Eurasian Snow Cover, Stratosphere - Climate Prediction Center
Eurasian Snow Cover, Stratosphere - Climate Prediction Center
Eurasian Snow Cover, Stratosphere - Climate Prediction Center

You also want an ePaper? Increase the reach of your titles
YUMPU automatically turns print PDFs into web optimized ePapers that Google loves.
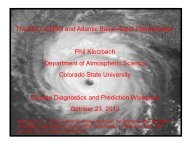
<strong>Eurasian</strong> <strong>Snow</strong> <strong>Cover</strong>, <strong>Stratosphere</strong>-Troposphere Coupling, and NHWintertime <strong>Climate</strong> Variability inthe CMIP5 ModelsJason C. FurtadoCollaborators: Judah Cohen (AER)Amy Butler, Emily Riddle, and Arun Kumar (NOAA CPC)NOAA’s 37 th <strong>Climate</strong> Diagnostics and <strong>Prediction</strong> Workshop24 October 2012
NH Winter <strong>Climate</strong> and the AOForecasting the phase of the ArcticOscillation is a factor for seasonaland longer-range forecasts.Negative PhaseIPCC, 2007Future climate changeStochastic? Forced?Solar ForcingENSO <strong>Eurasian</strong><strong>Snow</strong> <strong>Cover</strong>Arctic SeaIce(1) Greenhouse gas forcing predicts more +AOconditions (e.g., Shindell et al. 1999, Hurrell et al.2004; Miller et al. 2006, Scaife et al. 2012).(2) Will winters grow increasingly warmer? Or arethere important feedbacks that could mitigate thepositive trend, even intermittently?AER Company Proprietary Information. © Atmospheric and Environmental Research, Inc. (AER), 2011. 11/14/2012 2
Fall <strong>Eurasian</strong> <strong>Snow</strong>-Winter AO HypothesisEvidenced in observations (e.g., Foster et al.1983; Cohen and Entekhabu 1998; Saito et al.2001; Cohen et al. 2007).Model-produced snow cover does notdemonstrate the response (e.g., Hardiman et al.2008; Allen and Zender 2011), but a model withprescribed snow can (e.g., Fletcher et al. 2009;Allen and Zender 2010, 2011).Based on Cohen et al. (2007)Objectives1) Examine salient features for the mechanismin the models (e.g., snow cover, AO).2) Evaluate the ‘six-step process’ in CMIP5models and compare with observations.3) Offer suggestions for why CMIP5 models donot agree with observations.AER Company Proprietary Information. © Atmospheric and Environmental Research, Inc. (AER), 2011. 11/14/2012 3
Data and MethodologyObservational Data•Monthly-mean ERA-Interim (1979-2011)•October Monthly-Mean Rutgers <strong>Eurasian</strong><strong>Snow</strong> <strong>Cover</strong> Index (20-75°N, 0-170°E)(1979-2010)October <strong>Snow</strong> <strong>Cover</strong>(OBS)October <strong>Snow</strong> <strong>Cover</strong>(ENSMEAN)CMIP5 Models•Monthly-mean piControl runs (15 models).•Selected based on availability of snow coverextent (snc) as downloadable variable.•Regridded to a 2.5° by 2.5° grid for intermodelcomparisons.[%]1 10050Methodology•Subdivide the piControl runs into 40-yr segments.•Compute statistics on each segment separately.•Present results by model (aggregate segmentstatistics) and as ‘multi-model ensemble-mean.’•Focus on NH extended cold season (ONDJFM).AER Company Proprietary Information. © Atmospheric and Environmental Research, Inc. (AER), 2011. 11/14/2012 4
October <strong>Eurasian</strong> <strong>Snow</strong> <strong>Cover</strong>StatisticsOctober Mean <strong>Eurasian</strong> <strong>Snow</strong> <strong>Cover</strong> ExtentAER Company Proprietary Information. © Atmospheric and Environmental Research, Inc. (AER), 2011. 11/14/2012 6
October <strong>Eurasian</strong> <strong>Snow</strong> <strong>Cover</strong> StatisticsStandard Deviation – October <strong>Eurasian</strong> <strong>Snow</strong> <strong>Cover</strong>Lower variability inOctober <strong>Eurasian</strong> snowcover extent in the models.AER Company Proprietary Information. © Atmospheric and Environmental Research, Inc. (AER), 2011. 11/14/2012 7
<strong>Eurasian</strong> <strong>Snow</strong>/SLP RelationsObservationsND SLPa Regressed OntoOct. <strong>Eurasian</strong> <strong>Snow</strong> <strong>Cover</strong>Multi-Model Mean[hPa]SLP [hPa] Precursor to SSWs-3 0 3 -0.3 00.3(e.g., Cohen and Jones 2011)AER Company Proprietary Information. © Atmospheric and Environmental Research, Inc. (AER), 2011. 11/14/2012 8
<strong>Eurasian</strong> <strong>Snow</strong>/Surf. T RelationsObservationsND Surface Ta Regressed OntoOct. <strong>Eurasian</strong> <strong>Snow</strong> <strong>Cover</strong>Multi-Model Mean[°C]Weaker and even oppositesigned(i.e., warm anomalies).[°C]-2 02-0.1 0.10AER Company Proprietary Information. © Atmospheric and Environmental Research, Inc. (AER), 2011. 11/14/2012 9
Steps 3 – 5 of the Hypothesis40-80°N WAFz / Oct <strong>Snow</strong> (Obs)40-80°N WAFz / Oct <strong>Snow</strong> (ENSMEAN)[Correlation]-0.7 00.760-90°N GPH / Oct <strong>Snow</strong> (Obs)60-90°N GPH / Oct <strong>Snow</strong> (ENSMEAN)[Correlation]-0.6 00.6AER Company Proprietary Information. © Atmospheric and Environmental Research, Inc. (AER), 2011. 11/14/2012 10
Step 6 - Link to the DJF AOVertical bars represent the spread of correlationsamong the 40 year segments in the model.AER Company Proprietary Information. © Atmospheric and Environmental Research, Inc. (AER), 2011. 11/14/2012 11
Possible Explanations for Poor Model Agreement(1) Variability in the Stratospheric Polar Vortex• All models show lowervariability than observed,some significantly lower (e.g.,CSIRO).• Ensemble-mean σ U60 = 9.1m/s vs. Observed σ U60 = 15m/s.Vertical bars denote the ‘spread’among the 40-yr intervals.AER Company Proprietary Information. © Atmospheric and Environmental Research, Inc. (AER), 2011. 11/14/2012 12
Possible Explanations for Poor Model Agreement(2) Downward Propagation of Stratospheric AnomaliesEnsemble-mean correlations show downwardpropagation to ~150 hPa but not to the surface.r(Jan AO 10 , Jan AO 1000 ) ranges from -0.54(INMCM4) to 0.20 in MIROC5.[Correlation]-1 01[Correlation]-1 01AER Company Proprietary Information. © Atmospheric and Environmental Research, Inc. (AER), 2011. 11/14/2012 13
Summary and Conclusions• The six-step snow-AO hypothesis does not verify in the CMIP5 models,similar to the results from the CMIP3 models (Hardiman et al. 2008).• Models continue to underperform on simulating fall snow cover extent, itsvariability, and the lagged atmospheric response to the snow.• Analysis with the historical runs yields very similar conclusions.• Irrespective of the snow relationship, the coupled climate models haveissues with stratospheric vortex variability and ‘downward propagation’.– This fact may give pause for wintertime climate model projections.• Remaining Challenges/Future Work– <strong>Snow</strong>fall/snow cover in the models. Precipitation-related? Land surface?– Investigation of daily-mean output for downward propagation and wavedynamics propagation. This is relevant for both S/T studies as well as thesnow-AO hypothesis.AER Company Proprietary Information. © Atmospheric and Environmental Research, Inc. (AER), 2011. 11/14/2012 14
Thank you!Jason C FurtadoAtmospheric and Environmental ResearchE-mail: jfurtado@aer.comThis work is funded through NOAA Grant #NA10OAR4310163 andNSF Grant #BCS-1060323.AER Company Proprietary Information. © Atmospheric and Environmental Research, Inc. (AER), 2011. 11/14/2012 15
October 24, 2012Jason C. Furtado,Atmospheric and Environmental Research, Inc. (AER)NOAA 37 TH Annual <strong>Climate</strong> Diagnostics WorkshopAER Company Proprietary Information. © Atmospheric and Environmental Research, Inc. (AER), 2011. 11/14/2012 16
Prior WorkObservations<strong>Climate</strong> ModelsPolar Cap Height / SON EA <strong>Snow</strong> CorrelationsCAMReanalysis(Model <strong>Snow</strong>)CAM(Prescribed <strong>Snow</strong>)Cohen et al. (2007)Allen and Zender (2011)AER Company Proprietary Information. © Atmospheric and Environmental Research, Inc. (AER), 2011. 11/14/2012 17
Possible Explanations for Poor Model Agreement(1) Wave Forcing and Wave PropagationObservationsOct Zonal-Mean U (shading) and EP-Fluxes (arrows)Regressed onto the Oct <strong>Snow</strong> IndexCMIP5 Ensemble-MeanStrong vertical and polewardwave propagation in obs.[m/s]-1.9 1.90Weaker wave forcing in models.AER Company Proprietary Information. © Atmospheric and Environmental Research, Inc. (AER), 2011. 11/14/2012 18
Possible Explanations for Poor Model Agreement(2) ND WAFz / JF SLPa CovariabilityAER Company Proprietary Information. © Atmospheric and Environmental Research, Inc. (AER), 2011. 11/14/2012 19