USER'S GUIDE - Biosignal Analysis and Medical Imaging Group
USER'S GUIDE - Biosignal Analysis and Medical Imaging Group USER'S GUIDE - Biosignal Analysis and Medical Imaging Group
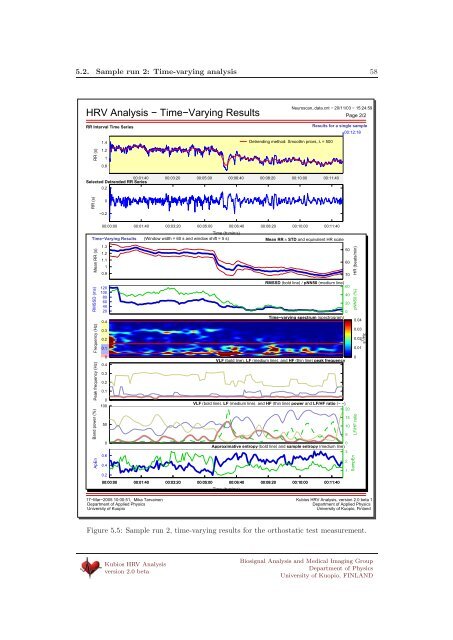
5.2. Sample run 2: Time-varying analysis 58HRV Analysis − Time−Varying ResultsRR Interval Time SeriesNeuroscan_data.cnt − 20/11/03 − 15:24:59Page 2/2Results for a single sample00:12:181.4 Detrending method: Smoothn priors, λ = 500RR (s)1.210.800:01:40 00:03:20 00:05:00 00:06:40 00:08:20 00:10:00 00:11:40Selected Detrended RR Series0.2RR (s)0−0.200:00:00 00:01:40 00:03:20 00:05:00 00:06:40 00:08:20 00:10:00 00:11:40Time (h:min:s)Time−Varying Results (Window width = 60 s and window shift = 5 s) Mean RR ± STD and equivalent HR scaleMean RR (s)RMSSD (ms)Frequency (Hz)Peak frequency (Hz)Band power (%)ApEn1.31.21.110.9120100806040200.40.30.20.100.40.30.20.101005000.60.40.2RMSSD (bold line) / pNN50 (medium line)600Time−varying spectrum (spectrogram)VLF (bold line), LF (medium line), and HF (thin line) peak frequencyVLF (bold line), LF (medium line), and HF (thin line) power and LF/HF ratio (− −)200Approximative entropy (bold line) and sample entropy (medium line)300:00:00 00:01:40 00:03:20 00:05:00 00:06:40 00:08:20 00:10:00 00:11:40Time (h:min:s)50607040201510521HR (beats/min)pNN50 (%)0.040.030.020.010LF/HF ratioSampEns 2 /Hz17−Mar−2005 10:00:51, Mika TarvainenDepartment of Applied PhysicsUniversity of KuopioKubios HRV Analysis, version 2.0 beta 1Department of Applied PhysicsUniversity of Kuopio, FinlandFigure 5.5: Sample run 2, time-varying results for the orthostatic test measurement.Kubios HRV Analysisversion 2.0 betaBiosignal Analysis and Medical Imaging GroupDepartment of PhysicsUniversity of Kuopio, FINLAND
Appendix AFrequently asked questionsBased on the feedback and user experiences obtained from the users of the previous versionof the HRV analysis software [32] we have collected here a bunch of frequently asked questions.An answer to each question is given below the question. Some of the questions areconcerned with the optimal value of some analysis parameter. Often these parameter valuesare, however, more or less case-specific, for example the length of the selected HRV datamay change the preferred settings for FFT spectrum calculation. Thus, some of the answersmight be more or less vague, but hopefully still helpful.What is the best way to treat artifacts in RR interval series?When doing HRV analysis one should always make sure that the measured HRVseries does not include any artifacts such as ectopic beats or missed/extra QRSdetections. Thus, if ECG measurement is available, it is recommended that theECG measurement, corresponding to the analyzed RR interval series, is checkedfor artifacts. In the software this can be easily done by scrolling the ECG signal.Any misdetections can be corrected straight and possible ectopic beats can beexcluded from the analysis by suitable selections for the analyzed sample range. When several RR interval samples have been selected, what does the mergesamples do?When the Merge samples option is selected for the Sample analysis type, theRR interval samples selected for analysis are simply merged into one sample byconcatenating the samples.How to select the value of λ in the smoothness priors based detrending?λ is the regularization parameter in the smoothness priors based detrendingapproach, see Section 2.3.1 for details. The value of this parameter changes thesmoothness of the estimated trend, i.e. a bigger value corresponds to a smoothertrend. As discussed in Section 2.3.1 the smoothness priors detrending methodcan be compared to a time-varying highpass filter and λ adjusts the cut-offfrequency of the filter. A practical way to observe what this cut-off frequencyisforaspecificλ value is as follows. Start, for example, from a big value (e.g.λ = 10000) and decrease it to some desired value and observe from the FFTspectrum which frequencies were eliminated. Just remember to make sure thatyou are not eliminating frequencies of whichyouareinterestedin(e.g. watchout the lower limit of the LF band).59
- Page 7: 1.2. Installation 74. Next, select
- Page 10 and 11: 1.2. Installation 1010. The MATLAB
- Page 12 and 13: 1.2. Installation 1214. When the in
- Page 14 and 15: 1.4. Software home page 14• Delet
- Page 16 and 17: Chapter 2Heart rate variabilityHear
- Page 18: 2.2. Derivation of HRV time series
- Page 21 and 22: 2.3. Preprocessing of HRV time seri
- Page 23 and 24: 3.2. Frequency-domain methods 23In
- Page 25 and 26: 3.3. Nonlinear methods 253.3.2 Appr
- Page 27 and 28: 3.3. Nonlinear methods 27−0.6−0
- Page 29 and 30: 3.3. Nonlinear methods 29987Time (m
- Page 31 and 32: 3.5. Summary of HRV parameters 31Ta
- Page 33 and 34: 4.1. Input data formats 33Figure 4.
- Page 35 and 36: 4.2. The user interface 35Figure 4.
- Page 37 and 38: 4.2. The user interface 37In additi
- Page 39 and 40: 4.2. The user interface 39Figure 4.
- Page 41 and 42: 4.2. The user interface 41Figure 4.
- Page 43 and 44: 4.3. Saving the results 431. Softwa
- Page 45 and 46: 4.3. Saving the results 45Figure 4.
- Page 47 and 48: 4.4. Setting up the preferences 47F
- Page 49 and 50: 4.4. Setting up the preferences 49F
- Page 51 and 52: Chapter 5Sample runsIn this chapter
- Page 53 and 54: 5.1. Sample run 1: General analysis
- Page 55 and 56: 5.1. Sample run 1: General analysis
- Page 57: 5.2. Sample run 2: Time-varying ana
- Page 61 and 62: 61 Why do the power values of Kubio
- Page 63 and 64: References[1] V.X. Afonso. ECG QRS
- Page 65 and 66: References 65[28] J. Mateo and P. L
5.2. Sample run 2: Time-varying analysis 58HRV <strong>Analysis</strong> − Time−Varying ResultsRR Interval Time SeriesNeuroscan_data.cnt − 20/11/03 − 15:24:59Page 2/2Results for a single sample00:12:181.4 Detrending method: Smoothn priors, λ = 500RR (s)1.210.800:01:40 00:03:20 00:05:00 00:06:40 00:08:20 00:10:00 00:11:40Selected Detrended RR Series0.2RR (s)0−0.200:00:00 00:01:40 00:03:20 00:05:00 00:06:40 00:08:20 00:10:00 00:11:40Time (h:min:s)Time−Varying Results (Window width = 60 s <strong>and</strong> window shift = 5 s) Mean RR ± STD <strong>and</strong> equivalent HR scaleMean RR (s)RMSSD (ms)Frequency (Hz)Peak frequency (Hz)B<strong>and</strong> power (%)ApEn1.31.21.110.9120100806040200.40.30.20.100.40.30.20.101005000.60.40.2RMSSD (bold line) / pNN50 (medium line)600Time−varying spectrum (spectrogram)VLF (bold line), LF (medium line), <strong>and</strong> HF (thin line) peak frequencyVLF (bold line), LF (medium line), <strong>and</strong> HF (thin line) power <strong>and</strong> LF/HF ratio (− −)200Approximative entropy (bold line) <strong>and</strong> sample entropy (medium line)300:00:00 00:01:40 00:03:20 00:05:00 00:06:40 00:08:20 00:10:00 00:11:40Time (h:min:s)50607040201510521HR (beats/min)pNN50 (%)0.040.030.020.010LF/HF ratioSampEns 2 /Hz17−Mar−2005 10:00:51, Mika TarvainenDepartment of Applied PhysicsUniversity of KuopioKubios HRV <strong>Analysis</strong>, version 2.0 beta 1Department of Applied PhysicsUniversity of Kuopio, Finl<strong>and</strong>Figure 5.5: Sample run 2, time-varying results for the orthostatic test measurement.Kubios HRV <strong>Analysis</strong>version 2.0 beta<strong>Biosignal</strong> <strong>Analysis</strong> <strong>and</strong> <strong>Medical</strong> <strong>Imaging</strong> <strong>Group</strong>Department of PhysicsUniversity of Kuopio, FINLAND


