USER'S GUIDE - Biosignal Analysis and Medical Imaging Group
USER'S GUIDE - Biosignal Analysis and Medical Imaging Group
USER'S GUIDE - Biosignal Analysis and Medical Imaging Group
- No tags were found...

Create successful ePaper yourself
Turn your PDF publications into a flip-book with our unique Google optimized e-Paper software.
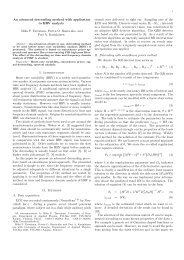
3.3. Nonlinear methods 241000x 2950x 1900RR j+1(ms)850800SD1SD2750700650650 700 750 800 850 900 950 1000RR j(ms)Figure 3.1: Poincaré plot analysis with the ellipse fitting procedure. SD1 <strong>and</strong> SD2 are thest<strong>and</strong>ard deviations in the directions x 1 <strong>and</strong> x 2 ,wherex 2 is the line-of-identity for whichRR j =RR j+1 .recurrence plots [47, 46, 49]. During the last years, the number of studies utilizing suchmethods have increased substantially. The downside of these methods is still, however, thedifficulty of physiological interpretation of the results.3.3.1 Poincaré plotOne commonly used nonlinear method that is simple to interpret is the so-called Poincaréplot. It is a graphical representation of the correlation between successive RR intervals,i.e. plot of RR j+1 as a function of RR j as described in Fig. 3.1. The shape of the plotis the essential feature. A common approach to parameterize the shape is to fit an ellipseto the plot as shown in Fig. 3.1. The ellipse is oriented according to the line-of-identity(RR j =RR j+1 )[5]. The st<strong>and</strong>ard deviation of the points perpendicular to the line-ofidentitydenoted by SD1 describes short-term variability which is mainly caused by RSA. Itcan be shown that SD1 is related to the time-domain measure SDSD according to [5]SD1 2 = 1 2 SDSD2 . (3.5)The st<strong>and</strong>ard deviation along the line-of-identity denoted by SD2, on the other h<strong>and</strong>, describeslong-term variability <strong>and</strong> has been shown to be related to time-domain measuresSDNN <strong>and</strong> SDSD by [5]SD2 2 =2SDNN 2 − 1 2 SDSD2 . (3.6)The st<strong>and</strong>ard Poincaré plot can be considered to be of the first order. The second order plotwould be a three dimensional plot of values (RR j , RR j+1 , RR j+2 ). In addition, the lag canbe bigger than 1, e.g., the plot (RR j , RR j+2 ).Kubios HRV <strong>Analysis</strong>version 2.0 beta<strong>Biosignal</strong> <strong>Analysis</strong> <strong>and</strong> <strong>Medical</strong> <strong>Imaging</strong> <strong>Group</strong>Department of PhysicsUniversity of Kuopio, FINLAND