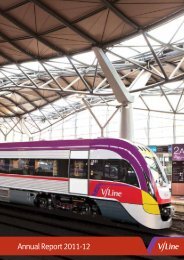
ANNUAL REPORT 2004â05 - V/Line
ANNUAL REPORT 2004â05 - V/Line
ANNUAL REPORT 2004â05 - V/Line
- No tags were found...
You also want an ePaper? Increase the reach of your titles
YUMPU automatically turns print PDFs into web optimized ePapers that Google loves.
AN OVERVIEW (CONTINUED)THE YEAR IN REVIEWCATEGORY KEY PERFORMANCE INDICATOR 2004–05 2003–04 COMMENTSSAFETY Lost-time injuries (LTIs) 58 Not available 2004–05 was the first year in which LTIs were recordedSignals passed at danger (SPADs) 8 5Customer Incidents 23 32Staff incidents 72 32 Reflects increased focus on reporting as well as overallincrease in employee numbersCUSTOMERS Customer Satisfaction Index 75.7% trains 79.2% trains Slight decrease as a result of major shut-down on Bendigo(DOI target 68%) 79.1% coaches 81.8% coaches corridor and disruptions on other corridors due toinfrastructure worksPatronage (rail and coach) 6.912 million 6.945 million Minor decrease as a result of infrastructure works, particularlythe extended Bendigo line closure. Offset by addition ofWarrnambool servicesNo. customer information enquiries 739,660 765,532No. customer feedback calls 7,126 4,600 Increase due to level of disruptions; also due to promotionof feedback lineCompensation paid to customers $31,298 $5,419 Increase due to fluctuations in train punctuality(complimentary ticket value)levels as a result of infrastructure worksNo. stakeholder briefings held on 30 Not applicable Key goal of 2004–05 was to ensure appropriatenew timetableconsultation with stakeholders and customers on theNo. customer consultation 2,483 Not applicable new timetableresponses on new timetableOPERATIONS Reliability (average monthly performance) 99.14% 99.54% Slight decrease due to major infrastructure works and(DOI target 96%)maintenance programsPunctuality – On time to 5 minutes 84.94% 91.26% Drop in performance due to focus on running services(average monthly performance)despite disruptions(DOI target 92%)Rolling stock availability 95% carriages, Sprinters 94% carriages, Sprinters Rolling stock performance was in line with expectations(% of fleet available) 87% locomotives 86% locomotivesRolling stock reliability Sprinter: 23,555 Sprinter: 22,857(Mean km between faults) Carriage: 156,877 Carriage: 146,480Locomotive: 22,981 Locomotive: 25,994FINANCE Revenue (from operating activities) $206.7 million $125.6 million Financial performance for 2004–05 and 2003–04Farebox – $47.6 millionwas in line with budget expectationsGovernment subsidies – $155.5 millionNote: Financial reporting in 2003–04 was only for nine-monthsOther – $3.5 millionof operation. The 2003–04 operating profit included a gain of$136.8 million resulting from the purchase of V/<strong>Line</strong>Operating (deficit)/profit ($0.65 million) $126.1 million Passenger Pty Ltd. The transaction involved the acquisition ofnet assets of $136.8 million for a consideration of $1.EMPLOYEES Full-time equivalent staff 727.5 622 Increase includes 33 new drivers plus 6 staff transferred fromHoys Pty Ltd and 20 staff from West Coast RailTraining attendance nos.1,502 attendees(154 training sessions)Medical examinations completed 434 211Workcover claims 115 claims 101 claimsV/LINE <strong>ANNUAL</strong> <strong>REPORT</strong> 2004–05|11


