Passive Soil Vapor Extraction - GSI Environmental Inc.
Passive Soil Vapor Extraction - GSI Environmental Inc.
Passive Soil Vapor Extraction - GSI Environmental Inc.
- No tags were found...

You also want an ePaper? Increase the reach of your titles
YUMPU automatically turns print PDFs into web optimized ePapers that Google loves.
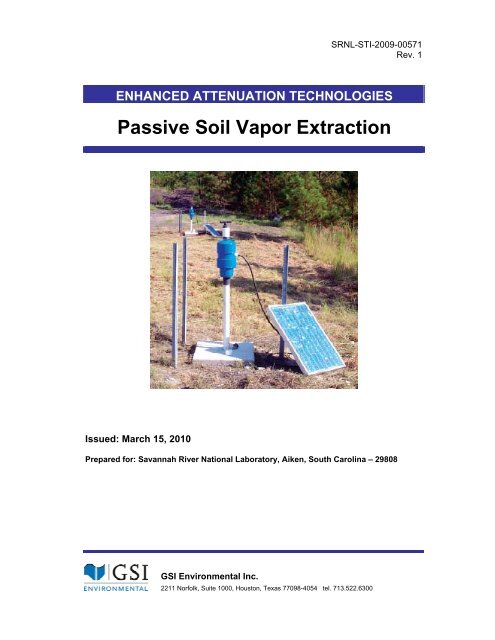
SRNL-STI-2009-00571Rev. 1ENHANCED ATTENUATION TECHNOLOGIES<strong>Passive</strong> <strong>Soil</strong> <strong>Vapor</strong> <strong>Extraction</strong>Issued: March 15, 2010Prepared for: Savannah River National Laboratory, Aiken, South Carolina – 29808<strong>GSI</strong> <strong>Environmental</strong> <strong>Inc</strong>.2211 Norfolk, Suite 1000, Houston, Texas 77098-4054 tel. 713.522.6300
SRNL-STI-2009-00571Rev. 1<strong>Passive</strong> <strong>Soil</strong> <strong>Vapor</strong> <strong>Extraction</strong>Prepared by:Roopa Kamath, Ph.D.David T. Adamson, Ph.D.Charles J. Newell, Ph.D.<strong>GSI</strong> <strong>Environmental</strong> <strong>Inc</strong>.2211 Norfolk, Suite 1000Houston, Texas 77098-4054713/522-6300In Conjunction with:Karen M. VangelasBrian B. Looney, Ph.D.Savannah River National LaboratoryAiken, South Carolina – 29808803/725-5223Kamath R., D.T. Adamson, C. J. Newell, K. M. Vangelas and B. B. Looney. 2009. EnhancedAttenuation Technologies: <strong>Passive</strong> <strong>Soil</strong> <strong>Vapor</strong> <strong>Extraction</strong>. Rev. 1. SRNL-STI-2009-00571Rev. 1, Savannah River National Laboratory, Aiken, South Carolina. March 15, 2010.Available at www.osti.govEnhanced Attenuation Technologies<strong>Passive</strong> <strong>Soil</strong> <strong>Vapor</strong> <strong>Extraction</strong>
SRNL-STI-2009-00571Rev. 1Revision 1 of this document was issued to correct the following error:In the original printing the graphics in Figures 3.1a and 3.1b were inverted and thus werenot reflective of the associated captions.Enhanced Attenuation Technologies<strong>Passive</strong> <strong>Soil</strong> <strong>Vapor</strong> <strong>Extraction</strong>
SRNL-STI-2009-00571Rev. 1FOREWORDEnhanced Attenuation (EA) is a strategy where engineered remediation activitiessupport and extend natural attenuation processes and assures the sustainability of thoseattenuation mechanisms. The Interstate Technology and Regulatory Council (ITRC), anational regulator led organization with the goal of encouraging adoption of usefulinnovativeenvironmental technologies, defined and described EA in a technicalregulatory document published in 2008 (ITRC, 2008). EA supports the transition fromsource and active treatments to monitored natural attenuation and supports the conceptsof treatment trains and combined remedies.There are two general classes of EA applications: 1) those that reduce the release ofcontaminant from a source into the groundwater plume; and 2) those that increase thenatural attenuation capacity in the subsurface. For the most part, the technologies toaccomplish these objectives are already in use as traditional active treatments. In an EAapproach, technologies are deployed to create an environment that will foster atransition to MNA once the active treatment is complete and will sustain and enhanceimportant natural attenuation mechanisms until remediation goals are met.To illustrate EA and encourage broader use of the strategy, several user guides thatdescribe the selection, design and performance of key technologies are now beingdeveloped by the Savannah River National Lab in collaboration with partners. Theseguides provide information to support the implementation of EA as described in the ITRCtechnical regulatory document (ITRC, 2008) and serve as supplementary resources toenvironmental professionals, regulators and managers in developing technically soundplans to clean up contaminated sites.Enhanced Attenuation Technologies<strong>Passive</strong> <strong>Soil</strong> <strong>Vapor</strong> <strong>Extraction</strong>
SRNL-STI-2009-00571Rev. 1<strong>Passive</strong> <strong>Soil</strong> <strong>Vapor</strong> <strong>Extraction</strong>EXECUTIVE SUMMARY<strong>Passive</strong> soil vapor extraction (PSVE) is an enhanced attenuation (EA) approach thatremoves volatile contaminants from soil. The extraction is driven by natural pressuregradients between the subsurface and atmosphere (Barometric Pumping), or byrenewable sources of energy such as wind or solar power (Assisted PSVE). Thetechnology is applicable for remediating sites with low levels of contamination and fortransitioning sites from active source technologies such as active soil vapor extraction(ASVE) to natural attenuation. PSVE systems are simple to design and operate and aremore cost effective than active systems in many scenarios. Thus, PSVE is oftenappropriate as an interim-remedial or polishing strategy. Over the past decade, PSVEhas been demonstrated in the U.S. and in Europe. These demonstrations providepractical information to assist in selecting, designing and implementing the technology.These demonstrations indicate that the technology can be effective in achievingremedial objectives in a timely fashion. The keys to success include:1) Application at sites where the residual source quantities, and associated fluxes togroundwater, are relatively low;2) Selection of the appropriate passive energy source – barometric pumping in cases with adeep vadose zone and barrier (e.g., clay) layers that separate the subsurface from theatmosphere and renewable energy assisted PSVE in other settings and where higherflow rates are required.3) Provision of sufficient access to the contaminated vadose zones through the spacing andnumber of extraction wells.This PSVE technology report provides a summary of the relevant technical background,real-world case study performance, key design and cost considerations, and a scenariobasedcost evaluation. The key design and cost considerations are organized into aflowchart that dovetails with the Enhanced Attenuation: Chlorinated Organics Guidanceof the Interstate Technology and Regulatory Council (ITRC). The PSVE flowchartprovides a structured process to determine if the technology is, or is not, reasonable anddefensible for a particular site. The central basis for that decision is the expectedperformance of PSVE under the site specific conditions. Will PSVE have sufficient massremoval rates to reduce the release, or flux, of contamination into the underlyinggroundwater so that the site can meet it overall remedial objectives?The summary technical information, case study experiences, and structured decisionprocess provided in this “user guide” should assist environmental decision-makers,regulators, and engineers in selecting and successfully implementing PSVE atappropriate sites.iiiEnhanced Attenuation Technologies<strong>Passive</strong> <strong>Soil</strong> <strong>Vapor</strong> <strong>Extraction</strong>
SRNL-STI-2009-00571Rev. 1<strong>Passive</strong> <strong>Soil</strong> <strong>Vapor</strong> <strong>Extraction</strong>TABLE OF CONTENTSEXECUTIVE SUMMARY.............................................................................................................. i1.0 TECHNOLOGY SUMMARY............................................................................................... 11.1 Problem Statement .................................................................................................... 11.2 Solution ...................................................................................................................... 11.3 How It Works.............................................................................................................. 21.4 Deployment Summary ............................................................................................... 31.5 Commercial Availability and Contacts ........................................................................ 42.0 TECHNOLOGY DESCRIPTION......................................................................................... 62.1 Theoretical Basis ....................................................................................................... 62.2 Description of Equipment ......................................................................................... 102.3 System Operation and Maintenance ....................................................................... 132.4 Long-Term Monitoring for PSVE Applications ......................................................... 142.5 Site Transition to MNA............................................................................................. 183.0 TECHNOLOGY APPLICABILITY AND ALTERNATIVES .............................................. 193.1 PSVE Technology Strengths ................................................................................... 193.2 PSVE Technology Weaknesses .............................................................................. 203.3 Competing and Complementary Technologies ........................................................ 234.0 TECHNOLOGY PERFORMANCE................................................................................... 265.0 KEY CONSIDERATIONS DURING SELECTION OF A PSVE TECHNOLOGY............. 325.1 Decision Framework for Selection of PSVE Technologies...................................... 336.0 OCCUPATIONAL SAFETY AND HEALTH..................................................................... 456.1 Technology-Specific Health and Safety Risks......................................................... 456.2 Worker Safety .......................................................................................................... 456.3 Community Safety.................................................................................................... 457.0 REGULATORY AND POLICY ISSUES........................................................................... 467.1 Regulatory Considerations ...................................................................................... 467.2 Risks, Benefits, and Community Reaction............................................................... 467.3 <strong>Environmental</strong> Impact .............................................................................................. 467.4 Socioeconomic Impacts and Community Perception .............................................. 478.0 COST FOR USE OF PSVE TECHNOLOGIES WITHIN AN EA STRATEGY ................. 488.1 Cost Drivers ............................................................................................................. 488.2 Site-Specific Scenarios............................................................................................ 549.0 REFERENCES .................................................................................................................... 58APPENDIX A. PREDICTING MASS FLUX FOR A BAROMETRIC PUMPING APPLICATIONBASED ON SITE SPECIFIC PARAMETERSivEnhanced Attenuation Technologies<strong>Passive</strong> <strong>Soil</strong> <strong>Vapor</strong> <strong>Extraction</strong>
SRNL-STI-2009-00571Rev. 1<strong>Passive</strong> <strong>Soil</strong> <strong>Vapor</strong> <strong>Extraction</strong>APPENDIX B. TECHNOLOGY DEMONSTRATION - DESIGN, IMPLEMENTATION ANDRESULTSLIST OF FIGURESFigure 1.1. Devices used for Barometric Applications a. BERT TM Flapper Valve b.Baroball TM Control ValveFigure 2.1.Figure 2.2.Figure 2.3a.Figure 2.3b.Figure 2.4.Figure 2.5.Figure 2.6.Figure 2.7a.Figure 2.7b.Conceptual Model for ‘Inhalation’ and ‘Exhalation’ Phenomenon Observed inWells Installed within the Vadose Zone.Distribution of Flow Rates from an <strong>Extraction</strong> Well collected at 15 MinuteIntervals over a Period of One Year (Riha, 2005c)Typical Diurnal Changes in the Barometric and Subsurface Pressure at theSavannah River Site (SRS), SC.Typical Daily Flow Rates Measured in <strong>Extraction</strong> Wells Undergoing BarometricPumping at SRS, SC.Average Differential Pressure Measured Above and Below a Low PermeabilityCaliche Layer at the Hanford, WA (Rohay et al., 1997).Schematic of Control Valves used in Barometric Applications a. BERT TM FlapperValve b. Baroball TM Control ValveMeasured Plume Curve for the MicroBlower Set-up Installed at SRS, SC.Schematic of the MicroBlower AssemblyMicroBlower Installed at an Individual Well at SRS, SC.Figure 2.8. Schematic of Advective and Diffusive Flow of <strong>Soil</strong> Gas during a. Early and b.Late Stages of <strong>Soil</strong> <strong>Vapor</strong> <strong>Extraction</strong>Figure 3.1a.Figure 3.1b.Figure 5.1.Figure 5.2.Figure 5.3.Factors that Favor PSVE.Factors that could Preclude PSVE.Structure of the ITRC EA Decision Flowchart and How the PSVE FlowchartDovetails into the ProcessDecision Flow Chart for Selection of a PSVE Strategy at a Typical ChlorinatedSolvent Site.Comparison of <strong>Soil</strong> Gas Flow generated during a Barometric Application versusthat generated using a MicroBlower at SRS, SC.vEnhanced Attenuation Technologies<strong>Passive</strong> <strong>Soil</strong> <strong>Vapor</strong> <strong>Extraction</strong>
SRNL-STI-2009-00571Rev. 1<strong>Passive</strong> <strong>Soil</strong> <strong>Vapor</strong> <strong>Extraction</strong>LIST OF TABLESTable 1.1.Table 3.1.Table 4.1.Table 4.2.Summary of Pilot and Full-Scale Studies Conducted in the United StatesRemedial Technologies Routinely Employed at Chlorinated Solvent Sites andPotential Compatibility Issues that can arise during Concurrent or SubsequentPSVE ApplicationsResults from Full-Scale Application of <strong>Passive</strong> <strong>Soil</strong> <strong>Vapor</strong> <strong>Extraction</strong> at the MetLabSite, SRS, SC.Results from Full-Scale Application of <strong>Passive</strong> <strong>Soil</strong> <strong>Vapor</strong> <strong>Extraction</strong> at the MCBSite, SRS, SC.Table 4.3.Table 4.4.Table 5.1.Table 8.1.Table 8.2.Table 8.3.Table 8.4.Results from Full-Scale Application of <strong>Passive</strong> <strong>Soil</strong> <strong>Vapor</strong> <strong>Extraction</strong> at the MAPSLSite, SRS, SC.Results from Full-Scale Application of <strong>Passive</strong> <strong>Soil</strong> <strong>Vapor</strong> <strong>Extraction</strong> at Four Sites inDenmark.Potential Benefits or Limitations of Implementing an SVE Strategy based on Site-Specific Drivers for an Enhanced Attenuation Strategy.Cost Drivers for Comparing PSVE to an Existing ASVE System.Cost Evaluation for Site-Specific Scenario 1: PSVE is Cost-Effective at Site withExisting ASVE System and No Requirement for New Wells.Cost Evaluation for Site-Specific Scenario 2: PSVE may not be Cost-Effective atSite where New Wells are Required.Cost Evaluation for Site-Specific Scenario 3: PSVE is Not Cost-Effective Due toSite-Specific Issues.viEnhanced Attenuation Technologies<strong>Passive</strong> <strong>Soil</strong> <strong>Vapor</strong> <strong>Extraction</strong>
SRNL-STI-2009-00571Rev. 11.0 TECHNOLOGY SUMMARY1.1 Problem StatementMore than a decade after the deployment of active source remediation technologies atchlorinated solvent sites, many still do not meet MNA or site closure requirements. In asurvey of 59 chlorinated solvent sites (McGuire et al., 2005) where active sourcetreatment technologies - chemical oxidation, enhanced bioremediation, thermaltreatment, and surfactant/co-solvent flushing – were implemented, none of thetechnologies were able to achieve maximum contaminant levels (MCLs) 1 to 5 yearsafter the treatment. Furthermore, despite the fact that active technologies no longer offerthe cost-benefits required to continue operation at many of these sites, discontinuingsource treatment is not considered an acceptable option due to the potential for theresidual mass to act as a long-term source of low-level groundwater contamination.For such sites, there is an immediate need for the development of innovative low-cost,low-energy technologies that can accelerate the transition from active technologies toMNA and/or site-specific remedial objectives. Additionally, there is a need forestablishment of a widely-accepted framework for the selection and long-term monitoringof these passive technologies.1.2 Solution<strong>Passive</strong> soil vapor extraction (PSVE) is a broad term that encompasses low-energy soilvapor extraction technologies for remediating unsaturated soils impacted with volatilecontaminants. Two general processes are used to extract volatile contaminants fromimpacted soils within the unsaturated zone:· Barometric pumping applications, which exploit the natural diurnal and weatherdrivenventing cycles between the atmosphere and the subsurface environment; and· MicroBlower applications, in which small blowers powered by renewable energysources (e.g., solar or wind) are used.Ideally, PSVEs can be employed at sites where the mass loading from the source zoneare intermittent or low. For example, low permeability soils with diffusion-limited gastransport and/or residual concentrations of volatile contaminants are the most likelycandidates for a PSVE application. By virtue of their technological simplicity and lowcost, PSVEs are ideal as an interim strategy or as a polishing strategy at sites where themass flux reduction achieved by an active SVE technology no longer justifies the cost ofthe operation. Since well design for a PSVE application is identical to that for an ASVEapplication, transitioning from an ASVE remediation program to a PSVE program couldbe inexpensive and rapid.1 Enhanced Attenuation Technologies<strong>Passive</strong> <strong>Soil</strong> <strong>Vapor</strong> <strong>Extraction</strong>
SRNL-STI-2009-00571Rev. 11.3 How It WorksBarometric Applications: Disequilibrium between the atmospheric pressure and thesubsurface pressure results in a flow of air from the zone of high pressure to the zone oflow pressure when the two zones are directly connected as by a well. As a result of thispressure difference, under natural circumstances, wells screened within the unsaturatedzone have been shown to “breathe”, i.e., inhale ambient air from the atmosphere duringhigh atmospheric pressure conditions and exhale soil gas to the atmosphere during lowatmospheric pressure conditions. Barometric applications aim to exploit the “exhalation”behavior in wells screened within the impacted soil layers in the unsaturated zone byinstalling a passive one-way check valve that allows flow of soil gas into the atmospherewhen the pressure in the well is greater than the atmospheric pressure and seals thewell when the atmospheric pressure is greater than the pressure in the well. Bypreventing dilution of soil gas with ambient air, the one-way passive control valve hasbeen shown to increase mass removal of VOCs by barometric pumping by at least afactor of 2 (Rohay et al. 1997; Rossabi, 1999). A network of such wells screened withincontaminated layers of the vadose zone could effectively remove residual contaminantmass during the course of a long-term remediation project.In the last 10 years, researchers have explored a variety of check valves for use inbarometric applications:1. Mylar Flapper Valve patented by Science and Engineering Associates and used inconjunction with Barometrically Enhanced Remediation Technology (BERT TM )(ITSER, 2000);2. Mylar Disk patented by Idaho National Engineering and <strong>Environmental</strong> Laboratory(INEEL); and3. Baroball TM Control Valve is a trademark of Westinghouse Savannah River Company,LLC.Figure 1.1: Devices used for Barometric Applications: (a) BERT TM Flapper Valve; (b)Baroball TM Control Valve2 Enhanced Attenuation Technologies<strong>Passive</strong> <strong>Soil</strong> <strong>Vapor</strong> <strong>Extraction</strong>
SRNL-STI-2009-00571Rev. 1All three check valves are sensitive to pressure differences between the atmosphere andthe subsurface and allow outflow of soil gas at pressure gradients less thanapproximately 1 mbar (cracking pressure). During negative pressure differentialconditions, the valve (either the mylar flap, disk or ball) is designed to maintain a seal toprevent inflow of ambient air into the subsurface environment. Riha (2001) reported soilvapor flow rates ranging between 15 and 50 cubic feet per minute (cfm) in 2-inchextraction wells located at the M-Area Process Sewer Line (MAPSL) site at theSavannah River Site (SRS), South Carolina.MicroBlower Applications: Small blowers can be used to exert a constant and consistentvacuum level on the extraction wells. While similar in design to an ASVE blower, PSVEblowers are low-cost alternatives that are designed to run on renewable sources ofenergy such as solar and wind energy. By using renewable sources of energy (such assolar panels), the blowers eliminate the need for an external power supply and otherancillary infrastructure generally required for conventional ASVE systems. For mostapplications, a small battery bank can be used to store power for when the sun or windenergy is inadequate.1.4 Deployment SummaryOver the past decade, passive soil vapor extraction has been tested successfully at anumber of demonstrations around the US (See Table 1). At a majority of these sites, allor a portion of the existing ASVE wells were converted to PSVE by installing a one-wayvalve or a MicroBlower. Several of these demonstrations were conducted at theSavannah River Site (SRS), SC. For barometric applications, these SRS demonstrationsinvolved 8 to 25 PSVE wells where airflow rates of 1 to 7 scfm were achieved, resultingin the removal of 100 lb to over 700 lb of contaminant mass per site over the individualoperating periods. Similarly, MicroBlowers have been installed at two wells at one ofthese SRS sites to specifically target an area of high concentration (60 ppmvtetrachloroethylene (PCE) and 40 ppmv trichloroethene (TCE)). This assisted PSVEapplication is capable of achieving consistently high (> 10 scfm) average operatingairflow rates and has successively reduced vapor concentrations by approximately anorder of magnitude over a 5-year operating period. See Section 4 for results ofdemonstrations conducted at individual sites.3 Enhanced Attenuation Technologies<strong>Passive</strong> <strong>Soil</strong> <strong>Vapor</strong> <strong>Extraction</strong>
Table 1.1: Summary of Pilot and Full-Scale Studies Conducted in the United States.SRNL-STI-2009-00571Rev. 1No. Demonstration Site ReferenceBERT TM Applications• Idaho National Engineering and <strong>Environmental</strong> Laboratory ITSER, 2000(INEEL) Radioactive Waste Management Complex, ID• Los Alamos National Laboratory, NM ITSER, 2000BaroBall TM Applications• Miscellaneous Chemical Basin (MCB), Savannah River Riha et al., 2005aSite (SRS), SC• Metals Laboratory (MetLab), SRS, SC Riha, 2005b• M-Area Process Sewer Line (MAPSL), SRS, SC Riha et al., 2001• Hanford Site, WA Rohay et al., 1993• Four Sites in Denmark Christensen et al., 2003MicroBlower Applications• Marine Corps Air Ground Combat Center in Twenty-NinePalms, CA (Wind-powered)O’Brian, 2001• M-Area Abandoned Process Sewer Line (MAPSL), SC Riha, 2005c(Solar-powered)Note: Detailed information about the site application of the INEEL mylar disk were not available in literatureand were therefore not included in the table.1.5 Commercial Availability and Contacts• BERT TM Mylar Flapper Valve: The valves are not available commercially. Fortechnical information or a copy of the patent, contacto William (Bill) E. Lowry, Mission Solutions Group, QinetiQ North America. e-mail: Bill.Lowry@QinetiQ-NA.como Eric Miller, Organic Contaminants in the Vadose Zone, WAG–7 LockheedMartin, Idaho Technologies Company, e-mail: ecm@inel.gov, Telephone:(208) 526-9410• INEEL Mylar Disk : The valves are not available commercially. For technicalinformation or a copy of the patent, contact the Technical Transfer Office at IdahoNational Laboratory at www.inl.gov4 Enhanced Attenuation Technologies<strong>Passive</strong> <strong>Soil</strong> <strong>Vapor</strong> <strong>Extraction</strong>
SRNL-STI-2009-00571Rev. 1• Baroball TM Control Valve and MicroBlower Applications: The valve is commerciallyavailable through Durham Geo Slope Indicator (D<strong>GSI</strong>), 2175 West Park Court, StoneMountain, GA 30087. Tel: 800-837-0864; Fax: 770-465-7447. MicroBlowers are notyet available commercially.For technical information, contactooooBrian B. Looney, <strong>Environmental</strong> Science and Biotechnology Section,Savannah River National Laboratory, SC. Telephone: 803-725-3692, Email:brian02.looney@srnl.doe.govBrian Riha, <strong>Environmental</strong> Science and Biotechnology Section, SavannahRiver National Laboratory, SC. Telephone: 803-725-5948, Email:brian.riha@srnl.doe.govJoseph Rossabi, Redox-Tech, <strong>Inc</strong>. Telephone: 919-678-0140, email:rossabi@redox-tech.comKaren Vangelas, <strong>Environmental</strong> Science and Biotechnology Section,Savannah River National Laboratory, SC. Telephone: 803-725-5223, Email:Karen.vangelas@srnl.doe.gov5 Enhanced Attenuation Technologies<strong>Passive</strong> <strong>Soil</strong> <strong>Vapor</strong> <strong>Extraction</strong>
SRNL-STI-2009-00571Rev. 12.0 TECHNOLOGY DESCRIPTION2.1 Theoretical Basis2.1.1 Barometric <strong>Soil</strong> <strong>Vapor</strong> <strong>Extraction</strong>Fluctuations in the atmospheric pressure transmit through the soil as pressure wavesthat attenuate and decelerate with depth and lower soil permeability. This damping anddelay effect results in a sustained period of time during which the surface andsubsurface pressure are not in equilibrium. As a result, when the two zones are directlyconnected (as through a well), there is a dynamic flow of air from the zone of highpressure to the zone of low pressure (Figure 2.1), a process known as “barometricpumping”. When the atmospheric pressure is greater than the subsurface pressure,ambient air flows into the well. This principal forms the basis of passive bioventingtechnologies that are used to deliver oxygen/air to soils impacted with petroleumhydrocarbons. Exhalation or venting of soil gas, which forms the basis for PSVE, occurswhen the subsurface pressure is greater than the atmospheric pressure.Figure 2.1: Conceptual Model for the ‘Inhalation’ and ‘Exhalation’ Phenomenon Observed inWells Installed within the Vadose Zone.6 Enhanced Attenuation Technologies<strong>Passive</strong> <strong>Soil</strong> <strong>Vapor</strong> <strong>Extraction</strong>
SRNL-STI-2009-00571Rev. 1The mass flux of contaminants from an extraction well (kg/yr) depends primarily on theradial permeability within the target zone and on the magnitude of the pressure gradientthat develops between the atmosphere and the target zone. The pressure gradient inturn is a function of the lithology and the vertical permeability of the soil layers overlyingthe target zone. At sites with deep vadose zones or with a highly stratified soil structure,the damping phenomenon can be substantial, resulting in differential pressures that aresufficient to induce high soil gas or ambient air flow rates. Sites with more resistance tovertical air flow (due to man-made caps or from natural “confining” units) will show higherdifferential pressure and sometimes higher flowrates from barometric SVE applications.During outflow events, the soil gas flow can remove accumulated volatile contaminantsreleased from impacted soils. At the MAPSL site (Riha, 2005c), soil gas flow rates up to76 cubic feet per minute (cfm) have been recorded in extraction wells screened withinthe vadose zone during exhalation or venting (Figure 2.2). Apart from fluctuations inpressure, PSVE well vapor flows are a function of well size, screen length, screen zoneand gravel pack. Larger wells (e.g. 4-inch diameter wells) generally produce higheramounts of flow compared to 2-inch diameter wells (Rossabi, 1999). Refer to AppendixA for predicting values of contaminant mass flux and predicted soil gas flow rates basedon measured contaminant concentration in the soil gas and estimated values for verticaland radial permeability for the site.0.50.50.40.4Frequency0.30.2Frequency0.30.20.10.1000 10 20 30 40 50 60MVE-5 PSVE Flow, cfm0 10 20 30 40 50 60MVE-8 PSVE Flow, cfm0.50.50.40.4Frequency0.30.2Frequency0.30.20.10.1000 10 20 30 40 50 60MVE-6 PSVE Flow, cfm0 10 20 30 40 50 60MHV-6 PSVE Flow, cfmFigure 2.2: Distribution of Flow Rates from an <strong>Extraction</strong> Well collected at 15 Minute Intervalsover a Period of One Year (adapted from Riha, 2005c).The duration of flow depends on the relative frequency of fluctuations in the atmosphericpressure and the attenuation capacity of the unsaturated zone overlying the screenedinterval. Atmospheric pressure fluctuations occur on a diurnal as well as on a seasonal7 Enhanced Attenuation Technologies<strong>Passive</strong> <strong>Soil</strong> <strong>Vapor</strong> <strong>Extraction</strong>
SRNL-STI-2009-00571Rev. 1basis. In areas within the contiguous United States, the diurnal atmospheric pressurefluctuations can range between 0.3 to 6 inches of water, with pressure highs observed inthe early morning and lows in the afternoon (ESTCP, 2006). Weather-front atmosphericpressure changes, on the other hand, typically last 3 to 5 days and can be of asignificantly higher magnitude than the diurnal fluctuations (Neeper, 2002). Typicaldiurnal changes in the barometric pressure are shown in Figure 2.3.aSurface PressureWell Pressure102010101000Pressure, mbarFlow, scfm80604020bMVE-8MHV-602/23/02 3/2/02 3/9/02 3/16/02 3/23/02 3/30/02 4/6/02Figure 2.3a: Typical Diurnal Changes in the Barometric and Subsurface Pressure at an SRS site,SC. b. Typical Daily Flow Rates Measured in <strong>Extraction</strong> Wells Undergoing Barometric Pumpingat an SRS Site, SC (adapted from Riha, 2005c).The pressure wave attenuation capacity of a site can also affect the duration of theequilibration period and is a function of the depth and vertical permeability of the vadosezone. Deep vadose zone contamination (Figure 2. 4), low permeability strata betweensurface and target zone, or presence of a surface seal (as utilized in BERT TMapplications) can extend the equilibration period resulting in longer exhalationresponses.8 Enhanced Attenuation Technologies<strong>Passive</strong> <strong>Soil</strong> <strong>Vapor</strong> <strong>Extraction</strong>
SRNL-STI-2009-00571Rev. 1Figure 2.4: Average Differential Pressure Measured Above and Below a Low PermeabilityCaliche Layer at the Hanford Site, WA (adapted from Rohay et al., 1997)The radius of influence (ROI) of a barometric application is a function of the soilpermeability and the pressure gradient (Rohay et al., 1997). At the INEEL site in Idaho,tracer tests using sulfur hexafluoride were used to estimate the ROI (7 m). At the SRSsites, an ROI of 4 – 5 m was estimated using a simple cylindrical model of well capture.At the Hanford site, the ROI was calculated using the same method and was found torange between 15 – 24 m, due to lithological controls (very high permeability strata) thatincreased the effectiveness of the pressure-difference induced flow.The mass of contaminants removed depends on the soil gas extraction rate and theconcentration of contaminants in the soil gas. Installation of one-way passive valves hasbeen shown to prevent the dilution of soil gas with ambient air during the “inhalation”periods, resulting in at least two times the mass removal rates achievable without thecontrol valves (Rohay et al. 1997; Rossabi, 1999).2.1.2 Assisted <strong>Passive</strong> <strong>Soil</strong> <strong>Vapor</strong> <strong>Extraction</strong>Due to its reliance on the pressure gradient between the atmosphere and thesubsurface, barometric pumping may be unsuitable for sites with very shallowcontaminated soils. At these sites, contamination is often confined to low permeabilitystrata or there isn’t sufficient cumulative vertical flow impedance to produce adequatepressure difference periods between the surface and target zones. For such sites, smallblowers can be used as part of an “assisted PSVE” system to exert a continuous andconsistent soil gas extraction rate at the extraction well. The blowers are low-cost andare capable of operating using renewable energy sources such as solar or wind power.By using renewable sources of energy, the blowers eliminate the need for an externalpower supply that would require consumables (e.g., gasoline, diesel, propane, etc.) and9 Enhanced Attenuation Technologies<strong>Passive</strong> <strong>Soil</strong> <strong>Vapor</strong> <strong>Extraction</strong>
SRNL-STI-2009-00571Rev. 1ancillary infrastructure that are generally required to run conventional ASVE systems inremote areas, thereby reducing the carbon footprint and O&M expenses.As with ASVE systems, the amount of soil gas extracted is a function of the radialpermeability of the target zone, the vacuum application rate, the volume of the targetzone, and the air handling capacity of the blower. Furthermore, large diameter wellsproduce slightly more soil gas than smaller wells. The ROI depends on the radialpermeability of the target zone, presence of stratigraphic or man-made features thatconstrain the target volume, and the applied vacuum. Based on typical ROI estimates forASVE systems (4 m to 30 m) (Johnson et al., 1990), the maximum ROI that can beexpected from an assisted PSVE system is likely to be less than 30 m.2.2 Description of Equipment2.2.1 Barometric ApplicationsResearchers have developed an array of check valves that can be used in barometricapplications. Of these, only the BaroBall TM control valve is available commercially.a. BERT TM Mylar Flapper Valve: The valve was designed by researchers at Scienceand Engineering Associates and installed at the INEEL Radioactive WasteManagement Complex in December 1996 to promote barometric extraction ofvolatile organic compounds (VOCs) at the site (ITSER, 2000). The design was laterinstalled at the Los Alamos National Laboratory (LANL) site in 1999 to ventaccumulated water vapor from beneath asphalt pads in a radioactive waste storagearea.The assembly includes a light-weight flapper valve, mounted at an angle, inside astack vent (Figure 2.5). The valve is a low-differential pressure relief valve with acracking pressure (i.e., the amount of pressure required to open the valve) less than0.1 mbar. Under negative pressure differential conditions, the valve maintains a sealthus preventing flow of ambient air into the stack. Additionally, the assembly includesa turbine ventilator that enhances soil gas removal under high wind speedconditions. The device was originally designed to be installed directly within asurface seal (such as a geosynthetic liner), however, a similar assembly can beeasily constructed and fitted directly to extraction wells.b. INEEL Mylar Disk: The disk was originally designed at the Idaho NationalEngineering and <strong>Environmental</strong> Laboratory (INEEL) and is currently used at a fewsites in Denmark. Like the mylar flapper valve, the mylar disk has a low crackingpressure and is capable of maintaining a seal during negative pressure differentialconditions.c. Baroball TM Control Valve: Designed by scientists at Savannah River NationalLaboratory, the Baroball TM uses a table tennis ball placed in a valve seat to allowflow of soil gas into the atmosphere when the pressure in the well is greater than theatmospheric pressure and seals the well by closing the valve when the atmosphericpressure is greater than the pressure in the well. In the currently available model, the10 Enhanced Attenuation Technologies<strong>Passive</strong> <strong>Soil</strong> <strong>Vapor</strong> <strong>Extraction</strong>
SRNL-STI-2009-00571Rev. 1cracking pressure is less than 1 mbar. A version of the Baroball was designed tofacilitate the measurement of the volume of air passing through the valve using atapered column that permits the ball to rise in the column in proportion to the flowrate. Furthermore, an in-line condenser located between the well and the valveprevents moisture condensation in the valve that could cause it to freeze in oneposition during cold weather. The condenser also holds condensed water that isproduced when warmer, moist air from the subsurface is cooled in the valve tubingduring cold weather. The condensate can be drained periodically with a valve in thebottom of the condenser.abFigure 2.5: Schematic of Control Valves used in Barometric Applications a. BERT TMValve (ITSER, 2000) b. Baroball TM Control ValveFlapper2.2.2 MicroBlower ApplicationsThe MicroBlower system is simple and easy to install on individual wells. The assemblyconsists of a 12- or 24-V DC vacuum blower powered by a renewable energy sourcesuch as solar or wind energy. A battery bank can be used for reserve power when sun orwind is inadequate. The blower pumps in the system are small and unobtrusive,measuring 4 inches in height and 3 inches in diameter. Currently-available MicroBlowersare capable of generating a maximum vacuum of 10.2 inches-water and handlingmaximum air flow rates of 17-18 standard cubic feet per minute (scfm) (see Figure 2.6).The blowers are also fitted with Baroball TM control valves to ensure unidirectional flow ofair. The blowers can be designed to operate 24 hours/day and are rugged with meantime between failures (MTBF) on the order of 15,000 to 20,000 hours.11 Enhanced Attenuation Technologies<strong>Passive</strong> <strong>Soil</strong> <strong>Vapor</strong> <strong>Extraction</strong>
SRNL-STI-2009-00571Rev. 11816<strong>Soil</strong> Gas Flow Rate (scfm)141210864200 2 4 6 8 10Applied Vacuum (inches of water)Figure 2.6: Measured Pump Curve for the MicroBlower used at SRS, SC.12 Enhanced Attenuation Technologies<strong>Passive</strong> <strong>Soil</strong> <strong>Vapor</strong> <strong>Extraction</strong>
SRNL-STI-2009-00571Rev. 1abFigure 2.7: (a) Schematic of the MicroBlower Assembly; (b) MicroBlower installed at an individualwell at an SRS site, SC.2.3 System Operation and Maintenance2.3.1 Barometric ApplicationsThe one-way passive valve is a simple mechanical device that requires minimalmaintenance over the long-term apart from periodic inspections to ensure proper sealing13 Enhanced Attenuation Technologies<strong>Passive</strong> <strong>Soil</strong> <strong>Vapor</strong> <strong>Extraction</strong>
SRNL-STI-2009-00571Rev. 1of the valve when closed and easy opening during outflow pressure events. Presence ofdirt or insects can interfere with the sealing of the ball/flapper and result in some leakageof ambient air into the well during inflow events. In general, this condition corrects itselfduring subsequent outflow events.2.3.2 MicroBlower ApplicationsThe MicroBlower assembly requires basic house-keeping to ensure effective long-termoperation - cleaning of the pumps, dusting of the solar panels or maintenance of thewind generators. Current field experience with systems using solar panels as the energysource indicates that the O & M requirements for the MicroBlowers are minimal.2.4 Long-Term Monitoring for PSVE ApplicationsIn general, an effective SVE monitoring program should involve periodic collection ofdata necessary to estimate contaminant mass flux as well as evaluate the progress ofremediation by SVE. Mass flux (units - kg/yr) can be calculated based on fieldmeasurements of the soil gas extraction rates and VOC concentrations in the extractedgas. Remedial progress within the zone of influence of the extraction well can beestimated using results from a rebound test performed at regular intervals during thecourse of the SVE program. See Site Example 1 in grey box for a description of themethod used at the MAPSL site, SRS, SC to demonstrate the effectiveness of a PSVEapplication.2.4.1 Estimation of Contaminant Mass FluxThe average contaminant mass flux (kg/yr) can be calculated by multiplying the averageVOC concentrations measured in the extracted soil gas by the estimated average soilgas flow rates.Measurement of VOC Concentrations in <strong>Soil</strong> Gas: Field equipment capable ofmeasuring both the VOCs and CO 2 e.g. Infra-red Photo-Acoustic Spectroscopy (IRPAS)should be used in order to determine the average VOC concentrations in the soil gas.Measuring the CO 2 concentrations in the extracted soil gas is necessary to ensure thatextracted gas is from the subsurface target zone and is not being short circuited from thesurface. Alternatively, samples may be collected in Tedlar bags, summa canisters orglass vials and analyzed using standard methods.Measurement of <strong>Soil</strong> Gas Flow Rates: Due to the intermittent nature of the barometricpumping technology, the use of continuous flow data logging systems to measure soilgas flow within the vent well is generally recommended for at least some wells in abarometric extraction system. Wells must be temporarily sealed to accurately measurethe subsurface pressure. Once the relation between surface pressure fluctuations andsubsurface pressure (and ultimately flow through the well) have been established bymonitoring, the flow response to surface pressure fluctuations can be accuratelypredicted by analytical models (Rossabi and Falta, 2002).14 Enhanced Attenuation Technologies<strong>Passive</strong> <strong>Soil</strong> <strong>Vapor</strong> <strong>Extraction</strong>
SRNL-STI-2009-00571Rev. 1Measurement of soil gas extraction rates in MicroBlower applications are identical tothose used in conventional ASVE applications. Since the flow rates tend to be moreconsistent than barometric applications, weekly measurement of the instantaneous soilgas flow rate at the wellhead using a hand-held thermal anemometer should satisfy thedata requirements. If the MicroBlowers are operated without a power storagemechanism (e.g. a battery), then the operating history of the renewable energy powersystem will determine the volume of gas extracted.2.4.2 Evaluating Remedial Progress within the ROIA rebound test is a widely-accepted method for estimating the extent of progress of anSVE remedial program.The premise of a rebound test is that soils are heterogeneous and flow of soil gastowards an extraction well occurs as a result of rapid advective flow from the morepermeable soil layers surrounding the well. Contaminant transport from soils withrelatively low permeablility, on the other hand, is dictated by the rate of contaminantdiffusion from the low permeability soils to the more permeable soils, a process that mayoccur over periods of months or years. As a result of this difference in timescale forcontaminant transport, the VOC concentrations in the extracted soil gas rapidly declinesduring the early stages of SVE operation, reflecting the rapid flushing of the VOC-ladensoil vapor within the more permeable zones. However, the concentration ultimatelystabilizes over time at a rate that reflects the rate of diffusion of the contaminant from thelow permeability soils. The concentration of VOCs during the latter stages of an SVEoperation is therefore an indicator of the progress of the remediation and can be used topredict the flux of contamination to determine risk to receptors and appropriate mitigationstrategies.15 Enhanced Attenuation Technologies<strong>Passive</strong> <strong>Soil</strong> <strong>Vapor</strong> <strong>Extraction</strong>
SRNL-STI-2009-00571Rev. 1abFigure 2.8: Schematic of Advective and Diffusive Flow of <strong>Soil</strong> Gas during a. Early andb. Late Stages of <strong>Soil</strong> <strong>Vapor</strong> <strong>Extraction</strong>.During a rebound test, the operating SVE system (barometric or MicroBlower) is shut-offto allow the different soil layers to equilibrate. Over time, the concentration of VOCs inthe more permeable layers should “rebound” at a rate that is dictated by diffusionprocesses within the low permeability soils. This maximum or equilibrium concentrationachieved in the extraction well during the rebound test can be used to qualitatively16 Enhanced Attenuation Technologies<strong>Passive</strong> <strong>Soil</strong> <strong>Vapor</strong> <strong>Extraction</strong>
SRNL-STI-2009-00571Rev. 1predict the residual mass of contaminants remaining in the source zone. For moredetails on how to conduct a rebound test, refer to the USACE SVE design guide (2002).Site example 1 (shown in grey box) describes a method used at the MAPSL site (Riha,2005c) to evaluate long-term performance effectiveness of a barometric strategy. Thissame strategy can be used to calculate performance objectives for a future PSVEstrategy as well.SITE EXAMPLE 1: COMPARISON OF MASS REMOVAL RATES TO MASS TRANSFERRATES IN THE TARGET ZONE AT THE MAPSL SITE, SRS, SCSite: In 2005, a rebound test was conducted using five inactive ASVE wells at the M-AreaAbandoned Process Sewer Line (MAPSL) at the Savannah River Site, SC. These wellswere screened in or very close to three fine-grained zones containing residual VOCs. Datacollection included periodic analysis of soil gas for PCE and TCE concentrations.In addition, two nearby inactive ASVE wells, not included in the rebound test, were fittedwith the Baroball TM assembly and measured for continuous flow rates and soil gasconcentrations.Performance Metric: In order to reduce the migration of contaminants to groundwater, aPSVE system should be capable of extracting VOC mass at a rate that equals or exceedsthe rate of mass transfer of contaminants from contaminated soils within the target zone tosoil gas phase.Data Analysis: The mass transfer rate of VOCs in the soils surrounding each well wasobtained by calculating the slope on a linear fit applied to the initial concentrationsmeasured at each well during the rebound test. These estimates were then scaled to obtainthe VOC mass loading to the entire source zone area.The average VOC mass removal rates were calculated using soil gas flow rates and VOCconcentrations in the soil gas extracted from the two inactive ASVE wells fitted with theBaroball TM assembly. These estimates were then scaled to obtain total VOC mass removalin the source zone area.Results:· PCE: Mass loading of PCE from the source area was calculated to be approximately 0.024kg- PCE/day (8.8 kg-PCE/yr) whereas the measured mass removal rates by barometricpumping was approximately 0.03 lbs-PCE/day (11.6 kg-PCE/yr)· TCE: Mass loading of TCE from the source area was approximately 0.022 kg-TCE/day(8.0 kg-TCE/yr). In contrast, the actual mass removal rates by barometric pumping wasmeasured to be approximately 0.027 lbs-TCE/day (9.95 kg-TCE/yr).Site Example 1 Conclusion: The PSVE technology was shown to be effectively removingmass from the source zone at rates greater than the rates of dissolution or diffusion andtherefore, the technology was considered protective of the groundwater at the Site.17 Enhanced Attenuation Technologies<strong>Passive</strong> <strong>Soil</strong> <strong>Vapor</strong> <strong>Extraction</strong>
SRNL-STI-2009-00571Rev. 12.5 Site Transition to MNAThe ultimate goal for any PSVE site is to eventually transition to MNA and/or siteclosure. Determining specific criteria that can predict when this transition can be madeis essential and should be identified early-on in the site decision-making process by sitestakeholders. Depending on site conditions and identified remediation drivers, a sitecould have requirements other than generic MCLs to meet the “no further action” level.This allows for development of innovative site-specific metrics that can be used tosupport this transition. See Site Example 2 (grey box) for description of one of the sitetransition goals developed for the MAPSL site at the SRS, SC (Riha and Whiteside,2008).SITE EXAMPLE 2: SITE TRANSITION CRITERIAAT THE MAPSL SITE, SAVANNAH, SCAt the MAPSL site, a risk-based site specific target level (SSTL) was proposed as thetransition point from a PSVE to an MNA strategy. Simple partitioning equations were usedto determine the maximum soil vapor concentration of each contaminant that could exist inequilibrium with impacted pore water in a source zone without posing any additional risk togroundwater due to leaching.First, a pore water concentration protective of the groundwater was calculated by dividingthe lowest concentration measured in on-site wells by a safety factor of 10. At the site, thelowest concentration of PCE and TCE measured was 0.6 mg-PCE/L and 1.6 mg-TCE/L.Based on a safety factor of 10, the pore water concentration considered protective of thegroundwater was assumed to be 0.06 mg-PCE/L and 0.16 mg-TCE/L.Next, the soil vapor concentration in equilibrium with the pore water was calculated underequilibrium conditions using Henry’s Law. This soil vapor concentration was considered tobe protective of the groundwater. At the MAPSL site, the soil vapor SSTL for PCE andTCE was calculated to be 4.7 ppmv-PCE and 9.3 ppmv-TCE and was therefore, proposedas a potential end-point for the PSVE strategy.18 Enhanced Attenuation Technologies<strong>Passive</strong> <strong>Soil</strong> <strong>Vapor</strong> <strong>Extraction</strong>
3.0 TECHNOLOGY APPLICABILITY AND ALTERNATIVESSRNL-STI-2009-00571Rev. 1Given the complex distribution and migration patterns of contaminants at chlorinatedsolvent sites, successful strategies for clean-up often involve a combination or asequence of technologies that address different site conditions as the treatmentprogresses. Prior knowledge of the strengths and weakness of any technology, as wellas any potential compatibility issues, is key when considering combined remedies toensure that a remedial configuration for a site will be optimally effective.3.1 PSVE Technology StrengthsThe primary advantages of PSVE applications are their technological simplicity, costeffectivenessand wide applicability.• PSVE systems are most effective at removing residual concentrations of volatilecontaminants from the unsaturated zone. It is therefore suitable as a polishingtechnology for sites where ASVE performance no longer warrants its operating costs.For example, at sites where the VOC transport in the vadose zone is dictated bydiffusion mechanisms, the intermittent nature of barometric pumping can ensure thatthe available contaminant mass will be removed as it is released from the lowpermeability zones and at a price that ASVE or other active technologies cannotmatch.• Like conventional SVE strategies, the technology exhibits the highest gas removalrates in coarse soils with high permeability, but because of the passive nature of thetechnology, it is also applicable to diffusion-controlled, lower permeability soils. Forbarometric pumping, the presence of multiple soil layers separated from theatmosphere by a confining unit or by depth greatly increases the effectiveness of thetechnology. For assisted PSVE, good conditions for solar or wind power increase theoverall effectiveness.• Due to their minimal operating and maintenance requirements, PSVE technologiessuch as the Baroball TM and MicroBlower systems are well-suited for application atremote sites.• The Baroball TM and MicroBlower systems use conventional, readily-availablesupplies and construction techniques.• Capital costs for PSVE technologies are low. Units for individual wells range up to$1300 – $2000 per well for small vacuum blowers (including power sources), and
SRNL-STI-2009-00571Rev. 1• Implementation of either system eliminates the need for costly and high-maintenanceinfrastructure typically associated with an ASVE application, such as high powerelectric blowers, vacuum manifold systems and electrical lines and control boxes.• Operating and maintenance costs are generally low and the units can be expected tooperate continuously for the life span of the remediation with little or no intervention.3.2 PSVE Technology WeaknessesIn general, PSVE technologies suffer from the same limitations as those documented forASVE, but with the additional limitation that the removal rates and radius of influence forextraction wells will likely be lower than ASVE applications.• SVE technologies are limited to vadose zone contamination and do not directlyaddress existing groundwater contamination in most situations.• High moisture levels or high pore water saturation can limit air permeability andreduce the rate of contaminant mass removal.• The presence of preferential pathways, such as abrupt changes in lithology, deeproot zones, or anthropomorphic features, could result in low air flow due to vacuumdisruptions or more likely, short-circuiting to the atmosphere.In addition to these limitations,• PSVE technologies are typically not appropriate to treat high levels of VOCs incomparison with ASVE. High contaminant mass removal rates would probablynecessitate above-ground vapor treatment which may off set the benefits of a lowenergyextraction system. Furthermore, it would be harder to gain regulatoryapproval for a passive treatment technology at these sites when an activeremediation technology would probably be more effective in terms of mass removalrates.• Low and intermittent extraction of air at sites employing barometric pumping may notbe sufficient to meet the target mass removal rates. Depending on the site lithologyand barometric pressure gradient, peak flow rates may be as low as 1 cubic foot perminute (cfm), and may last only a short period during each 24-hour period. For sitesemploying solar- or wind-powered SVE, the highest vacuum possible still may notproduce desirable airflow rates.• Barometric pumping is generally not suitable for sites with limited lithologicstratification or a shallow groundwater table. These factors allow vertical movementof air from the surface, which circumvents the barometric pumping process.• Due to the small zone of capture around each well, sites employing PSVEtechnologies may generally require more extraction wells than conventional activeSVE systems, thus adding to the overall cost of site preparation, installation and20 Enhanced Attenuation Technologies<strong>Passive</strong> <strong>Soil</strong> <strong>Vapor</strong> <strong>Extraction</strong>
SRNL-STI-2009-00571Rev. 1monitoring. In some cases, additional wells may be needed to convert an active SVEsystem to a PSVE system.Figure 3.1a: Factors that Favor PSVE.21 Enhanced Attenuation Technologies<strong>Passive</strong> <strong>Soil</strong> <strong>Vapor</strong> <strong>Extraction</strong>
SRNL-STI-2009-00571Rev. 1Figure 3.1b: Factors that could Preclude PSVE.22 Enhanced Attenuation Technologies<strong>Passive</strong> <strong>Soil</strong> <strong>Vapor</strong> <strong>Extraction</strong>
SRNL-STI-2009-00571Rev. 13.3 Competing and Complementary TechnologiesPSVEs are technologically simple and do not require modifications to the hydrologicalflow or to the natural aquifer characteristics to be effective. Therefore, the selection ofPSVEs does not restrict the choice of technologies that can be implemented subsequentto a PSVE application. However, active technologies that alter aquifer conditions (i.e.,reduce the porosity and/or the air permeability of the unsaturated zone) can negativelyimpact the effectiveness of any concurrent or subsequent PSVE application. Potentialcompatibility issues that can arise between PSVEs and other technologies routinelyevaluated at chlorinated solvent sites are shown in Table 3.1.Technologies that are compatible with concurrent or subsequent PSVE applicationsinclude most saturated zone treatment technologies such as bioremediation andphytoremediation, which can be deployed in the vicinity of a PSVE well network withoutconcerns about reducing the effectiveness of either technology.Infiltration barriers or capping technologies can increase extraction efficiencies ofbarometric pumping wells. As an impermeable barrier, the surface seal allows fordevelopment of greater pressure differentials between the surface and the target zone,thus enhancing soil vapor gas flows from the subsurface. Furthermore, by restrictinginfiltration into the vadose zone and by reducing the likelihood of short-circuiting to theatmosphere, the surface barrier serves to increase the efficiency of any concurrentPSVE application.On the other hand, active source remediation technologies such as thermal treatmentand surfactant flushing can decrease the effectiveness of any subsequent SVEtechnology. By reducing the overall gas filled porosity and/or permeability of the treatedaquifer, such technologies can interfere with VOC mass transport within the soil. At siteswhere an active SVE system is still in place, installation of a PSVE well near an ASVEwellhead could render the PSVE well ineffective if the zones of capture for the two wellsoverlap.Saturated zone pump and treat (P&T) can increase extraction efficiencies of PSVE inareas of groundwater table drawdown and reduce extraction efficiencies of PSVE in reinjectionareas of groundwater table mounding. Impacts to the water table effectivelyincrease or decrease the depth of the vadose zone, resulting in higher or lowerextraction rates, respectively, by any concurrent SVE application.23 Enhanced Attenuation Technologies<strong>Passive</strong> <strong>Soil</strong> <strong>Vapor</strong> <strong>Extraction</strong>
SRNL-STI-2009-00571Rev. 1Table 3.1: Remedial Technologies Routinely Employed at Chlorinated Solvent Sites and Potential Compatibility Issues that can arise duringConcurrent or Subsequent PSVE ApplicationsRemedial TechnologiesRoutinely Employed atChlorinated SolventSitesPotential Impact onSource and/orGroundwater PlumePotential Impact on Concurrent orSubsequent PSVE Applications withinTreated ZoneCompatible/ComplementaryCompeting / PossiblyNon-CompatibleRationale for Compatibility StatusSource Enhancement Zone Technologies• Excavation Source mass removal Reduced mass could encourage selection of PSVEs.• <strong>Soil</strong> <strong>Vapor</strong> <strong>Extraction</strong> Source mass removal Compatible as a precursor to PSVE. Could be acompeting technology if concurrently implemented. Highvacuum rates could interfere with the development of adiffusion gradient between the passive well andsurrounding areas• Thermal remediation(Electrical Resistance)• Thermal remediation(Steam injection)Source mass removal &mass flux reductionSource mass removal &potential for mass fluxreductionPotential reduction in porosity and air permeability couldaffect soil gas flow rates and VOC diffusion kineticsPotential reduction in porosity and air permeability couldaffect soil gas flow rates and VOC diffusion kinetics• Flushing (surfactants,foams, cosolvents)• Chemical Oxidation (InSitu Oxidation)• Capping/InfiltrationBarriers<strong>Inc</strong>reases mass flux ofcontaminants from lowpermeability zonesReduction in source massand mass fluxReduced infiltrationresulting in decreasedmass flux of contaminantsfrom treated zone No interference foreseenReduction in permeability could affect VOC diffusion ratesand air flow rates Surface seal could increase the pressure differentialbetween the atmospheric and subsurface. Also, lowerinfiltration through the source could reduce moisturecontent in the vadose zone.24 Enhanced Attenuation Technologies<strong>Passive</strong> <strong>Soil</strong> <strong>Vapor</strong> <strong>Extraction</strong>
SRNL-STI-2009-00571Rev. 1Remedial TechnologiesRoutinely Employed atChlorinated SolventSitesPotential Impact onSource and/orGroundwater PlumeSource Enhancement Zone Technologies (CONTD.)• Dual Phase<strong>Extraction</strong>GW and vadose zonemass removal• Addition of bio Decrease mass flux to thesubstrates as Vadose groundwaterZone ApplicationPlume Enhancement Zone TechnologiesPotential Impact on Concurrent orSubsequent PSVE Applications withinTreated ZoneCompatibleComplementaryCompeting / PossiblyNon-CompatibleRationale for Compatibility Status Could be a competing technology if proper precautions toprevent mounding are not taken. Also, if re-injection ispermitted at the site, care should be taken not to re-injectin the vicinity of any active PSVE wells. Could enhance biodegradation of contaminants within thevadose zone. However, it is possible that the addedsubstrate could likely decrease permeability and gas filledpore volume.• Pump & Treat Dissolved mass removal Could be a competing technology if proper precautions toprevent mounding are not taken. Also, if re-injection ispermitted at the site, care should be taken not to re-injectin the vicinity of any active PSVE wells.• Slurry wall Decreases Contaminant No interference foreseenMass Flux fromsubmerged source• Air Sparging Assists in source massremoval• Bioremediation (e.g.Engineered additionof Electron Donors) Could enhance mass transfer of VOCs, however,technology is energy-intensive and not sustainable.Therefore, implementation would defeat the purpose ofPSVE.Dissolved mass removal No interference foreseenDischarge Enhancement Zone TechnologiesPhytoremediation Dissolved mass removal No interference foreseen25 Enhanced Attenuation Technologies<strong>Passive</strong> <strong>Soil</strong> <strong>Vapor</strong> <strong>Extraction</strong>
SRNL-STI-2009-00571Rev. 14.0 TECHNOLOGY PERFORMANCEThe performance of PSVE at several sites is summarized in the following section. In allcases, conditions at these sites were judged suitable for application of PSVE, either as astand-alone measure or following (or in conjunction with) ASVE. Performance wasassessed using most of the measures outlined in Section 5 of this document(concentration reductions, mass removal. etc.). Note that while the majority of the datais from applications using barometric pumping, a site where assisted PSVE using aMicroBlower device is also included.4.1 Metallurgical Laboratory (Metlab)4.1.1 Site DescriptionThe Metallurgical Laboratory (MetLab) waste unit is located at the Savannah River Site(SRS), within the A/M areas. PCE and TCE were the primary solvents used at the site, withhistoric releases leading to vadose zone soil impacts and the development of a soil gasplume. Nineteen vadose zone wells were installed across the source area of the Metlab in1996 and BaroBall TM devices were installed at the surface of each well casing to permitpassive soil vapor extraction via natural barometric pressure changes. Monitoring of wellvapor concentrations (PCE and TCE) began in June 1998 and continues to present day.Site characteristics that contributed to the selection of PSVE:• Vadose zone source is well-defined and present in deep, lithologically isolated strata• Need for cost-effective, low-maintenance treatment that protects the groundwater4.1.2 Results/Performance MetricsPerformance data for the Metlab is available through June 2005 (Riha, 2005b) and includestemporal concentration trends, mass removal rates, plume size, and cumulative massremoval, as summarized in Table 4.1.26 Enhanced Attenuation Technologies<strong>Passive</strong> <strong>Soil</strong> <strong>Vapor</strong> <strong>Extraction</strong>
SRNL-STI-2009-00571Rev. 1Table 4.1: Results from Full-Scale Application of <strong>Passive</strong> <strong>Soil</strong> <strong>Vapor</strong> <strong>Extraction</strong> at the MetLabSite, SRS, SC.Site NameMetLabLocationSavannah River Site, Aiken, SCType of Device UtilizedBaroball TMNo. of Wells 19No. of Wells per acre~ 6 (estimated)Zone of Capture~ 25 (assumed based on well spacing)Screened Interval60 ft (from 20 to 80 ft bgs)Average Flow Rate1 cfmPore Volumes Removed During Operating Not reportedPeriodStarting <strong>Vapor</strong>-Phase Concentration 18.0 ppmv PCE15.4 ppmv TCE(Average of 19 wells)Ending <strong>Vapor</strong>-Phase Concentration0.8 ppmv PCE0.7 ppmv TCE(Average of 19 wells after 7 years ofoperation)Mass Transfer/Removal Rate(per well)Mass Removed (per well)Mass Removed (cumulative)Cost0.0006 to 0.0020 yr -1 PCE0.0004 to 0.0016 yr -1 TCE0.3 to 11.4 kg of PCE;0.09 to 8.8 kg of TCE74.3 kg of PCE;48.6 kg of TCENot reported27 Enhanced Attenuation Technologies<strong>Passive</strong> <strong>Soil</strong> <strong>Vapor</strong> <strong>Extraction</strong>
SRNL-STI-2009-00571Rev. 14.2 Miscellaneous Chemical Basin (MCB)4.2.1 Site DescriptionThe MCB waste unit is located in the northwest portion of the Savannah River Site. Limitedinformation is available concerning historic releases within the MCB, but it is thought that thebasin received mixed solvent waste, used oil, and partially full drums until 1974. Thesehistoric releases led to vadose zone soil impacts and the development of a soil gas plume(with the center of the plume not corresponding to the former location of the basin due toregrading). Twenty-five vadose zone wells were installed across the source area of the MCBin 1996 (Figure 4.2) and Baroball TM devices were installed at the surface of each well casingon each well casing to facilitate passive soil vapor extraction due to natural barometricpressure changes. Monitoring of well vapor concentrations (PCE and TCE) began in April1996 as part of a treatability study that extended for a period of approximately 1 year. Basedon the success of this initial study, the system was left in place and continues to operatethrough present day. An active soil vapor extraction system was also operated betweenOctober 2001 and December 2002.Site characteristics that contributed to the selection of PSVE:• Vadose zone source is well-defined and present in deep, lithologically isolated strata• Need for cost-effective, low-maintenance treatment that protects the groundwater4.2.2 Results/Performance MetricsComprehensive performance data for the MCB is available from the treatability study (Rihaand Rossabi, 1997) and includes temporal concentration trends, mass removal rates, plumesize, cumulative mass removal, and estimation of remediation timeframe, as summarized inTable 4.2. It should be noted that the operation of an ASVE system at the MCB influencedthe performance of the PSVE after this period, such that subsequent data would notnecessarily be reflective of long-term performance of a stand-alone PSVE system.28 Enhanced Attenuation Technologies<strong>Passive</strong> <strong>Soil</strong> <strong>Vapor</strong> <strong>Extraction</strong>
SRNL-STI-2009-00571Rev. 1Table 4.2: Results from Full-Scale Application of <strong>Passive</strong> <strong>Soil</strong> <strong>Vapor</strong> <strong>Extraction</strong> at the MCB Site,SRS, SC.Site NameMCBLocationSavannah River Site, Aiken, SCType of Device UtilizedBaroball TMNo. of Wells 25No. of Wells per acre~ 0.9 (estimated)Zone of Capture~ 120 ft (assumed based on well spacing)Screened IntervalSelected intervals from 0 to 110 ft bgsAverage Flow Rate2 to 4 cfmPore Volumes Removed During Not reportedOperating PeriodStarting <strong>Vapor</strong>-Phase Concentration 37 ppmv TCE; (Average of 19 selected wells)Ending <strong>Vapor</strong>-Phase ConcentrationMass Transfer Rate (/ well)Mass Removed ( per well)Mass Removed (cumulative)Cost13 ppmv TCE; (Average of 19 selected wells after 1.1 yrof operation)0.001 to 0.006 yr -1 TCENot reported45 lb of total VOCs for first 1.1 yr$779 to $1560 per kg removed for first 1.1 yr$469 to $939 per kg removed over 10 yrs29 Enhanced Attenuation Technologies<strong>Passive</strong> <strong>Soil</strong> <strong>Vapor</strong> <strong>Extraction</strong>
SRNL-STI-2009-00571Rev. 1Table 4.3: Results from Full-Scale Application of <strong>Passive</strong> <strong>Soil</strong> <strong>Vapor</strong> <strong>Extraction</strong> at the MAPSLSite, SRS, SC.Site NameMAPSLLocationSavannah River Site, Aiken, SCType of Device Utilized Baroball TM MicroBlowerNo. of Wells 8 2No. of Wells per acre 0.3 (estimated) 0.8 (estimated)Zone of Capture16 to 26 ft (using 1 yr of flow Not Reportedevent data);9 to 39 ft (using continuousaverage flow rate)Screened Interval 85 ft (25 to 110 ft bgs) 10 ft (30 to 40 ft bgs)Average Flow Rate2.6 to 7.5 cfm(maximum of 76 cfm)2 cfm(Data from 1 well)Pore Volumes RemovedDuring Operating PeriodNot reportedNot reportedStarting <strong>Vapor</strong>-PhaseConcentrationEnding <strong>Vapor</strong>-PhaseConcentrationMass Transfer/RemovalRate (per well)Mass Removed (per well)Mass Removed (cumulative)~ 45 ppmv PCE~ 5 ppmv TCE(Average of 5 wells at peakfollowing switch to PSVEsystem)~15 ppmv PCE< 2 ppmv TCE(Average of 5 wells following4.5 yr of operation)0.03 kg/day PCE;0.03 kg/day TCE;(Average of 2 wells)6.9 to 144 kg of PCE;1.5 to 7.7 kg of TCE307 kg of PCE;29 kg of TCE250 ppmv PCE300 ppmv TCE(Data from 1 well)60 ppmv PCE40 ppmv TCE(Data from 1 well)0.06 kg/day PCE;0.03 kg/day TCE;(Average of 2 wells)37 kg of PCE;21 kg of TCENot reportedCost Not reported Not reported30 Enhanced Attenuation Technologies<strong>Passive</strong> <strong>Soil</strong> <strong>Vapor</strong> <strong>Extraction</strong>
SRNL-STI-2009-00571Rev. 1Table 4.4: Results from Full-Scale Application of <strong>Passive</strong> <strong>Soil</strong> <strong>Vapor</strong> <strong>Extraction</strong> at Four Sites inDenmark.Site NamesLocationType of Device UtilizedNo. of WellsNo. of Wells per acreZone of CaptureScreened IntervalAverage Flow RatePore Volumes Removed DuringOperating PeriodStarting <strong>Vapor</strong>-Phase Concentration(1) Møllevej 12, Askov;(2) Nygade 37, Fakse;(3) Prins Valdemars Alle 14, Allerød;(4) Amtsvej 2-4, AllerødCounties of Sotrtrøm, Frederiksborg, and Ribe inDenmarkOne-way valve for flow control, coupled with granularactivated carbon treatment of off-gasesVaries, typically 5 to 6 per siteVaries3 to 13 ft average; 10 to 33 ft maximumVaries, but typically across entire unsaturated intervalto approx. 60 ft bgs0.1 to 0.6 cfm25 to 100 during 2 yr operating period100 to 300 mg/m 3 PCE (Average)Ending <strong>Vapor</strong>-Phase Concentration 30 to 120 mg/m 3 PCE (Average of wells after up to 2yr of operation)Mass Removal Rate (per well)Mass Removed (per well)Mass Removed (cumulative)Cost0.1 to 1.0 kg/yr PCENot reported(1) 2 to 3 kg; (2) 5 kg; (3) 8 kg; (4) 50 to 60 kg~ $35,000 to $45,000 for typical site with 5 to 6 wells(converted from Danish Krone; excluding VAT)31 Enhanced Attenuation Technologies<strong>Passive</strong> <strong>Soil</strong> <strong>Vapor</strong> <strong>Extraction</strong>
SRNL-STI-2009-00571Rev. 15.0 KEY CONSIDERATIONS DURING SELECTION OF A PSVE TECHNOLOGYFrom a regulatory standpoint, selection of a passive strategy for a site can require morecomplex and expensive site characterization activities than selection of an activetechnology. As with other emerging technologies, collaboration between the siteremediation team, regulators and stakeholders is key to implementation of pilot studies.Existing guidance on the selection of passive technologies, such as MNA, advocate a‘converging lines of evidence’ approach to demonstrate the capability of a passivetechnology to meet clean-up goals at a site. Based on these converging lines ofevidence, passive technologies would most likely receive regulatory approval only if thegroundwater plume is stable or shrinking and if the historical data indicates a generaldecreasing trend in the VOC concentrations over time. At sites where plume conditionsindicate that the natural attenuation is occurring at a rate equal to or greater than themass loading, implementation of a passive source technology could hasten remediation.Thus, to demonstrate the efficacy of a PSVE strategy, site characterization activitieswould have to include an evaluation of the general site conditions, vadose zonehydrology, source geometry and architecture, groundwater flow conditions, plumebehavior, physical and chemical characteristics of the contaminant and contaminantconcentrations. At some sites, the use of simple analytical or complex numericalmodeling might also be necessary to support the selection of the strategy. Guidancedocuments such as MNA OSWER directive (1999) provide useful tools to evaluateconcentration trends as well as plume stability. See Site Example 3 (grey box) for onemethod that was used to demonstrate the suitability of a PSVE strategy at the M-AreaAbandoned Process Sewer Line (MAPSL) site, SRS, SC.SITE EXAMPLE 3: CRITERION FOR SELECTION OF PSVE AT THEMAPSL SITE, SAVANNAH, SCEssentially, an SVE technology is protective of the groundwater only if it is capable ofinducing an advective flux of VOCs towards the vent well (V p ) at a rate that exceeds therate of downward diffusion flux towards the groundwater (V d ).At the MAPSL site, depth discrete gas concentration data collected from three SVE wellswere fitted with an analytical solution of the Ficks’ Second Law of Diffusion in order toobtain an estimate of the diffusion flux.The pore gas velocity or advective flux of VOCs was calculated based on estimates of soilvapor extraction rates, soil porosity, depth of the screened interval and the zone of capturearound each extraction well.Results: Results indicated that the pore gas velocities ranged 10 -3 and 10 -4 cm/s at adistance of 10 and 100 ft from the extraction well. Diffusion rates ranged between 2x10 -6 to8x10 -6 cm/s. These results were comparable to those obtained from robust numericalmodeling. Since the V p > V d , PSVE is a suitable strategy for cleaning up the site.32 Enhanced Attenuation Technologies<strong>Passive</strong> <strong>Soil</strong> <strong>Vapor</strong> <strong>Extraction</strong>
5.1 Decision Framework for Selection of PSVE TechnologiesSRNL-STI-2009-00571Rev. 1In the absence of a technology specific decision framework and process documentation,it may still prove difficult to reliably demonstrate to a regulator or a stakeholder thatPSVE is sufficient to meet some or all MNA requirements within an acceptabletimeframe.Recently, the ITRC (2008) published a document titled “Enhanced Attenuation:Chlorinated Organics” that includes and explains a decision framework to assess theattenuation capacity of a chlorinated solvent site. The enhanced attenuation strategyrelies on an evaluation of the contaminant mass balance to help identify and quantifyattenuation processes occurring at the site. The basic premise of EA is that for somesites, source mass flux reductions due to natural attenuation processes may not besufficient to meet regulatory criteria, causing MNA alone to be an unacceptabletreatment option. However, implementation of a suitable technology or a combination oftechnologies could reduce the source mass flux and/or increase the rate of naturalattenuation to an extent that ensures that the site meets MNA requirements. Thus, asite-specific contaminant mass balance could be the basis for determining whichremedial technologies are capable of bridging the gap between current site conditionsand MNA requirements at the site.A typical EA assessment entails• An evaluation of the degree of enhancement in the rate of source fluxreductions/natural attenuation that would be needed to create conditions suitablefor an MNA application (e.g., a stable or shrinking plume), and;• Identification of the class of technologies that would most effectively meet siteobjectives in a timely fashion. Source strength reduction technologies such asSVE, source excavation and infiltration barriers reduce source mass and/orreduce mass flux from the source zone. Attenuation capacity enhancementtechnologies such as permeable reactive barriers and bioremediation increasethe contaminant attenuation rate by promoting abiotic or biological transformationwithin the plume.For ease of use, the decision process is presented in flowchart format (Figure 5.1) and isintended to be an iterative process for a smooth, efficient and defensible transition toMNA.33 Enhanced Attenuation Technologies<strong>Passive</strong> <strong>Soil</strong> <strong>Vapor</strong> <strong>Extraction</strong>
SRNL-STI-2009-00571Rev. 1Figure 5.1: Structure of the ITRC EA Decision Flowchart and How the PSVE Flowchart Dovetailsinto the Process5.1.2 Decision Process for Selection of PSVEThe ITRC document is a guide to building a strong technically defensible basis forselecting technologies that can accelerate the transition from an active technology toMNA, however, it does not provide any guidance on how to select appropriatetechnologies. The PSVE decision flowchart (Figure 5.2) was developed to providedecision-makers with a systematic approach to demonstrate the appropriateness ofselecting PSVE technologies for chlorinated solvent sites. It is intended to be used inconjunction with the EA flowchart and like the EA process, is intended to be an iterativeprocess that should be repeated during the remedy selection and performancemonitoring until MNA or site closure requirements have been achieved.34 Enhanced Attenuation Technologies<strong>Passive</strong> <strong>Soil</strong> <strong>Vapor</strong> <strong>Extraction</strong>
The PSVE decision process involves the following sequence of five steps:SRNL-STI-2009-00571Rev. 11. Identify site conditions that drive the need for an enhancement technology: Thisstep provides the link to Section iii of the EA flowchart and encourages the userto identify site conditions that make MNA an unacceptable option.2. Evaluate whether SVE technologies are suitable for the site: This step is similarto a conventional remediation technology screening process and helps evaluatewhether site conditions or technology limitations preclude the use of SVE.3. Determine whether passive SVE technologies can adequately addressenhancement drivers: This step directs users to pilot study data collection andanalysis methods that could be used to assess PSVE suitability at the site.4. Identify which passive SVE technology is more suitable for the site - barometricpumping or assisted PSVE: This step helps narrow down the choice of PSVEtechnologies based on operational differences between the two technologies.5. Add selected PSVE technology to remedial configuration and continue evaluatingother technologies until all enhancement drivers are eliminated: This step allowsthe user to continue evaluating other technologies that could accelerate remedialprogress at the site.The following sections describe the PSVE decision process in more details.35 Enhanced Attenuation Technologies<strong>Passive</strong> <strong>Soil</strong> <strong>Vapor</strong> <strong>Extraction</strong>
SRNL-STI-2009-00571Rev. 1Figure 5.2: Decision Flow Chart for Selection of a PSVE Strategy at a Typical Chlorinated Solvent Site.36 Enhanced Attenuation Technologies<strong>Passive</strong> <strong>Soil</strong> <strong>Vapor</strong> <strong>Extraction</strong>
SRNL-STI-2009-00571Rev. 15.1.2.1 Identify Site Conditions that Drive the Need for an Enhancement OptionThere are five site conditions that are necessary for the selection of MNA at a site.Failure to demonstrate the presence of any one of these conditions precludes theselection of MNA and necessitates selection and implementation of an enhancementtechnology that can mitigate the failed criteria. The failed criterion thus becomes thedriver for an enhancement option, i.e., the “enhancement driver” for the site. Users of theITRC EA flowchart should have already completed this step before entering the PSVEdecision process. However, for the purposes of continuity, the five questions that helpevaluate the suitability of selecting MNA at a site are:1. Are the current risks acceptable or do current conditions pose an unacceptable riskto a receptor that could be mitigated by implementation of other remediationtechnologies?2. Is the plume stable or shrinking?3. Are conditions sustainable?4. Is the remediation timeframe acceptable?5. Are the cost-benefits acceptable?For more details about how to assess whether MNA is a suitable strategy for a given siteor whether an enhancement option will be necessary to accelerate the remedialprogress at the site, refer to the Enhanced Attenuation: Chlorinated Organics ITRCGuidance Document (ITRC, 2008).5.1.2.2 Evaluate Whether SVE Technologies are Suitable for the Site (PreliminaryScreening Stage)For sites where MNA is found to be inadequate, SVE technologies, active or passive,can be an effective means of addressing many of the critical conditions that initiallyprecluded the selection of MNA. However, certain site conditions and technologylimitations may preclude the selection of SVE and must be evaluated.i. Can SVE Technologies Eliminate One or More Drivers for an EnhancementOption?This decision point in the flowchart requires ayes/no response based on existing knowledgeof site lithology and hydrogeology,observations made during sitereconnaissance surveys and knowledge of thetechnological strengths and limitations of SVEremedies. This stage is similar to aconventional remedy screening process.37 Enhanced Attenuation Technologies<strong>Passive</strong> <strong>Soil</strong> <strong>Vapor</strong> <strong>Extraction</strong>
SRNL-STI-2009-00571Rev. 1Table 5.1 provides examples of enhancement drivers that can and cannot be addressedby SVE. Typical site-specific parameters necessary to aid the decision process includeradial air permeability of the target zone, contaminant properties, depth to groundwaterand the depth and areal extent of the contamination. If the necessary informationregarding these parameters is not available or if the available information suggests thatthe site-specific conditions are not amenable to remediation by an soil vapor extraction,then the flow chart recommends evaluating technologies other than SVE. For sites withexisting ASVE operations, most of this information should already be available. Refer tosection 3.2 to determine whether site conditions that preclude selection of an SVEtechnology exist.Following this evaluation, a decision-maker might determine that SVE technologies canbe employed to eliminate all enhancement drivers at the site. If so, continuing the PSVEdecision process would allow for selection of appropriate SVE technologies that wouldmeet all MNA requirements. For sites where SVE is not sufficient to address all of theenhancement options, the flowchart directs the user towards other technologies that canbe used in combination with the selected SVE technology to achieve required goals.However, if it is determined that SVE cannot mitigate any of the current site conditionsthat preclude an MNA application, then the flowchart recommends that for sites withactive SVE operations, the site manager should immediately implement contingencyremedial actions until more appropriate technologies can be identified.38 Enhanced Attenuation Technologies<strong>Passive</strong> <strong>Soil</strong> <strong>Vapor</strong> <strong>Extraction</strong>
SRNL-STI-2009-00571Rev. 1Table 5.1: Potential Benefits or Limitations of Implementing an SVE Strategy based on Site-Specific Drivers for an EnhancedAttenuation Strategy.ScenariosPotentialEnhancementDriversPotential impact of an SVE StrategyPotential Effect on PotentialEnhancement Drivers1. VOCs are present in the unsaturatedzone. Either natural or manmade (cap)present above contaminated zone acts asbarrier to upward migration of volatiles.Unacceptable risk toreceptor.Growing plume.Reduces contaminant mass in theunsaturated zone, thereby reducing themass flux from the source zone.May result in sufficient rates of attenuationto counterbalance the loading ofcontaminants, thus stabilizing andshrinking the plume. With plumeshrinkage, receptors of concern may nolonger be impacted.2. VOCs are present in the unsaturatedzone. No barrier is present to eliminateupward migration of volatiles, resulting invapor intrusion issues.Unacceptable risk toreceptor.Creative placement of wells (possiblyhorizontal wells underneath structure(s))will induce vapor transport towards ventwells.Alternative pathway for VOC removal willminimize, if not negate, risk to receptors.3. VOCs are present in saturated zone only. All drivers. SVE, active or passive, cannot influencedissolved source mass or DNAPLNo impact.4. VOCs are present in both unsaturatedand saturated zones. Natural electrondonor supply inadequate for long-termsustainability of biodegradation. Plumepresently stable or shrinking.SustainabilityReduce the contaminant mass in theunsaturated zone. This will decrease futureelectron donor demand in the saturatedzone.The decrease in electron donor demandmay be sufficient to enable thebiodegradation mechanisms to sustain thedegradation of the contaminants untilremedial goals are reached.5. If not addressed, the residual VOCs in theunsaturated zone will result in acontaminant plume that will remain aboveMCLs for a timeframe deemed unsuitableby the responsible parties.Remediationtimeframe isunacceptable.Reduces loading to the saturated zone.Little impact to leading edge of plume.Impact is to the trailing edge of plume.Decrease life of plume. May be sufficientto be considered an acceptabletimeframe.39 Enhanced Attenuation Technologies<strong>Passive</strong> <strong>Soil</strong> <strong>Vapor</strong> <strong>Extraction</strong>
SRNL-STI-2009-00571Rev. 15.1.2.3 Determine Whether <strong>Passive</strong> SVE Technologies can Address EnhancementDrivers AdequatelyThe following decision points in the flow chart help identify whether a passive SVEtechnology could meet remediation criteria within an acceptable timeframe. Thefollowing data from pilot SVE tests will help to accurately answer these questions:• Residual mass in the source zone (obtained from rebound tests)• Contaminant mass transfer rates (obtained from rebound tests)• Depth-discrete VOC concentration data• VOC concentration trends over time (obtained from periodic monitoring duringconstant-rate vacuum tests)• Zone of capture or radius of influence for individual extraction wells (obtainedfrom constant rate vacuum tests)• Preliminary estimates of the remediation timeframe (obtained from constant ratevacuum tests)For sites with existing SVE operations, most of this data should already be available. Formore details about performing pilot studies, refer to the USACE SVE design guidelines(2002).i. Can PSVE Achieve Mass Flux Goals?This decision point requires a yes/noresponse based on a comparison of thetarget mass flux goal that is protective ofthe groundwater and the actual mass fluxachievable by a PSVE technology at thesite (predicted based on pilot studies).Site Example 2 (grey box) provides onemethod that was used at the MAPSL siteto estimate the target mass flux goals. Appendix A provides rules of thumb (ROT) forpredicting the mass flux achievable at a site based on measured soil gascontaminant concentration and estimated values for vertical and radial permeabilityfor the site.ii. Will the Extracted <strong>Vapor</strong> Require Treatment Prior to Discharge to the Atmosphere?Ex-situ treatment of off-gases can be an energy-intensive process that may offsetany cost-benefits derived from implementing a passive remediationtechnology. There will be cases where vapor treatment via granular activated40 Enhanced Attenuation Technologies<strong>Passive</strong> <strong>Soil</strong> <strong>Vapor</strong> <strong>Extraction</strong>
SRNL-STI-2009-00571Rev. 1carbon (GAC) canisters may be installed cheaply. For the remaining sites, ASVEmay be more appropriate. However, once off-gas concentrations decrease toacceptable levels, PSVEs might offer more advantages as a polishingtechnology.This decision point requires a yes/no response based on the comparison ofactual and predicted mass removal rates to Applicable or Relevant andAppropriate Requirements (ARARs).If the response to both the decision points is “No”, then PSVE might be a suitable optionfor the site. However, if the response to either question is “Yes”, PSVEs may not besuitable for the site. The user should instead consider ASVEs as an option to accelerateremediation. If ASVEs are already operating at the site, the user might considercontinuing the ASVE program or identifying other alternatives that might help achieveMNA requirements in a more timely and cost-effective manner. For users interested inidentifying alternatives, the flowchart directs users to Section iii of the EA flowchart. Thisgives the user an opportunity to re-evaluate other methods of mitigating the failed criteriafor MNA.5.1.2.4 Identify Which <strong>Passive</strong> SVE Technology is More Suitable for the Site -Barometric Pumping or Assisted PSVEAt this stage in the flowchart, responses to earlier decision points indicate that PSVEsmight be a suitable addition to the remedial strategy for the site. However, in order toselect the appropriate PSVE technology, it is necessary to evaluate whether targetextraction rates can be met under barometric conditions at the site. Figure 5.3 comparesestimated soil gas flow generated during a barometric application versus that generatedusing a MicroBlower at an SRS site.41 Enhanced Attenuation Technologies<strong>Passive</strong> <strong>Soil</strong> <strong>Vapor</strong> <strong>Extraction</strong>
SRNL-STI-2009-00571Rev. 1Figure 5.3: Comparison of <strong>Soil</strong> Gas Flow generated during a Barometric Application versus thatgenerated using a MicroBlower at SRS, SC.While barometric applications can generate higher instantaneous flows during outflowconditions, the intermittent nature of the application may make selection of barometricpumping unfeasible.i. Is the Average Pressure Differential between Atmospheric and Target SubsurfaceZone Sufficient to Meet Target Mass Flux Goals?This decision point requires a yes/noresponse based on the target mass fluxgoals determined earlier and the averagemass flux that can be achieved usingbarometric pumping. In addition to thedata requirements outlined in the previoussection, the pilot study for evaluation ofbarometric pumping should be designedto collect long-term surface andsubsurface pressure data as wellas barometric soil gas flow rates.Methods for collection of this data are described in Section 2.4. See Appendix Afor predicted values for soil gas flow rate and contaminant mass flux based onthe physical properties of the overlying soil and the affected soil layers.42 Enhanced Attenuation Technologies<strong>Passive</strong> <strong>Soil</strong> <strong>Vapor</strong> <strong>Extraction</strong>
SRNL-STI-2009-00571Rev. 1If the pressure differential at the site issufficient to achieve the target extractionrates (response to question is “Yes”), thenbarometric pumping might be a suitableoption at the site. As with all strategies, longtermperformance monitoring will benecessary to ensure that remedial progressis occurring in a timely and sustainablefashion.If results from performance monitoring indicate poor performance by thebarometric pumping wells, then contingency plans described in the ITRC EACOflowchart will have to be activated to ensure continued remedial progress at thesite.If the pressure differential at the site is notsufficient to produce the desirable massextraction rates (response to question is “No”),then pumping using a MicroBlower might be asuitable option. The selection of an energysource, solar or wind, for the MicroBlower willdepend on site-specific conditions. As describedin Section 4, both solar-powered and windpoweredPSVE systems have been installed atDepartment of Energy facilities with great success.As with the barometric pumping system, it will beimportant to monitor the system over the long-term to ensure that the system isperforming at the levels necessary to meet all MNA or site closure requirementswithin an acceptable timeframe.5.1.2.5 Add Selected PSVE Technology to Remedial Configuration and ContinueEvaluating Other Technologies until All Enhancement Drivers are EliminatedIf PSVE is incapable of eliminating all of the enhancement drivers, then it isimportant to continue evaluating other complementary or compatibletechnologies that could help meet MNA requirements.i. Is the Technology Sufficient to Address All the Enhancement Drivers?This decision point requires a yes/noresponse based on the original list ofenhancement drivers identified for thesite. If the response is a “Yes”, then theflowchart directs the user to approveand implement the selected PSVEtechnology. Following this, theflowchart directs the user to Section ii43 Enhanced Attenuation Technologies<strong>Passive</strong> <strong>Soil</strong> <strong>Vapor</strong> <strong>Extraction</strong>
SRNL-STI-2009-00571Rev. 1of the EA flowchart so that the site conditions can be re-evaluated to check ifthey meet MNA requirements.However, if the response is a “No”, then the flowchart would direct the user backto the EA flowchart where they would then evaluate the new mass balance thatincorporates the contributions of the selected PSVE in order to identify the nextenhancement option for the site.If for some reason, at this stage, implementation of PSVE technologies becomesunlikely either due to concerns raised by the regulatory authority or by otherstakeholders, then the PSVE flowchart would direct the user to Section III of theEA flowchart where they can screen other potential technologies that might beappropriate and acceptable for their site.5.1.3 Flowchart SummaryThe PSVE flowchart provides a process through which decision-makers can determinewhether PSVE systems can help transition a site from an active remedial strategy to anMNA strategy. The decision process is iterative in nature and is intended to be used inconjunction with the EA decision process (ITRC, 2008). Like the EA decision process,the PSVE decision process acknowledges that PSVE is only one of many technologiesthat can be used to eliminate enhancement drivers at the site and encourages decisionmakersto develop a combination of remedial technologies to address site conditionsthat would otherwise preclude the use of MNA at the site.44 Enhanced Attenuation Technologies<strong>Passive</strong> <strong>Soil</strong> <strong>Vapor</strong> <strong>Extraction</strong>
SRNL-STI-2009-00571Rev. 16.0 OCCUPATIONAL SAFETY AND HEALTH6.1 Technology-Specific Health and Safety Risks• There are no technology-specific health and safety risks associated with either theone-way passive valves used for barometric pumping or the blowers used forassisted PSVE applications.• The risk profile for PSVE technologies is generally safer than ASVE due to the low orno energy usage and lower mass flux through the system.6.2 Worker Safety• As is the case with implementation of any remediation technology, the site workersshould be OSHA-certified.• A Health and Safety plan that describes chemical risks associated with working at aparticular site will be necessary.• However, overall, implementation of a PSVE strategy does not pose any additionalrisks to a worker other than the standard risks associated with constructionoperations and those associated with working at a contaminated site.6.3 Community Safety• As long as the discharge of extracted soil vapor meets appropriate regulatory actionlevels and or site specific target levels, implementation of a PSVE strategy shouldnot pose any community safety issues associated with the installation or operation ofeither PSVE technology.45 Enhanced Attenuation Technologies<strong>Passive</strong> <strong>Soil</strong> <strong>Vapor</strong> <strong>Extraction</strong>
SRNL-STI-2009-00571Rev. 17.0 REGULATORY AND POLICY ISSUES7.1 Regulatory ConsiderationsThe decision process for selection of PSVE technology is a novel method that iscurrently gaining acceptance within the regulatory circles. An ITRC survey of regulatorsin 34 states in the contiguous United States indicated that a majority of the respondentssupport the development of technical procedures and decision processes based on anevaluation of contaminant mass balance (ITRC, 2008). Nevertheless, it is crucial thatcommunication with regulators be established early-on and regularly as part of thedecision process when novel technologies such as PSVEs are being considered.• At Federal facilities, a National <strong>Environmental</strong> Policy Act (NEPA) review is required.• Comprehensive <strong>Environmental</strong> Recovery, Compensation, and Liability Act(CERCLA) or Resource Conservation and Recovery Act (RCRA) corrective actionpermitting may be required.7.2 Risks, Benefits, and Community Reaction• There are no unusual or significant safety concerns associated with PSVEimplementations. However, as vapor intrusion becomes more recognized as apotential receptor pathway, the use of this technology may garner some concernfrom communities and this should be considered when developing strategies forcommunicating risk to impacted communities.• Assuming that all ARARs are adhered to during the course of the remediation, noimpacts to receptors are anticipated as a result of implementing a PSVE technology.7.3 <strong>Environmental</strong> Impact• Compared to ASVE technologies, PSVEs may require additional well installation inorder to provide adequate coverage of the source area. Although PSVE wells canoften be installed using direct push technologies which generate very little waste, it ispossible that a greater amount of drill cuttings and drill fluid will be generated as aresult of a passive strategy. However, PSVE operations would result in a reducedcarbon footprint and energy usage as compared to ASVE operations.• Assuming that all ARARs are strictly adhered to during the course of the remediation,impacts to the ambient air should be minimal.• As long as the PSVE meets all performance metrics, no impacts to the nearbysurface water bodies or groundwater is anticipated.46 Enhanced Attenuation Technologies<strong>Passive</strong> <strong>Soil</strong> <strong>Vapor</strong> <strong>Extraction</strong>
SRNL-STI-2009-00571Rev. 17.4 Socioeconomic Impacts and Community Perception• PSVEs have minimal economic or labor force impact• The general public has limited familiarity with the PSVE technology; however, ifremedy selection occurs within the framework of the decision process described inSection 4, selection of PSVEs should not face much resistance.• Communities are generally receptive to technologies that use renewable or naturalenergy to accomplish their task.47 Enhanced Attenuation Technologies<strong>Passive</strong> <strong>Soil</strong> <strong>Vapor</strong> <strong>Extraction</strong>
SRNL-STI-2009-00571Rev. 18.0 COST FOR USE OF PSVE TECHNOLOGIES WITHIN AN EA STRATEGYAs with all technologies, a rational and technically-based cost evaluation requiresquantification of the various drivers and counterbalanced factors to determine therelative merit of each alternative. The factors that influence costs for PSVE relate to thevadose zone, physical and chemical properties, the infrastructure required to achieveremediation goals (i.e., the number, spacing and design of extraction wells), and theprojected costs for operating and maintenance (O&M) and monitoring. Rather thanproviding a traditional detailed cost evaluation in this summary report (see Cummingsand Booth, 1996 for an example), typical site-specific factors that may impact the cost ofimplementing PSVE are presented and discussed. The evaluation is from theperspective of a typical site owner who has an ASVE system in place and plans totransition to a PSVE system. This is expected to be the typical scenario for consideringPSVE within an EA strategy. In this case, the desire will be to use existing ASVE wells.8.1 Cost DriversThe fundamental technical viability of PSVE depends on vadose conditions andinstallation requirements at an appropriate site. For example, a site with a thin vadosezone that does not have lithologic or pressure isolation of the targeted depth interval isnot suited to barometric pumping. When comparing PSVE to alternatives such asASVE, the equipment and O&M costs tend to be significantly lower, but the lower flowrates that are achievable with PSVE may require closer well spacing and a largernumber of wells.The primary considerations in using existing wells include the following:• Well spacing must be sufficient to provide needed PSVE coverage andcontaminant removal rate.• Screened depth intervals must target appropriate zones to maximizeefficiency.If the existing extraction well network is insufficient to adequately meet remedial goalsafter a transition to PSVE, then the capital costs associated with installing additionalextraction wells must be factored into the overall cost evaluation. The costs of drillingnew wells are site-specific, but the most important factor is the depth interval beingtargeted for PSVE. At sites with shallow vadose zones, direct push methods can beused to provide rapid drilling rates and a high degree of flexibility, such that installationcosts may be $1,000 to $2,000 per well or less. At sites with deep vadose zones whererotary drilling or other conventional deep-drilling techniques are required, installation of asingle well could take several days to a week or more. At these sites, installation costscan easily exceed $2,000 per well and may approach up to $10,000 per well atparticularly complex sites. As a consequence, these costs may rule out PSVE if a largenumber of wells must be installed to meet performance objectives (e.g., completecoverage of source area).48 Enhanced Attenuation Technologies<strong>Passive</strong> <strong>Soil</strong> <strong>Vapor</strong> <strong>Extraction</strong>
SRNL-STI-2009-00571Rev. 1The wellhead equipment costs are typically low for PSVE compared to active SVE. Thedevices used for barometric pumping (e.g., Baroball TM ) can generally be purchased orfabricated for less than $50. As an example of the cost of typical equipment for assistedPSVE applications, the 24 V MicroBlower system can be fabricated from materials thatrange between $200 and $300, most of which is related to the blower. While there areother costs associated with these systems, it is clear that for the average site, the costsof the wellhead equipment will be a fraction of the well installations.At sites where assisted PSVE is being considered, one decision is whether to usetraditional power sources or renewable sources to power the small vacuum blowers thatare part of these systems. Renewable or “green” technologies, such as wind or solarpower, can be supplemented with external power sources or batteries to provide backuppower when necessary. Factors affecting costs include:• Availability of existing traditional power sources. Sites that are located farfrom existing power grids may be able to tap renewable power sources morecost-effectively than other alternatives (e.g., generators).• Credits for use of green technologies and/or carbon abatement. These canbe in the form of direct subsidies or incentives for using renewable powersources, or as a cost savings accrued by preventing greenhouse gas emissions(e.g., emissions credits, offsets, carbon tax avoidance).• Reliability of green technologies to maintain performance of the treatmentsystem. At some sites, the use of wind or solar may be impractical. An extremeexample would in areas, where there is minimal sunlight for extended periods inthe winter, meaning that the cost-effectiveness of a solar-powered system wouldbe negated by the need for extensive backup power supply. Similarly, siterestrictions related to the height of structures may preclude the use of windpower as even small wind turbines installed on towers typically must be at least30 ft higher than surrounding structures.Green sources have little or no power costs associated with their use, assuming thatthey are installed with no traditional power backup. However, there are costs associatedwith the installation, operation, maintenance, and replacement of these assisted PSVEsystems. The capital costs typically range from $4 to $7 per watt for a single solar panelof approximately 150 to 200 W (max power) and energy storage system (batteries) thatare sufficient to operate a small vacuum blower. Capital costs for a wind-power assistedPSVE system include $3,000 to $20,000 for a single wind turbine (1 kW to 5 kW) thatcan typically run a full suite of small vacuum blowers at site, and energy storage system(batteries) to provide backup power ($200 to $300 per well). The exact sizing (and thuscosts) of these units will be dependent on the ratio of time the system is generatingenergy from solar or wind to the time it relies on back-up (battery) power each day.Barometric SVE systems have no power costs and thus represent a potential forsignificant reductions in costs over the lifecycle of a typical project (years to decades).49 Enhanced Attenuation Technologies<strong>Passive</strong> <strong>Soil</strong> <strong>Vapor</strong> <strong>Extraction</strong>
SRNL-STI-2009-00571Rev. 1A summary of potential cost drivers for PSVE systems is presented in Table 8.1. Whenapplicable, these are presented in terms of potential cost outlays or potential costsavings relative to ASVE systems. As such, it is intended to provide guidance forevaluating the merits of switching from an ASVE system to a PSVE system at a givensite.50 Enhanced Attenuation Technologies<strong>Passive</strong> <strong>Soil</strong> <strong>Vapor</strong> <strong>Extraction</strong>
SRNL-STI-2009-00571Rev. 1Table 8.1: Cost Drivers for Comparing Transition to PSVE System from an Existing ASVE SystemCost Driver Description Estimated Cost Range1) Preliminarytechnology and siteassessment2) Above-groundtreatmentrequirements3) Installation of newPSVE wells• Objective is to assess if switch to PSVE will adequately address enhancement drivers• Implement treatability testing and/or pilot testing to the extent necessary• Assessment can include vacuum measurements, mass removal rates, rebound tests• Up to several months of monitoring• Utilize existing ASVE well(s) and install passive device during testing• Concentration of gas from PSVE extraction wells generally should not exceed permissibleair discharge limits• Typical above-ground treatment technologies (catalytic/thermal oxidation and activatedcarbon adsorption) could have high O&M costs. Depending on the loading rate, granularactivated carbon (GAC) may be installed cheaply.• If above-ground treatment is required, then cost may eliminate PSVE as an cost-effectiveoption (particularly at large sites)• Typical option for above-ground treatment for PSVE wells is small activated carbon unit• Additional wells may be required depending on results of preliminary testing• PSVE wells have lower airflow rates and zones of influence, so existing SVE wellconfiguration may be inadequate• PSVE is most effective in vadose zones where presence of isolated intervals contribute tosignificant barometric pressure differentials, but this may make for costly drilling (timeconsuming;direct-push impratical)$2K - $10K per well(capital costs including equipment,labor, and analytical)Costs for Small ASVE sites(10 to 200 scfm):Activated carbon $0.2K to $10Kannually; oxidation $10 to $100KannuallyLarge ASVE sites (>1,000 scfm):Activated carbon > $50K annually;oxidation $100 to $300 K annually(plus capital costs)$1K to $2K per well for shallowsites where direct-push used toinstall wells$2 to $10 K per well for deepersites where conventional drillingused to install wells51 Enhanced Attenuation Technologies<strong>Passive</strong> <strong>Soil</strong> <strong>Vapor</strong> <strong>Extraction</strong>
SRNL-STI-2009-00571Rev. 1Cost Driver Description Estimated Cost Range4) Installation of PSVEdevices• Most existing PSVE devices are simple designs with very low cost• Barometric pumping devices have long lifetimes, with many installations operatingcontinuously without replacement. Baroball TM valves should be checked regularly andchanged as needed to ensure proper operation.• Assisted PSVE devices (e.g., MicroBlower) have lifetimes of up to several years.However, certain components should be changed more frequently: motors (every 6 to 12months) and deep-cycle batteries (as needed).5) O&M • Minimal to no energy costs except for certain MicroBlower applications (battery back-up)• Devices require little maintenance or oversight during operation6) Remedial timeframe • PSVE is unlikely to decrease remedial timeframe relative to ASVE unless a much largernumber of wells are installed (increasing capital costs)• Longer remedial timeframe typically has minimal impact on lifecycle costs because O&Mfor PSVE is low• Protection and/or restoration of resources (e.g., sale of restored property to recoupcleanup expenditures) may influence decisions on accelerating cleanup date7) Sustainability issues • PSVE is low carbon footprint technology due to minimal energy usage, minimalmaintenance, low reliance on fabricated materials and infrastructure, and no requirementfor combustion/conversion of contaminant• Cost for carbon emissions is negligible (best captured by lower O&M expenditures) butmay be significant if regulatory framework and market forces become driversBarometric Pumping: $10 to $50per well (example: Baroball TM ~$13 per well) plus labor (minimal,typically 1-2 days per site)Assisted PSVE: ~ $2 K per wellusing solar-power as primary andbattery as back-up; higher forwind-powered system unless siteis large; plus labor (minimal,typically 1-2 days per site)< $1 K annually per site for routinechecks and maintenanceNegligible, unless restoring use ofresource is driving cleanup dateNegligible under current regulatoryframework52 Enhanced Attenuation Technologies<strong>Passive</strong> <strong>Soil</strong> <strong>Vapor</strong> <strong>Extraction</strong>
SRNL-STI-2009-00571Rev. 1Cost Driver Description Estimated Cost Range8) Other sitecharacteristics• Site Location:• poor performance of wind and solar-powered devices (MicroBlower) if local conditionsare unfavorable• access to centralized power supply may be limited or not cost-effective• infrastructure at site may limit ability to install additional wells (e.g., urban sites,industrialized or active sites)• Existing ASVE system may be difficult or inefficient to convert to PSVE (e.g., intervals thatdo not isolate target depth interval)• Airflow rates: higher rates reduce unit cost ($/lb of contaminant removed) but there is noexternal control (function of formation and climatological properties)• Steady-state concentration of gas from PSVE wells: higher concentrations reduce unitcost ($/lb of contaminant removed) but may necessitate above-ground treatmentVaries depending on sitecharacteristics53 Enhanced Attenuation Technologies<strong>Passive</strong> <strong>Soil</strong> <strong>Vapor</strong> <strong>Extraction</strong>
SRNL-STI-2009-00571Rev. 18.2 Site-Specific ScenariosThe following section presents a series of hypothetical sites with specific characteristicsthat directly influence the cost and viability of switching to PSVE.8.2.1 Scenario 1: PSVE is Cost-Effective at Site with Existing ASVE System and NoRequirement for New WellsSite Information: At this hypothetical site, the performance of the existing ASVE system(in terms of mass removal rate per well) has begun to decline, and extensive pilot-scaletesting ($10,000) has determined that the existing system of 10 extraction wells providesadequate coverage to meet technology requirements and performance objectives for aPSVE system. As such, there are no costs associated with drilling additional wells, andthe primary capital costs are associated with installation of Baroball TM valves at eachwellhead ($500). It is estimated that the entire PSVE system can be installed in a singleday (labor costs of $1,000). The monitoring schedule for the PSVE system is identical tothat for the previous ASVE system, but the primary O&M savings occur as a result ofeliminating power requirements for the ASVE blowers ($2,000 annually) and allcomponents of the granular activated carbon (GAC) treatment system ($3,000 annually),as well as the associated maintenance of these systems ($1,000 annually).Table 8.2: Cost Evaluation for Site-Specific Scenario 1.Key Cost ComponentsPilot test cost $10,000Equipment costs for Baroball TM valvesLabor cost for installationTOTAL COST $11,500Key Savings Components (relative to ASVE)*Power SavingsTreatment SavingsOther O&M savingsTOTAL SAVINGS (excluding costs)TOTAL SAVINGS (including costs)*Discount rate = 3%$500 ($50 per well)$1,000 ($1,000 for 1-day installation period)$2,000 per year$3,000 per year$1,000 per year$6,000 per year$34,000 over 10 year operating periodResults of Cost-Benefit Evaluation: For this type of idealized site, the switch to PSVErepresents a net cost savings within 2 to 3 years and will approach $30,000 to $40,000in cost savings (in net present value) over the course of a ten-year operating period.Based on these projections, the use of small vacuum blowers could also be chosen tocomplement the PSVE system since the potential cost savings from the switch fromASVE still exceeds the typical capital costs associated with assisted PSVE ($2,000 perwell for solar-powered MicroBlowers installed at 10 wells).54 Enhanced Attenuation Technologies<strong>Passive</strong> <strong>Soil</strong> <strong>Vapor</strong> <strong>Extraction</strong>
SRNL-STI-2009-00571Rev. 18.2.2 Scenario 2: PSVE May Not be Cost-Effective at Site Where New Wells areRequiredSite Information: Preliminary pilot-scale testing ($10,000) demonstrated that a portion ofthis federal site was not adequately covered by the 10 wells that make up the existingASVE system. To meet PSVE technology requirements and performance objectives, 5additional wells will be installed that target the same depth intervals as the existing wells.These wells are to be screened in lithologically-isolated intervals that will increase theeffectiveness of PSVE, but because these intervals are relatively deep (40—60 ft bgsand 80—100 ft bgs) and must advance through several difficult intervals, the quote fromthe subcontractor for drilling these wells is $50,000 (including all mobilization andoversight costs). The primary capital costs are associated with installation of Baroball TMvalves at each wellhead ($500), and it is estimated that the entire PSVE system can beinstalled in a single day (labor costs of $1,000). The monitoring schedule for the PSVEsystem is identical to that for the previous ASVE system, and the primary O&M savingsoccur as a result of eliminating power requirements for the ASVE blowers ($2,000annually), all components of the GAC treatment system ($3,000 annually), and theassociated maintenance of these systems ($1,000 annually).Table 8.3: Cost Evaluation for Site-Specific Scenario 2.Key Cost ComponentsPilot test cost $10,000Drilling cost for installing new PSVE wellsEquipment costs for Baroball TM valvesLabor cost for installationTOTAL COST $61,500Key Savings Components (relative to ASVE)*Power SavingsTreatment SavingsOther O&M savingsTOTAL SAVINGS (excluding costs)TOTAL SAVINGS (including costs)*Discount rate = 3%$50,000 ($5,000 per well)$500 ($50 per well)$1,000 ($1,000 for 1-day installation period)$2,000 per year$3,000 per year$1,000 per year$6,000 per year$5,000 over 20 year operating period(break even point occurs after 17 years)Results of Cost-Benefit Evaluation: For this type of idealized site, the switch to PSVE willrepresent a net cost savings only after an extended operating period of 15 to 20 years(based on net present value). Consequently, PSVE may only be cost-effective over areasonable project lifecycle if the number of new PSVE wells can be decreased to 3 orless (e.g., focusing only on a source area) or if greenhouse gas emissions from theASVE system become an important cost driver. Alternatively, it may be that the switchfrom ASVE to a PSVE system does not completely eliminate the need for above-groundtreatment of vapors, such that a small GAC treatment unit may have been required forsome or all of the PSVE wells. This is not an unrealistic scenario when new extractionwells are installed it is possible that initially “high levels” of contaminant mass are55 Enhanced Attenuation Technologies<strong>Passive</strong> <strong>Soil</strong> <strong>Vapor</strong> <strong>Extraction</strong>
SRNL-STI-2009-00571Rev. 1present requiring off-gas treatment. In this case, treatment of PSVE vapors likely wouldhave eliminated PSVE as a cost-effective option for this site.8.2.3 Scenario 3: PSVE is not Cost-Effective Due to Site-Specific IssuesSite Information: At this larger site, the existing ASVE system is no longer performing ina cost-effective manner, and more economical options are being explored. Annual O&Mcosts for the ASVE system, including the air stripper for vapor treatment, are typically$5,000 per year. Limited pilot-scale testing ($3,000) demonstrated that barometricpumping could be an effective mechanism for capturing vapors from the low permeabilityzones in the source area, but that an additional 5 to 10 wells must be installed to provideadequate coverage. A further assessment determined that migration of contaminants togroundwater is no longer occurring in areas down-gradient of the source, such thatASVE wells in these areas (20) will also be converted to PSVE wells (using barometricpumping). The cost associated with drilling these additional wells are projected to be$50,000 due to site constraints, which is difficult for the site manager to justify based onthe large capital expenditure and the disruption to site activities caused by drilling. Theuse of assisted PSVE is proposed because the higher airflows achieved by these lowvacuum devices would be sufficient to minimize the need for additional wells. However,because a large number of the existing wells that would be converted to PSVE wells arelocated in restricted areas with limited access to sunlight (and no wind), these deviceswould need to rely exclusively on battery power.Table 8.4: Cost Evaluation for Site-Specific Scenario 3.Key Cost Components Barometric PSVE Assisted PSVEPilot test cost $3,000 $3,000Drilling cost for installing newPSVE wells$50,000 ($5,000 per well) Not requiredEquipment costs for PSVE valves $500 ($50 per well) $24,000 ($1200 per well forbattery power)Labor cost for installation$1,000 ($1,000 per day for1-day installation period)$3,000 ($1,000 per day for 3-dayinstallation period)O&M costs (batteries) Not required $15,000 per yearTOTAL COST $54,500 $30,000 for first year; $15,000per year in following yearsKey Savings Components (relative to ASVE)*Power Savings $2,000 per year $2,000 per yearTreatment Savings $2,000 per year $2,000 per yearOther O&M savings $1,000 per year $1,000 per yearTOTAL SAVINGS (excludingcosts)TOTAL SAVINGS (includingcosts)*Discount rate = 3%$5,000 per year $5,000 per year< $1,000 over 20 yearoperating period, break evenpoint occurs after 19 yearoperating period)< $0 over any proposedoperating period56 Enhanced Attenuation Technologies<strong>Passive</strong> <strong>Soil</strong> <strong>Vapor</strong> <strong>Extraction</strong>
SRNL-STI-2009-00571Rev. 1Results of Cost-Benefit Evaluation: The cost associated with regular change-out ofbatteries ($500 to $1,000 per well per year), as well as the capital costs associated withthe initial installation of the systems ($1,000 to $1,500 per well for 20 wells), precludedtheir use, and as a consequence, assisted PSVE was eliminated as an option.57 Enhanced Attenuation Technologies<strong>Passive</strong> <strong>Soil</strong> <strong>Vapor</strong> <strong>Extraction</strong>
SRNL-STI-2009-00571Rev. 19.0 REFERENCESChristensen, A.G., Nielsen, H.H. and E.V. Fischer. 2003. <strong>Passive</strong> Ventilation of PCE inUnsaturated Zone. Technical Project Report No. 805 2003. Prepared as part of theMiljøstyrelsens (Danish EPA) Technology Demonstration Program.http://www2.mst.dk/Udgiv/publikationer/2003/87-7972-610-0/pdf/87-7972-611-9.pdfESTCP (<strong>Environmental</strong> Security Technology Certification Program), 2006. Design Document for<strong>Passive</strong> Bioventing. Prepared under the ESTCP Program at Department of Defense (DoD),Arlington, Virginia. ESTCP-9715. March 2006.ITRC (The Interstate Technology & Regulatory Council). 2008. Enhanced Attenuation:Chlorinated Organics. Technical and Regulatory Guidance prepared by EACO-1, EnhancedAttenuation: Chlorinated Organics Team. Washington, D.C. April 2008.http://www.itrcweb.org/Documents/EACO-1.pdfITSER (Innovative Technology Summary Report). 2000. Barometrically Enhanced RemediationTechnology (BERT TM ). Prepared for Office of Science and Technology, US Department ofEnergy (DOE). DOE/EM-0516. March 2000.McGuire, T.M., Newell, C.J., Looney, B.B., Vangelas, K.M., and C.H. Sink. 2004. Historicalanalysis of monitored natural attenuation: A survey of 191 chlorinated solvent sites and 45solvent plumes. Remediation, Winter 2004, Pg 99-112McGuire, T. M., McDade, J.M., and C.J. Newell. 2005. Performance of DNAPL SourceDepletion Technologies at 59 Chlorinated Solvent-Impacted Sites. Groundwater Monitoring andRemediation, Vol. 26, No. 1, Pg 73 – 84.Neeper, D. A. 2002. Investigation of the Vadose Zone using Barometric Pressure Cycles. Journalof Contaminant Hydrology, No. 54, Pg 59-80.O’Brian, 2001 <strong>Passive</strong> soil vapor extraction: a low cost complement to conventional activeextractionmethod. Technology Highlight Archive. As referenced in Jennings, A. and P. Patil.2002. Feasibility Modeling of <strong>Passive</strong> <strong>Soil</strong> <strong>Vapor</strong> <strong>Extraction</strong>. Journal of <strong>Environmental</strong>Engineering and Science. Vol. 1, Pg 157-172.Riha, B. D. and J. Rossabi. 1997. Miscellaneous Chemical Basin Treatability Study: An Analysisof <strong>Passive</strong> <strong>Soil</strong> <strong>Vapor</strong> <strong>Extraction</strong> Wells (PSVE). Washington Savannah River Company. WSRC-TR-97-00405. December 1997.Riha, B. D., Rossabi, J., and W. K. Hyde. 1999. Metallurgical Laboratory (MetLab) TreatabilityStudy: An Analysis of <strong>Passive</strong> <strong>Soil</strong> <strong>Vapor</strong> <strong>Extraction</strong> Wells (PSVE) FY 1999 Update. WashingtonSavannah River Company. WSRC-TR-99-00378. October 1999.Riha, B. D, Jackson, D. G., Hyde, W. K., Looney, B. B. and J. Rossabi. 2001. Vadose ZoneRemediation Assessment: M-Area Process Sewer <strong>Soil</strong> <strong>Vapor</strong> <strong>Extraction</strong> Units 782-5M, 782-7Mand 782-8M. Washington Savannah River Company. WSRC-TR-2001-00077. February 2001.Riha, B. D. 2005a. Vadose Zone VOC Mass Transfer Testing at the SRS MiscellaneousChemical Basin. Washington Savannah River Company. WSRC-TR-2005-00266. October 2005.58 Enhanced Attenuation Technologies<strong>Passive</strong> <strong>Soil</strong> <strong>Vapor</strong> <strong>Extraction</strong>
SRNL-STI-2009-00571Rev. 1Riha, B. D. 2005b. <strong>Passive</strong> <strong>Soil</strong> <strong>Vapor</strong> <strong>Extraction</strong> (PSVE) for VOC Remediation at theMetallurgical Laboratory (MetLab), June 2005 Progress Report. Washington Savannah RiverCompany. WSRC- TR- 2005-00268. June 2005.Riha, B. D. 2005c. Performance Testing of <strong>Passive</strong> <strong>Soil</strong> <strong>Vapor</strong> <strong>Extraction</strong> (PSVE) along the M-Area Abandoned Process Sewer Line (MAPSL). Washington Savannah River Company. WSRC-TR-2004-00143. June 2005.Rohay, V.J., Rossabi, J., Looney, B., Cameron, R., and B. Peters. 1993. Well Venting andApplication of <strong>Passive</strong> <strong>Soil</strong> <strong>Vapor</strong> <strong>Extraction</strong> at Hanford and Savannah River. WestinghouseHanford Company. WHC-SA-2064-FP. September 1993.Rohay, V.J., Cameron, R. J., Peters, B. B., Rossabi, J., Riha, B., and W. Downs. 1997. <strong>Passive</strong><strong>Soil</strong> <strong>Vapor</strong> <strong>Extraction</strong>. Prepared for the Office of <strong>Environmental</strong> Restoration, US Department ofEnergy (DOE). BHI-01089. August 1997.Rossabi, J. 1999. The Influence of Atmospheric Pressure Variations on Subsurface <strong>Soil</strong> Gas andthe Implications for <strong>Environmental</strong> Characterization and Remediation, Ph.D. Dissertation,Clemson University, Alabama.Rossabi J., and R. W. Falta. 2002. Analytical Solutions for Subsurface Gas Flow to a WellInduced by Surface Pressure Fluctuations. Groundwater, Vol. 40, No. 1, Pg 67 - 75.Riha, B.D. and T. Whiteside. 2008. Transition from Active to Enhanced Attenuation (EA) using<strong>Passive</strong> <strong>Soil</strong> <strong>Vapor</strong> <strong>Extraction</strong>. Proceedings of the Sixth International Conference on Remediationof Chlorinated and Recalcitrant Compounds, Monterey, California. May 19-22, 2008.USACE. 2002. Engineering and Design - <strong>Soil</strong> <strong>Vapor</strong> <strong>Extraction</strong> and Bioventing. Prepared by USArmy Corp of Engineers. EM 1110-1-4001. Available athttp://140.194.76.129/publications/eng-manuals/em1110-1-4001/toc.htm59 Enhanced Attenuation Technologies<strong>Passive</strong> <strong>Soil</strong> <strong>Vapor</strong> <strong>Extraction</strong>
SRNL-STI-2009-00571Rev. 1APPENDIX A:PREDICTING MASS FLUX FOR A BAROMETRIC PUMPING APPLICATION BASEDON SITE SPECIFIC PARAMETERSIn the absence of long-term pressure data, Rossabi and Falta (2002) provide a simpleanalytical solution for predicting soil gas flow rates based on the atmospheric pressure,depth of the target zone and the vertical permeability of the overlying strata. Undertypical conditions, data from a short-term pilot study (~ 2 weeks) should be sufficient tocalibrate the model. Once calibrated, future soil gas flow rates from the extraction wellscan be predicted based on pressure data from local meteorological stations. UsingFigures A.1 and A.2, a user can predict typical values for soil gas flow rates based onestimated or known radial permeability of the target soil layer and vertical permeability ofsoils overlying the impacted soils. Figure A.3 allow a user to make preliminary estimatesof the contaminant mass flux based on measured soil gas VOC concentrations andpredicted soil gas flow rates.10z = 10 ftz = 50 ftz = 100 ftdPz/dPmax1clayey fine mediumcoarse0.1sands sands sandssands0.1 1 10 100 1000 10000Vertical Permeability K z_air (millidarcy)Figure A.1: Predicted values for differential pressure between the atmosphere and the screenedinterval as a function of the height and average permeability of the soil column overlying the screenedinterval. Values calculated using equations presented in ESTCP, 2006.A.1 Enhanced Attenuation Technologies<strong>Passive</strong> <strong>Soil</strong> <strong>Vapor</strong> <strong>Extraction</strong>
SRNL-STI-2009-00571Rev. 1<strong>Soil</strong> Gas Flow Rate (cfm)1010.1dPz = 0.01 psidPz = 0.1 psidPz = 1 psi0.01mediumsands10 100 1000 10000Radial Permeability, K V _air (milldarcy)coarsesandsFigure A.2: Predicted value for soil gas flow rates as a function of the differential pressure between theatmosphere and the screened interval and the permeability of the screened interval. Values calculatedusing equations presented in Appendix A.2 of ESTCP, 2006 and the following assumed parametricvalues: well diameter = 2 inches, screen length = 10 ft)1000<strong>Soil</strong> Gas Flow Rate (cfm)1001010.1W = 100 g/dayW = 10 g/dayW = 1 g/day0.011 10 100 1000VOC Concentration (ppmV)Figure A.3: Contaminant mass flux (W) as a function of the VOC concentration and actual or estimatedsoil gas flow rates for a PSVE well. PCE; Chlorobenzene; Vinyl Chloride.A.2 Enhanced Attenuation Technologies<strong>Passive</strong> <strong>Soil</strong> <strong>Vapor</strong> <strong>Extraction</strong>
APPENDIX B:TECHNOLOGY DEMONSTRATIONDESIGN, IMPLEMENTATION AND RESULTSSRNL-STI-2009-00571Rev. 1This section presents additional detail and references for the case studies presented inSection 5.B.1 Metallurgical Laboratory (MetLab)Information for the site was drawn primarily from the contract report WSRC-TR-2005-00268, entitled <strong>Passive</strong> <strong>Soil</strong> <strong>Vapor</strong> <strong>Extraction</strong> (PSVE) for VOC Remediation at theMetallurgical Laboratory (MetLab) June 2005 Progress Report. The report is publiclyavailableand can be downloaded at http://www.durhamgeo.com/pdf/Rempdf/Other/WSRC-TR-2005-00268%20MetLab.pdf.Additional information was obtainedfrom the authors of the report.B.1.1 Site Description• Location: The Metallurgical Laboratory (MetLab) waste unit is located at theSavannah River Site (SRS), within the A/M areas.• Site History: PCE and TCE were the primary solvents used at the site. Historicreleases created vadose zone soil impacts and a soil gas plume.• Site Hydrogeology: The Metlab unit is underlain by unconsolidated sedimentsconsisting of sands, clayey sands, and sandy clays, as is the entire SRS. Thefine-grained intervals of primary interest are between 0 to 15 ft and approximately60 and 80 ft below ground surface (bgs). The water table is encountered atapproximately 140 ft bgs.• Pre-Test Conditions: Characterization studies included extensive soil and soilgas sampling that confirmed the presence of a source at the south side ofBuilding 717-A. <strong>Soil</strong> gas concentrations ranged up to 88.4 ppmv TCE and 121.6ppmv PCE in this area, with evidence of migration of the gas plume to the northand east.B.1 Enhanced Attenuation Technologies<strong>Passive</strong> <strong>Soil</strong> <strong>Vapor</strong> <strong>Extraction</strong>
SRNL-STI-2009-00571Rev. 1905-53A711-A729-A734-AMLBB-004717-12AMLBB-013MLBB-020MLBB-003MLBB-014717-A717-7AMLBB-021MLBB-001MLBB-006723-7AMLBB-002MLBB-015MLBB-008 MLBB-010 MLBB-012MLBB-011MLBB-009717-3AMLBB-007MLBB-016MLBB-019712-AMLBB-022722-2A723-13AMLBB-023722-A722-4AMLBB-017723-A722-1A722-8AMLBB-018PSVE WellsCPTcharacterization pushNot a wellFigure B.1.1: PSVE System Layout for Metlab Site.B.1.2 PSVE System Description• System Layout: Nineteen vadose zone wells were installed across the sourcearea of the Metlab in 1996 using direct push in combination with CPT (FigureB.1.1).• Screened Interval: PSVE wells were screened continuously from 20 to 80 ftbgs.• System Design: BaroBall TM devices were installed on the upper end of eachwell casing to permit passive soil vapor extraction via natural barometric pressurechanges.• Monitoring Period: Monitoring of well vapor concentrations (PCE and TCE)began in June 1998 and has continued to date.B.1.3 Results/Performance MetricsPerformance data for the Metlab is available through June 2005 (Riha, 2005c). Itincludes temporal concentration trends, mass removal rates, plume size, and cumulativemass removal, as summarized in Table B.1.B.2 Enhanced Attenuation Technologies<strong>Passive</strong> <strong>Soil</strong> <strong>Vapor</strong> <strong>Extraction</strong>
SRNL-STI-2009-00571Rev. 17010060TCE90PCE80PSVE Well Concentration, ppmv50403020MLBB-001 ppmv = 28.72e -0.00152tR 2 =0.76MLBB-008 ppmv = 62.85e -0.001504tR 2 =0.96MLBB-010 ppmv = 44.05e -0.00119tR 2 =0.81PSVE Well Concentration, ppmv7060504030MLBB-001 ppmv = 45.78e -0.00197tR 2 =0.91MLBB-008 ppmv = 72.08e -0.00169tR 2 =0.94MLBB-010 ppmv = 50.92e -0.00114tR 2 =0.7320101000Jan-1999 Jan-2000 Jan-2001 Jan-2002 Jan-2003 Jan-2004 Jan-2005Jan-1999 Jan-2000 Jan-2001 Jan-2002 Jan-2003 Jan-2004 Jan-2005Figure B.1.2: <strong>Vapor</strong>-Phase Concentration Trends at Metlab Site during PSVE System Operation.Concentration Trends:• <strong>Soil</strong> gas PCE and TCE in wellhead samples exhibited decreasing concentrationtrends in all wells. The PSVE system resulted in order of magnitude or greaterconcentration reduction in the majority of wells, with levels near or below 1 ppmvby June 2005 (Figure B.1.2). During the monitoring period, the average PCEgas-phase concentration decreased from 18.0 to 0.8 ppmv and the average TCEgas-phase concentration decreased from 15.4 to 0.7 ppmv.• The trend was exponential as was expected based on a conceptual model ofmass transfer from the liquid phase in the fine-grained soils to the gas phase ofthe coarse-grained soils.• Strong correlations were obtained when the data were exponentially fitted, withdecay coefficients ranging from 0.0006 to 0.0020 yr -1 for PCE and 0.0004 to0.0016 yr -1 for TCE. In effect, these decay coefficients serve as mass removalrates and can be used to estimate future mass removal by PSVE.Plume Size:• Both the PCE and TCE plumes shrank considerably during the PSVE operation,receding towards the source area at the south side of Building 717-A, confirmingthat mass removal by the PSVE controlled plume migration at the Metlab.• The area where soil gas concentrations exceed 1 ppmv decreased at least 50%relative to initial conditions.B.3 Enhanced Attenuation Technologies<strong>Passive</strong> <strong>Soil</strong> <strong>Vapor</strong> <strong>Extraction</strong>
SRNL-STI-2009-00571Rev. 1Cumulative Mass Removal:• The nineteen PSVE wells with Baroball TM devices removed between 0.66 and24.99 lb of PCE and between 0.19 and 19.29 lb of TCE in the period betweenJune 1998 and June 2005. Wells with low cumulative mass removals initially hadlow gas-phase concentrations.• In total, these wells removed 163.51 lb of PCE and 104.77 lb of TCE during thisseven-year period. In all cases, mass removals were estimated using the gasphase concentrations along with the average flow rate from the PSVE wells(approximately 1 cfm).Table B.1: Summary of Relevant Data for MetLab SiteSite NameMetLabLocationSavannah River Site, Aiken, SCType of Device UtilizedBaroball TMNo. of Wells 19No. of Wells per acre6 (estimated)Zone of Capture25 ft (assumed based on well spacing)Screened Interval60 ft (from 20 to 80 ft bgs)Average Flow Rate1 cfmPore Volumes Removed During Operating Not reportedPeriodStarting <strong>Vapor</strong>-Phase Concentration 18.0 ppmv PCE15.4 ppmv TCE(Average of 19 wells)Ending <strong>Vapor</strong>-Phase Concentration0.8 ppmv PCE0.7 ppmv TCE(Average of 19 wells after 7 years of operation)Mass Transfer/Removal Rate (per well) 0.0006 to 0.0020 yr -1 PCE0.0004 to 0.0016 yr -1 TCEMass Removed (per well)0.66 to 24.99 lb of PCE;0.19 to 19.29 lb of TCEMass Removed (cumulative)163.51 lb of PCE;104.77 lb of TCECostNot reportedB.4 Enhanced Attenuation Technologies<strong>Passive</strong> <strong>Soil</strong> <strong>Vapor</strong> <strong>Extraction</strong>
SRNL-STI-2009-00571Rev. 1B.2 Miscellaneous Chemical Basin (MCB)Information for the site was drawn primarily from the contract report WSRC-TR-97-00405, entitled Miscellaneous Chemical Basin Treatability Study: An Analysis of <strong>Passive</strong><strong>Soil</strong> <strong>Vapor</strong> <strong>Extraction</strong> Wells (PSVE). The report is publicly-available and can bedownloaded at http://www.osti.gov/bridge/servlets/purl/574514-ehlVmz/webviewable/.Additional information was obtained from the authors of the report.B.2.1 Site Description• Location: The Miscellaneous Chemical Basin (MCB) waste unit is located at theSavannah River Site (SRS), in the northwest portion of the site.• Site History: Limited information is available concerning historic releases withinthe MCB, but it is thought that the basin received mixed solvent waste, used oil,and partially full drums until 1974. Afterward, sediments from the basin areawere spread across an area approximately 350 ft by 350 ft. These historicreleases created vadose zone soil impacts and a soil gas plume. The center ofthe plume does not correspond to the location of the former basin due toregrading.• Site Hydrogeology: The fine-grained soil intervals of interest are approximately0 to 15 ft and 75 to 85 ft bgs. The water table is encountered at approximately120 ft bgs.• Pre-Test Conditions: Characterization studies (conducted primarily in 1986 and1996) included extensive soil and soil gas sampling that established the highestconcentrations around CPT-MCB-4 in the 15 to 20 ft depth interval. <strong>Soil</strong> gasconcentrations ranged up to 99.5 ppmv PCE and 140 ppmv TCE (in addition tolower concentrations of several other constituents), with evidence of gas plumemigration to the southeast. The highest soil concentrations were detected in thevicinity of CPT-MCB-4 and CPT-MCB-S2 and elevated soil concentrationscontinued to depths of approximately 225 ft, suggesting the release of a sourcethat had migrated into and through two fine-grained units in the vadose zone.B.2.2 PSVE System Description• System Layout: Twenty-five vadose zone wells were installed across thesource area of the MCB in 1996 in boreholes where CPT had been completed(Figure B.2.1).• Screened Intervals: All wells extended to within 10 ft of the water table andwere screened across the sections of the unsaturated zone described above.B.5 Enhanced Attenuation Technologies<strong>Passive</strong> <strong>Soil</strong> <strong>Vapor</strong> <strong>Extraction</strong>
SRNL-STI-2009-00571Rev. 1• System Design: Baroball TM devices were installed on the upper end of eachwell. The devices permit passive soil vapor extraction via natural barometricpressure changes.• Monitoring Period: Monitoring of well vapor concentrations (PCE and TCE)began in April 1996 as part of a treatability study that extended for a period ofapproximately 1 year. Based on the success of this initial study, the system wasleft in place and continues to operate to this date. An active soil vapor extractionsystem was also initiated in October 2001 and was terminated in December2002.B.2.3 Results/Performance MetricsComprehensive performance data for the MCB is available from the treatability study(WSRC, 1997). It includes temporal concentration trends, mass removal rates, plumesize, cumulative mass removal, and estimation of remediation timeframe, assummarized in Table B.2. It should be noted that the temporary operation of an ASVEsystem at the MCB influenced the performance of the PSVE after this period, such thatsubsequent data would not necessarily reflect long-term performance of a stand-alonePSVE system.Concentration Trends:• <strong>Soil</strong> gas TCE measured directly from wellhead samples exhibited decreasingconcentration trends through the first 13 months of monitoring in all wells. ThePSVE system resulted in concentration reductions of greater than 50% in themajority of wells during this period (Figure B.2.2).• This trend was exponential, as was expected based on a conceptual model ofmass transfer from the liquid phase in the fine-grained soils to the gas phase ofthe coarse-grained soils.• Strong correlations were obtained when the data were exponentially fitted, withdecay coefficients ranging from 0.002 to 0.006 yr -1 for TCE.• Based on these mass removal rates, it was projected that PSVE alone wouldhave reduced TCE concentrations to below 1 ppmv within 3 years in the soil gasplume and within 10 years in source zone wells.Plume Size:• The size of the TCE plume, as well as the TCE concentrations within the plume,decreased significantly during the 13 month PSVE treatability test. For example,the area where soil gas concentrations exceeded 20 ppmv decreased by at least50% relative to initial conditions.• The test demonstrated that PSVE removed sufficient mass to shrink the plume.B.6 Enhanced Attenuation Technologies<strong>Passive</strong> <strong>Soil</strong> <strong>Vapor</strong> <strong>Extraction</strong>
SRNL-STI-2009-00571Rev. 1Cumulative Mass Removal:• The 25 PSVE wells with Baroball TM devices removed more than 100 lb ofchlorinated organics in the period between October 1996 and November 1997based on soil gas concentrations and average flow rates from the PSVE wells (2to 4 cfm).• Using the exponential mass removal rates, it was estimated that approximatelytwice this amount would be removed by PSVE in the subsequent 9 years.• Depth discrete soil samples were collected. <strong>Soil</strong> concentrations indicated areduction of 13% in the TCE mass in the fine-grained sediments of the sourcearea during the initial 13 months of PSVE operation.Remediation Timeframe:• The authors projected that PSVE would achieve its objective (1 ppmv) within 3years in plume wells and within 10 years in source zone wells.• No estimate of the remediation timeframe in the absence of PSVE waspresented.Table B.2: Summary of Relevant Data for MCB SiteSite NameMCBLocationSavannah River Site, Aiken, SCType of Device UtilizedBaroball TMNo. of Wells 25No. of Wells per acre0.9 (estimated)Zone of Capture120 ft (assumed based on well spacing)Screened IntervalSelected intervals from 0 to 110 ft bgsAverage Flow Rate2 to 4 cfmPore Volumes Removed During Operating Not reportedPeriodStarting <strong>Vapor</strong>-Phase Concentration 37 ppmv TCE(Average of 19 selected wells)Ending <strong>Vapor</strong>-Phase Concentration13 ppmv TCE(Average of 19 selected wells after 1.1 yr ofoperation)Mass Transfer/Removal Rate (per well) 0.001 to 0.006 yr -1 TCEMass Removed (per well)Not reportedMass Removed (cumulative) 100 lb of total chlorinated solvents for first 1.1yrCost$354 to $709 per lb removed for first 1.1 yr$213 to $427 per lb removed over 10 yrB.7 Enhanced Attenuation Technologies<strong>Passive</strong> <strong>Soil</strong> <strong>Vapor</strong> <strong>Extraction</strong>
SRNL-STI-2009-00571Rev. 1B.3 M-Area Abandoned Process Sewer Line (MAPSL): BaroBall TMInformation for the site was drawn primarily from the contract report WSRC-TR-2004-00143, entitled Performance Testing of <strong>Passive</strong> <strong>Soil</strong> <strong>Vapor</strong> <strong>Extraction</strong> (PSVE) along theM-Area Abandoned Process Sewer Line (MAPSL). The report is publicly-available.Additional information was obtained from the authors of the report.B.3.1 Site Description• Location: The M-Area Abandoned Process Sewer Line (MAPSL) is located atthe Savannah River Site (SRS). It is approximately 2000 ft long and connects theformer M-Area security fence and the M-Area Settling Basin.• Site History: The original MAPSL was 30-inch diameter vitrified clay tile.Cracks at pipe connections resulted in several point-source releases of CVOCs(primarily PCE and TCE) to the underlying unsaturated zone. A 12inchpolyethylene pipe was installed in the 30-inch clay tile to minimize leakage.Sewer line use ceased in 1985.• Site Hydrogeology: At the MAPSL, the fine-grained soil intervals of primaryinterest are thin clays located approximately 40 ft and 65 ft bgs, and interbeddedsands and clays encountered at 95 ft bgs and extending below the water table,which is approximately 135 ft bgs. In addition, the “upland unit” (a lowpermeability soil mix of sand, silt, and clay) extends to 40 ft bgs in the MAPSLarea.• Pre-Test Conditions: To address vadose zone contamination, three active soilvapor extraction (ASVE) units were installed and operated at the MAPSL startingin 1995. Characterization studies conducted primarily in 2000 established thatthe ASVE systems had effectively cleaned up the central sandy unit but thatcontaminant removal from lower permeability zones was limited. Residual PCE,TCE, and 1,1,1-TCA remained in the fine-grained intervals, including the uplandunit. Of particular concern was the central section of the MAPSL that was part ofSVE unit 782-8M. Additional characterization in 2003 encountered DNAPL intwo borings in the upland unit at depths between 20 and 26 ft bgs.B.3.2 PSVE System Description• System Layout: A total of 8 of the ASVE wells were switched to PSVE in theperiod between November 2001 and April 2003 as a low-energy alternative torecover residual contamination from the fine-grained units of the unsaturatedzone while preventing migration to the groundwater (Figure 5.3.1). Two newPSVE wells were installed in October 2003. The ASVE system was not usedafter 2001. .B.8 Enhanced Attenuation Technologies<strong>Passive</strong> <strong>Soil</strong> <strong>Vapor</strong> <strong>Extraction</strong>
SRNL-STI-2009-00571Rev. 1• Screened Intervals: The eight wells retro-fitted with BaroBall TM devices werescreened continuously from 25 to 110 ft bgs. The two new PSVE wells installedin October 2003 targeted a short soil interval (30 to 40 ft bgs) of permeable soilsto address DNAPL in fine-grained soils located immediately above them.• System Design: Baroball TM devices were installed on the upper end of the wellcasing of the 8 original wells to permit passive soil vapor extraction via naturalbarometric pressure changes. These wells are all located in the upper andcentral sections of the MAPSL. One of these wells (MVE-24) was abandoned inOctober 2003. The two new PSVE wells installed in October 2003 wereequipped with MicroBlower devices (see Section B.4).• Monitoring Period: Monitoring of well vapor concentrations began in November2001 for the wells equipped with Baroball TM devices. The system continues tooperate through the present date. Three additional vent wells located in thelower section of the MAPSL were converted to sweep wells to increasesubsurface flow towards the vapor extraction wells. (Sweep well use wasdiscontinued in 2003 in preparation for steam stripping remediation planned nearthe M-Area Settling Basin).B.9 Enhanced Attenuation Technologies<strong>Passive</strong> <strong>Soil</strong> <strong>Vapor</strong> <strong>Extraction</strong>
SRNL-STI-2009-00571Rev. 1103800RWM-4103700MVE-5103600103500Horizontal <strong>Extraction</strong> WellOld Manholes and Sewer<strong>Extraction</strong> WellsMonitoring LocationsAverage Zone of CaptureMaximum Zone of CaptureGroundwater Recovery WellsMVC 4MVE-8103400103300MVC 5MVE-6Upper Section (Unit 5M)103200MVE-7SRS Northing, ft103100103000MVE-23MVC 6 MVE-29MVE-24102900102800MHV 4MHV 5MHV 3MHV 1 MHV 2AMH-2MVE-28MHV-7MHV-6MHV-9Central Section (Unit 7M)102700MVE-25102600102500102400RWM-1MVC 7MVE-27 MVE-26MHV 25TUP-2MHV-8Lower Section (Unit 8M)MHV 2910230010220048500 48600 48700 48800 48900 49000 49100SRS Easting, ftFigure B.3.1: PSVE System Layout for MAPSL Site.B.3.3 Results/Performance MetricsPerformance data for the MAPSL is available through early 2005 (WSRC, 2005). Itincludes temporal concentration trends, cumulative mass removal, zone of capture, andmass transfer rates (including relative to diffusion rates) to prevent migration to the watertable, as summarized in Table B.3. Performance for the 2 wells where MicroBlowerswere installed is summarized in Section B.4.B.10 Enhanced Attenuation Technologies<strong>Passive</strong> <strong>Soil</strong> <strong>Vapor</strong> <strong>Extraction</strong>
SRNL-STI-2009-00571Rev. 1Concentration Trends:• In general, PCE and TCE soil gas concentrations increased until late 2003 andthen declined through the remainder of the monitoring period (Figure B.3.2).• Three theories were postulated for the long-term trends of increasing thendecreasing concentrations: i) subsurface concentration equilibration aftertransition from ASVE to PSVE; ii) increased efficiency of PSVE due to decreasedvertical permeability from rainfall; and iii) increases in measured well vaporconcentration due to contaminated water infiltration into the central sandy zonefrom the upland unit.• Depth discrete gas data from piezometers screened in the fine-grained intervalswas collected during the period when ASVE was halted and following PSVEoperation to monitor rebound effects. The shallowest depths (50 and 75 ft bgs)showed the expected decrease in concentration during ASVE operation and theexpected increase during system shutdown and PSVE. This zone provides along-term contaminant source that was not directly addressed by the ASVE.• The data show that gas concentrations are near or at equilibrium with the sourceareas in the fine-grained zones and that PSVE is decreasing concentrations inthe upper and lower vadose zone, while concentrations in the middle vadosezone are stable.PSVE PCE Concentration, ppmv• In the deep vadose zone (deeper than 100 ft bgs), concentrations are lower thanthe shallow vadose zone, indicating the ASVE was effective in cleaning the lowersection and the PSVE is reducing downward migration of contaminants.12080400MVE-5MVE-6MVE-7MVE-8MVE-23MVE-24Jan-2002 Jan-2003 Jan-2004 Jan-200550403020100PSVE TCE Concentration, ppmvFigure B.3.2: <strong>Vapor</strong>-Phase Concentration Trends at MAPSL Site during PSVE System Operation(6 PSVE Wells with Baroball TM devices).B.11 Enhanced Attenuation Technologies<strong>Passive</strong> <strong>Soil</strong> <strong>Vapor</strong> <strong>Extraction</strong>
SRNL-STI-2009-00571Rev. 1Cumulative Mass Removal:• The seven PSVE wells with BaroBalls removed between 15.2 and 316.7 lb ofPCE and between 3.2 and 17 lb of TCE between November 2001 and April 2005.Five of these wells were operational for the entire period, while two wereoperational only during the final two years.• In total, these wells removed 676.1 lb of PCE and 64.4 lb of TCE.• In all cases, mass removals were estimated using the gas phase concentrationsalong with the average flow rate from each of the PSVE wells (2.6 to 7.5 cfm,with a maximum of 76.2 cfm) using differential pressure data.Zone of Capture:• The zone of capture (ZOC), defined as the radius of the volume of soil gasremoved during a flow event, was 16 to 26 ft for a subset of wells using one yearof flow event data. A second method generated average ZOC values between 9and 39 ft.• Due to the pulsed nature of the flow events, several estimation methods wereused, differing in the period of time over which well flow rates were measured.• The authors stated that the calculated ZOC and flow rates alone were notadequate to define the effectiveness of PSVE, and that consideration should begiven to concentration trends in the vicinity of the well to determine if coverage isadequate.Mass Transfer Rates:• It was determined that 0.053 lb/day of PCE and 0.048 lb/day of TCE were beingreleased from the fine-grained soils, while the PSVE system (i.e., wells withBaroBalls) was removing 0.06 to 0.07 lb/day of PCE and TCE. This masstransfer from fine-grained soils was calculated from data collected during arebound test conducted at a series of wells with depth discrete screens in 2002after ASVE was stopped and as the subsurface contaminant distributionapproached equilibrium prior to the start of the PSVE system.• This demonstrated that PSVE was removing what was being released and thuswas protecting the groundwater.• Further attempts at establishing that mass transfer to the water table was notoccurring used a combination of numerical and analytical modeling to establishthat the pore water velocities generated by PSVE (3.29 x 10 -6 to 5.78 x 10 -4 cm/s)were larger than the downward diffusion rates (1.38 x 10 -8 to 1.82 x 10 -6 cm/s).B.12 Enhanced Attenuation Technologies<strong>Passive</strong> <strong>Soil</strong> <strong>Vapor</strong> <strong>Extraction</strong>
SRNL-STI-2009-00571Rev. 1Table B.3: Summary of Relevant Data for MAPSL Site (Baroball TM PSVE Wells)Site NameMAPSLLocationSavannah River Site, Aiken, SCType of Device UtilizedBaroball TMNo. of Wells 8No. of Wells per acre0.3 (estimated)Zone of Capture16 to 26 ft (using 1 yr of flow event data);9 to 39 ft (using continuous average flow rate)Screened Interval85 ft (25 to 110 ft bgs)Average Flow Rate2.6 to 7.5 cfm(maximum of 76 cfm)Pore Volumes Removed During Not reportedOperating PeriodStarting <strong>Vapor</strong>-PhaseConcentration~ 45 ppmv PCE~ 5 ppmv TCE(Average of 5 wells at peak following switch to PSVEEnding <strong>Vapor</strong>-PhaseConcentrationMass Transfer/Removal Rate(per well)Mass Removed (per well)Mass Removed (cumulative)Costsystem)~15 ppmv PCE< 2 ppmv TCE(Average of 5 wells following 4.5 yr of operation)0.06 to 0.07 lb/day TCE;0.06 to 0.07 lb/day PCE;(Average of 2 wells)15.2 to 316.7 lb of PCE;3.2 to 17.0 lb of TCE676.1 lb of PCE;64.4 lb of TCENot reportedB.4 M-Area Abandoned Process Sewer Line (MAPSL): MicroBlowerMicroBlower operation at the MAPSL site was reported by the project team whichconducted the project (Washington Savannah River Company). Because the report isnot publicly-accessible, additional detail is presented herein.B.4.1 Site and PSVE System Description.• As described in Section B.3, three ASVE units have targeted vadose zonechlorinated solvent contamination along this 1500 ft section of the MAPSL since1995. In 2002, all ASVE operations were shutdown and passive soil vaporextraction began. In 2003, characterization activities indicated that residualcontamination remained in the fine-grained sediments at two locations along theMAPSL. Specifically, DNAPL was found in two borings completed in theshallow, fine-grained sediments (20 to 26 ft bgs) that are part of the upland unit.• In February 2004, MicroBlowers were installed at these two locations (MVE-28and MVE-29, Figure B.3.1) to target small areas of contamination and toB.13 Enhanced Attenuation Technologies<strong>Passive</strong> <strong>Soil</strong> <strong>Vapor</strong> <strong>Extraction</strong>
SRNL-STI-2009-00571Rev. 1minimize contaminant transfer to the groundwater. The original MicroBlowerdesign was a 12 V system powered solely by a solar panel. These systems werecapable of extracting contaminant mass only when the sun was shining, andtherefore operated on a periodic basis. In January 2006, 24 V MicroBlowersystems were installed. These systems are designed to operate 24 hours a dayusing a sustainable 24 V power source (a battery bank charged by solar panels).The two enhanced PSVE wells are screened 30 to 40 ft bgs in relativelypermeable soil that underlie the fine-grained sediments where DNAPL wasfound.B.4.2 Results/Performance MetricsPerformance at the MAPSL site following the installation of the 24 V MicroBlower systemis summarized in Table B.4.Concentration Trends:• The periodically-operating 12 V MicroBlower system did not reduce CVOC vaporconcentrations, but as shown in Figure B.4.1, PCE and TCE vapor-phaseconcentrations decreased rapidly and stabilized at a lower level following theswitch to the continuously-operating 24 V system in January 2006.• <strong>Soil</strong> concentration profiles from sampling events completed in 2003 (prior toMicroBlower installation) and in 2007 (post-installation) are shown in FigureB.4.2. <strong>Soil</strong> concentrations of both PCE and TCE decreased by an order ofmagnitude in the interval immediately above the screened zone of the extractionwell. This interval consists of fine-grained material, as indicated by the higherCPT (cone penetrometer test) friction ratios measured as part of thecharacterization study. Interestingly, the enhanced PSVE system significantlyreduced contaminant levels in the fine-grained interval despite the fact that it hasthe tendency to trap contaminant mass and DNAPL was present.Concentration, ppmv30020010024 V MicroblowerInstallationPCETCE01/1/04 1/1/05 1/1/06 1/1/07 1/1/08 1/1/09Figure B.4.1: <strong>Vapor</strong>-Phase Concentration Trends at MAPSL Site during PSVE System Operation(PSVE Well MVE-29 with MicroBlower).B.14 Enhanced Attenuation Technologies<strong>Passive</strong> <strong>Soil</strong> <strong>Vapor</strong> <strong>Extraction</strong>
SRNL-STI-2009-00571Rev. 1CPT Friction Ratio0 2 4 6 8 10CPT Friction Ratio0 2 4 6 8 100MVE-29FY030MVE-29FY0710PCETCEPCE DNAPL LimitTCE DNAPL LimitMVC-6 Friction Ratio10Depth, ft bgs20Depth, ft bgs203030Screen Zone404010 -2 10 -1 10 0 10 1 10 2 10 3 10 4Concentration, mg/kg10 -2 10 -1 10 0 10 1 10 2 10 3 10 4Concentration, mg/kgFigure B.4.2: <strong>Soil</strong> Concentration Profiles at MAPSL Site during PSVE System Operation.Samples Collected at PSVE Well MVE-29 Before and After Installation of MicroBlower.System Operational Parameters:• MicroBlower operational parameters have been recorded since deployment(Figure B.4.3). Battery voltage shows a diurnal pattern with the daytime voltagesincreasing up to 28 V as a result of solarization and an increase in powerprovided by the solar panel. During night time hours, the battery voltage slowlydecreases, with corresponding decreases observed in the flow rate and vacuum.The MicroBlower is designed to operate 24 hours a day, but on occasion, thesystem will shut down due to prolonged periods of overcast skies. The systemresponse during this type of incident is shown on Figure B.4.3 on May 7, 2007,where voltage decreased sharply and shutdown eventually occurred after 3 daysof cloudy skies. Note that the battery charger for this system has a low voltageshutoff to protect the batteries from excess damaging discharge. During theentire operating period, the average flow rate was approximately 2 scfm, and thevacuum consistently fell between 6 and 8 in. H 2 O.B.15 Enhanced Attenuation Technologies<strong>Passive</strong> <strong>Soil</strong> <strong>Vapor</strong> <strong>Extraction</strong>
SRNL-STI-2009-00571Rev. 130252015Flow rate (acfm)Vaccum (in. H2O)Battery Voltage10504/19/07 4/26/07 5/3/07 5/10/07 5/17/07 5/24/07 5/31/07Figure B.4.2: MicroBlower Operational Parameters at MAPSL Site during PSVE SystemOperation (PSVE Well MVE-29).Cumulative Mass Removal:• Forty-seven pounds of TCE and eighty-two pounds of PCE were recovered fromWell SVE-29 during the period starting January 17, 2006 and ending November6, 2008. The linear profiles of these curves indicate that the MicroBlower systemis treating the DNAPL source zone above the screen. It is anticipated that oncethe DNAPL is depleted, vapor concentrations (Figure B.4.1) will decline, resultingin decreased mass removal rates relative to system startup.100Mass Removed, lbs80604020PCETCE01/1/06 1/1/07 1/1/08 1/1/09Figure B.4.4: Cumulative Mass Removal at MAPSL Site during PSVE System Operation (PSVEWell MVE-29 with MicroBlower).B.16 Enhanced Attenuation Technologies<strong>Passive</strong> <strong>Soil</strong> <strong>Vapor</strong> <strong>Extraction</strong>
SRNL-STI-2009-00571Rev. 1Table B.4: Summary of Relevant Data for MAPSL Site (MicroBlower PSVE Wells)Site NameMAPSLLocationSavannah River Site, Aiken, SCType of Device UtilizedMicroBlowerNo. of Wells 2No. of Wells per acre0.8 (estimated)Zone of CaptureNot ReportedScreened Interval10 ft (30 to 40 ft bgs)Average Flow Rate2 cfm(Data from 1 well)Pore Volumes Removed During Not reportedOperating PeriodStarting <strong>Vapor</strong>-PhaseConcentration250 ppmv PCE300 ppmv TCEEnding <strong>Vapor</strong>-PhaseConcentrationMass Transfer/Removal Rate(per well)Mass Removed (per well)Mass Removed (cumulative)Cost(Data from 1 well)60 ppmv PCE40 ppmv TCE(Data from 1 well)0.12 lb/day PCE;0.07 lb/day TCE;(Data from 1 well)82 lb of PCE;47 lb of TCENot reportedNot reportedB.17 Enhanced Attenuation Technologies<strong>Passive</strong> <strong>Soil</strong> <strong>Vapor</strong> <strong>Extraction</strong>
SRNL-STI-2009-00571Rev. 1B.5 Multiple Demonstration Sites in DenmarkInformation for these sites was drawn primarily from a project report (Nr. 805 2003),entitled Passiv ventilation til fjernelse af PCE fra den umttede zone—Hovedrapport(<strong>Passive</strong> ventilation for remediation of PCE from unsaturated zone). The Danishlanguage report (with an English language executive summary) is publicly-available andcan be downloaded at http://www2.mst.dk/Udgiv/publikationer/2003/87-7972-610-0/pdf/87-7972-611-9.pdf.B.3.1 Site Descriptions and PSVE System Descriptions<strong>Passive</strong> soil vapor extraction was selected for a vadose zone technology demonstrationat a series of sites in Denmark. The project was a cooperative effort between theDanish EPA and the counties of Sotrtrøm, Frederiksborg, and Ribe. The performance at4 of these sites, all former dry-cleaners with PCE and other chlorinated solvents presentin a highly permeable sand interval that underlies a clay cover, was documented after 18to 24 months of operation (Christensen et al., 2003), and a compilation of the results isfound in Table B.4. At all of these sites, the PSVE process utilized a one-way valveconnected to a well screened across the unsaturated zone, followed by an in-linegranular activated carbon unit for treatment of the off-gas prior to venting At one site(Fakse), a solar-powered vacuum pump was installed on one of the wells. The pumpincreased extraction rates approximately 5 times over passive flow rates.B.18 Enhanced Attenuation Technologies<strong>Passive</strong> <strong>Soil</strong> <strong>Vapor</strong> <strong>Extraction</strong>
SRNL-STI-2009-00571Rev. 1Site NamesTable B.4: Summary of Relevant Data for 4 Sites in Denmark(1) Møllevej 12, Askov;(2) Nygade 37, Fakse;(3) Prins Valdemars Alle 14, Allerød;(4) Amtsvej 2-4, AllerødLocationType of Device UtilizedNo. of WellsNo. of Wells per acreZone of CaptureScreened IntervalAverage Flow RatePore Volumes Removed During OperatingPeriodStarting <strong>Vapor</strong>-Phase ConcentrationCounties of Sotrtrøm, Frederiksborg, and Ribein DenmarkOne-way valve for flow control, coupled withgranular activated carbon treatment of offgasesVaries, typically 5 to 6 per siteVaries3 to 13 ft average;10 to 33 ft maximumVaries, but typically across entire unsaturatedinterval to approx. 60 ft bgs0.1 to 0.6 cfm25 to 100 during 2 yr operating period100 to 300 mg/m3 PCE(Average)Ending <strong>Vapor</strong>-Phase Concentration30 to 120 mg/m3 PCE(Average of wells after up to 2 yr of operation)Mass Transfer/Removal Rate (per well) 0.2 to 2.2 lb/yr PCEMass Removed (per well)Not reportedMass Removed (cumulative)4 to 6 lb; 11 lb; 18 lb; 110 to 130 lbCost ~ $35,000 to $45,000 for typical site with 5 to 6wells (converted from Danish Krone; excludingvalue-added tax)B.19 Enhanced Attenuation Technologies<strong>Passive</strong> <strong>Soil</strong> <strong>Vapor</strong> <strong>Extraction</strong>