Environmental Inequalities in Europe - World Health Organization ...
Environmental Inequalities in Europe - World Health Organization ...
Environmental Inequalities in Europe - World Health Organization ...
- No tags were found...

Create successful ePaper yourself
Turn your PDF publications into a flip-book with our unique Google optimized e-Paper software.
The WHO <strong>Europe</strong>an Centre for Environment and <strong>Health</strong>, Bonn Office, WHO Regional Office for<strong>Europe</strong>, coord<strong>in</strong>ated the development of this report.AbstractRecent debate on the social determ<strong>in</strong>ants of health has <strong>in</strong>dicated that the unequal distribution of healthand well-be<strong>in</strong>g <strong>in</strong> national populations is a major challenge for public health governance. This is equallytrue for environmental health conditions and for exposure to environmental risk, which varies strongly bya range of sociodemographic determ<strong>in</strong>ants and thus causes <strong>in</strong>equalities <strong>in</strong> exposure to – and potentially<strong>in</strong> disease result<strong>in</strong>g from – environmental conditions.Interventions tackl<strong>in</strong>g such environmental health <strong>in</strong>equalities need to be based on an assessment of theirmagnitude and on the identification of population groups that are most exposed or most vulnerable toenvironmental risks. However, data to quantify the environmental health <strong>in</strong>equality situation are notabundant, mak<strong>in</strong>g comprehensive assessments difficult at both national and <strong>in</strong>ternational levels.Follow<strong>in</strong>g up on the commitments made by Member States at the Fifth M<strong>in</strong>isterial Conference onEnvironment and <strong>Health</strong> <strong>in</strong> Parma, Italy (2010), the WHO Regional Office for <strong>Europe</strong> has carriedout a basel<strong>in</strong>e assessment of the magnitude of environmental health <strong>in</strong>equality <strong>in</strong> the <strong>Europe</strong>an Regionbased on a core set of 14 <strong>in</strong>equality <strong>in</strong>dicators. The ma<strong>in</strong> f<strong>in</strong>d<strong>in</strong>gs of the assessment report <strong>in</strong>dicate thatsocioeconomic and demographic <strong>in</strong>equalities <strong>in</strong> risk exposure are present <strong>in</strong> all countries and need to betackled throughout the Region. However, the report also demonstrates that each country has a specificportfolio of <strong>in</strong>equalities, document<strong>in</strong>g the need for country-specific <strong>in</strong>equality assessments and tailored<strong>in</strong>terventions on the national priorities.KeywordsENVIRONMENTAL HEALTHENVIRONMENTAL EXPOSUREHEALTH STATUS DISPARITIESSOCIOECONOMIC FACTORSRISK FACTORSRISK ASSESSMENTEVALUATION STUDIESEUROPEISBN 978 92 890 0260 8Address requests about publications of the WHO Regional Office for <strong>Europe</strong> to:PublicationsWHO Regional Office for <strong>Europe</strong>Scherfigsvej 8DK-2100 Copenhagen Ø, DenmarkAlternatively, complete an onl<strong>in</strong>e request form for documentation, health <strong>in</strong>formation, or for permission to quote or translate,on the Regional Office web site (http://www.euro.who.<strong>in</strong>t/pubrequest).© <strong>World</strong> <strong>Health</strong> <strong>Organization</strong> 2012All rights reserved. The Regional Office for <strong>Europe</strong> of the <strong>World</strong> <strong>Health</strong> <strong>Organization</strong> welcomes requests for permission toreproduce or translate its publications, <strong>in</strong> part or <strong>in</strong> full.The designations employed and the presentation of the material <strong>in</strong> this publication do not imply the expression of any op<strong>in</strong>ionwhatsoever on the part of the <strong>World</strong> <strong>Health</strong> <strong>Organization</strong> concern<strong>in</strong>g the legal status of any country, territory, city or area or ofits authorities, or concern<strong>in</strong>g the delimitation of its frontiers or boundaries. Dotted l<strong>in</strong>es on maps represent approximate borderl<strong>in</strong>es for which there may not yet be full agreement.The mention of specific companies or of certa<strong>in</strong> manufacturers’ products does not imply that they are endorsed or recommendedby the <strong>World</strong> <strong>Health</strong> <strong>Organization</strong> <strong>in</strong> preference to others of a similar nature that are not mentioned. Errors and omissionsexcepted, the names of proprietary products are dist<strong>in</strong>guished by <strong>in</strong>itial capital letters.All reasonable precautions have been taken by the <strong>World</strong> <strong>Health</strong> <strong>Organization</strong> to verify the <strong>in</strong>formation conta<strong>in</strong>ed <strong>in</strong> thispublication. However, the published material is be<strong>in</strong>g distributed without warranty of any k<strong>in</strong>d, either express or implied.The responsibility for the <strong>in</strong>terpretation and use of the material lies with the reader. In no event shall the <strong>World</strong> <strong>Health</strong><strong>Organization</strong> be liable for damages aris<strong>in</strong>g from its use. The views expressed by authors, editors, or expert groups do notnecessarily represent the decisions or the stated policy of the <strong>World</strong> <strong>Health</strong> <strong>Organization</strong>.Language edit<strong>in</strong>g: Lydia WanstallLayout: Vitali Shkaruba
<strong>Environmental</strong> health <strong>in</strong>equalities <strong>in</strong> <strong>Europe</strong>viiContributorsEditorial group and authorsGabriele Bolte, Department of Occupational and <strong>Environmental</strong> Epidemiology, Bavarian <strong>Health</strong> and FoodSafety Authority, Munich, GermanyMatthias Braubach, Liv<strong>in</strong>g Environments and <strong>Health</strong>, WHO <strong>Europe</strong>an Centre for Environment and <strong>Health</strong>,GermanyNita Chaudhuri, American University of Paris, FranceSéver<strong>in</strong>e Deguen, Department of Epidemiology and Biostatistics, EHESP School of Public <strong>Health</strong>, Rennes,FranceJon Fairburn, Institute for Environment, Susta<strong>in</strong>ability and Regeneration, Staffordshire University, UnitedK<strong>in</strong>gdomIngrid Fast, Maastricht University, NetherlandsLucia Isabel Fiestas, Department of Occupational and <strong>Environmental</strong> <strong>Health</strong>, EHESP School of Public<strong>Health</strong>, FrancePaata Imnadze, National Centre for Disease Control and Public <strong>Health</strong>, GeorgiaLucie Laflamme, Department of Public <strong>Health</strong> Sciences, Karol<strong>in</strong>ska Institutet, SwedenFrancesco Mitis, Violence and Injury Prevention, WHO Regional Office for <strong>Europe</strong>, DenmarkGeorge Morris, Consultant <strong>in</strong> Ecological Public <strong>Health</strong>, United K<strong>in</strong>gdomDenis Zmirou-Navier, Department of Occupational and <strong>Environmental</strong> <strong>Health</strong>, EHESP School of Public<strong>Health</strong>, Rennes, FranceReviewersMaria José Carroqu<strong>in</strong>o, Instituto de Salud Carlos III/WHO Collaborat<strong>in</strong>g Centre for the Epidemiology ofEnvironment Related Diseases, Spa<strong>in</strong>Hanneke Kruize, National Institute for Public <strong>Health</strong> and the Environment (RIVM), NetherlandsAnna Paldy, National Institute of <strong>Environmental</strong> <strong>Health</strong>, HungaryKieron Stanley, Environment Agency, United K<strong>in</strong>gdomRebecca Ste<strong>in</strong>bach, Social and <strong>Environmental</strong> <strong>Health</strong> Research, London School of Hygiene and TropicalMedic<strong>in</strong>e, United K<strong>in</strong>gdomContributors of national fact sheets and practice examplesFact sheetsDwell<strong>in</strong>gs supplied with piped water by proportion of Roma population (Hungary):Anna Paldy, National Institute of <strong>Environmental</strong> <strong>Health</strong>, HungaryAttila Juhasz and Csilla Nagy, <strong>Health</strong> <strong>Organization</strong> of Government Office of the Capital City Budapest,HungaryLack of flush toilet by wealth status, urban/rural residence and region (Georgia):Paata Imnadze, National Centre for Disease Control and Public <strong>Health</strong>, GeorgiaLack of bath or shower <strong>in</strong> dwell<strong>in</strong>g by urban/rural population and region (Kyrgyzstan):A<strong>in</strong>ash Sharshenova, Scientific and Production Centre for Preventive Medic<strong>in</strong>e, KyrgyzstanOvercrowd<strong>in</strong>g by tenure group and household <strong>in</strong>come (Great Brita<strong>in</strong>):George Morris, Consultant <strong>in</strong> Ecological Public <strong>Health</strong>, United K<strong>in</strong>gdomBob Gilmour, School of Eng<strong>in</strong>eer<strong>in</strong>g and the Built Environment, Glasgow Caledonian University, ScotlandJake Wilson, School of Eng<strong>in</strong>eer<strong>in</strong>g and the Built Environment, Glasgow Caledonian University, Scotland
viiiContributorsDampness <strong>in</strong> dwell<strong>in</strong>g by age, <strong>in</strong>come and household type (Norway):Randi Jacobsen Bertelsen and Berit Granum, Division of <strong>Environmental</strong> Medic<strong>in</strong>e, Norwegian Institute ofPublic <strong>Health</strong>, NorwayTor Morten Normann, Statistics Norway, NorwayLack of home heat<strong>in</strong>g by education and household composition (Serbia and Montenegro):Dragana Vujanovic, Office for Susta<strong>in</strong>able Development of Insufficiently Developed Areas, SerbiaWork-related <strong>in</strong>juries by sex and economic sector (Croatia):Goranka Petrović, Department of Physiology, Monitor<strong>in</strong>g and Improvement of Nutrition, Croatian NationalInstitute of Public <strong>Health</strong>, CroatiaTransport-related mortality by sex and age (Malta):Roberto DeBono, <strong>Environmental</strong> <strong>Health</strong> Policy Coord<strong>in</strong>ation Unit, M<strong>in</strong>istry of <strong>Health</strong>, the Elderly andCommunity Care, MaltaMortality from accidental poison<strong>in</strong>g by age and urban/rural residence (Poland):Krzysztof Skotak, National Institute of Public <strong>Health</strong> – National Institute of Hygiene, PolandMortality from falls by age and sex (Romania):Alexandra Cucu, National Centre for <strong>Health</strong> Promotion and Evaluation, National Institute of Public <strong>Health</strong>,RomaniaExposure to traffic noise with<strong>in</strong> residential areas by household <strong>in</strong>come level (Netherlands):Hanneke Kruize, National Institute for Public <strong>Health</strong> and the Environment (RIVM), NetherlandsLack of access to recreational/green space by region (Spa<strong>in</strong>):Maria José Carroqu<strong>in</strong>o, Instituto de Salud Carlos III/WHO Collaborat<strong>in</strong>g Centre for the Epidemiology ofEnvironment Related Diseases, Spa<strong>in</strong>Potential smoke exposure at home by SES (Germany):Christiane Bunge, <strong>Environmental</strong> Hygiene, Federal Environment Agency, GermanyExposure to second-hand smoke at work by sex, age, <strong>in</strong>come, and employment (Italy):Andrea Ranzi, <strong>Environmental</strong> <strong>Health</strong> Reference Centre, Regional Agency for <strong>Environmental</strong> Prevention of theEmilia Romagna (ARPA), ItalyPractice examples<strong>Environmental</strong> health <strong>in</strong>equality action <strong>in</strong> France: a report on the SIGFRIED Project:Julien Caudeville and Cel<strong>in</strong>e Boudet, National Institute for Industrial Environment and Risks (INERIS),FranceThe United K<strong>in</strong>gdom susta<strong>in</strong>able development <strong>in</strong>dicators: report<strong>in</strong>g on environmental health <strong>in</strong>equalities:Kieron Stanley, Environment Agency, United K<strong>in</strong>gdomIdentification of environmental health <strong>in</strong>equalities <strong>in</strong> populations liv<strong>in</strong>g close to waste disposal sites <strong>in</strong> Italy:Andrea Ranzi, Regional Reference Centre on Environment and <strong>Health</strong>, Regional Agency for <strong>Environmental</strong>Prevention of Emilia Romagna Region, ItalyChiara Badaloni and Francesco Forastiere, Department of Epidemiology, Lazio Regional <strong>Health</strong> Service, ItalyGiuseppe Costa, Department of Biological and Cl<strong>in</strong>ical Sciences, University of Tur<strong>in</strong>, ItalyMarco Martuzzi, <strong>Health</strong> Impact Assessment, WHO <strong>Europe</strong>an Centre for Environment and <strong>Health</strong>Francesco Mitis, Violence and Injury Prevention, WHO Regional Office for <strong>Europe</strong>, DenmarkAssess<strong>in</strong>g and report<strong>in</strong>g on environmental health <strong>in</strong>equalities related to lack of heated space and <strong>in</strong>door pollution <strong>in</strong>Serbia and Montenegro:Dragana Vujanovic, Office for Susta<strong>in</strong>able Development of Insufficiently Developed Areas, SerbiaAnalysis and presentation of environmental health <strong>in</strong>equalities concern<strong>in</strong>g “green space” <strong>in</strong> Scotland:George Morris, Consultant <strong>in</strong> Ecological Public <strong>Health</strong>, United K<strong>in</strong>gdomJon Fairburn, Institute for Environment, Susta<strong>in</strong>ability and Regeneration, Staffordshire University, UnitedK<strong>in</strong>gdom
<strong>Environmental</strong> health <strong>in</strong>equalities <strong>in</strong> <strong>Europe</strong>ixAssessment of environmental health <strong>in</strong>equalities <strong>in</strong> F<strong>in</strong>land: residential exposure to ambient air pollution from woodcombustion and traffic:Pauli<strong>in</strong>a Taimisto, Marko Ta<strong>in</strong>io, Jouni T. Tuomisto and Matti Jantunen, National Institute for <strong>Health</strong> andWelfare (THL), F<strong>in</strong>landNiko Karvosenoja, Kaarle Kupia<strong>in</strong>en and Petri Porvari, F<strong>in</strong>nish Environment Institute (SYKE), F<strong>in</strong>landAri Karpp<strong>in</strong>en and Leena Kangas and Jaakko Kukkonen, F<strong>in</strong>nish Meteorological Institute (FMI), F<strong>in</strong>land<strong>Environmental</strong> health <strong>in</strong>equality report on the impact of socioeconomic status on the prevalence of allergies and respiratorydiseases and symptoms <strong>in</strong> Hungarian children:Anna Paldy, Peter Rudnai, Mihaly Janos Varro, Annamaria Macsik and Eszter Szabo, National Institute of<strong>Environmental</strong> <strong>Health</strong>, HungaryAttila Juhasz and Csilla Nagy, <strong>Health</strong> <strong>Organization</strong> of Government Office of the Capital City Budapest,HungaryParticipants of project-related WHO meet<strong>in</strong>gs on environmental health <strong>in</strong>equalityRandi Jacobsen Bertelsen, Division of <strong>Environmental</strong> Medic<strong>in</strong>e, Norwegian Institute of Public <strong>Health</strong>, NorwayGabriele Bolte, Department of Occupational and <strong>Environmental</strong> Epidemiology, Bavarian <strong>Health</strong> and FoodSafety Authority, Munich, GermanyCel<strong>in</strong>e Boudet, National Institute for Industrial and Environment and Risks (INERIS), FranceChristiane Bunge, <strong>Environmental</strong> Hygiene, Federal Environment Agency, GermanyKrunoslav Capak, <strong>Environmental</strong> <strong>Health</strong> Ecology Service, National Institute of Public <strong>Health</strong>, CroatiaMaria José Carroqu<strong>in</strong>o, Instituto de Salud Carlos III/WHO Collaborat<strong>in</strong>g Centre for the Epidemiology ofEnvironment Related Diseases, Spa<strong>in</strong>Julien Caudeville, National Institute for Industrial Environment and Risks (INERIS), FranceGiuseppe Costa, Department of Biological and Cl<strong>in</strong>ical Sciences, University of Tur<strong>in</strong>, ItalyAlexandra Cucu, National Centre for <strong>Health</strong> Promotion and Evaluation, National Institute of Public <strong>Health</strong>,RomaniaAryuna Dashitsyrenova, M<strong>in</strong>istry of <strong>Health</strong> and Social Development, Russian FederationRoberto DeBono, <strong>Environmental</strong> <strong>Health</strong> Policy Coord<strong>in</strong>ation Unit, M<strong>in</strong>istry of <strong>Health</strong>, the Elderly andCommunity Care, MaltaSéver<strong>in</strong>e Deguen, Department of Epidemiology and Biostatistics, EHESP School of Public <strong>Health</strong>, Rennes,FranceMart<strong>in</strong> Dev<strong>in</strong>e, <strong>Health</strong> Services Executive, IrelandNita Chaudhuri, American University of Paris, FranceJon Fairburn, Institute for Environment, Susta<strong>in</strong>ability and Regeneration, Staffordshire University, UnitedK<strong>in</strong>gdomBerit Granum, Division of <strong>Environmental</strong> Medic<strong>in</strong>e, Norwegian Institute of Public <strong>Health</strong>, NorwayPaata Imnadze, National Centre for Disease Control and Public <strong>Health</strong>, GeorgiaMatti Jantunen, Department of <strong>Environmental</strong> <strong>Health</strong>, National Institute of <strong>Health</strong> and Welfare, F<strong>in</strong>landHanneke Kruize, National Institute for Public <strong>Health</strong> and the Environment (RIVM), NetherlandsLucie Laflamme, Department of Public <strong>Health</strong> Sciences, Karol<strong>in</strong>ska Institutet, SwedenGeorge Morris, Consultant <strong>in</strong> Ecological Public <strong>Health</strong>, United K<strong>in</strong>gdomAnna Paldy, National Institute of <strong>Environmental</strong> <strong>Health</strong>, HungaryRifat Pamuk, M<strong>in</strong>istry of <strong>Health</strong>, TurkeyGoranka Petrović, Department of Physiology, Monitor<strong>in</strong>g and Improvement of Nutrition, Croatian NationalInstitute of Public <strong>Health</strong>, CroatiaAndrea Ranzi, Regional Reference Centre on Environment and <strong>Health</strong>, Regional Agency for <strong>Environmental</strong>Prevention of Emilia Romagna Region, ItalyAnne Reneflot, Norwegian Institute of Public <strong>Health</strong>, NorwayA<strong>in</strong>ash Sharshenova, Scientific and Production Centre for Preventive Medic<strong>in</strong>e, KyrgyzstanKrzysztof Skotak, National Institute of Public <strong>Health</strong> – National Institute of Hygiene, PolandKieron Stanley, Environment Agency, United K<strong>in</strong>gdomRebecca Ste<strong>in</strong>bach, Social and <strong>Environmental</strong> <strong>Health</strong> Research, London School of Hygiene and TropicalMedic<strong>in</strong>e, United K<strong>in</strong>gdom
xContributorsDragana Vujanovic, Office for Susta<strong>in</strong>able Development of Insufficiently Developed Areas, SerbiaDenis Zmirou-Navier, Department of Occupational and <strong>Environmental</strong> <strong>Health</strong>, EHESP School of Public<strong>Health</strong>, Rennes, FranceIngrid Zurlyté, Centre for <strong>Health</strong> Education and Disease Prevention, LithuaniaMeet<strong>in</strong>g observersCharles Price, Directorate General for <strong>Health</strong> and Consumer Protection, <strong>Europe</strong>an Commission, LuxembourgJames Wilson, School of Built and Natural Environment, Glasgow Caledonian University, ScotlandWHO secretariatMatthias Braubach, Liv<strong>in</strong>g Environments and <strong>Health</strong>, WHO <strong>Europe</strong>an Centre for Environment and <strong>Health</strong> 1Andrey Egorov, Environment and <strong>Health</strong> Surveillance, WHO <strong>Europe</strong>an Centre for Environment and <strong>Health</strong>Ingrid Fast, Student <strong>in</strong>tern, WHO <strong>Europe</strong>an Centre for Environment and <strong>Health</strong>Stefanie Fleischmann, Student <strong>in</strong>tern, WHO <strong>Europe</strong>an Centre for Environment and <strong>Health</strong>Johanna Hanefeld, Social Determ<strong>in</strong>ants of <strong>Health</strong>, WHO <strong>Europe</strong>an Office for Investment for <strong>Health</strong> andDevelopmentRokho Kim, Occupational <strong>Health</strong>, WHO <strong>Europe</strong>an Centre for Environment and <strong>Health</strong>Michal Krzyzanowski, Head of Office, WHO <strong>Europe</strong>an Centre for Environment and <strong>Health</strong>Marco Martuzzi, <strong>Health</strong> Impact Assessment, WHO <strong>Europe</strong>an Centre for Environment and <strong>Health</strong>Srdan Matic, Coord<strong>in</strong>ator Environment and <strong>Health</strong>, WHO Regional Office for <strong>Europe</strong>Gerald<strong>in</strong>e McWeeney, Environment and <strong>Health</strong>, WHO Country Office, SerbiaFrancesco Mitis, Violence and Injury Prevention, WHO Regional Office for <strong>Europe</strong>Angelika Nöcker, Programme Assistant, WHO <strong>Europe</strong>an Centre for Environment and <strong>Health</strong>Deepika Sachdeva, Programme Assistant, WHO <strong>Europe</strong>an Centre for Environment and <strong>Health</strong>Steffen Uffenorde, Student <strong>in</strong>tern, WHO <strong>Europe</strong>an Centre for Environment and <strong>Health</strong>Tanja Wolf, Climate Change and <strong>Health</strong>, WHO <strong>Europe</strong>an Centre for Environment and <strong>Health</strong>1 Project leader.
<strong>Environmental</strong> health <strong>in</strong>equalities <strong>in</strong> <strong>Europe</strong>xiAcknowledgementsThe project and the two related expert meet<strong>in</strong>gs were supported by funds generously provided to WHOby the German Government through the Federal M<strong>in</strong>istry for the Environment, Nature Conservationand Nuclear Safety.
xii
<strong>Environmental</strong> health <strong>in</strong>equalities <strong>in</strong> <strong>Europe</strong>xiiiForewordIn 2008, the f<strong>in</strong>al report of the WHO Commission on Social Determ<strong>in</strong>ants of <strong>Health</strong> 2 concludedthat <strong>in</strong>equalities <strong>in</strong> health are a major challenge for both development and overall progress <strong>in</strong> countries.Such <strong>in</strong>equalities also exist with<strong>in</strong> environmental health; almost all countries have some groups of theirpopulation at greater risk of experienc<strong>in</strong>g harmful environmental conditions than others. Socioeconomicvariables such as <strong>in</strong>come, employment or occupation and education are found to be especially strongdeterm<strong>in</strong>ants of environmental health risks. Demographic variables such as age, sex and ethnicity canalso affect risk, and <strong>in</strong> addition can modify the relationship between socioeconomic status, environmentand health. The Member States of the WHO <strong>Europe</strong>an Region declared their commitment to act onsocioeconomic and gender <strong>in</strong>equalities <strong>in</strong> the human environment and health at the Fifth M<strong>in</strong>isterialConference on Environment and <strong>Health</strong> <strong>in</strong> Parma, Italy, <strong>in</strong> March 2010. 3This assessment report <strong>in</strong>dicates that environmental health <strong>in</strong>equalities exist <strong>in</strong> all subregions and<strong>in</strong> all countries of the WHO <strong>Europe</strong>an Region, even though countries may have different patterns ofexposure and risk. The report also confirms the expectation that often, although not exclusively, exposureto environmental risks is more frequently suffered by disadvantaged population groups.The report shows that more and better data on the distribution of environmental risks with<strong>in</strong> thepopulation of the WHO <strong>Europe</strong>an Region are needed. For many environmental health <strong>in</strong>equalitiescovered <strong>in</strong> this report, data are only available for about half the countries. The assessment of environmental<strong>in</strong>equalities is further restricted by a frequent lack of data on population subgroups def<strong>in</strong>ed by variouscategories of socioeconomic or demographic variable. This report must therefore be considered an <strong>in</strong>itialbasel<strong>in</strong>e assessment us<strong>in</strong>g data available from <strong>in</strong>ternational databases. Clearly, more work is needed toprovide more and better data, enabl<strong>in</strong>g more <strong>in</strong>sightful assessments.The existence of significant unjust and avoidable <strong>in</strong>equalities <strong>in</strong> environmental risks with<strong>in</strong> acountry is not acceptable, and evidence of such <strong>in</strong>equalities, as presented <strong>in</strong> this report, thus calls forrelevant policies and <strong>in</strong>terventions. In consequence, the environmental health <strong>in</strong>equalities identified <strong>in</strong>the respective countries need to be validated and <strong>in</strong>terpreted <strong>in</strong> the given national context, allow<strong>in</strong>g thedesign of <strong>in</strong>tersectoral remedial actions 4 as well as the <strong>in</strong>tegration of health equity considerations <strong>in</strong>toall national policies. 5 Such <strong>in</strong>terventions would prove that Member States have not only the capacity toidentify <strong>in</strong>equalities <strong>in</strong> environmental risk but also the political will to address these <strong>in</strong>equalities andprovide environmental justice as declared by the Member States <strong>in</strong> Parma.Zsuzsanna JakabWHO Regional Director for <strong>Europe</strong>2 Commission on Social Determ<strong>in</strong>ants of <strong>Health</strong> (2008). Clos<strong>in</strong>g the gap <strong>in</strong> a generation: health equity through action on the social determ<strong>in</strong>antsof health. F<strong>in</strong>al report of the Commission on Social Determ<strong>in</strong>ants of <strong>Health</strong>. Geneva, <strong>World</strong> <strong>Health</strong> <strong>Organization</strong> (http://whqlibdoc.who.<strong>in</strong>t/publications/2008/9789241563703_eng.pdf, accessed 11 January 2012).3 WHO (2010). Parma Declaration on Environment and <strong>Health</strong>. Copenhagen, WHO Regional Office for <strong>Europe</strong> (http://www.euro.who.<strong>in</strong>t/__data/assets/pdf_file/0011/78608/E93618.pdf, accessed 11 January 2012).4 WHO (2011). Rio Political Declaration on Social Determ<strong>in</strong>ants of <strong>Health</strong>. Geneva, <strong>World</strong> <strong>Health</strong> <strong>Organization</strong> (http://www.who.<strong>in</strong>t/sdhconference/declaration/Rio_political_declaration.pdf, accessed 11 January 2012).5 WHO (2009). <strong>World</strong> <strong>Health</strong> Assembly resolution 62.14. Reduc<strong>in</strong>g health <strong>in</strong>equities through action on the social determ<strong>in</strong>ants of health. Geneva,<strong>World</strong> <strong>Health</strong> <strong>Organization</strong> (http://apps.who.<strong>in</strong>t/gb/ebwha/pdf_files/A62/A62_R14-en.pdf, accessed 11 January 2012).
xiv
<strong>Environmental</strong> health <strong>in</strong>equalities <strong>in</strong> <strong>Europe</strong>xvExecutive summaryThe concept of environmental health <strong>in</strong>equalities<strong>Environmental</strong> health <strong>in</strong>equalities refer to general differences <strong>in</strong> environmental health conditions.Socioeconomic and demographic <strong>in</strong>equalities <strong>in</strong> exposure to environmental hazards exist everywhereand can be expressed <strong>in</strong> relation to factors that may affect the risk of be<strong>in</strong>g exposed, such as <strong>in</strong>come,education, employment, age, sex, race/ethnicity and specific locations or sett<strong>in</strong>gs. In addition to thesedifferences <strong>in</strong> exposure, environmental health <strong>in</strong>equalities are also caused by social or demographicdifferences <strong>in</strong> vulnerability towards certa<strong>in</strong> risks.Many of the environmental health <strong>in</strong>equalities, particularly where they are l<strong>in</strong>ked to socioeconomicvariables or sex, also represent “<strong>in</strong>equities” because they are unfair, unjust and avoidable. The root causeof such <strong>in</strong>equalities is most often a lack of “distributive justice”, <strong>in</strong>dicat<strong>in</strong>g that environmental risks arenot evenly distributed with<strong>in</strong> societies and populations, and a lack of “procedural justice”, <strong>in</strong>dicat<strong>in</strong>gthat different population groups may have different opportunities to <strong>in</strong>fluence decisions affect<strong>in</strong>g theirclose environment.Rationale of the reportThe objective of the report is to provide an <strong>in</strong>itial basel<strong>in</strong>e assessment of environmental health <strong>in</strong>equalities<strong>in</strong> the WHO <strong>Europe</strong>an Region. It is based on available statistical data from national or <strong>in</strong>ternationaldatabases. To undertake the assessment, a set of 14 environmental health <strong>in</strong>equality <strong>in</strong>dicators wasdeveloped, categorized <strong>in</strong>to three <strong>in</strong>equality dimensions (see Table).Table. <strong>Environmental</strong> health <strong>in</strong>equality <strong>in</strong>dicatorsHous<strong>in</strong>g-related <strong>in</strong>equalities Injury-related <strong>in</strong>equalities Environment-related <strong>in</strong>equalities• Inadequate water supply• Lack of a flush toilet• Lack of a bath or shower• Overcrowd<strong>in</strong>g• Dampness <strong>in</strong> the home• Inability to keep the homeadequately warm• Work-related <strong>in</strong>juries• Fatal road traffic <strong>in</strong>juries• Fatal poison<strong>in</strong>gs• Fatal falls• Noise exposure at home• Lack of access to green/recreational areas• Second-hand smoke exposureat home• Second-hand smoke exposureat workFor each environmental health <strong>in</strong>equality <strong>in</strong>dicator, data from <strong>in</strong>ternational databases were analysedto assess, by country or subregion, the existence and the magnitude of <strong>in</strong>equalities between differentpopulation subgroups.National data were analysed for the development of national environmental health <strong>in</strong>equality fact sheetsand practice examples (see Annexes 1 and 2). These national contributions <strong>in</strong>dicate that more detailedassessments of environmental health <strong>in</strong>equality can be provided at national and subnational levels andthat there are already national experiences with such assessments.Inequality assessment f<strong>in</strong>d<strong>in</strong>gsThe assessment of hous<strong>in</strong>g-, <strong>in</strong>jury- and environment-related <strong>in</strong>equalities shows that <strong>in</strong>equalitiesexist throughout the WHO <strong>Europe</strong>an Region. However, there are large differences between countriesregard<strong>in</strong>g the magnitude of the <strong>in</strong>equalities and the most affected population groups. Depend<strong>in</strong>g on
xviExecutive summarythe available data, <strong>in</strong>equality assessments were undertaken <strong>in</strong> relation to differences by sex, age, <strong>in</strong>come,relative poverty, household type, social position, employment, occupation, education and difficultypay<strong>in</strong>g bills. All of these sociodemographic determ<strong>in</strong>ants are found to be associated with significant<strong>in</strong>equalities.• Income and poverty-related <strong>in</strong>equalities are identified for noise exposure, exposure to second-handtobacco smoke at home and at work, and hous<strong>in</strong>g-related <strong>in</strong>equality <strong>in</strong>dicators, where they aremost clearly expressed. Compared to the other determ<strong>in</strong>ants applied, <strong>in</strong>come- and poverty-relateddeterm<strong>in</strong>ants display some of the strongest <strong>in</strong>equalities at subregional and national levels. Differences<strong>in</strong> national <strong>in</strong>come levels are also associated with <strong>in</strong>jury-related fatalities, with low/middle <strong>in</strong>comecountries report<strong>in</strong>g higher mortality rates.• Sex-related <strong>in</strong>equality is most strongly associated with <strong>in</strong>jury, where male fatality rates are oftenthree times (and beyond) female fatality rates. Sex-related differences also appear <strong>in</strong> relation tosecond-hand tobacco smoke exposure, yet play no important role for hous<strong>in</strong>g-related risk factors.• Age-related <strong>in</strong>equalities are present for <strong>in</strong>juries (especially falls) but differ <strong>in</strong> direction, depend<strong>in</strong>g onthe <strong>in</strong>dicator. Age impacts are less prom<strong>in</strong>ent for the other <strong>in</strong>equality <strong>in</strong>dicators.• Household type-related <strong>in</strong>equalities <strong>in</strong> hous<strong>in</strong>g conditions are especially identified for s<strong>in</strong>gle-parenthouseholds, and <strong>in</strong>crease when comb<strong>in</strong>ed with low <strong>in</strong>come and relative poverty factors.• Data on <strong>in</strong>equalities by education, employment/occupation and self-assessed social position are onlyavailable for some of the environment-related <strong>in</strong>equalities, but they show a diverse <strong>in</strong>equality pattern:high education level is consistently associated with higher reported lack of access to recreational andgreen areas, while employment/occupation level shows different <strong>in</strong>equality patterns <strong>in</strong> exposure tosecond-hand smoke, with the direction of <strong>in</strong>equality depend<strong>in</strong>g on sex and subregion.Suggested priorities for national actionSuggested priorities for national action are identified <strong>in</strong> the report, based on a comb<strong>in</strong>ed assessment of theabsolute magnitude of the respective environmental exposure for the whole population and the relativeexposure differences between selected population subgroups. If the respective environmental health riskis greater <strong>in</strong> one country than <strong>in</strong> others, and if the distribution of the risk with<strong>in</strong> the population is moreunequal <strong>in</strong> that country than <strong>in</strong> others, the country thus identified should give priority to nationalfollow-up activities <strong>in</strong> order to address these <strong>in</strong>equalities.Suggested priorities for national action on <strong>in</strong>equalities are identified for 38 of the 53 countries of theWHO <strong>Europe</strong>an Region and affect Member States from all subregions and developmental levels.However, of the 15 countries where no priority for national action on environmental health <strong>in</strong>equalitieswas identified, 12 countries only reported data for 5 or even fewer of the 30 assessed <strong>in</strong>equality dimensionscovered with<strong>in</strong> the 14 environmental health <strong>in</strong>equality <strong>in</strong>dicators.Annex 3 shows the suggested priorities for the <strong>in</strong>dividual countries of the WHO <strong>Europe</strong>an Region.In countries with identified priorities for national action, a more detailed national assessment of therespective <strong>in</strong>equalities is needed <strong>in</strong> order to confirm and <strong>in</strong>terpret them <strong>in</strong> the given national context.However, <strong>in</strong> countries where no data were available, this lack of <strong>in</strong>formation should, <strong>in</strong> and of itself, bea reason for more detailed <strong>in</strong>vestigation.Constra<strong>in</strong>ts and evidence gapsThe assessment report is affected by a range of constra<strong>in</strong>ts and gaps <strong>in</strong> evidence. The most significantconstra<strong>in</strong>ts are (a) the lack of general data on environmental exposure <strong>in</strong> many countries, and (b) thelimited opportunities for stratification of environmental exposure data by socioeconomic or demographicdeterm<strong>in</strong>ants. Further constra<strong>in</strong>ts relate to the quality and reliability of the data, and the lack of
<strong>Environmental</strong> health <strong>in</strong>equalities <strong>in</strong> <strong>Europe</strong>xviimethodological consistency between national surveys, restrict<strong>in</strong>g the comparison of data collected <strong>in</strong>different countries. Priority steps to be taken towards the improvement of statistical evidence forenvironmental health <strong>in</strong>equality assessments would comprise:• establishment of surveys cover<strong>in</strong>g priority environmental health issues and specific target groups• <strong>in</strong>creased use of social and demographic variables <strong>in</strong> environmental surveys• development of common tools, methods, def<strong>in</strong>itions and criteria• better access to the available data.ConclusionThe report conveys four key messages.• <strong>Environmental</strong> health <strong>in</strong>equalities exist <strong>in</strong> all subregions and <strong>in</strong> all countries, and are most oftensuffered by disadvantaged population groups.• The magnitude of <strong>in</strong>equalities and the distribution of <strong>in</strong>equalities between advantaged anddisadvantaged population groups can be very diverse between countries and also depends on thesocioeconomic or demographic variable used for stratification.• To allow reliable identification of the most relevant target groups and to understand better thenational <strong>in</strong>equality patterns and their causal mechanisms, more detailed environmental health<strong>in</strong>equality report<strong>in</strong>g and assessment are needed at the national level.• The evidence base for the assessment of environmental health <strong>in</strong>equalities needs to be strengthened.This is valid for both data quantity (number of countries with data, number of risk factors reported)and data quality (reliability, opportunities for stratification).Therefore, the results presented <strong>in</strong> this report provide an <strong>in</strong>itial basel<strong>in</strong>e assessment of selectedenvironmental health <strong>in</strong>equalities <strong>in</strong> the WHO <strong>Europe</strong>an Region. Further work is necessary to expandand further ref<strong>in</strong>e the assessment.Possible actions for tackl<strong>in</strong>g environmental health <strong>in</strong>equalitiesAlthough national priorities and disadvantaged groups vary, action is necessary throughout the WHO<strong>Europe</strong>an Region to reduce the observed <strong>in</strong>equalities. The report suggests six general recommendationsfor action, which can be tailored to the respective national situation:• action 1: general improvement of environmental conditions, assur<strong>in</strong>g healthy environments for all;• action 2: mitigation and reduction of risk exposure <strong>in</strong> the most affected population groups, focus<strong>in</strong>gon the most exposed and/or most vulnerable subpopulations;• action 3: national environmental health <strong>in</strong>equality assessments to assess or confirm <strong>in</strong>equalitiesbased on national, more detailed data;• action 4: shar<strong>in</strong>g experiences and case studies on successful <strong>in</strong>terventions tackl<strong>in</strong>g environmentalhealth <strong>in</strong>equalities;• action 5: review and modification of national <strong>in</strong>tersectoral policies <strong>in</strong> relation to environmentalhealth <strong>in</strong>equalities;• action 6: monitor<strong>in</strong>g of environmental health <strong>in</strong>equalities us<strong>in</strong>g a standard set of <strong>in</strong>equality <strong>in</strong>dicators.
INTRODUCTION
<strong>Environmental</strong> health <strong>in</strong>equalities <strong>in</strong> <strong>Europe</strong> 3Call<strong>in</strong>g on governments to close the gap <strong>in</strong> a generation, CSDH (2008) recommended three pr<strong>in</strong>ciplesof action.• Improve daily liv<strong>in</strong>g conditions.• Tackle the <strong>in</strong>equitable distribution of power, money and resources.• Measure and understand the problem and assess the impact of action.The first recommendation is strongly related to the environmental conditions to which people areexposed on a daily basis. The third recommendation calls for assessment of the health situation <strong>in</strong>Member States <strong>in</strong> order to understand the problem, identify causal mechanisms and set priorities foraction. Most importantly, it calls for monitor<strong>in</strong>g of the impacts of actions and <strong>in</strong>terventions. In thecontext of environmental health <strong>in</strong>equalities, various report<strong>in</strong>g and monitor<strong>in</strong>g opportunities arise toconnect environmental exposure data with sociodemographic <strong>in</strong>formation to describe the disparities ofenvironmental risk with<strong>in</strong> and between population groups.In response to the CSDH f<strong>in</strong>al report, the <strong>World</strong> <strong>Health</strong> Assembly agreed <strong>in</strong> 2009 on a resolutionto reduce health <strong>in</strong>equities through action on the social determ<strong>in</strong>ants of health (WHO, 2009a). Thisresolution provides WHO with a strong mandate to address the social determ<strong>in</strong>ants of health <strong>in</strong> itswork, and urges Member States to:• tackle health <strong>in</strong>equities with<strong>in</strong> as well as across countries;• develop mechanisms to <strong>in</strong>tegrate <strong>in</strong>equalities <strong>in</strong>to public health actions;• consider <strong>in</strong>equity arguments <strong>in</strong> their policy-mak<strong>in</strong>g.The need for monitor<strong>in</strong>g of and action on <strong>in</strong>equalities was confirmed by the <strong>World</strong> Conference onSocial Determ<strong>in</strong>ants of <strong>Health</strong> held <strong>in</strong> Brazil <strong>in</strong> October 2011. The conference discussion paper (WHO,2011b) <strong>in</strong>dicates that a dearth of knowledge – result<strong>in</strong>g from an absence of <strong>in</strong>equality monitor<strong>in</strong>g andof political accountability – is one of the ma<strong>in</strong> reasons for the lack of action and thus calls for <strong>in</strong>creasedreport<strong>in</strong>g of <strong>in</strong>equalities us<strong>in</strong>g disaggregated data rather than <strong>in</strong>formation based on national averages.Assess<strong>in</strong>g environmental health <strong>in</strong>equalities <strong>in</strong> the WHO<strong>Europe</strong>an RegionIn 2009 the WHO Regional Office for <strong>Europe</strong> began to review the evidence on social and gender<strong>in</strong>equalities <strong>in</strong> environmental risk and exposure, draft<strong>in</strong>g a policy brief and an evidence report onenvironmental <strong>in</strong>equalities, published at the Fifth M<strong>in</strong>isterial Conference on Environment and <strong>Health</strong><strong>in</strong> 2010 (WHO, 2010a; 2010b). At the Conference Member States recognized environmental health<strong>in</strong>equalities as a priority for future work and adopted the Parma Declaration (WHO, 2010c), whichprovides WHO with a mandate to monitor the commitment of Member States to act on:• the health risks to children and other vulnerable population groups (with a specific focus on thewater and sanitation situation);• socioeconomic and gender <strong>in</strong>equalities <strong>in</strong> the human environment that are relevant for health.Work undertaken by academic researchers, as well as by WHO and other <strong>in</strong>ternational agencies,<strong>in</strong>dicates that countries already have a significant ammount of <strong>in</strong>formation on the most vulnerablegroups <strong>in</strong> relation to specific environmental threats. However, the respective data are often scatteredand rarely brought together <strong>in</strong> a systematic way, as concluded by the first WHO expert meet<strong>in</strong>g toreview the evidence on environmental <strong>in</strong>equalities <strong>in</strong> 2009 (WHO, 2009b). Follow<strong>in</strong>g up on this lack ofquantitative evidence, and based on the Parma Declaration and the <strong>World</strong> <strong>Health</strong> Assembly resolution,WHO identified the need to assess <strong>in</strong> more detail the environmental health <strong>in</strong>equalities <strong>in</strong> the WHO<strong>Europe</strong>an Region as a basis for further action by WHO and Member States.
4IntroductionRationale and overview of the projectThe ma<strong>in</strong> objective of the project was to assess and report on environmental health <strong>in</strong>equalities <strong>in</strong> theWHO <strong>Europe</strong>an Region, based on available statistical data from national or <strong>in</strong>ternational databases.The results of the project are presented <strong>in</strong> this assessment report, which describes the magnitude ofenvironmental disparities <strong>in</strong> the WHO <strong>Europe</strong>an Region and identifies the population groups thatare most affected. Some academic research work referenced <strong>in</strong> the report chapters is also applied to putthe statistical data <strong>in</strong>to context, to provide <strong>in</strong>formation about the health relevance of the risk factorscovered, and to shed light on <strong>in</strong>equalities that cannot be assessed through the data alone. However,emphasis is also placed on identify<strong>in</strong>g and report<strong>in</strong>g the gaps <strong>in</strong> evidence that restrict the assessment ofenvironmental <strong>in</strong>equalities, which may be as relevant for public health practitioners and policy-makersas the f<strong>in</strong>d<strong>in</strong>gs.Initiated <strong>in</strong> 2010 and benefitt<strong>in</strong>g from the work review<strong>in</strong>g academic evidence for the Fifth M<strong>in</strong>isterialConference on Environment and <strong>Health</strong>, the project aimed to:• establish a list of environmental health risk factors for which data on socioeconomic or demographic<strong>in</strong>equalities can be compiled at the national level;• select and apply an environmental health <strong>in</strong>equality <strong>in</strong>dicator set for the assessment of countryspecificenvironmental health <strong>in</strong>equality data;• produce an assessment report on environmental health <strong>in</strong>equality together with national <strong>in</strong>equalityfact sheets.Two milestone meet<strong>in</strong>gs took place at the WHO <strong>Europe</strong>an Centre on Environment and <strong>Health</strong> <strong>in</strong>Bonn to mark the project’s progress.Identification of available data and selection of <strong>in</strong>equality <strong>in</strong>dicatorsInformed by the evidence review published for the Fifth M<strong>in</strong>isterial Conference on Environment and<strong>Health</strong> (WHO, 2010b), a compilation of available data on environmental health risk factors and theirpotential for stratification by sociodemographic determ<strong>in</strong>ants was put together dur<strong>in</strong>g summer 2010.17 Member States participated, search<strong>in</strong>g for available data based on national censuses and surveys.In parallel, the WHO secretariat reviewed <strong>in</strong>ternational databases (<strong>in</strong>clud<strong>in</strong>g those of the <strong>Europe</strong>anUnion (EU), the Organisation for Economic Co-operation and Development (OECD) and the UnitedNations) for data on the environmental health risk factors that could be stratified by socioeconomic ordemographic determ<strong>in</strong>ants.In October 2010 at the first project meet<strong>in</strong>g 26 experts from different countries across the WHO<strong>Europe</strong>an Region and WHO staff from various programmes reviewed and evaluated the compilationof environmental health <strong>in</strong>equality data and data sources (WHO, 2010d). From an <strong>in</strong>itial 30 riskfactors compiled by the WHO secretariat and the Member States, a set of 14 environmental health<strong>in</strong>equality <strong>in</strong>dicators categorized <strong>in</strong>to three <strong>in</strong>equality areas (hous<strong>in</strong>g-, <strong>in</strong>jury- and environment-related<strong>in</strong>equalities) was agreed (see Table 1).Although the review was undertaken on both the national and <strong>in</strong>ternational levels, the meet<strong>in</strong>gconcluded that the data compiled through national surveys and censuses were too diverse to be used for<strong>in</strong>ternational report<strong>in</strong>g. The ma<strong>in</strong> restrictions relate to the variety of collection methods and def<strong>in</strong>itionsused, which do not enable consistent and reliable comparison between countries (see Chapter 5 fordetails). Nevertheless, national data have strong potential to be useful <strong>in</strong> environmental health <strong>in</strong>equalityassessments with<strong>in</strong> <strong>in</strong>dividual countries, as <strong>in</strong>dicated by the national <strong>in</strong>equality fact sheets and practiceexamples <strong>in</strong> Annexes 1 and 2.
<strong>Environmental</strong> health <strong>in</strong>equalities <strong>in</strong> <strong>Europe</strong> 5Table 1. <strong>Environmental</strong> health <strong>in</strong>equality <strong>in</strong>dicatorsIndicator Sociodemographic stratification options available Data sourceHous<strong>in</strong>g-related <strong>in</strong>equalitiesInadequate water supply Urbanization level WHO/UNICEFLack of a flush toilet Age, sex, <strong>in</strong>come/poverty status and household type EurostatLack of a bath or shower Age, sex, <strong>in</strong>come/poverty status and household type EurostatOvercrowd<strong>in</strong>g Age, sex, <strong>in</strong>come/poverty status and household type EurostatDampness <strong>in</strong> the home Age, sex, <strong>in</strong>come/poverty status and household type EurostatInability to keep the home adequately warm Age, sex, <strong>in</strong>come/poverty status and household type EurostatInjury-related <strong>in</strong>equalitiesWork-related <strong>in</strong>juries Sex, age and occupation EurostatFatal road traffic <strong>in</strong>juries Country <strong>in</strong>come, age and sex WHOFatal poison<strong>in</strong>gs Country <strong>in</strong>come, age and sex WHOFatal falls Country <strong>in</strong>come, age and sex WHOEnvironment-related <strong>in</strong>equalitiesNoise exposure at home Income/poverty status and household type EurostatLack of access to green/recreational areas Age, sex, <strong>in</strong>come, difficulty pay<strong>in</strong>g bills,employment, education level and household typeEurofoundSecond-hand smoke exposure at homeSecond-hand smoke exposure at workAge, sex, self-assessed social position, difficultypay<strong>in</strong>g bills and employmentAge, sex, self-assessed social position, difficultypay<strong>in</strong>g bills and occupationEurobarometerEurobarometerImplementation of <strong>in</strong>dicators and draft<strong>in</strong>g the first assessment reportUs<strong>in</strong>g the environmental health <strong>in</strong>equality <strong>in</strong>dicators, subcontracted experts drafted reports assess<strong>in</strong>g<strong>in</strong>dicator-specific <strong>in</strong>equalities. Chapters on the concept of environmental health <strong>in</strong>equality and onthe gaps <strong>in</strong> evidence identified as restrict<strong>in</strong>g a more detailed <strong>in</strong>equality assessment were developed <strong>in</strong>parallel. In addition, selected Member States were asked to provide fact sheets on environmental health<strong>in</strong>equalities (show<strong>in</strong>g the potential for more detailed assessments us<strong>in</strong>g national data) and practiceexamples describ<strong>in</strong>g the experience and methods applied <strong>in</strong> recent national work identify<strong>in</strong>g, monitor<strong>in</strong>gand assess<strong>in</strong>g environmental health <strong>in</strong>equalities.At the second project meet<strong>in</strong>g <strong>in</strong> June 2011, the chapter drafts, fact sheets and practice examples werepeer-reviewed and discussed by 24 country representatives and experts. The chapters were then revisedand f<strong>in</strong>alized, based on their comments.Benefits of <strong>in</strong>equality assessments for actionAction to tackle <strong>in</strong>equalities needs to be <strong>in</strong>formed by evidence on the population groups most affectedand the sociodemographic features associated with the unequal distribution of risks and opportunities.Hence, better quality evidence and adequate identification of the specific target groups could help tomake <strong>in</strong>terventions more effective. Table 2 <strong>in</strong>dicates the potential benefits of us<strong>in</strong>g <strong>in</strong>equality evidencefor policy action, suggest<strong>in</strong>g that such actions can be focused on societal structures and mechanisms aswell as on result<strong>in</strong>g disparities <strong>in</strong> exposure and/or vulnerability.
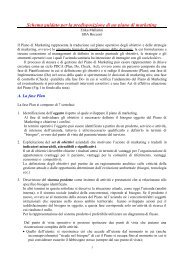
6IntroductionTable 2. Benefits of <strong>in</strong>equality report<strong>in</strong>g for effective action on environmental health <strong>in</strong>equalitiesInequality evidenceEvidence on societalstructures andmechanisms lead<strong>in</strong>g to<strong>in</strong>equalitiesEvidence on differentialexposure to social andphysical environmentalrisksEvidence on differentialvulnerability tothe risksPolicy actions• Provide examples of good/equitable societal practices.• Review and propose policy options on environmental protection.• Engage <strong>in</strong> public debate to <strong>in</strong>corporate health equity issues <strong>in</strong>to economic and socialstrategies and plans.• Support and implement equity-focused health impact assessment of policies and<strong>in</strong>frastructural projects.• Advocate for appropriate <strong>in</strong>terventions to improve environmental conditions for the wholepopulation.• Target action on pollution hotspots and population groups with the highest exposures.• Influence the health m<strong>in</strong>istry to shift attention upstream to policies that produce goodpopulation health.• Support <strong>in</strong>tersectoral action and extend HiAP approaches.• Actively participate <strong>in</strong> public education, regulation, <strong>in</strong>frastructure plann<strong>in</strong>g and design,and taxation policy development affect<strong>in</strong>g environmental conditions.• Ensure adequate environmental and <strong>in</strong>frastructural services and conditions throughouteach country.• Increase targeted protection measures <strong>in</strong> areas or sett<strong>in</strong>gs with a high density ofvulnerable, sensitive or disproportionally affected populations.• Improve environmental standards <strong>in</strong> the vic<strong>in</strong>ity of child care centres, schools, hospitals,nurs<strong>in</strong>g homes, and similar.Source: adapted and extended, based on a concept outl<strong>in</strong>ed <strong>in</strong> Blas, Sommerfeld and Sivasankara Kurup (2011).S<strong>in</strong>ce the transformation of society structures and procedures may be more of a long-term objective forthe improvement of health for all, the reduction of environmental <strong>in</strong>equalities specifically requires shortterm<strong>in</strong>terventions <strong>in</strong> decreas<strong>in</strong>g exposure (Braubach et al., 2010). In this context, Table 2 <strong>in</strong>dicates that <strong>in</strong>many cases the decision will be between two separate approaches: <strong>in</strong>terventions assur<strong>in</strong>g environmentalconditions for all and targeted <strong>in</strong>terventions tackl<strong>in</strong>g environmental conditions specific to certa<strong>in</strong> groupsor geographical units. Although both approaches are needed and can often be comb<strong>in</strong>ed to achieve thebest outcome (Dahlgren and Whitehead, 2006), the results of <strong>in</strong>equality assessments are essential to<strong>in</strong>form the decision-mak<strong>in</strong>g process and provide guidance on the most appropriate way forward.On the one hand, as <strong>in</strong>dicated by the recent report on equity, social determ<strong>in</strong>ants and public healthprogrammes (Blas and Sivasankara Kurup, 2010), the existence of l<strong>in</strong>ear gradients of environmental<strong>in</strong>equality (see Fig. 1, Country A) would strongly suggest that universal approaches – improv<strong>in</strong>genvironmental conditions to reduce exposure for all groups, irrespective of social status – would bebeneficial for the whole of society. <strong>Environmental</strong> actions such as assur<strong>in</strong>g compliance with exist<strong>in</strong>genvironmental standards throughout the country are likely to have the greatest benefits for the mostdisadvantaged segment of the population with the highest levels of exposure. Thus, broad-brushenvironmental actions might help to reduce <strong>in</strong>equalities more effectively.On the other hand, actions should not ignore the specific needs of population groups with highersocial disadvantage, which might benefit most from dedicated action. Thus, environmental <strong>in</strong>equalitygradients with a skewed distribution (see Fig. 1, Country B) – especially those with excess risk for thepoorest population groups – would benefit from the application of targeted actions focus<strong>in</strong>g on theenvironmental conditions suffered by the most disadvantaged population groups, which, <strong>in</strong> addition, areoften less socially <strong>in</strong>cluded and less <strong>in</strong>volved <strong>in</strong> political advocacy.This assessment report provides examples that show how analysis based on the results of statisticaldata can assist with the selection of appropriate <strong>in</strong>terventions. However, this approach requires theidentification of gradients which cannot be produced when only dichotomous comparisons of, forexample, “rich versus poor” and “male versus female” are possible. As demonstrated by the results <strong>in</strong> thisreport, data availability often does not facilitate adequate assessment of <strong>in</strong>equalities us<strong>in</strong>g these exist<strong>in</strong>ggradients.
<strong>Environmental</strong> health <strong>in</strong>equalities <strong>in</strong> <strong>Europe</strong> 7Fig. 1. Examples of l<strong>in</strong>ear and nonl<strong>in</strong>ear <strong>in</strong>equality gradients3025Country ACountry BExposure prevalence (%)201510501 (strong socialdisadvantage)2 3 4 5 (no socialdisadvantage)Overview of reportThe assessment report beg<strong>in</strong>s with an <strong>in</strong>troduction to the concept of environmental health <strong>in</strong>equalities(Chapter 1). It presents the historic development of the approach and provides <strong>in</strong>sight <strong>in</strong>to theterm<strong>in</strong>ology and scientific concepts used. This <strong>in</strong>troduction will provide readers unfamiliar with theconcept of environmental health <strong>in</strong>equality with a basic understand<strong>in</strong>g of the field.The conceptual <strong>in</strong>troduction is followed by the three ma<strong>in</strong> chapters of the assessment report, present<strong>in</strong>gthe environmental health <strong>in</strong>equalities <strong>in</strong> the WHO <strong>Europe</strong>an Region. Chapter 2 looks at hous<strong>in</strong>grelated<strong>in</strong>equalities, cover<strong>in</strong>g those related to water and sanitation (water supply and sanitary equipmentwith<strong>in</strong> homes) as well as those related to the quality and size of the dwell<strong>in</strong>g (overcrowd<strong>in</strong>g, dampnessand thermal comfort). This is followed by Chapter 3 on <strong>in</strong>jury-related <strong>in</strong>equalities, which assesses theunequal distribution of work-related <strong>in</strong>juries and fatal traffic <strong>in</strong>juries, poison<strong>in</strong>gs and falls. Chapter 4then considers the <strong>in</strong>equalities <strong>in</strong> noise exposure, access to green and recreational areas, and secondhandsmoke exposure at home and at work. Each of these assessment chapters also <strong>in</strong>cludes a section onthe health relevance of the identified <strong>in</strong>equalities as well as ma<strong>in</strong> conclusions and suggested mitigationactions.The presentation of the f<strong>in</strong>d<strong>in</strong>gs is complemented by a review of the evidence gaps and the barriers toassess<strong>in</strong>g environmental health <strong>in</strong>equalities. Chapter 5 shows that the f<strong>in</strong>d<strong>in</strong>gs presented are far fromexhaustive and argues that there are still fundamental gaps <strong>in</strong> the evidence yet to be tackled.Chapter 6 then merges the f<strong>in</strong>d<strong>in</strong>gs to identify the patterns of and possible priority areas for action onenvironmental health <strong>in</strong>equality observed <strong>in</strong> the WHO <strong>Europe</strong>an Region. The assessment results arereviewed to highlight:• the ma<strong>in</strong> <strong>in</strong>equalities found <strong>in</strong> the <strong>Europe</strong>an subregions;• the countries fac<strong>in</strong>g the largest challenges of environmental health <strong>in</strong>equalities based on acomb<strong>in</strong>ation of the absolute magnitude of an environmental problem (prevalence levels or mortalityrates <strong>in</strong> the total population) and the magnitude of relative <strong>in</strong>equality between selected populationsubgroups.F<strong>in</strong>ally, the report concludes by summariz<strong>in</strong>g the most relevant key messages, and provides sixrecommendations for potential action.
8IntroductionComplement<strong>in</strong>g and extend<strong>in</strong>g the <strong>in</strong>ternational assessment report and its f<strong>in</strong>d<strong>in</strong>gs, three annex sectionsfocus on evidence, experiences and suggested priorities for action at the national level. Annex 1 presentsa national fact sheet for each of the 14 environmental health <strong>in</strong>equality <strong>in</strong>dicators and shows that properassessment of environmental health <strong>in</strong>equalities can be undertaken <strong>in</strong> all Member States of the WHO<strong>Europe</strong>an Region, irrespective of social or economic level. Annex 2 provides specific examples andexperiences from selected Member States, show<strong>in</strong>g steps and methods that can be applied to identifyand assess environmental health <strong>in</strong>equalities. Annex 3 presents <strong>in</strong> detail the assessment of suggestedpriorities for national action on range of environmental health <strong>in</strong>equality dimensions, as presented <strong>in</strong>Chapter 6.Methodological notesAs mentioned above, availability and consistency of data were the ma<strong>in</strong> challenges for putt<strong>in</strong>gtogether this assessment report. The variety of data formats and the available stratification options bysociodemographic determ<strong>in</strong>ants have also had an impact on the chapter contents. Table 1 above showsthat for each of the three <strong>in</strong>equality dimensions (hous<strong>in</strong>g, <strong>in</strong>jury and environment) different data sourceswere used for the assessment of environmental health <strong>in</strong>equalities. Rather than apply<strong>in</strong>g one commonmethodological approach to all <strong>in</strong>dicators, the authors have tried to adapt the analysis to the available<strong>in</strong>formation by choos<strong>in</strong>g the most practical analysis methods for the respective data. As a result, eachchapter has approached the assessment and presentation of the <strong>in</strong>equality situation slightly differently.Chapter-specific sections on the data and methods used <strong>in</strong>form the reader about the <strong>in</strong>formationavailable for the assessment, the associated constra<strong>in</strong>ts, and the methods applied.Nevertheless, throughout the assessment report, the authors have attempted to present two different<strong>in</strong>equality dimensions:• absolute dimensions of <strong>in</strong>equality, as shown by absolute differences <strong>in</strong>, for example, mortality ratesor environmental exposure prevalence levels between population groups;• relative dimensions of <strong>in</strong>equality (where appropriate), as shown by ratios compar<strong>in</strong>g, for example,the excess mortality <strong>in</strong> or prevalence of the most affected population group to the less affected or thetotal population, thus show<strong>in</strong>g the relative magnitude of <strong>in</strong>equality.While the authors believe that a complete assessment of environmental health <strong>in</strong>equalities must bebased on both absolute and relative <strong>in</strong>equality dimensions, the data sometimes made this approachdifficult <strong>in</strong> practical terms. Several examples shown <strong>in</strong> this assessment report <strong>in</strong>dicate that the highestrelative <strong>in</strong>equalities can often be found <strong>in</strong> countries where the overall prevalence of a given problem isvery low. Therefore, it is necessary to note that any relative expression of <strong>in</strong>equality always needs to be<strong>in</strong>terpreted <strong>in</strong> light of the overall prevalence situation, as well as the absolute differences between thecompared population groups. For example, if the overall prevalence of an environmental problem <strong>in</strong>the general population is 1%, the lowest-<strong>in</strong>come subgroups might have a prevalence of 5%, while thehighest-<strong>in</strong>come subgroups might have a prevalence of only 0.5%. The relative difference between these<strong>in</strong>come groups is then described by a ratio of 10:1, while the absolute difference is 4.5%. In comparison,countries with an overall prevalence of 10% <strong>in</strong> the general population rarely achieve such high relative<strong>in</strong>equality ratios. It should also be noted that the same absolute difference of 4.5% provides a ratio ofonly 1.45:1 if the population groups compared have prevalence levels of 14.5% and 10%. Bear<strong>in</strong>g this<strong>in</strong> m<strong>in</strong>d, it is clear that <strong>in</strong> countries where both the prevalence of an environmental problem and therelative contrast <strong>in</strong> prevalence between subgroups are high, political action is more urgently required.The sample sizes of the surveys used as data sources presented another constra<strong>in</strong>t. Many of these surveys(such as those coord<strong>in</strong>ated by Eurostat or Eurofound) are designed to provide nationally representativeestimates for a range of variables for the total population of the country. However, when analys<strong>in</strong>gsuch datasets from an <strong>in</strong>equality perspective, the data are divided <strong>in</strong>to population subgroups, quicklyreduc<strong>in</strong>g the respective sample size. For example, <strong>in</strong> the United K<strong>in</strong>gdom the sample size of households
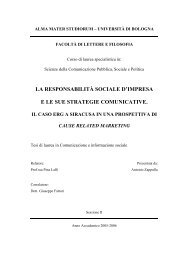
<strong>Environmental</strong> health <strong>in</strong>equalities <strong>in</strong> <strong>Europe</strong> 9participat<strong>in</strong>g <strong>in</strong> the Eurostat survey on EU Statistics on Income and Liv<strong>in</strong>g Conditions (EU-SILC)is 7500. Analys<strong>in</strong>g the effect, for example, of poverty (which may affect only 15% of the population) <strong>in</strong>s<strong>in</strong>gle-parent households (which may be 5% of all households) reduces this sample size to only 50–60households that represent s<strong>in</strong>gle-parent households liv<strong>in</strong>g <strong>in</strong> poverty. Similarly, the size of the respectivesample is affected by the prevalence level of a given environmental problem, with lower prevalence levelsreduc<strong>in</strong>g the sample size further. This makes the results less reliable and the f<strong>in</strong>d<strong>in</strong>gs less representativeof the general population.Another factor was the population size of the respective country: compared to the United K<strong>in</strong>gdom,which <strong>in</strong>cludes 7500 households <strong>in</strong> the EU-SILC survey, smaller countries such as Ireland and Estoniaprovide even smaller samples to start with (3750 and 3500 households respectively). Other surveys used,such as the Eurobarometer and <strong>Europe</strong>an Quality of Life Survey (EQLS), are based on even lowersample sizes. Therefore, the assessment of environmental <strong>in</strong>equalities between population subgroupsmay suffer from poor reliability. Nevertheless, these databases seem to be the only sources provid<strong>in</strong>gconsistent and comparable data for assessment of environmental health <strong>in</strong>equalities.A further challenge was that many of the <strong>in</strong>ternational databases are frequently updated. The ma<strong>in</strong>work on the assessment report was undertaken <strong>in</strong> 2011, all data hav<strong>in</strong>g been downloaded <strong>in</strong> spr<strong>in</strong>g 2011.F<strong>in</strong>al modifications and changes were made <strong>in</strong> late 2011 when data for 2010 started to become availablefor some (but not the majority of ) countries. Therefore, the <strong>in</strong>equality assessment is based on datareported for 2009 or, where this was not available, the last year of report<strong>in</strong>g for the respective countries.However, the lack of data for many countries, especially non-EU countries, is of much greater concern.In order not only to compare countries but also to assess the <strong>in</strong>equality conditions by geopoliticalsubregion, the data were aggregated to reflect four subregions of the WHO <strong>Europe</strong>an Region.Subregional categorization reflects the geographical and political situation as <strong>in</strong>dicated by Table 3 andMap 1. 5Table 3. <strong>Europe</strong>an subregions used for the assessmentSubregionCountry coverageEuro 1 (21 countries) All countries belong<strong>in</strong>g to the EU before May 2004 and western <strong>Europe</strong>an countries oncomparable developmental level (such as Norway and Switzerland)Euro 2 (12 countries) All countries jo<strong>in</strong><strong>in</strong>g the EU after May 2004Euro 3 (12 countries) All countries belong<strong>in</strong>g to the former Soviet Union (except the Baltic states)Euro 4 (8 countries) All countries <strong>in</strong> the south-east of the WHO <strong>Europe</strong>an Region <strong>in</strong>clud<strong>in</strong>g the Balkans, Turkeyand IsraelData from Eurostat, Eurobarometer and Eurofound, which cover only the EU countries and a fewadditional countries from the <strong>Europe</strong>an Free Trade Association or EU candidate countries, use thesubregional dist<strong>in</strong>ctions of “EU15” (for the 15 Member States belong<strong>in</strong>g to the EU before May 2004)and “NMS12” (for the 12 Member States jo<strong>in</strong><strong>in</strong>g the EU after May 2004). Total figures for all EUMember States are labelled “EU27”.For all figures and tables <strong>in</strong> this report, subregional terms such as “EU15” or “Euro 2”, for example,<strong>in</strong>dicate that all the respective countries <strong>in</strong> these subregions are covered by the data. If data from one ormore countries are miss<strong>in</strong>g, subregional terms “EU15 countries” or “Euro 2 countries” are used <strong>in</strong>stead,<strong>in</strong>dicat<strong>in</strong>g that the data are not based on all the countries with<strong>in</strong> the respective subregion.5 Euro 1: EU countries: Austria, Belgium, Denmark, F<strong>in</strong>land, France, Germany, Greece, Ireland, Italy, Luxembourg, Netherlands, Portugal, Spa<strong>in</strong>,Sweden, United K<strong>in</strong>gdom. Non-EU countries: Andorra, Iceland, Monaco, Norway, San Mar<strong>in</strong>o, Switzerland.Euro 2: Bulgaria, Cyprus, Czech Republic, Estonia, Hungary, Latvia, Lithuania, Malta, Poland, Romania, Slovakia, Slovenia.Euro 3: Armenia, Azerbaijan, Belarus, Georgia, Kazakhstan, Kyrgyzstan, Republic of Moldova, Russian Federation, Tajikistan, Turkmenistan,Ukra<strong>in</strong>e, Uzbekistan.Euro 4: Albania, Bosnia and Herzegov<strong>in</strong>a, Croatia, Israel, Montenegro, Serbia, the former Yugoslav Republic of Macedonia, Turkey.
10IntroductionMap 1. <strong>Europe</strong>an subregions used for the assessmentEuro 1Euro 2Euro 3Euro 4The aggregation of data for the <strong>Europe</strong>an subregions demonstrates another important restrictionencountered dur<strong>in</strong>g the assessment. Depend<strong>in</strong>g on the data source and the stratification of data, it wasvery difficult – and sometimes impossible – to derive accurate results for the subregions that would<strong>in</strong>corporate the population weight of the countries with<strong>in</strong> the respective region. For many <strong>in</strong>dicators,this would require a calculation of population subgroup sizes (by age group, sex, <strong>in</strong>come, and so on)for each country to be used as a weight<strong>in</strong>g factor <strong>in</strong> calculat<strong>in</strong>g the subregional average. In many cases– especially when comb<strong>in</strong><strong>in</strong>g several determ<strong>in</strong>ants – this proved impossible due to a lack of adequatedata. As a result, the f<strong>in</strong>d<strong>in</strong>gs presented for the subregions often represent the arithmetic average ofthe national rates of the countries covered by the respective subregion, not adjusted for the differentnational population sizes. In each figure, this restriction is clearly marked as the average of national ratesfor all report<strong>in</strong>g countries of the subregion. Subregional data that are representative (often provided byEurostat databases) do not <strong>in</strong>clude this <strong>in</strong>dication.Data accessSources of data are listed <strong>in</strong> the reference section of each chapter. National data tables downloadedfrom these sources <strong>in</strong> spr<strong>in</strong>g 2011 can be requested by email from the WHO <strong>Europe</strong>an Centre forEnvironment and <strong>Health</strong>. Please send your requests to <strong>in</strong>fo@ecehbonn.euro.who.<strong>in</strong>t, marked “NationalEH <strong>in</strong>equality data tables”.ReferencesBlas E, Sivasankara Kurup A, eds. (2010). Equity, social determ<strong>in</strong>ants and public health programmes. Geneva, <strong>World</strong><strong>Health</strong> <strong>Organization</strong> (http://whqlibdoc.who.<strong>in</strong>t/publications/2010/9789241563970_eng.pdf, accessed 13 April2011).Blas E, Sommerfeld J, Sivasankara Kurup A, eds. (2011). Social determ<strong>in</strong>ants approaches to public health: from conceptto practice. Geneva, <strong>World</strong> <strong>Health</strong> <strong>Organization</strong> (http://whqlibdoc.who.<strong>in</strong>t/publications/2011/9789241564137_eng.pdf, accessed 13 April 2011).Braubach M et al. (2010). On the way to Parma: understand<strong>in</strong>g and address<strong>in</strong>g the <strong>in</strong>fluence that social <strong>in</strong>equitieshave on environmental health. <strong>Europe</strong>an Journal of Public <strong>Health</strong> 20(1):12–13.CSDH (2008). Clos<strong>in</strong>g the gap <strong>in</strong> a generation: health equity through action on the social determ<strong>in</strong>ants of health. F<strong>in</strong>alreport of the Commission on Social Determ<strong>in</strong>ants of <strong>Health</strong>. Geneva, <strong>World</strong> <strong>Health</strong> <strong>Organization</strong> (http://whqlibdoc.who.<strong>in</strong>t/publications/2008/9789241563703_eng.pdf, accessed 13 April 2011).
<strong>Environmental</strong> health <strong>in</strong>equalities <strong>in</strong> <strong>Europe</strong> 11Dahlgren G, Whitehead M (2006). <strong>Europe</strong>an strategies for tackl<strong>in</strong>g social <strong>in</strong>equities <strong>in</strong> health: levell<strong>in</strong>g up, part 2.Copenhagen, WHO Regional Office for <strong>Europe</strong> (http://www.euro.who.<strong>in</strong>t/__data/assets/pdf_file/0018/103824/E89384.pdf, accessed 30 November 2011).M<strong>in</strong>istry of Social Affairs and <strong>Health</strong>, F<strong>in</strong>land (2006). <strong>Health</strong> <strong>in</strong> all policies: prospects and potentials. Hels<strong>in</strong>ki,M<strong>in</strong>istry of Social Affairs and <strong>Health</strong> (http://ec.europa.eu/health/archive/ph_<strong>in</strong>formation/documents/health_<strong>in</strong>_all_policies.pdf, accessed 22 November 2011).WHO (1946). Constitution of the <strong>World</strong> <strong>Health</strong> <strong>Organization</strong>. Geneva, <strong>World</strong> <strong>Health</strong> <strong>Organization</strong> (http://whqlibdoc.who.<strong>in</strong>t/hist/official_records/constitution.pdf, accessed 28 November 2011).WHO (1978). Declaration of Alma-Ata. Geneva, <strong>World</strong> <strong>Health</strong> <strong>Organization</strong> (http://www.who.<strong>in</strong>t/hpr/NPH/docs/declaration_almaata.pdf, accessed 28 November 2011).WHO (2009a). <strong>World</strong> <strong>Health</strong> Assembly Resolution WHA62.14. Reduc<strong>in</strong>g health <strong>in</strong>equities through action on the socialdeterm<strong>in</strong>ants of health. Geneva, <strong>World</strong> <strong>Health</strong> <strong>Organization</strong> (http://apps.who.<strong>in</strong>t/gb/ebwha/pdf_files/A62/A62_R14-en.pdf, accessed 28 November 2011).WHO (2009b). Environment and health risks: the <strong>in</strong>fluence and effects of social <strong>in</strong>equalities. Copenhagen, WHORegional Office for <strong>Europe</strong> (http://www.euro.who.<strong>in</strong>t/__data/assets/pdf_file/0020/115364/E93037.pdf, accessed13 April 2011).WHO (2010a). Social and gender <strong>in</strong>equalities <strong>in</strong> environment and health. Copenhagen, WHO Regional Office for<strong>Europe</strong> (http://www.euro.who.<strong>in</strong>t/__data/assets/pdf_file/0010/76519/Parma_EH_Conf_pb1.pdf, accessed 13April 2011).WHO (2010b). Environment and health risks: a review of the <strong>in</strong>fluence and effects of social <strong>in</strong>equalities. Copenhagen,WHO Regional Office for <strong>Europe</strong> (http://www.euro.who.<strong>in</strong>t/__data/assets/pdf_file/0003/78069/E93670.pdf ,accessed 13 April 2011).WHO (2010c). Parma Declaration on Environment and <strong>Health</strong>. Copenhagen, WHO Regional Office for <strong>Europe</strong>(http://www.euro.who.<strong>in</strong>t/__data/assets/pdf_file/0011/78608/E93618.pdf, accessed 13 April 2011).WHO (2010d). Towards environmental health <strong>in</strong>equality report<strong>in</strong>g. Report of an expert group meet<strong>in</strong>g, Bonn, Germany,25–26 October 2010. Copenhagen, WHO Regional Office for <strong>Europe</strong> (http://www.euro.who.<strong>in</strong>t/__data/assets/pdf_file/0013/130243/e94628.pdf, accessed 13 April 2011).WHO (2011a). Rio Political Declaration on Social Determ<strong>in</strong>ants of <strong>Health</strong>. Geneva, <strong>World</strong> <strong>Health</strong> <strong>Organization</strong>(http://www.who.<strong>in</strong>t/sdhconference/declaration/Rio_political_declaration.pdf, accessed 22 November 2011).WHO (2011b). Clos<strong>in</strong>g the gap: policy <strong>in</strong>to practice on social determ<strong>in</strong>ants of health: discussion paper. Geneva, <strong>World</strong><strong>Health</strong> <strong>Organization</strong> (http://www.who.<strong>in</strong>t/sdhconference/Discussion-Paper-EN.pdf, accessed 22 November2011).
CHAPTER1THE CONCEPT OFENVIRONMENTALHEALTH INEQUALITIES
14Chapter 1. The concept of environmental health <strong>in</strong>equalitiesChapter 1. The conceptof environmental health<strong>in</strong>equalitiesGeorge Morris, Matthias BraubachA historic perspectiveWhile priorities and emphases change over time and accord<strong>in</strong>g to location, the environmental healthapproach has traditionally centred on protection of population health through identify<strong>in</strong>g, monitor<strong>in</strong>gand controll<strong>in</strong>g the environmental hazards which produce disease <strong>in</strong> populations. The approach hasits orig<strong>in</strong>s <strong>in</strong> the earliest days of the modern public health movement and, by assur<strong>in</strong>g the qualityof domestic, community and occupational environments, has greatly extended lifespans and improvedhealth and well-be<strong>in</strong>g for communities and <strong>in</strong>dividuals. Underp<strong>in</strong>ned by advances <strong>in</strong> epidemiology andthe biological understand<strong>in</strong>g of disease, the disease-centred, hazard-focused approach to environmentalhealth rema<strong>in</strong>s a cornerstone of public health activity.It was clear even to the 19th-century public health pioneers that the degraded, malodorous neighbourhoodswhere lives were shortest and most blighted by disease were also home to the poorest communities.Recognition of the importance of environmental conditions for population health has always been, andcont<strong>in</strong>ues to be, accompanied by recognition of the <strong>in</strong>terplay between sociodemographic and physicalfactors <strong>in</strong> produc<strong>in</strong>g <strong>in</strong>equalities <strong>in</strong> health and well-be<strong>in</strong>g. The f<strong>in</strong>al report of the CSDH, Clos<strong>in</strong>g thegap <strong>in</strong> a generation (CSDH, 2008), re<strong>in</strong>forces the global relevance of this <strong>in</strong>terplay for the 21st century.Notably, the first of the report’s three pr<strong>in</strong>ciples of action to tackle social <strong>in</strong>equity <strong>in</strong> health is: “improvethe conditions of daily life – the circumstances <strong>in</strong> which people are born, grow, live, work, and age”.The report is suffused with references to the alignment of, and <strong>in</strong>terplay between, sociodemographic,economic and physical factors <strong>in</strong> ways which bear on health and equity. This re<strong>in</strong>forces the fact that thephysical environment – alongside the social environment and genetic endowment – is one key driver <strong>in</strong>the creation and destruction of health and well-be<strong>in</strong>g, and thus also a ma<strong>in</strong> driver for health <strong>in</strong>equalities.In summary, <strong>in</strong> the 150 years and more dur<strong>in</strong>g which there has been tangible <strong>in</strong>terest <strong>in</strong> populationhealth and action at the level of society to protect and improve it, <strong>in</strong>equalities <strong>in</strong> health between differentsocial groups have been an abid<strong>in</strong>g public health challenge. As the second decade of the 21st centurybeg<strong>in</strong>s, it could be argued that remarkable health ga<strong>in</strong>s delivered by adherence to a population focusare <strong>in</strong>creas<strong>in</strong>gly overshadowed by persist<strong>in</strong>g and <strong>in</strong>creas<strong>in</strong>g variability between and with<strong>in</strong> countries.Implicitly, the notable achievements of public health are not enjoyed by all. By extension, and despitea sometimes dim<strong>in</strong>ished political profile, differences <strong>in</strong> the physical context for people’s lives – referredto as environmental justice issues or environmental health <strong>in</strong>equalities – rema<strong>in</strong> central to the health<strong>in</strong>equalities challenge throughout the world.Acutely aware of this issue, m<strong>in</strong>isters and representatives of Member States of the WHO <strong>Europe</strong>anRegion came together <strong>in</strong> 2010 at the Fifth M<strong>in</strong>isterial Conference on Environment and <strong>Health</strong> <strong>in</strong>Parma, Italy, to chart the next steps <strong>in</strong> the <strong>Europe</strong>an environment and health process and, <strong>in</strong> the words ofthe Parma Declaration, “to face the key environment and health challenges of our time” (WHO, 2010).
<strong>Environmental</strong> health <strong>in</strong>equalities <strong>in</strong> <strong>Europe</strong> 15Listed among the key environment and health challenges on which they made a commitment to actwere: “the health risks to children and other vulnerable groups posed by poor environmental, work<strong>in</strong>gand liv<strong>in</strong>g conditions (especially the lack of water and sanitation)” and “socioeconomic and gender<strong>in</strong>equalities <strong>in</strong> the human environment and health”. Each of these reflects recognition at a politicallevel of the <strong>in</strong>terplay between social and environmental variables and the need to tackle each to createbetter and more equal health for all. Evidence providers <strong>in</strong> the scientific, medical and epidemiologicalcommunities also recognize shared agendas and methodological challenges and the need to work <strong>in</strong>partnership. There is, for example, both conceptual and methodological overlap between the activities ofenvironmental epidemiologists who study the effects of environmental exposures on health and disease<strong>in</strong> the population and social epidemiologists who often use social concepts to better understand andexpla<strong>in</strong> patterns of health <strong>in</strong> the population.Key message 1Sociodemographic <strong>in</strong>equalities <strong>in</strong> the exposure to environmental hazards exist everywhere and theyare not new. These <strong>in</strong>equalities can be expressed <strong>in</strong> relation to factors such as <strong>in</strong>come, education,employment, age, gender, race/ethnicity and specific locations or sett<strong>in</strong>gs.Inequality and <strong>in</strong>equityNotions of fairness versus unfairness and justice versus <strong>in</strong>justice now <strong>in</strong>form the language of public healthwhen speak<strong>in</strong>g about health differences between population subgroups. Like any type of <strong>in</strong>equality,<strong>in</strong>equalities <strong>in</strong> health and its determ<strong>in</strong>ants between different groups of people may, on one level, beregarded as natural and <strong>in</strong>evitable. An example might be differences <strong>in</strong> a range of health outcomesobserved between different demographic groups, such as the elderly versus the rest of the population.However, normally, when health <strong>in</strong>equalities are observed between socially def<strong>in</strong>ed groups, they aremore accurately described as “health <strong>in</strong>equities”. This term is now widely used to denote situations <strong>in</strong>which the distribution of health and its determ<strong>in</strong>ants is not simply unequal, but also unjust, unfair andavoidable (WHO, 2011).Viewed from an environmental health perspective, the differential exposure of groups of people tohealth-relevant aspects of environment (with potential to create and susta<strong>in</strong> differences <strong>in</strong> health status)can often simply be <strong>in</strong>equalities. This might be the case where a group of people chooses to live <strong>in</strong> apolluted city centre for reasons of convenience or chooses riverside homes – potentially more liable toflood<strong>in</strong>g – for aesthetic reasons or social status. However, the potential for differences <strong>in</strong> health outcomel<strong>in</strong>ked to environment may have little or noth<strong>in</strong>g to do with choice or biological variation and may haveits orig<strong>in</strong> <strong>in</strong> factors beyond the <strong>in</strong>fluence of those affected. Here the environmental health challenge isabout address<strong>in</strong>g health <strong>in</strong>equities that are unfair and avoidable.Key message 2The term “health <strong>in</strong>equalities” refers to general differences <strong>in</strong> health. Many of these differences(particularly where they are l<strong>in</strong>ked to social variables or gender) represent “health <strong>in</strong>equities” becausethey are unfair, unjust and avoidable.Identification and assessment of <strong>in</strong>equalities and <strong>in</strong>equitiesTo identify, assess, monitor and ultimately address environmental health <strong>in</strong>equalities and <strong>in</strong>equitiesassociated with sociodemographic determ<strong>in</strong>ants, it is necessary to develop appropriate measures ofenvironmental quality; this <strong>in</strong>cludes health-promot<strong>in</strong>g aspects of environment <strong>in</strong> relation to socialor demographic variables such as <strong>in</strong>come, education, employment, age, gender, race/ethnicity and
16Chapter 1. The concept of environmental health <strong>in</strong>equalitiesspecific locations or sett<strong>in</strong>gs. In practice, this creates a requirement for robust <strong>in</strong>dicators to illustrate therelationship between environmental health risk and different sociodemographic variables and permitbetter understand<strong>in</strong>g regard<strong>in</strong>g specific risk groups and their exposure. Such <strong>in</strong>dicators might be termed“<strong>in</strong>dicators of environmental health <strong>in</strong>equality”. Thus, the concentration of, for example, particulatematter <strong>in</strong> different areas might be related to the <strong>in</strong>come of people liv<strong>in</strong>g there to create an <strong>in</strong>dicator ofenvironmental health <strong>in</strong>equality. The potential to use such <strong>in</strong>dicators to better understand public healthproblems and to shape and evaluate the policy response is considerable. They permit an assessment andanalysis of the social distribution of exposure and impacts and allow comparison with<strong>in</strong> and betweennations which, when used constructively, can benefit all concerned. When used to assess environmentalhealth <strong>in</strong>equality with<strong>in</strong> nations, such <strong>in</strong>equality <strong>in</strong>dicators can tease out problems which mightotherwise be masked by average figures. Clearly, the importance a country attaches to deliver<strong>in</strong>g betterlife circumstances for its most disadvantaged groups, and its success <strong>in</strong> do<strong>in</strong>g so, can be considered atell<strong>in</strong>g <strong>in</strong>dicator of its political, social and economic development. This re<strong>in</strong>forces the value of <strong>in</strong>dicatorsof environmental health <strong>in</strong>equality <strong>in</strong> a broad context.Nevertheless, <strong>in</strong>dicators have no practical value unless they can be used to gather and process <strong>in</strong>formationabout environmental health <strong>in</strong>equalities <strong>in</strong> practice, and this demands data. In many locations the dataare simply absent, perhaps due to a lack of political will or resources to create the systems and structuresfor data generation. This may, of itself, be an <strong>in</strong>equality.Key message 3Robust <strong>in</strong>dicators of environmental health <strong>in</strong>equality that comb<strong>in</strong>e both social and environmentalfactors are needed, allow<strong>in</strong>g these <strong>in</strong>equalities to be identified, assessed and tackled.<strong>Environmental</strong> health <strong>in</strong>equality: hazard and risk<strong>Environmental</strong> health <strong>in</strong>equalities can result <strong>in</strong> many ways: a typical mechanism is when areas populatedby particular social groups have a greater concentration of environmental hazards and a scarcity orabsence of environmental “goods”. This will almost <strong>in</strong>evitably disadvantage or marg<strong>in</strong>alize populationsubgroups with certa<strong>in</strong> characteristics <strong>in</strong> relation to, for example, gender, ethnic orig<strong>in</strong>, occupation,<strong>in</strong>come level, urban versus rural location, and so on. This unequal distribution between social groupsis frequently described as an absence of “environmental justice” (Bullard, 2008; Curtice et al., 2005).However, the “distributive” element of environmental justice (which is about achiev<strong>in</strong>g more equaldistribution of hazards and goods between population groups) is <strong>in</strong>extricably bound up with a needto ensure that different groups have equal capacity to <strong>in</strong>fluence decisions about what is and is notsituated <strong>in</strong> their area. This second component of environmental justice is often termed “proceduraljustice” and a lack of procedural justice, <strong>in</strong> addition to the lack of distributive justice, often characterizessociodemographically disadvantaged groups.However, a comprehensive consideration of the role of sociodemographic factors <strong>in</strong> environmentalhealth <strong>in</strong>equality must look above and beyond <strong>in</strong>dividual components of environmental justice toconsider how a range of sociodemographic variables can modify not only the presence or absence ofenvironmental hazards but also the <strong>in</strong>dividual risk of exposure and associated health consequences.Look<strong>in</strong>g more closely at the <strong>in</strong>fluence of sociodemographic factors on environmental risk for the<strong>in</strong>dividual, it can readily be appreciated that factors such as age, gender, SES and <strong>in</strong>deed culture mayhave quite a profound <strong>in</strong>fluence on whether an <strong>in</strong>dividual chooses to be physically active or not, orto behave <strong>in</strong> a way which results <strong>in</strong> higher or lower exposure to a hazardous aspect of environment.There is a need to recognize that where sociodemographic factors <strong>in</strong>fluence <strong>in</strong>dividual opportunity,empowerment and dignity, they may critically <strong>in</strong>fluence an <strong>in</strong>dividual’s decision, for example, to bephysically active or avoid harmful exposures. It is evident that there is a socially-mediated mechanismthat affects the <strong>in</strong>dividual risk exposure. In any case, all dimensions of environmental health <strong>in</strong>equalityare of equivalent policy relevance.
<strong>Environmental</strong> health <strong>in</strong>equalities <strong>in</strong> <strong>Europe</strong> 17Key message 4There are sociodemographically determ<strong>in</strong>ed <strong>in</strong>equalities <strong>in</strong> population-level environmental hazardbut, because sociodemographic factors may also modify <strong>in</strong>dividual exposure and the health impactfor the same degree of exposure, there may also be sociodemographically determ<strong>in</strong>ed <strong>in</strong>equalities <strong>in</strong><strong>in</strong>dividual environmental health risk. Each level needs to be identified and assessed.Sociodemographic factors, exposure and vulnerabilityAs described above, <strong>in</strong>equalities <strong>in</strong> environmental conditions and the lack of distributive justice regard<strong>in</strong>gthe location of environmental hazards lead to a greater probability of exposure to environmental healththreats. Indeed, a wide range of surveys have shown that marg<strong>in</strong>alized and disadvantaged groups –irrespective of the type of disadvantage, which can be education- or <strong>in</strong>come-related as well as genderspecificor associated with ethnicity – are most often characterized as hav<strong>in</strong>g the highest levels ofexposure to environmental problems.It is further recognized that the same degree of environmental exposure can result <strong>in</strong> a greater healthimpact when borne by a disadvantaged population; this may be due to a lower ability to respond to theenvironmental stress, perhaps exacerbated by other health pressures lead<strong>in</strong>g to synergistic effects. Forexample, sociodemographic and other factors can <strong>in</strong>fluence whether, hav<strong>in</strong>g been exposed to a healthdeterm<strong>in</strong><strong>in</strong>genvironmental factor, an <strong>in</strong>dividual goes on to experience a particular health outcome, andto what extent (the “exposure–response function”). The capacity for age, gender, genetic <strong>in</strong>heritance,pre-exist<strong>in</strong>g illness or psychosocial stress – s<strong>in</strong>gly or <strong>in</strong> jo<strong>in</strong>t <strong>in</strong>teraction – to <strong>in</strong>fluence the exposure–response function is well understood <strong>in</strong> many cases.Key message 5Sociodemographic <strong>in</strong>equalities can be caused by differences <strong>in</strong> exposure to environmental risks(exposure differential), as well as by social or demographic differences <strong>in</strong> vulnerability towards certa<strong>in</strong>risks (vulnerability differential).The psychosocial dimension <strong>in</strong> environmental health <strong>in</strong>equalityIn recent times, observation of and scientific <strong>in</strong>terest <strong>in</strong> the vulnerability differential between differentsociodemographic groups have led researchers to consider the role played by psychosocial stress.Psychosocial stress may have a number of orig<strong>in</strong>s but may be directly l<strong>in</strong>ked to social and physicalcharacteristics of the places where people live. It is <strong>in</strong>creas<strong>in</strong>gly seen as a key factor <strong>in</strong> determ<strong>in</strong><strong>in</strong>g<strong>in</strong>dividual vulnerability to environmental hazards (Gee, Payne-Sturges, 2004). Psychosocial stressproduces acute and chronic changes <strong>in</strong> the function<strong>in</strong>g of body systems such as those govern<strong>in</strong>g immuneand <strong>in</strong>flammatory response, lead<strong>in</strong>g directly to illness or perhaps render<strong>in</strong>g <strong>in</strong>dividuals more vulnerablewhen exposed to, for example, a toxic environment. This may be particularly important <strong>in</strong> the absence ofany counterbalanc<strong>in</strong>g effect from positive life circumstances and resources. Reflect<strong>in</strong>g on the significanthealth <strong>in</strong>equalities challenge <strong>in</strong> Scotland and on the role of the physical environment, Scotland’s ChiefMedical Officer emphasized the importance of the psychosocial dimension when he observed that“how people feel about their physical surround<strong>in</strong>gs, can impact on not just mental health and wellbe<strong>in</strong>g,but also physical disease” (Scottish Government, 2007).Key message 6People’s perceptions of the physical aspects of the places they live <strong>in</strong> can profoundly impact on theirmental and physical health and their longevity.
18Chapter 1. The concept of environmental health <strong>in</strong>equalitiesFram<strong>in</strong>g the problemDur<strong>in</strong>g the meet<strong>in</strong>g of an expert group on environmental health <strong>in</strong>equalities held <strong>in</strong> Bonn <strong>in</strong> September2009 (WHO, 2009), attendees discussed a WHO contextual framework (see Fig. 2) which seeks tostructure and identify potential pathways through which sociodemographic variables <strong>in</strong>fluence:• the nature and distribution of environmental conditions;• the exposure to these conditions for <strong>in</strong>dividuals and groups with<strong>in</strong> society;• the exposure–response relationships which lead to different health outcomes <strong>in</strong> <strong>in</strong>dividuals withcomparable exposures;• access to, and quality of, health-related services.The framework offers a useful, holistic approach to fram<strong>in</strong>g issues <strong>in</strong> environmental health, reflect<strong>in</strong>ggrow<strong>in</strong>g enthusiasm for more <strong>in</strong>tegrated policy-relevant strategies for analys<strong>in</strong>g complex multifactorialenvironmental health issues. This tendency is stimulated by the <strong>in</strong>creas<strong>in</strong>g aspiration to anticipate andmitigate the likely health implications of policies <strong>in</strong> all sectors of civil society (sometimes referred toas the HiAP agenda). The framework attempts to make explicit to policy- and other decision-makersthat better, more equal environmental health for <strong>in</strong>dividuals and communities requires attention toenvironmental factors and sociodemographic conditions, as well as to how these <strong>in</strong>fluences <strong>in</strong>terrelate.The framework suggests four major pathways through which sociodemographic <strong>in</strong>equalities may<strong>in</strong>fluence exposure to and health outcomes from environmental risks.• Arrow 1: there is a relationship between sociodemographic determ<strong>in</strong>ants and environmentalconditions. Disadvantaged groups may live and work <strong>in</strong>, or be surrounded by, less favourableenvironmental conditions than the general population, result<strong>in</strong>g <strong>in</strong> higher exposure risk.• Arrow 2: factors attributed to sociodemographic <strong>in</strong>equalities (such as knowledge and healthbehaviour) compound exposure. Given the same environmental conditions, disadvantaged groupsmay be more exposed than the general population.• Arrow 3: factors attributed to sociodemographic <strong>in</strong>equalities (such as health status and biologicalsensitivity) <strong>in</strong>fluence the exposure–response function. Given the same exposure, disadvantagedgroups may be more vulnerable to adverse health effects than the general population.• Arrow 4: sociodemographic <strong>in</strong>equalities have a direct impact on health outcomes, which may operatethrough many mechanisms – some environmental, some <strong>in</strong>dependent of environmental factors.However, given the same exposure–response situation, disadvantaged groups may also be morevulnerable to adverse health effects than the general population (through, for example, <strong>in</strong>adequate<strong>in</strong>surance, reduced health services use or reduced access to services).Arrows 1 and 2 together represent the exposure differential, describ<strong>in</strong>g the <strong>in</strong>creased exposure risk, whileArrow 3 represents the vulnerability differential, account<strong>in</strong>g for an <strong>in</strong>creased translation of environmentalexposure conditions <strong>in</strong>to negative health effects.The generic framework may be populated for different environmental health issues but the utility ofFig. 2 is perhaps best illustrated by example. An ostensibly straightforward environmental health issue,such as the risk of serious health effects and even death from carbon monoxide (CO) poison<strong>in</strong>g <strong>in</strong> thehome, can be expanded us<strong>in</strong>g the framework to illustrate its many components and the array of policyoptions it presents.Briefly, particular sociodemographic groups – such as the elderly and those on a low <strong>in</strong>come – may bemore likely to occupy low-quality hous<strong>in</strong>g, possibly with poorly ma<strong>in</strong>ta<strong>in</strong>ed gas or solid fuel heat<strong>in</strong>gsystems, thus illustrat<strong>in</strong>g the potential for sociodemographic factors to create differential exposureto CO. The elderly and cognitively impaired and those with limited education may, <strong>in</strong> turn, possessless knowledge or understand<strong>in</strong>g of the hazard of CO, yet may actually spend longer <strong>in</strong> the homeenvironment and, <strong>in</strong> a struggle to keep warm on a limited <strong>in</strong>come, may deliberately limit ventilationto save on fuel costs. These additional factors illustrate the potential <strong>in</strong>fluence of sociodemographic
<strong>Environmental</strong> health <strong>in</strong>equalities <strong>in</strong> <strong>Europe</strong> 19variables on exposure to CO, and hence the risk to an <strong>in</strong>dividual or demographic group. To furthercompound the risk, the elderly may exhibit particular vulnerability to the health impacts of CO dueto pre-exist<strong>in</strong>g illness or impaired cardio-respiratory function, thus illustrat<strong>in</strong>g that sociodemographicfactors may also <strong>in</strong>fluence <strong>in</strong>dividual vulnerability. F<strong>in</strong>ally, sociodemographic factors may align withfactors such as <strong>in</strong>adequate health <strong>in</strong>surance, or reduced access to or use of health services, which mayaffect the effectiveness of medical treatment.Fig. 2. The WHO framework model on social <strong>in</strong>equalities and environmental risksDriv<strong>in</strong>g forcesMacroeconomic context: <strong>in</strong>creas<strong>in</strong>g social disparities and stratification<strong>Inequalities</strong> by sociodemographic determ<strong>in</strong>ants(<strong>in</strong>come, education, age, occupation, migrant status, gender, etc.)1 2 3 4Effect modifiers<strong>Environmental</strong>conditionsExposureExposure–responsefunction<strong>Health</strong> effectsand costs<strong>Environmental</strong> protection<strong>Health</strong> protection/educationPreventive environmental andhealth servicesIndividualsusceptibilityAccess to/qualityof health servicesPublic, health and social services/health systemStakeholders and HiAP actors(environment, hous<strong>in</strong>g, transport, social, etc.)Source: modified, based on WHO (2009).Key message 7It is important to take a holistic approach to fram<strong>in</strong>g equity problems <strong>in</strong> environmental and humanhealth if the complexity of the challenge and the policy options are to be revealed.ConclusionThere is strong justification for work to establish <strong>in</strong>dicators and report<strong>in</strong>g systems that relate healthrelevantenvironmental factors to <strong>in</strong>dividual or multiple sociodemographic variables with an appropriateresolution, such as at a small geographical scale. These <strong>in</strong>dicators are a necessary resource for work toimprove understand<strong>in</strong>g, report<strong>in</strong>g, assess<strong>in</strong>g and ultimately act<strong>in</strong>g on environmental health <strong>in</strong>equalitiesand the wider challenge of social complexity <strong>in</strong> environmental public health. There is also strongjustification for keep<strong>in</strong>g under review, and extend<strong>in</strong>g where <strong>in</strong>dicated, the range of environmentalvariables which should be l<strong>in</strong>ked to sociodemographic variables. Equity-sensitive environmentalmonitor<strong>in</strong>g and report<strong>in</strong>g should <strong>in</strong> future extend its scope to <strong>in</strong>clude environmental factors whichare potentially health-nurtur<strong>in</strong>g and represent a health resource rather than a health risk. Similarly,<strong>in</strong>tegration of aspects of physical environments or places which generate negative psychosocial responsesis also important.
20Chapter 1. The concept of environmental health <strong>in</strong>equalitiesIncreas<strong>in</strong>g reference to the concept of “place” and “healthy places” <strong>in</strong> public health circles representsrecognition of the <strong>in</strong>terplay of social, demographic, economic and cultural factors at the neighbourhoodlevel and the need to ensure that these are jo<strong>in</strong>tly managed to create better and more equal health. Suchan approach is a significant enrichment of the hazard-focused traditions of environmental public health.F<strong>in</strong>ally, the current environmental changes and erosion of natural resources l<strong>in</strong>ked to climate change,and the policies put <strong>in</strong> place to mitigate and adapt to them, are likely to impact differentially onsociodemographic groups, exacerbat<strong>in</strong>g environmental health <strong>in</strong>equalities and further re<strong>in</strong>forc<strong>in</strong>g thecase for appropriate <strong>in</strong>dicators and report<strong>in</strong>g structures of environmental health <strong>in</strong>equality.The development and application of environmental health <strong>in</strong>equality <strong>in</strong>dicators for the WHO<strong>Europe</strong>an Region – as presented <strong>in</strong> this report – permits a first basel<strong>in</strong>e assessment of environmentalhealth <strong>in</strong>equalities. This, <strong>in</strong> turn, has the potential to <strong>in</strong>form policy and action and to chart progress <strong>in</strong>tackl<strong>in</strong>g the environmental dimension of sociodemographic <strong>in</strong>equalities <strong>in</strong> health.Key message 8The range of environmental health <strong>in</strong>equality <strong>in</strong>dicators should cont<strong>in</strong>ue to reflect the nature ofenvironmental health threats. The assessment of environmental <strong>in</strong>equalities, therefore, should bedynamic and based on frequently updated <strong>in</strong>equality <strong>in</strong>dicators.ReferencesBullard RD (2008). <strong>Environmental</strong> justice <strong>in</strong> the 21st century. Atlanta, GA, <strong>Environmental</strong> Justice Resource Centerat Clark Atlanta University (http://www.ejrc.cau.edu/ej<strong>in</strong>the21century.htm, accessed 3 October 2011).CSDH (2008). Clos<strong>in</strong>g the gap <strong>in</strong> a generation: health equity through action on the social determ<strong>in</strong>ants of health. F<strong>in</strong>alreport of the Commission on Social Determ<strong>in</strong>ants of <strong>Health</strong>. Geneva, <strong>World</strong> <strong>Health</strong> <strong>Organization</strong> (http://whqlibdoc.who.<strong>in</strong>t/publications/2008/9789241563703_eng.pdf, accessed 5 June 2011).Curtice J et al. (2005). Public attitudes and environmental justice <strong>in</strong> Scotland: a report for the Scottish Executive onresearch to <strong>in</strong>form the development and evaluation of environmental justice policy. Ed<strong>in</strong>burgh, Scottish Executive(http://www.scotland.gov.uk/Resource/Doc/77843/0018790.pdf, accessed 5 June 2011).Gee GC, Payne-Sturges DC (2004). <strong>Environmental</strong> health disparities: a framework <strong>in</strong>tegrat<strong>in</strong>g psychosocial andenvironmental concepts. <strong>Environmental</strong> <strong>Health</strong> Perspectives, 112(17):1645–1653 (http://www.ncbi.nlm.nih.gov/pmc/articles/PMC1253653/, accessed 18 September 2011).Scottish Government (2007). <strong>Health</strong> <strong>in</strong> Scotland 2006: annual report of the Chief Medical Officer. Ed<strong>in</strong>burgh, ScottishGovernment (http://www.scotland.gov.uk/Resource/Doc/203463/0054202.pdf, accessed 3 October 2011).WHO (2009). Socioeconomic <strong>in</strong>equalities – scenarios, recommendations and tools for action. Background document for theThird High-Level Preparatory Meet<strong>in</strong>g. Copenhagen, WHO Regional Office for <strong>Europe</strong> (http://www.euro.who.<strong>in</strong>t/Document/EEHC/29th_EEHC__Bonn_edoc15.pdf, accessed 15 October 2009).WHO (2010). Parma Declaration on Environment and <strong>Health</strong>. Copenhagen, WHO Regional Office for <strong>Europe</strong>(http://www.euro.who.<strong>in</strong>t/__data/assets/pdf_file/0011/78608/E93618.pdf, accessed 3 August 2011).WHO (2011). <strong>Health</strong> impact assessment: glossary of terms used. Geneva, <strong>World</strong> <strong>Health</strong> <strong>Organization</strong> (http://www.who.<strong>in</strong>t/hia/about/glos/en/<strong>in</strong>dex1.html, accessed 3 October 2011).
22Chapter 2. Hous<strong>in</strong>g-related <strong>in</strong>equalitiesChapter 2. Hous<strong>in</strong>g-related<strong>in</strong>equalitiesSéver<strong>in</strong>e Deguen, Lucia Isabel Fiestas and Denis Zmirou-NavierKey messagesGenerally:• with<strong>in</strong> the EU, the NMS12 countries are more affected by substandard hous<strong>in</strong>g than the EU15countries;• for countries beyond the EU, no adequate data (except on water supply) were available, butpublished literature <strong>in</strong>dicates that the hous<strong>in</strong>g situation is worse than <strong>in</strong> the NMS12 countries;• <strong>in</strong>equalities have been found <strong>in</strong> all <strong>Europe</strong>an countries with available data;• subgroups of low-<strong>in</strong>come population and s<strong>in</strong>gle-parent households have been identified as moreexposed to poor hous<strong>in</strong>g conditions <strong>in</strong> all countries;• poverty <strong>in</strong>creases the level of <strong>in</strong>equality among s<strong>in</strong>gle-parent households.More specifically:• <strong>in</strong>adequate water supply is ma<strong>in</strong>ly an issue <strong>in</strong> Euro 3 and Euro 4 countries;• rural populations are more exposed to <strong>in</strong>adequate water supply than urban populations;• the lack of a flush toilet and bath or shower is most prevalent <strong>in</strong> less wealthy countries;• lower-<strong>in</strong>come households, and particularly low-<strong>in</strong>come s<strong>in</strong>gle-parent households, are most likelyto lack a flush toilet and lack a bath or shower;• a low <strong>in</strong>come <strong>in</strong>creases the risk of liv<strong>in</strong>g <strong>in</strong> overcrowded hous<strong>in</strong>g, particularly among s<strong>in</strong>gleparenthouseholds;• liv<strong>in</strong>g <strong>in</strong> a damp dwell<strong>in</strong>g is a hous<strong>in</strong>g issue <strong>in</strong> both the EU15 and NMS12 countries;• low-<strong>in</strong>come subgroups are more exposed to damp dwell<strong>in</strong>gs, especially <strong>in</strong> the NMS12 countries,where a substantial gap exists between the lowest <strong>in</strong>come qu<strong>in</strong>tile and the higher ones;• there is a high prevalence of <strong>in</strong>ability to keep the home warm <strong>in</strong> most <strong>Europe</strong>an countries,especially among s<strong>in</strong>gle-parent households and low-<strong>in</strong>come population groups;• <strong>in</strong>ability to keep the home cool <strong>in</strong> summer – even more prevalent <strong>in</strong> the population than <strong>in</strong>abilityto keep the home warm <strong>in</strong> w<strong>in</strong>ter – also shows <strong>in</strong>come-related <strong>in</strong>equalities, although they are lessstrongly expressed than those for keep<strong>in</strong>g the home warm.
<strong>Environmental</strong> health <strong>in</strong>equalities <strong>in</strong> <strong>Europe</strong> 23IntroductionAwareness of socioeconomic health <strong>in</strong>equalities has recently put this topic on the priority list whendraft<strong>in</strong>g public health policies. It is well known that populations privileged by advanced education,greater <strong>in</strong>come, higher-status jobs and better quality hous<strong>in</strong>g standards are <strong>in</strong> better health. Hous<strong>in</strong>g andneighbourhood quality improvement has historically been a key policy <strong>in</strong>strument to improve health(Howden-Chapman, 2002). Hous<strong>in</strong>g <strong>in</strong> particular has been recognized as an important parameteraffect<strong>in</strong>g population well-be<strong>in</strong>g and health (Bonnefoy, 2007; Braubach and Fairburn, 2010; Poort<strong>in</strong>ga,Dunstan and Fone, 2008). One reason for this is that a high proportion – approximately two thirds– of time is spent <strong>in</strong> the home (Bernste<strong>in</strong> et al., 2008). This proportion varies across countries and iseven greater for vulnerable population subgroups such as the elderly, children – at 80–90% of the day(Breysse et al., 2004) – and deprived people, who may be unemployed or have few external activities.Furthermore, less affluent populations are more often affected by <strong>in</strong>adequate hous<strong>in</strong>g conditions(Braubach and Fairburn, 2010).Inadequate hous<strong>in</strong>g conditions generate health <strong>in</strong>equalities through two ma<strong>in</strong> pathways. First, froman environmental epidemiology perspective, the term “hous<strong>in</strong>g conditions” may be used as a proxy forenvironmental exposures <strong>in</strong>fluenc<strong>in</strong>g health <strong>in</strong> the home, such as <strong>in</strong>door air quality, noise or humidity.Second, it can be an <strong>in</strong>dicator of socioeconomic determ<strong>in</strong>ants of health: poor hous<strong>in</strong>g conditions are aconsequence of a disadvantaged situation. Hous<strong>in</strong>g prices vary greatly geographically and consequentlythe quality of hous<strong>in</strong>g and of its local environment is both directly and <strong>in</strong>directly associated with <strong>in</strong>come,or more generally with SES (Braubach and Fairburn, 2010; Galobardes et al., 2006).It is important to note that exposure <strong>in</strong>equalities may occur at multiple levels: at an <strong>in</strong>dividual level (suchas personal or household <strong>in</strong>come, or substandard hous<strong>in</strong>g) and at a geographical, or ecological, level(such as average neighbourhood <strong>in</strong>come, or proportion of <strong>in</strong>adequate hous<strong>in</strong>g <strong>in</strong> the neighbourhood).The analysis <strong>in</strong> this chapter focuses only on <strong>in</strong>formation regard<strong>in</strong>g <strong>in</strong>dividuals and households.Associations between <strong>in</strong>adequate hous<strong>in</strong>g and health have been revealed us<strong>in</strong>g a variety of approachesand <strong>in</strong>dicators. Liv<strong>in</strong>g conditions affect both physical and mental health. Data collected by WHO oneight <strong>Europe</strong>an countries confirm that <strong>in</strong>adequate hous<strong>in</strong>g conditions are associated with risk factorssuch as moulds or overcrowd<strong>in</strong>g, especially <strong>in</strong> low-<strong>in</strong>come households (Braubach and Fairburn, 2010).Several researchers have found associations between <strong>in</strong>door environmental exposures <strong>in</strong>clud<strong>in</strong>g dampnessand a variety of adverse respiratory diseases, such as risk of asthma, pulmonary <strong>in</strong>fections and allergies(Krieger and Higg<strong>in</strong>s, 2002; Sandel and Wright, 2006). Damp houses provide a nurtur<strong>in</strong>g environmentfor mites, roaches, respiratory viruses and moulds known to play an important role <strong>in</strong> respiratory diseasepathogenesis. For this reason, poor <strong>in</strong>door air has been advanced as a way of expla<strong>in</strong><strong>in</strong>g the recent<strong>in</strong>crease <strong>in</strong> prevalence of respiratory health problems <strong>in</strong> many developed countries (Rauh, Landriganand Claudio, 2008).In addition, overcrowd<strong>in</strong>g and lack of hygiene and sanitation equipment are relevant health hazardsfound <strong>in</strong> dwell<strong>in</strong>gs. Overcrowd<strong>in</strong>g has long been associated with the transmission of tuberculosis andrespiratory <strong>in</strong>fections. In recent years, epidemiological studies have revealed an <strong>in</strong>creased risk of chronicdiseases for those liv<strong>in</strong>g <strong>in</strong> substandard hous<strong>in</strong>g (Krieger and Higg<strong>in</strong>s, 2002) and documented thatpoor liv<strong>in</strong>g environments – <strong>in</strong>clud<strong>in</strong>g overcrowd<strong>in</strong>g, <strong>in</strong>adequate garbage removal or location near busytransportation routes – may generate chronic stress (Rauh, Landrigan and Claudio, 2008).Low <strong>in</strong>door temperature is associated with lower health status, and particularly with cardiovasculardisease (Krieger and Higg<strong>in</strong>s, 2002). A synthesis of <strong>in</strong>tervention studies reviewed several reportsassess<strong>in</strong>g changes <strong>in</strong> health follow<strong>in</strong>g hous<strong>in</strong>g improvements (Thomson, 2011). These confirmed thathous<strong>in</strong>g <strong>in</strong>tervention programmes target<strong>in</strong>g thermal comfort improved health – <strong>in</strong>clud<strong>in</strong>g mentalhealth – and social outcomes considerably (Shortt and Rugkåsa, 2007). The association betweendegraded hous<strong>in</strong>g characterized by poor thermal efficiency and high levels of excess w<strong>in</strong>ter or summermortality has also been documented (Braubach and Fairburn, 2010). Homes of low-<strong>in</strong>come <strong>in</strong>dividualsare more likely to be too cold (or too warm <strong>in</strong> summer) because of <strong>in</strong>sufficient <strong>in</strong>sulation and lack of air
24Chapter 2. Hous<strong>in</strong>g-related <strong>in</strong>equalitiescondition<strong>in</strong>g. In summary, substandard hous<strong>in</strong>g is not evenly distributed across space and population;disadvantaged groups are disproportionately affected. In some cases, low-<strong>in</strong>come households even haveto make tradeoffs between hav<strong>in</strong>g enough food and liv<strong>in</strong>g <strong>in</strong> adequate hous<strong>in</strong>g conditions (Krieger andHigg<strong>in</strong>s, 2002).Data and methodsData from the WHO/UNICEF Jo<strong>in</strong>t Monitor<strong>in</strong>g Programme ( JMP) for Water Supply and Sanitation(2011) were used to analyse <strong>in</strong>equalities <strong>in</strong> <strong>in</strong>adequate water supply. Data are available for all 53 MemberStates of the WHO <strong>Europe</strong>an Region, collected <strong>in</strong> five different years: 1990, 1995, 2000, 2005 and2008. Population with <strong>in</strong>adequate water supply is def<strong>in</strong>ed as the percentage of the population suppliedwith water from unimproved sources (water supply that, by nature of its construction or through active<strong>in</strong>tervention, is not protected from outside contam<strong>in</strong>ation – <strong>in</strong> particular from contam<strong>in</strong>ation withfaecal matter – such as surface water or water from unprotected wells or spr<strong>in</strong>gs). Unfortunately, theWHO/UNICEF JMP data available up to 2008 do not <strong>in</strong>clude data on <strong>in</strong>dividuals (such as gender or<strong>in</strong>come) and only dist<strong>in</strong>guish between urban and rural areas. However, as the recent JMP data collectionwave (2010 data to be released soon) <strong>in</strong>cludes <strong>in</strong>formation on water and sanitation supply by <strong>in</strong>comedecile, more detailed assessment of these data will soon be possible.A bar chart show<strong>in</strong>g the proportion of the population with <strong>in</strong>adequate water supply for urban and ruralareas with<strong>in</strong> each country and subregion was created for the year 2008. Additionally, a time trend graphwas drawn to represent the evolution of the prevalence of <strong>in</strong>adequate water supply <strong>in</strong> rural areas <strong>in</strong> theWHO <strong>Europe</strong>an Region, to detect whether the situation had improved dur<strong>in</strong>g the last 20 years.For the water <strong>in</strong>equality <strong>in</strong>dicator, the data were disaggregated by subregions Euro 1 to Euro 4 topresent results for the different subregions.Data for analysis of the five other hous<strong>in</strong>g <strong>in</strong>equality <strong>in</strong>dicators were retrieved from EU-SILC database(2011). Data were available from 2004 to 2009 and were downloaded from March to May 2011.Information was reported by 30 countries <strong>in</strong> 2009, but the number of countries repeatedly report<strong>in</strong>gover time between 2004 and 2009 was lower, so it was not possible to assess time trends for a varietyof countries. As a result, only data from the latest year, 2009, were studied. The five hous<strong>in</strong>g <strong>in</strong>equality<strong>in</strong>dicators covered <strong>in</strong> this report are:• lack of flush toilet <strong>in</strong> the dwell<strong>in</strong>g, based on EU-SILC question “Is there an <strong>in</strong>door flush<strong>in</strong>g toilet<strong>in</strong> your dwell<strong>in</strong>g?” with answer options Yes and No;• lack of bath or shower, based on EU-SILC question “Is there a shower unit or a bathtub <strong>in</strong> yourdwell<strong>in</strong>g?” with answer options Yes and No;• overcrowd<strong>in</strong>g, based on the follow<strong>in</strong>g Eurostat def<strong>in</strong>ition: “a person is considered as liv<strong>in</strong>g <strong>in</strong> anovercrowded household if the household does not have at its disposal a m<strong>in</strong>imum of rooms equalto one room for the household, one room per couple <strong>in</strong> the household, one room for each s<strong>in</strong>gleperson aged 18 or more, one room per pair of s<strong>in</strong>gle people of the same gender between 12 and 17years of age, one room for each s<strong>in</strong>gle person between 12 and 17 years of age and not <strong>in</strong>cluded <strong>in</strong> theprevious category, and one room per pair of children under 12 years of age”;• dampness <strong>in</strong> the home, based on EU-SILC question “Do you have any of the follow<strong>in</strong>g problemswith your dwell<strong>in</strong>g/accommodation: a leak<strong>in</strong>g roof, damp walls/floors/foundation, or rot <strong>in</strong> w<strong>in</strong>dowframes or floor?” with answer options Yes and No;• <strong>in</strong>ability to keep the home adequately warm, based on EU-SILC question “Can your householdafford to keep its home adequately warm?” with answer options Yes and No.To complement the <strong>in</strong>equality <strong>in</strong>dicator on thermal comfort <strong>in</strong> w<strong>in</strong>ter, data from an EU-SILC rotationmodule question “Is the dwell<strong>in</strong>g comfortably cool dur<strong>in</strong>g summer time?” with answer options Yes andNo (only asked <strong>in</strong> 2007) were also used and are discussed <strong>in</strong> an additional section.
<strong>Environmental</strong> health <strong>in</strong>equalities <strong>in</strong> <strong>Europe</strong> 25The EU-SILC data were stratified by four socioeconomic characteristics: age, <strong>in</strong>come level reflect<strong>in</strong>grelative poverty status, household type and sex. The age variable was divided <strong>in</strong>to three groups: less than18 years, between 18 and 64 years and over 65 years. The <strong>in</strong>come variable was divided <strong>in</strong>to populationbelow and above relative poverty status (def<strong>in</strong>ed as household <strong>in</strong>come below or above 60% of themedian <strong>in</strong>come for the respective country). Upon specific request, Eurostat provided additional dataon <strong>in</strong>come qu<strong>in</strong>tiles for some of the hous<strong>in</strong>g <strong>in</strong>equality <strong>in</strong>dicators. The household type variable had16 categories, but only three were used <strong>in</strong> this analysis: “households with dependent children”, “s<strong>in</strong>gleparenthouseholds with dependent children” and “s<strong>in</strong>gle households with one adult older than 65 years”.Analysis by sex stratification was not relevant because most households – except s<strong>in</strong>gle and s<strong>in</strong>gleparenthouseholds – are composed of a somewhat similar number of males and females so that statisticalanalysis rarely results <strong>in</strong> significant differences.For the five hous<strong>in</strong>g-related <strong>in</strong>equality <strong>in</strong>dicators based on Eurostat data, two different metrics werecalculated:• a crude metric, denot<strong>in</strong>g the prevalence of a given problem per country or subregion and persocioeconomic or demographic category – results are expressed as a percentage of households orpopulation;• a relative metric, denot<strong>in</strong>g the ratio divid<strong>in</strong>g the prevalence among one socioeconomic category bythe prevalence among another – the higher the ratio, the greater the level of disparity between thetwo categories.Given that ratio figures can be mislead<strong>in</strong>g, both crude and relative metrics were <strong>in</strong>cluded <strong>in</strong> graphs<strong>in</strong> order to highlight the countries for which hous<strong>in</strong>g conditions constitute a major problem – thosecountries with both a high proportion of the population affected and large <strong>in</strong>equalities between specificsubpopulation groups. Conversely, several countries provide challeng<strong>in</strong>g cases when an overall lowprevalence of a given problem (such as lack of a bath/shower) affects the calculation of ratios, lead<strong>in</strong>gto high ratios when specific population subgroups are compared with the average population. Thus,evaluation must always consider the absolute and the relative dimensions of <strong>in</strong>equality.Scatter plots were also used to illustrate the relationship of prevalence of one hous<strong>in</strong>g problem betweentwo different population subgroups. This was done to explore whether <strong>in</strong>equalities <strong>in</strong> the first populationgroup deviated from the second one, <strong>in</strong>dicat<strong>in</strong>g <strong>in</strong>equalities <strong>in</strong> exposure. The y-axis was expressed ona logarithmic scale to improve the readability of the graph because several countries had prevalencelevels close to 0%. A l<strong>in</strong>ear model was fitted to <strong>in</strong>vestigate how the two prevalence values were l<strong>in</strong>earlyassociated as well as to quantify the strength of the association.In addition, to explore whether prevalence of <strong>in</strong>ability to keep the home warm by country deviates fromthe general pattern of national <strong>in</strong>equality, <strong>in</strong>formation was extracted from the EU-SILC database onthe 2009 G<strong>in</strong>i <strong>in</strong>dex by country. This is a standard economic measure of <strong>in</strong>come <strong>in</strong>equality that variesbetween 0 and 100: a value close to 0 signifies a low level of <strong>in</strong>come <strong>in</strong>equality and a high value <strong>in</strong>dicatesa high level of <strong>in</strong>come <strong>in</strong>equality <strong>in</strong> the country. The scatter plot illustrates the shape of the relationshipbetween the two variables (G<strong>in</strong>i <strong>in</strong>dex and prevalence of <strong>in</strong>ability to keep home warm).As the hous<strong>in</strong>g <strong>in</strong>equality data provided by Eurostat covers the EU countries and Iceland, Norway andSwitzerland only, EU15 and NMS12 were chosen as subregions. Iceland, Norway and Switzerland arepresented separately.Restrictions and data limitationsThe ma<strong>in</strong> limitation of the available data on <strong>in</strong>equalities <strong>in</strong> adequate water supply is the absence of<strong>in</strong>formation on socioeconomic and demographic characteristics, preclud<strong>in</strong>g a detailed analysis of<strong>in</strong>equalities. The only stratification possible is by rural or urban population, although data for 2010will shortly be published, enabl<strong>in</strong>g data analysis by <strong>in</strong>come decile. This <strong>in</strong>formation was used as a
26Chapter 2. Hous<strong>in</strong>g-related <strong>in</strong>equalitiesproxy for SES because there is consistent evidence that, on average, rural populations experience highersocioeconomic disadvantages than urban ones. A second limitation is that the absence of annual data didnot allow for a more precise trend analysis. Hav<strong>in</strong>g acknowledged these limitations, the ma<strong>in</strong> advantageof the database lies <strong>in</strong> the great number of countries for which this <strong>in</strong>formation was available, permitt<strong>in</strong>ga large geographical comparison.Data on all other hous<strong>in</strong>g <strong>in</strong>equality <strong>in</strong>dicators were provided by Eurostat, cover<strong>in</strong>g a maximum of 30Member States. A study of the 53 countries of the WHO <strong>Europe</strong>an Region would allow a larger spatialview of hous<strong>in</strong>g <strong>in</strong>equalities, possibly improv<strong>in</strong>g identification of the most exposed population groups<strong>in</strong> a more economically and culturally diverse area. Furthermore, the sample sizes for the EU-SILCsurvey are not very large, vary<strong>in</strong>g between 8250 (Germany) and 2250 (Iceland) households, which mayresult <strong>in</strong> unstable figures and large uncerta<strong>in</strong>ty levels when split accord<strong>in</strong>g to several subcategories. 6Nevertheless, a detailed data search (WHO, 2011a) has <strong>in</strong>dicated that these are the best available datato date, although caution should be used when <strong>in</strong>terpret<strong>in</strong>g the results of the analysis.In particular, <strong>in</strong>formation on the composition of households, such as the number of people per agecategory, would be relevant to improve understand<strong>in</strong>g of the overcrowd<strong>in</strong>g phenomenon <strong>in</strong> certa<strong>in</strong><strong>Europe</strong>an subregions. This <strong>in</strong>formation might help to dist<strong>in</strong>guish the countries for which overcrowd<strong>in</strong>gis related to cultural habits (such as cohabitation of several generations) from those for which it reflectsa situation of deprivation.Regard<strong>in</strong>g analysis of dampness <strong>in</strong> the dwell<strong>in</strong>g, some qualification of the degree of dampness wouldalso be appropriate. The <strong>in</strong>formation used for the def<strong>in</strong>ition was rather poor and misclassificationof exposure could result <strong>in</strong> over- or underestimation of the proportion of subjects exposed to dampdwell<strong>in</strong>gs, possibly <strong>in</strong> a different manner across countries.Climate <strong>in</strong>formation is important <strong>in</strong> order to <strong>in</strong>terpret fully analysis of the <strong>in</strong>equality <strong>in</strong>dicator onthermal comfort – cold countries could be more affected by <strong>in</strong>ability to keep homes warm. Perception ofcold <strong>in</strong> dwell<strong>in</strong>gs might also differ from one group to another; for example, older subjects or unemployedpeople who spend more of the day <strong>in</strong>side their home could be more vulnerable to perception of coldcompared to those who are out for a greater part of the day. Data on <strong>in</strong>door temperature could allowstratification of the analysis and enhance identification of the most exposed populations. In addition,<strong>in</strong>formation on the number of rooms per dwell<strong>in</strong>g could also help to expla<strong>in</strong> differences <strong>in</strong> the prevalenceof <strong>in</strong>ability to keep the home warm between countries and subgroups of population.For all the hous<strong>in</strong>g <strong>in</strong>equality <strong>in</strong>dicators, it would also be of great <strong>in</strong>terest if additional socioeconomic<strong>in</strong>formation (such as education level and employment status) were rout<strong>in</strong>ely collected as a way toimprove the understand<strong>in</strong>g of <strong>in</strong>equality factors between and with<strong>in</strong> countries.<strong>Inequalities</strong> <strong>in</strong> <strong>in</strong>adequate water supplyIntroductionAn adequate supply of water is recognized as a basic human need as well as a human right (UnitedNations Human Rights Council, 2010). Therefore, halv<strong>in</strong>g the proportion of <strong>in</strong>dividuals without accessto safe dr<strong>in</strong>k<strong>in</strong>g-water is one of the key Millennium Development Goals (United Nations MillenniumProject, 2005). The need for water resources goes beyond quantity and must also consider quality forma<strong>in</strong>ta<strong>in</strong><strong>in</strong>g good health. The United Nations Development Programme (UNDP) declared <strong>in</strong> March2011 that:6 For details on EU-SILC sample size and methodology see Eurostat website (http://epp.eurostat.ec.europa.eu/portal/page/portal/<strong>in</strong>come_social_<strong>in</strong>clusion_liv<strong>in</strong>g_conditions/<strong>in</strong>troduction).
<strong>Environmental</strong> health <strong>in</strong>equalities <strong>in</strong> <strong>Europe</strong> 27Water and sanitation <strong>in</strong>frastructure <strong>in</strong> many countries <strong>in</strong> <strong>Europe</strong> and Central Asia are <strong>in</strong> a criticalstate and deteriorat<strong>in</strong>g, often pos<strong>in</strong>g a threat to human health. Yet, most countries have signedor ratified core UN human rights conventions, and many regional treaties recognize the right towater…. The <strong>in</strong>ternationally recognized right to water guarantees that all people have access tosafe potable water at an affordable price, regardless of their age, sex, race, gender, or ethnicity.(UNDP, 2011)Dr<strong>in</strong>k<strong>in</strong>g-water has been def<strong>in</strong>ed by WHO as water that does not conta<strong>in</strong> pathogens or chemicalagents at levels of concentration that could affect health (WHO 2011b). The greatest hazard associatedwith dr<strong>in</strong>k<strong>in</strong>g-water is contam<strong>in</strong>ation by sewage or by human excrement. It is also significant thatthe UNDP declaration goes on: “The right to water emphasizes the importance of water-relateddevelopment for marg<strong>in</strong>alized and vulnerable groups, who are commonly socially excluded”. In thiscontext, a forthcom<strong>in</strong>g report by the United Nations Economic Commission for <strong>Europe</strong> (UNECE),WHO and the French M<strong>in</strong>istry of <strong>Health</strong> on good practices to ensure equitable access to water andsanitation <strong>in</strong> the pan-<strong>Europe</strong>an region concludes that the three major dimensions <strong>in</strong>cluded <strong>in</strong> theconcept of equitable access to water and sanitation are geographical disparities <strong>in</strong> service provision,discrim<strong>in</strong>ation or exclusion <strong>in</strong> access to services by vulnerable and marg<strong>in</strong>alized groups, and f<strong>in</strong>ancialaffordability by users (UNECE, <strong>in</strong> press).Fig. 3. Prevalence of <strong>in</strong>adequate water supply by urbanization level (2008) <strong>in</strong> countries without fullcoverage454035Urban population with <strong>in</strong>adequate water supplyRural population with <strong>in</strong>adequate water supplyPrevalence (%)302520151050PortugalGreeceEuro 1 [a]SloveniaEstoniaLatviaEuro 2 [a]TurkmenistanBelarusUkra<strong>in</strong>eGeorgiaArmeniaKazakhstanRussian FederationKyrgyzstanRepublic of MoldovaUzbekistanAzerbaijanTajikistanEuro 3 [a]MKD [b]AlbaniaBosnia and Herzegov<strong>in</strong>aSerbiaCroatiaMontenegroTurkeyEuro 4 [a]All countries [a]Source: data from WHO/UNICEF JMP, 2011.Notes: [a] data for Euro 1, 2, 3 and 4 represent the average of national rates for all countries with<strong>in</strong> the subregions, <strong>in</strong>clud<strong>in</strong>gthose with full coverage not shown; [b] MKD: International <strong>Organization</strong> for Standardization (ISO) code for the formerYugoslav Republic of Macedonia.Indicator analysis: <strong>in</strong>equalities by urbanization levelThe proportions of rural and urban populations with <strong>in</strong>adequate water supply, def<strong>in</strong>ed as “unimprovedwater supply conditions” with<strong>in</strong> the WHO/UNICEF JMP database, were compared (see Fig. 3).The distribution of the prevalence of <strong>in</strong>adequate water supply <strong>in</strong> rural and urban sectors varies acrosscountries from 0% <strong>in</strong> most Euro 1 and Euro 2 countries to about 40% for the rural population liv<strong>in</strong>g <strong>in</strong>Tajikistan, a Euro 3 country. Euro 3 countries are by far the most affected by <strong>in</strong>adequate water supply,followed by Euro 4 countries. However, water supply <strong>in</strong>equalities were also found among some Euro 1
28Chapter 2. Hous<strong>in</strong>g-related <strong>in</strong>equalitiesand Euro 2 countries (Euro 1: Portugal and Greece, Euro 2: Estonia and Latvia). Overall, Azerbaijanhas the highest proportion (12%) of urban population with <strong>in</strong>adequate water supply, whereas Tajikistanhas the highest proportion (39%) of rural population without adequate access to water. However, severalcountries with<strong>in</strong> the Euro 3 and Euro 4 regions present a low prevalence of <strong>in</strong>adequate water supply <strong>in</strong>rural and/or urban populations, with figures comparable to Euro 1 and Euro 2 countries. For <strong>in</strong>stance,<strong>in</strong> Israel the entire population – urban and rural – has adequate access to water, while <strong>in</strong> Belarus and theformer Yugoslav Republic of Macedonia only 1% of the rural population lacks adequate access to water.In terms of rural–urban <strong>in</strong>equalities, the largest differences are observed for Kyrgyzstan, Kazakhstan andUzbekistan. For example, <strong>in</strong> Kyrgyzstan the proportion of the population without an adequate watersupply is 15 times higher among the rural population than the urban population.Inequality trends <strong>in</strong> <strong>in</strong>adequate water supply <strong>in</strong> urban and rural areas between the four Euro regionsfrom 1990 to 2008 were also analysed (see Fig. 4). Already low, the prevalence of <strong>in</strong>adequate watersupply <strong>in</strong> Euro 1 and Euro 2 countries slowly decreased between 1990 and 2008 from 0.7% to 0%(Euro 1) and from less than 2% to less than 1% (Euro 2) among the rural population. A similar patternis observed among the urban population. In Euro 3 and Euro 4 countries, the proportion of the ruralpopulation with <strong>in</strong>adequate water supply <strong>in</strong>creased between 1990 and 1995 and then decreased from2000. However, the time trend variations are lower <strong>in</strong> the Euro 4 countries than the Euro 3 countries.In the Euro 3 region, the prevalence <strong>in</strong> 2008 is still higher for both urban and rural areas than the 1990figure.Fig. 4. Trends of <strong>in</strong>adequate water supply by urbanization level4.024Urban3.521Rural3.018Prevalence (%)2.52.01.5Prevalence (%)151291.060.530.01990 1995 2000 2005 2008YearEuro 1 Euro 2Source: data from WHO/UNICEF JMP, 2011.01990 1995 2000 2005 2008YearEuro 3 Euro 4 All countriesA more <strong>in</strong>-depth analysis (data not shown) by country highlights that the biggest improvement <strong>in</strong>water supply equality has been observed <strong>in</strong> Turkmenistan, where all the rural population had access toadequate water <strong>in</strong> 2008 while 28% had an <strong>in</strong>adequate water supply <strong>in</strong> 1995. Large urban–rural equalityimprovements were also found <strong>in</strong> Georgia, Tajikistan and Azerbaijan. A worsen<strong>in</strong>g trend between 1995and 2008 was noted for Kazakhstan (2% <strong>in</strong>crease <strong>in</strong> <strong>in</strong>adequate water supply <strong>in</strong> rural areas from 1995 to2008) and <strong>in</strong> the Republic of Moldova and <strong>in</strong> Uzbekistan (4% <strong>in</strong>crease <strong>in</strong> both cases).Target groups for actionThese data show a clear difference across the WHO <strong>Europe</strong>an Region, particularly between the Euro 1and Euro 2 countries and the Euro 3 and Euro 4 countries. Many countries could qualify as “exposed”to the problem of <strong>in</strong>adequate water supply given the high prevalence of unimproved water sources <strong>in</strong>the general population: the situation <strong>in</strong> Azerbaijan and Tajikistan illustrates this po<strong>in</strong>t. Moreover, it wasseen that <strong>in</strong> every country (except <strong>in</strong> the Euro 1 region, <strong>in</strong> which <strong>in</strong>adequate water supply is not an issue)
<strong>Environmental</strong> health <strong>in</strong>equalities <strong>in</strong> <strong>Europe</strong> 29rural populations constitute a disproportionately highly exposed group compared to urban populations.F<strong>in</strong>ally, for the Euro 1, Euro 2 and Euro 4 regions, the prevalence tended to decrease between 1990 and2008 <strong>in</strong> both rural and urban areas. However, the prevalence rema<strong>in</strong>s very high for Euro 3 countries <strong>in</strong>2008: higher than the figure for 1990.National data sets provid<strong>in</strong>g more detailed <strong>in</strong>formation need to be applied to identify further <strong>in</strong>equalities.One example is contributed by Hungary, show<strong>in</strong>g the provision of piped water supply to dwell<strong>in</strong>gs <strong>in</strong>relation to the rate of Roma population <strong>in</strong> Hungarian municipalities (see Annex 1).<strong>Health</strong> implicationsA key driver for the provision of safe water is improvement to public health, and many studies havedemonstrated that dr<strong>in</strong>k<strong>in</strong>g-water <strong>in</strong>terventions can substantially reduce the risk of diarrhoeal diseases(Clasen et al., 2007; Fewtrell et al., 2005). Diarrhoeal disease is one of the lead<strong>in</strong>g causes of morbidityand mortality <strong>in</strong> less developed countries and <strong>in</strong> less developed areas of emerg<strong>in</strong>g countries, especiallyamong children. Rural areas are particularly at risk. Inadequate water supply translates <strong>in</strong>to a major healthimpact as it leads to a high prevalence of water-borne diseases. In the WHO <strong>Europe</strong>an Region, an averageof 330 000 cases of serious water-related diseases are reported every year, <strong>in</strong>clud<strong>in</strong>g campylobacteriosis,viral hepatitis A, giardiasis, Shigella (bloody diarrhoea), enterohaemorrhagic Escherichia coli <strong>in</strong>fection,legionellosis and cholera (WHO, 2011b). Increased knowledge about the preventable health burdenassociated with an <strong>in</strong>adequate supply of dr<strong>in</strong>k<strong>in</strong>g-water has strengthened the commitment to <strong>in</strong>creaseaccess to improved water supplies across <strong>Europe</strong>. Improvements <strong>in</strong> access to safe water and adequatesanitation could reduce the child mortality rate by 2.2 million each year.Rural area dwellers are particularly exposed to <strong>in</strong>adequate dr<strong>in</strong>k<strong>in</strong>g-water sources; they face <strong>in</strong>creasedvulnerability to water-borne diseases due to lack of access to a water distribution network or to distancefrom water sources. Moreover, water service costs are comparatively higher <strong>in</strong> rural and suburban areasthan <strong>in</strong> urban centres. This is due <strong>in</strong> part to the numerous <strong>in</strong>termediaries <strong>in</strong> the retail cha<strong>in</strong>, and <strong>in</strong> partto the scarcity of the water. This situation translates <strong>in</strong>to a major health impact for rural populations.Conclusions and suggestionsThe two major conclusions of the analysis are that <strong>in</strong>adequate water supply is ma<strong>in</strong>ly an issue <strong>in</strong> Euro3 and Euro 4 countries and that populations liv<strong>in</strong>g <strong>in</strong> rural areas, particularly <strong>in</strong> these regions, are moreexposed to an <strong>in</strong>adequate water supply. Improved water supply can enhance health status by enabl<strong>in</strong>gbetter hygiene, and possibly also by decreas<strong>in</strong>g the need for storage <strong>in</strong> the home and for transport ofwater – factors that are l<strong>in</strong>ked to the risk of water contam<strong>in</strong>ation. In addition to quantity, it is wellestablished that quality of dr<strong>in</strong>k<strong>in</strong>g-water is an important determ<strong>in</strong>ant <strong>in</strong> prevent<strong>in</strong>g diarrhoeal diseases.Suggested mitigation actions are:• protection of ground water or effective treatment and dis<strong>in</strong>fection of surface water, and build<strong>in</strong>gof water networks that br<strong>in</strong>g protected dr<strong>in</strong>k<strong>in</strong>g-water to remote areas;• l<strong>in</strong>k<strong>in</strong>g provision of dr<strong>in</strong>k<strong>in</strong>g-water with sanitation improvements to protect water resourcesand reduce the risk of contam<strong>in</strong>ation;• <strong>in</strong> rural areas, <strong>in</strong>vestment by local and state authorities <strong>in</strong> community utilities for productionand distribution of improved dr<strong>in</strong>k<strong>in</strong>g-water and provisions to ensure its permanent microbialand chemical quality, s<strong>in</strong>ce it has been shown that poor water system ma<strong>in</strong>tenance, even for afew days, can jeopardize the expected health benefits (Hunter, Zmirou-Navier and Hartemann,2009);• better audit<strong>in</strong>g by funders of water quality programmes of whether <strong>in</strong>terventions are susta<strong>in</strong>ableand whether health benefits are be<strong>in</strong>g achieved – this calls for health surveillance efforts tomonitor the evolution of diarrhoeal diseases over time.
30Chapter 2. Hous<strong>in</strong>g-related <strong>in</strong>equalities<strong>Inequalities</strong> <strong>in</strong> lack of a flush toilet <strong>in</strong> the dwell<strong>in</strong>gIntroductionAccess to safe sanitation facilities and practices is central to human health and dignity, economic wellbe<strong>in</strong>g,educational opportunities, and susta<strong>in</strong>ability of the environment (Water Supply and SanitationCollaborative Council, 2010). Inadequate access to safe sanitation services, together with poor hygienepractices, produces a compounded detrimental effect on the health of <strong>in</strong>dividuals and may lead toimpoverishment via a severe decrease <strong>in</strong> economic and educational opportunities (UNICEF, 2011).Lack of access to a flush toilet <strong>in</strong> the dwell<strong>in</strong>g may force <strong>in</strong>dividuals to defecate <strong>in</strong> the open or to useunsanitary facilities (Humphrey, 2009). Open defecation has been described by WHO as “the riskiestsanitation practice of all” (WHO, 2010a) because it constitutes a major cause of ground water pollution,agricultural produce contam<strong>in</strong>ation and disease transmission (Water Aid, 2010). Other excreta disposaloptions <strong>in</strong> use, <strong>in</strong>clud<strong>in</strong>g traditional pit latr<strong>in</strong>es, “fly<strong>in</strong>g toilets”, ventilated pit latr<strong>in</strong>es and pour-flushtoilets, are also considered to be unimproved sanitation practices because they are shared by manyhouseholds and pollute the groundwater through “direct and <strong>in</strong>direct discharge of pollution loads <strong>in</strong>tothe environment” (Katukiza et al., 2010). Poverty is still one of the major distal determ<strong>in</strong>ants of diarrhoea,and is closely related to lack of sanitation, poor neighbourhood <strong>in</strong>frastructure and poor liv<strong>in</strong>g conditions(Genser et al., 2008): 40% of the world’s population – the most socioeconomically disadvantaged andmaterially deprived – do not have access to improved sanitation facilities (WHO/UNICEF JMP, 2010).Furthermore, the disparities between rural and urban communities are alarm<strong>in</strong>g. Without a flush toilet<strong>in</strong> the dwell<strong>in</strong>g, the most impoverished populations are systematically prevented from experienc<strong>in</strong>g theprotective health effects of improved sanitation.Indicator analysis: <strong>in</strong>equalities by <strong>in</strong>come and household typeLack of a flush toilet <strong>in</strong> the dwell<strong>in</strong>g is not a major issue for the EU15 countries (see Fig. 5). The averagepercentage of the population lack<strong>in</strong>g a flush toilet <strong>in</strong> the dwell<strong>in</strong>g is 0.7% for these countries, withPortugal reach<strong>in</strong>g the highest prevalence at 2.4%. Every household <strong>in</strong> Denmark, Netherland, Spa<strong>in</strong>,and Sweden reported the presence of a flush toilet <strong>in</strong> the dwell<strong>in</strong>g. Similar results were also observedfor Iceland, Norway and Switzerland. By contrast, wide variability was observed between the NMS12countries. Many countries exhibit a very high percentage of the population lack<strong>in</strong>g a flush toilet <strong>in</strong>the home – for <strong>in</strong>stance, Romania (42.4%), Bulgaria (26.2%), Lithuania (17.2%) and Latvia (16.6%)– whereas the percentage is very low <strong>in</strong> other countries, <strong>in</strong>clud<strong>in</strong>g Slovenia (0.6%), Cyprus (0.7%) andthe Czech Republic (0.7%). The entire population of Malta was reported to have a flush toilet <strong>in</strong> thedwell<strong>in</strong>g.Fig. 5 also shows the level of <strong>in</strong>equality with<strong>in</strong> countries: the large majority of countries exhibit an<strong>in</strong>come ratio greater than 1 when compar<strong>in</strong>g the prevalence of households below the poverty thresholdwith those above it. This demonstrates that the prevalence of lack<strong>in</strong>g a flush toilet is higher amongpopulations liv<strong>in</strong>g <strong>in</strong> relative poverty. Higher ratios are reported <strong>in</strong> the NMS12 than <strong>in</strong> the EU15countries: about 17:1 and 15:1 for Slovenia and Cyprus, respectively, versus about 4:1 <strong>in</strong> Belgium,F<strong>in</strong>land, Greece and Luxembourg.In conclusion, analysis of Fig. 5 highlights three ma<strong>in</strong> issues. First, it demonstrates that lack of a flushtoilet is a significant hous<strong>in</strong>g problem <strong>in</strong> several of the NMS12 countries. Second, it exposes large<strong>in</strong>equalities between the socioeconomically privileged and disadvantaged populations <strong>in</strong> some countrieswhere the basel<strong>in</strong>e prevalence is low, such as Slovenia and Cyprus. Third, it highlights the compoundedproblem that exists <strong>in</strong> countries that present a high level of <strong>in</strong>equality <strong>in</strong> conjunction with a highprevalence of lack of a flush toilet <strong>in</strong> the home, as <strong>in</strong> Latvia and Hungary. Although the data presentedhere are restricted to EU members and Iceland, Norway and Switzerland, similar – or even stronger –<strong>in</strong>come-related <strong>in</strong>equalities appear outside the EU, as shown <strong>in</strong> data on the prevalence of lack of a flushtoilet stratified by wealth status, urban/rural residence and region <strong>in</strong> Georgia (see Annex 1).
<strong>Environmental</strong> health <strong>in</strong>equalities <strong>in</strong> <strong>Europe</strong> 31Fig. 5. Prevalence of lack of a flush toilet <strong>in</strong> the dwell<strong>in</strong>g by relative poverty level (2009)Prevalence (%)908070605040302010Above relative poverty levelBelow relative poverty levelIncome ratio18161412108642Ratio of prevalence (below:aboverelative poverty level)00Denmark [a]Netherlands [a]Spa<strong>in</strong> [a]Sweden [a]ItalyIrelandUnited K<strong>in</strong>gdomBelgiumFranceF<strong>in</strong>landLuxembourgGermanyAustriaGreecePortugalEU15Malta [a]Czech RepublicCyprusSloveniaSlovakiaPolandHungaryEstoniaLatviaLithuaniaBulgariaRomaniaNMS12EU27Norway [b]Switzerland [b]IcelandSource: data from EU-SILC, 2011.Notes: [a] countries report<strong>in</strong>g full population coverage; [b] countries report<strong>in</strong>g 0.1% for both above and below relativepoverty level.The relationship between lack of a flush toilet <strong>in</strong> the dwell<strong>in</strong>g among s<strong>in</strong>gle-parent households andamong the general population was plotted on a logarithmic scale (see Fig. 6). The analysis excludescountries where the entire population has a flush toilet <strong>in</strong>side the home. The l<strong>in</strong>ear model expla<strong>in</strong>s about96% of the variability, signify<strong>in</strong>g that one variable could predict the second one with very good precision.The regression coefficient is equal to 0.93, show<strong>in</strong>g that, on average, the percentage of s<strong>in</strong>gle-parenthouseholds liv<strong>in</strong>g <strong>in</strong> a home without a flush toilet is slightly lower than that <strong>in</strong> the general population.Several exceptions appear on the scatter plot: countries on the left of the l<strong>in</strong>e have a higher prevalenceof lack of a flush toilet among s<strong>in</strong>gle-parent households than <strong>in</strong> the general population. The highestlevels of <strong>in</strong>equality faced by s<strong>in</strong>gle-parent households exist <strong>in</strong> Poland (4.8% of the general populationreported lack of a flush toilet at home compared to 7.9% of s<strong>in</strong>gle-parent households), F<strong>in</strong>land (0.8%versus 1.9%), Slovenia (0.6% versus 1.6%) and Lithuania (17.2% versus 20.3%).The subgroup of s<strong>in</strong>gle-parent households lack<strong>in</strong>g a flush toilet <strong>in</strong> the dwell<strong>in</strong>g was explored <strong>in</strong>more detail to assess whether those below the poverty threshold constituted a particularly exposedgroup. Us<strong>in</strong>g a l<strong>in</strong>ear model (data not shown), it was found that, on average, the percentage of s<strong>in</strong>gleparenthouseholds below the poverty threshold without a flush toilet <strong>in</strong>creases by about 2% when theprevalence among all s<strong>in</strong>gle-parent households <strong>in</strong>creases by 1%. In other words, the prevalence of lackof a flush toilet <strong>in</strong> the dwell<strong>in</strong>g is twice as high among s<strong>in</strong>gle-parent households <strong>in</strong> relative poverty thanamong all s<strong>in</strong>gle-parent households. The situation represented by several NMS12 countries appearsespecially worry<strong>in</strong>g. For example, <strong>in</strong> Bulgaria the prevalence of liv<strong>in</strong>g <strong>in</strong> a dwell<strong>in</strong>g without a flush toiletis 19.2% among all s<strong>in</strong>gle-parent households and 53.6% among those <strong>in</strong> relative poverty. In Romania,the prevalence is 42% among all s<strong>in</strong>gle-parent households but almost double that figure (78%) amongthose <strong>in</strong> relative poverty. The examples for Romania and Bulgaria show how the comb<strong>in</strong>ation of twosociodemographic determ<strong>in</strong>ants – namely poverty and s<strong>in</strong>gle-parent household situation – enables theidentification of a particularly exposed group.F<strong>in</strong>ally, the <strong>in</strong>come-related <strong>in</strong>equality of lack<strong>in</strong>g a flush toilet <strong>in</strong> the dwell<strong>in</strong>g was analysed (see Fig. 7),<strong>in</strong>dicat<strong>in</strong>g that low <strong>in</strong>come is associated with <strong>in</strong>creased prevalence of lack of a flush toilet. As alreadyshown, the NMS12 countries are by far the most affected <strong>in</strong> quantitative terms, but they also exhibitthe largest <strong>in</strong>equality levels, with 31% of the population lack<strong>in</strong>g a flush toilet <strong>in</strong> the dwell<strong>in</strong>g among thelowest <strong>in</strong>come qu<strong>in</strong>tile and 3% <strong>in</strong> the highest <strong>in</strong>come qu<strong>in</strong>tile.
32Chapter 2. Hous<strong>in</strong>g-related <strong>in</strong>equalitiesFig. 6. Prevalence of lack of a flush toilet for s<strong>in</strong>gle-parent households versus general population (2009)100ROMS<strong>in</strong>gle parent households without flush toilet (%)10POLFIN EU27PORSVN DEU1 SVKBEL FRAEU15LUXHUNESTLTULTVNMS12BULAUSCZHsource??UNKS<strong>in</strong>gle parent household wirklich niedriger als tot pop?ITA0.1IRE0 5 10 15 20 25 30 35 40 45General population without flush toilet (%)Source: data from EU-SILC, 2011.Note: see list of country abbreviations <strong>in</strong> Annex 4.Fig. 7. Prevalence of lack of a flush toilet <strong>in</strong> the dwell<strong>in</strong>g by <strong>in</strong>come qu<strong>in</strong>tile (2009)35Qu<strong>in</strong>tile 1 (lowest <strong>in</strong>come)Prevalence (%)30Qu<strong>in</strong>tile 2Qu<strong>in</strong>tile 325Qu<strong>in</strong>tile 4Qu<strong>in</strong>tile 5 (highest <strong>in</strong>come)20151050EU15NMS12EU27Source: data from EU-SILC, 2011.Target groups for actionThe analysis demonstrates that households <strong>in</strong> the NMS12 countries are the most exposed to lack of aflush toilet <strong>in</strong> the dwell<strong>in</strong>g and most vulnerable <strong>in</strong> <strong>in</strong>come-related terms. Moreover, it reveals greater<strong>in</strong>equalities between the socioeconomically advantaged and disadvantaged population groups <strong>in</strong> this
<strong>Environmental</strong> health <strong>in</strong>equalities <strong>in</strong> <strong>Europe</strong> 33region; this corroborates the wealth of knowledge from the exist<strong>in</strong>g literature which identifies low-SESpopulations as hav<strong>in</strong>g the poorest access to good sanitation conditions. <strong>Inequalities</strong> can also be observedamong the EU15 countries, but to a lesser extent.The <strong>in</strong>come gradient analysis per region gives additional <strong>in</strong>formation underl<strong>in</strong><strong>in</strong>g a strong l<strong>in</strong>eardecrease <strong>in</strong> prevalence of lack of a flush toilet <strong>in</strong> the dwell<strong>in</strong>g from the lowest to the highest qu<strong>in</strong>tile.This reveals that <strong>in</strong>equalities exist not only between the poorest and the richest but also as a cont<strong>in</strong>uumacross all <strong>in</strong>come categories. The analysis also demonstrates that although when compared with thegeneral population s<strong>in</strong>gle-parent households are not disadvantaged by default, s<strong>in</strong>gle-parent households<strong>in</strong> relative poverty have a prevalence of lack of a flush toilet almost double that for all s<strong>in</strong>gle-parenthouseholds.<strong>Health</strong> implicationsThe plethora of preventable health effects (such as acute diarrhoea – particularly among <strong>in</strong>fants andchildren – hepatitis, typhoid and paratyphoid enteric fevers, <strong>in</strong>test<strong>in</strong>al parasitic worms and otherparasitic diseases) related to lack of access to a flush toilet has been <strong>in</strong>ternationally recognized by the<strong>in</strong>sertion of important water and sanitation targets <strong>in</strong> the Millennium Development Goals (UnitedNations, 2010). WHO has reiterated that progress towards these targets “will contribute significantlyto the reduction of child mortality, major <strong>in</strong>fectious diseases, maternal health and quality of life of slumpopulations” (Hutton and Bartram, 2008). Sanitation <strong>in</strong>terventions have been shown to reduce illnessand to have a substantial impact on the epidemiology of child diarrhoea: directly by reduc<strong>in</strong>g exposureto disease determ<strong>in</strong>ants, and <strong>in</strong>directly by alter<strong>in</strong>g the pathways by which socioeconomic factors act onthe outcome (Fewtrell et al., 2005; Genser et al., 2008).Conclusions and suggestionsLack of a flush toilet <strong>in</strong> the dwell<strong>in</strong>g is still an issue <strong>in</strong> many countries with<strong>in</strong> the WHO <strong>Europe</strong>anRegion. The proportion of households with no flush toilet varies between subpopulations, with those <strong>in</strong>relative poverty – and particularly s<strong>in</strong>gle-parent households <strong>in</strong> relative poverty – more exposed.A few suggestions for action stem from this analysis and concern permanent <strong>in</strong>dividual and collectivehous<strong>in</strong>g. Specific recommendations could also be formulated for temporary hous<strong>in</strong>g – such as thatbuilt for transitory workers or students’ residences – or any other provisional or emergency type ofaccommodation. The analysis does not take <strong>in</strong>to account this particular category of hous<strong>in</strong>g.Suggested mitigation actions are:• ensur<strong>in</strong>g that all new residential build<strong>in</strong>gs have at least one <strong>in</strong>side flush toilet per dwell<strong>in</strong>g;• rehabilitation of exist<strong>in</strong>g dwell<strong>in</strong>gs to <strong>in</strong>stall a flush toilet where one is lack<strong>in</strong>g;• offer<strong>in</strong>g f<strong>in</strong>ancial support to disadvantaged populations to encourage <strong>in</strong>stallation of a flushtoilet <strong>in</strong> their hous<strong>in</strong>g;• better report<strong>in</strong>g of data for non-EU Member States, especially <strong>in</strong> relation to <strong>in</strong>come andhousehold types not covered by WHO/UNICEF JMP data.Evidently, the two first recommendations are only practical if households have access to an adequatewater supply and if this supply is affordable for the poorest segments of the population.
34Chapter 2. Hous<strong>in</strong>g-related <strong>in</strong>equalities<strong>Inequalities</strong> <strong>in</strong> lack of a bath or shower <strong>in</strong> the dwell<strong>in</strong>gIntroductionThe absence of a bath or shower <strong>in</strong> the dwell<strong>in</strong>g is associated with an <strong>in</strong>adequate supply of water andimpairs personal and domestic hygiene. The Office of the High Commissioner for Human Rights(OHCHR) has stated that the right to water is <strong>in</strong>tr<strong>in</strong>sically connected to the right to an adequatestandard of liv<strong>in</strong>g because it greatly <strong>in</strong>fluences human health and quality of life (OHCHR, 2011).Lack of a bath or shower <strong>in</strong> the dwell<strong>in</strong>g severely underm<strong>in</strong>es the capacity of <strong>in</strong>dividuals to use therequired amount of water necessary to meet their most basic hygiene needs and to promote good health(Howard and Bartram, 2003; WHO, 2011c). Wash<strong>in</strong>g may not occur as often as necessary to ma<strong>in</strong>ta<strong>in</strong>good hygiene and bath<strong>in</strong>g cannot be assured unless it is carried out at an open water source outsidethe household, such as a nearby river, lake or stream. The water quality at these sources may even becontam<strong>in</strong>ated and unsafe for human use. Moreover, if household members have to collect water to beused <strong>in</strong> the dwell<strong>in</strong>g from outside, the distances and time <strong>in</strong>volved may prevent the household fromsecur<strong>in</strong>g the volumes necessary to support optimal basic personal and domestic hygiene; this may alsoresult <strong>in</strong> storage of the water at home, mak<strong>in</strong>g it prone to contam<strong>in</strong>ation, even if it is <strong>in</strong>itially clean(Howard and Bartram, 2003). Populations lack<strong>in</strong>g a bath or shower <strong>in</strong> the dwell<strong>in</strong>g, and consequentlymost at risk of contract<strong>in</strong>g diseases related to suboptimal hygiene, are <strong>in</strong> addition those who are mostsocioeconomically disadvantaged and liv<strong>in</strong>g <strong>in</strong> poverty. Even if they have access to m<strong>in</strong>imum volumesof water from a source outside the dwell<strong>in</strong>g, marg<strong>in</strong>alized populations are unlikely to benefit from theprotective effect of higher volumes of water per day, ga<strong>in</strong>ed from water piped <strong>in</strong>to the home (Luna etal., 1992; Prüss and Mariotti, 2000).Indicator analysis: <strong>in</strong>equalities by <strong>in</strong>come and household typeAs with the absence of a toilet <strong>in</strong> the dwell<strong>in</strong>g <strong>in</strong>dicator, the <strong>in</strong>equalities related to a lack of bath orshower <strong>in</strong> the dwell<strong>in</strong>g are predom<strong>in</strong>antly <strong>in</strong>tercountry <strong>in</strong>equalities (see Fig. 8).Fig. 8. Prevalence of lack of a bath or shower <strong>in</strong> the dwell<strong>in</strong>g by country (2009)4540Prevalence (%)35302520151050Netherlands [a]Spa<strong>in</strong> [a]Luxembourg [b]United K<strong>in</strong>gdom [b]Germany [b]ItalySwedenFranceIrelandAustriaDenmarkBelgiumF<strong>in</strong>landGreecePortugalEU15Malta [b]Slovakia [b]Czech RepublicSloveniaCyprusHungaryPolandEstoniaBulgariaLithuaniaLatviaRomaniaNMS12EU27Iceland [b]Norway [b]Switzerland [b]Source: data from EU-SILC, 2011.Notes: [a] countries report<strong>in</strong>g full coverage; [b] countries report<strong>in</strong>g prevalence lower than or equal to 0.3%.Hav<strong>in</strong>g no bath or shower at home is not an issue for the EU15 countries, where the average prevalenceis 0.4%. Portugal (as <strong>in</strong> the case of lack of a toilet <strong>in</strong> the dwell<strong>in</strong>g) has the highest prevalence at 2.7%. Inthe Netherlands and Spa<strong>in</strong>, the entire population is reported to have a bath or a shower <strong>in</strong> the dwell<strong>in</strong>gand low prevalence levels (up to 0.3%) were observed for Luxembourg, Germany and United K<strong>in</strong>gdom,as well as for Iceland, Norway and Switzerland. By contrast, as seen with the previous hous<strong>in</strong>g <strong>in</strong>dicator,
<strong>Environmental</strong> health <strong>in</strong>equalities <strong>in</strong> <strong>Europe</strong> 35large differences were observed between the NMS12 countries, with a high prevalence <strong>in</strong> Romania(41.2%), Latvia (18.2%), Lithuania (15.9%) and Bulgaria (15.6%) and a low prevalence <strong>in</strong> Malta (0.2%),Slovakia (0.3%), the Czech Republic (0.5%) and Cyprus (0.7%).The Eurostat data <strong>in</strong>dicate strong <strong>in</strong>equalities <strong>in</strong> access to a bath or shower at home between populations<strong>in</strong> the lowest <strong>in</strong>come qu<strong>in</strong>tile and those <strong>in</strong> the highest. Prevalence levels for <strong>in</strong>come qu<strong>in</strong>tiles show asteep gradient <strong>in</strong> the NMS12 countries, especially <strong>in</strong> the lowest <strong>in</strong>come qu<strong>in</strong>tile where 29.6% of thepopulation report a lack of bath or shower, which is 11% higher than the second-lowest qu<strong>in</strong>tile (seeFig. 9). In the EU15 countries, despite the low prevalence of the problem overall, a social gradient alsoclearly exists (rang<strong>in</strong>g from 1% <strong>in</strong> the lowest-<strong>in</strong>come population to 0.1% <strong>in</strong> the highest). In summaryterms, the data <strong>in</strong>dicate that with<strong>in</strong> the lowest-<strong>in</strong>come population group, more than 7% of EU citizensdo not have a bath or shower <strong>in</strong> their home. However, detailed data for Kyrgyzstan (see Annex 1)<strong>in</strong>dicate that outside the EU the problems are much greater, but can only be identified through nationaldatabases.Fig. 9. Prevalence of lack of a bath or shower by <strong>in</strong>come qu<strong>in</strong>tile (2009)Prevalence (%)353025201510Qu<strong>in</strong>tile 1 (lowest <strong>in</strong>come)Qu<strong>in</strong>tile 2Qu<strong>in</strong>tile 3Qu<strong>in</strong>tile 4Qu<strong>in</strong>tile 5 (highest <strong>in</strong>come)50EU15NMS12EU27Source: data from EU-SILC, 2011.In the majority of countries, prevalence of lack<strong>in</strong>g a bath or shower <strong>in</strong> the dwell<strong>in</strong>g is higher amongs<strong>in</strong>gle-parent households than among all households with dependent children (see Fig. 10), except <strong>in</strong>France and Hungary. The ratio varies between 0.5:1 for France and 4:1 for Belgium or Germany, but toensure a complete <strong>in</strong>terpretation of the figures the low prevalence of households with no bath or shower<strong>in</strong> these countries (0.2%, 0.2% and 0.1% <strong>in</strong> all households with dependent children and 0.1%, 0.8% and0.4% among s<strong>in</strong>gle-parent households, respectively) must be noted.Larger <strong>in</strong>equalities can be found when figures for s<strong>in</strong>gle-parent households <strong>in</strong> relative poverty and for allhouseholds with dependent children are contrasted, with ratios rang<strong>in</strong>g from 1.2:1 <strong>in</strong> F<strong>in</strong>land and about12:1 <strong>in</strong> Denmark (see Fig. 10). This comparison does not reveal differences <strong>in</strong> the extent of <strong>in</strong>equalitiesbetween EU15 countries and NMS12 countries: the prevalence of liv<strong>in</strong>g <strong>in</strong> a house without a bath orshower among low-<strong>in</strong>come s<strong>in</strong>gle-parent households is about twice greater than among householdswith dependent children across both regions.In several countries, tak<strong>in</strong>g relative poverty <strong>in</strong>to account only slightly <strong>in</strong>creases the difference betweenfigures for s<strong>in</strong>gle-parent households and for all households with dependent children (see Fig. 10).This means that the issue concerns all s<strong>in</strong>gle-parent households equally, irrespective of <strong>in</strong>come. For<strong>in</strong>stance, <strong>in</strong> Belgium both ratios are 4:1 and <strong>in</strong> Ireland both are 2:1. In contrast, Denmark and Sloveniaexhibit a much larger difference when consider<strong>in</strong>g s<strong>in</strong>gle-parent households <strong>in</strong> relative poverty: for bothcountries, the ratio is approximately 12:1. High ratios are also found for the Czech Republic and Poland.
36Chapter 2. Hous<strong>in</strong>g-related <strong>in</strong>equalitiesFig. 10. Ratio of prevalence of lack of a bath or shower for all households with children compared to s<strong>in</strong>gleparenthouseholds, by poverty level (2009)1512Ratio of prevalence (all s<strong>in</strong>gle-parent households:all households with children)Ratio of prevalence (s<strong>in</strong>gle-parent households below relative poverty level:all households with children)9630Greece [a]Luxembourg [b]Netherlands [b]Spa<strong>in</strong> [b]Sweden [a]United K<strong>in</strong>gdom [a]FranceF<strong>in</strong>landItalyIrelandPortugalBelgiumAustriaGermanyDenmarkEU15Cyprus [a]Malta [a]Slovakia [a]HungaryEstoniaRomaniaLatviaLithuaniaBulgariaCzech RepublicPolandSloveniaNMS12EU27Norway [a]Switzerland [a]Iceland [b]RatioSource: data from EU-SILC, 2011.Notes: [a] countries report<strong>in</strong>g full coverage with bath/shower for all s<strong>in</strong>gle-parent households; [b] countries report<strong>in</strong>g fullcoverage with bath/shower for all households with dependent children.Target groups for actionThe analysis confirms that prevalence of lack of a bath or shower <strong>in</strong> the dwell<strong>in</strong>g is highest <strong>in</strong> amajority of NMS12 countries compared to EU15 countries: the average figures across each region are13.4% and 0.4% respectively. Lower-<strong>in</strong>come populations are also clearly identified as constitut<strong>in</strong>g adisproportionately highly exposed group. The current economic crisis with its serious social consequencesmight exacerbate exist<strong>in</strong>g environmental health risks, <strong>in</strong>clud<strong>in</strong>g those relat<strong>in</strong>g to lack of hygiene andsanitation equipment. On average among the EU15 countries, the prevalence of lack<strong>in</strong>g a bath or showeramong those below the relative poverty threshold is about four times higher than among those aboveit. The contrast is greater <strong>in</strong> the NMS12 countries, where the average ratio is 6:1. F<strong>in</strong>ally, s<strong>in</strong>gle-parenthouseholds – especially those on low <strong>in</strong>comes – are a particularly vulnerable group regard<strong>in</strong>g lack of abath or shower <strong>in</strong> the dwell<strong>in</strong>g, compared to all households with dependent children.<strong>Health</strong> implicationsA lack of hygiene and sanitation equipment is still one of the most basic threats to health found<strong>in</strong> dwell<strong>in</strong>gs (Bonnefoy, 2007). It has long been established that a number of diseases are l<strong>in</strong>ked topoor hygiene, <strong>in</strong>clud<strong>in</strong>g those transmitted through the faecal-oral route, sk<strong>in</strong> and eye diseases, anddiseases propagated by <strong>in</strong>festations, <strong>in</strong>clud<strong>in</strong>g louse- and tick-borne typhus (Bradley, 1977; Cairncrossand Feachem, 1993). A study conducted <strong>in</strong> the south of Tehran found that lack of a bath or showerconstitutes a risk factor for persistent diarrhoea <strong>in</strong> children under five years old (Sakhaie et al., 2001).The ma<strong>in</strong> purpose of personal hygiene is to prevent such health-threaten<strong>in</strong>g conditions, but it is alsorelevant to improve appearance. This plays an important role <strong>in</strong> social acceptance and <strong>in</strong>clusiveness,s<strong>in</strong>ce poor hygiene can h<strong>in</strong>der a person’s reputation, community <strong>in</strong>tegration and job capacity; factorsthat, <strong>in</strong> turn, are determ<strong>in</strong>ants of self-esteem and revenue.
<strong>Environmental</strong> health <strong>in</strong>equalities <strong>in</strong> <strong>Europe</strong> 37Conclusions and suggestionsLack of a bath or shower is an issue <strong>in</strong> several countries, ma<strong>in</strong>ly among the NMS12 countries, andprobably also among the countries <strong>in</strong> the eastern part of the WHO <strong>Europe</strong>an Region, for which datawere not available. Several subpopulations were identified as more frequently vulnerable to the absenceof a bath or shower <strong>in</strong> the dwell<strong>in</strong>g: socioeconomically disadvantaged groups, s<strong>in</strong>gle-parent householdsand households comb<strong>in</strong><strong>in</strong>g these two sociodemographic determ<strong>in</strong>ants.Suggested mitigation actions are:• ensur<strong>in</strong>g that all new residential build<strong>in</strong>gs have a bath or shower <strong>in</strong> each dwell<strong>in</strong>g;• rehabilitation of exist<strong>in</strong>g build<strong>in</strong>gs to <strong>in</strong>stall a bath or shower where one is lack<strong>in</strong>g;• offer<strong>in</strong>g f<strong>in</strong>ancial support to disadvantaged populations to encourage <strong>in</strong>stallation of a bath orshower <strong>in</strong> their hous<strong>in</strong>g;• better report<strong>in</strong>g of data for non-EU member states, especially <strong>in</strong> relation to <strong>in</strong>come andhousehold types not covered by WHO/UNICEF JMP data.Evidently, the two first recommendations are only practical if households have access to an adequatewater supply and if the cost of energy to heat the water is affordable for the poorest segments of thepopulation.<strong>Inequalities</strong> <strong>in</strong> overcrowd<strong>in</strong>gIntroductionAn overcrowded house is recognized as an important contributor to ill health (Maani, Vaithianathan andWolfe, 2006), a burden affect<strong>in</strong>g several population subgroups. The 2008 annual report of the <strong>Europe</strong>anFederation of National Organisations work<strong>in</strong>g with the Homeless (FEANTSA) advanced that amongthe population groups at greatest risk of overcrowded liv<strong>in</strong>g are immigrants, refugees and ethnic m<strong>in</strong>oritygroups; this is partly because overcrowded homes may be accepted as temporary accommodation by newarrivals to a city, particularly ethnic m<strong>in</strong>orities (FEANTSA, 2008). For example, black and m<strong>in</strong>orityethnic households <strong>in</strong> England are about six times as likely as white households to be overcrowded, andaround half of the registered migrants <strong>in</strong> Austria live <strong>in</strong> an overcrowded home with at least two peopleper room. However, no data were identified that would enable an <strong>in</strong>ternational <strong>in</strong>equality assessment ofovercrowd<strong>in</strong>g <strong>in</strong> relation to migrant status or ethnicity.The authors of a New Zealand study found that unemployed people are more likely to live <strong>in</strong>overcrowded households than people with full-time jobs, with respective proportions of 20% and 7%(M<strong>in</strong>istry of Social Development, 2010), and highlighted a clear relationship between <strong>in</strong>come levelsand overcrowd<strong>in</strong>g. Multigenerational households also logically constitute a group at particular risk ofovercrowded liv<strong>in</strong>g; for example, 83% and 67% of overcrowded households <strong>in</strong> Wales and <strong>in</strong> Scotlandrespectively <strong>in</strong>clude dependent children (FEANTSA, 2008). Moreover, it must be noted that there arealso issues where elderly people cohabit with their children’s families – a situation more often seen <strong>in</strong>southern <strong>Europe</strong>an countries.Indicator analysis: <strong>in</strong>equalities by <strong>in</strong>come and household typeThe problem of overcrowd<strong>in</strong>g is a particularly significant hous<strong>in</strong>g threat as it is suffered by 10.1% ofthe general population <strong>in</strong> the EU15 countries and 46.6% <strong>in</strong> the NMS12 countries, <strong>in</strong>dicat<strong>in</strong>g strongsubregional differences (see Fig. 11). It is unsurpris<strong>in</strong>g that overcrowd<strong>in</strong>g among households with
38Chapter 2. Hous<strong>in</strong>g-related <strong>in</strong>equalitiesdependent children, which tend to be larger than the average household size, has a higher prevalence(14.4%) <strong>in</strong> the EU15 countries and a markedly higher prevalence (60.1%) <strong>in</strong> the NMS12 countries.Even higher prevalence levels are observed among s<strong>in</strong>gle-parent households (EU15: 19.1%, NMS12:68.2%).Fig. 11. Prevalence of overcrowd<strong>in</strong>g by household type (2009)Prevalence (%)908070605040302010All householdsHouseholds with dependent childrenS<strong>in</strong>gle-parent households0NetherlandsSpa<strong>in</strong>IrelandBelgiumF<strong>in</strong>landUnited K<strong>in</strong>gdomDenmarkPortugalFranceSwedenLuxembourgGermanyAustriaItalyGreeceEU15CyprusMaltaCzech RepublicBulgariaSlovakiaSloveniaEstoniaHungaryPolandRomaniaLatviaLithuaniaNMS12EU27SwitzerlandNorwayIcelandSource: data from EU-SILC, 2011.Larger disparities <strong>in</strong> levels of <strong>in</strong>equality between household types can be observed among the EU15countries than the NMS12 countries. In Austria and Belgium, the prevalence of liv<strong>in</strong>g <strong>in</strong> an overcrowdedhouse among s<strong>in</strong>gle-parent households is at least double that among all households, while <strong>in</strong> Germanyit is 3.5 times higher. <strong>Inequalities</strong> between household types are less apparent <strong>in</strong> the NMS12 countries,where overcrowd<strong>in</strong>g is more frequent – only the Czech Republic has a prevalence among s<strong>in</strong>gleparenthouseholds double that among all households. Nevertheless, protect<strong>in</strong>g vulnerable groups <strong>in</strong> theNMS12 countries from overcrowd<strong>in</strong>g is a significant challenge, s<strong>in</strong>ce for four countries the overcrowd<strong>in</strong>gprevalence among s<strong>in</strong>gle-parent families exceeds 70%.Fig. 11 also demonstrates an <strong>in</strong>verse correlation between the relative <strong>in</strong>equality and the absoluteprevalence of overcrowd<strong>in</strong>g among households: the relative differences between household types areglobally higher <strong>in</strong> the EU15 countries where total prevalence is lower, while the reverse is observed <strong>in</strong>the NMS12 countries.In addition, a clear gradient of the prevalence of overcrowd<strong>in</strong>g appears <strong>in</strong> the general populationaccord<strong>in</strong>g to <strong>in</strong>come (see Fig. 12). For the EU15 countries, 20% of the lowest-<strong>in</strong>come population areexposed to overcrowd<strong>in</strong>g versus less than 4% of the highest-<strong>in</strong>come. For the NMS12 countries, a sharpdecrease <strong>in</strong> prevalence was also found across the <strong>in</strong>come qu<strong>in</strong>tiles, rang<strong>in</strong>g from almost 60% to 35%between the first and the fifth qu<strong>in</strong>tiles. The data also <strong>in</strong>dicate that the prevalence of overcrowd<strong>in</strong>g ismuch higher among s<strong>in</strong>gle-parent households than the general population across all <strong>in</strong>come qu<strong>in</strong>tiles,although it does not exactly follow the l<strong>in</strong>ear pattern observed <strong>in</strong> the general population: <strong>in</strong> the EU15countries, overcrowd<strong>in</strong>g among s<strong>in</strong>gle-parent households <strong>in</strong> the fourth <strong>in</strong>come qu<strong>in</strong>tile (the secondhighest <strong>in</strong>come category), is slightly greater than <strong>in</strong> the middle qu<strong>in</strong>tile, and there is also an <strong>in</strong>verse trendbetween the two highest <strong>in</strong>come categories <strong>in</strong> the NMS12 countries.Overall, the data confirm that the poorest qu<strong>in</strong>tile of the population suffers greater exposure toovercrowd<strong>in</strong>g than the richest qu<strong>in</strong>tile. This is confirmed by more detailed data from Great Brita<strong>in</strong>(see Annex 1) show<strong>in</strong>g that the overall risk of overcrowd<strong>in</strong>g also differs by dwell<strong>in</strong>g tenure, but thathousehold <strong>in</strong>come rema<strong>in</strong>s associated with overcrowd<strong>in</strong>g <strong>in</strong> all types of tenure.
<strong>Environmental</strong> health <strong>in</strong>equalities <strong>in</strong> <strong>Europe</strong> 39Fig. 12. Prevalence of overcrowd<strong>in</strong>g by <strong>in</strong>come qu<strong>in</strong>tile and household type (2009)Prevalence (%)9080706050403020100General populationS<strong>in</strong>gle-parent householdsQu<strong>in</strong>tile 1 (lowest)Qu<strong>in</strong>tile 2Qu<strong>in</strong>tile 3Qu<strong>in</strong>tile 4Qu<strong>in</strong>tile 5 (highest)Qu<strong>in</strong>tile 1 (lowest)Qu<strong>in</strong>tile 2Qu<strong>in</strong>tile 3Qu<strong>in</strong>tile 4Qu<strong>in</strong>tile 5 (highest)Qu<strong>in</strong>tile 1 (lowest)Qu<strong>in</strong>tile 2Qu<strong>in</strong>tile 3Qu<strong>in</strong>tile 4Qu<strong>in</strong>tile 5 (highest)EU15NMS12EU27Source: data from EU-SILC, 2011.Target groups for actionThe majority of NMS12 countries show high overcrowd<strong>in</strong>g figures compared to the EU15 countries.More detailed data show that several population subgroups are particularly exposed to overcrowd<strong>in</strong>g <strong>in</strong>both regions. Hav<strong>in</strong>g dependent children <strong>in</strong> the household is a strong <strong>in</strong>dicator for <strong>in</strong>creased exposureto overcrowded liv<strong>in</strong>g conditions, and s<strong>in</strong>gle-parent households are at even greater risk.Furthermore, a low <strong>in</strong>come <strong>in</strong>creases the risk of liv<strong>in</strong>g <strong>in</strong> overcrowded homes. The prevalence ofovercrowd<strong>in</strong>g is higher among low-<strong>in</strong>come s<strong>in</strong>gle-parent households (77%) than among all s<strong>in</strong>gle-parenthouseholds (60%) <strong>in</strong> the NMS12 countries. These observations are <strong>in</strong> accord with the exist<strong>in</strong>g literature,which highlights the fact that low-<strong>in</strong>come populations, and particularly s<strong>in</strong>gle-parent households, aremore susceptible to this form of discomfort and health risk. Analysis of the <strong>in</strong>come gradient by subregionpresents additional <strong>in</strong>formation underl<strong>in</strong><strong>in</strong>g the gradual decrease <strong>in</strong> the prevalence of overcrowd<strong>in</strong>gfrom the lowest to the highest <strong>in</strong>come qu<strong>in</strong>tile. This reveals that <strong>in</strong>equalities exist not only between thepoorest and the richest households but also as a cont<strong>in</strong>uum across all <strong>in</strong>come categories.<strong>Health</strong> implicationsHousehold overcrowd<strong>in</strong>g is often associated with social deprivation, which <strong>in</strong> turn leads to an <strong>in</strong>creasedrisk of <strong>in</strong>fectious diseases (Maani, Vaithianathan and Wolfe, 2006). Numerous epidemiological studieshave demonstrated the existence of a significant association between overcrowd<strong>in</strong>g and the prevalenceof certa<strong>in</strong> <strong>in</strong>fectious diseases. Overcrowd<strong>in</strong>g may have a direct effect by facilitat<strong>in</strong>g the spread of<strong>in</strong>fectious diseases such as tuberculosis, rheumatic fever and men<strong>in</strong>gococcal disease (Baker et al., 2000).More specifically, tuberculosis associated with household overcrowd<strong>in</strong>g <strong>in</strong> the eastern part of the WHO<strong>Europe</strong>an Region results <strong>in</strong> 0.8 deaths and 617.6 disability-adjusted life years (DALYs) per 100 000population, correspond<strong>in</strong>g to a total of 15 351 tuberculosis cases and 3518 deaths (Braubach, Jacobsand Ormandy, 2011).Hous<strong>in</strong>g space adequate to the needs and desires of a family is also a core component of quality oflife. Overcrowd<strong>in</strong>g has been associated with mental health problems (Braubach, Jacobs and Ormandy,2011). A study conducted <strong>in</strong> north-west England found an association between overcrowd<strong>in</strong>g and theprevalence of psychiatric morbidity <strong>in</strong> the adult population (Harrison, Barrow and Creed, 1998). Severalstudies have also demonstrated that hous<strong>in</strong>g quality constitutes a good predictor of psychological issuesand that overcrowd<strong>in</strong>g <strong>in</strong> particular is significantly associated with children’s mental health (Evans,Saegert and Harris, 2001; Evans, Saltzman and Cooperman, 2001; Evans and English, 2002).
40Chapter 2. Hous<strong>in</strong>g-related <strong>in</strong>equalitiesConclusions and suggestionsOvercrowd<strong>in</strong>g is an issue <strong>in</strong> the majority of NMS12 countries and, to a lesser extent, <strong>in</strong> the EU15countries. Several subgroups were identified as more frequently exposed to overcrowd<strong>in</strong>g <strong>in</strong> thedwell<strong>in</strong>g, although by far the greatest overcrowd<strong>in</strong>g risk is found for socioeconomically disadvantagedhouseholds. Households with children <strong>in</strong> general and specifically s<strong>in</strong>gle-parent households also showhigher prevalence rates. Those accumulat<strong>in</strong>g both sociodemographic determ<strong>in</strong>ants have the highestexposure levels: low-<strong>in</strong>come s<strong>in</strong>gle-parent households <strong>in</strong> the NMS12 countries have a prevalence ofovercrowd<strong>in</strong>g of more than 75%.Suggested mitigation actions are:• mak<strong>in</strong>g regulatory provisions so that all new residential build<strong>in</strong>g projects, private or public,plan a m<strong>in</strong>imum proportion of dwell<strong>in</strong>gs for large households – this should take <strong>in</strong>to accountthe demographic characteristics and future trends of each country and, where appropriate, ofdifferent regions with<strong>in</strong> a country;• ensur<strong>in</strong>g a significant proportion of large dwell<strong>in</strong>gs when renovat<strong>in</strong>g exist<strong>in</strong>g hous<strong>in</strong>g stock;• provid<strong>in</strong>g targeted f<strong>in</strong>ancial support to disadvantaged populations to facilitate access todwell<strong>in</strong>gs of sufficient size;• <strong>in</strong>creas<strong>in</strong>g public hous<strong>in</strong>g programmes which provide dwell<strong>in</strong>gs with an adequate number ofrooms as a way to improve the overcrowd<strong>in</strong>g situation of low-<strong>in</strong>come populations and thosegroups most vulnerable to overcrowd<strong>in</strong>g.<strong>Inequalities</strong> <strong>in</strong> dampness <strong>in</strong> the homeIntroductionDampness <strong>in</strong> the dwell<strong>in</strong>g constitutes a substandard liv<strong>in</strong>g condition that <strong>in</strong>dicates the presence of waterdamage, a leak<strong>in</strong>g roof, rot <strong>in</strong> w<strong>in</strong>dow frames and floors, visible mould or condensation (Social CareInstitute for Excellence, 2005). Dampness is associated with a broad array of detrimental health effects<strong>in</strong> adults and children (Fisk, Lei-Gomez and Mendell, 2007). Mould growth is also facilitated whendampness is present <strong>in</strong>doors, a condition often encountered <strong>in</strong> poor social conditions associated withlarge family size that gives rise to humidity (Butler et al., 2003). Individuals with lower SES are highlyexposed to the effects of substandard hous<strong>in</strong>g conditions: studies have shown that ethnic m<strong>in</strong>orities and<strong>in</strong>dividuals with low <strong>in</strong>come tend to suffer disproportionately from the adverse health effects relatedto exposure to dampness and mould (Kohlhuber et al., 2006; Bolte and Mielck, 2004; Mielck andHe<strong>in</strong>rich, 2002). A WHO report on guidel<strong>in</strong>es for <strong>in</strong>door air pollution concludes that dampness shouldbe given greater priority as it contributes to the deterioration <strong>in</strong> health of disadvantaged and low-<strong>in</strong>comepopulations who are already overburdened by disease (WHO, 2009).Indicator analysis: <strong>in</strong>equalities by <strong>in</strong>come and household typeA comparable level of prevalence of dampness <strong>in</strong> the dwell<strong>in</strong>g exists <strong>in</strong> both the EU15 and the NMS12countries (see Fig. 13).On average, 15% of the general population is affected by dampness <strong>in</strong> the home <strong>in</strong> the EU15 versus18% <strong>in</strong> the NMS12 countries. However, with<strong>in</strong> these regional averages, strong national variations areobserved. The lowest prevalence is found <strong>in</strong> F<strong>in</strong>land, where only 5% of the population live <strong>in</strong> damphomes; similarly low levels were found <strong>in</strong> Sweden and Slovakia. Slovenia has the highest prevalence at30%, followed by Cyprus at 29%.
<strong>Environmental</strong> health <strong>in</strong>equalities <strong>in</strong> <strong>Europe</strong> 41Fig. 13. Prevalence of dampness <strong>in</strong> the dwell<strong>in</strong>g by household type (2009)Prevalence (%)454035302520151050All householdsS<strong>in</strong>gle-parent householdsHousehold ratio3210F<strong>in</strong>landSwedenDenmarkGreeceIrelandAustriaPortugalSpa<strong>in</strong>FranceUnited K<strong>in</strong>gdomLuxembourgNetherlandsItalyBelgiumGermanyEU15SlovakiaMaltaCzech RepublicHungaryBulgariaEstoniaLithuaniaLatviaPolandRomaniaSloveniaCyprusNMS12EU27NorwayRatio of prevalence (s<strong>in</strong>gle parent:all households)SwitzerlandIcelandSource: data from EU-SILC, 2011.Moreover, <strong>in</strong> the majority of countries the prevalence of dampness <strong>in</strong> hous<strong>in</strong>g is higher among s<strong>in</strong>gleparenthouseholds than the general population (household ratio of 1.5:1 for EU27, with nationalhousehold ratios rang<strong>in</strong>g from 0.9:1 to 2.1:1). The prevalence of dampness <strong>in</strong> s<strong>in</strong>gle-parent householdsacross regions is 24% <strong>in</strong> the EU15 and 25% <strong>in</strong> the NMS12 countries, but aga<strong>in</strong> there are wide nationalvariations, with the highest prevalence of 41% <strong>in</strong> Cyprus, followed by 39% <strong>in</strong> Slovenia, and the lowestonce aga<strong>in</strong> <strong>in</strong> F<strong>in</strong>land at 7%. The prevalence of dampness among s<strong>in</strong>gle-parent households <strong>in</strong> Germanyis double that among the general population at 29% and 14% respectively – the largest differencemeasured. However, differences of 10% or more are also found between the general population ands<strong>in</strong>gle-parent households <strong>in</strong> Belgium, Cyprus, France, the Netherlands, Poland and Romania. Incontrast, Greece and Bulgaria report the opposite situation, with a slightly higher prevalence of damphomes <strong>in</strong> the general population than among s<strong>in</strong>gle-parent households. More details on the associationof household types with dampness can be found <strong>in</strong> data from Norway (see Annex 1).There is a clear gradient <strong>in</strong> the prevalence of dampness <strong>in</strong> homes from the lowest <strong>in</strong>come qu<strong>in</strong>tile to thehighest (see Fig. 14). The trend is steeper among the NMS12 than the EU15 countries, a result partlyexpla<strong>in</strong>ed by the high average prevalence <strong>in</strong> the lowest <strong>in</strong>come qu<strong>in</strong>tile among the NMS12 countries(30%).Fig. 14. Prevalence of damp dwell<strong>in</strong>gs by <strong>in</strong>come qu<strong>in</strong>tile (2009)353025Qu<strong>in</strong>tile 1 (lowest <strong>in</strong>come)Qu<strong>in</strong>tile 2Qu<strong>in</strong>tile 3Qu<strong>in</strong>tile 4Qu<strong>in</strong>tile 5 (highest <strong>in</strong>come)Prevalence (%)20151050EU15NMS12EU27Source: data from EU-SILC, 2011.
42Chapter 2. Hous<strong>in</strong>g-related <strong>in</strong>equalitiesA more <strong>in</strong>-depth analysis by country (data not shown) highlights wide <strong>in</strong>come-related variations,particularly among EU15 countries. Southern <strong>Europe</strong>an countries such as Portugal, Greece and Italyshow the highest prevalences <strong>in</strong> the lowest <strong>in</strong>come qu<strong>in</strong>tiles (between 25% and 28%) while <strong>in</strong> Nordiccountries (such as Denmark, F<strong>in</strong>land, Norway and Sweden), the prevalence levels are much lower forthese groups (between 7% and 12%), lead<strong>in</strong>g to lower levels of <strong>in</strong>equality. Among the NMS12 countries,the steepest gradient of dampness across the <strong>in</strong>come qu<strong>in</strong>tiles is found <strong>in</strong> Romania and Poland, with35.5% and 30.1% prevalence <strong>in</strong> the lowest <strong>in</strong>come group and 8.7% and 7.4% <strong>in</strong> the highest, respectively.Compared to this, countries such as Slovenia (40.3% versus 21.4%) and Cyprus (35.0% versus 21.2%)show a lower level of <strong>in</strong>equality, but this is mostly because problems with damp are also common forhigh-<strong>in</strong>come households.Target groups for actionIn contrast to the other hous<strong>in</strong>g <strong>in</strong>equality <strong>in</strong>dicators considered above, liv<strong>in</strong>g <strong>in</strong> a damp dwell<strong>in</strong>g is ahous<strong>in</strong>g issue <strong>in</strong> both the EU15 and the NMS12 countries. Lower-<strong>in</strong>come populations <strong>in</strong> both regions(especially <strong>in</strong> the lowest <strong>in</strong>come qu<strong>in</strong>tile) constitute more exposed groups. This is particularly markedamong the NMS12 countries, where a large gap exists between the lowest <strong>in</strong>come qu<strong>in</strong>tile and theothers, giv<strong>in</strong>g a three-fold difference <strong>in</strong> exposure to dampness <strong>in</strong> the home between poor and rich.S<strong>in</strong>gle-parent households are also a group at higher risk: <strong>in</strong> all countries bar two, the risk of liv<strong>in</strong>g <strong>in</strong> adamp dwell<strong>in</strong>g is higher for s<strong>in</strong>gle-parent households than among the general population.<strong>Health</strong> implicationsDampness is associated with a broad array of detrimental health effects; the most common of theseare related to the deterioration of the respiratory system (Mudarri and Fisk, 2007), <strong>in</strong>clud<strong>in</strong>g a higherprevalence of respiratory symptoms, <strong>in</strong>creased risk of asthma, wheez<strong>in</strong>g cough (Pirastu et al., 2009)bronchitis, common cold and rh<strong>in</strong>itis (Pirhonen et al., 1996). Some studies showed a clear relationbetween dampness and mould and objective measures of lung function. Children’s respiratory health isparticularly damaged by liv<strong>in</strong>g <strong>in</strong> a damp or mouldy home (Tischer et al., 2011). Results based on theanalysis of data collected from 45 countries of the WHO <strong>Europe</strong>an Region estimate that a considerableproportion of childhood asthma cases are attributable to exposure to <strong>in</strong>door dampness and mould(Braubach, Jacobs and Ormandy, 2011). More precisely, it has been estimated that 0.07 asthma-relateddeaths and 50 asthma-related DALYs per 100 000 children per year are associated with exposure todampness <strong>in</strong> dwell<strong>in</strong>gs, and that 0.06 asthma-related deaths and 40 asthma-related DALYs per 100 000children per year are associated with exposure to mould. Irritations of the throat and eyes, allergies,rh<strong>in</strong>o-conjunctivitis and eczema have also been observed repeatedly (Bonnefoy, 2007; Zacharasiewicz etal., 2000; Simoni et al., 2005; McNally, Williams and Phillips, 2001).Conclusions and suggestionsDampness <strong>in</strong> the home is an issue <strong>in</strong> all 27 <strong>Europe</strong>an countries for which data were available. A largeproportion of the general population lives <strong>in</strong> homes where dampness is an issue. As with many otherrisk factors, socioeconomically disadvantaged households (particularly those <strong>in</strong> the two lowest <strong>in</strong>comequartiles) are most affected, as are s<strong>in</strong>gle-parent households.One reason for dampness and associated mould is related to the design and construction of build<strong>in</strong>gs;good design and proper construction can help to prevent problems from occurr<strong>in</strong>g (WHO, 2010b).Ma<strong>in</strong>tenance and use of build<strong>in</strong>gs can also be considered key factors to preserve healthy hous<strong>in</strong>g; forexample, a speedy response to water damage will help to keep the dwell<strong>in</strong>g <strong>in</strong> sound condition.
<strong>Environmental</strong> health <strong>in</strong>equalities <strong>in</strong> <strong>Europe</strong> 43Suggested mitigation actions are:• mak<strong>in</strong>g regulatory provisions so that all new residential build<strong>in</strong>g projects, private or public,provide adequate protection of build<strong>in</strong>g structures aga<strong>in</strong>st excess dampness and humidity –adequate levels of ventilation should be ma<strong>in</strong>ta<strong>in</strong>ed <strong>in</strong> all build<strong>in</strong>gs, irrespective of their useand ownership;• ensur<strong>in</strong>g that the problems of dampness, humidity and ventilation are considered whenrenovat<strong>in</strong>g exist<strong>in</strong>g and especially low-cost hous<strong>in</strong>g stock;• provid<strong>in</strong>g targeted f<strong>in</strong>ancial support to disadvantaged populations and those groups mostexposed to damp homes due to specific hous<strong>in</strong>g circumstances;• provid<strong>in</strong>g adequate hous<strong>in</strong>g conditions and affordable heat<strong>in</strong>g to economically disadvantagedand vulnerable larger households, s<strong>in</strong>ce overcrowded liv<strong>in</strong>g conditions and <strong>in</strong>door cold bothcontribute to dampness.The last recommendation l<strong>in</strong>ks the problem of dampness to other hous<strong>in</strong>g <strong>in</strong>equality <strong>in</strong>dicators discussed<strong>in</strong> this chapter: policies and actions to reduce overcrowd<strong>in</strong>g and <strong>in</strong>crease thermal comfort will have an<strong>in</strong>direct impact on the prevalence of dampness <strong>in</strong> the homes of disadvantaged populations groups.<strong>Inequalities</strong> <strong>in</strong> keep<strong>in</strong>g the home adequately warmIntroductionIn colder climates, liv<strong>in</strong>g <strong>in</strong> a comfortably heated home is commonly viewed as protective of humanhealth. WHO recommends a m<strong>in</strong>imum temperature of 21°C <strong>in</strong> liv<strong>in</strong>g rooms, and 18°C <strong>in</strong> all otherrooms (WHO, 2007). Households unable to ma<strong>in</strong>ta<strong>in</strong> this standard comfortable temperature, or thatrequire more than 10% of their <strong>in</strong>come to atta<strong>in</strong> the WHO standards, are described as liv<strong>in</strong>g <strong>in</strong> fuelpoverty (<strong>Europe</strong>an fuel poverty and energy efficiency: Epee Project, 2008). Many countries have policiesthat protect their most vulnerable population from cold-related health risks; the United K<strong>in</strong>gdom FuelPoverty Strategy (BERR, 2001), for example, aims to reduce fuel poverty by focus<strong>in</strong>g on people over 60years old, people liv<strong>in</strong>g with disabilities or long-term illnesses, and households with dependent children,and subsequently to eradicate fuel poverty by 2018 (Liddell and Morris, 2010).Fuel poverty disproportionately affects low-<strong>in</strong>come households, which must economize across all areasof the household budget and choose the most important expenses for their family. This economicdisadvantage is exacerbated by the poor energy efficiency standards of many of their homes. In <strong>Europe</strong>,between 50 and 125 million people are estimated to suffer from fuel poverty and the Epee Projectreveals that this number will <strong>in</strong>evitably rise <strong>in</strong> the future as global energy prices <strong>in</strong>crease. Approximatelyone-third of households <strong>in</strong> Northern Ireland and Wales live <strong>in</strong> fuel poverty, whereas 13% <strong>in</strong> Scotlandand 9% <strong>in</strong> England are affected by this problem (Shortt and Rugkåsa, 2007).It is important to recognize that a household’s <strong>in</strong>ability to keep the home adequately warm has serioushealth consequences. Extreme w<strong>in</strong>ter temperatures have been demonstrated to cause the prematuredeaths of tens of thousands of EU citizens each year. In a <strong>Europe</strong>an cross-country analysis (Healy, 2003)a significant association between poor hous<strong>in</strong>g – <strong>in</strong> terms of thermal efficiency – and high levels ofw<strong>in</strong>ter mortality was found. Further evidence suggests that the excess of w<strong>in</strong>ter mortality <strong>in</strong> the UnitedK<strong>in</strong>gdom is related to fuel poverty and is highest among the most disadvantaged population groups(Braubach and Fairburn, 2010).
44Chapter 2. Hous<strong>in</strong>g-related <strong>in</strong>equalitiesIndicator analysis: <strong>in</strong>equalities by <strong>in</strong>come, G<strong>in</strong>i <strong>in</strong>dex and household typeInability to keep the home warm constitutes a hous<strong>in</strong>g issue among both the NMS12 countries (18.4%prevalence among the general population) and – although to a lesser extent – the EU15 countries (6.9%prevalence). Of the NMS12 countries, Bulgaria has by far the highest prevalence at 64.2%, while Estoniahas the lowest at 1.7%; of the EU15 countries, Portugal has the highest prevalence and Luxembourg thelowest, at 28% and 0.3% respectively.Income levels <strong>in</strong>fluence the risk of exposure to cold homes across both subregions, and for manycountries, households below the poverty threshold are particularly strongly affected. The magnitudeof <strong>in</strong>come-related <strong>in</strong>equalities is <strong>in</strong> fact greater among the EU15 than among the NMS12 countries:on average, the prevalence of <strong>in</strong>ability to keep the home warm is 3.4 times higher for those <strong>in</strong> relativepoverty <strong>in</strong> the EU15 countries, but only 2.1 times higher <strong>in</strong> the NMS12 countries (see Fig. 15).Fig. 15. Prevalence of <strong>in</strong>ability to keep the home warm by relative poverty level (2009)Prevalence (%)90Above relative poverty level80 Below relative poverty levelIncome ratio706050403020100LuxembourgDenmarkF<strong>in</strong>landSwedenNetherlandsAustriaIrelandUnited K<strong>in</strong>gdomSpa<strong>in</strong>BelgiumFranceGermanyItalyGreecePortugalEU15EstoniaSloveniaSlovakiaCzech RepublicMaltaHungaryLatviaRomaniaLithuaniaPolandCyprusBulgariaNMS12EU27IcelandNorwaySwitzerland9876543210Ratio of prevalence (below:above relative poverty level)Source: data from EU-SILC, 2011.There is a general trend that countries with high prevalence rates of <strong>in</strong>ability to keep the home warmhave lower <strong>in</strong>come-related <strong>in</strong>equalities. The <strong>in</strong>equality ratio of 1.3:1 <strong>in</strong> Bulgaria is the lowest amongthe NMS12 countries, which, comb<strong>in</strong>ed with the country’s high prevalence rate, shows that keep<strong>in</strong>gthe home warm represents a widespread hous<strong>in</strong>g problem. The highest ratio is found <strong>in</strong> Luxembourg,at 5.5:1, but evaluation of this relative metric must take two facts <strong>in</strong>to account: only a small proportionof the general population Last (about bracket 0.3%) on second reported y-axis miss<strong>in</strong>g the problem, while prevalence among householdsbelow the poverty threshold is 1.1%. Similar f<strong>in</strong>d<strong>in</strong>gs are seen for Austria, the Netherlands, Estonia,Slovakia and Norway, all of which present a high level of <strong>in</strong>equality between populations above andbelow the poverty threshold (with a ratio of about 4:1 or higher), but a very low prevalence <strong>in</strong> the generalpopulation, at less than 4%. In comparison, countries such as Cyprus, Greece, Latvia and Poland mayneed to pay particular attention to this <strong>in</strong>dicator, s<strong>in</strong>ce their <strong>in</strong>equality ratios are at least 2:1 and highprevalence rates (above 15%) are observed <strong>in</strong> the general population.There is also a clear l<strong>in</strong>ear association between the G<strong>in</strong>i <strong>in</strong>dex <strong>in</strong>dicat<strong>in</strong>g national <strong>in</strong>come-related<strong>in</strong>equalities and reported <strong>in</strong>ability to keep the home warm (see Fig. 16): about 16% of the variability ofthe <strong>in</strong>equalities between the population above and below the poverty threshold is expla<strong>in</strong>ed by the G<strong>in</strong>i<strong>in</strong>dex (R2=0.16). When the <strong>in</strong>dex <strong>in</strong>creases by 1%, <strong>in</strong>come <strong>in</strong>equalities related to thermal comfort <strong>in</strong>w<strong>in</strong>ter decrease by 0.12. In other words, a lower G<strong>in</strong>i value, <strong>in</strong>dicat<strong>in</strong>g a lower general <strong>in</strong>come <strong>in</strong>equality,
<strong>Environmental</strong> health <strong>in</strong>equalities <strong>in</strong> <strong>Europe</strong> 45goes with a higher <strong>in</strong>come <strong>in</strong>equality related to thermal comfort. For example, compar<strong>in</strong>g Norwaywith Portugal, <strong>in</strong>come <strong>in</strong>equalities are higher <strong>in</strong> Portugal (G<strong>in</strong>i <strong>in</strong>dex of 24.1 <strong>in</strong> Norway and 35.4 <strong>in</strong>Portugal) whereas <strong>in</strong>equalities between populations above and below the poverty threshold are higher<strong>in</strong> Norway (ratios of 4:1 <strong>in</strong> Norway and 1.8:1 <strong>in</strong> Portugal).Fig. 16. Ratio of prevalence of <strong>in</strong>ability to keep the home warm (households below:households aboverelative poverty level, 2009) <strong>in</strong> relation to the G<strong>in</strong>i <strong>in</strong>dex (2009)6LUXPoverty ratio54321SVNSVKBEL NETNOR AUTFINIRESWECZHCYPHUNDENMATDEUESTFRAITA GREEU15EU27NMS12SWIICEPOLSPAUNKROMBULPORLTULVA020 22 24 26 28 30 32 34 36 38 40Source: data from EU-SILC, 2011.Note: see list of country abbreviations <strong>in</strong> Annex 4.G<strong>in</strong>i <strong>in</strong>dexThis means that <strong>in</strong>ability to keep the home warm is <strong>in</strong>versely related to the general level of <strong>in</strong>come<strong>in</strong>equality with<strong>in</strong> countries, <strong>in</strong>dicat<strong>in</strong>g that <strong>in</strong>equalities <strong>in</strong> thermal comfort <strong>in</strong> w<strong>in</strong>ter are not directlyassociated with national <strong>in</strong>come <strong>in</strong>equality patterns. This effect may result from the fact that <strong>in</strong> somecountries the difference of prevalence between <strong>in</strong>come groups is rather low (see Fig. 15).country acronym allocaon to be checked aer impot <strong>in</strong>to text chapterThe demographic groups most exposed to the problem of <strong>in</strong>ability to keep the home warm are not thesame across <strong>Europe</strong>an countries (see Fig. 17). One common po<strong>in</strong>t is that households with dependentchildren seem less affected by the problem (7.1% <strong>in</strong> the EU15 and 17.4% <strong>in</strong> the NMS12 countries)than s<strong>in</strong>gle households with one adult older than 65 years (8.3% <strong>in</strong> the EU15 and 27.5% <strong>in</strong> the NMS12countries) and s<strong>in</strong>gle-parent households (13.1% <strong>in</strong> the EU15 and 25.1% <strong>in</strong> the NMS12 countries). Bycontrast, s<strong>in</strong>gle-parent households have greater difficulty keep<strong>in</strong>g the home warm among the EU15countries, while among the NMS12 countries, the overall prevalence is higher for s<strong>in</strong>gle householdswith one adult older than 65 years. Among the EU15 countries, Portugal is an exception: the prevalenceof <strong>in</strong>ability to keep the home warm is much higher among s<strong>in</strong>gle households with one adult older than65 years (44%) than among s<strong>in</strong>gle-parent households (31%).Target groups for actionMost of the NMS12 countries present a high prevalence of problems with keep<strong>in</strong>g the home warm <strong>in</strong> thegeneral population, with Bulgaria show<strong>in</strong>g by far the highest level. With<strong>in</strong> countries, socioeconomicallydeprived populations report more problems with thermal comfort <strong>in</strong> w<strong>in</strong>ter <strong>in</strong> both the EU15 and theNMS12 countries, although the magnitude of this <strong>in</strong>equality is greater <strong>in</strong> western <strong>Europe</strong>. This resultis consistent with results obta<strong>in</strong>ed for the five other hous<strong>in</strong>g <strong>in</strong>dicators and corroborates the wealth ofknowledge <strong>in</strong> the exist<strong>in</strong>g literature report<strong>in</strong>g that socioeconomically disadvantaged groups are moresusceptible to environmental exposures.
46Chapter 2. Hous<strong>in</strong>g-related <strong>in</strong>equalitiesFig. 17. Prevalence of <strong>in</strong>ability to keep the home warm by household type (2009)807060Households with dependent childrenS<strong>in</strong>gle-parent households with dependent childrenHouseholds with one adult older than 65 yearsPrevalence (%)50403020100LuxembourgF<strong>in</strong>landSwedenNetherlandsDenmarkAustriaUnited K<strong>in</strong>gdomFranceIrelandSpa<strong>in</strong>BelgiumItalyGermanyPortugalGreeceEU15EstoniaSlovakiaSloveniaCzech RepublicHungaryMaltaLatviaCyprusRomaniaPolandLithuaniaBulgariaNMS12EU27IcelandNorwaySwitzerlandSource: data from EU-SILC, 2011.In the majority of countries, s<strong>in</strong>gle-parent households are most frequently unable to keep the homewarm and should be considered a group at high risk. Households with one adult older than 65 alsoconstitute a group prone to the problem <strong>in</strong> a few countries, <strong>in</strong>clud<strong>in</strong>g Bulgaria, Cyprus and Portugal.Further detailed <strong>in</strong>formation on potentially vulnerable groups is available from Serbia and Montenegro,show<strong>in</strong>g, for example, that education level may also have a strong impact on ability to heat the home(see Annex 1).<strong>Health</strong> implicationsAccord<strong>in</strong>g to the recent Marmot Review Team report (2011) on the health impacts of cold hous<strong>in</strong>g andfuel poverty, excess w<strong>in</strong>ter deaths (EWDs) are associated with thermal efficiency of hous<strong>in</strong>g and low<strong>in</strong>door temperatures. About 40% and 33% of EWDs are attributable to cardiovascular and respiratorydiseases respectively, the risk of EWD be<strong>in</strong>g almost three times higher <strong>in</strong> the quartile of houses withcoldest <strong>in</strong>door temperatures than <strong>in</strong> the warmest quartile. A WHO report on the burden of disease of<strong>in</strong>adequate hous<strong>in</strong>g quantified as 30% the proportion of EWDs attributable to cold hous<strong>in</strong>g (Braubach,Jacobs and Ormandy, 2011).A BMJ editorial comment<strong>in</strong>g on the Marmot Review Team report concludes that “although the extradeaths <strong>in</strong> elderly people are caused ma<strong>in</strong>ly by cardiovascular and respiratory disease, far greater numbershave m<strong>in</strong>or ailments that lead to a huge burden of disease, costs to the health system, and misery” (Dearand McMichael, 2011). Non-fatal cardiovascular and respiratory diseases are also l<strong>in</strong>ked to low <strong>in</strong>doortemperature, which exacerbates exist<strong>in</strong>g conditions such as arthritis and rheumatism, <strong>in</strong>creased bloodpressure and risk of stroke, social isolation and adverse effects on children’s education and nutrition(Shortt and Rugkåsa, 2007). Children are especially at risk, <strong>in</strong> particular for respiratory problems thatare, <strong>in</strong> part, due to the development of moulds <strong>in</strong> the humid environments of cold houses. The MarmotReview Team (2011) also reports that mental health is negatively affected by fuel poverty and coldhous<strong>in</strong>g <strong>in</strong> all age groups, with a fivefold <strong>in</strong>crease <strong>in</strong> risk of poor mental health among adolescents liv<strong>in</strong>g<strong>in</strong> cold hous<strong>in</strong>g than those <strong>in</strong> warmer houses.Conclusions and suggestionsInability to keep the home warm is an important hous<strong>in</strong>g issue <strong>in</strong> most <strong>Europe</strong>an countries, and a highlevel of <strong>in</strong>equality is also apparent. Population subgroups liv<strong>in</strong>g <strong>in</strong> relative poverty are significantly moreaffected, with several countries show<strong>in</strong>g three or four times higher prevalence rates for households belowthan those above the poverty threshold. <strong>Inequalities</strong> <strong>in</strong> exposure to cold homes are also identified fors<strong>in</strong>gle-parent households and, to a lesser extent, households with one adult older than 65 years.
<strong>Environmental</strong> health <strong>in</strong>equalities <strong>in</strong> <strong>Europe</strong> 47Suggested mitigation actions are:• offer<strong>in</strong>g special energy prices or f<strong>in</strong>ancial support to the most vulnerable households (especiallythose <strong>in</strong> relative poverty and households with children), allow<strong>in</strong>g them to pay for the energyneeded to ma<strong>in</strong>ta<strong>in</strong> an appropriate temperature <strong>in</strong>side the home;• ensur<strong>in</strong>g efficient <strong>in</strong>sulation to reduce energy consumption and related expenses – poorerhouseholds often live <strong>in</strong> the least energy-efficient homes, and will thus need f<strong>in</strong>ancial supportto afford thermal <strong>in</strong>sulation;• build<strong>in</strong>g and rehabilitation of social hous<strong>in</strong>g to meet energy standards and reduce households’energy expenses;• giv<strong>in</strong>g consideration at a local scale, <strong>in</strong> accordance with general energy-sav<strong>in</strong>g policies, to theavailability of low-cost energy sources such as wood, residual agricultural biomass, w<strong>in</strong>d andgeothermal sources, depend<strong>in</strong>g on the local situation and opportunities;• provid<strong>in</strong>g measures and <strong>in</strong>formation from a health perspective to avoid an extreme focus onsav<strong>in</strong>g energy lead<strong>in</strong>g to reduced air exchange and a deterioration of <strong>in</strong>door air quality: a goodbalance is required between ventilation and <strong>in</strong>sulation.<strong>Inequalities</strong> <strong>in</strong> keep<strong>in</strong>g the home adequately coolAlthough it falls outside the environmental health <strong>in</strong>equality <strong>in</strong>dicator set, the EU-SILC database alsooffers data on dwell<strong>in</strong>gs that cannot be kept cool <strong>in</strong> summer, enabl<strong>in</strong>g comparison with the oppositethermal comfort <strong>in</strong>dicator discussed above. Globally, the proportion of the general population unable tokeep the dwell<strong>in</strong>g comfortably cool <strong>in</strong> summer is higher than the proportion unable to keep the homewarm <strong>in</strong> w<strong>in</strong>ter, show<strong>in</strong>g that summer temperatures may be a ris<strong>in</strong>g problem. Much higher prevalencelevels can be found among the NMS12 countries (average 37.7%) than among the EU15 countries(average 24.2%).Moreover, there is a clear gradient <strong>in</strong> the proportion of the population not comfortably cool <strong>in</strong> thedwell<strong>in</strong>g dur<strong>in</strong>g the summer from the lowest <strong>in</strong>come qu<strong>in</strong>tile to the highest (see Fig. 18). The trendappears steeper among the EU15 countries than among the NMS12 countries, where the highest<strong>in</strong>come qu<strong>in</strong>tile is much more affected than the lowest <strong>in</strong> the EU15.Fig. 18. Prevalence of <strong>in</strong>ability to keep the home adequately cool <strong>in</strong> summer by <strong>in</strong>come qu<strong>in</strong>tile (2007)Prevalence (%)5045403530252015105Qu<strong>in</strong>tile 1 (lowest <strong>in</strong>come)Qu<strong>in</strong>tile 2Qu<strong>in</strong>tile 3Qu<strong>in</strong>tile 4Qu<strong>in</strong>tile 5 (highest <strong>in</strong>come)0EU15NMS12EU27Source: data from EU-SILC, 2011.
48Chapter 2. Hous<strong>in</strong>g-related <strong>in</strong>equalitiesThere are strong variations with<strong>in</strong> both the EU15 and the NMS12 countries, with the overall prevalenceof not be<strong>in</strong>g comfortably cool <strong>in</strong> summer largely affected by geographical location and climate (see Fig.19). However, the data also <strong>in</strong>dicate that the impact of <strong>in</strong>come on problems with <strong>in</strong>door temperatures<strong>in</strong> summer is very diverse, depend<strong>in</strong>g on the country.The <strong>in</strong>equalities across the <strong>in</strong>come qu<strong>in</strong>tiles seem most strongly expressed <strong>in</strong> hot climates such asGreece, Italy, Portugal and Cyprus, which show a prevalence difference of around or even beyond 20%,with Greece and Cyprus <strong>in</strong>dicat<strong>in</strong>g an <strong>in</strong>come ratio of 2:1 between the lowest- and highest-<strong>in</strong>comepopulation qu<strong>in</strong>tiles. Of further note is the f<strong>in</strong>d<strong>in</strong>g <strong>in</strong> Lithuania and Hungary, where further explorationis needed to expla<strong>in</strong> the reverse f<strong>in</strong>d<strong>in</strong>g that high-<strong>in</strong>come households are more affected. F<strong>in</strong>ally, the dataalso <strong>in</strong>dicate that the problem of keep<strong>in</strong>g the home cool <strong>in</strong> summer is less clearly related to <strong>in</strong>come levelsthan was the case for keep<strong>in</strong>g the home warm <strong>in</strong> w<strong>in</strong>ter (where <strong>in</strong>come ratios were higher than 3:1 formany EU15 and several NMS12 countries: see Fig. 15).Fig. 19. Prevalence of <strong>in</strong>ability to keep the home adequately cool <strong>in</strong> summer by <strong>in</strong>come (2007)6050Qu<strong>in</strong>tile 1 (lowest <strong>in</strong>come)Qu<strong>in</strong>tile 5 (highest <strong>in</strong>come)All <strong>in</strong>comesPrevalence (%)403020100IrelandUnited K<strong>in</strong>gdomSwedenBelgiumF<strong>in</strong>landDenmarkAustriaNetherlandsGermanyLuxembourgFranceSpa<strong>in</strong>GreeceItalyPortugalEU15MaltaEstoniaLithuaniaSloveniaHungarySlovakiaCzech RepublicLatviaPolandCyprusNMS12 countriesEU27 countriesIcelandNorwaySource: data from EU-SILC, 2011.Conclusion on hous<strong>in</strong>g-related <strong>in</strong>equalitiesFrom a public health perspective, two aspects of hous<strong>in</strong>g <strong>in</strong>equality can be dist<strong>in</strong>guished: <strong>in</strong>equalitiesrelat<strong>in</strong>g to the basic needs of water and equipment availability for dr<strong>in</strong>k<strong>in</strong>g, cook<strong>in</strong>g and hygiene onthe one hand, and <strong>in</strong>equalities relat<strong>in</strong>g to overcrowd<strong>in</strong>g, dampness and the capacity to keep the homewarm or cool on the other. The ma<strong>in</strong> health effects associated with water and sanitation <strong>in</strong>dicatorsare <strong>in</strong>fectious diseases, while those associated with the latter <strong>in</strong>dicators are allergic and respiratoryor cardiovascular diseases. This analysis reflects the dist<strong>in</strong>ction between these two different aspects,show<strong>in</strong>g that the former is of particular concern <strong>in</strong> the NMS12 countries, whereas the latter affects boththe NMS12 and the EU15 countries.The analysis also clearly demonstrates that a high proportion of the population liv<strong>in</strong>g <strong>in</strong> the NMS12countries has no flush toilet and no bath or shower <strong>in</strong> the dwell<strong>in</strong>g. Because absence of sanitationequipment <strong>in</strong>side the home has such considerable health consequences, hous<strong>in</strong>g policies should ensurethat all new residences <strong>in</strong> public build<strong>in</strong>gs or private houses offer such basic commodities. This requiresthat no construction should be allowed without a permit from local authorities that will check that notonly the build<strong>in</strong>g plans but also the reality conform to this obligation. Regard<strong>in</strong>g pre-exist<strong>in</strong>g premises,the data clearly show that poverty is the key risk factor for absence of a toilet and shower or bath.
<strong>Environmental</strong> health <strong>in</strong>equalities <strong>in</strong> <strong>Europe</strong> 49Hous<strong>in</strong>g and public health policies should therefore target low-<strong>in</strong>come household groups <strong>in</strong>clud<strong>in</strong>gs<strong>in</strong>gle-parent families – a particularly vulnerable category – for the delivery of social aid and funds tohelp reduce the prevalence of this problem. Indeed, the study reveals that the comb<strong>in</strong>ation of these twosocioeconomic characteristics of poverty and s<strong>in</strong>gle parenthood gives rise to a particularly exposed andvulnerable group that could be considered a priority for targeted action <strong>in</strong> many countries.Accessibility (and affordability) of dr<strong>in</strong>k<strong>in</strong>g-water has also been shown to be a serious issue <strong>in</strong> manycountries of the eastern part of the WHO <strong>Europe</strong>an Region – particularly, but not solely, <strong>in</strong> rural areas.Moreover, the analysis reveals that although the prevalence of <strong>in</strong>adequate water supply has tended todecrease for all countries s<strong>in</strong>ce 1995, it rema<strong>in</strong>s very high for the Euro 3 countries. Tak<strong>in</strong>g the significanthealth consequences <strong>in</strong>to account once aga<strong>in</strong>, the same rationale for the necessity for <strong>in</strong>stall<strong>in</strong>g sanitationequipment should apply to the obligation to connect water networks to all new and old dwell<strong>in</strong>gs <strong>in</strong>urban areas. In addition, provision should be made at national and regional levels to help <strong>in</strong>vestments <strong>in</strong>rural areas that would develop community water systems <strong>in</strong> small towns and villages.The data provide strong evidence that the non-sanitary hous<strong>in</strong>g <strong>in</strong>equalities – overcrowd<strong>in</strong>g, dampnessand thermal comfort related to cool and warm homes – exist <strong>in</strong> almost every country. Once aga<strong>in</strong>,low-<strong>in</strong>come populations, and especially low-<strong>in</strong>come s<strong>in</strong>gle-parent households, are most affected acrossall <strong>in</strong>dicators. This requires particular attention because this comb<strong>in</strong>ation of disadvantages has beenidentified as the group most exposed to substandard hous<strong>in</strong>g <strong>in</strong> many countries.Progress <strong>in</strong> the areas of overcrowd<strong>in</strong>g, dampness and thermal comfort can be made through acomb<strong>in</strong>ation of hous<strong>in</strong>g and social policies and should be regulated by national laws to ensure theireffective implementation throughout the country. All new build<strong>in</strong>g programmes should be obliged toprovide a m<strong>in</strong>imum proportion of dwell<strong>in</strong>gs with a large number of rooms <strong>in</strong> order to host large families,with low-cost homes for rent or for purchase, the figures depend<strong>in</strong>g on national demographic andsociocultural characteristics. Rehabilitation programmes for exist<strong>in</strong>g build<strong>in</strong>gs should aim to achievethe same goal. Dedicated f<strong>in</strong>ancial support should also be targeted to economically disadvantagedgroups to cope with the costs of energy (for heat<strong>in</strong>g or cool<strong>in</strong>g) and to help them improve <strong>in</strong>sulationand ventilation of the dwell<strong>in</strong>g.ReferencesBaker M et al. (2000). Household crowd<strong>in</strong>g a major risk factor for epidemic men<strong>in</strong>gococcal disease <strong>in</strong> Aucklandchildren. Pediatric Infectious Disease Journal, 19(10):983–990.Bernste<strong>in</strong> JA et al. (2008). The health effects of non-<strong>in</strong>dustrial <strong>in</strong>door air pollution. Journal of Allergy and Cl<strong>in</strong>icalImmunology, 121(3):585–591.BERR (2001).The UK fuel poverty strategy. London, Department for Bus<strong>in</strong>ess Enterprise and Regulatory Reform(http://webarchive.nationalarchives.gov.uk/+/http://www.berr.gov.uk/files/file16495.pdf, accessed 14 November2011).Bolte G, Mielck A, eds. (2004). Umweltgerechtigkeit. Die soziale Verteilung von Umweltbe-lastungen [<strong>Environmental</strong>justice. The social distribution of environmental exposures]. We<strong>in</strong>heim, Juventa.Bonnefoy X (2007). Inadequate hous<strong>in</strong>g and health: an overview. International Journal of Environment andPollution, 30(3/4):411–429.Bradley D (1977). <strong>Health</strong> aspects of water supplies <strong>in</strong> tropical countries. In: Feachem R, McGarry M, Mara D, eds.Water, wastes and health <strong>in</strong> hot climates. Chichester, John Wiley.Braubach M, Fairburn J (2010). Social <strong>in</strong>equities <strong>in</strong> environmental risks associated with hous<strong>in</strong>g and residentiallocation—a review of evidence. <strong>Europe</strong>an Journal of Public <strong>Health</strong>, 20(1):36–42.Braubach M, Jacobs D, Ormandy D, eds. (2011). <strong>Environmental</strong> burden of disease associated with <strong>in</strong>adequate hous<strong>in</strong>g:methods for quantify<strong>in</strong>g health impacts of selected hous<strong>in</strong>g risks <strong>in</strong> the WHO <strong>Europe</strong>an Region. Copenhagen, WHORegional Office for <strong>Europe</strong> (http://www.euro.who.<strong>in</strong>t/__data/assets/pdf_file/0003/142077/e95004.pdf, accessed 7November 2011).
50Chapter 2. Hous<strong>in</strong>g-related <strong>in</strong>equalitiesBreysse P et al. (2004). The relationship between hous<strong>in</strong>g and health: children at risk. <strong>Environmental</strong> <strong>Health</strong>Perspectives, 112:1583–1588.Butler S et al. (2003). Problems with damp and cold hous<strong>in</strong>g among Pacific families <strong>in</strong> New Zealand. New ZealandMedical Journal, 116(1177):494.Cairncross S, Feachem R (1993). <strong>Environmental</strong> health eng<strong>in</strong>eer<strong>in</strong>g <strong>in</strong> the tropics: an <strong>in</strong>troductory text, 2nd ed.Chichester, John Wiley.Clasen T et al. (2007). Interventions to improve water quality for prevent<strong>in</strong>g diarrhoea: systematic review andmeta-analysis. British Medical Journal, 334(7597):782–785.Dear KBG, McMichael AJ (2011). The health impacts of cold homes and fuel poverty. Three reasons to act: thehealth burden, <strong>in</strong>equity, and mitigation. British Medical Journal, 342:d2807.<strong>Europe</strong>an fuel poverty and energy efficiency: Epee Project [web site] (2008). Valbonne, Alpheeis (http://www.fuelpoverty.org,accessed 13 October 2011).EU-SILC [onl<strong>in</strong>e database] (2011). Luxembourg, Eurostat (http://epp.eurostat.ec.europa.eu/portal/page/portal/microdata/eu_silc, downloaded on 9 November 2011).Evans GW, English K (2002). The environment of poverty, multiple stressor exposure, psychophysical stress, andsocioemotional adjustment. Child Development, 73(4):1238–1248.Evans GW, Saegert S, Harris R (2001). Residential density and psychological health among children <strong>in</strong> low <strong>in</strong>comefamilies. Environment and Behavior, 33(2):165–180.Evans GW, Saltzman H, Cooperman J (2001). Hous<strong>in</strong>g quality and children’s socioemotional health, Environmentand Behavior, 33(3):389–399.FEANTSA (2008). <strong>Europe</strong>an report: the role of hous<strong>in</strong>g <strong>in</strong> pathways <strong>in</strong>to and out of homelessness. Annual theme 2008:hous<strong>in</strong>g and homelessness. Brussels, <strong>Europe</strong>an Federation of National Organisations Work<strong>in</strong>g with the Homeless.Fewtrell L et al. (2005). Water, sanitation, and hygiene <strong>in</strong>terventions to reduce diarrhoea <strong>in</strong> less developedcountries: A systematic review and meta-analysis. Lancet Infectious Diseases, 5(1):42–52.Fisk WJ, Lei-Gomez Q, Mendell MJ (2007). Meta-analyses of the associations of respiratory health effects withdampness and mold <strong>in</strong> homes. Indoor Air, 17(4):284–296.Galobardes B et al. (2006). Indicators of socioeconomic position (part 1). Journal of Epidemiology and Community<strong>Health</strong>, 60(1):7–12.Genser B et al. (2008). Impact of a city-wide sanitation <strong>in</strong>tervention <strong>in</strong> a large urban centre on social,environmental and behavioural determ<strong>in</strong>ants of childhood diarrhoea: analysis of two cohort studies. InternationalJournal of Epidemiology, 37(4):831–840.Harrison J, Barrow S, Creed F (1998). Mental health <strong>in</strong> the north west region of England: associations withdeprivation. Social Psychiatry and Psychiatric Epidemiology, 33(3):124–128.Healy JD. (2003) Excess w<strong>in</strong>ter mortality <strong>in</strong> <strong>Europe</strong>: a cross country analysis identify<strong>in</strong>g key risk factors. Journal ofEpidemiology and Community <strong>Health</strong>, 57(10):784–789.Howard G, Bartram J (2003). Domestic water quantity, service level and health. Geneva, <strong>World</strong> <strong>Health</strong> <strong>Organization</strong>(http://www.who.<strong>in</strong>t/water_sanitation_health/diseases/WSH03.02.pdf, accessed 7 November 2011).Howden-Chapman P (2002). Hous<strong>in</strong>g and <strong>in</strong>equalities <strong>in</strong> health. Journal of Epidemiology and Community <strong>Health</strong>,56:645–646.Humphrey, JH (2009). Child undernutrition, tropical enteropathy, toilets, and handwash<strong>in</strong>g. Lancet,374(9694):1032–1035.Hunter PR, Zmirou-Navier D, Hartemann P (2009). Estimat<strong>in</strong>g the impact on health of poor reliability ofdr<strong>in</strong>k<strong>in</strong>g water <strong>in</strong>terventions <strong>in</strong> develop<strong>in</strong>g countries. Science of the Total Environment, 407(8):2621–2624.Hutton G, Bartram, J (2008). Global costs of atta<strong>in</strong><strong>in</strong>g the Millennium Development Goals. Bullet<strong>in</strong> of the <strong>World</strong><strong>Health</strong> <strong>Organization</strong>, 86(1):13–19 (http://www.who.<strong>in</strong>t/bullet<strong>in</strong>/volumes/86/1/07-046045/en/, accessed 24 2011).Katukiza A et al. (2010). Selection of susta<strong>in</strong>able sanitation technologies for urban slums—a case of Bwaise III <strong>in</strong>Kampala, Uganda. Science of the Total Environment, 409(1):52–62.
<strong>Environmental</strong> health <strong>in</strong>equalities <strong>in</strong> <strong>Europe</strong> 51Kohlhuber M et al. (2006). Social <strong>in</strong>equality <strong>in</strong> perceived environmental exposures <strong>in</strong> relation to hous<strong>in</strong>g conditions<strong>in</strong> Germany. <strong>Environmental</strong> Research, 101(2):246–255.Krieger J, Higg<strong>in</strong>s DL (2002). Hous<strong>in</strong>g and health: time aga<strong>in</strong> for public health action. American Journal of Public<strong>Health</strong>, 92(5):758–768.Liddell C, Morris C (2010). Fuel poverty and human health: a review of recent evidence. Energy Policy, 38:2987–2997.Luna EJ et al. (1992). Epidemiology of trachoma <strong>in</strong> Bebedouro State of Sao Paulo, Brazil: prevalence and riskfactors. International Journal of Epidemiology, 21(1):169–177.Maani SA, Vaithianathan R, Wolfe B (2006). Inequality and health: is hous<strong>in</strong>g crowd<strong>in</strong>g the l<strong>in</strong>k? Motu Work<strong>in</strong>gPaper 06–09. Well<strong>in</strong>gton, Motu Economic and Public Policy Research.Marmot Review Team (2011). The health impacts of cold homes and fuel poverty. London, Friends of the Earth andMarmot Review Team (http://www.foe.co.uk/resource/reports/cold_homes_health.pdf, accessed 7 November2011).McNally NJ, Williams HC, Phillips DR (2001). Atopic eczema and the home environment. British Journal ofDermatology, 145(5):730–736.Mielck A, He<strong>in</strong>rich J (2002). Social <strong>in</strong>equalities and distribution of the environmental burden among thepopulation (environmental justice). Gesundheitswesen, 64(7):405–16.M<strong>in</strong>istry of Social Development (2010). The social report 2010: te purongo oranga tangata. Well<strong>in</strong>gton, M<strong>in</strong>istry ofSocial Development.Mudarri D, Fisk WJ (2007). Public health and economic impact of dampness and mold. Indoor Air, 17(3):226–235.OECD.Stat Extracts [onl<strong>in</strong>e database] (2011). Paris, OECD (http://stats.oecd.org/Index.aspx, accessed 9November 2011).OHCHR (2011). Special Rapporteur on the human right to safe dr<strong>in</strong>k<strong>in</strong>g water and sanitation [web site]. Geneva,Office of the High Commissioner for Human Rights. (http://www.ohchr.org/EN/Issues/WaterAndSanitation/SRWater/Pages/SRWaterIndex.aspx, accessed 24 May 2011).Pirastu R et al. (2009). Indoor exposure to environmental tobacco smoke and dampness: respiratory symptoms <strong>in</strong>Sard<strong>in</strong>ian children—DRIAS study. <strong>Environmental</strong> Research, 109(1):59–65.Pirhonen I et al. (1996). Home dampness, moulds and their <strong>in</strong>fluence on respiratory <strong>in</strong>fections and symptoms <strong>in</strong>adults <strong>in</strong> F<strong>in</strong>land. <strong>Europe</strong>an Respiratory Journal, 9(12):2618–2622.Poort<strong>in</strong>ga W, Dunstan FD, Fone DL (2008). Neighbourhood deprivation and self-rated health: the role ofperceptions of the neighbourhood and of hous<strong>in</strong>g problems. <strong>Health</strong> & Place, 14(3):562–575.Prüss A, Mariotti SP (2000). Prevent<strong>in</strong>g trachoma through environmental sanitation: a review of the evidence base.Bullet<strong>in</strong> of the <strong>World</strong> <strong>Health</strong> <strong>Organization</strong>, 78(2):258–266.Rauh VA, Landrigan PJ, Claudio L (2008). Hous<strong>in</strong>g and health: <strong>in</strong>tersection of poverty and environmentalexposures. Annals of the New York Academy of Sciences, 1136:276–288.Sakhaie E et al. (2001). Risk factors for persistent diarrhea <strong>in</strong> children under five years of age <strong>in</strong> the south ofTehran. Iranian South Medical Journal, 3(2):117–122.Sandel M, Wright RJ (2006). When home is where the stress is: expand<strong>in</strong>g the dimensions of hous<strong>in</strong>g that<strong>in</strong>fluence asthma morbidity. Archives of Disease <strong>in</strong> Childhood, 91(11):942–948.Shortt N, Rugkåsa J (2007). “The walls were so damp and cold” fuel poverty and ill health <strong>in</strong> Northern Ireland:results from a hous<strong>in</strong>g <strong>in</strong>tervention. <strong>Health</strong> & Place, 13(1):99–110.Simoni M et al. (2005). Mould/dampness exposure at home is associated with respiratory disorders <strong>in</strong> Italianchildren and adolescents: the SIDRIA-2 Study. Occupational and <strong>Environmental</strong> Medic<strong>in</strong>e, 62(9):616–622.Social Care Institute for Excellence (2005). SCIE research brief<strong>in</strong>g 19: What is the impact of environmental hous<strong>in</strong>gconditions on the health and well-be<strong>in</strong>g of children? London, Social Care Institute for Excellence.Tischer C et al. (2011). Respiratory health <strong>in</strong> children, and <strong>in</strong>door exposure to (1,3)-β-D-glucan, EPS mouldcomponents and endotox<strong>in</strong>. <strong>Europe</strong>an Respiratory Journal, 37(5):1050–1059.
52Chapter 2. Hous<strong>in</strong>g-related <strong>in</strong>equalitiesUNDP (2011). <strong>World</strong> water day: situation critical for water supply and sanitation <strong>in</strong> <strong>Europe</strong> and Central Asia. NewYork, UNDP (http://europeandcis.undp.org/home/show/707ADE83-F203-1EE9-BF3D08FC372EA619,accessed 9 November 2011).UNECE (<strong>in</strong> press). No one left beh<strong>in</strong>d. Good practices to ensure equitable access to water and sanitation <strong>in</strong> the pan-<strong>Europe</strong>an region. Geneva, UNECE.UNICEF (2011). Water, sanitation and hygiene [web site]. (http://www.unicef.org/wash/<strong>in</strong>dex_3951.html,accessed 25 May 2011).United Nations (2010). Millennium Development Goals Report 2010. New York, United Nations Department ofEconomic and Social Affairs.United Nations Human Rights Council (2010). Human Rights Council resolution A/HRC/15/L.14 on human rightsand access to safe dr<strong>in</strong>k<strong>in</strong>g water and sanitation. Geneva, United Nations Human Rights Council (http://ap.ohchr.org/documents/dpage_e.aspx?si=A/HRC/15/L.14, accessed 21 January 2012).United Nations Millennium Project (2005). Invest<strong>in</strong>g <strong>in</strong> development: a practical plan to achieve the MillenniumDevelopment Goals. New York, UNDP.Water Aid (2010). Abandon<strong>in</strong>g open defecation: comparison and adaptation of social change dynamics. Accra, Water AidGhana (http://www.wateraid.org/documents/plug<strong>in</strong>_documents/social_transformation_study_brief<strong>in</strong>g_note.pdf,accessed 7 November 2011).Water Supply and Sanitation Collaborative Council (2010). Global Sanitation Fund: pr<strong>in</strong>ciples [web site]. Geneva,Water Supply and Sanitation Collaborative Council (http://www.wsscc.org/global-sanitation-fund/pr<strong>in</strong>ciples,accessed 6 July 2010).WHO (2007). Hous<strong>in</strong>g, energy and thermal comfort: a review of 10 countries with<strong>in</strong> the WHO <strong>Europe</strong>an Region, 2007.Copenhagen, WHO Regional Office for <strong>Europe</strong> (http://www.euro.who.<strong>in</strong>t/__data/assets/pdf_file/0008/97091/E89887.pdf, accessed 7 November 2011).WHO (2009). WHO Guidel<strong>in</strong>es for <strong>in</strong>door air quality: dampness and mould. Copenhagen, WHO Regional Office for<strong>Europe</strong> (http://www.euro.who.<strong>in</strong>t/__data/assets/pdf_file/0017/43325/E92645.pdf, accessed 7 November 2011).WHO (2010a). News release: access to safe dr<strong>in</strong>k<strong>in</strong>g water improv<strong>in</strong>g; sanitation needs greater efforts. Geneva, <strong>World</strong><strong>Health</strong> <strong>Organization</strong> (http://www.who.<strong>in</strong>t/mediacentre/news/releases/2010/water_20100315/en/<strong>in</strong>dex.html,accessed 25 May 2011).WHO (2010b). Technical and policy recommendations to reduce health risks due to dampness and mould. Copenhagen,WHO Regional Office for <strong>Europe</strong> (http://www.euro.who.<strong>in</strong>t/__data/assets/pdf_file/0015/121425/E92998.pdf,accessed 7 November 2011).WHO (2011a). Towards environmental health <strong>in</strong>equality report<strong>in</strong>g. Report of an expert group meet<strong>in</strong>g, Bonn, Germany,25–26 October 2010. Copenhagen, WHO Regional Office for <strong>Europe</strong> (http://www.euro.who.<strong>in</strong>t/__data/assets/pdf_file/0013/130243/e94628.pdf, accessed 7 November 2011).WHO (2011b). Small-scale water supplies <strong>in</strong> the pan-<strong>Europe</strong>an Region: background, challenges, improvements.Copenhagen, WHO Regional Office for <strong>Europe</strong> (http://www.euro.who.<strong>in</strong>t/__data/assets/pdf_file/0018/140355/e94968.pdf, accessed 7 November 2011).WHO (2011c). Water sanitation and health: water supply, sanitation and hygiene development. Geneva, <strong>World</strong> <strong>Health</strong><strong>Organization</strong> (http://www.who.<strong>in</strong>t/water_sanitation_health/hygiene/en/, accessed 25 May 2011).WHO/UNICEF JMP for Water Supply and Sanitation (2010). Progress on sanitation and dr<strong>in</strong>k<strong>in</strong>g-water: 2010update. Geneva, <strong>World</strong> <strong>Health</strong> <strong>Organization</strong> (http://www.unwater.org/downloads/JMP_report_2010.pdf, accessed7 November 2011).WHO/UNICEF JMP for Water Supply and Sanitation [web site] (2011). Geneva, <strong>World</strong> <strong>Health</strong> <strong>Organization</strong>;New York, UNICEF (http://www.wss<strong>in</strong>fo.org/about-the-jmp/<strong>in</strong>troduction/, accessed 7 November 2011).Zacharasiewicz A et al. (2000). Symptoms suggestive of atopic rh<strong>in</strong>itis <strong>in</strong> children aged 6–9 years and the <strong>in</strong>doorenvironment. Allergy, 55(10):945–950.
CHAPTER3INJURY-RELATEDINEQUALITIES
54Chapter 3. Injury-related <strong>in</strong>equalitiesChapter 3. Injury-related<strong>in</strong>equalitiesIngrid Fast, Matthias Braubach, Francesco Mitis, Lucie LaflammeKey messagesIn general terms, un<strong>in</strong>tentional <strong>in</strong>juries related to or <strong>in</strong>fluenced by environmental conditions area major challenge for public health.• Un<strong>in</strong>tentional <strong>in</strong>juries are the third lead<strong>in</strong>g cause of death <strong>in</strong> <strong>Europe</strong> and the associatedmorbidity puts a high level of demand on health systems.• Un<strong>in</strong>tentional <strong>in</strong>juries are one of the causes of mortality and morbidity with the steepestsocioeconomic gradient, affect<strong>in</strong>g lower-<strong>in</strong>come people and areas to a greater extent.• Un<strong>in</strong>tentional <strong>in</strong>juries can be prevented through a range of evidence-based measures.This chapter specifically reports on sex- and age-related <strong>in</strong>equalities, as well as on differences bynational <strong>in</strong>come levels, for four <strong>in</strong>jury-related <strong>in</strong>equality <strong>in</strong>dicators, highlight<strong>in</strong>g the follow<strong>in</strong>gfactors.• Males susta<strong>in</strong> far more fatal road traffic <strong>in</strong>juries (RTIs), falls, and poison<strong>in</strong>gs than females, andthe same applies to non-fatal work-related <strong>in</strong>juries.• The strongest sex-related <strong>in</strong>equality is found for RTIs, where <strong>in</strong>cidence among males is fourtimes greater than among females.• Age-related <strong>in</strong>equalities exist but are not systematic; they differ <strong>in</strong> magnitude and <strong>in</strong> directionacross <strong>in</strong>dicators.• The highest age-related disparities are found for fatal falls, where rates among the elderly areextremely high. By contrast, work-related <strong>in</strong>jury rates do not vary remarkably with age <strong>in</strong> manycountries.• At country level, low- and middle-<strong>in</strong>come countries have generally higher RTI and poison<strong>in</strong>gmortality rates than high-<strong>in</strong>come countries.• Country variations <strong>in</strong> <strong>in</strong>jury-related <strong>in</strong>equalities can be very significant, with differencesbetween lowest and highest <strong>in</strong>equality levels often fivefold or more. However, these differencesstrongly depend on the respective <strong>in</strong>equality <strong>in</strong>dicator.
<strong>Environmental</strong> health <strong>in</strong>equalities <strong>in</strong> <strong>Europe</strong> 55IntroductionInjuries are a lead<strong>in</strong>g cause of mortality worldwide, responsible for 9% of all deaths globally and 7% <strong>in</strong> theWHO <strong>Europe</strong>an Region (WHO, 2011). They are also responsible for a great deal of morbidity; <strong>in</strong>juredpeople are frequently admitted to hospital and, even more frequently, receive care through outpatientvisits and medical consultations and treatments (see Fig. 20). Although their consequences are oftenm<strong>in</strong>or, some <strong>in</strong>juries may have long-last<strong>in</strong>g and permanent negative consequences – not only physical(such as life-long disability) but also psychological (such as post-traumatic stress disorder (PTSD)) orsocial. Superficial or open wounds, contusions, dislocations and fractures are among the most commontypes of <strong>in</strong>juries susta<strong>in</strong>ed (Sethi et al., 2006a).Fig. 20. Pyramid of un<strong>in</strong>tentional <strong>in</strong>juries1 fatality36 hospital admissions185 hospital outpatients98 other medical treatmentsSource: data from Bauer and Ste<strong>in</strong>er, 2009, adapted.Although <strong>in</strong>jury rates have fallen slightly <strong>in</strong> <strong>Europe</strong> dur<strong>in</strong>g the past decade, there is broad scope forimprovement: both global <strong>in</strong>jury rates and the unequal distribution of <strong>in</strong>juries with<strong>in</strong> and betweencountries can be tackled and reduced (Laflamme, Burrows and Hasselberg, 2009; Laflamme et al.,2009). There is accumulated and conv<strong>in</strong>c<strong>in</strong>g evidence that un<strong>in</strong>tentional <strong>in</strong>juries are highly preventable(WHO, 2007a), and there is a grow<strong>in</strong>g body of knowledge suggest<strong>in</strong>g that <strong>in</strong>equalities <strong>in</strong> <strong>in</strong>jury ratescan be prevented and reversed (Laflamme, Burrows and Hasselberg, 2009; Laflamme et al., 2009).This is of the utmost importance, s<strong>in</strong>ce <strong>in</strong>juries have become one of the causes of mortality withthe steepest social gradient. Map 2 below shows that this is also reflected <strong>in</strong> the stark mortality ratedifferences between countries.There is also <strong>in</strong>creas<strong>in</strong>g evidence from several <strong>Europe</strong>an countries that <strong>in</strong>equality-related differences <strong>in</strong><strong>in</strong>jury morbidity can be just as stark. These <strong>in</strong>equalities arise for different reasons, <strong>in</strong>clud<strong>in</strong>g differences<strong>in</strong> exposure, <strong>in</strong> access to means of prevention (and protection) and <strong>in</strong> <strong>in</strong>jury consequences (Laflamme,Hasselberg and Burrows, 2010). <strong>Inequalities</strong> have been observed between different sociodemographicgroups – based on <strong>in</strong>dividual age, sex, and SES – as well as between locations such as country, regionand area of residence. Such wide disparities <strong>in</strong> <strong>in</strong>juries have been highlighted <strong>in</strong> the WHO <strong>Europe</strong>anRegion when compar<strong>in</strong>g low- and middle-<strong>in</strong>come countries to high-<strong>in</strong>come ones (Sethi, Mitis andRacioppi, 2010). If all countries’ data were at the level of the lowest national <strong>in</strong>jury-related mortalityrate, 508 313 lives could be saved each year with<strong>in</strong> the WHO <strong>Europe</strong>an Region (account<strong>in</strong>g for 68% ofall <strong>in</strong>jury-related death cases) (Sethi et al., 2006a).To better contextualize and highlight the <strong>in</strong>equalities <strong>in</strong> <strong>in</strong>juries occurr<strong>in</strong>g <strong>in</strong> <strong>Europe</strong>, this chapterpresents data on <strong>in</strong>equalities related to the <strong>in</strong>cidence of non-fatal work-related <strong>in</strong>juries, fatal RTIs,fatal poison<strong>in</strong>gs and fatal falls, stratified by age and sex, and – for RTIs, poison<strong>in</strong>gs and falls – bynational <strong>in</strong>come levels. Additional <strong>in</strong>formation is also provided concern<strong>in</strong>g the state of knowledge ofsociodemographic parameters that – unlike other <strong>in</strong>equality <strong>in</strong>dicators covered <strong>in</strong> this report – could notbe addressed with the available data.
56Chapter 3. Injury-related <strong>in</strong>equalitiesMap 2. Standardized mortality rates for un<strong>in</strong>tentional <strong>in</strong>juries and poison<strong>in</strong>gs/100 000 population (last yearof report<strong>in</strong>g)Mortality rate /100 000no data
<strong>Environmental</strong> health <strong>in</strong>equalities <strong>in</strong> <strong>Europe</strong> 57Work-related <strong>in</strong>juries are the only <strong>in</strong>dicator based on non-fatal <strong>in</strong>jury data. Injury <strong>in</strong>cidence rates formales and females (Eurostat code hsw_aw_<strong>in</strong>asx) were calculated, along with the development of <strong>in</strong>jury<strong>in</strong>cidence for males and females from 1998 to 2006 (Eurostat code tsiem 090). In addition, <strong>in</strong>jury<strong>in</strong>cidence was determ<strong>in</strong>ed for three age groups: younger (up to 24 years), middle (25–54 years) andolder (55 years and above) (based on Eurostat code hsw_aw_<strong>in</strong>aag). To extend the evidence base, dataon occupational death rates from the <strong>Europe</strong>an Commission and the <strong>Europe</strong>an <strong>Health</strong> for All databasewere also <strong>in</strong>cluded.Fatal RTIsData from the DMDB on the number of RTI-related deaths/100 000 population were used to display<strong>in</strong>equalities <strong>in</strong> RTI rates by four age groups and to assess differences by sex. The database, further<strong>in</strong>formation and def<strong>in</strong>itions are available onl<strong>in</strong>e on the WHO Regional Office for <strong>Europe</strong> web site(http://data.euro.who.<strong>in</strong>t/dmdb/) and cover up to 47 of the WHO <strong>Europe</strong>an Member States.Data from the DMDB – WHO International Statistical Classification of Diseases and Related <strong>Health</strong>Problems, tenth revision (ICD-10) codes V01–V79 and V82–V89 (WHO, 2010a) – were compiledto reflect cases of road traffic-related death, exclud<strong>in</strong>g mortality related to tra<strong>in</strong> or air transport but<strong>in</strong>clud<strong>in</strong>g cases of death among cyclists and pedestrians. However, if the necessary <strong>in</strong>formation wasnot available, DMDB data on overall transport mortality were used, based on mortality tabulation list1 (MTL1) of ICD-10 and <strong>in</strong>tegrat<strong>in</strong>g data from countries still report<strong>in</strong>g through the ICD-9 system(MTL1 code 1096).For an assessment of <strong>in</strong>tracountry variations of transport-related mortality, data from the MDB ondeaths from transport accidents (code 7120) – available for few <strong>Europe</strong>an Member States – were used.Fatal poison<strong>in</strong>gData from the DMDB on the number of fatal poison<strong>in</strong>gs/100 000 population were used to show<strong>in</strong>equalities by sex and the related ratios for all poison<strong>in</strong>gs, as well as for alcohol-related poison<strong>in</strong>gsspecifically. Age group-specific poison<strong>in</strong>g death rates were calculated for the most relevant poison<strong>in</strong>gs.Data were taken from the DMDB (ICD-10 codes X40–X49 and MTL1 code 1100). The database,further <strong>in</strong>formation and def<strong>in</strong>itions are available onl<strong>in</strong>e on the WHO Regional Office for <strong>Europe</strong> website (http://data.euro.who.<strong>in</strong>t/dmdb/) and cover up to 46 of the WHO <strong>Europe</strong>an Member States.For an assessment of <strong>in</strong>tracountry variations of poison<strong>in</strong>g mortality, MDB data on the standardizeddeath rates from accidental poison<strong>in</strong>g (code 7420) – available for few <strong>Europe</strong>an Member States – wereused.Fatal fallsData from the DMDB on the number of fatal falls/100 000 population were used to calculate <strong>in</strong>equalitiesby sex and the related ratios for the full population, as well as for age group categories. Age-specific datashow the trend of fall mortality over the life course.The data were taken from the DMDB (MTL1 code 1097). The database, further <strong>in</strong>formation anddef<strong>in</strong>itions are available onl<strong>in</strong>e on the WHO Regional Office for <strong>Europe</strong> web site (http://data.euro.who.<strong>in</strong>t/hfamdb/) and cover up to 46 of the WHO <strong>Europe</strong>an Member States.
58Chapter 3. Injury-related <strong>in</strong>equalitiesRestrictions and data limitationsThere were four major restrictions on the treatment of the data.Lack of data and data coverageAge- and sex-stratified data on work-related <strong>in</strong>juries and mortality could only be obta<strong>in</strong>ed from Eurostat,which has data from a limited number of WHO <strong>Europe</strong>an Member States. In the data provided byEurostat on work-related <strong>in</strong>juries, stratification by sex was only available at country level for 17 EUcountries.For some countries, the latest reported data are several years old and current <strong>in</strong>jury rates are unknown.This hampered an accurate comparison of trends over time and made comparative assessments difficult.Quality of dataData from the MDB and DMDB must be used with caution for <strong>in</strong>tercountry comparisons because forsome countries mortality rates may be biased due to the underreport<strong>in</strong>g of death cases, particularly <strong>in</strong>the central Asian republics, the Caucasus countries and some countries <strong>in</strong> the Balkan region (MDB,2011; DMDB, 2011).Lack of country data on <strong>in</strong>dividual socioeconomic determ<strong>in</strong>antsCountry-specific <strong>in</strong>formation on <strong>in</strong>juries stratified by SES variables (<strong>in</strong>come, education, and so on) orother relevant dimensions such as ethnicity is not available from the databases used, and would haveprovided additional <strong>in</strong>formation on <strong>in</strong>equalities <strong>in</strong> <strong>in</strong>jury rates. Wherever possible, exist<strong>in</strong>g empiricalevidence and country-level <strong>in</strong>come data were used to cover the socioeconomic dimension of <strong>in</strong>juryrelated<strong>in</strong>equality.Outcome heterogeneityThe four <strong>in</strong>jury-related <strong>in</strong>equality <strong>in</strong>dicators studied are heterogeneous groups. With<strong>in</strong> each of themthere are different health outcomes caused by a variety of mechanisms; for example, different categoriesof road users are associated with different levels of <strong>in</strong>jury risk, and some population groups are particularlyaffected by alcohol poison<strong>in</strong>g rather than by other types of poison<strong>in</strong>g. Variations and differences relatedto the <strong>in</strong>jury types can be large, imply<strong>in</strong>g that there might be underestimations of differences betweengroups, and that some exist<strong>in</strong>g <strong>in</strong>equalities are possibly not reflected by the data.<strong>Inequalities</strong> <strong>in</strong> work-related <strong>in</strong>juriesIntroductionIn <strong>Europe</strong> alone there are as many as 300 000 work-related deaths every year, and work-related <strong>in</strong>jurieshave been def<strong>in</strong>ed as the biggest health risk <strong>in</strong> the work<strong>in</strong>g environment, before exposure to noiseand carc<strong>in</strong>ogens (WHO, 2002). There is ample evidence from the scientific literature – <strong>Europe</strong>an and<strong>in</strong>ternational – that there are substantial <strong>in</strong>equalities <strong>in</strong> work-related <strong>in</strong>jury rates, vary<strong>in</strong>g especially butnot exclusively by occupation. S<strong>in</strong>ce occupation and SES are strongly correlated, differences <strong>in</strong> workrelated<strong>in</strong>jury rates can also be found based on <strong>in</strong>dividual SES measures such as education and <strong>in</strong>comelevel (WHO, 2010b; Siegrist et al., 2010; Costa and D’errico, 2006).Another source of <strong>in</strong>equality <strong>in</strong> work-related <strong>in</strong>jury rates is sex: males have higher <strong>in</strong>jury rates thanfemales. This can be expla<strong>in</strong>ed by differences both <strong>in</strong> type and amount of occupational exposure and<strong>in</strong> <strong>in</strong>dividual behaviour and vulnerability (WHO, 2010b). Even <strong>in</strong>dividual age can come <strong>in</strong>to play as a
<strong>Environmental</strong> health <strong>in</strong>equalities <strong>in</strong> <strong>Europe</strong> 59source of <strong>in</strong>equality, with younger and older workers identified as risk groups for their expected lack ofexperience <strong>in</strong> the former case (<strong>Europe</strong>an Agency for Safety and <strong>Health</strong> at Work, 2011) or their agerelatedimpairment <strong>in</strong> the latter (<strong>Europe</strong>an Commission, 2009). But reviews <strong>in</strong>dicate that it is <strong>in</strong> ratherspecific circumstances and for specific types of <strong>in</strong>juries that age can be expected to play a role (Laflammeand Menckel, 1995). Age can, <strong>in</strong> fact, be not only an aggravat<strong>in</strong>g but also a preventive factor.Work-related <strong>in</strong>juries are highly preventable through modification of the work environment itself, ofprevail<strong>in</strong>g work<strong>in</strong>g conditions and also, to some extent, of the work<strong>in</strong>g climate and work culture (CouncilDirective, 1989; WHO, 2010b). Because occupational exposure varies greatly across occupational groupsand sectors, some occupations are at far greater risk than others and so are some sectors of activity.Indicator analysis: <strong>in</strong>equalities by sex, age and occupationUs<strong>in</strong>g country-based Eurostat data, it can be observed that males have higher work-related <strong>in</strong>jury<strong>in</strong>cidence rates than females <strong>in</strong> all countries, with an average male–female SR of 2.3:1 for the EU15.The highest ratios are 3.6:1 and 3.5:1 <strong>in</strong> Luxembourg and Greece, and the lowest is found <strong>in</strong> Swedenat 1.7:1. For males, the <strong>in</strong>cidence rate of <strong>in</strong>juries/100 000 ranges from 1145 (Sweden) to 5935 (Spa<strong>in</strong>),and for females from 605 (Greece) to 2446 (Spa<strong>in</strong>) (see Fig. 21).Fig. 21. Work-related <strong>in</strong>jury <strong>in</strong>cidence rate/100 000 population <strong>in</strong> employment by sex (2007)Incidence rate /100000800070006000500040003000200010000MaleFemaleSex ratioSwedenGreat Brita<strong>in</strong>IrelandGreece [a]AustriaItalyDenmarkNetherlands [a]NorwayF<strong>in</strong>landBelgiumGermanySwitzerlandLuxembourgFrancePortugalSpa<strong>in</strong>EU15 [b]4.03.53.02.52.01.51.00.50.0Ratio of <strong>in</strong>cidence rates (male:female)Source: data from Eurostat, 2011.Notes: [a] data for Greece and Netherlands from 2006; [b] EU15 data based on value for Great Brita<strong>in</strong> replac<strong>in</strong>g unknownvalue for United K<strong>in</strong>gdom.Sex-related differences are also reproduced at economic sector level (see Table 4). Risk of <strong>in</strong>jury to malesoutweighs that to females by the highest proportion <strong>in</strong> the construction sector (SR 3.6:1); this is alsothe sector with the highest <strong>in</strong>jury <strong>in</strong>cidence globally. The SR is lower <strong>in</strong> sectors such as transport andcommunication (1.4:1) and hotel and cater<strong>in</strong>g (1.3:1). A national example of work-related <strong>in</strong>jury SRdifferences by sector is provided for Croatia <strong>in</strong> Annex 1.Fig. 22 shows the development of the <strong>in</strong>cidence of work-related <strong>in</strong>juries from 1998 to 2006, the lastyear of report<strong>in</strong>g to Eurostat. The bars show the <strong>in</strong>cidence changes for males and females, based on an<strong>in</strong>dex value of 100 for the basel<strong>in</strong>e year of 1998. In most EU countries, the occurrence of work-related<strong>in</strong>juries decreased strongly for both sexes, although with a sharper decl<strong>in</strong>e for males than for females.In 2006, the work-related <strong>in</strong>jury <strong>in</strong>dex for females was at 83 for EU27, whereas for males the <strong>in</strong>dexdropped to 77. This corresponds to <strong>in</strong>jury rate reductions by 17% and 23% s<strong>in</strong>ce 1998, respectively.In a few countries the rate actually <strong>in</strong>creased for one sex (Ireland, Cyprus, France and Lithuania) andthus <strong>in</strong>dicates an <strong>in</strong>creas<strong>in</strong>g sex-related <strong>in</strong>equality dur<strong>in</strong>g the time period covered, while <strong>in</strong> Estonia, the
60Chapter 3. Injury-related <strong>in</strong>equalitiesrate strongly <strong>in</strong>creased for both sexes. However, there are various countries where, although rates aredecl<strong>in</strong><strong>in</strong>g for males and females, there is a strong sex-related difference <strong>in</strong> the relative reduction (such asDenmark, Czech Republic and Poland).Table 4. Standardized <strong>in</strong>cidence rate of accidents at work by economic sector and sex (average for 2005–2007)Economic sector Incidence/100 000 population <strong>in</strong> employment Ratio of <strong>in</strong>cidence ratesMale Female (male:female)Construction 6172 1723 3.6:1Electricity, gas & water supply 2046 715 2.9:1Manufactur<strong>in</strong>g 4003 1855 2.2:1F<strong>in</strong>ancial <strong>in</strong>termediation; real estate 1972 934 2.1:1Wholesale and retail trade; repair 2811 1440 2:1of motor vehicles, motorcycles andpersonal and household goodsAgriculture, hunt<strong>in</strong>g and forestry 4847 2963 1.6:1Transport, storage and communication 2882 2013 1.4:1Hotel and cater<strong>in</strong>g 3238 2585 1.3:1Source: data from Eurostat, 2011.Fig. 22. Work-related <strong>in</strong>jury <strong>in</strong>cidence rate/100 000 population <strong>in</strong> employment by sex (2006) <strong>in</strong> <strong>in</strong>dexpo<strong>in</strong>tsGreeceBelgiumGermanyItalyAustriaPortugalUnited K<strong>in</strong>gdomFranceDenmarkLuxembourgSwedenF<strong>in</strong>landSpa<strong>in</strong>Netherlands [a]IrelandEU15FemaleMaleSlovakiaBulgariaHungaryCzech RepublicSloveniaCyprusPolandMaltaLithuaniaRomaniaNMS12 countriesEstoniaEU27 countries40 50 60 70 80 90 100 110 120 130 140Index po<strong>in</strong>ts (1998=100)Source: data from Eurostat, 2011.Note: [a] Netherlands: value = 100 (2005).Note: smaller font size chosen (8 <strong>in</strong>stead of 9)Country names may have to be updated <strong>in</strong> lay out version
<strong>Environmental</strong> health <strong>in</strong>equalities <strong>in</strong> <strong>Europe</strong> 61Fig. 23 illustrates age-related <strong>in</strong>equalities <strong>in</strong> work-related <strong>in</strong>jury rates. In many <strong>in</strong>stances, at country level,workers from the highest age group experience the lowest <strong>in</strong>cidence of work-related <strong>in</strong>juries (EU15average: 1917/100 000). Noteworthy exceptions are the Netherlands (4533/100 000), Luxembourg(4897/100 000) and Norway (2947/100 000) where <strong>in</strong>cidences among the highest age group exceedthose among younger workers.Fig. 23. Work-related <strong>in</strong>jury <strong>in</strong>cidence rate/100 000 population <strong>in</strong> employment by age group (2007)Incidence rate/10000080007000600050004000300020001000
62Chapter 3. Injury-related <strong>in</strong>equalitiesIt is important to note that some health problems that are more common among females are miss<strong>in</strong>gfrom the material under consideration: this is because the def<strong>in</strong>ition of work-related <strong>in</strong>juries <strong>in</strong>cludesonly those occurr<strong>in</strong>g dur<strong>in</strong>g the course of work. With<strong>in</strong> the health sector, for <strong>in</strong>stance, where femalesmake up a greater proportion of employees than males, musculoskeletal problems are highly prevalentamong nurses and aides but are not considered to be direct work-related <strong>in</strong>juries.A closer look at data stratified by occupation and economic sector would also help to broadenunderstand<strong>in</strong>g of age-related <strong>in</strong>equalities, which are less clearly expressed when look<strong>in</strong>g at the totalnumber of work-related <strong>in</strong>juries.Although <strong>in</strong>equality dimensions other than age and sex could not be considered <strong>in</strong> the analysesconducted, it is important to note that workers with low SES and migrant workers are known vulnerablegroups that suffer traumatic <strong>in</strong>juries more often, a fact that has been attributed to their generally worsehealth status. But poorer work<strong>in</strong>g conditions and work environments may also contribute to their higherrisk of work-related <strong>in</strong>jury (<strong>Europe</strong>an Agency for Safety and <strong>Health</strong> at Work, 2011).<strong>Health</strong> implicationsWork-related <strong>in</strong>juries most often result <strong>in</strong> sick leave, and there are more <strong>in</strong>juries that result <strong>in</strong> sick leaveamong older than younger workers. Longer durations of sick leave <strong>in</strong> general are more prevalent amongmales and the elderly work<strong>in</strong>g population (<strong>Europe</strong>an Commission, 2009). However, work-related <strong>in</strong>juriescan also lead to long-last<strong>in</strong>g disabilities and, as mentioned above, even have fatal outcomes. Disabilityis a threat for workers of all age groups: among adults, around 6% of disabilities are a consequence ofwork-related <strong>in</strong>juries (Tüchsen et al., 2009).Regard<strong>in</strong>g the types of <strong>in</strong>juries susta<strong>in</strong>ed, from 1997 to 2005 a decrease has been observed <strong>in</strong> the<strong>in</strong>cidence of wounds and superficial <strong>in</strong>juries as burns, scalds and frostbite. By contrast, occurrences ofdislocations, spra<strong>in</strong>s and stra<strong>in</strong>s are on the <strong>in</strong>crease, as well as multiple and <strong>in</strong>ternal <strong>in</strong>juries result<strong>in</strong>g <strong>in</strong>death (<strong>Europe</strong>an Commission, 2009).Work-related <strong>in</strong>juries also affect a worker’s social life and future prospects; for <strong>in</strong>stance, disabilities thatreduce work performance or capacity to rema<strong>in</strong> <strong>in</strong> an occupation lead not only to loss of employment butalso to an impoverished quality of life. The long-term absence from work or long-term unemploymentof a breadw<strong>in</strong>ner might even put an entire family <strong>in</strong> a precarious situation.Conclusions and suggestionsAlthough the available data are representative of only a limited number of countries, some trends andpatterns are noteworthy. One is that there are clear sex-related <strong>in</strong>equalities <strong>in</strong> the <strong>in</strong>cidence of workrelated<strong>in</strong>juries, to the disadvantage of male workers. However, <strong>in</strong> recent years, decreases <strong>in</strong> work-related<strong>in</strong>juries have been more remarkable among male workers than female workers.Also strik<strong>in</strong>g is the heightened risk of occupational <strong>in</strong>juries among younger workers, which is stronglyexpressed <strong>in</strong> several countries. By contrast, older workers are over-represented when analys<strong>in</strong>g occurrencesof fatal work-related <strong>in</strong>juries.The risk of work-related <strong>in</strong>jury can be significantly reduced by the design and layout of safer work<strong>in</strong>genvironments, methods, and <strong>in</strong>struments. Work to build up and promote these factors is likely not onlyto reduce the probability of <strong>in</strong>jury but also to narrow down the level of <strong>in</strong>equality between males andfemales employed <strong>in</strong> similar occupations (Eurostat, 2011). However, more reliable report<strong>in</strong>g of workrelated<strong>in</strong>juries <strong>in</strong> non-EU countries would extend the available <strong>in</strong>formation on the <strong>in</strong>cidence of workrelated<strong>in</strong>juries and their distribution among different segments of the workforce with<strong>in</strong> the WHO<strong>Europe</strong>an Region, as well as help<strong>in</strong>g to identify target groups for action.
<strong>Environmental</strong> health <strong>in</strong>equalities <strong>in</strong> <strong>Europe</strong> 63Suggested mitigation actions are:• implementation of national programmes on occupational safety and health as suggested byILO Conventions 155 (ILO, 1981) and 161 (ILO, 1985) and the Workers’ health: global planof action (WHO, 2007b), aim<strong>in</strong>g at universal coverage of prevention-oriented occupationalhealth services for all workers;• further implementation and enforcement of the Community strategy 2007–2012 on healthand safety at work (<strong>Europe</strong>an Commission, 2007) and similar relevant policies apply<strong>in</strong>goutside the EU;• thorough <strong>in</strong>duction tra<strong>in</strong><strong>in</strong>g of younger and new workers on workplace hazards and respectivesafety measures;• wherever possible, adapt<strong>in</strong>g job demands and conditions to the physical and mental capacityof workers;• provision of basic occupational health services to workers from vulnerable groups (younger,elderly, disabled, migrant, pregnant, and so on) and those <strong>in</strong> high-risk sectors (such as smallenterprises, construction, manufactur<strong>in</strong>g, health care, agriculture, m<strong>in</strong><strong>in</strong>g and <strong>in</strong>formal);• better report<strong>in</strong>g on work-related <strong>in</strong>juries through occupational health surveillance programmes,<strong>in</strong>clud<strong>in</strong>g their distribution by age, sex and occupation.<strong>Inequalities</strong> <strong>in</strong> fatal road traffic <strong>in</strong>juries (RTIs)IntroductionAn <strong>in</strong>creas<strong>in</strong>gly mobile society with grow<strong>in</strong>g traffic volume bears a ris<strong>in</strong>g risk of RTIs, <strong>in</strong>clud<strong>in</strong>g <strong>in</strong>juriesrelated to both motorized and non-motorized means of transport. As the lead<strong>in</strong>g cause of deaths amongadolescents and young adults, and an <strong>in</strong>creas<strong>in</strong>gly important cause of <strong>in</strong>jury and death among children,RTIs have among the most serious consequences of all <strong>in</strong>juries (Sethi et al., 2006b). In 2010 aloneRTIs resulted <strong>in</strong> 107 850 deaths <strong>in</strong> the WHO <strong>Europe</strong>an Region (WHO, 2009). In western <strong>Europe</strong>an estimated 25% (12–59%) of RTIs are caused by environmental factors such as urban structure androad design (Prüss-Üstün and Corvalán, 2006). Alongside environmental risks, alcohol consumptionand speed<strong>in</strong>g rank highly as factors associated with both crash occurrence and crash severity. It has beenestimated that around one <strong>in</strong> four <strong>in</strong>juries is caused by dr<strong>in</strong>k–driv<strong>in</strong>g (Directorate General for <strong>Health</strong>and Consumer Protection, 2006).RTIs are not randomly distributed among areas and groups <strong>in</strong> society (Laflamme and Diderichsen,2000; Laflamme, Hasselberg and Burrows, 2010). In <strong>Europe</strong>, residents of the Euro 3 countries are moreat risk than those of other regions: as a result of these states’ late transition to market economies anda result<strong>in</strong>g <strong>in</strong>crease <strong>in</strong> motorization without the match<strong>in</strong>g <strong>in</strong>frastructure, road safety tends to be low(Racioppi et al., 2004). Alongside well-known differences between, for example, urban and rural areas,there are also remarkable <strong>in</strong>equalities between socioeconomic groups, to the detriment of disadvantagedones (WHO, 2009; Laflamme, Hasselberg and Burrows, 2010). With<strong>in</strong> countries, a high proportion ofthe RTI-related burden of <strong>in</strong>jury is carried by those with low SES, <strong>in</strong> part because they may not haveequal access to safe transport options (Kay et al., 2011).In addition, males are at far greater risk of RTI than females and so are people <strong>in</strong> the younger andmiddle age categories. These <strong>in</strong>equalities may, however, vary depend<strong>in</strong>g on the category of road user(Laflamme, Hasselberg and Burrows, 2010).
64Chapter 3. Injury-related <strong>in</strong>equalitiesIndicator analysis: <strong>in</strong>equalities by country <strong>in</strong>come, age and sexBased on recent GBD data (WHO, 2011), Fig. 24 shows the <strong>in</strong>equalities of RTI mortality rates betweenhigh-<strong>in</strong>come countries and low- and middle-<strong>in</strong>come countries <strong>in</strong> the WHO <strong>Europe</strong>an Region. Amongall age groups and both sexes there is much higher RTI-related mortality <strong>in</strong> low- and middle-<strong>in</strong>comecountries. The relative <strong>in</strong>equality between countries with high national <strong>in</strong>come levels versus those withlow and middle national <strong>in</strong>come levels is lowest <strong>in</strong> the 15–29 year age group <strong>in</strong> both males (low- andmiddle-<strong>in</strong>come country to high-<strong>in</strong>come country ratio of 1.6:1) and females (ratio of 1.8:1). The highest<strong>in</strong>equalities are found for children, with country <strong>in</strong>come ratios of 3.4:1 (males, 0–4 years) and 3.3:1(females, 5–14 years). Despite the much higher mortality rates <strong>in</strong> males, the ratio of high-<strong>in</strong>come tolow- and middle-<strong>in</strong>come countries is on a similar level for males and females, show<strong>in</strong>g that both sexesare, <strong>in</strong> relative terms, similarly disadvantaged by national <strong>in</strong>come levels.Fig. 24. RTI mortality rate/100 000 population by national <strong>in</strong>come level, sex and age <strong>in</strong> the WHO <strong>Europe</strong>anRegion (2008)Ratio of mortality rates (low/middle<strong>in</strong>come:high-<strong>in</strong>comecountries)Mortality rate/10000043.532.521.510.508000700060005000400030002000National <strong>in</strong>come level ratio – malesNational <strong>in</strong>come level ratio – females0–4 5–14 15–29 30–44 45–59 60–69 70–79 80+Males, high-<strong>in</strong>comecountriesMales, low/middle-<strong>in</strong>comecountriesFemales, high-<strong>in</strong>comecountriesFemales, low/middle<strong>in</strong>comecountries100000–4 5–14 15–29 30–44 45–59 60–69 70–79 80+Age groupSource: calculated from GBD 2008 data (WHO, 2011).A compilation of standardized mortality rates/100 000 by age group (0–14, 15–24, 25–64, 65+ years)is shown <strong>in</strong> Fig. 25a and the same calculation is shown <strong>in</strong> Fig. 25b us<strong>in</strong>g data on all transport-relatedmortality rates for those areas where RTI-specific data were not available. 77 RTI data used for Fig. 25a are based on the DMDB (ICD-10 codes V01–V79 and V82–V89) and refer to all fatal <strong>in</strong>juries occurr<strong>in</strong>g on the roads,<strong>in</strong>clud<strong>in</strong>g those to pedestrians and cyclists. Fatal <strong>in</strong>juries to passengers of tra<strong>in</strong>s, aircraft and ships are excluded. Fig. 25b uses data on “Transportmortality” from the DMDB (MTL1 code 1096) for countries where detailed data on RTIs were not available.
<strong>Environmental</strong> health <strong>in</strong>equalities <strong>in</strong> <strong>Europe</strong> 65Fig. 25a. Age-standardized mortality rate/100 000 population from RTIs by age group (last year ofreport<strong>in</strong>g)IcelandSwedenNetherlandsUnited K<strong>in</strong>gdomIrelandF<strong>in</strong>landNorwaySpa<strong>in</strong>PortugalLuxembourgGermanyAustriaFranceDenmarkItalyBelgiumEuro 1 countries [a]MaltaHungaryLatviaSlovakiaCzech RepublicEstoniaBulgariaRomaniaSloveniaLithuaniaCyprusPolandEuro 2 [a]AzerbaijanGeorgiaUzbekistan Source: DMDB, 2011KyrgyzstanRepublic of MoldovaEuro 3 countries [a]IsraelSerbiaMontenegroCroatiaEuro 4 countries [a]All countries [a](n=37)0 5 10 15 20 25 30 35Mortality rate/100 0000–14 years15–24 years25–64 years65 years +Source: data from DMDB, 2011.Note: [a] average of national rates.we need to see how this works <strong>in</strong> the layed out report
66Chapter 3. Injury-related <strong>in</strong>equalitiesThe aggregated data for all countries show that the lowest RTI mortality rate is among children, withan average of 1.7 deaths/100 000, while the mortality rates for all other age groups are much higher (seeFig. 25a). In 20 out of 37 countries the highest mortality rate falls <strong>in</strong> the 15–24 year age group (totalaverage of 11.7/100 000), which is also the highest total average rate, followed by the highest age group(65 and older), at 11.5/100 000. Those aged over 65 years have the highest RTI mortality rates <strong>in</strong> 14countries.Fig. 25b. Age-standardized mortality rate/100 000 population from all transport <strong>in</strong>juries by age group (lastyear of report<strong>in</strong>g)SwitzerlandGreeceSan Mar<strong>in</strong>oEuro 1 countries [a]ArmeniaUkra<strong>in</strong>eBelarusKazakhstanRussian FederationEuro 3 countries [a]0–14 years15–24 years25–64 years65 years +MKD [b]AlbaniaEuro 4 countries [a]All countries [a](n=10)0 5 10 15 20 25 30 35Mortality rate/100000Source: data from DMDB, 2011.Notes: [a] average of national rates; [b] MKD: ISO code for the former Yugoslav Republic of Macedonia.Fig. 25b <strong>in</strong>dicates a roughly similar situation for all transport mortality. All age groups have somewhathigher mortality rates we than need <strong>in</strong> to see the how RTI-specific this works <strong>in</strong> data, the layed but out – report as with the RTI mortality data – childmortality rates are much lower (at an average of 2.9 deaths/100 000) than the rates for other age groups.The highest average mortality rate is found for the 15–24 year age group (18.6/100 000), but it is only alittle lower for the 25–64 year age group (15.6/100 000) and the oldest age group (14.8/100 000).Although the average aggregated data for all countries show no large differences between the threeoldest age groups, Figs. 25a and 25b <strong>in</strong>dicate that age variations can be rather different with<strong>in</strong> countries.In fact, the relatively low mortality rate among children aged up to 14 years is the only commonalityfor all countries. In addition, countries show strong variations <strong>in</strong> the national level of transport-relatedmortality, with Albania, Kazakhstan, Kyrgyzstan, the Russian Federation and San Mar<strong>in</strong>o show<strong>in</strong>g veryhigh rates, exceed<strong>in</strong>g 25/100 000 for at least one age group.More detailed data for some countries show that <strong>in</strong>tracountry variations <strong>in</strong> RTIs exist and can be quitediverse. Table 5 presents selected examples of countries with wide regional variations <strong>in</strong> RTI mortality(Spa<strong>in</strong>: factor 3.7, Russian Federation: factor 3.8) and countries with lower regional disparities (F<strong>in</strong>land:factor 2.1, Hungary: factor 1.3).Fig. 26 presents the differences by sex <strong>in</strong> road traffic-related mortality, show<strong>in</strong>g the SR of fatal RTIs fordifferent age groups. The mortality from RTIs is higher <strong>in</strong> males throughout all age groups, <strong>in</strong>dicatedby median values higher than 1.
<strong>Environmental</strong> health <strong>in</strong>equalities <strong>in</strong> <strong>Europe</strong> 67Table 5. Intracountry differences <strong>in</strong> transport-related standardized death rates/100 000 population forselected countries (last year of report<strong>in</strong>g)F<strong>in</strong>land (2009) Hungary (2009) Russian Federation Spa<strong>in</strong> (2008)(2001)M<strong>in</strong>imum mortality rate 3.7 8.2 13.0 2.6Average mortality rate 6.1 9.7 25.8 7.1Maximum mortality rate 7.9 10.7 49.1 9.5Factor between m<strong>in</strong>imumand maximum rate2.1 1.3 3.8 3.7Source: data from MDB, 2011.The <strong>in</strong>equality <strong>in</strong> RTI mortality levels between males and females is greatest for young adults, reach<strong>in</strong>ga more than fivefold difference <strong>in</strong> those aged 25–29 years. After the age of 29 the <strong>in</strong>equality betweenthe sexes decreases moderately to a SR between 2:1 and 3:1 <strong>in</strong> the older age groups. Analysis of theoverall transport <strong>in</strong>jury data from 47 countries shows that the average transport-related mortality is15.7/100 000 for males and 4.2/100 000 for females, <strong>in</strong>dicat<strong>in</strong>g that the male mortality rate is almostfour times higher (DMDB, 2011).Fig. 26. SRs by age group for RTI mortality (last three report<strong>in</strong>g years)3220Ratio of mortality rates (male:female)1210864200-14 15-19 20-24 25-29 30-44 45-59 60-64 65-69 70-74 75+Age groupSource: data from DMDB, 2011.Note: country coverage as for Fig. 25a.Reversed sex-related <strong>in</strong>equalities with higher mortality rates <strong>in</strong> females can be observed <strong>in</strong> only threecountries, but the difference is much smaller. Such <strong>in</strong>equality is found <strong>in</strong> the youngest age groups (0–14years and 15–19 years) <strong>in</strong> Azerbaijan and Denmark; <strong>in</strong> the older age groups higher mortality rates <strong>in</strong>females are reported by Azerbaijan and Montenegro.Target groups for actionPersonal characteristics which <strong>in</strong>fluence vulnerability to RTIs are sex (males have a far higher <strong>in</strong>cidencerate than females) and age (young adults and older road users have the highest <strong>in</strong>cidence rates). Youngadults also have higher rates of mortality from RTIs as car drivers. The age- and gender-associatedlifestyle factors for this group, such as speed<strong>in</strong>g or overconfidence <strong>in</strong> males, or driv<strong>in</strong>g under the <strong>in</strong>fluenceof alcohol and drugs, raise the <strong>in</strong>cidence of RTIs (Peden et al., 2004; <strong>Europe</strong>an Commission, 2011).
68Chapter 3. Injury-related <strong>in</strong>equalitiesIn old age (65+ years), <strong>in</strong>cidence of RTIs is determ<strong>in</strong>ed by functional limitations (<strong>in</strong>creased crash risk)and physical vulnerability (<strong>in</strong>creased <strong>in</strong>jury severity), which result <strong>in</strong> a higher risk of fatality than <strong>in</strong>jury(<strong>Europe</strong>an Commission, 2011).Fig. 27 shows the distribution of RTI mortality by road user category, <strong>in</strong>dicat<strong>in</strong>g that about one-halfof all RTI mortality <strong>in</strong> the WHO <strong>Europe</strong>an Region is suffered by car occupants. However, pedestriansaccount for 28% of all deaths from road traffic. A national example of transport mortality for differentroad users stratified by sex and age is provided for Malta <strong>in</strong> Annex 1.Fig. 27. Distribution of RTI fatalities by road user category for the WHO <strong>Europe</strong>an RegionOther, 2%Unspecified, 5%Pedestrians, 28%Occupants of fourwheeledvehicles,53%Cyclists, 3%Riders ofmotorized two- orthree-wheeledvehicles, 8%Source: data from WHO, 2009, adapted. Data have been reported by countries for different years.In urban areas, pedestrians are the most vulnerable road users, because they are usually not or scarcelyprotected. Unprotected road users are vulnerable to the greater mass and speed of motorized vehicles(<strong>Europe</strong>an Commission, 2011). Among pedestrians, people aged below 10 and over 65 years are atespecially high risk. Pedestrians have the highest fatality rate <strong>in</strong> urban areas and account for 33% offatal RTIs. Pedestrians with low SES are at especially high risk because they have least access to safermodes of transport (Kay et al., 2011). In rural areas, however, car drivers have the highest <strong>in</strong>cidence offatal accidents (43%), while pedestrians account for only 9% of fatal RTIs <strong>in</strong> rural sett<strong>in</strong>gs (<strong>Europe</strong>anCommission, 2011).<strong>Health</strong> implicationsThe health consequences of RTIs vary <strong>in</strong> severity. The most severe outcomes are fatal <strong>in</strong>juries, but thefatality rate is relatively low (2% <strong>in</strong> 2005) <strong>in</strong> comparison to other outcomes (<strong>Europe</strong>an Transport andSafety Council, 2007). The recently decreas<strong>in</strong>g fatality rates from RTIs are partially counteracted by an<strong>in</strong>creased number of severe <strong>in</strong>juries with long-term consequences. More serious health implications canresult <strong>in</strong> long-term or permanent disability such as sp<strong>in</strong>al cord <strong>in</strong>juries (1.4% of all RTIs), a fracturedthighbone (1.3%) and long-term <strong>in</strong>tracranial <strong>in</strong>juries (1.2%). RTIs often result <strong>in</strong> short-term disability,such as short-term <strong>in</strong>tracranial <strong>in</strong>juries (24.6%); open wounds (10.3%), various fractures and <strong>in</strong>ternal<strong>in</strong>juries (
<strong>Environmental</strong> health <strong>in</strong>equalities <strong>in</strong> <strong>Europe</strong> 69Conclusions and suggestionsThere are <strong>in</strong>equalities <strong>in</strong> RTI-related death rates with<strong>in</strong> and between all countries of the WHO <strong>Europe</strong>anRegion. Both age and sex play an important role but affect RTI rates differently: age differences appearto be rather country-specific, while males suffer more road deaths than females <strong>in</strong> all countries. Thehigher rate of mortality among males is partly because of greater exposure (they are more likely to beon the roads than females) and partly because of risk-tak<strong>in</strong>g behaviour on the roads. Income levelsaffect the magnitude of RTIs both <strong>in</strong> relation to country <strong>in</strong>come levels – as <strong>in</strong>dicated by Fig. 24 – and<strong>in</strong> relation to <strong>in</strong>dividual <strong>in</strong>come and SES, as shown <strong>in</strong> literature on the subject (see Kay et al., 2011;Laflamme et al., 2009; Laflamme, Hasselberg and Burrows, 2010).In order to tackle <strong>in</strong>equalities of fatal RTI rates and RTI-related adverse health outcomes, moredetailed understand<strong>in</strong>g about the causes of <strong>in</strong>equalities <strong>in</strong> the WHO <strong>Europe</strong>an Region is required. Thelarge national variations of <strong>in</strong>equality patterns mean that only broad guidel<strong>in</strong>es or recommendationscan be made (see, for example, Mock et al., 2004). A good start<strong>in</strong>g po<strong>in</strong>t would be to decrease theoverall <strong>in</strong>cidence of RTIs, as suggested by the <strong>World</strong> report on road traffic <strong>in</strong>jury prevention (Peden etal., 2004), the EU’s Policy orientations on road safety 2011–2020 (<strong>Europe</strong>an Commission, 2010) and theGlobal plan for the decade of action for road safety 2011–2020 (WHO, 2010c). This <strong>in</strong>cludes action onthe environmental causes of RTIs, which are determ<strong>in</strong>ed by, for example, urban structure, road designand land use patterns (Prüss-Üstün and Corvalán, 2006). Changes to the environment such as betterurban and street plann<strong>in</strong>g, street ma<strong>in</strong>tenance, <strong>in</strong>stallation of adequate street light<strong>in</strong>g and general trafficcalm<strong>in</strong>g have already been shown to be effective <strong>in</strong>terventions (Bunn et al., 2003; Beyer and Ker, 2009).Nevertheless, targeted and specific approaches are necessary to reduce RTIs <strong>in</strong> the ma<strong>in</strong> risk groups.There is a need to decrease the occurrence of RTIs <strong>in</strong> young adults – specifically males – and also toreduce the vulnerability of older road users.Suggested mitigation actions are:• separat<strong>in</strong>g motorized vehicles from unprotected and less protected road users such as pedestriansand cyclists;• implementation of traffic-calm<strong>in</strong>g measures to decrease vehicle speed <strong>in</strong> urban areas;• promot<strong>in</strong>g the use of <strong>in</strong>dividual safety measures (such as seatbelt, child car seat and helmet use);• legislation and enforcement of laws that control speed, dr<strong>in</strong>k–driv<strong>in</strong>g and ensure safetyequipment use;• promotion of safe driv<strong>in</strong>g behaviours <strong>in</strong> general and consideration given to specific campaignstargeted at ma<strong>in</strong> risk groups such as male drivers;• better report<strong>in</strong>g on RTIs, <strong>in</strong>clud<strong>in</strong>g their distribution by sociodemographic groups;• implementation of the EU’s Policy orientations on road safety 2011–2020 (<strong>Europe</strong>an Commission,2010) and the Global plan for the decade of action for road safety 2011–2020 (WHO, 2010c).<strong>Inequalities</strong> <strong>in</strong> fatal poison<strong>in</strong>gIntroductionUn<strong>in</strong>tentional poison<strong>in</strong>g is the third lead<strong>in</strong>g cause of death from <strong>in</strong>jury <strong>in</strong> <strong>Europe</strong> (Bauer and Ste<strong>in</strong>er,2009). In 2008, 84 059 people died <strong>in</strong> the WHO <strong>Europe</strong>an Region from un<strong>in</strong>tentional poison<strong>in</strong>g,correspond<strong>in</strong>g to a mortality rate of 9.5/100 000 (WHO, 2011). Poison<strong>in</strong>gs have a wide variety ofcauses, rang<strong>in</strong>g from chemicals and medic<strong>in</strong>e <strong>in</strong> the home to alcohol <strong>in</strong>toxication.
70Chapter 3. Injury-related <strong>in</strong>equalitiesRecent research has identified an association between age and type of poison<strong>in</strong>g. Among the elderly,the ma<strong>in</strong> causes of poison<strong>in</strong>g are smoke from fire or other gases, and chemicals, pharmaceuticals andfood (Centre for Research and Prevention of Injuries, 2011). Among adults <strong>in</strong> the middle age categoriesalcohol is the ma<strong>in</strong> cause of poison<strong>in</strong>g. Additional causes lie <strong>in</strong> a variety of exposures, most – but not all– of which are occupational ones. In young adults, substance abuse (<strong>in</strong>clud<strong>in</strong>g alcohol) is the ma<strong>in</strong> causeof poison<strong>in</strong>g; this type of poison<strong>in</strong>g is on the <strong>in</strong>crease. The associated health effects of such poison<strong>in</strong>gare dependent on the substance (Sethi et al., 2006b). As many as 90% of poison<strong>in</strong>gs among childrenoccur at home: substances <strong>in</strong>volved <strong>in</strong> childhood poison<strong>in</strong>g are often pharmaceuticals, clean<strong>in</strong>g fluids,cosmetics and other chemicals found <strong>in</strong> and around the home, as well as certa<strong>in</strong> plants which causepoison<strong>in</strong>g (<strong>Europe</strong>an Child Safety Alliance, 2011). Carbon monoxide exposure <strong>in</strong> the home and leadexposure <strong>in</strong> the general environment are additional sources of poison<strong>in</strong>g.Factors associated with higher rates – or consequences – of poison<strong>in</strong>gs are household poverty, liv<strong>in</strong>g <strong>in</strong>deprived communities, s<strong>in</strong>gle parenthood and overall low SES (Sethi et al., 2006a). Among children<strong>in</strong> particular, socioeconomic <strong>in</strong>equalities <strong>in</strong> un<strong>in</strong>tentional poison<strong>in</strong>g risk can be strong (Laflamme,Hasselberg and Burrows, 2010). It is noteworthy that the risk of <strong>in</strong>jury from poison<strong>in</strong>g can be particularlyhigh <strong>in</strong> migrant populations as shown, for <strong>in</strong>stance, <strong>in</strong> the Netherlands (Stirbu et al., 2006).Indicator analysis: <strong>in</strong>equalities by country <strong>in</strong>come, age and sexRecent GBD data (WHO, 2011) <strong>in</strong>dicate that <strong>in</strong>equalities <strong>in</strong> mortality rates from poison<strong>in</strong>g betweenhigh-<strong>in</strong>come and low- and middle-<strong>in</strong>come countries are strongly to the disadvantage of the poorercountries (see Fig. 28). The differences are even greater than those found for RTIs (see Fig. 24). Smallchildren (0–4 years) <strong>in</strong> low- and middle-<strong>in</strong>come countries are especially affected, with a mortality ratemore than 20 times higher than those <strong>in</strong> high-<strong>in</strong>come countries (both males and females).Fig. 28. Poison<strong>in</strong>g mortality rate/100 000 population by national <strong>in</strong>come level, sex and age <strong>in</strong> the WHO<strong>Europe</strong>an Region (2008)Ratio of mortality rates (low/middle<strong>in</strong>come:high-<strong>in</strong>comecountries)2520151050National <strong>in</strong>come level ratio – malesNational <strong>in</strong>come level ratio – females0–4 5–14 15–29 30–44 45–59 60–69 70–79 80+Mortality rate/100000140001200010000800060004000Males, high-<strong>in</strong>comecountriesMales, low/middle-<strong>in</strong>comecountriesFemales, high-<strong>in</strong>comecountriesFemales, low/middle-<strong>in</strong>comecountries200000–4 5–14 15–29 30–44 45–59 60–69 70–79 80+Age groupSource: calculated from GBD 2008 data (WHO, 2011).
<strong>Environmental</strong> health <strong>in</strong>equalities <strong>in</strong> <strong>Europe</strong> 71Fig. 29. Poison<strong>in</strong>g mortality rate/100 000 population by sex (last year of report<strong>in</strong>g)Mortality rate/10000035302520151050AustriaPortugalItalyGermanyNetherlandsIcelandBelgiumFranceSpa<strong>in</strong>SwitzerlandUnited K<strong>in</strong>gdomGreeceDenmarkSwedenLuxembourgIrelandNorwayF<strong>in</strong>landEuro 1 countries [a]All countries [a](n=46)76543210Ratio of mortality rates (male:female)Mortality rate/10000035302520151050HungaryCyprus [b]BulgariaMaltaCzech RepublicSloveniaSlovakiaRomaniaPolandLatviaLithuaniaEstoniaEuro 2 [a]All countries [a](n=46)76543210Ratio of mortality rates (male:female)Mortality rate/100000706050403020100AzerbaijanArmeniaGeorgiaUzbekistanRepublic of MoldovaKyrgyzstanUkra<strong>in</strong>eKazakhstanBelarusRussian FederationEuro 3 countries [a]Israel [c]Montenegro [c]MKD [d]SerbiaCroatiaAlbaniaEuro 4 countries [a]All countries [a](n=46)76543210Ratio of mortality rates (male:female)Male Female Sex ratioSource: data from DMDB, 2011.Notes: [a] average of national rates; [b] Cyprus: SR=11.0; [c] data reported for fatalities <strong>in</strong> males only; [d] MKD: ISO codefor the former Yugoslav Republic of Macedonia.Mortality rates for males are much higher, as with the RTI data (Fig. 24), but the mortality rate ratiosof low- and middle-<strong>in</strong>come to high-<strong>in</strong>come countries are very similar, <strong>in</strong>dicat<strong>in</strong>g that the impact ofnational <strong>in</strong>come levels is similar for both males and females.Data from the DMDB reveal that the average mortality rate from poison<strong>in</strong>g is 9.8 and 2.6/100 000for males and females respectively – a SR of 3.8:1 to the disadvantage of males. Fig. 29 shows that this<strong>in</strong>creased risk <strong>in</strong> males is reflected <strong>in</strong> all countries but expressed at very different levels of magnitude: theSR is lowest <strong>in</strong> Austria at 1.4:1 and exceeds 6:1 <strong>in</strong> Cyprus, Greece and Malta. However, the data also
72Chapter 3. Injury-related <strong>in</strong>equalities<strong>in</strong>dicate that the <strong>in</strong>tercountry variability of poison<strong>in</strong>g rates – with the highest occurrences <strong>in</strong> the Euro3 subregion – is more remarkable than the general sex-specific variability, which does not differ muchbetween the Euro regions (rang<strong>in</strong>g from an SR of 3:1 <strong>in</strong> Euro 1 to an SR of 4.1:1 <strong>in</strong> Euro 2). A nationalexample of poison<strong>in</strong>g mortality stratified by age, sex and urban versus rural residence is provided forPoland <strong>in</strong> Annex 1.Table 6 shows the proportion of alcohol poison<strong>in</strong>g among all poison<strong>in</strong>gs for those countries report<strong>in</strong>gsuch data. Alcohol causes one-third (33.9%) of all poison<strong>in</strong>gs on average, but there are extreme<strong>in</strong>tercountry variations, with the contribution rang<strong>in</strong>g from 3.6% (Belgium) to 78.6% (Poland). The SRof 3.7:1, however, is similar to the SR for all poison<strong>in</strong>gs (3.8:1).Table 6. Alcohol-related poison<strong>in</strong>g mortality rate/100 000 population by sex (last year of report<strong>in</strong>g)Country Alcohol-related poison<strong>in</strong>g Ratio of mortality Percentage ofTotal Male Femalerate(male:female)all poison<strong>in</strong>gsrelated to alcoholBelgium 0.1 0.1 0.0 5.6:1 3.6Denmark 0.3 0.4 0.2 2.2:1 7.8F<strong>in</strong>land 8.0 13.3 2.7 4.9:1 54.8France 0.3 0.5 0.1 4.5:1 17.3Germany 0.2 0.3 0.1 3.0:1 19.5Ireland 2.1 2.8 1.4 2.0:1 30.4Italy 0.0 0.0 0.0 1.5:1 4.0Luxembourg 3.8 4.8 2.8 1.7:1 56.4Netherlands 0.1 0.1 0.1 0.9:1 7.5Norway 1.0 1.3 0.7 1.9:1 13.2Portugal 0.0 0.0 0.0 2.1:1 11.2Spa<strong>in</strong> 0.1 0.1 0.1 2.6:1 5.9Sweden 1.1 1.5 0.6 2.6:1 28.6United K<strong>in</strong>gdom 0.4 0.6 0.3 2.3:1 15.1Euro 1 countries [a] 1.2 1.8 0.6 2.9:1 19.7Bulgaria 0.5 0.8 0.3 2.2:1 29.0Czech Republic 1.7 2.6 0.8 3.4:1 56.4Estonia 8.2 13.6 3.7 3.7:1 44.3Latvia 7.0 12.5 2.5 4.9:1 62.6Lithuania 10.0 16.9 4.2 4.1:1 60.5Poland 3.2 5.9 0.8 7.4:1 78.6Romania 1.9 3.1 0.8 3.8:1 42.3Slovakia 2.3 3.9 0.7 5.2:1 74.5Slovenia 0.9 1.7 0.2 6.7:1 28.9Euro 2 countries [a] 4.0 6.8 1.6 4.3:1 53.0Georgia 0.7 1.0 0.4 2.6:1 58.5Kyrgyzstan 8.0 13.3 3.4 3.9:1 62.0Republic of Moldova 5.3 8.3 2.8 3.0:1 43.4Uzbekistan 0.3 0.6 0.1 4.7:1 15.8Euro 3 countries [a] 3.6 5.8 1.7 3.4:1 44.9Croatia 0.5 0.8 0.1 6.5:1 16.7Euro 4 countries [a] 0.5 0.8 0.1 6.5:1 16.7All countries (n=28) [a] 2.4 4.0 1.1 3.7:1 33.9Source: data from DMDB, 2011.Note: [a] average of national rates.
<strong>Environmental</strong> health <strong>in</strong>equalities <strong>in</strong> <strong>Europe</strong> 73An analysis of <strong>in</strong>tracountry regional variation for a subset of 12 countries report<strong>in</strong>g subnational datashows that the poison<strong>in</strong>g mortality rates reveal smaller <strong>in</strong>tra- than <strong>in</strong>tercountry differences, with theexception of the Russian Federation where regional rates range from 1.2–130.3/100 000 (MDB, code7420).Regard<strong>in</strong>g age-related <strong>in</strong>equalities, Fig. 30 confirms that there is a specific age profile for each of thevarious causes of poison<strong>in</strong>g reported <strong>in</strong> the DMDB. Generally, rather low mortality rates are found<strong>in</strong> the youngest age group (0–19 years), followed by <strong>in</strong>creased mortality rates with ris<strong>in</strong>g age up to 39years. The starkest <strong>in</strong>crease is identified for narcotics and psychodysleptics, represent<strong>in</strong>g illegal drugs.Thereafter, mortality trends <strong>in</strong> the different age groups vary by poison<strong>in</strong>g cause. The elderly are thema<strong>in</strong> risk group for gases and vapours, pesticides and unspecified chemicals, while the rates for narcoticsdecrease aga<strong>in</strong> after the age of 39. Older adults are the ma<strong>in</strong> risk group for alcohol, organic solvents andvapours.Fig. 30. Poison<strong>in</strong>g mortality rate/100 000 population by age group and cause (last year of report<strong>in</strong>g)70–9 years 10–19 years 20–29 years 30–39 years 40–49 years50–59 years 60–69 years 70–79 years 80+ yearsMortality rate/1000006543210Other gasesand vapoursAlcoholNarcotics and psychodysleptics[halluc<strong>in</strong>ogens], not elsewhereclassified0.80.7Mortality rate/1000000.60.50.40.30.20.10.0Organic solventsand their vapoursOther and unspecifiedchemicalsPesticidesMedical drugsexclud<strong>in</strong>g narcotics/psychodyslepticsSource: data from DMDB, 2011.Furthermore, Fig. 30 shows that the total magnitude of age-related <strong>in</strong>equalities varies by cause ofpoison<strong>in</strong>g. The overall highest two figures mortality to appear rates as are one alcohol-related, characterized by strongly <strong>in</strong>creas<strong>in</strong>gmortality rates with <strong>in</strong>creas<strong>in</strong>g age, to a maximum mortality rate of 5.9/100 000 for the 50–59 year agegroup. Narcotic substances cause the second highest mortality rates. The rates of fatal poison<strong>in</strong>g bypesticides are the lowest ones.
74Chapter 3. Injury-related <strong>in</strong>equalitiesAnalysis of all poison<strong>in</strong>g causes by sex (data not shown) <strong>in</strong>dicates that, <strong>in</strong> general, there is a higherprevalence of poison<strong>in</strong>g among males than females for almost all substances. The largest differencesby sex are seen for alcohol – as shown above – as well as for narcotic substances and non-organic gasesand vapours. On the other hand, several countries <strong>in</strong>dicated a higher level of pesticide poison<strong>in</strong>g amongfemales, <strong>in</strong>clud<strong>in</strong>g Croatia and Bulgaria (where mortality among females is double that among males)and Portugal (where mortality among females is six times higher).Target groups for actionMales have higher mortality rates from poison<strong>in</strong>g than females. People <strong>in</strong> their fifties (50–59 years)constitute the age group with the highest overall mortality rates, but this is strongly related to alcoholpoison<strong>in</strong>g, which is the most relevant s<strong>in</strong>gle cause of fatal poison<strong>in</strong>g. However, seen from a causespecificperspective, the older population is a key risk group for many poison<strong>in</strong>gs.By far the highest mortality rates are found <strong>in</strong> the countries of the Euro 3 region but the Baltic countries– together with F<strong>in</strong>land – represent another geographical poison<strong>in</strong>g hotspot.Low national <strong>in</strong>come levels strongly <strong>in</strong>crease the overall risk of poison<strong>in</strong>g, but – <strong>in</strong> contrast to the higherproportions of mortality among adults and the elderly described above – especially affect poison<strong>in</strong>grates among small children. However, the DMDB data do not provide <strong>in</strong>formation on poison<strong>in</strong>gs bysocioeconomic attributes of <strong>in</strong>dividual victims, and thus this dimension could not be studied.<strong>Health</strong> implicationsThe health effects of poison<strong>in</strong>gs can be wide-rang<strong>in</strong>g <strong>in</strong> scope and duration because of the varietyof poisonous agents. Symptoms of poison<strong>in</strong>g often <strong>in</strong>clude nausea, vomit<strong>in</strong>g, stomach cramps, pa<strong>in</strong>,diarrhoea and bloody stools. Fever, chills, headaches and weakness can also occur, and more severe casescan lead to shock or collapse (W<strong>in</strong>ter Griffith, Moore and Yoder, 2006). Extreme poison<strong>in</strong>g can lead todeath.Besides acute poison<strong>in</strong>g related to CO, alcohol or consumption of hazardous items, for example,long-term poison<strong>in</strong>g such as lead poison<strong>in</strong>g can occur, which can cause fatigue or sleep<strong>in</strong>g disorders,behaviour changes <strong>in</strong> adults and children, stomach discomfort, headache, vomit<strong>in</strong>g and weight loss(W<strong>in</strong>ter Griffith, Moore and Yoder, 2006).Overall, poison<strong>in</strong>g is among the 15 lead<strong>in</strong>g causes of total DALYs lost. 2 156 438 DALYs were lostthrough poison<strong>in</strong>g <strong>in</strong> low- and middle-<strong>in</strong>come countries <strong>in</strong> the WHO <strong>Europe</strong>an Region <strong>in</strong> 2000(Peden, McGee and Krug, 2002).Conclusions and suggestionsAlthough <strong>in</strong>juries from poison<strong>in</strong>g are preventable to a high degree, they are an important cause ofmortality and morbidity and time trends show that they persist. Those most affected by fatal poison<strong>in</strong>gsare males <strong>in</strong> their fifties, where alcohol plays a major role. Alcohol is also a major concern, as is the use ofdrugs. However, other sources of poison<strong>in</strong>g to which people of all ages can be exposed at home, at workor <strong>in</strong> the general environment, also need close attention regard<strong>in</strong>g their prevention.For all vulnerable groups, the ma<strong>in</strong>tenance or establishment of a suitable network of poison controlcentres would enable fast and effective help <strong>in</strong> emergency situations.Further <strong>in</strong>formation about the occurrence of poison<strong>in</strong>gs, underly<strong>in</strong>g causes and vulnerable groups shouldalso be identified and analysed.
<strong>Environmental</strong> health <strong>in</strong>equalities <strong>in</strong> <strong>Europe</strong> 75Suggested mitigation actions are:• reduc<strong>in</strong>g alcohol poison<strong>in</strong>g by implementation of the Global Strategy to reduce the harmfuluse of alcohol (WHO, 2010d);• reduc<strong>in</strong>g the risk of child poison<strong>in</strong>g through preventive measures, <strong>in</strong>clud<strong>in</strong>g safe packag<strong>in</strong>g(manufacturers) and safe stor<strong>in</strong>g (home safety practice) of dangerous items and substances, aswell as <strong>in</strong>itiatives promot<strong>in</strong>g <strong>in</strong>creased parental supervision;• a ban on production and availability of lethal substances;• ensur<strong>in</strong>g and promot<strong>in</strong>g work<strong>in</strong>g and liv<strong>in</strong>g conditions free from toxic or poisonous materials;• establishment or ma<strong>in</strong>tenance of poison control centres and provision of <strong>in</strong>formation to thepublic on risks of <strong>in</strong>toxication from the ma<strong>in</strong> causes of poison<strong>in</strong>g;• improv<strong>in</strong>g the surveillance systems monitor<strong>in</strong>g the trends, causes and social context ofpoison<strong>in</strong>g cases.<strong>Inequalities</strong> <strong>in</strong> fatal fallsIntroductionFalls are the second lead<strong>in</strong>g cause of un<strong>in</strong>tentional <strong>in</strong>jury deaths globally (WHO, 2010e). In the WHO<strong>Europe</strong>an Region, 65 991 fall-related deaths occurred <strong>in</strong> 2008 (WHO, 2011). Falls are also the lead<strong>in</strong>gcause of non-fatal un<strong>in</strong>tentional <strong>in</strong>juries <strong>in</strong> children (Sethi et al., 2008), although there is a strongassociation between age and type of fall, and the <strong>in</strong>cidence and the health consequences of falls are by farthe highest and most severe among the elderly. There is evidence that non-fatal fall <strong>in</strong>juries are <strong>in</strong> generalmore common among females and fatal ones more common among males (WHO, 2007a). There is alsoevidence that some types of falls are more representative of people <strong>in</strong> good physical condition whereasothers falls are more typical for people <strong>in</strong> poorer physical condition, especially among older people(Kelsey et al., 2010). Falls occur <strong>in</strong> many different manners and circumstances – at work, at home, whencommut<strong>in</strong>g, dur<strong>in</strong>g sports and leisure time, and so on.Studies on the socioeconomic distribution of fall-related <strong>in</strong>juries <strong>in</strong>dicate that high SES (measured<strong>in</strong> terms of education or <strong>in</strong>come, for example) can be associated with a lower rate of falls <strong>in</strong> differentage groups (among children and older people <strong>in</strong> particular), but the results are not consistent (WHO,2007a; Sethi et al., 2008). <strong>Inequalities</strong> <strong>in</strong> fall-related <strong>in</strong>juries occur as a result not only of <strong>in</strong>dividualdifferences but also as a consequence of environmental disparities, <strong>in</strong>clud<strong>in</strong>g the built environment(such as the design and condition of stairs and balconies), and the products people make use of or areexposed to (WHO, 2007a). Unsafe and <strong>in</strong>adequate hous<strong>in</strong>g and liv<strong>in</strong>g environments lead to higherrates of <strong>in</strong>jury risk.Indicator analysis: <strong>in</strong>equalities by country <strong>in</strong>come, age and sexFig. 31 shows <strong>in</strong>come-related <strong>in</strong>equalities <strong>in</strong> fatal falls/100 000 between males and females <strong>in</strong> high<strong>in</strong>comecountries versus low- and middle-<strong>in</strong>come countries. As with the other <strong>in</strong>jury types (see Figs.24 and 28), low- and middle-<strong>in</strong>come countries have higher rates of fatal falls up to the 60–69 year agegroup. However, <strong>in</strong> the two oldest age groups the picture is reversed and the rate of fatal falls <strong>in</strong> high<strong>in</strong>comecountries exceeds those <strong>in</strong> the low- and middle-<strong>in</strong>come countries. Income ratios for males andfemales are very similar throughout all age groups, except for a peak <strong>in</strong> females <strong>in</strong> the age group 5–14years. In all other age groups the rate ratio is slightly higher for males than females.
76Chapter 3. Injury-related <strong>in</strong>equalitiesFig. 31. Fall mortality rate/100 000 population by national <strong>in</strong>come level, sex and age <strong>in</strong> the WHO <strong>Europe</strong>anRegion (2008)Ratio of mortality rates (low/middle<strong>in</strong>come:high-<strong>in</strong>comecountries)876543210National <strong>in</strong>come level ratio – malesNational <strong>in</strong>come level ratio – females0–4 5–14 15–29 30–44 45–59 60–69 70–79 80+Mortality rate/100000350030002500200015001000Males, high-<strong>in</strong>comecountriesMales, low/middle<strong>in</strong>comecountriesFemales , high-<strong>in</strong>comecountriesFemales, low/middle<strong>in</strong>comecountries500Source 0 : calculated from GBD 2008 data (WHO, 2011)0–4 5–14 15–29 30–44 45–59 60–69 70–79 80+Age groupSource: calculated from GBD 2008 data (WHO, 2011).The available data <strong>in</strong>dicate that males have a higher level of mortality from falls than females <strong>in</strong> allcountries of the WHO <strong>Europe</strong>an Region (see Fig. 32). On average, the fall mortality rate/100 000 is8.8 <strong>in</strong> males and 3.7 <strong>in</strong> females (SR 2.3:1) but as shown, <strong>in</strong>tercountry differences are stark; the highestdifferences by sex are identified <strong>in</strong> the Euro 3 countries with an average SR of 4.7:1, along with thehighest national SRs of 6:1 and higher (<strong>in</strong> Azerbaijan and the Republic of Moldova). High levels of sexrelated<strong>in</strong>equality are also found for some Euro 2 countries such as Bulgaria and Romania, which showSRs of more than 5:1, while lower levels are identified for Euro 1 countries, with the lowest disparities<strong>in</strong> Iceland and Luxembourg (SR 1.2:1). In consequence, the SRs of fatal falls show a wide range from1.2:1 to 7.3:1.For both males and females, age-based differences reveal relatively low fall mortality rates – below3/100 000 for both sexes – <strong>in</strong> the younger age groups (0–24 years), followed by a remarkable and quitesteady <strong>in</strong>crease thereafter (see Fig. 33). After the age of 64 years, a cont<strong>in</strong>ued rise <strong>in</strong> <strong>in</strong>cidence rates forboth sexes occurs, the peak be<strong>in</strong>g reached <strong>in</strong> the oldest age group (85 years and over) with mortality ratesof 130/100 000 females and 140/100 000 males. However, the data also show that the largest relativedifferences between males and females actually occur <strong>in</strong> the middle age range (20–59 years of age), andthat this difference almost disappears with ris<strong>in</strong>g age.A national example of fall mortality stratified by age and sex for Romania (see Annex 1) <strong>in</strong>dicates thatsex-related differences can be more strongly expressed with<strong>in</strong> certa<strong>in</strong> countries.
<strong>Environmental</strong> health <strong>in</strong>equalities <strong>in</strong> <strong>Europe</strong> 77Fig. 32. Fall mortality rate/100 000 population by sex (last year of report<strong>in</strong>g)Mortality rate/1000002520151050PortugalSpa<strong>in</strong>ItalyDenmarkGreeceUnited K<strong>in</strong>gdomIcelandLuxembourgNorwayIrelandFranceSwedenNetherlandsGermanyBelgiumAustriaSwitzerlandF<strong>in</strong>landEuro 1 countries [a]All countries [a](n=44)543210Ratio of mortality rates (male:female)Mortality rate/1000002520151050CyprusBulgariaLatviaRomaniaSlovakiaEstoniaPolandMaltaCzech RepublicLithuaniaHungarySloveniaEuro 2 [a]All countries [a](n=44)7.56.04.53.01.50.0Ratio of mortality rates (male:female)Mortality rate/1000002520151050AzerbaijanGeorgiaKyrgyzstanUzbekistanKazakhstanRepublic of MoldovaUkra<strong>in</strong>eRussian FederationBelarusEuro 3 countries [a]IsraelAlbaniaMKD [b]SerbiaCroatiaEuro 4 countries [a]All countries [a](n=44)7.56.04.53.01.50.0Ratio of mortality rates (male:female)Male Female Sex ratioSource: data from DMDB, 2011.Notes: [a] average of national rates; [b] MKD: ISO code for the former Yugoslav Republic of Macedonia.Target groups for actionFatal falls appear to affect males and older people to a greater extent. Globally, sex-related differencesare more pronounced <strong>in</strong> the middle age categories (30–60 years) but rema<strong>in</strong> smaller than age-relateddifferences. Fall <strong>in</strong>juries among older people are, <strong>in</strong> fact, a major public health concern <strong>in</strong> <strong>Europe</strong>. Avariety of <strong>in</strong>dividual factors contribute to expla<strong>in</strong> the vulnerability of the older population, <strong>in</strong>clud<strong>in</strong>gfrailty, impaired cognitive and visual capacity to handle certa<strong>in</strong> situations and general health condition(OECD, 2001). In addition, the surround<strong>in</strong>g environment <strong>in</strong>side and outside the home can eitheraggravate or m<strong>in</strong>imize the consequences of those <strong>in</strong>dividual vulnerability factors.
<strong>Environmental</strong> health <strong>in</strong>equalities <strong>in</strong> <strong>Europe</strong> 79home modification programmes. Regional <strong>in</strong>equality data reveal that the reported fall-related mortalityrates for older people are surpris<strong>in</strong>gly low <strong>in</strong> the Euro 3 countries. However, research shows that therewere no governmental <strong>in</strong>jury prevention programmes reported or <strong>in</strong> place <strong>in</strong> that region (Armour-Marshall et al., 2011), which may <strong>in</strong>dicate a need for more research and monitor<strong>in</strong>g.Young children would benefit from higher safety standards at home (<strong>Europe</strong>an Child Safety Alliance,2009) as they suffer most from fatal falls with<strong>in</strong> the age group below 25 years. Targeted action to protectchildren could therefore also help to close this gap.Suggested mitigation actions are:• safer build<strong>in</strong>g codes and especially adequate and adaptable homes for the elderly;• a number of evidence-based safe practices to prevent the occurrence and consequences ofchildren fall<strong>in</strong>g <strong>in</strong> the home (such as w<strong>in</strong>dow guards and stair gates) (<strong>Europe</strong>an Child SafetyAlliance, 2009);• creat<strong>in</strong>g and ma<strong>in</strong>ta<strong>in</strong><strong>in</strong>g physical activity-friendly residential environments that supportactive liv<strong>in</strong>g and especially active age<strong>in</strong>g;• better research <strong>in</strong>to the socioeconomic and sociodemographic determ<strong>in</strong>ants of fatal falls andthe occurrence of falls <strong>in</strong> adults – especially adult males – to create targeted action to decrease<strong>in</strong>equalities and avoid an early onset of the risk of fatal falls.Conclusion on <strong>in</strong>jury-related <strong>in</strong>equalitiesInjuries are an <strong>in</strong>creas<strong>in</strong>gly important source of concern both globally and with<strong>in</strong> <strong>Europe</strong>, where theyare a lead<strong>in</strong>g cause of mortality and disability. Injuries are, however, often preventable, whether susta<strong>in</strong>edat home, at work, <strong>in</strong> the traffic environment or dur<strong>in</strong>g leisure time: numerous evidence-based strategieshave already been identified that can be implemented to reduce either the likelihood of their occurrenceor the severity of their consequences (Sethi et al., 2006b; Peden et al., 2004; WHO, 2007c).Sociodemographic <strong>in</strong>equalities <strong>in</strong> <strong>in</strong>jury rates are also preventable: they can be avoided and they arereversible (Laflamme, 1998). Reach<strong>in</strong>g and susta<strong>in</strong><strong>in</strong>g health targets <strong>in</strong> the WHO <strong>Europe</strong>an Regionrequires not only safety-for-all policies and <strong>in</strong>terventions but also equality-oriented ones (Whiteheadand Dahlgren, 2006; Dahlgren and Whitehead, 2006). Equality-oriented measures may build on<strong>in</strong>itiatives aimed at narrow<strong>in</strong>g the safety divide between the worse- and better-off or focused solely onpeople or neighbourhoods <strong>in</strong> poverty (Laflamme, Burrows and Hasselberg, 2009; WHO, 2009b).In the forego<strong>in</strong>g analysis, emphasis was placed on demographic differences with<strong>in</strong> and between<strong>Europe</strong>an countries and subregions. The differences between <strong>in</strong>dividual countries are much morestrongly expressed than those between regions, mak<strong>in</strong>g deductions on a subregional level difficult.Sex-related differences to the detriment of males were reconfirmed, although the magnitude of thedifferences by sex varied across health <strong>in</strong>equity <strong>in</strong>dicators. For RTIs, for <strong>in</strong>stance, the highest sex-related<strong>in</strong>equality arose among young adults (25–29 years), where the male mortality rate was more than fivetimes higher than that of females. For fall-related mortality, rates were on average more than twicehigher <strong>in</strong> males than females, but sex-related differences were most pronounced <strong>in</strong> the 20–59 year agerange. Age-related differences varied too: the most strik<strong>in</strong>g ones were found for fall-related mortality,where rates were relatively low dur<strong>in</strong>g the first decades of life, <strong>in</strong>creas<strong>in</strong>g somewhat thereafter, and ris<strong>in</strong>gremarkably after the age of 60, reach<strong>in</strong>g a peak <strong>in</strong> the eighties. The analysis was based on severe (workrelated)and fatal (RTI-, fall-, poison<strong>in</strong>g-related) <strong>in</strong>juries, but those represent “the tip of the iceberg”.A set of analyses compar<strong>in</strong>g high-<strong>in</strong>come countries with low- and middle-<strong>in</strong>come ones <strong>in</strong>dicated thata high level of national <strong>in</strong>come is associated with a lower risk of <strong>in</strong>jury. Although this observation
80Chapter 3. Injury-related <strong>in</strong>equalitieswas expected, the mechanisms ly<strong>in</strong>g beh<strong>in</strong>d it rema<strong>in</strong> to be determ<strong>in</strong>ed. It is also of note that widedifferences exist between countries of similar economic levels, which is why a potential for improvementexists for all countries.Recommendations <strong>in</strong>clude a set of diverse actions and <strong>in</strong>volve resources from different sectors, <strong>in</strong>clud<strong>in</strong>g– but not limited to – the health sector. The experience accumulated from those sectors where extensiveprogress has been made, at least <strong>in</strong> some countries, demonstrates that environmental changes andso-called “passive” measures of prevention have the greatest and most long-last<strong>in</strong>g impact on <strong>in</strong>juryrates (WHO, 2007c; WHO, 2009); they also have the advantage of be<strong>in</strong>g less stigmatiz<strong>in</strong>g. Whatsuch measures do, us<strong>in</strong>g Haddon’s (1980) term<strong>in</strong>ology, is “elim<strong>in</strong>ate”, “separate”, “isolate”, or “modify”the sources of danger. Similar strategies have been employed <strong>in</strong> various environments (for example, <strong>in</strong>traffic, at home and at work) with considerable success. Tak<strong>in</strong>g the traffic environment as an example,differential exposure to hazards may be addressed by countermeasures rang<strong>in</strong>g from modifications of theenvironment itself (such as traffic separation or traffic calm<strong>in</strong>g) to improvements <strong>in</strong> the function<strong>in</strong>g ofpublic transport systems (see Table 7).Table 7. Haddon matrix applied to a road traffic crashPhasesPre-eventEventPost-eventFactorsHuman Vehicle Physical environment Social environmentAttitudesKnowledgeUse of alcoholDriver experienceUse of seat beltsWear<strong>in</strong>g fastenedhelmetFirst aidMedical treatmentVehicle conditionSpeedSeat beltsHelmetsFire riskSource: data from Hazen and Ehiri, 2006, adapted.Roadway designTraffic calm<strong>in</strong>gPedestrian facilitiesShoulders, mediansGuardrailsAvailability of traumacare equipmentTraffic congestionTraffic lawsCultural normsHelmet and seat beltlawsStandards of trauma care<strong>in</strong> hospitalsIt must also be emphasized that prevention and control of <strong>in</strong>jury risk are significantly aided by – andsometimes a pre-condition for – well-def<strong>in</strong>ed and enforced legislation and regulations (WHO, 2007c).Such legislation can be safety-oriented, determ<strong>in</strong><strong>in</strong>g m<strong>in</strong>imum standards and conditions under whicha number of activities or tasks can be performed (for example, dur<strong>in</strong>g leisure time and sports or on theroad). It can also impose safe behaviours and practices that would not be adopted by all on a voluntarybasis only (such as the fitt<strong>in</strong>g of car restra<strong>in</strong>ts, bicycle helmet use and reduc<strong>in</strong>g alcohol consumption).Well-anchored legislation has a great potential not only to improve safety for all but also to narrow thesafety divide and reduce <strong>in</strong>jury-related <strong>in</strong>equality.ReferencesArmour-Marshall J et al. (2011). Childhood deaths from <strong>in</strong>juries: trends and <strong>in</strong>equalities <strong>in</strong> <strong>Europe</strong>. <strong>Europe</strong>anJournal of Public <strong>Health</strong> (first published onl<strong>in</strong>e February 9, 2011, DOI: 10.1093/eurpub/ckr004).Bauer R, Ste<strong>in</strong>er M (2009). Injuries <strong>in</strong> the <strong>Europe</strong>an Union: statistics summary 2005–2007. Vienna, Kuratorium fürVerkehrssicherheit (Austrian Road Safety Board).Beyer FR, Ker K (2009). Street light<strong>in</strong>g for prevent<strong>in</strong>g road traffic <strong>in</strong>juries. Cochrane Database of Systematic Reviews,Issue 1, Art. No. CD004728 (DOI: 10.1002/14651858.CD004728.pub2).Bunn F et al. (2003). Area-wide traffic calm<strong>in</strong>g for prevent<strong>in</strong>g traffic related <strong>in</strong>juries. Cochrane Database ofSystematic Reviews, Issue 1, Art. No. CD003110 (DOI: 10.1002/14651858.CD003110).Centre for Research and Prevention of Injuries (2011). Fact sheet: prevention of accidental poison<strong>in</strong>g among elderly.Athens, EUNESE (http://www.euroipn.org/eunese/Documents/FS%20EN/FS_Poison<strong>in</strong>g.pdf, accessed 21October 2011).
<strong>Environmental</strong> health <strong>in</strong>equalities <strong>in</strong> <strong>Europe</strong> 81Costa G, D’errico A (2006). <strong>Inequalities</strong> <strong>in</strong> health: do occupational risks matter? <strong>Europe</strong>an Journal of Public <strong>Health</strong>,16(4):340.Council Directive 89/391/EEC of 12 June 1989 on the <strong>in</strong>troduction of measures to encourage improvements <strong>in</strong> the safetyand health of workers at work (1989). Luxembourg, <strong>Europe</strong>an Communities (http://eur-lex.europa.eu/LexUriServ/LexUriServ.do?uri=OJ:L:1989:183:0001:0008:EN:PDF, accessed 13 October 2011).Dahlgren G, Whitehead M (2006). <strong>Europe</strong>an strategies for tackl<strong>in</strong>g social <strong>in</strong>equities <strong>in</strong> health: levell<strong>in</strong>g up, part 2.Copenhagen, WHO Regional Office for <strong>Europe</strong> (http://www.euro.who.<strong>in</strong>t/__data/assets/pdf_file/0018/103824/E89384.pdf, accessed 21 October 2011).Directorate General for <strong>Health</strong> and Consumer Protection (2006). Factsheet: alcohol-related harm <strong>in</strong> <strong>Europe</strong> – keydata. Brussels, <strong>Europe</strong>an Communities (http://ec.europa.eu/health/archive/ph_determ<strong>in</strong>ants/life_style/alcohol/documents/alcohol_factsheet_en.pdf, accessed 13 October 2011).<strong>Europe</strong>an Agency for Safety and <strong>Health</strong> at Work: reduc<strong>in</strong>g workplace accidents: advice for employers [web site](2011) (http://osha.europa.eu/en/topics/accident_prevention/risks, accessed 6 June 2011).<strong>Europe</strong>an Child Safety Alliance (2009). Childhood falls. Amsterdam, EuroSafe (http://www.childsafetyeurope.org/publications/<strong>in</strong>fo/factsheets/childhood-falls.pdf, accessed 21 October 2011).<strong>Europe</strong>an Child Safety Alliance (2011). Poison<strong>in</strong>g. Amsterdam, EuroSafe (http://www.childsafetyeurope.org/publications/<strong>in</strong>fo/factsheets/childhood-poison<strong>in</strong>g.pdf, accessed 1 June 2011).<strong>Europe</strong>an Commission (2007). Improv<strong>in</strong>g quality and productivity at work: community strategy 2007–2012 on healthand safety at work. Brussels, <strong>Europe</strong>an Commission (http://eur-lex.europa.eu/LexUriServ/LexUriServ.do?uri=COM:2007:0062:FIN:EN:PDF, accessed 9 September 2011)<strong>Europe</strong>an Commission (2009). Causes and circumstances of accidents at work <strong>in</strong> the EU. Luxembourg, <strong>Europe</strong>anCommunities (http://ec.europa.eu/social/ma<strong>in</strong>.jsp?catId=738&langId=en&pubId=207&furtherPubs=yes, accessed21 October 2011).<strong>Europe</strong>an Commission (2010). Towards a <strong>Europe</strong>an area road safety area: policy orientations on road safety 2011–2020. Brussels, <strong>Europe</strong>an Commission (http://ec.europa.eu/transport/road_safety/pdf/com_20072010_en.pdf,accessed 21 October 2011).<strong>Europe</strong>an Commission (2011). Road safety knowledge base. Brussels, <strong>Europe</strong>an Commission (http://ec.europa.eu/transport/road_safety/specialist/knowledge/<strong>in</strong>dex.htm, accessed 28 April 2011).<strong>Europe</strong>an detailed mortality database [onl<strong>in</strong>e database] (2011). July 2010 version. Copenhagen, WHO RegionalOffice for <strong>Europe</strong> (http://data.euro.who.<strong>in</strong>t/dmdb/, downloaded on 15 February 2011).<strong>Europe</strong>an <strong>Health</strong> for All database [onl<strong>in</strong>e database] (2011). January 2011 version. Copenhagen, WHO RegionalOffice for <strong>Europe</strong> (http://data.euro.who.<strong>in</strong>t/hfadb, downloaded on 18 April 2011).<strong>Europe</strong>an mortality database [onl<strong>in</strong>e database] (2011). January 2011 version. Copenhagen, WHO Regional Officefor <strong>Europe</strong> (http://data.euro.who.<strong>in</strong>t/hfamdb, downloaded on 19 April 2011).<strong>Europe</strong>an Transport and Safety Council (2007). Social and economic consequences of road traffic <strong>in</strong>jury <strong>in</strong> <strong>Europe</strong>.Brussels, <strong>Europe</strong>an Transport and Safety Council (http://www.etsc.eu/documents/Social%20and%20economic%20consequences%20of%20road%20traffic%20<strong>in</strong>jury%20<strong>in</strong>%20<strong>Europe</strong>.pdf, accessed 21 October 2011).Eurostat [onl<strong>in</strong>e database] (2011). Accidents at work – until 2007 [data set]. Luxembourg, Eurostat (http://epp.eurostat.ec.europa.eu/cache/ITY_SDDS/EN/hsw_acc7_work_esms.htm, downloaded on 06 June 2011).Haddon W Jr (1980). Advances <strong>in</strong> the epidemiology of <strong>in</strong>juries as a basis for public policy. Public <strong>Health</strong> Reports,95(5): 411–421 (http://www.ncbi.nlm.nih.gov/pmc/articles/PMC1422748/?tool=pmcentrez, accessed 31 October2011).Hazen A, Ehiri JE (2006). Road traffic <strong>in</strong>juries: hidden epidemic <strong>in</strong> less developed countries. Journal of the NationalMedical Association, 98(1):73–82.ILO (1981). Convention concern<strong>in</strong>g occupational safety and health and the work<strong>in</strong>g environment (C155). Geneva,International Labour <strong>Organization</strong> (http://www.ilo.org/ilolex/english/convdisp1.htm, accessed 14 November2011).ILO (1985). Convention concern<strong>in</strong>g occupational health services (C161). Geneva, International Labour <strong>Organization</strong>(http://www.ilo.org/ilolex/english/convdisp1.htm, accessed 14 November 2011).
82Chapter 3. Injury-related <strong>in</strong>equalitiesKay D et al. (2011). Fairness <strong>in</strong> a car-dependent society. London, Susta<strong>in</strong>able Development Commission (http://www.sd-commission.org.uk/data/files/publications/fairness_car_dependant.pdf, accessed 21 October 2011).Kelsey JL et al. (2010). Indoor and outdoor falls <strong>in</strong> older adults are different: the ma<strong>in</strong>tenance of balance,<strong>in</strong>dependent liv<strong>in</strong>g, <strong>in</strong>tellect, and zest <strong>in</strong> the elderly of Boston Study. Journal of the American Geriatrics Society,58(11): 2135–2141.Kuratorium für Verkehrssicherheit (ed.) (2009). Data report: <strong>in</strong>juries <strong>in</strong> the EU due to falls of children at home. EUInjury Data & Report<strong>in</strong>g Services. Vienna, Kuratorium für Verkehrssicherheit (Austrian Road Safety Board)(https://webgate.ec.europa.eu/idb/documents/EU_<strong>in</strong>jury_data_report_2009_Falls-Children-Home.pdf, accessed31 October 2011).Laflamme L (1998). Social <strong>in</strong>equality <strong>in</strong> <strong>in</strong>jury risks: knowledge accumulated and strategies for the future. Stockholm,Karol<strong>in</strong>ska Institute and National Institute of Public <strong>Health</strong> (Report 1998: 33).Laflamme L, Diderichsen F (2000). Social differences <strong>in</strong> traffic <strong>in</strong>jury risks <strong>in</strong> childhood and youth-a literaturereview and research agenda. Injury Prevention, 6:293–298.Laflamme L, Menckel E (1995). Ag<strong>in</strong>g and occupational accidents. A review of the literature of the last threedecades. Safety Science, 21(2):145–161.Laflamme L, Burrows S, Hasselberg M (2009). Socioeconomic differences <strong>in</strong> <strong>in</strong>jury risks: a review of f<strong>in</strong>d<strong>in</strong>gs and adiscussion of potential countermeasures. Copenhagen, WHO Regional Office for <strong>Europe</strong> (http://www.euro.who.<strong>in</strong>t/__data/assets/pdf_file/0012/111036/E91823.pdf, accessed 21 October 2011).Laflamme L, Hasselberg M, Burrows S (2010). 20 years of research on socioeconomic <strong>in</strong>equality and children’sun<strong>in</strong>tentional<strong>in</strong>juries understand<strong>in</strong>g the cause-specific evidence at hand. International Journal of Pediatrics, Issue2010, Art. No. 819687, DOI: 10.1155/2010/819687 (http://www.h<strong>in</strong>dawi.com/journals/ijped/2010/819687,accessed 21 October 2011).Laflamme L et al. (2009). Address<strong>in</strong>g the socioeconomic safety divide: a policy brief<strong>in</strong>g. Copenhagen, WHO RegionalOffice for <strong>Europe</strong> (http://www.euro.who.<strong>in</strong>t/__data/assets/pdf_file/0004/96457/E92197.pdf, accessed 21 October2011).Mock C et al. (2004). Strengthen<strong>in</strong>g the prevention and care of <strong>in</strong>juries worldwide. Lancet, 363(9427):2172–2179.OECD (2001). Age<strong>in</strong>g and transport: mobility needs and safety issues. Paris, OECD (http://www.oecd.org/dataoecd/40/63/2675189.pdf, accessed 21 October 2011).Peden M, McGee K, Krug E, eds. (2002). Injury: a lead<strong>in</strong>g cause of the global burden of disease, 2000. Geneva, <strong>World</strong><strong>Health</strong> <strong>Organization</strong> (http://whqlibdoc.who.<strong>in</strong>t/publications/2002/9241562323.pdf, accessed 13 October 2011).Peden M et al. (2004). <strong>World</strong> report on road traffic <strong>in</strong>jury prevention. Geneva, <strong>World</strong> <strong>Health</strong> <strong>Organization</strong> (http://whqlibdoc.who.<strong>in</strong>t/publications/2004/9241562609.pdf, accessed 28 April 2011).Prüss-Üstün A, Corvalán C (2006). Prevent<strong>in</strong>g disease through healthy environments. Towards an estimate of theenvironmental burden of disease. Geneva, <strong>World</strong> <strong>Health</strong> <strong>Organization</strong> (http://www.who.<strong>in</strong>t/quantify<strong>in</strong>g_ehimpacts/publications/prevent<strong>in</strong>gdisease.pdf, accessed 13 October 2011).Racioppi F et al. (2004). Prevent<strong>in</strong>g road traffic <strong>in</strong>jury: a public health perspective for <strong>Europe</strong>. Copenhagen, WHORegional Office for <strong>Europe</strong> (http://www.euro.who.<strong>in</strong>t/__data/assets/pdf_file/0003/87564/E82659.pdf, accessed 13October 2011).Sethi D, Mitis F, Racioppi F (2010). Prevent<strong>in</strong>g <strong>in</strong>juries <strong>in</strong> <strong>Europe</strong>: from <strong>in</strong>ternational collaboration to localimplementation. Copenhagen, WHO Regional Office for <strong>Europe</strong> (http://www.euro.who.<strong>in</strong>t/__data/assets/pdf_file/0011/96455/E93567.pdf, accessed 21 October 2011).Sethi D et al. (2006a). Injuries and violence <strong>in</strong> <strong>Europe</strong>: why they matter and what can be done. Copenhagen, WHORegional Office for <strong>Europe</strong> (http://www.euro.who.<strong>in</strong>t/__data/assets/pdf_file/0005/98762/E88037.pdf, accessed 21October 2011).Sethi D et al. (2006b). Reduc<strong>in</strong>g <strong>in</strong>equalities from <strong>in</strong>juries <strong>in</strong> <strong>Europe</strong>. Lancet, 386(9554):2243–2250.Sethi D et al. (2008). <strong>Europe</strong>an report on child <strong>in</strong>jury prevention. Copenhagen, WHO Regional Office for <strong>Europe</strong>(http://www.who.<strong>in</strong>t/violence_<strong>in</strong>jury_prevention/child/<strong>in</strong>jury/world_report/<strong>Europe</strong>an_report.pdf, accessed 13October 2011).
<strong>Environmental</strong> health <strong>in</strong>equalities <strong>in</strong> <strong>Europe</strong> 83Siegrist J et al. (2010). Employment arrangements, work conditions and health <strong>in</strong>equalities. Task group report to theMarmot Review. London, University College London.Stirbu I et al. (2006). Injury mortality among ethnic m<strong>in</strong>ority groups <strong>in</strong> the Netherlands. Journal of Epidemiologyand Community <strong>Health</strong>, 60(3):249–255.Thomson H (2011). Hous<strong>in</strong>g improvements and their health effects. In: Braubach M, Jacobs D, Ormandy D, eds.<strong>Environmental</strong> burden of disease associated with <strong>in</strong>adequate hous<strong>in</strong>g: methods for quantify<strong>in</strong>g health impacts of selectedhous<strong>in</strong>g risks <strong>in</strong> the WHO <strong>Europe</strong>an Region. Copenhagen, WHO Regional Office for <strong>Europe</strong> (http://www.euro.who.<strong>in</strong>t/__data/assets/pdf_file/0003/142077/e95004.pdf, accessed 7 November 2011).Tüchsen F et al. (2009). Work <strong>in</strong>juries and disability. Journal of Safety Research, 40(1):21–24.Whitehead M, Dahlgren G (2006). Concepts and pr<strong>in</strong>ciples for tackl<strong>in</strong>g social <strong>in</strong>equities <strong>in</strong> health: levell<strong>in</strong>g up, part 1.Copenhagen, WHO Regional Office for <strong>Europe</strong> (http://www.enothe.eu/cop/docs/concepts_and_pr<strong>in</strong>ciples.pdf,accessed 21 October 2011).WHO (2002). The <strong>World</strong> health report 2002 – reduc<strong>in</strong>g risks, promot<strong>in</strong>g healthy life. Geneva, <strong>World</strong> <strong>Health</strong><strong>Organization</strong> (http://www.who.<strong>in</strong>t/whr/2002/en, accessed 25 May 2008).WHO (2007a). WHO global report on falls prevention <strong>in</strong> older age. Geneva, <strong>World</strong> <strong>Health</strong> <strong>Organization</strong> (http://www.who.<strong>in</strong>t/age<strong>in</strong>g/publications/Falls_prevention7March.pdf, accessed 13 October 2011).WHO (2007b). Workers’ health: global plan of action. Sixtieth <strong>World</strong> <strong>Health</strong> Assembly, 2007. Geneva, <strong>World</strong> <strong>Health</strong><strong>Organization</strong> (http://apps.who.<strong>in</strong>t/gb/ebwha/pdf_files/WHA60/A60_R26-en.pdf, accessed 19 September 2011).WHO (2007c). Prevent<strong>in</strong>g <strong>in</strong>juries and violence: a guide for M<strong>in</strong>istries of <strong>Health</strong>. Geneva, <strong>World</strong> <strong>Health</strong><strong>Organization</strong> (http://whqlibdoc.who.<strong>in</strong>t/publications/2007/9789241595254_eng.pdf, accessed 21 October 2011).WHO (2009). <strong>Europe</strong>an status report on road safety: towards safer roads and healthier transport choices. Copenhagen,WHO Regional Office for <strong>Europe</strong> (http://www.euro.who.<strong>in</strong>t/__data/assets/pdf_file/0015/43314/E92789.pdf,accessed 21 October 2011).WHO (2010a). International statistical classification of diseases and related health problems 10th revision (ICD-10):transport accidents. Geneva, <strong>World</strong> <strong>Health</strong> <strong>Organization</strong> (http://apps.who.<strong>in</strong>t/classifications/icd10/browse/2010/en#/V01-V99, accessed 21 October 2011).WHO (2010b). Social and gender <strong>in</strong>equalities <strong>in</strong> environment and health. Copenhagen, WHO Regional Office for<strong>Europe</strong> (http://www.euro.who.<strong>in</strong>t/__data/assets/pdf_file/0010/76519/Parma_EH_Conf_pb1.pdf, accessed 13October 2011).WHO (2010c). Global plan for the decade of action for road safety 2011–2020. Geneva, <strong>World</strong> <strong>Health</strong> <strong>Organization</strong>(http://www.who.<strong>in</strong>t/roadsafety/decade_of_action/plan/english.pdf, accessed 13 October 2011).WHO (2010d). Global Strategy to reduce the harmful use of alcohol. Geneva, <strong>World</strong> <strong>Health</strong> <strong>Organization</strong> (http://www.who.<strong>in</strong>t/substance_abuse/alcstratenglishf<strong>in</strong>al.pdf, accessed 4 September 2011).WHO (2010e). Falls: fact sheet no. 344. Geneva, <strong>World</strong> <strong>Health</strong> <strong>Organization</strong> (http://www.who.<strong>in</strong>t/mediacentre/factsheets/fs344/en/, accessed 10 May 2011).WHO (2011). Global burden of disease: disease and <strong>in</strong>jury regional mortality estimates for 2008. Geneva, <strong>World</strong> <strong>Health</strong><strong>Organization</strong> (http://www.who.<strong>in</strong>t/health<strong>in</strong>fo/global_burden_disease/estimates_regional/en/<strong>in</strong>dex.html, accessed21 June 2011).Williams J et al. (2011). Longer term health of young and middle-aged adults follow<strong>in</strong>g un<strong>in</strong>tentionalfalls at home result<strong>in</strong>g <strong>in</strong> hospitalization. Injury (first published onl<strong>in</strong>e April 14, 2011, DOI: 10.1016/j.<strong>in</strong>jury.2011.03.050).W<strong>in</strong>ter Griffith H, Moore S, Yoder K (2006). Complete guide to symptoms, illness and surgery, 5 th ed. London,Pengu<strong>in</strong> books.
CHAPTER4ENVIRONMENT-RELATEDINEQUALITIES
86Chapter 4. Environment-related <strong>in</strong>equalitiesChapter 4. Environmentrelated<strong>in</strong>equalitiesGabriele BolteKey messages• In EU15 countries, prevalence of compla<strong>in</strong>ts about noise from neighbours or from the street ishigher among <strong>in</strong>dividuals liv<strong>in</strong>g <strong>in</strong> relative poverty. This <strong>in</strong>equality is not apparent <strong>in</strong> NMS12countries.• The direction and degree of social <strong>in</strong>equalities <strong>in</strong> compla<strong>in</strong>ts about lack of access to recreationalor green areas depends on the local or regional situation <strong>in</strong> a given country or region, and onthe socioeconomic <strong>in</strong>dicator analysed. The expectation that disadvantaged groups might bemore affected by a lack of access to recreational or green areas is mostly met <strong>in</strong> the EU15region, while NMS12 and Euro 4 countries show more variation.• Gender differences are relevant <strong>in</strong> sociodemographic <strong>in</strong>equalities <strong>in</strong> access to recreational orgreen areas.• Among non-smokers, socioeconomic <strong>in</strong>equalities <strong>in</strong> second-hand smoke exposure at homeexist with a higher exposure among disadvantaged groups, characterized by unemployment,difficulty pay<strong>in</strong>g bills most of the time, or low self-assessed social position.• Among non-smokers <strong>in</strong> EU27 countries, prevalence of exposure to second-hand smoke<strong>in</strong>doors at work is higher among manual workers and among those <strong>in</strong>dividuals with difficultypay<strong>in</strong>g bills most of the time.• In the majority of countries, work<strong>in</strong>g non-smok<strong>in</strong>g males were more often exposed to secondhandsmoke at work than work<strong>in</strong>g non-smok<strong>in</strong>g females.• In accordance with the scientific literature, <strong>in</strong>dependent of the socioeconomic <strong>in</strong>dicator used,socially disadvantaged <strong>in</strong>dividuals <strong>in</strong> EU15 countries mostly have a higher self-assessedexposure to noise, lack of access to recreational or green areas, and exposure to second-handsmoke at home or at work. In contrast, socially advantaged <strong>in</strong>dividuals <strong>in</strong> NMS12 countriesappear to reside <strong>in</strong> urban neighbourhoods where environmental burdens such as noise or lackof access to recreational or green areas may occur more frequently.
<strong>Environmental</strong> health <strong>in</strong>equalities <strong>in</strong> <strong>Europe</strong> 87IntroductionIt has been estimated that approximately one-quarter of the global disease burden – and more thanone-third of the burden among children – is caused by modifiable environmental factors, which<strong>in</strong>clude physical, chemical and biological hazards. Cardiovascular disease and cancer, as well as healthrelatedbehaviour – such as physical activity as a mediat<strong>in</strong>g factor – are the most relevant outcomes ofnoncommunicable disease with<strong>in</strong> this estimation of the environmental disease burden <strong>in</strong> developedcountries (Prüss-Üstün and Corvalán, 2006). A pilot project on the environmental burden of disease<strong>in</strong> <strong>Europe</strong> showed that 3–7% of the standard WHO discounted age-weighted burden of disease wasassociated with n<strong>in</strong>e selected environmental stressors <strong>in</strong> the six participat<strong>in</strong>g countries. Among thesen<strong>in</strong>e stressors air pollution had the highest public health impact, followed by second-hand smoke andtraffic noise (Hänn<strong>in</strong>en and Knol, 2011).There is grow<strong>in</strong>g evidence that socioeconomic <strong>in</strong>equalities <strong>in</strong> man-made environmental conditionscontribute to health <strong>in</strong>equalities (Evans and Kantrowitz, 2002; Brulle and Pellow, 2006; Gee and Payne-Sturges, 2004). Exposure to environmental hazards as well as access to environmental benefits may differaccord<strong>in</strong>g to socioeconomic position. The f<strong>in</strong>al report of the CSDH also emphasizes the relevance ofpoor and unequal liv<strong>in</strong>g conditions for health <strong>in</strong>equalities, consider<strong>in</strong>g environmental factors <strong>in</strong> thephysical form of the built environment, the quality of the natural environment <strong>in</strong> which people reside,and the nature of employment and work<strong>in</strong>g conditions for health (CSDH, 2008).In addition, socioeconomic factors may modify health impacts by <strong>in</strong>fluenc<strong>in</strong>g an <strong>in</strong>dividual’s vulnerability(WHO, 2010; Bolte, Pauli and Hornberg, 2011). Psychosocial stress has been suggested as a vulnerabilityfactor l<strong>in</strong>k<strong>in</strong>g social conditions with environmental hazards (Gee and Payne-Sturges, 2004).Most research on socioeconomic disparities <strong>in</strong> environmental exposures has focused on environmentalhazards and pollutants, show<strong>in</strong>g, for example, that some disadvantaged urban subpopulations have ahigher exposure to ambient air pollution, with motor vehicle traffic as one important source; that areasof high exposure often co<strong>in</strong>cide with a lower socioeconomic position; and that socially disadvantagedpeople may be more responsive to air pollution (K<strong>in</strong>ney and O’Neill, 2006; Laurent et al., 2007). Studieswith<strong>in</strong> <strong>Europe</strong> <strong>in</strong>dicate that less affluent population groups are most exposed to environmental risks <strong>in</strong>their place of residence and that waste facilities are often disproportionately located <strong>in</strong> areas with moredeprived residents (Braubach and Fairburn, 2010; Martuzzi, Mitis and Forastiere, 2010). Recently, therehave been more attempts to consider environmental resources – such as access to public green areas –and the distribution of these amenities <strong>in</strong> urban neighbourhoods, which may <strong>in</strong>fluence health-relatedbehaviour, physical and mental health. Socioeconomic differences <strong>in</strong> exposure to ambient air pollution,noise, second-hand smoke and lack of access to green spaces have repeatedly been shown to existespecially among children <strong>in</strong> <strong>Europe</strong> (Bolte and Kohlhuber, 2005; Bolte, Tamburl<strong>in</strong>i and Kohlhuber,2010).The aim of this chapter on environment-related <strong>in</strong>equalities is to illustrate socioeconomic differences <strong>in</strong>environmental exposures related to noise exposure at home, lack of access to recreational or green areas,and exposure to tobacco smoke at home and at work. Us<strong>in</strong>g available data from cross-national surveysof the WHO <strong>Europe</strong>an Region, this chapter focuses on social <strong>in</strong>dicators of material circumstances(such as <strong>in</strong>come and poverty) accord<strong>in</strong>g to the <strong>in</strong>ternational debate on environmental <strong>in</strong>equalities andenvironmental justice (Brulle and Pellow, 2006; O’Neill et al., 2007).
88Chapter 4. Environment-related <strong>in</strong>equalitiesData and methodsNoise exposure at homeData were retrieved from the EU-SILC database for the years 2004 to 2009. Data were available forbetween 15 (2004) and 30 countries (2009: 27 EU Member States, Iceland, Norway and Switzerland).Details of the sample size of the cross-sectional studies for each country are given on the EU-SILC website.8 The reference population for EU-SILC <strong>in</strong>cludes all private households. Household members aged16 or over were <strong>in</strong>terviewed.Noise from neighbours or from the street was assessed based on the EU-SILC question “Do you haveany of the follow<strong>in</strong>g problems related to the place where you live?” <strong>in</strong>clud<strong>in</strong>g answer category “Toomuch noise <strong>in</strong> your dwell<strong>in</strong>g from neighbours or from outside (traffic, bus<strong>in</strong>ess, factory, etc.)” withanswer options Yes and No. The self-reported compla<strong>in</strong>ts about noise from neighbours or from thestreet are given as percentage of the total study population of each country.No stratification by sex was possible. Relative poverty was def<strong>in</strong>ed as a s<strong>in</strong>gle-adult equivalent disposable<strong>in</strong>come attributed to all household members below 60% of national median equivalized <strong>in</strong>come, thevariable obta<strong>in</strong>ed from the EU-SILC database. For equivalization of the total disposable household<strong>in</strong>come the OECD modified scale of equivalization factors was used. Categories of household type“Households with dependent children” and “Households without dependent children” were used. Thecategory “S<strong>in</strong>gle parent with dependent children” was also considered.As the data provided cover the EU countries and Iceland, Norway and Switzerland only, EU15 andNMS12 were chosen as subregions, as with the other Eurostat-based <strong>in</strong>equality <strong>in</strong>dicators <strong>in</strong> the <strong>in</strong>juryandhous<strong>in</strong>g-related <strong>in</strong>equality chapters. Data for Iceland, Norway and Switzerland are thus presentedseparately.Lack of access to recreational or green areasThe second <strong>Europe</strong>an Quality of Life Survey (EQLS) was conducted by Eurofound <strong>in</strong> 2007 withmore than 35 000 adult <strong>in</strong>terviewees from 31 countries: the 27 EU Member States, Norway, and threeEU candidate countries (Croatia, the former Yugoslav Republic of Macedonia and Turkey). Data wereobta<strong>in</strong>ed from the web site of the Economic and Social Data Service, via the UK Data Archive of theUniversity of Essex. The dataset comprised data for 35 634 people (57% female).EQLS participants were asked “Please th<strong>in</strong>k about the area where you live now – I mean the immediateneighbourhood of your home. Do you have very many reasons, many reasons, a few reasons, or no reasonat all to compla<strong>in</strong> about each of the follow<strong>in</strong>g problems?” <strong>in</strong>clud<strong>in</strong>g answer category “Lack of accessto recreational or green areas”. For analysis, the answers to this question on reasons to compla<strong>in</strong> werereduced to three categories: Yes (“Very many reasons”, “Many reasons” and “A few reasons”), No (“Noreason at all”) and Don’t know.Data for several socioeconomic <strong>in</strong>dicators were used for the <strong>in</strong>equality assessment.• Income: the dataset comprised a variable of OECD <strong>in</strong>come, with four categories – Lowest, Low,High, and Highest – <strong>in</strong>dicat<strong>in</strong>g quartiles of <strong>in</strong>come.• Difficulty pay<strong>in</strong>g bills: participants were asked, “A household may have different sourcesof <strong>in</strong>come and more than one household member may contribute to it. Th<strong>in</strong>k<strong>in</strong>g ofyour household’s total monthly <strong>in</strong>come: is your household able to make ends meet…?”The answer options were “Very easily”, “Easily”, “Fairly easily”, “With some difficulty”, “Withdifficulty”, “With great difficulty”, and “Don’t know”. For analysis, the answers were reduced tothree categories:8 See the Eurostat web site (http://epp.eurostat.ec.europa.eu/portal/page/portal/<strong>in</strong>come_social_<strong>in</strong>clusion_liv<strong>in</strong>g_conditions/documents/tab/Tab/EU-SILC%20sample%20size.pdf).
<strong>Environmental</strong> health <strong>in</strong>equalities <strong>in</strong> <strong>Europe</strong> 89º º No difficulty pay<strong>in</strong>g bills (“Very easily”, “Easily”, “Fairly easily”)º º Difficulty pay<strong>in</strong>g bills from time to time (“With some difficulty”)º º Difficulty pay<strong>in</strong>g bills most of the time (“With difficulty”, “With great difficulty”).• Employment: the available <strong>in</strong>formation was summarized <strong>in</strong>to three categories – Employed(<strong>in</strong>clud<strong>in</strong>g self-employed), Unemployed and Other (<strong>in</strong>clud<strong>in</strong>g home-maker and retired).• Level of education: participants were asked “What is the highest level of education you completed?”The answers were reduced to three categories:º º Low (“no education completed”)º º Medium (“primary education”, “lower secondary education”, or “upper secondary education”)º º High (“post-secondary, <strong>in</strong>clud<strong>in</strong>g pre-vocational or vocational education but not tertiary”,“tertiary education – first level”, or “tertiary education – advanced level”).• Household type: this variable differentiates four categories – S<strong>in</strong>gle person, S<strong>in</strong>gle parent, Couplewithout children and Couple with children.The socioeconomic <strong>in</strong>dicators given above were only moderately correlated. All analyses were stratifiedby sex.As the data provided cover the EU countries and Norway as well as the three candidate countries,subregions used to present results for geopolitical areas were EU15, NMS12, and Euro 4 countries; datafor Norway are thus presented separately <strong>in</strong> the figures.Second-hand smoke exposure at home or at workData on the second-hand smoke exposure at home and at work <strong>in</strong>dicators were derived from SpecialEurobarometer 332: tobacco (TNS Op<strong>in</strong>ion and Social, 2010) and obta<strong>in</strong>ed through the WHO <strong>Europe</strong>anCentre for Environment and <strong>Health</strong>. Special Eurobarometer 332: tobacco was part of wave 72.3 of theEurobarometer and was conducted <strong>in</strong> 2009. It comprised 30 292 residents (56% female) aged 15 orover. The analysis was restricted to 29 792 participants (56% female) of 30 countries (27 EU MemberStates and three candidate countries: Croatia, the former Yugoslav Republic of Macedonia and Turkey).To assess potential second-hand smoke exposure at home, the participants were asked “Which statementbest describes smok<strong>in</strong>g situation <strong>in</strong>side your house?” with answer options:• “Smok<strong>in</strong>g is not allowed at all <strong>in</strong>side the house”• “Smok<strong>in</strong>g is allowed only <strong>in</strong> certa<strong>in</strong> rooms <strong>in</strong>side the house”• “Smok<strong>in</strong>g is allowed everywhere <strong>in</strong>side the house”.For analysis, potential second-hand smoke exposure at home was def<strong>in</strong>ed as “Smok<strong>in</strong>g is allowed only<strong>in</strong> certa<strong>in</strong> rooms or everywhere <strong>in</strong>side the house”.To assess exposure to second-hand smoke at work, only those participants currently work<strong>in</strong>g were asked“How often are you exposed to tobacco smoke <strong>in</strong>doors at your workplace?” with answer options:• “Never or almost never”• “Less than 1 hour a day”• “1–5 hours a day”• “More than 5 hours a day”• “Not relevant (don’t work or don’t work <strong>in</strong>doors)”.S<strong>in</strong>ce the majority of participants answered “Never or almost never”, exposure to second-hand smokeat work was def<strong>in</strong>ed as any exposure, comb<strong>in</strong><strong>in</strong>g categories “Less than 1 hour a day”, “1–5 hours a day”,and “More than 5 hours a day” for analysis. In most countries the proportion of <strong>in</strong>dividuals answer<strong>in</strong>gthat they do not work <strong>in</strong>doors was below 10% of all non-smokers; exceptions were Turkey (19%) andGreece (12%).
90Chapter 4. Environment-related <strong>in</strong>equalitiesTo assess whether the lowest exposure category “Less than 1 hour a day” might cause artificial results, asensitivity analysis was carried out def<strong>in</strong><strong>in</strong>g exposure to second-hand smoke at work as at least 1 houra day.Several <strong>in</strong>dicators of socioeconomic position were used for the <strong>in</strong>equality assessment.• Self-assessed position on the social scale: participants were asked “On the follow<strong>in</strong>g scale, step ‘1’corresponds to the lowest level <strong>in</strong> the society; step ‘10’ corresponds to the highest level <strong>in</strong> the society.Could you tell me on which step you would place yourself?” This position was classified <strong>in</strong>to Low(steps 1–4), Medium (steps 5–6), and High (steps 7–10) <strong>in</strong> the dataset.• Difficulty pay<strong>in</strong>g bills: the question was “Dur<strong>in</strong>g the last twelve months, would you say you haddifficulties to pay your bills at the end of the month?” Answer options were “Most of the time”,“From time to time” and “Almost never or never”. A fourth category comprised those participantswho refused to answer this question.• Employment (applied for exposure at home). The available <strong>in</strong>formation was summarized <strong>in</strong>to threecategories:º º Employed (<strong>in</strong>clud<strong>in</strong>g self-employed, manager, other white collar worker and manual worker);º º Unemployed;º º Other (<strong>in</strong>clud<strong>in</strong>g home-maker, retired and student).• Occupation (applied for exposure at work): data were stratified <strong>in</strong>to two categories of Manualworkers and Managers.No <strong>in</strong>formation on household <strong>in</strong>come or level of education was available <strong>in</strong> this dataset. All analyseswere stratified by sex.All analyses of second-hand smoke exposure were restricted to non-smokers. To assess their currentsmok<strong>in</strong>g status, participants were asked: “Regard<strong>in</strong>g smok<strong>in</strong>g cigarettes, cigars or a pipe, which of thefollow<strong>in</strong>g applies to you?” with answer options “Smoke at the present time”, “Used to smoke but havestopped” and “Never smoked”. The smok<strong>in</strong>g status of respondents was classified as current smoker ornon-smoker (“Never smoked” or “Used to smoke but have stopped”). Depend<strong>in</strong>g on the country, 58%to 84% of the respondents were non-smokers (males: 49–88%, females: 62–85%). In total <strong>in</strong> EU27, 72%were non-smokers (males: 66%, females: 77%).As the Eurobarometer data covered the EU countries as well as the three candidate countries, subregionalgroup<strong>in</strong>gs used were EU15, NMS12, and Euro 4 countries.When consider<strong>in</strong>g social <strong>in</strong>equalities <strong>in</strong> second-hand smoke exposure, it must be borne <strong>in</strong> m<strong>in</strong>d thatcurrent smokers mostly have a lower socioeconomic position (see Table 8), so restrict<strong>in</strong>g the analysis tonon-smokers causes a disproportionate loss of socially disadvantaged <strong>in</strong>dividuals and may result <strong>in</strong> anunderestimation of <strong>in</strong>equalities. Nevertheless, from a health po<strong>in</strong>t of view, second-hand smoke exposureis more relevant <strong>in</strong> non-smokers than <strong>in</strong> active smokers.Among non-smokers, socioeconomic <strong>in</strong>dicators of self-assessed social position, difficulty pay<strong>in</strong>g bills,and employment were only weakly correlated.For the <strong>in</strong>dicators on lack of access to green space and exposure to second-hand smoke, it proved to bevery difficult – and sometimes impossible – to generate representative subregional results due to a lackof adequate data. Therefore, the subregional data often represent the average of the national rates of thecountries covered by the respective region. In each figure, this restriction is clearly marked as the averageof national rates for all report<strong>in</strong>g countries of the subregion. Subregional data that are representative(often provided by Eurostat databases, as <strong>in</strong> the case of noise exposure) do not <strong>in</strong>clude this <strong>in</strong>dicationand the aggregated results are representative of the respective subregion.
<strong>Environmental</strong> health <strong>in</strong>equalities <strong>in</strong> <strong>Europe</strong> 91Table 8. Socioeconomic characteristics of smokers and non-smokers by sex (%)MaleFemaleSmoker Non-smoker Smoker Non-smokerEU27Employment: unemployed 11.1 4.5 10.3 4.6Self-assessed social position: low 24.3 17.4 22.2 20.3Difficulty pay<strong>in</strong>g bills: most of the time 12.4 6.0 15.5 8.8EU15Employment: unemployed 9.5 4.3 9.3 4.1Self-assessed social position: low 19.0 12.1 17.2 13.5Difficulty pay<strong>in</strong>g bills: most of the time 9.6 4.1 11.9 6.0NMS12Employment: unemployed 13.4 4.8 11.5 5.3Self-assessed social position: low 31.1 24.1 28.5 28.9Difficulty pay<strong>in</strong>g bills: most of the time 15.9 8.4 20.0 12.2Euro 4 countriesEmployment: unemployed 20.9 12.2 19.2 12.2Self-assessed social position: low 35.0 32.6 32.9 32.2Difficulty pay<strong>in</strong>g bills: most of the time 24.7 17.7 28.1 20.4Source: data from Special Eurobarometer 332: tobacco (TNS Op<strong>in</strong>ion and Social, 2010).Data restrictions and limitationsAssessment of noise exposure us<strong>in</strong>g EU-SILC data was based on self-reported noise annoyance <strong>in</strong> termsof compla<strong>in</strong>ts about noise from neighbours or from the street. However, noise perception may differ bysocial position; for example, if less exposed <strong>in</strong>dividuals of a higher social position overrate their noiseexposure, then the true relationship between social position and noise exposure could be underestimated.A further limitation is that there was no quantification of the self-reported noise exposure. EU-SILCdata comprise only two <strong>in</strong>come categories, and because of restricted data access no data on sex wereavailable. F<strong>in</strong>ally, different sources of noise (noise from neighbours and traffic noise) were comb<strong>in</strong>ed<strong>in</strong>to one question <strong>in</strong> EU-SILC. From a health perspective these sources should be assessed separately,because different exposure–response relationships may exist for different k<strong>in</strong>ds of noise.Compla<strong>in</strong>ts about lack of access to recreational or green areas is a rather vague exposure <strong>in</strong>dicator. Toassess potential health impacts of this characteristic of the built environment, <strong>in</strong>formation on the quality,dimension, ease and convenience of access, perception, and usage of the green space or recreational areais necessary (Mitchell, Astell-Burt and Richardson, 2011; Lee and Maheswaran, 2011; Richardson andMitchell, 2010). Self-reported data should be comb<strong>in</strong>ed with objective data on at least the locationand dimension of green space or recreational area, and green spaces and recreational areas should bedist<strong>in</strong>guished, because there might be different mechanisms l<strong>in</strong>k<strong>in</strong>g these environmental characteristicsto health. Furthermore, both the presence and the quality of such areas should be dist<strong>in</strong>guished.The analysis of second-hand smoke exposure at home was based on the survey answer “Smok<strong>in</strong>gis allowed <strong>in</strong> certa<strong>in</strong> rooms or everywhere <strong>in</strong>side the house”. Permission to smoke only provides an<strong>in</strong>dication of exposure; it does not enable a full determ<strong>in</strong>ation of whether residents have actually beenexposed to <strong>in</strong>door smoke. Moreover, there was no supplementary <strong>in</strong>formation, such as the amountsmoked at home by any person or the duration of smok<strong>in</strong>g, <strong>in</strong> order to quantify exposure at home.The validity of self-reported data on active and passive smok<strong>in</strong>g has been questioned. Public debateabout smoke-free legislation <strong>in</strong> some countries may have contributed to a social preference bias towardsreport<strong>in</strong>g smoke-free homes, irrespective of actual smok<strong>in</strong>g habits.The analysis of second-hand smoke exposure at work was also based on self-reported data. Data wereprovided on duration of exposure, but do not allow any further quantification of exposure. There was no<strong>in</strong>formation on the validity of self-reported data on passive smok<strong>in</strong>g at work.
92Chapter 4. Environment-related <strong>in</strong>equalitiesBoth analyses were restricted to non-smokers, s<strong>in</strong>ce exposure to second-hand smoke was assessedto be more health-relevant <strong>in</strong> non-smokers. Thus, s<strong>in</strong>ce smok<strong>in</strong>g is more prevalent among sociallydisadvantaged <strong>in</strong>dividuals, this restriction will have caused a disproportionate loss of data on sociallydisadvantaged <strong>in</strong>dividuals.<strong>Inequalities</strong> <strong>in</strong> noise exposure at homeIntroduction<strong>Environmental</strong> noise (def<strong>in</strong>ed as noise emitted from all sources except <strong>in</strong>dustrial workplaces) isan important public health problem. The ma<strong>in</strong> exposure is road traffic noise. Sleep disturbance andannoyance, mostly related to road traffic noise, are the key health issues. At least one million healthylife years are lost every year from traffic-related noise <strong>in</strong> western <strong>Europe</strong>an countries, <strong>in</strong>clud<strong>in</strong>g the EUMember States (WHO, 2011). The effects of neighbourhood noise and leisure noise are not addressed<strong>in</strong> this risk assessment because of a lack of data. Moreover, differences <strong>in</strong> exposure by sex and amongvary<strong>in</strong>g socioeconomic groups, as well as additional burdens among potentially vulnerable subgroups arenot considered.Epidemiological studies show, <strong>in</strong> accordance with the fact that socially disadvantaged people are morelikely to live near busy roads, that noise annoyance due to traffic is often higher <strong>in</strong> people with a lowersocioeconomic position. In addition, social <strong>in</strong>equalities <strong>in</strong> objectively assessed noise exposure have beendemonstrated (Bolte, Tamburl<strong>in</strong>i and Kohlhuber, 2010). However, as the fact sheet on traffic noiseexposure from the Netherlands shows, it must be borne <strong>in</strong> m<strong>in</strong>d that different transport types (such asroad, tra<strong>in</strong> and air) may have different <strong>in</strong>equality profiles (see Annex 1).Indicator analysis: <strong>in</strong>equalities by <strong>in</strong>come and household typeThe overall prevalence of compla<strong>in</strong>ts about noise from neighbours or from the street varies by countrybetween 10% and 35%, with an average of 22% across EU27 (2009 figures).In the majority of the 30 report<strong>in</strong>g countries, self-reported noise exposure at home is higher among<strong>in</strong>dividuals liv<strong>in</strong>g <strong>in</strong> relative poverty, although <strong>in</strong> six countries this pattern is reversed (see Fig. 34).Prevalence <strong>in</strong> EU27 is 25% among <strong>in</strong>dividuals below the relative poverty threshold and 22% amongthose above it. However, when the countries are grouped <strong>in</strong>to subregions, the prevalence differencebetween the two <strong>in</strong>come categories is present <strong>in</strong> EU15 countries (26% versus 22%) but disappears <strong>in</strong>NMS12 countries (21% for both <strong>in</strong>come categories).There is a small but constant difference of 3–4% between the <strong>in</strong>come groups <strong>in</strong> EU15 countries from2005 to 2009, show<strong>in</strong>g no reduction <strong>in</strong> the exist<strong>in</strong>g <strong>in</strong>equality (see Fig. 35). In contrast, there are no clearand consistent differences between <strong>in</strong>come groups <strong>in</strong> NMS12 countries. Prevalence of noise exposure athome is somewhat higher <strong>in</strong> EU15 countries, regardless of <strong>in</strong>come. The highest prevalence is observedamong <strong>in</strong>dividuals liv<strong>in</strong>g <strong>in</strong> relative poverty <strong>in</strong> EU15 countries.To assess the comb<strong>in</strong>ed effect of several social dimensions, data on s<strong>in</strong>gle parents liv<strong>in</strong>g <strong>in</strong> relativepoverty were contrasted with data on households without dependent children and with a household<strong>in</strong>come above the relative poverty level. In the group of s<strong>in</strong>gle parents <strong>in</strong> relative poverty, noise exposureat home varies between 9% and 41% by country, and <strong>in</strong> the latter group it varies between 11% and38%. In the majority of countries (21 of 30) the prevalence of noise exposure at home is higher amongs<strong>in</strong>gle-parent households <strong>in</strong> relative poverty. Across EU27, the prevalence of noise exposure at home is32% among s<strong>in</strong>gle-parent households <strong>in</strong> relative poverty and 23% among households with no childrenand an <strong>in</strong>come above the relative poverty level, and if the subregional group<strong>in</strong>gs of EU15 and NMS12are applied, the prevalence difference between the two types of household are more pronounced <strong>in</strong> theEU15 countries (33% versus 23%) than the NMS12 countries (24% versus 22%).
<strong>Environmental</strong> health <strong>in</strong>equalities <strong>in</strong> <strong>Europe</strong> 93Fig. 34. Prevalence of compla<strong>in</strong>ts about noise from neighbours or from the street by relative poverty level(2009)4035Below relative poverty levelAbove relative poverty level30Prevalence (%)2520151050IrelandSwedenGreeceF<strong>in</strong>landPortugalUnited K<strong>in</strong>gdomFranceSpa<strong>in</strong>AustriaBelgiumItalyDenmarkLuxembourgGermanyNetherlandsEU 15EstoniaLithuaniaBulgariaHungaryPolandSloveniaLatviaSlovakiaCzech RepublicRomaniaMaltaCyprusNMS 12EU 27IcelandNorwaySwitzerlandSource: data from EU-SILC, 2011.Fig. 35. Time trend of prevalence of compla<strong>in</strong>ts about noise from neighbours or from the street byhousehold <strong>in</strong>come3027Prevalence (%)24211815EU15: below relative poverty levelEU15: above relative poverty levelNMS12: below relative poverty levelNMS12: above relative poverty level2005 2006 2007 2008 2009Source: data from EU-SILC, 2011.Note: NMS12 figures for 2005/2006 exclude Romania due to lack of data.Target groups for actionBased on the limited available <strong>in</strong>formation, the most exposed groups <strong>in</strong> terms of the highest prevalenceof compla<strong>in</strong>ts about noise from neighbours or from the street are low-<strong>in</strong>come groups, especially s<strong>in</strong>gleparents, ma<strong>in</strong>ly <strong>in</strong> EU15 countries.
94Chapter 4. Environment-related <strong>in</strong>equalities<strong>Health</strong> implicationsThe environmental burden of disease due to environmental noise has been recently estimated for western<strong>Europe</strong>an countries with a range of 1.0–1.6 million DALYs lost across all health outcomes (WHO,2011). The estimates are 61 000 DALYs for ischaemic heart disease, 45 000 for cognitive impairment ofchildren, 903 000 for sleep disturbance, 22 000 for t<strong>in</strong>nitus, and 587 000 for annoyance.Data from EU-SILC show a consistent but rather small prevalence difference relat<strong>in</strong>g to <strong>in</strong>come <strong>in</strong> noiseexposure – def<strong>in</strong>ed as compla<strong>in</strong>ts about noise from neighbours or from the street – especially <strong>in</strong> Euro 1countries. However, the given categorization of the two <strong>in</strong>come groups (below and above 60% of median<strong>in</strong>come) may mask the real extent of social differences across the entire <strong>in</strong>come spectrum. Differences<strong>in</strong> exposure prevalence can rise to more than 10% when more specific social groups are identified bycomb<strong>in</strong><strong>in</strong>g different socioeconomic characteristics (such as s<strong>in</strong>gle parents with low <strong>in</strong>come).S<strong>in</strong>ce compla<strong>in</strong>ts about noise from neighbours or from the street may also be <strong>in</strong>terpreted as a healtheffect <strong>in</strong> terms of annoyance, the EU-SILC data already show clear social <strong>in</strong>equalities <strong>in</strong> health relatedto noise exposure. However, from a health po<strong>in</strong>t of view it is important to recognize that there isconsiderable variation <strong>in</strong> exposure prevalence – or rather <strong>in</strong> prevalence of annoyance due to noise fromexternal sources (neighbours or street) – between countries, affect<strong>in</strong>g up to 35% of the population.Conclusions and suggestionsPrevalence of self-reported noise annoyance varies considerably between countries. Irrespective ofsocial differences, <strong>in</strong> many countries a relevant proportion of the population is affected by noise fromneighbours or from the street. In Euro 1 but not Euro 2 countries, prevalence of compla<strong>in</strong>ts about noisefrom neighbours or from the street is higher among <strong>in</strong>dividuals with low <strong>in</strong>come. If data were able to bestratified by more categories of <strong>in</strong>come, the social differences seen would probably be greater.It has been shown that health impacts such as annoyance and sleep disturbance are mostly related totraffic noise. Therefore, data on subjective noise exposure should be gathered separately for differentsources of noise. S<strong>in</strong>ce more consistent data are available on social <strong>in</strong>equalities <strong>in</strong> exposure to trafficrelatedair pollution, a clearer picture of noise <strong>in</strong>equalities could be created if data were available forexposure to traffic-related noise only. Wherever possible, measured data on noise exposure should beused to support the results presented on social <strong>in</strong>equalities <strong>in</strong> self-reported noise exposure.Suggested mitigation actions are:• further enforcement of the EU <strong>Environmental</strong> Noise Directive (Directive, 2002) to tackle theimportant public health issue of traffic-related noise;• ensur<strong>in</strong>g that action plans to address noise issues on a regional level take potential social<strong>in</strong>equalities <strong>in</strong> noise exposure <strong>in</strong>to account;• better report<strong>in</strong>g of objective traffic-related noise exposure and subjective noise annoyance bysex and socioeconomic group;• better research on comb<strong>in</strong>ed exposure to noise and air pollutants, <strong>in</strong>clud<strong>in</strong>g their distributionby sex and sociodemographic group, for a comprehensive health risk assessment.
<strong>Environmental</strong> health <strong>in</strong>equalities <strong>in</strong> <strong>Europe</strong> 95<strong>Inequalities</strong> <strong>in</strong> lack of access to recreational or green areasIntroductionGreen space may <strong>in</strong>fluence physical and mental health as well as well-be<strong>in</strong>g (Maas et al., 2006; Mitchelland Popham, 2008; Abraham, Sommerhalder and Abel, 2010). It has been proposed that green space– <strong>in</strong> terms of contact with nature – has an <strong>in</strong>fluence on health through restorative properties (Mitchell,Astell-Burt and Richardson, 2011). Both design of the built environment and accessibility of the naturalenvironment have an impact on physical activity and active liv<strong>in</strong>g (Edwards and Tsouros, 2006).Data from <strong>Europe</strong> <strong>in</strong>dicate that socially disadvantaged people often live <strong>in</strong> places with less access topublic green space (Kruize et al., 2007; Bolte, Tamburl<strong>in</strong>i and Kohlhuber, 2010). Socioeconomicallydeprived areas <strong>in</strong> Brita<strong>in</strong>, for example, have fewer large green spaces, which are assumed to be moreimportant for health effects than small ones (Mitchell, Astell-Burt and Richardson, 2011). Evenwhere there is equal access to green space, irrespective of social position, the quality of green spacemay differ, depend<strong>in</strong>g on the social characteristics of the neighbourhood (Bolte, Pauli and Hornberg,2011). In addition to this exposure variation by social group, a study from the Netherlands shows thatthe percentage of green space <strong>in</strong> people’s liv<strong>in</strong>g environment is positively associated with the perceivedgeneral health of residents, and that less-educated groups are more sensitive to the characteristics of theirphysical environmental (Maas et al., 2006). Another British study demonstrates that health <strong>in</strong>equalitiesrelated to <strong>in</strong>come deprivation are lower <strong>in</strong> populations who live <strong>in</strong> the greenest areas compared tothose who have less exposure to green space (Mitchell and Popham, 2008). F<strong>in</strong>ally, gender differences<strong>in</strong> the relationship between green space and health have been reported, which may be due to genderdifferences <strong>in</strong> the perception and usage of green spaces (Richardson and Mitchell, 2010).Indicator analysis: <strong>in</strong>equalities by sex, <strong>in</strong>come, difficulty pay<strong>in</strong>g bills,employment, education level and household typePrevalence of compla<strong>in</strong>ts about lack of access to recreational or green areas varies between 6% and 67%of EQLS participants by country, and the <strong>in</strong>tercountry prevalence range is comparable between females(7–67%) and males (5–67%). Across EU27, 34% of participants (35% of females, 34% of males) havecompla<strong>in</strong>ts about this lack of access. When divided <strong>in</strong>to subregions, the prevalence of compla<strong>in</strong>ts is32% (for both males and females) <strong>in</strong> EU15 countries, 44% (44% of females, 43% of males) <strong>in</strong> NMS12countries, and reaches 47% (47% of females, 46% of males) <strong>in</strong> the three Euro 4 countries – Croatia,the former Yugoslav Republic of Macedonia and Turkey. In Norway the prevalence is 9% among bothfemales and males. In the majority of countries, the highest rate of compla<strong>in</strong>ts was found <strong>in</strong> the 18–34year age group and the lowest among those 65 years and over.A pronounced variation <strong>in</strong> the prevalence difference across the four <strong>in</strong>come groups is observable <strong>in</strong> manycountries (see Fig. 36). Nevertheless, look<strong>in</strong>g at the total for all EU27 countries, there is only a m<strong>in</strong>ordifference <strong>in</strong> the lack of access to recreational or green areas (a maximum difference of 4% between<strong>in</strong>come quartiles for females and males). This is because those <strong>in</strong>dividuals <strong>in</strong> the lowest <strong>in</strong>come quartile<strong>in</strong> EU15 countries compla<strong>in</strong> of a lack of access more frequently (lowest <strong>in</strong>come quartile: 32% of femalesand males; highest <strong>in</strong>come quartile: 27% of females, 28% of males) while, <strong>in</strong> contrast, <strong>in</strong>dividuals <strong>in</strong> thelowest and low <strong>in</strong>come quartile <strong>in</strong> NMS12 countries compla<strong>in</strong> less often than those <strong>in</strong> the high andhighest (lowest <strong>in</strong>come quartile: 34% of females, 36% of males; highest <strong>in</strong>come quartile: 46% of females,41% of males). Look<strong>in</strong>g at the three Euro 4 countries together, there are no major social differencesbetween the two extreme <strong>in</strong>come quartiles (lowest <strong>in</strong>come: 51% of females, 46% of males; highest<strong>in</strong>come: 51% of females, 47% of males), although the prevalence of compla<strong>in</strong>ts about lack of accessto recreational or green areas is lower <strong>in</strong> the two middle <strong>in</strong>come quartiles for both females and males.However, <strong>in</strong> Croatia the highest rate of lack of access is observed among <strong>in</strong>dividuals <strong>in</strong> the highest<strong>in</strong>come quartile, <strong>in</strong> contrast to the former Yugoslav Republic of Macedonia and Turkey where thehighest rate is found among <strong>in</strong>dividuals <strong>in</strong> the lowest <strong>in</strong>come quartile.
96Chapter 4. Environment-related <strong>in</strong>equalitiesFig. 36. Prevalence of compla<strong>in</strong>ts about lack of access to recreational or green areas by <strong>in</strong>come quartile andsex (2007)80Females7060Prevalence (%)50403020100F<strong>in</strong>landDenmarkSwedenAustriaNetherlandsUnited K<strong>in</strong>gdomGermanyLuxembourgFranceIrelandBelgiumGreecePortugalSpa<strong>in</strong>ItalyEU 15 [a]SloveniaEstoniaRomaniaCzech RepublicHungaryLatviaSlovakiaCyprusPolandLithuaniaMaltaBulgariaNMS 12 [a]EU 27 [a]CroatiaTurkeyMKD [b]Euro 4 countries [a]Norway80Males7060Prevalence (%)50403020100DenmarkF<strong>in</strong>landSwedenNetherlandsUnited K<strong>in</strong>gdomFranceGermanyLuxembourgIrelandAustriaGreeceBelgiumPortugalSpa<strong>in</strong>ItalyEU 15 [a]SloveniaEstoniaRomaniaCzech RepublicLithuaniaHungaryLatviaSlovakiaCyprusPolandBulgariaMaltaNMS 12 [a]Lowest quartile Low quartile High quartile Highest quartileEU 27 [a]CroatiaTurkeyMKD [b]Euro 4 countries [a]NorwaySource: data from EQLS, 2007.Notes: [a] average of national rates; [b] MKD: ISO code for the former Yugoslav Republic of Macedonia.Stratification of the data by difficulty pay<strong>in</strong>g bills most of the time, from time to time or never revealsmarked differences <strong>in</strong> lack of access to recreational or green areas. There is a clear social gradient, withthe highest level of disadvantage most often found among those with difficulty pay<strong>in</strong>g bills most of thetime (see Table 9). Exceptions are found for females <strong>in</strong> NMS12 countries and males <strong>in</strong> Euro 4 countries.National data (see Fig. 37) show that there are large differences between countries regard<strong>in</strong>g both theoverall dimension of lack of access to recreational or green areas and the <strong>in</strong>equalities between males andfemales with various levels of difficulty pay<strong>in</strong>g bills. Several countries show a strong disadvantage for<strong>in</strong>dividuals report<strong>in</strong>g difficulty pay<strong>in</strong>g bills, while other countries show a balance or the opposite trend.In several countries, such as the Netherlands, Spa<strong>in</strong>, Estonia, Latvia and the former Yugoslav Republicof Macedonia, variations by sex on the impact of difficulty pay<strong>in</strong>g bills can be observed.
<strong>Environmental</strong> health <strong>in</strong>equalities <strong>in</strong> <strong>Europe</strong> 97Table 9. Lack of access to recreational or green areas by difficulty pay<strong>in</strong>g bills (2007)FemaleMaleNodifficultyDifficultyfrom timeto timeDifficultymost of thetimeNodifficultyDifficultyfrom timeto timeEU15 [a] 27.7 33.4 37.2 26.7 34.3 35.2NMS12 [a] 40.5 41.2 38.7 37.7 36.8 40.8EU27 [a] 32.4 35.9 36.8 30.7 34.5 36.9Euro 4countries [a]44.8 44.3 50.8 49.3 38.8 46.4Source: data from EQLS, 2007.Note: [a] average of national rates.Difficultymost of thetimeFig. 37. Prevalence of compla<strong>in</strong>ts about lack of access to recreational or green areas by difficulty pay<strong>in</strong>gbills and sex (2007)90Females80706050403020100F<strong>in</strong>landDenmarkSwedenNetherlandsGermanyUnited K<strong>in</strong>gdomFranceAustriaIrelandBelgiumLuxembourgSpa<strong>in</strong>GreecePortugalItalyEU 15 [a]SloveniaEstoniaRomaniaCzech RepublicLatviaCyprusSlovakiaHungaryPolandLithuaniaBulgariaMaltaNMS 12 [a]EU 27 [a]Prevalence (%)CroatiaTurkeyMKD [b]Euro 4 countries [a]Norway90Males8070Prevalence (%)6050403020100F<strong>in</strong>landDenmarkNetherlandsSwedenUnited K<strong>in</strong>gdomSpa<strong>in</strong>LuxembourgFranceAustriaGermanyBelgiumPortugalGreeceIrelandItalyEU 15 [a]Difficulty pay<strong>in</strong>g bills most of the timeSloveniaEstoniaCzech RepublicRomaniaCyprusLatviaHungaryLithuaniaSlovakiaPolandBulgariaMaltaNMS 12 [a]EU 27 [a]No difficulty pay<strong>in</strong>g billsCroatiaTurkeyMKD [b]Euro 4 countries [a]NorwaySource: data from EQLS, 2007.Notes: [a] average of national rates; [b] MKD: ISO code for the former Yugoslav Republic of Macedonia.Look<strong>in</strong>g at the impact of employment on the lack of access to recreational or green areas, the data<strong>in</strong>dicate that its impact is stronger but less consistent for males, and weaker but more consistent <strong>in</strong>females. The reported lack of access is consistently slightly higher among unemployed than employedfemales <strong>in</strong> EU15 countries (33% versus 31%), NMS12 countries (46% versus 44%) and Euro 4 countries(57% versus 55%). Among males the disadvantage is only higher among unemployed than employed
98Chapter 4. Environment-related <strong>in</strong>equalitiesmales <strong>in</strong> EU15 countries (36% versus 30%); <strong>in</strong> contrast, it is lower among unemployed than employedmales <strong>in</strong> NMS12 countries (38% versus 41%) and Euro 4 countries (41% versus 48%). Across all EU27countries, the prevalence of compla<strong>in</strong>ts about lack of access to recreational or green areas shows littlevariation by employment: the prevalence reported by females is 39% (unemployed) and 37% (employed),while <strong>in</strong> male respondents it is 37% (unemployed) and 35% (employed). 9At the aggregated level, there are reversed social gradients show<strong>in</strong>g an <strong>in</strong>creas<strong>in</strong>g lack of access with ahigher level of education <strong>in</strong> all subregions and for both females and males (see Table 10). The gradientis most obvious <strong>in</strong> the Euro 4 countries and much less clearly expressed <strong>in</strong> the EU15 countries. In allsubregions, differences by education level are much more pronounced than differences by sex.However, <strong>in</strong> several <strong>in</strong>dividual countries the prevalence of compla<strong>in</strong>ts about lack of access to recreationalor green areas is much higher among the less-educated than the better-educated. This is the case <strong>in</strong>F<strong>in</strong>land (17% versus 6%), the former Yugoslav Republic of Macedonia (63% versus 46%), Ireland (50%versus 20%), Italy (81% versus 66%), Malta (67% versus 50%) and the Netherlands (40% versus 19%) forfemales, and <strong>in</strong> F<strong>in</strong>land (20% versus 5%), France (43% versus 32%), Germany (50% versus 14%), Malta(60% versus 53%) and the United K<strong>in</strong>gdom (28% versus 14%) for males.F<strong>in</strong>ally, the impact of household composition on lack of access to recreational or green areas wasconsidered. The lack of access is more often expressed <strong>in</strong> s<strong>in</strong>gle-parent households than <strong>in</strong> households ofcouples without children <strong>in</strong> all subregions. A considerably higher proportion of s<strong>in</strong>gle-parent householdsare female than male (EU15: 9% female versus 2% male, NMS12: 12% versus 3%, Euro 4: 9% versus 2%;prevalence calculated among all EQLS participants of the respective subregion). Female s<strong>in</strong>gle-parenthouseholds have higher prevalence rates of compla<strong>in</strong>ts about lack of access to recreational or green areascompared to couples with children <strong>in</strong> EU15 and NMS12.An analysis of the impact of sex on <strong>in</strong>equality among s<strong>in</strong>gle-parent households revealed that a dist<strong>in</strong>ctdifference (with a higher lack of access among female than male s<strong>in</strong>gle-parent households) was seen <strong>in</strong>EU15 countries (36% of female, 26% of male s<strong>in</strong>gle-parent households) and, less strongly, <strong>in</strong> Euro 4countries (49% of female, 45% of male s<strong>in</strong>gle-parent households), but not <strong>in</strong> NMS12 countries (41% offemale, 42% of male s<strong>in</strong>gle-parent households). 10Beyond the impact of social and demographic determ<strong>in</strong>ants, the Spanish fact sheet on lack of access torecreational or green areas (see Annex 1) shows that geography and climate conditions can also affectthe provision of such spaces to the public.Target groups for actionThe impact of all the respective socioeconomic or demographic determ<strong>in</strong>ants stratified by sex wassummarized (see Fig. 38), show<strong>in</strong>g diverse and partially conflict<strong>in</strong>g trends by subregion and sex. Thepopulation groups with a higher prevalence of compla<strong>in</strong>ts about lack of access to recreational or greenareas are:• males and females <strong>in</strong> EU15, males <strong>in</strong> NMS12 and females <strong>in</strong> Euro 4 countries with difficulty pay<strong>in</strong>gbills most of the time;• those <strong>in</strong> the lowest <strong>in</strong>come quartile <strong>in</strong> EU15, and those <strong>in</strong> the highest <strong>in</strong>come quartile <strong>in</strong> NMS12countries;• unemployed females <strong>in</strong> all regions and unemployed males <strong>in</strong> EU15, as well as employed males <strong>in</strong>Euro 4 countries;• all those with a higher education level <strong>in</strong> NMS12 and Euro 4 countries (<strong>in</strong> EU15 this appliespredom<strong>in</strong>antly to males);• female s<strong>in</strong>gle-parent households <strong>in</strong> all regions (with the strongest effect visible <strong>in</strong> EU15) and males<strong>in</strong>gle-parent households <strong>in</strong> NMS12 and Euro 4 countries.9 Data for EU15, NMS12, EU27 and Euro 4 countries represent averages of national rates.10 Data for EU15, NMS12, EU27 and Euro 4 countries represent averages of national rates.
<strong>Environmental</strong> health <strong>in</strong>equalities <strong>in</strong> <strong>Europe</strong> 99Table 10. Lack of access to recreational or green areas by education level and sex (2007)FemaleMaleLoweducationMediumeducationHigheducationLoweducationMediumeducationHigheducationEU15 [a] 29.3 29.5 30.1 25.8 28.0 30.8NMS12 [a] 28.5 38.3 43.3 27.8 36.6 43.0EU27 [a] 29.0 33.4 36.0 26.5 31.8 36.2Euro 4countries [a]38.0 47.9 58.0 33.7 44.0 52.6Source: data from EQLS, 2007.Note: [a] average of national rates.<strong>Health</strong> implicationsAlthough no quantitative risk assessment of the health effects of characteristics of the built environmentsuch as access to recreational or green areas has been performed thus far, the importance of design ofthe built environment and access to the natural environment for physical activity and active liv<strong>in</strong>g hasrepeatedly been emphasized (Edwards and Tsouros, 2006). Green space is understood as a resource forphysical and mental health as well as for well-be<strong>in</strong>g (Maas et al., 2006; Mitchell and Popham, 2008;Abraham, Sommerhalder and Abel, 2010).It is very likely that the observed social differences <strong>in</strong> compla<strong>in</strong>ts about lack of access to recreational orgreen areas have an impact on social <strong>in</strong>equalities <strong>in</strong> physical activity and health.Conclusions and suggestionsThe frequency of self-reported reasons to compla<strong>in</strong> about lack of access to recreational or green areasvaries widely between countries, so the follow<strong>in</strong>g conclusions, which are based on subregional averages,may not be true for each <strong>in</strong>dividual country.Social <strong>in</strong>equalities <strong>in</strong> access to recreational or green spaces exist, <strong>in</strong>dicated by lower reported access levelsamong socially disadvantaged <strong>in</strong>dividuals, such as those characterized by the s<strong>in</strong>gle-parent householdtype <strong>in</strong>dicator <strong>in</strong> all subregions, and those with difficulty pay<strong>in</strong>g bills most of the time, primarily <strong>in</strong>EU15 countries (see Fig. 38). Unemployed females consistently report a slightly higher lack of access<strong>in</strong> all regions, as well as unemployed males <strong>in</strong> EU15, and both females and males <strong>in</strong> the lowest <strong>in</strong>comequartile <strong>in</strong> EU15.On the other hand, social disadvantage is not by default an <strong>in</strong>dicator of lower levels of access to recreationalor green areas; <strong>in</strong>dividuals with a high education level <strong>in</strong> all regions report a lack of access more often, aswell as employed males <strong>in</strong> NMS12 and Euro 4 countries and <strong>in</strong>dividuals with an <strong>in</strong>come <strong>in</strong> the highestquartile <strong>in</strong> NMS12 countries, for example. Thus, the direction and degree of social <strong>in</strong>equalities <strong>in</strong> lackof access to recreational or green areas depends on the local or regional situation <strong>in</strong> a given country orregion, as well as on the socioeconomic <strong>in</strong>dicator analysed. However, the seem<strong>in</strong>gly logical expectationthat disadvantaged groups might be more affected by a lack of access to recreational or green areas ismostly met <strong>in</strong> the EU15 region, while NMS12 and Euro 4 countries show more variation.Comb<strong>in</strong>ed exposures could be analysed us<strong>in</strong>g additional data from the EQLS. For example, question54 of the EQLS covers reasons to compla<strong>in</strong> about noise, air pollution, water quality, crime, violence orvandalism, and litter or rubbish <strong>in</strong> the streets <strong>in</strong> the immediate neighbourhood of the respondent’s home.Look<strong>in</strong>g at more aspects of the built environment could help to build an understand<strong>in</strong>g of differences <strong>in</strong><strong>in</strong>equality by sex, because safety issues are often more relevant for females.Local governments play a crucial role <strong>in</strong> creat<strong>in</strong>g healthy built environments. The cooperation of severalsectors – such as urban plann<strong>in</strong>g, hous<strong>in</strong>g, transport and public health sectors – is required (Edwardsand Tsouros, 2006).
100 Chapter 4. Environment-related <strong>in</strong>equalitiesFig. 38. Prevalence of compla<strong>in</strong>ts about lack of access to recreational or green areas by socioeconomic<strong>in</strong>dicator and sex (2007)Level ofeducationFemalesHouseholdtypeEmploymentIncomeDifficultypay<strong>in</strong>g billsLevel ofeducation0 10 20 30 40 50 60MalesHouseholdtypeEmploymentIncomeDifficultypay<strong>in</strong>g bills0 10 20 30 40 50 60EU15: high social positionEU15: low social positionNMS12: high social positionNMS12: low social positionEuro 4: high social positionEuro 4: low social positionSource: data from EQLS, 2007.Note: low social position represents low level of education, s<strong>in</strong>gle-parent household, unemployed, lowest <strong>in</strong>come quartile anddifficulty pay<strong>in</strong>g bills most of the time, respectively; high social position represents high level of education, couple withoutchildren, employed, highest <strong>in</strong>come quartile and no difficulty pay<strong>in</strong>g bills, respectively.Suggested mitigation actions are:• creation and ma<strong>in</strong>tenance of healthy built environments with accessible recreational and greenareas of good quality;• ga<strong>in</strong><strong>in</strong>g the cooperation of urban plann<strong>in</strong>g, hous<strong>in</strong>g, transport and public health sectors <strong>in</strong>health <strong>in</strong>equality impact assessments;• better report<strong>in</strong>g on the quality, dimension, ease and convenience of access, and perception ofrecreational and green areas by sex and socioeconomic group;• better research <strong>in</strong>to comb<strong>in</strong>ed exposures to hazards and <strong>in</strong>to resources beneficial to health <strong>in</strong>the built environment, <strong>in</strong>clud<strong>in</strong>g their distribution by sex and social position.
<strong>Environmental</strong> health <strong>in</strong>equalities <strong>in</strong> <strong>Europe</strong> 101<strong>Inequalities</strong> <strong>in</strong> second-hand smoke exposure at homeIntroductionSecond-hand smoke is one of the most important and widespread exposures <strong>in</strong> the <strong>in</strong>door environment(Öberg et al., 2010). The harmful health effects of second-hand smoke have been <strong>in</strong>tensively evaluated(U.S. Department of <strong>Health</strong> and Human Services, 2006; IARC, 2004). Social disparities <strong>in</strong> exposureto second-hand smoke at home <strong>in</strong> terms of a higher exposure <strong>in</strong> socially disadvantaged groups are welldocumented <strong>in</strong> <strong>Europe</strong>, with many studies focus<strong>in</strong>g on children (Bolte and Kohlhuber, 2005; Bolte andFromme, 2009; see also the fact sheet on potential smoke exposure at home by SES from Germany <strong>in</strong>Annex 1).Indicator analysis: <strong>in</strong>equalities by sex, self-assessed social position, difficultypay<strong>in</strong>g bills and employmentAll prevalence figures quoted are based on analysis restricted to non-smokers. Prevalence of potentialsecond-hand smoke exposure at home varies between 4% and 61% by country (4–62% among males;4–65% among females). Across EU27, 24% of male and 25% of female respondents report potentialexposure to second-hand smoke at home. Prevalence is 25% for both males and females <strong>in</strong> EU15countries and 24% for both sexes <strong>in</strong> NMS12 countries. There are much higher prevalence rates <strong>in</strong> thethree Euro 4 countries (49% of males, 57% of females).Differences by sex exist <strong>in</strong> most countries, but <strong>in</strong> different directions: potential exposure is higher <strong>in</strong>males than females <strong>in</strong> 13 countries and higher <strong>in</strong> females than males <strong>in</strong> 13 countries. In four countriesthere is no difference by sex. There is no consistent pattern for age groups across the countries.Self-assessed position on the social scale is associated with potential exposure to second-hand smokeat home <strong>in</strong> most countries (see Fig. 39). In the majority of countries, those <strong>in</strong>dicat<strong>in</strong>g a low position onthe social scale report potential exposure more often. Across EU27, prevalence rates are 30% for maleswith low versus 24% for males with high social position, and 30% for females with low versus 23% forfemales with high social position. In EU15 countries, the prevalence is 31% for both males and femaleswith low social position versus 23% for both sexes with high social position. In NMS12 countries, thereported potential exposure for low versus high social position is 30% versus 25% among males and 28%versus 24% among females; <strong>in</strong> Euro 4 countries, it is 53% versus 48% among males and 57% versus 51%among females.Some countries (for example, F<strong>in</strong>land, Estonia, Hungary and Malta for females and Denmark, F<strong>in</strong>land,the Netherlands, Cyprus and Estonia for males) show the reverse <strong>in</strong>equality pattern, with more frequentpotential exposure among <strong>in</strong>dividuals with high social position.The overall picture across all subregions is that <strong>in</strong>dividuals with difficulty pay<strong>in</strong>g bills most of the timeare more frequently exposed to potential second-hand smoke at home than those with no difficulty (seeTable 11). Moreover, <strong>in</strong> all regions – except <strong>in</strong> the case of females <strong>in</strong> EU15 and Euro 4 countries – thereis a consistent social gradient show<strong>in</strong>g an <strong>in</strong>crease <strong>in</strong> potential smoke exposure at home with <strong>in</strong>creas<strong>in</strong>gdifficulty pay<strong>in</strong>g bills. The largest <strong>in</strong>equality among those with difficulty pay<strong>in</strong>g bills most of the timeversus those with no difficulty is observed for males <strong>in</strong> Euro 4 countries.Despite the rather consistent trends, there are large differences between <strong>in</strong>dividual countries with<strong>in</strong> eachsubregion, most strongly expressed among males <strong>in</strong> EU15 countries (see Fig. 40). Among those withdifficulty pay<strong>in</strong>g bills most of the time, Euro 4 countries Croatia and the former Yugoslav Republic ofMacedonia show the highest prevalence rates for both males and females, but EU15 countries Swedenand Austria also show high prevalence levels for males.
102 Chapter 4. Environment-related <strong>in</strong>equalitiesFig. 39. Prevalence of potential exposure to second-hand smoke at home by self-assessed social positionand sex (2009)7060FemalesPrevalence (%)50403020100F<strong>in</strong>landSwedenPortugalIrelandGermanyFranceUnited K<strong>in</strong>gdomBelgiumLuxembourgAustriaItalyNetherlandsSpa<strong>in</strong>DenmarkGreeceEU 15 [a]LithuaniaHungaryCzech RepublicSloveniaMaltaSlovakiaEstoniaBulgariaRomaniaLatviaPolandCyprusNMS 12 [a]EU 27 [a]TurkeyCroatiaMKD [b]Euro 4 countries [a]70Males60Prevalence (%)50403020100F<strong>in</strong>landGermanyNetherlandsUnited K<strong>in</strong>gdomPortugalSwedenFranceBelgiumLuxembourgIrelandDenmarkItalyAustriaSpa<strong>in</strong>GreeceEU 15 [a]Low social positionSlovakiaLithuaniaEstoniaCzech RepublicMaltaHungaryLatviaBulgariaSloveniaCyprusRomaniaPolandNMS 12 [a]High social positionSource: data from Special Eurobarometer 332: tobacco; data analysis restricted to non-smokers.Notes: [a] average of national rates; [b] MKD: ISO code for the former Yugoslav Republic of Macedonia.EU 27 [a]TurkeyMKD [b]CroatiaEuro 4 countries [a]Table 11. Prevalence of potential exposure to second-hand smoke at home by difficulty pay<strong>in</strong>g bills and sex(2009)FemaleNodifficultyDifficultyfrom timeto timeDifficultymost of thetimeMaleNodifficultyDifficultyfrom timeto timeEU15 [a] 23.3 26.7 26.5 23.9 26.3 30.7NMS12 [a] 25.3 26.6 34.7 25.1 27.1 30.2EU27 [a] 24.2 26.7 30.2 24.4 26.6 30.5Euro 4 [a] 53.1 62.2 58.4 46.6 51.1 62.2Difficultymost of thetimeSource: data from Special Eurobarometer 332: tobacco (TNS Op<strong>in</strong>ion and Social, 2010); data analysis restricted to non-smokers.Note: [a] average of national rates.Among males, there is dist<strong>in</strong>ct variation <strong>in</strong> levels of potential exposure between employed andunemployed <strong>in</strong>dividuals across countries. In 17 of the 30 countries the prevalence of potential exposureto second-hand smoke at home is higher among unemployed than employed males. In females, onthe other hand, the prevalence differences are more consistent, show<strong>in</strong>g a higher exposure rate amongunemployed than employed females <strong>in</strong> 26 of the 30 countries.
<strong>Environmental</strong> health <strong>in</strong>equalities <strong>in</strong> <strong>Europe</strong> 103Across EU27, 29% of unemployed versus 23% of employed males and 32% of unemployed versus 23%of employed females are potentially exposed to second-hand smoke at home. Exposure prevalence <strong>in</strong>unemployed and employed <strong>in</strong>dividuals differs less <strong>in</strong> EU15 countries (males: 23% versus 21%, females:27% versus 21%) than <strong>in</strong> NMS12 countries (males: 36% versus 24%, females: 38% versus 25%), while <strong>in</strong>Euro 4 countries a large difference by employment status is found for females but not for males (males:48% versus 47%, females: 67% versus 47%). 11Fig. 40. Prevalence of potential exposure to second-hand smoke at home by difficulty pay<strong>in</strong>g bills and sex(2009)Prevalence (%)9080706050403020100Denmark [a]F<strong>in</strong>land [a]Sweden [a]LuxembourgGermanyPortugalFranceIrelandUnited K<strong>in</strong>gdomAustriaSpa<strong>in</strong>ItalyGreeceNetherlandsBelgiumEU 15 [b]FemalesLithuaniaHungaryCzech RepublicEstoniaSloveniaMaltaRomaniaBulgariaLatviaPolandSlovakiaCyprusNMS 12 [b]EU 27 [b]TurkeyCroatiaMKD [c]Euro 4 countries [b]Prevalence (%)9080706050403020100Denmark [a]F<strong>in</strong>land [a]United K<strong>in</strong>gdom [a]NetherlandsItalyFranceIrelandPortugalBelgiumGreeceGermanySpa<strong>in</strong>LuxembourgSwedenAustriaEU 15 [b]MalesDifficulty pay<strong>in</strong>g bills most of the timeMaltaCzech RepublicEstoniaLithuaniaSloveniaRomaniaHungaryPolandLatviaBulgariaSlovakiaCyprusNMS 12 [b]No difficulty pay<strong>in</strong>g billsEU 27 [b]TurkeyMKD [c]CroatiaEuro 4 countries [b]Source: data from Special Eurobarometer 332: tobacco (TNS Op<strong>in</strong>ion and Social, 2010); data analysis restricted to non-smokers.Notes: [a] prevalence by difficulty pay<strong>in</strong>g bills most of the time = 0% (due to low numbers <strong>in</strong> the respective social group); [b]average of national rates; [c] MKD: ISO code for the former Yugoslav Republic of Macedonia.Target groups for actionThe impact of all the respective socioeconomic determ<strong>in</strong>ants stratified by sex was summarized (see Fig.41). There is a consistent pattern of socioeconomic <strong>in</strong>equalities <strong>in</strong> second-hand smoke exposure at home,irrespective of the socioeconomic <strong>in</strong>dicator used. Higher exposure prevalence is present among <strong>in</strong>dividualswith low self-assessed social position, among those with difficulty pay<strong>in</strong>g bills most of the time andamong unemployed <strong>in</strong>dividuals (mostly females, and especially <strong>in</strong> Euro 4 countries). Ma<strong>in</strong> target groupsfor action regard<strong>in</strong>g smok<strong>in</strong>g <strong>in</strong> the home are thus groups such as unemployed females and males withf<strong>in</strong>ancial difficulties.11 Data for EU15, NMS12, EU27 and Euro 4 countries represent averages of national rates.
104 Chapter 4. Environment-related <strong>in</strong>equalitiesFig. 41. Prevalence of potential exposure to second-hand smoke at home by socioeconomic <strong>in</strong>dicator and sexSocialpositionFemalesDifficultypay<strong>in</strong>g billsEmploymentSocialposition0 10 20 30 40 50 60 70MalesDifficultypay<strong>in</strong>g billsEmployment0 10 20 30 40 50 60 70Prevalence (%)EU15: high social positionNMS12: high social positionEuro 4: high social positionEU15: low social positionNMS12: low social positionEuro 4: low social positionSource: data from Special Eurobarometer 332: tobacco (TNS Op<strong>in</strong>ion and Social, 2010); data analysis restricted to non-smokers.Note: low social position represents low self-assessed position on the social scale, difficulty pay<strong>in</strong>g bills most of the time andunemployed, respectively; high social position represents high self-assessed position on the social scale, (almost) no difficultypay<strong>in</strong>g bills, and employed, respectively.<strong>Health</strong> implications<strong>World</strong>wide exposure to second-hand smoke and its burden of disease <strong>in</strong> children and adult non-smokershas been estimated for the year 2004 (Öberg et al., 2011). About 1.0% of worldwide mortality and0.7% of total worldwide burden of disease are attributable to the exposure of non-smokers to secondhandsmoke, the largest disease burdens <strong>in</strong>clud<strong>in</strong>g 5.9 million DALYs lost from lower respiratory tract<strong>in</strong>fections <strong>in</strong> children younger than 5 years, 2.8 million DALYs lost from ischaemic heart disease <strong>in</strong>adults, and 1.2 million DALYs lost from asthma <strong>in</strong> adults. Globally, 47% of deaths from second-handsmoke occurred <strong>in</strong> women, 28% <strong>in</strong> children, and 26% <strong>in</strong> men.The higher potential exposure to second-hand smoke at home among the socially disadvantaged, as<strong>in</strong>dicated by the Special Eurobarometer 332: tobacco data, is likely to contribute to health <strong>in</strong>equalities.Conclusions and suggestionsThere is wide variation <strong>in</strong> the prevalence of self-reported potential exposure to second-hand smokeat home between countries. The Special Eurobarometer 332: tobacco report summarizes that the levelof smok<strong>in</strong>g permissiveness <strong>in</strong> private sett<strong>in</strong>gs is correlated with the proportion of smokers <strong>in</strong> a givencountry (TNS Op<strong>in</strong>ion and Social, 2010).Social <strong>in</strong>equalities <strong>in</strong> second-hand smoke exposure at home exist with higher exposure among sociallydisadvantaged groups, characterized by low self-assessed social position, difficulty pay<strong>in</strong>g bills most ofthe time and unemployment (see Fig. 41).
<strong>Environmental</strong> health <strong>in</strong>equalities <strong>in</strong> <strong>Europe</strong> 105Legislation creat<strong>in</strong>g smoke-free public places is mandated <strong>in</strong> Article 8 of the WHO FrameworkConvention on Tobacco Control, <strong>in</strong> order to protect people from the harmful consequences of secondhandsmoke exposure at the population level (WHO, 2003). Population-based tobacco control measuresmight reduce population smok<strong>in</strong>g prevalence, and might therefore also reduce second-hand smokeexposure.Smok<strong>in</strong>g bans are one component of a comprehensive tobacco control programme. However, accord<strong>in</strong>gto a recent Cochrane review, legislation-based smok<strong>in</strong>g bans dim<strong>in</strong>ish second-hand smoke exposure<strong>in</strong> public places but do not change self-reported second-hand smoke exposure at home (Call<strong>in</strong>an etal., 2010). Policy and prevention measures provid<strong>in</strong>g education and rais<strong>in</strong>g awareness about the healthhazards of second-hand smoke exposure focus<strong>in</strong>g on <strong>in</strong>dividual level <strong>in</strong>tervention have been shownto be less effective <strong>in</strong> socially disadvantaged groups. Thus, greater efforts need to be made to target<strong>in</strong>terventions specifically to reach socially disadvantaged people.Suggested mitigation actions are:• creation and ma<strong>in</strong>tenance of smoke-free public places by full-scale implementation of theWHO Framework Convention on Tobacco Control;• targeted <strong>in</strong>terventions aim<strong>in</strong>g to dim<strong>in</strong>ish second-hand smoke exposure at home, particularlyaddress<strong>in</strong>g socially disadvantaged groups;• better report<strong>in</strong>g on second-hand smoke exposure at home by sex and socioeconomic group,<strong>in</strong>clud<strong>in</strong>g possible effects of population-based tobacco control measures.<strong>Inequalities</strong> <strong>in</strong> second-hand smoke exposure at workIntroductionThe health effects of second-hand smoke exposure are well known and have been <strong>in</strong>tensivelyreviewed (U.S. Department of <strong>Health</strong> and Human Services, 2006; IARC, 2004; Öberg et al., 2011).Comparable to the social disparities shown <strong>in</strong> exposure to second-hand smoke at home, <strong>in</strong>dividuals<strong>in</strong> lower socioeconomic groups may experience a higher risk of second-hand smoke exposure at work(Moussa, L<strong>in</strong>dström and Ostergren, 2004). A study <strong>in</strong> Germany has shown that employees with ahigher education level are more likely to work <strong>in</strong> smoke-free workplaces or workplaces with at leastpartial smok<strong>in</strong>g restrictions (Rüge et al., 2010).Indicator analysis: <strong>in</strong>equalities by sex, self-assessed social position, difficultypay<strong>in</strong>g bills and occupationAll prevalence figures quoted are based on analysis restricted to non-smokers. Prevalence of exposure totobacco smoke <strong>in</strong>doors at work varies between 4% and 46% by country (males: 3–54%, females: 3–40%).Prevalence rates are 23% of males and 15% of females across EU27, 19% of males and 13% of females <strong>in</strong>EU15 countries, 27% of males and 18% of females <strong>in</strong> NMS12 countries, and 25% of males and 22% offemales <strong>in</strong> the three Euro 4 countries covered. Similarly, <strong>in</strong> 24 of the 30 <strong>in</strong>dividual countries, prevalencelevels are higher among males than females, <strong>in</strong>dicat<strong>in</strong>g the general existence of differences by sex <strong>in</strong>occupational second-hand smoke exposure.Across all countries, there is considerable variation <strong>in</strong> exposure by self-assessed position on the socialscale, which is especially expressed among males (see Fig. 42). Across EU27, 28% of males with lowsocial position are exposed to second-hand smoke at work <strong>in</strong> contrast to 20% of males with high social
106 Chapter 4. Environment-related <strong>in</strong>equalitiesposition. There is no such prevalence difference for females. Inverse social gradients with a higherexposure among <strong>in</strong>dividuals with a low social position are observed for both sexes <strong>in</strong> EU15 countries butonly for males <strong>in</strong> NMS12 countries, where the opposite trend is found for females. In Euro 4 countriesthere is no difference <strong>in</strong> prevalence for females, while a higher exposure level is reported for males withhigh self-assessed social position.Fig. 42. Prevalence of exposure to second-hand smoke at work by self-assessed social position and sex (2009)70Females60Prevalence (%)50403020100Denmark [a]Ireland [a]Sweden [a]United K<strong>in</strong>gdom [a]GermanyF<strong>in</strong>landLuxembourg [b]BelgiumFrancePortugalAustriaNetherlandsItalyGreeceSpa<strong>in</strong>EU 15 [c]Malta [a]LatviaSloveniaEstoniaLithuaniaCzech RepublicSlovakiaCyprusRomaniaHungaryBulgariaPolandNMS 12 [c]EU 27 [c]TurkeyCroatiaMKD [d]Euro 4 countries [c]70Males60Prevalence (%)50403020100Sweden [a]United K<strong>in</strong>gdom [a]PortugalIrelandDenmarkFranceGermanyNetherlandsF<strong>in</strong>landBelgiumItalyAustriaSpa<strong>in</strong>LuxembourgGreeceEU 15 [c]RomaniaSloveniaLatviaLithuaniaCzech RepublicPolandEstoniaSlovakiaBulgariaHungaryMaltaCyprusNMS 12 [c]EU 27 [c]TurkeyMKD [d]CroatiaEuro 4 countries [c]Low social positionHigh social positionSource: data from Special Eurobarometer 332: tobacco (TNS Op<strong>in</strong>ion and Social, 2010); data analysis restricted to non-smokers.Notes: [a] prevalence by low social position = 0% (due to low numbers <strong>in</strong> the respective social group); [b] prevalence by highsocial position = 0% (due to low numbers <strong>in</strong> the respective social group); [c] average of national rates; [d] MKD: ISO codefor the former Yugoslav Republic of Macedonia.Country data <strong>in</strong>dicate large differences, with most countries show<strong>in</strong>g similar <strong>in</strong>equality trends for malesand females, but some countries – <strong>in</strong>clud<strong>in</strong>g Belgium, Spa<strong>in</strong>, Cyprus, Estonia and Hungary – presentoppos<strong>in</strong>g <strong>in</strong>equalities by social position for males and females. The largest <strong>in</strong>equalities of double theexposure prevalence are mostly suffered by those with a low self-assessed social position, but doubledprevalence levels can also be identified for <strong>in</strong>dividuals with a high social position (for example, <strong>in</strong> Cyprusand Hungary for females, Romania and Turkey for males).Compared to the data on prevalence by self-assessed social position, the social differences <strong>in</strong> second-handsmoke exposure at work by categories of difficulty pay<strong>in</strong>g bills vary considerably between countries. InEU27, there are aga<strong>in</strong> <strong>in</strong>verse social gradients, with the highest exposure rate among those with difficultypay<strong>in</strong>g bills most of the time (27% of males, 19% of females), followed by those with difficulty pay<strong>in</strong>gbills from time to time (24% of males, 16% of females), and those with no difficulty pay<strong>in</strong>g bills (22% of
<strong>Environmental</strong> health <strong>in</strong>equalities <strong>in</strong> <strong>Europe</strong> 107males, 14% of females). However, it is clear that <strong>in</strong> EU15 countries, <strong>in</strong>equalities by difficulty pay<strong>in</strong>g billsare stronger for females (prevalence rates rang<strong>in</strong>g from 12% to 19%) while <strong>in</strong> NMS12 countries, malesare more affected (26% to 33%). Compared to the EU countries, the three countries from the Euro 4subregion show a rather different situation, with no clear trend for females and a reverse trend for males,more frequent exposure be<strong>in</strong>g associated with no difficulty pay<strong>in</strong>g bills (see Table 12).Table 12. Prevalence (%) of exposure to second-hand smoke at work by difficulty pay<strong>in</strong>g bills and sex, 2009FemaleMaleNodifficultyDifficultyfrom timeto timeDifficultymost of thetimeNodifficultyDifficultyfrom timeto timeEU15 [a] 11.7 13.5 19.0 18.7 20.3 21.1NMS12 [a] 15.9 19.7 19.6 25.8 29.1 33.2EU27 [a] 13.6 16.3 19.3 21.8 24.2 26.9Euro 4countries [a]25.7 23.2 26.2 29.0 24.0 18.4Difficultymost of thetimeSource: data from Special Eurobarometer 332: tobacco (TNS Op<strong>in</strong>ion and Social, 2010); data analysis restricted to non-smokers.Note: [a] average of national rates.Fig. 43. Prevalence of exposure to second-hand smoke at work by occupation and sex (2009)Prevalence (%)Prevalence (%)8070605040302010080706050403020100Ireland [a]GermanyF<strong>in</strong>land [a]Luxembourg [a]United K<strong>in</strong>gdomPortugalSweden [a]FranceBelgium [a]Denmark [a]Netherlands [a]Spa<strong>in</strong>Italy [a]GreeceAustriaEU 15 [b]SwedenUnited K<strong>in</strong>gdomPortugalDenmark [a]NetherlandsIrelandGermanyF<strong>in</strong>landItalyFranceBelgiumGreeceLuxembourg [a]AustriaSpa<strong>in</strong>EU 15 [b]Manual workerFemalesLatviaSloveniaCzech RepublicSlovakiaLithuaniaMaltaEstoniaHungaryRomaniaPolandBulgariaCyprusNMS 12 [b]MalesSloveniaPolandSlovakiaCzech RepublicMaltaLithuaniaLatviaBulgariaEstoniaRomaniaHungaryCyprus [a]NMS 12 [b]ManagerEU 27 [b]EU 27 [b]TurkeyCroatiaMKD [c]Euro 4 countries [b]TurkeyMKD [c]CroatiaEuro 4 countries [b]Source: data from Special Eurobarometer 332: tobacco (TNS Op<strong>in</strong>ion and Social, 2010); data analysis restricted to non-smokers.Notes: [a] prevalence among managers = 0%; [b] average of national rates; [c] MKD: ISO code for the former YugoslavRepublic of Macedonia.
108 Chapter 4. Environment-related <strong>in</strong>equalitiesWhen the data are stratified by occupation, a consistent pattern is visible, with few exceptions for eithermales or females: prevalence of second-hand smoke exposure at work is predom<strong>in</strong>antly higher amongmanual workers than managers (see Fig. 43). In EU15, <strong>in</strong>equalities exist for both sexes, with prevalencefor males at 23% among manual workers and 13% among managers, while the prevalence for femalesis 15% among manual workers and 6% among managers. In NMS12 countries, the <strong>in</strong>equality is lessstrong for females (20% among manual workers versus 16% among managers) than for males (36%versus 19%). In Euro 4 countries, the same disadvantage is found for males (31% among manual workersversus 13% among managers) but the reverse trend is shown for females, with managers more frequentlyexposed to second-hand smoke (23% versus 29%).The national fact sheet on second-hand smoke exposure at work gives further details on the issue <strong>in</strong>Italy (see Annex 1).Sensitivity analysisAs described <strong>in</strong> the data and methods section, exposure to second-hand smoke at work was def<strong>in</strong>edas any exposure, <strong>in</strong>clud<strong>in</strong>g the category “Less than 1 hour a day”. To assess whether the <strong>in</strong>clusion ofthis lowest exposure category may have caused artificial results, the prevalence of second-hand smokeexposure at work was also calculated for only those <strong>in</strong>dividuals <strong>in</strong>dicat<strong>in</strong>g an exposure of one hour ormore per day. With<strong>in</strong> this classification, 9% of males and 5% of females are exposed to smoke <strong>in</strong>doorsat the workplace across EU27, <strong>in</strong> EU15 countries it is 7% of males, 5% of females, <strong>in</strong> NMS12 countries11% of males, 6% of females, and <strong>in</strong> Euro 4 countries 12% of males and 9% of females.Us<strong>in</strong>g this more str<strong>in</strong>gent exposure def<strong>in</strong>ition, social differences <strong>in</strong> exposure prevalence rema<strong>in</strong>. AcrossEU27, exposure prevalence for males is 13.5% among manual workers and 4.8% among managers, andfor females is 6.5% among manual workers and 3.2% among managers. This difference persists <strong>in</strong> EU15countries (manual workers versus managers: males 10.8% versus 4.3%, females 6.7% versus 1.3%) aswell as <strong>in</strong> NMS12 countries (males 17.0% versus 5.4%, females 6.3% versus 5.7%) and Euro 4 countries(males 13.6% versus 11.1%, females 14.3% versus 4.9%).Target groups for actionThe impact of all the respective socioeconomic determ<strong>in</strong>ants stratified by sex was summarized (seeFig. 44). Increased exposure to second-hand smoke <strong>in</strong>doors at work shows a consistent pattern ofsocioeconomic disadvantage for several of the <strong>in</strong>dicators studied. The strongest and most consistent<strong>in</strong>equality is found for male manual workers, who can therefore be identified as the most importanttarget group for action on occupational exposure. Increased exposure is also found among female manualworkers, but it is less strong and does not apply as consistently.Analys<strong>in</strong>g the impact of self-assessed social position as well as level of difficulty pay<strong>in</strong>g bills, adisadvantage can be seen for less resourced <strong>in</strong>dividuals <strong>in</strong> EU countries, while for the Euro 4 countriesthe focus of action may rather be targeted at the occupational conditions of people – especially males –without f<strong>in</strong>ancial problems and with high social position.<strong>Health</strong> implicationsSecond-hand smoke <strong>in</strong> the workplace is an important source of exposure for non-smok<strong>in</strong>g adults,especially if they are not exposed at home (U.S. Department of <strong>Health</strong> and Human Services, 2006).Occupational exposure to second-hand smoke significantly <strong>in</strong>creases the risk of lung cancer andischaemic heart disease (Stayner et al., 2007; Öberg et al., 2010). More frequent exposure to second-handsmoke <strong>in</strong>doors at work among socially disadvantaged <strong>in</strong>dividuals may contribute to health <strong>in</strong>equalities.
<strong>Environmental</strong> health <strong>in</strong>equalities <strong>in</strong> <strong>Europe</strong> 109Several studies have <strong>in</strong>vestigated the immediate effect of smok<strong>in</strong>g bans on the health of non-smok<strong>in</strong>gemployees <strong>in</strong> bars and restaurants, and have demonstrated improvements of sensory and respiratorysymptoms (see, for example, Menzies et al., 2006; Goodman et al., 2007; Ayres et al., 2009).Fig. 44. Prevalence of exposure to second-hand smoke at work by socioeconomic <strong>in</strong>dicator and sex (2009)FemalesSocialpositionDifficultypay<strong>in</strong>g billsOccupationSocialposition0 5 10 15 20 25 30 35 40MalesDifficultypay<strong>in</strong>g billsOccupation0 5 10 15 20 25 30 35 40Prevalence (%)EU15: high social positionEU15: low social positionNMS12: high social position NMS12: low social positionEuro 4: high social position Euro 4: low social positionSource: data from Special Eurobarometer 332: tobacco (TNS Op<strong>in</strong>ion and Social, 2010); data analysis restricted to non-smokers.Note: low social position represents low self-assessed position on the social scale, difficulty pay<strong>in</strong>g bills most of the timeand manual worker, respectively; high social position represents high self-assessed position on the social scale, (almost) nodifficulty pay<strong>in</strong>g bills, and manager, respectively.Conclusions and suggestionsExposure to second-hand smoke <strong>in</strong>doors at work varies between countries, with an overall higherprevalence <strong>in</strong> males than females, and higher exposure levels <strong>in</strong> NMS12 and Euro 4 countries thanEU15 countries.Social <strong>in</strong>equalities <strong>in</strong> second-hand smoke exposure at work exist across EU27, with higher exposureprevalence among socially disadvantaged <strong>in</strong>dividuals, us<strong>in</strong>g the social <strong>in</strong>dicators occupation, f<strong>in</strong>ancialdifficulties, and self-assessed social position (see Fig. 44). For the Euro 4 countries analysed, the<strong>in</strong>equalities are less consistent, sometimes show<strong>in</strong>g lower exposure prevalence <strong>in</strong> socially deprivedpopulation groups.At the time of the Special Eurobarometer 332: tobacco survey <strong>in</strong> 2009 (TNS Op<strong>in</strong>ion and Social, 2010),legislation-based workplace smok<strong>in</strong>g bans were already effective <strong>in</strong> many <strong>Europe</strong>an countries. If thesurvey data are valid, stricter enforcement of exist<strong>in</strong>g smok<strong>in</strong>g bans is required. That second-handsmoke exposure may still occur despite a workplace-smok<strong>in</strong>g ban has been demonstrated by a study <strong>in</strong>the Netherlands, show<strong>in</strong>g exposure especially of males and lower educated employees before and afterimplementation of the smok<strong>in</strong>g ban (Verdonk-Kle<strong>in</strong>jan et al., 2009).
110Chapter 4. Environment-related <strong>in</strong>equalitiesSuggested mitigation actions are:• further implementation and enforcement of exist<strong>in</strong>g legislation-based smok<strong>in</strong>g bans <strong>in</strong>workplaces;• creation and ma<strong>in</strong>tenance of smoke-free public places by full-scale implementation of theWHO Framework Convention on Tobacco Control;• targeted <strong>in</strong>terventions aim<strong>in</strong>g to dim<strong>in</strong>ish second-hand smoke exposure at work, address<strong>in</strong>gsocially disadvantaged employees;• better report<strong>in</strong>g on second-hand smoke exposure at work by sex and socioeconomic groups,<strong>in</strong>clud<strong>in</strong>g the possible effects of population-based tobacco control measures and legislationbasedsmok<strong>in</strong>g bans <strong>in</strong> workplaces.Conclusion on environment-related <strong>in</strong>equalitiesIt has repeatedly been shown, especially <strong>in</strong> the case of children, that there are socioeconomic differences<strong>in</strong> exposure to ambient air pollution, noise and second-hand smoke and <strong>in</strong> lack of access to green space<strong>in</strong> <strong>Europe</strong> (Bolte and Kohlhuber, 2005; Bolte, Tamburl<strong>in</strong>i and Kohlhuber, 2010). This analysis of datafrom EU-SILC, EQLS and Special Eurobarometer 332: tobacco adds results for adults from up to 30countries <strong>in</strong> the WHO <strong>Europe</strong>an Region to the body of evidence.In l<strong>in</strong>e with the <strong>in</strong>ternational debate on environmental <strong>in</strong>equalities and environmental justice, thischapter focuses on social <strong>in</strong>dicators of material circumstances. Whenever possible, stratified analyseswere performed to identify the impact of sex on environmental <strong>in</strong>equalities. Analysis of any modificationof the health effects of environmental burdens by socioeconomic factors was not an objective of thisoverview.Despite restrictions <strong>in</strong> data access and applicability of the available data, this systematic approachanalys<strong>in</strong>g social differences <strong>in</strong> environmental exposures shows socioeconomic <strong>in</strong>equalities <strong>in</strong> allenvironmental dimensions studied: noise exposure (or rather annoyance), lack of access to recreationalor green areas, and exposure to second-hand smoke at home or at work. F<strong>in</strong>ancial limitations, <strong>in</strong>dicatedby a low <strong>in</strong>come or self-reported difficulty pay<strong>in</strong>g bills, for example, are consistently associated withhigher environmental threats, with some exceptions <strong>in</strong> NMS12 and Euro 4 countries. Other social ordemographic determ<strong>in</strong>ants, such as household type, also <strong>in</strong>dicate <strong>in</strong>equalities to the disadvantage ofmore vulnerable households.On the other hand, analysis of data stratified by education level, and to some extent also by employmentand occupation, shows that <strong>in</strong> some countries <strong>in</strong>creased environmental exposures may also be associatedwith higher social status <strong>in</strong>dicated by high education level, employment or managerial positions. Us<strong>in</strong>gthe available data, there was no way to identify the impact of environmental health awareness (especially<strong>in</strong> relation to education) and level of expectation on these results.S<strong>in</strong>ce all analyses were based on self-reported data, it would be desirable to strengthen the evidence basewith more objective exposure data, as well as data on characteristics of the built environment. Ambientair pollution data are particularly relevant s<strong>in</strong>ce the data currently available do not allow the assessment of<strong>in</strong>equalities related to air pollution. Surveys designed with suitable <strong>in</strong>dicators (for example, consider<strong>in</strong>gonly traffic-related noise) and more precise exposure assessments (such as evidence of real secondhandsmoke exposure at home <strong>in</strong>stead of permission to smoke at home) should be implemented. Thecomplexity of the issue cannot be captured by the <strong>in</strong>dicators currently available, so efforts are needed toassess comb<strong>in</strong>ed or cumulative environmental exposures.
<strong>Environmental</strong> health <strong>in</strong>equalities <strong>in</strong> <strong>Europe</strong> 111Several types of policy action may be recommended, based on these results:• <strong>in</strong>tegration of an <strong>in</strong>equality perspective <strong>in</strong>to urban plann<strong>in</strong>g (for example, <strong>in</strong> the design of build<strong>in</strong>gs,streets and activity-friendly neighbourhoods, and <strong>in</strong> strengthen<strong>in</strong>g public transport);• enforcement of exist<strong>in</strong>g legislation (such as smok<strong>in</strong>g bans <strong>in</strong> workplaces);• <strong>in</strong>tegration of an <strong>in</strong>equality perspective <strong>in</strong>to policy measures aimed at reduc<strong>in</strong>g environmentalhazards;• targeted measures to protect the most vulnerable groups (<strong>in</strong>dividuals with the highest prevalence ofexposure or who are most sensitive to the health effects of environmental threats).Aga<strong>in</strong>st the background of a widespread tendency to <strong>in</strong>dividualise health, it is essential to embedenvironmental concerns <strong>in</strong>to the debate on health <strong>in</strong>equalities for policy-makers. Accord<strong>in</strong>g to the f<strong>in</strong>alreport of the CSDH, one pr<strong>in</strong>ciple of action is to improve the structural determ<strong>in</strong>ants and conditionsof daily life; hence, policies must embrace all key sectors of society, not just the health or environmentsector (CSDH, 2008).ReferencesAbraham A, Sommerhalder K, Abel T (2010). Landscape and well-be<strong>in</strong>g: a scop<strong>in</strong>g study on the healthpromot<strong>in</strong>gimpact of outdoor environments. International Journal of Public <strong>Health</strong>, 55(1):59–69.Ayres JG, et al. (2009). Bar workers’ health and environmental tobacco smoke exposure (BHETSE): symptomaticimprovement <strong>in</strong> bar staff follow<strong>in</strong>g smoke-free legislation <strong>in</strong> Scotland. Occupational and <strong>Environmental</strong> Medic<strong>in</strong>e,66(5): 339–346.Bolte G, Fromme H for the GME Study Group (2009). Socioeconomic determ<strong>in</strong>ants of children’s environmentaltobacco smoke exposure and family’s home smok<strong>in</strong>g policy. <strong>Europe</strong>an Journal of Public <strong>Health</strong>, 19(1):52–58.Bolte G, Kohlhuber M (2005). PINCHE Project, f<strong>in</strong>al report workpackage 5: socioeconomic factors. GelderlandMidden, Public <strong>Health</strong> Services (http://www.p<strong>in</strong>che.hvdgm.nl/resource/pdf/documents/f<strong>in</strong>al/PINCHE_WP5_f<strong>in</strong>al_181105.pdf, accessed 31 May 2011).Bolte G, Pauli A, Hornberg C (2011). <strong>Environmental</strong> justice: social disparities <strong>in</strong> environmental exposures andhealth. Overview. In: Nriagu JO (ed.) Encyclopedia of <strong>Environmental</strong> <strong>Health</strong>. Vol. 2, pp. 459–470. Burl<strong>in</strong>gton,Elsevier.Bolte G, Tamburl<strong>in</strong>i G, Kohlhuber M (2010). <strong>Environmental</strong> <strong>in</strong>equalities among children <strong>in</strong> <strong>Europe</strong> – evaluationof scientific evidence and policy implications. <strong>Europe</strong>an Journal of Public <strong>Health</strong>, 20(1):14–20.Braubach M, Fairburn J (2010). Social <strong>in</strong>equities <strong>in</strong> environmental risks associated with hous<strong>in</strong>g and residentiallocation – a review of evidence. <strong>Europe</strong>an Journal of Public <strong>Health</strong>, 20(1):36–42.Brulle RJ, Pellow DN (2006). <strong>Environmental</strong> justice: human health and environmental <strong>in</strong>equalities. Annual Reviewof Public <strong>Health</strong>, 27:103–124.Call<strong>in</strong>an JE et al. (2010). Legislative smok<strong>in</strong>g bans for reduc<strong>in</strong>g secondhand smoke exposure, smok<strong>in</strong>g prevalenceand tobacco consumption. Cochrane Database of Systematic Reviews, 4:CD005992.CSDH (2008). Clos<strong>in</strong>g the gap <strong>in</strong> a generation: health equity through action on the social determ<strong>in</strong>ants of health. F<strong>in</strong>alreport of the Commission on Social Determ<strong>in</strong>ants of <strong>Health</strong>. Geneva, <strong>World</strong> <strong>Health</strong> <strong>Organization</strong> (http://whqlibdoc.who.<strong>in</strong>t/publications/2008/9789241563703_eng.pdf, accessed 7 July 2011).Directive 2002/49/EC of the <strong>Europe</strong>an Parliament and of the Council of 25 June 2002 relat<strong>in</strong>g to the assessment andmanagement of environmental noise (2002). Brussels, <strong>Europe</strong>an Commission (http://eur-lex.europa.eu/LexUriServ/LexUriServ.do?uri=CELEX:32002L0049:EN:HTML, accessed 4 January 2012).Edwards P, Tsouros A (2006). Promot<strong>in</strong>g physical activity and active liv<strong>in</strong>g <strong>in</strong> urban environments: the role of localgovernments. Copenhagen, WHO Regional Office for <strong>Europe</strong> (http://www.euro.who.<strong>in</strong>t/__data/assets/pdf_file/0009/98424/E89498.pdf, accessed 29 May 2011).EQLS [onl<strong>in</strong>e database] (2007). Essex and Manchester, ESDS (http://www.esds.ac.uk/f<strong>in</strong>d<strong>in</strong>gData/eqlsTitles.asp,accessed 28 December 2011).
112Chapter 4. Environment-related <strong>in</strong>equalitiesEU-SILC [onl<strong>in</strong>e database] (2011). Luxembourg, Eurostat (http://epp.eurostat.ec.europa.eu/cache/ITY_SDDS/EN/ilc_esms.htm#stat_pres, accessed 28 December 2011).Evans G, Kantrowitz E (2002). Socioeconomic status and health: the potential role of environmental risk exposure.Annual Review of Public <strong>Health</strong>, 23:303–331.Gee GC, Payne-Sturges DC (2004). <strong>Environmental</strong> health disparities: a framework <strong>in</strong>tegrat<strong>in</strong>g psychosocial andenvironmental concepts. <strong>Environmental</strong> <strong>Health</strong> Perspectives, 112(17):1645–1653 (http://www.ncbi.nlm.nih.gov/pmc/articles/PMC1253653/, accessed 18 September 2011).Goodman P et al. (2007). Effects of the Irish smok<strong>in</strong>g ban on respiratory health of bar workers and air quality <strong>in</strong>Dubl<strong>in</strong> pubs. American Journal of Respiratory and Critical Care Medic<strong>in</strong>e, 175(8):840–845.Hänn<strong>in</strong>en O, Knol A (2011). <strong>Europe</strong>an perspectives on environmental burden of disease: estimates for n<strong>in</strong>e stressors <strong>in</strong> six<strong>Europe</strong>an countries. Hels<strong>in</strong>ki, National Institute for <strong>Health</strong> and Welfare (THL) (http://www.thl.fi/thl-client/pdfs/b75f6999-e7c4-4550-a939-3bccb19e41c1, accessed 26 May 2011).IARC (2004). Tobacco smoke and <strong>in</strong>voluntary smok<strong>in</strong>g. Lyon, International Agency for Research on Cancer(IARC monographs on the evaluation of carc<strong>in</strong>ogenic risks to humans, Vol. 83; http://monographs.iarc.fr/ENG/Monographs/vol83/mono83.pdf, accessed 5 January 2012).K<strong>in</strong>ney PL, O’Neill MS (2006). <strong>Environmental</strong> equity. In: WHO (ed.), Air quality guidel<strong>in</strong>es: global update 2005.Copenhagen, WHO Regional Office for <strong>Europe</strong>, pp 135–152 (http://www.euro.who.<strong>in</strong>t/__data/assets/pdf_file/0005/78638/E90038.pdf, accessed 26 May 2011).Kruize H et al. (2007). <strong>Environmental</strong> equity and the role of public policy: experiences <strong>in</strong> the Rijnmond region.<strong>Environmental</strong> Management, 40(4):578–595.Laurent O et al. (2007). Effect of socioeconomic status on the relationship between atmospheric pollution andmortality. Journal of Epidemiology and Community <strong>Health</strong>, 61(8):665–675.Lee ACK, Maheswaran R (2011). The health benefits of urban green spaces: a review of the evidence. Journal ofPublic <strong>Health</strong>, 33(2): 212–222.Martuzzi M, Mitis F, Forastiere F (2010). <strong>Inequalities</strong>, <strong>in</strong>equities, environmental justice <strong>in</strong> waste management andhealth. <strong>Europe</strong>an Journal of Public <strong>Health</strong>, 20(1):21–26.Maas J et al. (2006). Green space, urbanity, and health: how strong is the relation? Journal of Epidemiology andCommunity <strong>Health</strong>, 60(7):587–592.Menzies D et al. (2006). Respiratory symptoms, pulmonary function, and markers of <strong>in</strong>flammation among barworkers before and after a legislative ban on smok<strong>in</strong>g <strong>in</strong> public places. Journal of the American Medical Association,296(14):1742–1748.Mitchell R, Popham F (2008). Effect of exposure to natural environment on health <strong>in</strong>equalities: an observationalpopulation study. Lancet, 372(9650):1655–1660.Mitchell R, Astell-Burt T, Richardson EA (2011). A comparison of green space <strong>in</strong>dicators for epidemiologicalresearch. Journal of Epidemiology and Community <strong>Health</strong>, 65(10):853–858.Moussa K, L<strong>in</strong>dström M, Ostergren PO (2004). Socioeconomic and demographic differences <strong>in</strong> exposure toenvironmental tobacco smoke at work: the Scania Public <strong>Health</strong> Survey 2000. Scand<strong>in</strong>avian Journal of Public<strong>Health</strong>, 32(3):194–202.Öberg M et al. (2010). Second-hand smoke: assess<strong>in</strong>g the burden of disease at national and local levels.Geneva, <strong>World</strong><strong>Health</strong> <strong>Organization</strong> (<strong>Environmental</strong> Burden of Disease Series, No. 18; http://www.who.<strong>in</strong>t/quantify<strong>in</strong>g_ehimpacts/publications/SHS.pdf, accessed 29 May 2011).Öberg M et al. (2011). <strong>World</strong>wide burden of disease from exposure to second-hand smoke: a retrospective analysisof data from 192 countries. Lancet, 377(9760):139–146.O’Neill MS et al. (2007). Poverty, environment, and health: the role of environmental epidemiology andenvironmental epidemiologists. Epidemiology, 18(6):664–668.Prüss-Üstün A, Corvalán C (2006). Prevent<strong>in</strong>g disease through healthy environments. Towards an estimate of theenvironmental burden of disease. Geneva, <strong>World</strong> <strong>Health</strong> <strong>Organization</strong> (http://www.who.<strong>in</strong>t/quantify<strong>in</strong>g_ehimpacts/publications/prevent<strong>in</strong>gdisease.pdf, accessed 26 May 2011).
<strong>Environmental</strong> health <strong>in</strong>equalities <strong>in</strong> <strong>Europe</strong> 113Richardson EA, Mitchell R (2010). Gender differences <strong>in</strong> relationships between urban green space and health <strong>in</strong>the United K<strong>in</strong>gdom. Social Science and Medic<strong>in</strong>e, 71(3):568–575.Rüge J et al. (2010). Workplace smok<strong>in</strong>g restrictions: smok<strong>in</strong>g behavior and the <strong>in</strong>tention to change amongcont<strong>in</strong>u<strong>in</strong>g smokers. International Journal of Public <strong>Health</strong>, 55(6):599–608.Stayner L et al. (2007). Lung cancer risk and workplace exposure to environmental tobacco smoke. AmericanJournal of Public <strong>Health</strong>, 97(3):545–551.TNS Op<strong>in</strong>ion and Social (2010). Special Eurobarometer 332: tobacco. Brussels, <strong>Europe</strong>an Commission (http://ec.europa.eu/public_op<strong>in</strong>ion/archives/ebs/ebs_332_en.pdf, accessed 31 May 2011).U.S. Department of <strong>Health</strong> and Human Services (2006). The health consequences of <strong>in</strong>voluntary exposure to tobaccosmoke: a report of the surgeon general. Atlanta, GA, U.S. Department of <strong>Health</strong> and Human Services, Centersfor Disease Control and Prevention, Coord<strong>in</strong>at<strong>in</strong>g Center for <strong>Health</strong> Promotion, National Center for ChronicDisease Prevention and <strong>Health</strong> Promotion, Office on Smok<strong>in</strong>g and <strong>Health</strong> (http://www.surgeongeneral.gov/library/secondhandsmoke/, accessed 07 July 2011).Verdonk-Kle<strong>in</strong>jan WM et al. (2009). Does the workplace-smok<strong>in</strong>g ban elim<strong>in</strong>ate differences <strong>in</strong> risk forenvironmental tobacco smoke exposure at work? <strong>Health</strong> Policy, 92(2–3):197–202.WHO (2003). WHO Framework Convention on Tobacco Control. Geneva, <strong>World</strong> <strong>Health</strong> <strong>Organization</strong> (http://www.who.<strong>in</strong>t/tobacco/framework/WHO_FCTC_english.pdf, accessed 17 October 2011).WHO (2010). Environment and health risks: a review of the <strong>in</strong>fluence and effects of social <strong>in</strong>equalities. Copenhagen,WHO Regional Office for <strong>Europe</strong> (http://www.euro.who.<strong>in</strong>t/__data/assets/pdf_file/0003/78069/E93670.pdf,accessed 29 May 2011).WHO (2011). Burden of disease from environmental noise: quantification of healthy life years lost <strong>in</strong> <strong>Europe</strong>.Copenhagen, WHO Regional Office for <strong>Europe</strong> (http://www.who.<strong>in</strong>t/quantify<strong>in</strong>g_ehimpacts/publications/e94888.pdf, accessed 26 May 2011).
CHAPTER5GAPS IN EVIDENCEAND RESTRICTIONSON ASSESSINGENVIRONMENTALHEALTH INEQUALITIES
116Chapter 5. Gaps <strong>in</strong> evidence and restrictions on assess<strong>in</strong>g environmental health <strong>in</strong>equalitiesChapter 5. Gaps <strong>in</strong> evidenceand restrictions onassess<strong>in</strong>g environmentalhealth <strong>in</strong>equalitiesNita Chaudhuri, Matthias BraubachIntroductionHigh-quality data should be the foundation for understand<strong>in</strong>g and tak<strong>in</strong>g political action on environmentalhealth <strong>in</strong>equalities <strong>in</strong> <strong>Europe</strong>. However, one of the greatest weaknesses <strong>in</strong> work on environmental health<strong>in</strong>equalities is the many gaps <strong>in</strong> data and evidence <strong>in</strong> the region. The lack of environmental risk factorand exposure data – as well as the limited stratification of environmental risk exposures by factors suchas age, gender, <strong>in</strong>come, ethnicity, employment and education – makes it difficult to identify vulnerablegroups and the magnitude of <strong>in</strong>equality. Inconsistent <strong>in</strong>equality data also make produc<strong>in</strong>g comparisonswith<strong>in</strong> and between countries a challenge, and potentially limit the development of targeted policyresponses. This can have important consequences for the health of populations, and thus the lack of dataon environmental health <strong>in</strong>equalities <strong>in</strong> itself represents an environmental justice issue.Timely, accurate, valid, reliable and relevant data help to identify important associations betweenenvironmental risk factors and sociodemographic determ<strong>in</strong>ants, and lead to better understand<strong>in</strong>gof the patterns of exposure-response relationships and subsequent health outcomes. Such <strong>in</strong>creasedunderstand<strong>in</strong>g and awareness will <strong>in</strong>form plann<strong>in</strong>g and decision-mak<strong>in</strong>g for <strong>in</strong>terventions and resourceallocation, and can thus help to reduce the disproportionate burden of environmental risks on vulnerablegroups.Improv<strong>in</strong>g the availability and quality of such data is a major priority for further and more detailedassessments of environmental health <strong>in</strong>equalities. In consequence, the current data limitations – described<strong>in</strong> more detail below – need to be tackled urgently to implement sociodemographic determ<strong>in</strong>ants ofhealth approaches effectively with<strong>in</strong> the environmental health sector.Miss<strong>in</strong>g dataLack of data on environmental exposure is one key reason why a complete picture of regionalenvironmental health <strong>in</strong>equalities is not possible. This is especially the case for the eastern part of theWHO <strong>Europe</strong>an Region, where <strong>in</strong>formation on environmental risks is scarce <strong>in</strong> general and thus alreadyrestricts environmental health risk assessments on population level. However, even <strong>in</strong> the western part ofthe Region, a range of environmental exposure <strong>in</strong>dicators is only sporadically collected <strong>in</strong> many countries,and for various specific environmental risks no reliable data are available <strong>in</strong> any of the Member States.Typical environmental justice <strong>in</strong>dicators – such as distance to waste site, location close to busy road,location <strong>in</strong> dangerous area (prone to floods, landslides, and so on) – are rarely collected by countries, andvery few of these <strong>in</strong>dicators l<strong>in</strong>k neighbourhood and hous<strong>in</strong>g location to social and/or environmental
<strong>Environmental</strong> health <strong>in</strong>equalities <strong>in</strong> <strong>Europe</strong> 117deprivation. For other relevant environmental risks considered high priority – such as air pollution,<strong>in</strong>door air quality, chemical exposure, radiation or measured noise levels – reliable statistical data are alsolimited to very few countries.Limited stratification by sociodemographic determ<strong>in</strong>antsAlthough a variety of environmental risk factor data have been gathered by both national and<strong>in</strong>ternational bodies (mostly restricted to the EU region), stratification of these risks by sociodemographicdeterm<strong>in</strong>ants is limited.International databases such as Eurostat, for example, provide a number of environmental risk <strong>in</strong>dicatorsfor many countries <strong>in</strong> the EU. Several relevant sociodemographic dimensions of these data (suchas education, employment status and ethnicity), however, are not available. Stratification of data onimportant risk factors such as water supply, collected by the Jo<strong>in</strong>t Monitor<strong>in</strong>g Programme, is limited torural–urban dimensions, which may not be relevant to all countries. Injury data provided <strong>in</strong> the WHO<strong>Europe</strong>an <strong>Health</strong> for All database are also limited to stratification by age and sex only, leav<strong>in</strong>g out,for example, the very relevant dimension of <strong>in</strong>come. <strong>Environmental</strong> databases, while provid<strong>in</strong>g rich<strong>in</strong>formation on environmental conditions and trends, usually focus exclusively on this data dimensionand seldom offer further breakdown of the data by population subgroups.National statistical data are often affected by similar limitations. For example, data on air pollutionare mostly restricted to the assessment of pollutant levels and are not related to sociodemographicpopulation variables. Similarly, limited data on <strong>in</strong>door air quality are available at the national level forsome countries but cannot be broken down by sociodemographic determ<strong>in</strong>ants. This limits the richnessof the <strong>in</strong>equality <strong>in</strong>formation that can be reported.Many countries have collected environmental risk data – on traffic noise, for example – <strong>in</strong> various formatssuch as geographical <strong>in</strong>formation systems (GIS) or exposure maps. Information on sociodemographiccharacteristics, however, has not been collected simultaneously, and the potential overlay of mappeddata on sociodemographic determ<strong>in</strong>ants has yet to be explored <strong>in</strong> many countries. Aggregate-level data(on districts, postal codes, deprived neighbourhoods, and so on) have also been collected; they <strong>in</strong>dicateuseful dimensions of environmental risks associated with social or neighbourhood deprivation levels,but do not enable the identification of environmental health <strong>in</strong>equalities at the household or personallevel. While the assessment of territorial disparities is enhanced by such data collection techniques, theidentification of vulnerable risk groups rema<strong>in</strong>s restricted.Social deprivation <strong>in</strong>dices have been used and suggested by a number of countries to identify populationsat risk and provide a powerful tool for identify<strong>in</strong>g major risk groups. However, such <strong>in</strong>dices would needto be disaggregated to provide a more detailed understand<strong>in</strong>g of the l<strong>in</strong>k between the separate socialdeterm<strong>in</strong>ants and environmental risk factors.Data qualityAccuracy, validity, timel<strong>in</strong>ess, completeness and relevance are some of the desirable attributes that def<strong>in</strong>edata quality. Infrastructure and resource availability for data collection, as well as country and regionalpriorities, often <strong>in</strong>fluence the extent to which quality can be assured. In the WHO <strong>Europe</strong>an Regionthere is a clear trend that when an <strong>in</strong>creased level of detail or a higher quality of data is required, fewercountries are able to report on it. Also, greater variations and <strong>in</strong>consistencies between national data existwhen more detailed or objectively measured data are reported.A key challenge for environmental risk assessment is that some exposure data tend to be based on selfreportedrather than objective data, which means that perception rather than objective measurement isthe basis for the assessment. Although it is often mean<strong>in</strong>gful to ask <strong>in</strong>dividuals about their subjective
118Chapter 5. Gaps <strong>in</strong> evidence and restrictions on assess<strong>in</strong>g environmental health <strong>in</strong>equalitiesperception of exposures, rather than to consider only objective data that people may feel about verydifferently, self-reported data make comparison difficult exactly because they <strong>in</strong>clude a personalassessment. Examples of environmental exposure that are often surveyed us<strong>in</strong>g self-reported exposure<strong>in</strong>clude noise, dampness and air pollution data. The restricted validity and reliability of these selfreportedrather than objective measures need to be considered when assess<strong>in</strong>g survey designs or <strong>in</strong>equalityrelationships based on such data. However, for many environmental risk factors such <strong>in</strong>formation will bethe only data available and, despite its limitations, may still provide useful <strong>in</strong>dications of the perceivedenvironmental burden.Representativeness of data can also be problematic, especially <strong>in</strong> relation to data collected through nationalsurveys that are not developed to provide detailed data on specific population subgroups. For example,small risk groups – such as poor s<strong>in</strong>gle-parent households – may make up only a small percentage ofthe population, and consequently may be represented by a low number of people respond<strong>in</strong>g to thesurvey, lead<strong>in</strong>g to vague and, at best, <strong>in</strong>dicative results. Extrapolation of such data to the national leveltherefore causes substantial concerns regard<strong>in</strong>g the reliability of national assessments. Nevertheless,acknowledg<strong>in</strong>g this limitation, many <strong>in</strong>equality assessments will have to rely on such surveys s<strong>in</strong>ce noalternative data sources are available. Targeted surveys on specific risk groups, based on adequate samplesizes, would be necessary for more reliable and detailed assessments.Consistency and comparabilityConsistency is another dimension of data quality that allows for comparability with<strong>in</strong> and betweencountries. The highest consistency levels are usually provided by <strong>in</strong>ternational studies us<strong>in</strong>g similarmethods and def<strong>in</strong>itions for each country surveyed, but these studies tend to be more general andaddress the full populations. By contrast, national studies often provide more detailed data and/or focuson specific target groups, but tend to be difficult to compare to similar studies undertaken <strong>in</strong> othercountries.Several criteria <strong>in</strong>fluence the extent to which data on environmental risk factors and sociodemographicdeterm<strong>in</strong>ants are consistently collected and reported. Numerous def<strong>in</strong>itions exist, for example, with<strong>in</strong>and between countries on many environmental and sociodemographic <strong>in</strong>dicators, which <strong>in</strong>clude bothsubjective and objective measures. Interpretations of given risk factors may differ between countriesbecause of sociocultural, environmental or health priorities. This leads to the development of differenttypes of measurement <strong>in</strong>dicators. For example, assessments of overcrowd<strong>in</strong>g may measure floor space <strong>in</strong>square metres or number of rooms, or may report on subjective notions of overcrowd<strong>in</strong>g. Similarly, unitsof measurement may also differ, <strong>in</strong>clud<strong>in</strong>g <strong>in</strong>dividuals, households, or percentages of the population.This makes consistency <strong>in</strong> report<strong>in</strong>g difficult, especially when <strong>in</strong>dividual national studies from differentcountries are compared and represent the ma<strong>in</strong> or only data source.Similarly, countries may also collect multiple variables for one risk factor where def<strong>in</strong>itions and datacollection protocols may be different, aga<strong>in</strong> creat<strong>in</strong>g <strong>in</strong>consistency <strong>in</strong> comparability. For example, variouscollection mechanisms exist for data on <strong>in</strong>juries and on absence from work due to <strong>in</strong>juries, mak<strong>in</strong>gcountry comparison difficult. A similar situation is created by noise exposure studies which use differentexposure thresholds, <strong>in</strong>dicat<strong>in</strong>g the proportion of households exposed to more than 60 A-weighteddecibels (dB(A)) <strong>in</strong> one country, while identify<strong>in</strong>g households with exposure levels above 65 dB(A) <strong>in</strong>another.Indicators can also be collected at different <strong>in</strong>tervals or frequencies, mak<strong>in</strong>g comparability betweencountries with<strong>in</strong> specific time frames tricky. This may be the case particularly for detailed nationalpopulation surveys or censuses that are not implemented on an annual basis, but also relates to<strong>in</strong>ternational surveys. This aspect of data quality also affects the timel<strong>in</strong>ess of the data to provide reliable<strong>in</strong>formation for decision-mak<strong>in</strong>g to address environmental health <strong>in</strong>equalities.
<strong>Environmental</strong> health <strong>in</strong>equalities <strong>in</strong> <strong>Europe</strong> 119Geographic scope also differs, as similarly def<strong>in</strong>ed <strong>in</strong>dicators may be collected at local, regional ornational levels. This makes it difficult to compare the magnitude of <strong>in</strong>equalities between and with<strong>in</strong>countries, and is further complicated by the fact that many environmental exposures do not adhere toterritorial or adm<strong>in</strong>istrative boundaries.Sociodemographic data often vary <strong>in</strong> relation to country-specific categories. Levels of education, forexample, differ accord<strong>in</strong>g not only to years of obligatory school<strong>in</strong>g, but also to the type of school<strong>in</strong>g,such as vocational or university. These dist<strong>in</strong>ctions are not always made and the categories used bycountries are often not comparable. Similarly, <strong>in</strong>come categories may differ by stratification of actuallevels of <strong>in</strong>come <strong>in</strong> local currency, or based on different def<strong>in</strong>itions of high-, low- or middle-<strong>in</strong>comegroups. Similar problems apply for data on ethnic groups or migrants, and some countries even havelegislation that bans the identification of survey participants <strong>in</strong> relation to ethnic groups.Access to dataDespite all such limitations, many data useful for the assessment of environmental health <strong>in</strong>equalitiesare frequently collected by a range of actors work<strong>in</strong>g on environment, health, social protection, urbanplann<strong>in</strong>g, transport, occupational safety and so on. However, a lack of coord<strong>in</strong>ation and data exchangebetween different national as well as <strong>in</strong>ternational <strong>in</strong>stitutions prevents the effective exploitation and<strong>in</strong>tegration of many data sets to provide a fuller picture of environmental health <strong>in</strong>equalities. Dataelements thus rema<strong>in</strong> scattered and <strong>in</strong> the hands of different actors <strong>in</strong>stead of be<strong>in</strong>g brought together.In many countries, relevant data are not easily accessible because of legal and cost constra<strong>in</strong>ts, and thismay also be the case for national or governmental <strong>in</strong>stitutions. Public authorities, as well as commercialmonopolies, often collect data but are reluctant to release them, and data made available are frequently<strong>in</strong> formats that are difficult to work with.Cumulative and multiple exposuresIndividuals and households may experience many risk factors <strong>in</strong> parallel, accumulat<strong>in</strong>g problems thatlead to multiple exposures. This requires a more complex approach to analysis, as several exposuredimensions need to be brought together with<strong>in</strong> the same data set. However, most risk factors arestudied, collected and reported separately, lead<strong>in</strong>g to an underestimation of multiple exposures whendocument<strong>in</strong>g clustered <strong>in</strong>equalities. It is difficult to develop a consistent approach that can be similarlyapplied <strong>in</strong> a number of countries with different data and priorities. Nevertheless, this should not precludecomparisons between countries us<strong>in</strong>g simple messages to convey <strong>in</strong>equalities.Country prioritiesCountries have different priorities <strong>in</strong> relation to environmental health <strong>in</strong>equalities, which directly affectthe availability and use of data. These priorities may relate to levels of development and affluence,historical development or general environmental conditions such as climate or health status. Forexample, rural–urban differences <strong>in</strong> some countries represent a significant <strong>in</strong>dicator of <strong>in</strong>equality, while<strong>in</strong> other countries such <strong>in</strong>formation is considered irrelevant. Similarly, the ability to keep the home warmdur<strong>in</strong>g w<strong>in</strong>ter may not be considered relevant <strong>in</strong> countries where central heat<strong>in</strong>g is a basic standard <strong>in</strong>all dwell<strong>in</strong>gs. Water and sanitation data <strong>in</strong> many eastern <strong>Europe</strong>an and central Asian countries areconsidered to be a priority, but they are not considered relevant for – and are thus no longer collectedby – some EU states. In consequence, <strong>in</strong>dividual countries have no data available on a selected range ofenvironmental and sociodemographic risk factors.
120 Chapter 5. Gaps <strong>in</strong> evidence and restrictions on assess<strong>in</strong>g environmental health <strong>in</strong>equalitiesSociodemographic <strong>in</strong>equalities <strong>in</strong> the eastern <strong>Europe</strong>an and central Asian countries are among the mostnotable, yet little has been done <strong>in</strong> these countries to make the study of the effects of sociodemographicfactors on environment and health outcomes a priority. This has led to the dearth of data apparent <strong>in</strong>this report.Data gaps and relevance for public healthAlthough the literature on environmental health <strong>in</strong>equalities contributes to the stock of available<strong>in</strong>formation – particularly when similar patterns are reported frequently – the overall evidence base islimited, mostly due to the lack of statistical evidence and prevalence studies focus<strong>in</strong>g on specific risk groups.Develop<strong>in</strong>g robust and relevant environmental health <strong>in</strong>equality <strong>in</strong>dicators is, therefore, an essentialrequirement <strong>in</strong> order to develop a better understand<strong>in</strong>g of the complex way <strong>in</strong> which environmental riskfactors operate <strong>in</strong> the social environment, and to identify the respective risk groups to be targeted. Datacollected with regular frequency can provide time trend <strong>in</strong>formation to <strong>in</strong>form environmental, healthand social actors and to monitor policy responses tackl<strong>in</strong>g identified environmental health <strong>in</strong>equalities.More work is needed, however, to identify and collect <strong>in</strong>formation on relevant environmental risk factors.In particular, data on emerg<strong>in</strong>g environmental health issues – such as exposure to toxic chemicals, nonioniz<strong>in</strong>gradiation, nanoparticles or <strong>in</strong>door air quality – should be collected regularly, and may provideimportant <strong>in</strong>sights <strong>in</strong>to differential exposures and impacts on vulnerable groups.Relevant sociodemographic risk factors also need to be identified and collected, accord<strong>in</strong>g to countrypriorities, <strong>in</strong> order to provide a better picture of those vulnerable groups most at risk. In many countries,for example, data on ethnicity and migrant groups as it relates to environmental risk exposure are rarelycollected. Sett<strong>in</strong>g up agreements on the priority determ<strong>in</strong>ants to be considered is most practical at anational or even subnational level, but this then restricts the use of such data for <strong>in</strong>ternational comparison.Extend<strong>in</strong>g the description of data constra<strong>in</strong>ts, there is an important need to assess and quantify morefully the direct impact of environmental <strong>in</strong>equalities on health <strong>in</strong>equalities; this would also help toposition this topic as a public health challenge. In order to make the case that disparities <strong>in</strong> environmentalexposure cause health <strong>in</strong>equalities, a third data dimension is necessary: health outcomes. An idealdatabase for environmental health <strong>in</strong>equality assessment would therefore need to <strong>in</strong>clude <strong>in</strong>formation onhealth outcomes that can be categorized accord<strong>in</strong>g to the population subgroups suffer<strong>in</strong>g from differentexposure levels. This would not only enable an assessment of the <strong>in</strong>equalities <strong>in</strong> environmental exposure,but would also extend the assessment to a quantification of health <strong>in</strong>equalities caused by environmental<strong>in</strong>equalities. However, it appears that there is no large, <strong>in</strong>ternational database available that would enablesuch an assessment.Furthermore, the type and quality of data collected should take <strong>in</strong>to consideration the context <strong>in</strong> whichsocial determ<strong>in</strong>ants affect environmental conditions where people live, work and play, their differentialexposure, biological susceptibility and f<strong>in</strong>al health outcome. This could be provided by a descriptionof sett<strong>in</strong>gs and the dynamic <strong>in</strong>teraction of social determ<strong>in</strong>ants with several environmental risk factorssimultaneously. For example, social class <strong>in</strong>teracts with other sociodemographic factors such as gender,ethnicity and age to <strong>in</strong>fluence access to adequate hous<strong>in</strong>g, overcrowd<strong>in</strong>g or exposure to chemicalsubstances. Internationally coord<strong>in</strong>ated environmental health <strong>in</strong>equality studies target<strong>in</strong>g specific groupsand not only full populations could therefore be <strong>in</strong>itiated to exam<strong>in</strong>e this.
<strong>Environmental</strong> health <strong>in</strong>equalities <strong>in</strong> <strong>Europe</strong> 121ConclusionMuch work needs to be undertaken to fill the data and evidence gaps that currently restrict the assessmentof environmental health <strong>in</strong>equalities <strong>in</strong> the WHO <strong>Europe</strong>an Region. A culture of free <strong>in</strong>formation,which requires public authorities and the private sector to give access to environmental <strong>in</strong>formation <strong>in</strong>the spirit of the Aarhus Convention (UNECE, 1998), should be encouraged across countries to makehigh-quality data available.A detailed review of data sources and harmonization of criteria for data collection between countrieswould help to improve data availability, comparability and consistency. Furthermore, build<strong>in</strong>g capacityand shar<strong>in</strong>g best practices for those countries with <strong>in</strong>frastructure and resource constra<strong>in</strong>ts could help to<strong>in</strong>crease environmental health <strong>in</strong>equality data collection. This could <strong>in</strong>clude the development of surveysand GIS that simultaneously collect <strong>in</strong>dividual and territorial data on health, environment exposure andsociodemographic factors, particularly at country and <strong>in</strong>ternational levels.An environmental health <strong>in</strong>equality network could be set up to facilitate all these activities: <strong>in</strong> eachcountry one competent agency could be mandated to compile and make available data from all sectors.This agency could also conduct <strong>in</strong>dependent analysis and assess national patterns. This would contributeto the development of more useful data and tools for report<strong>in</strong>g on environmental health <strong>in</strong>equalities <strong>in</strong>the region, and would also <strong>in</strong>fluence countries to act on the results.In summary, priority steps to be taken towards the improvement of statisticalevidence for environmental health <strong>in</strong>equality assessment would comprise:• ensur<strong>in</strong>g the right to access to available data at no or low cost;• establish<strong>in</strong>g surveys focus<strong>in</strong>g on target groups <strong>in</strong> addition to full population surveys;• facilitat<strong>in</strong>g the collection of reliable data on priority issues <strong>in</strong> environmental health;• <strong>in</strong>tegrat<strong>in</strong>g and <strong>in</strong>creas<strong>in</strong>g the use of analysis of social and demographic variables <strong>in</strong>environmental surveys;• develop<strong>in</strong>g common tools, methods, def<strong>in</strong>itions and criteria for national work on environmentalhealth <strong>in</strong>equalities.ReferenceUNECE (1998). Convention on access to <strong>in</strong>formation, public participation <strong>in</strong> decision-mak<strong>in</strong>g and access to justice <strong>in</strong>environmental matters (Aarhus Convention). Geneva, UNECE (http://www.unece.org/fileadm<strong>in</strong>/DAM/env/pp/documents/cep43e.pdf, accessed 26 January 2012).
CHAPTER6Priorities foraction onenvironmentalhealth <strong>in</strong>equalities
124Chapter 6. Priorities for action on environmental health <strong>in</strong>equalitiesChapter 6. Priorities foraction on environmentalhealth <strong>in</strong>equalitiesMatthias Braubach, Stefanie FleischmannIntroductionThe report presents a wide range of <strong>in</strong>equalities <strong>in</strong> environmental exposure. One of the most obviousdifferences displayed is the disparity between <strong>in</strong>dividual countries and between the subregions. Whilethese differences are relevant and can <strong>in</strong>dicate the potential for improvement <strong>in</strong> those countries andsubregions perform<strong>in</strong>g less successfully, they are not good <strong>in</strong>dicators of the distribution of environmentalquality with<strong>in</strong> the respective populations of each country or subregion. Therefore, while acknowledg<strong>in</strong>gthat the absolute level of environmental problems is relevant, the report goes beyond national andsubregional averages, attempt<strong>in</strong>g to assess the <strong>in</strong>equalities <strong>in</strong> the distribution of environmental risksand to describe the exposure with<strong>in</strong> different population subgroups <strong>in</strong> both absolute and relative terms.The figures provided throughout the report identify the environmental health <strong>in</strong>equalities separately for<strong>in</strong>dividual countries and subregions. In this chapter, the f<strong>in</strong>d<strong>in</strong>gs are condensed and considered fromthe subregional and national perspectives, identify<strong>in</strong>g the greatest environmental health <strong>in</strong>equalities andthereby also suggest<strong>in</strong>g potential priorities for action to tackle them.Suggested subregional priorities for actionAlthough the analysis of environmental health <strong>in</strong>equality is strongly affected by the lack of data fromnon-EU countries for many of the hous<strong>in</strong>g and all the environment <strong>in</strong>equality <strong>in</strong>dicators, the data doenable the identification of some subregional priorities for action. However, it must be emphasizedthat – due to the wide diversity of national <strong>in</strong>equalities – only a few subregional trends for selected<strong>in</strong>equalities can be identified.• EU15 or Euro 1 subregion: the largest <strong>in</strong>jury-related <strong>in</strong>equalities occur for transport-related <strong>in</strong>juries.With hous<strong>in</strong>g-related <strong>in</strong>equalities, EU15 or Euro 1 countries perform rather well <strong>in</strong> relation towater and sanitary equipment; conversely, <strong>in</strong> relation to overcrowd<strong>in</strong>g, dampness and thermalcomfort, the relative <strong>in</strong>equalities between population subgroups tend to rise and partially exceedthe <strong>in</strong>equalities seen <strong>in</strong> the NMS12. <strong>Environmental</strong> <strong>in</strong>equality results often <strong>in</strong>dicate that <strong>in</strong> thissubregion <strong>in</strong>equalities for a range of environmental exposures are among the largest of all thesubregions with available data.• NMS12 or Euro 2 subregion: this subregion is significantly disadvantaged regard<strong>in</strong>g manyof the hous<strong>in</strong>g-related <strong>in</strong>equality <strong>in</strong>dicators, and a range of gender <strong>in</strong>equalities is found for theenvironmental <strong>in</strong>dicators. Injury-related <strong>in</strong>equalities are largest for RTIs and fatal poison<strong>in</strong>gs.• Euro 3 subregion: data for Euro 3 countries are only available for the <strong>in</strong>adequate water supply<strong>in</strong>dicator and for the <strong>in</strong>jury-related <strong>in</strong>equality <strong>in</strong>dicators (except work <strong>in</strong>juries). For all of these<strong>in</strong>dicators, greater <strong>in</strong>equalities than for some of the other subregions are identified, with the worst
<strong>Environmental</strong> health <strong>in</strong>equalities <strong>in</strong> <strong>Europe</strong> 125results found for <strong>in</strong>adequate water supply and fatal poison<strong>in</strong>gs. Euro 3 countries should set as amajor priority the development of reliable mechanisms to collect and analyse data on <strong>in</strong>equalities <strong>in</strong>environmental risks so that better assessments can be produced <strong>in</strong> the future.• Euro 4 subregion: data for Euro 4 countries are only available for the <strong>in</strong>adequate water supply<strong>in</strong>dicator and for the <strong>in</strong>jury-related <strong>in</strong>equality <strong>in</strong>dicators (exclud<strong>in</strong>g work <strong>in</strong>juries), as well as forthe <strong>in</strong>dicators on second-hand smoke exposure and lack of access to recreational and green areas(for Croatia, the former Yugoslav Republic of Macedonia and Turkey only). Although <strong>in</strong>equalitiesare identified for all <strong>in</strong>dicators, the ma<strong>in</strong> <strong>in</strong>equality challenges for Euro 4 countries lie with<strong>in</strong>un<strong>in</strong>tentional <strong>in</strong>jury <strong>in</strong>dicators (transport-related <strong>in</strong>juries and poison<strong>in</strong>gs) as well as the secondhandsmoke exposure <strong>in</strong>dicator. As with the Euro 3 subregion, data collection as a basel<strong>in</strong>e for theassessment of environmental health <strong>in</strong>equalities must be considered a priority challenge.As these subregional trends reflect the summarized values for the respective countries, they allow anassessment of the likelihood that countries of a given subregion may face <strong>in</strong>equality problems relatedto a particular environmental exposure. Subregions with very obvious <strong>in</strong>equalities <strong>in</strong>evitably conta<strong>in</strong> amajority of countries where the respective <strong>in</strong>equality is an issue. However, it must be cautioned that thesubregional priorities can by no means automatically <strong>in</strong>dicate priorities for action at a national level.Suggested priorities for national actionTo identify potential priorities for national action among the range of environmental health <strong>in</strong>equalities,two dimensions of <strong>in</strong>equality are of relevance. First, data on the relative <strong>in</strong>equality between populationsubgroups for a given environmental exposure must be considered. However, as this report shows, highrelative <strong>in</strong>equalities can be found <strong>in</strong> countries where the absolute population prevalence of this exposureis low, and also where prevalence is relatively low for the selected disadvantaged population subgroups,compared to other countries. Therefore, possible priorities for national action need to be identified withan acknowledgement of both the absolute magnitude of the respective environmental exposure (<strong>in</strong> totalterms, such as for the whole population) and the dimension of relative differences between populationsubgroups.Follow<strong>in</strong>g this approach, data on the relative <strong>in</strong>equalities and <strong>in</strong>equality ratios were compiled from thereport and graded for each country. A percentile approach was used to categorize the countries <strong>in</strong>to fourquartiles, the first quartile conta<strong>in</strong><strong>in</strong>g the countries with the lowest relative <strong>in</strong>equalities and the fourthquartile conta<strong>in</strong><strong>in</strong>g those with the highest relative <strong>in</strong>equalities. These data were then brought togetherwith data on the absolute prevalence of the respective risk exposure <strong>in</strong> the total population – thesewere also categorized <strong>in</strong>to quartiles, the first quartile conta<strong>in</strong><strong>in</strong>g the countries with the lowest absoluteprevalence rates, and the fourth quartile conta<strong>in</strong><strong>in</strong>g those with the highest absolute prevalence rates.Assess<strong>in</strong>g potential priorities for national action: methodologyTable 13 shows how this approach is applied to an example environmental risk factor <strong>in</strong> relation topoverty. The columns show the <strong>in</strong>equality ratio quartiles, with quartile 1 (countries with lowest exposure<strong>in</strong>equalities <strong>in</strong> relation to poverty) on the left, and quartile 4 (countries with highest exposure <strong>in</strong>equalities<strong>in</strong> relation to poverty) on the right. The rows show the absolute exposure prevalence quartiles for thetotal population, with quartile 1 (countries with lowest absolute prevalence) at the top, and quartile 4(countries with highest absolute prevalence) at the bottom.Table 13 <strong>in</strong>dicates that the comb<strong>in</strong>ation of the absolute and relative dimensions results <strong>in</strong> an overallcountry assessment.• Country A performs well on both <strong>in</strong>equality dimensions, report<strong>in</strong>g – <strong>in</strong> relation to all othercountries – both low absolute exposure prevalence and low <strong>in</strong>equality by poverty.
126Chapter 6. Priorities for action on environmental health <strong>in</strong>equalitiesTable 13. Potential priorities for national action assessment rank<strong>in</strong>g schemeQuartiles forabsolute exposureprevalence(total population)Quartiles for <strong>in</strong>equality ratios <strong>in</strong> exposure prevalence(population below/above poverty threshold)1 (lowest) 2 3 4 (highest)1 (lowest) Country A Country B2 Country G3 Country H Country D4 (highest) Country C Country I Country E Country FColour cod<strong>in</strong>g:Countries with no suggested priority for national actionCountries that would be classified as hav<strong>in</strong>g a suggested priority for national action if they fell<strong>in</strong>to a higher quartile for just one of the two <strong>in</strong>equality dimensionsCountries with suggested priority for national action (def<strong>in</strong>ed as countries be<strong>in</strong>g <strong>in</strong> the fourthquartile for both the absolute and relative <strong>in</strong>equality dimensions, or <strong>in</strong> the third quartile for oneand <strong>in</strong> the fourth quartile for the other <strong>in</strong>equality dimension)• Country B is <strong>in</strong> the quartile of countries show<strong>in</strong>g the highest <strong>in</strong>equality <strong>in</strong> exposure prevalencebetween those above and below the poverty threshold, but the absolute population prevalence ofexposure to this risk factor is very low. Although the respective <strong>in</strong>equality needs to be addressed byfocus<strong>in</strong>g local action on the population groups that experience disproportionate exposure levels, itcan hardly be considered a national priority issue <strong>in</strong> Country B.• The opposite case is represented by Country C, which falls <strong>in</strong>to the highest quartile regard<strong>in</strong>gabsolute exposure but shows – compared to the other countries – rather modest poverty-related<strong>in</strong>equality. The respective environmental health risk must therefore be considered a national healthchallenge <strong>in</strong> Country C and calls for general public health action. However, as the exposure riskaffects those above the poverty threshold almost as much as those below, there is little to ga<strong>in</strong> fromtargeted <strong>in</strong>terventions aim<strong>in</strong>g at the reduction of <strong>in</strong>equalities <strong>in</strong> Country C.• F<strong>in</strong>ally, some countries comb<strong>in</strong>e both disadvantages. Country D is <strong>in</strong> the third quartile for absoluteprevalence and <strong>in</strong> the fourth quartile with one of the highest relative <strong>in</strong>equalities by poverty, whileCountry E shows one of the highest absolute prevalence rates of all countries covered, and also falls<strong>in</strong>to the third quartile of relative <strong>in</strong>equalities. Country F is categorized <strong>in</strong> the highest quartile forboth dimensions. For countries D, E and F, the respective environmental health risk is greater than<strong>in</strong> most other countries, and its distribution with<strong>in</strong> the population is also much more unequal than<strong>in</strong> most other report<strong>in</strong>g countries. In consequence, they can be identified as countries <strong>in</strong> which therespective <strong>in</strong>equality <strong>in</strong> environmental exposure is – compared to the other countries – expressedmost strongly and thus might represent a priority for national action and follow-up.• In addition to the comb<strong>in</strong>ations discussed above, Table 13 also helps to identify countries that arejust one step away from a suggested need for action, represented by countries G, H and I <strong>in</strong> thetable. If Country H were to experience an <strong>in</strong>crease either <strong>in</strong> the absolute prevalence or <strong>in</strong> the relative<strong>in</strong>equality by poverty, it could quickly fall <strong>in</strong>to the fourth quartile on one of the two dimensions,thus be<strong>in</strong>g identified as a country with suggested priority for national action. A similar situationoccurs for countries G and I, as they are <strong>in</strong> the fourth quartile for one dimension already, and wouldbecome a country with a suggested priority for national action if they fell <strong>in</strong>to the third quartile forthe other dimension. Thus, countries G, H and I may be considered “at risk”, s<strong>in</strong>ce a deterioration ofthe situation could quickly result <strong>in</strong> their be<strong>in</strong>g categorized as hav<strong>in</strong>g priorities for national action.Us<strong>in</strong>g this approach, the figures and tables displayed <strong>in</strong> this assessment report were analysed to assesspossible priorities for national action, apply<strong>in</strong>g the colour scheme def<strong>in</strong>ed <strong>in</strong> Table 13 to <strong>in</strong>dicatecountries with suggested priorities for national action (countries D, E and F), countries close to be<strong>in</strong>gclassified as hav<strong>in</strong>g suggested priorities for national action (countries G, H and I) and countries with acomparatively low relevance of <strong>in</strong>equalities.
<strong>Environmental</strong> health <strong>in</strong>equalities <strong>in</strong> <strong>Europe</strong> 127Potential priorities for national action assessment f<strong>in</strong>d<strong>in</strong>gsPossible priorities for <strong>in</strong>equality action are identified for the countries listed <strong>in</strong> Table 14, based onthe merged analysis of relative and absolute <strong>in</strong>equality dimensions. However, it must be emphasizedthat a large number of countries cannot be assessed because no data are available, and therefore theidentification of suggested priorities for national action is restricted to the respective and vary<strong>in</strong>gnumber of report<strong>in</strong>g countries for each given <strong>in</strong>dicator. A more detailed table show<strong>in</strong>g the assessmentby country is available <strong>in</strong> Annex 3.Interpretation of resultsIn countries with suggested priorities for action, national follow-up is needed to:• confirm and validate the f<strong>in</strong>d<strong>in</strong>gs based on national data;• identify the social and environmental context and causal mechanisms of the f<strong>in</strong>d<strong>in</strong>gs;• evaluate and <strong>in</strong>terpret the respective <strong>in</strong>equalities.This is especially important as the assessments presented <strong>in</strong> this report are based on quantitative dataonly, and might thus identify <strong>in</strong>equalities which, <strong>in</strong> a given national context, may not present a problemfor country-specific reasons that cannot be considered by this <strong>in</strong>ternational assessment report. Therefore,<strong>in</strong> these countries, action should first be focused on ga<strong>in</strong><strong>in</strong>g a better understand<strong>in</strong>g of the f<strong>in</strong>d<strong>in</strong>gs andthe causal mechanisms lead<strong>in</strong>g to the observed disparities. Practical action should follow when the<strong>in</strong>equalities are confirmed as result<strong>in</strong>g from unfair societal processes.In most cases, action would aim at the reduction of relative <strong>in</strong>equalities by reduc<strong>in</strong>g the exposureprevalence of the most affected population groups, which would also have an impact on the absoluteexposure prevalence. In addition, countries might also consider general environmental protectionmeasures to reduce the absolute population exposure, but would then need to pay attention to thedistribution effects of the applied measures to ensure that more exposed population groups benefit asmuch from these efforts as the less exposed.It must also be noted that this classification is based on a relative <strong>in</strong>ternational comparison; thus<strong>in</strong>dividual countries may be perform<strong>in</strong>g more poorly than their neighbours, but may not have beenidentified as countries with potential priorities for action because other countries – many of whichmight have a lower developmental level – are report<strong>in</strong>g higher prevalence and <strong>in</strong>equality levels. Thus,if a similar classification approach were undertaken across only the EU15 countries, for example – agroup more comparable <strong>in</strong> terms of economic situation than the group <strong>in</strong>clud<strong>in</strong>g all the Member Statesof the WHO <strong>Europe</strong>an Region – some of these countries would have been categorized as countrieswith potential priorities for action, while they might not be categorized as such when data from a widerrange of countries are taken <strong>in</strong>to consideration. This is especially valid for “at risk” countries which, ifcategorized <strong>in</strong>to a higher quartile for only one of the two dimensions, would immediately be classifiedas countries with suggested priorities for national action (see countries G, H and I <strong>in</strong> Table 13).Furthermore, <strong>in</strong> some of the countries with small populations, the samples provid<strong>in</strong>g data for thisassessment report were relatively small. This could have resulted <strong>in</strong> substantial random variability of theresults, which must be borne <strong>in</strong> m<strong>in</strong>d <strong>in</strong> their <strong>in</strong>terpretation.F<strong>in</strong>ally, Table 14 reveals two important conclusions. First, for each environmental health <strong>in</strong>equality<strong>in</strong>dicator, a large number of countries do not report the required data. For seven Member States,data were only available for 5 or fewer of the 30 assessed <strong>in</strong>equality dimensions covered with<strong>in</strong> the14 environmental health <strong>in</strong>equality <strong>in</strong>dicators, and for five countries no data were identified for anyof the <strong>in</strong>equality dimensions covered. In this context, environment and health policy-makers as wellas experts from social support and protection sectors should bear <strong>in</strong> m<strong>in</strong>d that the lack of data onthe exist<strong>in</strong>g exposure differentials may represent an <strong>in</strong>equality <strong>in</strong> itself, hid<strong>in</strong>g potential disparitiesbetween population groups beh<strong>in</strong>d national averages. Second, <strong>in</strong> a considerable number of countries the<strong>in</strong>equality trends are reversed and the environmental burden is higher <strong>in</strong>, for example, groups of higher
128Chapter 6. Priorities for action on environmental health <strong>in</strong>equalitiessocial position or <strong>in</strong>come. This <strong>in</strong>dicates that general trends say little about the situation <strong>in</strong> <strong>in</strong>dividualcountries, and that for some environmental health risks, action may have to be targeted not only at thesocially disadvantaged.Table 14. Suggested priorities for national <strong>in</strong>equality actionChapter Indicator Relative <strong>in</strong>equality dimension Countries with suggested prioritiesfor actionHous<strong>in</strong>g Lack of flush toilet <strong>in</strong> Above versus below relative poverty Bulgaria, Hungary, Latvia, Poland,dwell<strong>in</strong>glevelSlovakiaS<strong>in</strong>gle-parent households versus all Austria [a], Bulgaria [a], Estonia [a],InjuryLack of bath orshower <strong>in</strong> dwell<strong>in</strong>gOvercrowd<strong>in</strong>gDampness <strong>in</strong> thehomeInability to keephome warm <strong>in</strong>w<strong>in</strong>terInability to keephome cool <strong>in</strong>summerWork-related<strong>in</strong>jurieshouseholdsGreece [a]Lowest versus highest <strong>in</strong>come qu<strong>in</strong>tile Belgium, Bulgaria, Cyprus, Estonia,Hungary, Latvia, Poland, Portugal,RomaniaS<strong>in</strong>gle-parent households versus allhouseholds with childrenGreece [a], Lithuania, Poland,Portugal, Slovenia30S<strong>in</strong>gle-parent households versus all Austria, Czech Republic 30householdsLowest versus highest <strong>in</strong>come qu<strong>in</strong>tile --- 30Lowest versus highest <strong>in</strong>come qu<strong>in</strong>tile Bulgaria, Estonia, Latvia, Lithuania, 30Poland, RomaniaS<strong>in</strong>gle-parent households versus all Cyprus, Poland, Romania 30householdsAbove versus below relative poverty Greece 30levelHousehold type Cyprus, Germany, Poland 30Lowest versus highest <strong>in</strong>come qu<strong>in</strong>tile Cyprus, Greece, Italy, Portugal 27Male versus femaleGermany, Luxembourg, Portugal, 15SwitzerlandAge group France, Portugal, Spa<strong>in</strong> 15Mortality rate of all Age group San Mar<strong>in</strong>o 10transport <strong>in</strong>juriesMortality rate of RTIs Age group Croatia, Cyprus 37Male versus femaleCroatia, Italy, Lithuania, Portugal, 37Serbia, Slovenia, UzbekistanPoison<strong>in</strong>g mortalityrate (all causes)Male versus female43Poison<strong>in</strong>g mortalityrate (exclud<strong>in</strong>galcohol poison<strong>in</strong>g)Alcohol poison<strong>in</strong>gMale versus femaleBelarus, Estonia, F<strong>in</strong>land, Greece,Kazakhstan, Kyrgyzstan, Latvia,Lithuania, Poland, RussianFederation, Slovakia, Ukra<strong>in</strong>eEstonia, Ireland, Kyrgyzstan, Latvia,Lithuania, MaltaMale versus femaleEstonia, F<strong>in</strong>land, Kyrgyzstan, Latvia,mortality rateLithuania, Poland, SlovakiaFall mortality rate Male versus female Belarus, Estonia, F<strong>in</strong>land, Latvia,Lithuania, Romania, RussianFederationEnvironment Compla<strong>in</strong>ts aboutnoise exposure athomeCompla<strong>in</strong>ts aboutlack of access torecreational or greenareasExposure to secondhandsmoke athomeExposure to secondhandsmoke at workAbove versus below relative povertylevelNotes: [a] reversed <strong>in</strong>equality dimension.Details of the country assessment can be found <strong>in</strong> Annex 3.Denmark, Germany, Luxembourg,Netherlands, Romania [a]Female versus male Poland [a], Portugal, Turkey 31Lowest versus highest <strong>in</strong>come quartile Belgium, Bulgaria [a], Greece [a], 31Hungary [a], Lithuania [a]No difficulty pay<strong>in</strong>g bills versusdifficulty pay<strong>in</strong>g bills most of the time--- 31Female versus maleLuxembourg, the former Yugoslav 30Republic of Macedonia, TurkeyLow versus high self-assessed social Greece, Poland 30positionNo difficulty pay<strong>in</strong>g bills versus --- 28difficulty pay<strong>in</strong>g bills most of the timeMale versus female Austria, Lithuania 30Low versus high self-assessed social Bulgaria, Turkey [a] 28positionManager versus manual worker Cyprus, Italy, Malta, Spa<strong>in</strong> 30Countrycoverage30303032284530
CONCLUSION
130 ConclusionConclusionEditorial group“Tackl<strong>in</strong>g the determ<strong>in</strong>ants of health <strong>in</strong>equalities is about tackl<strong>in</strong>g the unequal distribution ofhealth determ<strong>in</strong>ants.”(Graham, 2004)Key messagesThere are four ma<strong>in</strong> conclusions from this assessment report.1. <strong>Environmental</strong> health <strong>in</strong>equalities exist <strong>in</strong> all subregions and <strong>in</strong> all countries,and they are most often suffered by disadvantaged population groups.• <strong>Environmental</strong> health <strong>in</strong>equalities exist across the region and are expressed by both <strong>in</strong>tercountry and<strong>in</strong>tracountry differences. Intracountry differences by social or demographic determ<strong>in</strong>ants can oftenexceed the <strong>in</strong>tercountry differences, <strong>in</strong>dicat<strong>in</strong>g that specific population groups are more stronglyexposed to certa<strong>in</strong> environmental risks with<strong>in</strong> the respective country.• For most of the environmental health <strong>in</strong>equality <strong>in</strong>dicators for which stratification by socioeconomicdeterm<strong>in</strong>ants such as <strong>in</strong>come or poverty is possible, the f<strong>in</strong>d<strong>in</strong>gs show a rather consistent patternwith socioeconomically disadvantaged <strong>in</strong>dividuals or households be<strong>in</strong>g more frequently exposed toenvironmental risks. However, <strong>in</strong> some countries, as well as for some risk factors, obverse <strong>in</strong>equalitiescan be found, <strong>in</strong>dicat<strong>in</strong>g higher exposure levels <strong>in</strong> more affluent population groups.• <strong>Environmental</strong> health <strong>in</strong>equality data can most often be stratified by age and gender, and frequentlyby socioeconomic determ<strong>in</strong>ants (mostly <strong>in</strong>come-related, but also <strong>in</strong> relation to education oremployment, for example) and household type. Each of these determ<strong>in</strong>ants is associated withsignificant <strong>in</strong>equalities.º º Income and poverty-related <strong>in</strong>equalities are identified for noise exposure, exposure to tobaccosmoke at home and at work, and for hous<strong>in</strong>g-related <strong>in</strong>equality <strong>in</strong>dicators, where they areexpressed most strongly. Compared to the other social and demographic determ<strong>in</strong>ants applied,<strong>in</strong>come- and poverty-related determ<strong>in</strong>ants display some of the strongest <strong>in</strong>equalities at regionalas well as subregional and national levels (for EU27, the lack of a toilet <strong>in</strong> the home is, forexample, eight times higher <strong>in</strong> the lowest <strong>in</strong>come qu<strong>in</strong>tile than <strong>in</strong> the highest <strong>in</strong>come qu<strong>in</strong>tile).º º Differences <strong>in</strong> national <strong>in</strong>come levels are also associated with <strong>in</strong>jury-related fatalities, with low/middle <strong>in</strong>come countries report<strong>in</strong>g higher mortality rates.º º The <strong>in</strong>dicators show that gender-related <strong>in</strong>equality is most strongly associated with <strong>in</strong>jury, wheremale fatality rates are often three times (and beyond) female fatality rates. Gender differencesalso appear <strong>in</strong> relation to tobacco smoke exposure, yet play no important role for hous<strong>in</strong>g- andlocation-related risk factors.º º Age-related <strong>in</strong>equalities are present for <strong>in</strong>juries (especially falls) but are less prom<strong>in</strong>ent for theother <strong>in</strong>equality <strong>in</strong>dicators.º º Household type-related <strong>in</strong>equalities are especially identified for s<strong>in</strong>gle-parent households, and<strong>in</strong>crease when comb<strong>in</strong>ed with <strong>in</strong>come-related determ<strong>in</strong>ants. Large variations by householdtype are identified for hous<strong>in</strong>g-related risk factors, putt<strong>in</strong>g vulnerable households at higher risk.º º Data on <strong>in</strong>equalities by education, employment/occupation level, self-reported social positionand difficulty pay<strong>in</strong>g bills are only available for some of the environment-related <strong>in</strong>equalities,but show a more diverse <strong>in</strong>equality pattern. For example, high education level is consistentlyassociated with lower self-reported access to recreational and green areas, while low social
<strong>Environmental</strong> health <strong>in</strong>equalities <strong>in</strong> <strong>Europe</strong> 131position is most often associated with <strong>in</strong>creased exposure to second-hand smoke both at homeand at work. On the other hand, employment/occupation level shows different <strong>in</strong>equalitypatterns <strong>in</strong> exposure to second-hand smoke, depend<strong>in</strong>g on sex and subregion.2. The magnitude of <strong>in</strong>equalities and the distribution of <strong>in</strong>equalities betweenadvantaged and disadvantaged population groups can be very diverse betweencountries and also depends on the socioeconomic or demographic variable usedfor stratification.• There are strong differences <strong>in</strong> the magnitude of environmental health <strong>in</strong>equalities between countries,and these differences are visible between countries both on disparate and on similar developmentallevels. They are formed by both the differences <strong>in</strong> absolute exposure levels and the differences <strong>in</strong>the expression of relative <strong>in</strong>equalities, and show that each country provides a unique context for thedevelopment of environmental health <strong>in</strong>equalities.• For a range of <strong>in</strong>equality dimensions, some countries exhibit oppos<strong>in</strong>g <strong>in</strong>equality directionscompared to the majority of countries. This variation of <strong>in</strong>equality direction was often found for<strong>in</strong>equalities by sex and age, but also occurred – depend<strong>in</strong>g on the environmental risk considered – <strong>in</strong>relation to <strong>in</strong>equalities by <strong>in</strong>come and poverty, by household type, and other determ<strong>in</strong>ants such associal position, difficulty pay<strong>in</strong>g bills, and occupation.3. To allow reliable identification of the most relevant target groups and tounderstand better the national <strong>in</strong>equality patterns and their causal mechanisms,more detailed environmental health <strong>in</strong>equality report<strong>in</strong>g and assessment must becarried out at the national level.• Large <strong>in</strong>tercountry variations and national exceptions from regional or subregional trends exist formany <strong>in</strong>dicators. More detailed environmental health <strong>in</strong>equality assessment should be carried out ata national or subnational scale, as general patterns for the WHO <strong>Europe</strong>an Region or its subregionsare not necessarily reflected <strong>in</strong> all countries.• The general population exposure to environmental risks does not necessarily <strong>in</strong>dicate the level ofrelative <strong>in</strong>equalities. For some <strong>in</strong>dicators, <strong>in</strong>equality expressed <strong>in</strong> relative terms is higher <strong>in</strong> countrieswith rather modest general exposure prevalence. This situation often applies to the more affluentcountries due to the very low prevalence of environmental risks <strong>in</strong> the advantaged populationsubgroups (such as those with the highest SES).• The use of national databases for country-specific environmental health <strong>in</strong>equality assessments willenable more detailed f<strong>in</strong>d<strong>in</strong>gs by provid<strong>in</strong>g additional data on exposure as well as enabl<strong>in</strong>g analysisof a more complete set of social and/or demographic determ<strong>in</strong>ants.4. The evidence base for the assessment of environmental health <strong>in</strong>equalities isweak and needs to be strengthened.• The overall availability of reliable and consistent national and <strong>in</strong>ternational data capable of <strong>in</strong>dicat<strong>in</strong>gdifferences by social or demographic determ<strong>in</strong>ants is <strong>in</strong>sufficient. In particular, a large evidence gapexists between EU Member States, EU candidate countries and <strong>Europe</strong>an Free Trade Associationcountries on the one hand, and the other countries <strong>in</strong> the WHO <strong>Europe</strong>an Region on the other.This evidence gap becomes especially apparent when it is noted that of the 14 environmental health<strong>in</strong>equality <strong>in</strong>dicators covered <strong>in</strong> this report, only 5 can draw data from the whole WHO <strong>Europe</strong>anRegion, while consistent data for all 14 <strong>in</strong>dicators are available from the EU countries.• Many environmental health <strong>in</strong>equality <strong>in</strong>dicators covered <strong>in</strong> this report are restricted to stratificationby only one or two sociodemographic determ<strong>in</strong>ants, and for a number of environmental healthpriorities (such as chemical exposure, air quality, distance to waste sites or location <strong>in</strong> dangerousresidential areas) no <strong>in</strong>equality <strong>in</strong>dicators could be developed because of a lack of data.• Several of the <strong>in</strong>dicators used are based on self-reported data and have been taken from nationalsurveys with relatively small sample sizes.
132ConclusionIn summary, this report compiles and quantifies a diverse range of environmental health <strong>in</strong>equalities,prov<strong>in</strong>g that challenges of environmental justice are apparent <strong>in</strong> all countries, and document<strong>in</strong>g that eachof the environmental <strong>in</strong>equalities covered is associated with a range of health effects, thus contribut<strong>in</strong>gto health <strong>in</strong>equalities. However, the data are rather limited, both <strong>in</strong> terms of quantity (<strong>in</strong>clud<strong>in</strong>g lowcountry coverage, lack of data on risk factors and on sociodemographic determ<strong>in</strong>ants) and sometimesquality (such as small sample sizes and dependency on self-reported or vague exposure conditions).Therefore, this assessment report marks only a first milestone <strong>in</strong> the progress towards a reliable andcomprehensive assessment of environmental health <strong>in</strong>equality <strong>in</strong> the WHO <strong>Europe</strong>an Region.Furthermore, it is not possible without further <strong>in</strong>vestigation to say whether the observed differences <strong>in</strong>environmental exposures between different sociodemographic groups are simply the product of chance,or whether they reflect the <strong>in</strong>equities discussed <strong>in</strong> Chapter 1: <strong>in</strong>equalities result<strong>in</strong>g from a comb<strong>in</strong>ationof <strong>in</strong>fluences, which imply unfairness and <strong>in</strong>justice and are avoidable. A qualitative assessment ofwhether the differences described <strong>in</strong> this report are unavoidable <strong>in</strong>equalities or unfair reflections of<strong>in</strong>equity is a task best conducted at the national level, where the particular social and policy contextis better understood. Therefore, the results of this report should encourage Member States and theirgovernments to follow up <strong>in</strong> more detail on the f<strong>in</strong>d<strong>in</strong>gs and <strong>in</strong>equalities presented. This should permitthe identification of areas where action is most needed and where it is possible to reduce the described<strong>in</strong>equalities.Further perspectives for actionThe f<strong>in</strong>d<strong>in</strong>gs of the environmental health <strong>in</strong>equality assessment report <strong>in</strong>dicate that, although todiffer<strong>in</strong>g extents, environmental health <strong>in</strong>equalities exist <strong>in</strong> all Member States of the WHO <strong>Europe</strong>anRegion. Many countries need to tackle environmental health <strong>in</strong>equalities as a priority issue, althoughnational priorities and disadvantaged groups vary. Six general recommendations for action that can bederived from this report are given below, but need to be tailored to the national situation.Action 1: general improvement of environmental conditionsIrrespective of target groups and target areas, general improvement of hous<strong>in</strong>g conditions, safetyregulations and education, and environmental conditions would reduce the general exposure level of allcitizens, thereby also improv<strong>in</strong>g the situation of those most affected or most vulnerable. Disadvantagedpopulation groups may even benefit to a greater extent from such <strong>in</strong>terventions, and thus basic measuresprovid<strong>in</strong>g adequate environmental conditions to all would be likely to mitigate a range of environmentalhealth <strong>in</strong>equalities.As <strong>in</strong>dicated <strong>in</strong> the Introduction (Fig. 1), the expression of <strong>in</strong>equalities as gradients across populationsubgroups may offer helpful <strong>in</strong>formation <strong>in</strong> decid<strong>in</strong>g whether universal action for the benefit of all isa suitable strategy for tackl<strong>in</strong>g these <strong>in</strong>equalities. This report enables the assessment of environmentalhealth issues affect<strong>in</strong>g most or all population groups, which call for universal actions to create healthyenvironments for all. Such general <strong>in</strong>terventions could be suggested, for example, to address:• water supply <strong>in</strong> all rural areas of Euro 3 countries (see Fig. 3, Chapter 2);• overcrowd<strong>in</strong>g <strong>in</strong> EU15 and NMS12 countries (see Fig. 11, Chapter 2);• dampness <strong>in</strong> dwell<strong>in</strong>gs <strong>in</strong> EU15 and NMS12 countries (see Fig. 14, Chapter 2);• <strong>in</strong>ability to keep the home cool <strong>in</strong> summer <strong>in</strong> EU15 and NMS12 countries (see Fig. 18, Chapter 2);• noise exposure <strong>in</strong> EU15 and NMS12 countries (see Fig. 34, Chapter 4).However, as environmental conditions and <strong>in</strong>equalities may be diverse, more detailed national assessmenton general environmental priorities is recommended before tak<strong>in</strong>g action (see Action 3 below).
<strong>Environmental</strong> health <strong>in</strong>equalities <strong>in</strong> <strong>Europe</strong> 133Action 2: mitigation and reduction of risk exposure <strong>in</strong> the most affectedpopulation groupsTargeted and short-term action is necessary to reduce exposure burdens <strong>in</strong> the most exposed as well asthe most vulnerable population groups. If specific <strong>in</strong>equality assessments to identify the most affectedgroups are not available, area-based approaches could be applied. These could focus on environmentalexposure hotspots or neighbourhoods/residential locations known to be most deprived and/or exposedto hous<strong>in</strong>g and environmental risks, <strong>in</strong>clud<strong>in</strong>g transport-related exposures such as noise, air pollutionand safety threats.As with identification of universal actions, some f<strong>in</strong>d<strong>in</strong>gs <strong>in</strong>dicate that specific target groups are mostat risk. Acknowledg<strong>in</strong>g that especially steep or skewed gradients suggest the application of risk groupspecific<strong>in</strong>terventions, this report proposes that targeted action could be taken, for example, to address:• lack of flush toilet <strong>in</strong> low-<strong>in</strong>come households <strong>in</strong> NMS12 countries (see Fig. 7, Chapter 2);• lack of bath or shower <strong>in</strong> low-<strong>in</strong>come households <strong>in</strong> NMS12 countries (see Fig. 9, Chapter 2);• RTI mortality <strong>in</strong> young male adults across all regions (see Fig. 26, Chapter 3);• lack of access to recreational/green areas <strong>in</strong> population with high education level <strong>in</strong> Euro 4 countries(see Table 10, Chapter 4).Aga<strong>in</strong>, with<strong>in</strong> <strong>in</strong>dividual countries, gradients and <strong>in</strong>equalities may be diverse or reversed, so moredetailed national assessment is recommended before tak<strong>in</strong>g targeted action (see Action 3 below).Action 3: national environmental health <strong>in</strong>equality assessmentsThis report shows that the profile of environmental health <strong>in</strong>equalities is very different across MemberStates. To allow targeted action, further country-specific work is necessary to collect more and better dataon national priorities and the population groups most at risk. This could also be achieved by <strong>in</strong>tegrationof <strong>in</strong>equality-sensitive items <strong>in</strong> national health and/or environment surveys, or the development ofmultiple <strong>in</strong>dices which br<strong>in</strong>g the data together to provide a more holistic measure. The methodologyand environmental health <strong>in</strong>equality <strong>in</strong>dicators developed dur<strong>in</strong>g this project could provide a backbonefor country-specific adaptations of the WHO <strong>Europe</strong>an environmental health <strong>in</strong>equality assessment.Furthermore, an effort towards better data collection standardization would allow more useful andreliable <strong>in</strong>ternational comparisons.Action 4: shar<strong>in</strong>g experiences – case studies on successful <strong>in</strong>terventionsA number of countries have already provided evidence on their experiences of identify<strong>in</strong>g and assess<strong>in</strong>genvironmental health <strong>in</strong>equalities, as well as the actions and <strong>in</strong>terventions used to tackle those <strong>in</strong>equalities(see Annex 2). A review of case studies based on <strong>in</strong>terventions <strong>in</strong> the health sector as well as <strong>in</strong> nonhealthsectors (<strong>in</strong>clud<strong>in</strong>g environment, transport, urban plann<strong>in</strong>g, work, education, social and hous<strong>in</strong>g)could identify successful approaches and elements of good practice for the reduction of environmentalhealth <strong>in</strong>equalities related to, for example:• enforcement of legislation (such as smok<strong>in</strong>g bans, speed limits and build<strong>in</strong>g codes);• <strong>in</strong>tegration of an <strong>in</strong>equality perspective <strong>in</strong>to urban plann<strong>in</strong>g (such as safe design of build<strong>in</strong>gs andactivity-friendly neighbourhoods, and safe and ecological transport modes);• <strong>in</strong>tegration of an <strong>in</strong>equality perspective <strong>in</strong>to policy measures aimed at the reduction and equaldistribution of environmental hazards;• targeted environmental, social and <strong>in</strong>frastructural measures to protect the most vulnerable groups.
134ConclusionAction 5: review and modification of national <strong>in</strong>tersectoral policies <strong>in</strong> relation toenvironmental health <strong>in</strong>equalitiesReflect<strong>in</strong>g the fact that environmental and health <strong>in</strong>equalities are often caused by policies and decisionsmade outside the environment and health sectors, <strong>in</strong>creased communication and exchange betweensectors are necessary to ensure shared <strong>in</strong>formation and to prevent the negative consequences of equitysensitivepolicies and measures. Moderated round-table discussions could br<strong>in</strong>g together high-levelrepresentatives of different sectors to discuss and agree on opportunities to reduce unequal distributiveeffects of policy-mak<strong>in</strong>g. In this context, brief<strong>in</strong>g papers could be developed that <strong>in</strong>form non-healthsectors about the health and equity consequences of their actions.Action 6: monitor<strong>in</strong>g of environmental health <strong>in</strong>equalitiesWhile s<strong>in</strong>gle assessments and status reports on environmental health <strong>in</strong>equalities will be useful to provideevidence and raise awareness, cont<strong>in</strong>uous monitor<strong>in</strong>g of environmental health <strong>in</strong>equalities is necessaryto trace the trends, re-assess priorities and evaluate the success of policy or technical <strong>in</strong>terventions.Aga<strong>in</strong>, national action <strong>in</strong> monitor<strong>in</strong>g the development of environmental health <strong>in</strong>equalities will bemost effective. Nevertheless, WHO will make use of its Environment and <strong>Health</strong> Information System(ENHIS) as an exist<strong>in</strong>g structure to monitor environment and health trends, and extend selectedENHIS <strong>in</strong>dicators to cover stratification by relevant social or demographic determ<strong>in</strong>ants as respectivedata become available.ReferenceGraham H (2004). Tackl<strong>in</strong>g <strong>in</strong>equalities <strong>in</strong> health <strong>in</strong> England: remedy<strong>in</strong>g health disadvantages, narrow<strong>in</strong>g healthgaps or reduc<strong>in</strong>g health gradients? Journal of Social Policy, 33(1):115–31.
ANNEX1NATIONALENVIRONMENTALHEALTH INEQUALITYFACT SHEETS
136Annex 1. National environmental health <strong>in</strong>equality fact sheetsAnnex 1. Nationalenvironmental health<strong>in</strong>equality fact sheetsCONTENTSDwell<strong>in</strong>gs supplied with piped water by proportion of Roma population (Hungary)137Lack of flush toilet by wealth status, urban/rural residence and region (Georgia)138Lack of bath or shower <strong>in</strong> dwell<strong>in</strong>g by urban/rural population and region (Kyrgyzstan)139Overcrowd<strong>in</strong>g by tenure group and household <strong>in</strong>come (Great Brita<strong>in</strong>)140Dampness <strong>in</strong> dwell<strong>in</strong>g by age, <strong>in</strong>come and household type (Norway)141Lack of home heat<strong>in</strong>g by education and household composition (Serbia and Montenegro)142Work-related <strong>in</strong>juries by sex and economic sector (Croatia)143Transport-related mortality by sex and age (Malta)144Mortality from accidental poison<strong>in</strong>g by age and urban/rural residence (Poland)145Mortality from falls by age and sex (Romania)146Exposure to traffic noise with<strong>in</strong> residential areas by household <strong>in</strong>come level (Netherlands)147Lack of access to recreational/green space by region (Spa<strong>in</strong>)148Potential smoke exposure at home by SES (Germany)149Exposure to second-hand smoke at work by sex, age, <strong>in</strong>come, and employment (Italy)150
<strong>Environmental</strong> health <strong>in</strong>equalities <strong>in</strong> <strong>Europe</strong> 137Dwell<strong>in</strong>gs supplied with piped water by proportion of Roma populationHungaryKEY MESSAGE: The percentage of dwell<strong>in</strong>gs supplied with piped water differs betweenmunicipalities <strong>in</strong> Hungary with different proportions of Roma population.Data source: The data are taken from the 2001 census undertaken by the Hungarian CentralStatistical Office and stored at the Regional Informational System of the M<strong>in</strong>istry of NationalDevelopment.Data description: The parameters are def<strong>in</strong>ed as “dwell<strong>in</strong>gs supplied with piped water” and as“proportion of Roma population <strong>in</strong> municipality”.Data coverage: The available data have national coverage, stratified by municipality level (LocalAdm<strong>in</strong>istrative Unit2, formerly known as NUTS5).Social dimension: This <strong>in</strong>equality fact sheet describes “dwell<strong>in</strong>gs supplied with piped water” <strong>in</strong>association with the proportion of Roma population <strong>in</strong> the respective municipality (divided <strong>in</strong>to fivegroups by natural breaks <strong>in</strong> the data).100908070605040302010Dwell<strong>in</strong>gs supplied with piped water by proportion of Roma populationNational average level (90.7%)Percentage of dwell<strong>in</strong>gs supplied withpiped waterContext: The Roma population is the only official ethnic group <strong>in</strong> Hungary. The census def<strong>in</strong>itionof a Roma <strong>in</strong>habitant is based on a personal declaration of be<strong>in</strong>g a Roma (aggregated description ofthe Gipsy, Romany and Bea population).00–3.1 3.2–9.9 10–21.1 21.2–42.7 42.8–93.4Percentage of Roma population <strong>in</strong> municipalityThe Roma population is relatively small, compris<strong>in</strong>g only 2.02% of the total population accord<strong>in</strong>g tothe 2001 census <strong>in</strong> Hungary. However, the proportion is assessed as 7% <strong>in</strong> the EU strategy on Roma<strong>in</strong>clusion.Roma <strong>in</strong>habitants live ma<strong>in</strong>ly <strong>in</strong> the less urbanized, rural areas where the population has a mixedethnic–religious composition. High unemployment rates and a low educational level characterizethis ethnic group.The national average of dwell<strong>in</strong>gs supplied with piped water is 90.7% but can be below 50%depend<strong>in</strong>g on the respective municipality.Analysis and <strong>in</strong>terpretation: A strong, significantly <strong>in</strong>verse association is found between betweenthe percentage of dwell<strong>in</strong>gs supplied with piped water and the proportion of Roma population at themunicipal level <strong>in</strong> Hungary, based on the 2001 census.The band show<strong>in</strong>g the lowest percentage of dwell<strong>in</strong>gs supplied with piped water is characterized bythe highest proportion of Roma population. In this band less than one-half (45.29%) of dwell<strong>in</strong>gs aresupplied with piped water, a figure 50% lower than the national average (90.7%).Policy implications: Earlier surveys have shown that approximately 1.6% of the total population of Hungary lives <strong>in</strong> segregated habitats (colonies) with poor environmental conditionssuch as a lack of sewerage and gas supply, the presence of garbage deposits and waterlogged soil. 94% of these colonies are <strong>in</strong>habited predom<strong>in</strong>antly by Roma. The most deprived areasare those parts of the country with the highest numbers of colonies, and consequently a higher proportion of Roma population.Significant improvements of liv<strong>in</strong>g conditions can be achieved by implement<strong>in</strong>g complex programmes to change environmental factors at local and national levels. These plannedprogrammes will be <strong>in</strong> accordance with the ma<strong>in</strong> aims of the newly adopted EU strategy on Roma <strong>in</strong>clusion to close the gap <strong>in</strong> access to hous<strong>in</strong>g and public utilities such as water andelectricity (EU Framework for National Roma Integration Strategies up to 2020, 5.4.2011 COM(2011) 173 f<strong>in</strong>al).
138Annex 1. National environmental health <strong>in</strong>equality fact sheetsLack of flush toilet by wealth status, urban/rural residence and region GeorgiaKEY MESSAGE: Households with low wealth status levels are much more likely to live<strong>in</strong> dwell<strong>in</strong>gs without flush toilets <strong>in</strong> Georgia. Rural areas are especially affected by this<strong>in</strong>equality.Availability of flush toiletby wealth statusAvailability of toilet type by urban/rural residence and selected regionData source: Data on the availability of flush toilets are taken from the Reproductive <strong>Health</strong> Surveycarried out <strong>in</strong> Georgia <strong>in</strong> 2010 jo<strong>in</strong>tly by the National Center for Disease Control and Public <strong>Health</strong>,the Centers for Disease Control and Prevention, the United Nations Population Fund and theUnited States Agency for International Development.Data description: The household chapter of the survey def<strong>in</strong>es various parameters, <strong>in</strong>clud<strong>in</strong>gclassifications of “flush toilet” and “pit latr<strong>in</strong>e” as pre-coded options, among other alternatives, andrefers to households.HighestHighMiddleLowRacha-SvanetiKakhetiKvemo KartliAdjaraTbilisiRuralWealth qu<strong>in</strong>tileData coverage: The available data have national coverage and are available for 2010. Future surveysare planned.Social dimension: This <strong>in</strong>equality fact sheet stratifies “availability of flush toilet” by wealth qu<strong>in</strong>tile,residence and selected regions. Wealth status is based on household assets, <strong>in</strong>clud<strong>in</strong>g durable goods(such as refrigerator, television, car and computer) and dwell<strong>in</strong>g characteristics (such as type ofsource for dr<strong>in</strong>k<strong>in</strong>g-water, toilet facilities, fuel used for cook<strong>in</strong>g and heat<strong>in</strong>g, ma<strong>in</strong> roof materialand overcrowd<strong>in</strong>g). The sample of households was divided <strong>in</strong>to qu<strong>in</strong>tiles of equal size based on aweighted frequency distribution of households by the result<strong>in</strong>g asset score <strong>in</strong>dicat<strong>in</strong>g wealth status.Context: In general, 48% of all Georgian households have a flush toilet with adequate hygienicstandards, while 50% have a pit latr<strong>in</strong>e that provides a much less appropriate hygienic context.However, the availability of a flush toilet is highly associated with urban sett<strong>in</strong>gs and <strong>in</strong>creased socialstatus and wealth: almost three out of four urban households (74%) are classified <strong>in</strong> the two highestwealth qu<strong>in</strong>tiles, while only 3% of rural households are as wealthy. Instead, more than 70% of ruralhouseholds belong to the low and lowest wealth qu<strong>in</strong>tile.In consequence, the availability of flush toilets versus pit latr<strong>in</strong>es follows a strong social andgeographical pattern, putt<strong>in</strong>g rural and less developed regions with less economic power and moretraditional hous<strong>in</strong>g stock at a disadvantage.Lowest0 20 40 60 80 100Percentage of populationUrban0 20 40 60 80 100Percentage of populationFlush toilet Pit latr<strong>in</strong>e Other toilet facilitiesAnalysis and <strong>in</strong>terpretation: There is a very strong difference <strong>in</strong> the availability of flush toiletsbetween households by wealth qu<strong>in</strong>tile, rang<strong>in</strong>g from 0–100%. Similarly, strong disparities regard<strong>in</strong>gthe availability of flush toilets exist by urban/rural residence and geographic area. Overall, the lowestwealth qu<strong>in</strong>tile households live exclusively <strong>in</strong> dwell<strong>in</strong>gs without a flush toilet.The situation is most severe <strong>in</strong> rural areas (around 10% of households hav<strong>in</strong>g access to flush toilets)and particularly <strong>in</strong> mounta<strong>in</strong>ous areas (such as the Racha and Svaneti regions, at 8%).The unequal distribution <strong>in</strong>dicates the degree to which wealth is distributed <strong>in</strong> geographic areas,demonstrat<strong>in</strong>g a direct effect of poverty and economic disadvantage on basic sanitary equipment.Look<strong>in</strong>g at the regional variation, Tbilisi metropolitan area has the largest proportion of households<strong>in</strong> the highest two wealth qu<strong>in</strong>tiles (91%) and thus the highest level of flush toilet availability (96%),while regions with most households <strong>in</strong> the lowest two wealth qu<strong>in</strong>tiles report that 60% and more oftheir dwell<strong>in</strong>gs are only equipped with pit latr<strong>in</strong>es.Policy implications: There is a very strong difference <strong>in</strong> the availability of flush toilets between households <strong>in</strong> Georgia by wealth qu<strong>in</strong>tile, as well as by urban/rural residence andgeographic area. Lowest wealth qu<strong>in</strong>tile households exclusively live <strong>in</strong> dwell<strong>in</strong>gs without flush toilets, which are a predom<strong>in</strong>antly rural feature, while urban households strongly benefitfrom economic wealth and thus have a very high level of access to flush toilets. Political measures to reduce the unequal distribution of hygienic sanitation equipment therefore need tobe tackled predom<strong>in</strong>antly through economic measures and an improvement of liv<strong>in</strong>g conditions <strong>in</strong> rural areas.
140 Annex 1. National environmental health <strong>in</strong>equality fact sheetsOvercrowd<strong>in</strong>g by tenure group and household <strong>in</strong>come Great Brita<strong>in</strong>KEY MESSAGE: The highest proportions of overcrowd<strong>in</strong>g for all <strong>in</strong>come qu<strong>in</strong>tiles arefound <strong>in</strong> the social rented sector. Overcrowd<strong>in</strong>g affects all tenure groups but <strong>in</strong> each caseis more prevalent <strong>in</strong> the three lowest <strong>in</strong>come qu<strong>in</strong>tiles. Policies that target overcrowd<strong>in</strong>g <strong>in</strong>the social rented sector have the potential to benefit more families.Data sources: Data on overcrowd<strong>in</strong>g are available from various sources <strong>in</strong>clud<strong>in</strong>g the GeneralLifestyle Survey (GLS), formerly known as the General Household Survey (http://www.ons.gov.uk/ons/search/<strong>in</strong>dex.html?pageSize=50&newquery=general+lifestyle+survey).Data description: The GLS parameter chosen to assess overcrowd<strong>in</strong>g is based on the ‘bedroomstandard’: the number of bedrooms required <strong>in</strong> a house is calculated from the number of people liv<strong>in</strong>gthere and their relationships to each other. One bedroom is allocated for each married/cohabit<strong>in</strong>gcouple, for any other person aged over 21, for each same-sex pair aged 10–20 and for each pair ofchildren under 10. Where there are one or more bedrooms too few for the occupants of the house itis said to be overcrowded.Data coverage: The GLS data used are for the years 2004 to 2006. The overall sample was 31233 households (occupied by 74 314 people). Sampl<strong>in</strong>g for the GLS is based on a probabilitystratifiedtwo-stage sample design and is representative of Great Brita<strong>in</strong>. The data are weighted tothe population and to take account of non-response and attrition. Northern Ireland is not <strong>in</strong>cluded<strong>in</strong> the coverage of the survey.Social dimension: This <strong>in</strong>equality fact sheet stratifies overcrowd<strong>in</strong>g by tenure and <strong>in</strong>come qu<strong>in</strong>tile.The tenure categories are owner-occupation, rental from a social landlord (such as a local authority)and rental from a private landlord.Context: Overcrowd<strong>in</strong>g has historically been l<strong>in</strong>ked to <strong>in</strong>creased transmission of <strong>in</strong>fectious disease.In addition, overcrowded conditions are now seen as detrimental to educational atta<strong>in</strong>ment – forexample, by deny<strong>in</strong>g young people the opportunity for un<strong>in</strong>terrupted study. For adults, anxietyand depression can result from crowded conditions and lack of opportunity for privacy. Whileovercrowd<strong>in</strong>g levels have fallen <strong>in</strong> the last few decades, some sources report that recent economictrends have halted and may reverse progress. As overcrowd<strong>in</strong>g is highest <strong>in</strong> low-<strong>in</strong>come householdsit is frequently associated with substandard hous<strong>in</strong>g and other aspects of deprivation.76543210Prevalence of overcrowded homes by tenure and household <strong>in</strong>come qu<strong>in</strong>tileQu<strong>in</strong>tile 1 (lowest <strong>in</strong>come)Qu<strong>in</strong>tile 2Qu<strong>in</strong>tile 3Qu<strong>in</strong>tile 4Qu<strong>in</strong>tile 5 (highest <strong>in</strong>come)Percentage of householdsSocial renters Private renters OwnersAnalysis and <strong>in</strong>terpretation: The chart above was created us<strong>in</strong>g data from 28 901 valid cases with<strong>in</strong>a total survey sample of 31 233 households (92%). Owner-occupation is the dom<strong>in</strong>ant tenure,represent<strong>in</strong>g approximately 71% of the sample, with social rented homes mak<strong>in</strong>g up approximately19%, and the rema<strong>in</strong><strong>in</strong>g 10% private rented. However, this pattern of tenure distribution is notreflected uniformly with<strong>in</strong> each <strong>in</strong>come qu<strong>in</strong>tile. The likelihood of a household be<strong>in</strong>g overcrowded<strong>in</strong>creases with decl<strong>in</strong><strong>in</strong>g household <strong>in</strong>come, as illustrated by the fact that the overall percentage ofovercrowded homes <strong>in</strong> the lowest <strong>in</strong>come qu<strong>in</strong>tile (3.4%) is more than 10 times that <strong>in</strong> the highest<strong>in</strong>come qu<strong>in</strong>tile (0.3%).The chart shows the percentage of overcrowd<strong>in</strong>g <strong>in</strong> each tenure group for each of the five <strong>in</strong>comequ<strong>in</strong>tiles. Overcrowd<strong>in</strong>g is evident <strong>in</strong> each tenure group and <strong>in</strong> each qu<strong>in</strong>tile. The highest percentagesof overcrowd<strong>in</strong>g for all <strong>in</strong>come qu<strong>in</strong>tiles are found <strong>in</strong> the social rented sector whereas the lowestpercentages are found among owner-occupiers. Qu<strong>in</strong>tiles 1–3 exhibit not dissimilar levels ofovercrowd<strong>in</strong>g <strong>in</strong> each tenure category, imply<strong>in</strong>g that overcrowd<strong>in</strong>g is not a problem restricted to thepoorest <strong>in</strong> society.Policy implications: Knowledge of overcrowd<strong>in</strong>g levels and the capacity to l<strong>in</strong>k this <strong>in</strong>formation to household <strong>in</strong>come, tenure and to a variety of other sociodemographic variables canhelp to <strong>in</strong>form and evaluate hous<strong>in</strong>g, economic and social policies to improve both health and equity. There is wide acceptance of the need to <strong>in</strong>crease the availability of good-qualityaffordable hous<strong>in</strong>g for all, not least the poorest, most socially excluded. However, it is clear from the data that policies that tackle overcrowd<strong>in</strong>g <strong>in</strong> the social rented sector (and <strong>in</strong> the threelowest <strong>in</strong>come qu<strong>in</strong>tiles, irrespective of tenure group<strong>in</strong>g) have the potential to impact positively on the lives of the largest number of people.
<strong>Environmental</strong> health <strong>in</strong>equalities <strong>in</strong> <strong>Europe</strong> 141Dampness <strong>in</strong> dwell<strong>in</strong>g by age, <strong>in</strong>come and household type NorwayKEY MESSAGE: Low-<strong>in</strong>come groups and s<strong>in</strong>gle-parent households <strong>in</strong> Norway aremore likely to report dampness <strong>in</strong> their dwell<strong>in</strong>g.Data source: Data are taken from EU-SILC and the national Survey of Liv<strong>in</strong>g Conditions (SLC)by Statistics Norway. Data are available at: http://epp.eurostat.ec.europa.eu and http://www.ssb.no.Data description: EU-SILC: the parameter is def<strong>in</strong>ed as proportion of the population “liv<strong>in</strong>g <strong>in</strong> adwell<strong>in</strong>g with a leak<strong>in</strong>g roof, damp walls, floors or foundations, or rot <strong>in</strong> w<strong>in</strong>dow frames or floor”(variable HH040). Possible values are “yes” or “no”. SLC: the parameter is def<strong>in</strong>ed as “a dwell<strong>in</strong>g thatis damaged by rot and mould <strong>in</strong> some or all the rooms”. Possible values are “yes” or “no”.Data coverage: The data have national coverage. EU-SILC: data are available annually from 2004to 2009. SLC: this annual survey changes topics dur<strong>in</strong>g a three-year cycle. Hous<strong>in</strong>g conditions weretopics <strong>in</strong> 1997, 2001, 2004 and 2007.Reported dampness by household type(SLC, 2007)Household type Reporteddampness (%)S<strong>in</strong>gle (16–24 years) 5S<strong>in</strong>gle (25–44 years) 5S<strong>in</strong>gle (45–66 years) 3S<strong>in</strong>gle (>66 years) 2Two adults (16–44years)Two adults (45–66years)Two adults (>66 years) 1Two adults with childrenaged 0–6 years5332018161412108642Self-reported dampness by relative poverty(EU-SILC, 2009)Households above relative poverty levelHouseholds below relative poverty levelPercentage of householdsSocial dimension: This <strong>in</strong>equality fact sheet stratifies data by age, <strong>in</strong>come (below or above 60% ofthe median equivalent, or relative poverty level) and household type.Two adults with childrenaged 7–19 yearsS<strong>in</strong>gle parents 7402004 2005 2006 2007 2008 2009YearContext: Dampness has been associated with respiratory symptoms <strong>in</strong> several epidemiologicalstudies: a damp environment may cause <strong>in</strong>creased levels of bacteria, moulds and mycotox<strong>in</strong>s. Inparticular, associations between mould growth and respiratory symptoms have been extensivelystudied. In occupational sett<strong>in</strong>gs, where the exposure levels may be very high, an association betweenmould and adverse health effects such as asthma and allergies has been found. In private households,however, exposure levels are much lower and studies have failed to show such associations.Analysis Vitali: this and is <strong>in</strong>terpretation: a table <strong>in</strong>cluded <strong>in</strong> The the number fact sheet of reports of dampness is lowest <strong>in</strong> the highest age group.The household type that most frequently reports dampness consists of one adult with children.There is more reported dampness <strong>in</strong> the group earn<strong>in</strong>g below the relative poverty level (<strong>in</strong> the period2004–2009, around 9–10% of the total population had an <strong>in</strong>come level below the relative povertylevel). S<strong>in</strong>gle-parent families are a major subset with<strong>in</strong> this group, constitut<strong>in</strong>g around 17–23%. Incomparison, the figure for households with two adults with children is around 8%.Compared to the countries <strong>in</strong> the EU, Norway has few dwell<strong>in</strong>gs with reported dampness (EU:15.9%; Norway: 8.2% (2009)). However, Norway is comparable to the other Scand<strong>in</strong>avian countries(Sweden: 6.6%; Denmark: 7.8%). Tenure status differs between the household types “two adults withchildren” and “s<strong>in</strong>gle parent”, <strong>in</strong> that couples with children are more likely to own their flat or house,whereas s<strong>in</strong>gle parents are more likely to live <strong>in</strong> a cooperative sharehold<strong>in</strong>g flat. A higher percentageof s<strong>in</strong>gle parents are also tenants.Report<strong>in</strong>g dampness is subjective and does not give an <strong>in</strong>dication of the extensiveness of the problem;thus it may not represent a serious hous<strong>in</strong>g problem. However, the psychological factor is important,s<strong>in</strong>ce people may be afraid of develop<strong>in</strong>g associated health problems, or may relate already exist<strong>in</strong>ghealth effects to dampness <strong>in</strong> the dwell<strong>in</strong>g. In addition, s<strong>in</strong>gle parents constitute a large proportionof the low-<strong>in</strong>come group and are more often tenants than couples with children. Both low <strong>in</strong>comeand tenure status may <strong>in</strong>fluence the ability to deal with the dampness problem or to move to a drierdwell<strong>in</strong>g.Policy implications: The data show a social <strong>in</strong>equality with regard to dampness <strong>in</strong> dwell<strong>in</strong>gs, <strong>in</strong> that the highest frequency of reported dampness is among low-<strong>in</strong>come households. Inaddition, there are differences between household types, with more s<strong>in</strong>gle parents than s<strong>in</strong>gle people or couples with children report<strong>in</strong>g dampness. In Norway, <strong>in</strong>door ma<strong>in</strong>tenance is thedwell<strong>in</strong>g owner’s responsibility. People liv<strong>in</strong>g <strong>in</strong> freehold or cooperative sharehold<strong>in</strong>g flats thus have equal opportunities to deal with dampness, but people with low <strong>in</strong>come levels maynot be able to afford the necessary ma<strong>in</strong>tenance work. The hous<strong>in</strong>g market <strong>in</strong> Norway is under high pressure; not all population groups are able to buy their own flats and some thereforedepend on the market for rental flats. If there are dampness issues <strong>in</strong> the rented flat and the owners are not will<strong>in</strong>g to undertake ma<strong>in</strong>tenance to improve the <strong>in</strong>door environment, theseresidents have few opportunities to change their hous<strong>in</strong>g conditions. An obligatory survey report on rental flats could be a regulatory step to secure a decent <strong>in</strong>door environment. Inaddition, a system whereby low-<strong>in</strong>come groups could be given a favourable loan to be able to buy their own flat could also be considered. Similarly, loans could be given to home-ownerswho are unable to perform the necessary ma<strong>in</strong>tenance for economic reasons.
142Annex 1. National environmental health <strong>in</strong>equality fact sheetsLack of home heat<strong>in</strong>g by education and household composition Serbia and MontenegroKEY MESSAGE: Poorly educated and overcrowded households <strong>in</strong> Serbia and Montenegroare suffer<strong>in</strong>g from a lack of home heat<strong>in</strong>g, which also affects their health status.Heated dwell<strong>in</strong>g space by household social <strong>in</strong>dicatorsData source: Data are taken from the study “Stuck <strong>in</strong> the Past” carried out by UNDP <strong>in</strong> 2004 <strong>in</strong>Serbia and Montenegro. Further details can be accessed from the ma<strong>in</strong> report at: http://www.undp.org/energy/docs/Stuck_<strong>in</strong>_the_Past.pdf.Data description: The parameter “home heat<strong>in</strong>g” is presented as “square metres of heated space perhousehold member”. Parameters were def<strong>in</strong>ed through two surveys form<strong>in</strong>g part of the UNDP studywhich exam<strong>in</strong>ed household energy usage.Data coverage: The data used are from 2002–2003. The survey was repeated <strong>in</strong> 2008 but the ma<strong>in</strong>results (unpublished) were very similar to those from 2002–2003 and <strong>in</strong>dicate no significant changes<strong>in</strong> relation to the identified <strong>in</strong>equalities.Social dimension: This <strong>in</strong>equality fact sheet stratifies the amount of heated space per householdmember by level of education (primary school and university/college) and household size andcomposition (large households, households with two or more children and three-generationhouseholds), and puts this <strong>in</strong>to context with variations <strong>in</strong> health status (proportion of householdmembers without health problems).No reportedhealth problemsThree-generationhouseholdHousehold with twoor more childrenHousehold with fiveor more membersUniversity/collegePrimary schoolEducationalstatusHouseholdtype<strong>Health</strong>statusMore than 20 m² ofheated space perhousehold memberLess than 10 m² ofheated space perhousehold member0 10 20 30 40 50 60 70 80Percentage of householdsContext: Factors such old hous<strong>in</strong>g, poor <strong>in</strong>sulation, heat<strong>in</strong>g with “dirty fuels” (wood and lignite coal),<strong>in</strong>door pollution and overcrowd<strong>in</strong>g are associated with poverty. Poor households practise risky formsof energy sav<strong>in</strong>g and often heat only about half their liv<strong>in</strong>g space <strong>in</strong> order to save on energy costs.As a result, the relative amount of heated space stratifies by <strong>in</strong>come per household member and isassociated with a range of social or household-related characteristics.The problems <strong>in</strong>dicated by the data are less marked <strong>in</strong> urban areas but represent the normal liv<strong>in</strong>gconditions for households with low <strong>in</strong>come <strong>in</strong> rural areas. This type of household typically has asubstandard house with low efficiency heat<strong>in</strong>g devices and an amount of heated space per householdmember that is below 8 m 2 ; these factors are also closely associated with health-related <strong>in</strong>equalities.Analysis and <strong>in</strong>terpretation: Poor households heat only about half their liv<strong>in</strong>g space <strong>in</strong> order tosave on energy costs. On average more than one <strong>in</strong> four households (26%) heat less than 10 m 2 perperson, considered the necessary m<strong>in</strong>imum. However, this proportion is <strong>in</strong>creased for householdswith low education level and for large households. Lack of heat, overcrowd<strong>in</strong>g and <strong>in</strong>door pollutioncome together as <strong>in</strong>equalities <strong>in</strong> poor households and result <strong>in</strong> severe reductions <strong>in</strong> usable floor space<strong>in</strong> w<strong>in</strong>ter time (because of a restricted heated area), which disrupts the normal household dynamicsand puts pressure on personal and hygiene habits as well as social and cultural norms.The social and household-related differences are associated with health-related <strong>in</strong>equalities,<strong>in</strong>dicat<strong>in</strong>g that <strong>in</strong> households with less heated space, there is an <strong>in</strong>creased probability of householdsreport<strong>in</strong>g health problems. The differences are even more significant for heated space per memberof less than 5 m 2 .Policy implications: There is a very strong correlation between poverty and lack of heat<strong>in</strong>g space. Reduc<strong>in</strong>g the heated area of a household can lead to tensions and dysfunctionalrelationships between household members. Insufficient heated space can have consequences for the health and quality of life of the household. Cop<strong>in</strong>g strategies are particularly limitedfor poor households, whose lack of capital often forces them to adopt dangerous and <strong>in</strong>efficient energy-sav<strong>in</strong>g strategies.Better governance and a more comprehensive policy are needed. Policy-makers need to establish an enforceable concept of property rights and public goods, to build hous<strong>in</strong>g capacity, toimprove <strong>in</strong>stitutional and corporative governance, to develop better polices and reforms, and improve <strong>in</strong>formation flows and structures.
<strong>Environmental</strong> health <strong>in</strong>equalities <strong>in</strong> <strong>Europe</strong> 143Work-related <strong>in</strong>juries by sex and economic sector CroatiaKEY MESSAGE: Male workers <strong>in</strong> Croatia are more likely to suffer an occupational<strong>in</strong>jury than female workers. Most work accidents occur <strong>in</strong> the agriculture, forestry andfish<strong>in</strong>g, manufactur<strong>in</strong>g, water supply and waste management, and construction sectors.Data source: Data are taken from the report on accident at work notifications by the Croatian NationalInstitute of Public <strong>Health</strong>. Data from 2008 onwards, broken down by sex, can be downloaded fromthe Institute’s web site at: http://www.hzjz.hr/publikacije.htm.Data description: Data cover all recognized work accidents which result <strong>in</strong> absence from work.Work accidents are accidents suffered by <strong>in</strong>sured people (<strong>in</strong>surants) <strong>in</strong> connection with their work,or whilst travell<strong>in</strong>g on company bus<strong>in</strong>ess. Accord<strong>in</strong>g to Croatian legislation, commut<strong>in</strong>g accidents(def<strong>in</strong>ed as travel to and from work) are also <strong>in</strong>cluded.Data coverage: Data cover all fatal and non-fatal work accidents, <strong>in</strong>clud<strong>in</strong>g commut<strong>in</strong>g accidents,broken down by economic sector and sex.Social dimension: Although work accidents contribute to no more than 3–6% of total sick leave,their share is significant, given the consequences they cause. While cases of sickness cause an averageloss of 20 to 29 days, a work accident leads to an average of over 60 days of absence from work, and1–5% of <strong>in</strong>juries end <strong>in</strong> permanent disability.Context: On 31 December 2009, Croatia had 1 530 233 active <strong>in</strong>surants, which constitutes 41.3%of the work<strong>in</strong>g-age population (ages 15–65), or 86.7% of the active labour force (the employmentmale to female ratio was 54:46). Croatia annually registers over 20 000 work-related <strong>in</strong>juries. In otherwords, between 15 and 17 employees per 1000 are annually <strong>in</strong>jured at work.In 2009 the overall rate was 12.8 per 1000 employees (9.8/1000 exclud<strong>in</strong>g commut<strong>in</strong>g accidents).The average rate was 16.7/1000 for males, and 7.1/1000 for females. By <strong>in</strong>dustry sector, thehighest specific rates were <strong>in</strong> agriculture, forestry and fish<strong>in</strong>g (24.1/1000), water supply and wastemanagement (20.8/1000), manufactur<strong>in</strong>g (20.2/1000) and construction (19.5/1000). These figures,which place Croatia among the countries with a low rate of registered work <strong>in</strong>juries, have beenrelatively constant over the last decade.35302520151050MalesFemalesTotal<strong>Health</strong> andsocial workWork-related <strong>in</strong>jury rate by sex and economic sector (2009)Injury rate/1000 employeesAccommodationand foodserviceTransportationand storageConstruction Manufactur<strong>in</strong>g Watersupply andwastemanagementAgriculture,forestry andfish<strong>in</strong>gAnalysis and <strong>in</strong>terpretation: In 2009 the majority (76.2%) of work-related <strong>in</strong>juries, follow<strong>in</strong>g thetrend of preced<strong>in</strong>g years, were susta<strong>in</strong>ed at the workplace, while 23.8% happened on the way toor from work. Approximately 70% of cases were work <strong>in</strong>juries to males, 30% to females. Malessuffered 85.3% of accidents at work and only 14.7% while commut<strong>in</strong>g, while for females the ratiowas 58.8%:41.2%. The majority of work accidents susta<strong>in</strong>ed by males occurred <strong>in</strong> agriculture,forestry and fish<strong>in</strong>g (29.0/1000), manufactur<strong>in</strong>g (25.7/1000), water supply and waste management(23.6/1000) and construction (21.8/1000); those susta<strong>in</strong>ed by females occurred <strong>in</strong> accommodationand food service activities (13.4/1000), agriculture, forestry and fish<strong>in</strong>g (11.1/1000), health and socialwork (10.7/1000) and manufactur<strong>in</strong>g (10.2/1000). Men were more exposed to risk: 94.7% of fatalaccidents were suffered by male workers (5.7/100 000), only 5.3% by female workers (0.4/100 000).Of these, 83% of those susta<strong>in</strong>ed by males, but none of those susta<strong>in</strong>ed by females, were work-related.The most dangerous sector, with the highest number of <strong>in</strong>juries or fatalities at the workplace, isagriculture, forestry and fishery, followed by water supply and waste management.Policy implications: On 29 December 2008, the Croatian Government adopted the National Occupational <strong>Health</strong> and Safety Programme 2009–2013. The strategic aim of theProgramme is to ensure safe and healthy work travel and workplace conditions. To achieve this aim, adoption of the EU Occupational <strong>Health</strong> and Safety at Work Strategy 2007–2012is be<strong>in</strong>g considered. Implementation of a national programme will help to solve a multitude of problems <strong>in</strong> the area of occupational health and safety, such as ill-suited education, lack ofharmonization and research projects, unsystematic implementation and, most of all, negligence of occupational <strong>in</strong>jury and disease prevention measures.Fundamental objectives of occupational health care and safety are: reduction of occupational <strong>in</strong>juries and diseases, and improvement of workers’ health status by means of prevention andreduction of economic losses due to occupational <strong>in</strong>juries and diseases (sick leave, premature and disability pensions).
144 Annex 1. National environmental health <strong>in</strong>equality fact sheetsTransport-related mortality by sex and age MaltaKEY MESSAGE: The vast majority of all transport-related deaths <strong>in</strong> Malta occur amongmales, with the highest proportion <strong>in</strong> the 15–29 year age group. Over the last decade, theproportion of female deaths has <strong>in</strong>creased.3025Mortality rate by type of road user (average 2001–2010)Adult malesAdult femalesData source: Data are taken from the National Mortality Register held by the Directorate of <strong>Health</strong>Information and Research. The register holds mortality data for Maltese residents.Data description: The parameter is def<strong>in</strong>ed as “transport accidents” accord<strong>in</strong>g to ICD-10 codesV01–V99.Data coverage: Annual data are available. Data presented are for 2001–2010.Social dimension: This <strong>in</strong>equality fact sheet stratifies “transport-related mortality” by target group(adult male, adult female and child) accord<strong>in</strong>g to the type of transport accident. The number oftransport-related deaths for this period was 168. S<strong>in</strong>ce the numbers are low, data must be <strong>in</strong>terpretedwith caution.20151050Pedestrian PedalcyclistMotorcyclist CaroccupantPick-uptruck/vanoccupantChildren (0–14 years)Mortality rate/100 000Heavy goodsvehicleoccupantBusoccupantContext: Malta is a densely populated country with 1307 people per km 2 . S<strong>in</strong>ce the 1980s thenumber of licensed vehicles per capita has risen steadily, from 0.33 <strong>in</strong> 1986 to 0.63 <strong>in</strong> 2001. At theend of 2009, the number was 297 776 or 0.72 vehicles per capita.Transport accidents accounted for 10.4% of all deaths <strong>in</strong> the 15–44 year age group <strong>in</strong> 2008,represent<strong>in</strong>g 4.4% of all the potential years of life lost <strong>in</strong> those under the age of 65. Over the referenceperiod, driv<strong>in</strong>g licences <strong>in</strong> Malta were held predom<strong>in</strong>antly by males (61% of licence holders). Theproportions of male and female licence holders <strong>in</strong> the younger age groups tend to be closer, imply<strong>in</strong>gthat more younger females are tak<strong>in</strong>g up driv<strong>in</strong>g. Nevertheless, a greater percentage of males thanfemales take up driv<strong>in</strong>g at an early age. In 2009 59% of all driv<strong>in</strong>g licences <strong>in</strong> the 18–24 year agegroup were held by males. At present 93% of motorcycle licence holders are male.Over the last decade, measures have been taken to slow down traffic <strong>in</strong> villages, such as construct<strong>in</strong>gmore speed bumps and <strong>in</strong>stall<strong>in</strong>g speed cameras to deter speed<strong>in</strong>g. A public transport reform policywas launched <strong>in</strong> July 2011, with the aim of mak<strong>in</strong>g public transport more efficient, more effectiveand operat<strong>in</strong>g over a wider network.Analysis and <strong>in</strong>terpretation: Between 2001 and 2010, 81% of all transport-related deaths occurredamong males and 19% among females. The average male to female mortality ratio decreased overthe years, from 5:1 <strong>in</strong> the period 2001–2005 to 3.6:1 <strong>in</strong> the period 2006–2010. The lowest ratio,2.2:1, was <strong>in</strong> 2010. The largest number of male deaths occurred <strong>in</strong> the 15–29 year age group, whilemortality <strong>in</strong> females was highest <strong>in</strong> the 60+ year age group. 34% of all male deaths occurred amongcar occupants (73% drivers and 27% passengers) and 30% among motorcycle users. 50% of all femaledeaths occurred among pedestrians and 34% among car occupants. There were no transport-relateddeaths related to motorcycle use among females over the 10-year period. It is important to note thatmost deaths occurred on Saturdays and Sundays.The discrepancy between proportions of male and female licence holders may expla<strong>in</strong> part of thedifference between the total numbers of transport-related deaths by sex, not tak<strong>in</strong>g <strong>in</strong>to account thepossibility that a greater proportion of female licence holders do not actually drive. In addition, malestend to get their driv<strong>in</strong>g licence earlier, possibly account<strong>in</strong>g for the bigger proportion of deaths <strong>in</strong>males <strong>in</strong> the younger age groups. Males may also be driv<strong>in</strong>g more dangerously than females. A largerproportion of males take up motorcycle driv<strong>in</strong>g, which <strong>in</strong> this reference period accounts for 41 deathsor 30% of all male transport-related deaths. S<strong>in</strong>ce most deaths occur at weekends, some transportfatalities may be related to dr<strong>in</strong>k<strong>in</strong>g and driv<strong>in</strong>g. It is also important to note the number of deathsof unprotected or less protected road users such as pedestrians, pedal cyclists and motorcycle users.Policy implications: S<strong>in</strong>ce the vast majority of transport-related deaths occur among males, any policy that manages to reduce transport-related mortality would automatically reducesex-related <strong>in</strong>equality. Encourag<strong>in</strong>g public transport use and alternative modes of transport among younger age groups, especially males, well before they take up driv<strong>in</strong>g may reduce thenumber of deaths occurr<strong>in</strong>g <strong>in</strong> the 15–29 year age group. In addition, further enforcement and augmentation of penalties for driv<strong>in</strong>g dangerously (such as speed<strong>in</strong>g) may be called for todeter drivers from speed<strong>in</strong>g and from dr<strong>in</strong>k<strong>in</strong>g and driv<strong>in</strong>g. Breathalyser test<strong>in</strong>g of all car drivers <strong>in</strong>volved <strong>in</strong> a traffic accident may warrant further discussion. In parallel, the fact that thepopulation is <strong>in</strong>creas<strong>in</strong>gly age<strong>in</strong>g must be noted. Car-free zones will def<strong>in</strong>itely make areas safer for pedestrians.
<strong>Environmental</strong> health <strong>in</strong>equalities <strong>in</strong> <strong>Europe</strong> 145Mortality from accidental poison<strong>in</strong>g by age and urban/rural residence PolandKEY MESSAGE: Mortality from accidental poison<strong>in</strong>g <strong>in</strong> Poland is almost five timeshigher <strong>in</strong> males than <strong>in</strong> females. There is a high <strong>in</strong>crease <strong>in</strong> death rates <strong>in</strong> the 40–64 yearage group. Alcohol is the ma<strong>in</strong> cause of mortality from accidental poison<strong>in</strong>g.20Accidental poison<strong>in</strong>g mortality rate by sex, age and urban/rural residenceData source: Accidental poison<strong>in</strong>g-related mortality data are taken from death certificates, withcause of death based on ICD-10 codes (adopted <strong>in</strong> 1997). Data are rout<strong>in</strong>ely gathered by thePolish M<strong>in</strong>istry of <strong>Health</strong>. Data by age group and sex on a national level with urban and rural areastratification are available from the Central Statistical Office at: http:// www.stat.gov.pl/gus.Data description: The <strong>in</strong>dicator is def<strong>in</strong>ed as accidental poison<strong>in</strong>g mortality (see ICD-10 def<strong>in</strong>itionof “accidental poison<strong>in</strong>g by and exposure to noxious substances”, codes X40–X49).Data coverage: The data have national coverage at the municipality level, stratified by urban andrural area, age group and sex. Data are available <strong>in</strong> current ICD-10 classification s<strong>in</strong>ce 2002. Thisanalysis is based on data from 2009.181614121086420–19 years20–39 years40–64 years65+ yearsMortality rate/100 000 <strong>in</strong>habitantsSocial dimension: This <strong>in</strong>equality fact sheet stratifies mortality from accidental poison<strong>in</strong>g by ageand sex. There are four almost equal age groups. In addition, data can be broken down by urban orrural residence.0UrbanMalesRuralUrbanFemalesRuralContext: Between 1500 and 2000 deaths as a result of accidental poison<strong>in</strong>g are recorded <strong>in</strong> Polandevery year. Accidental poison<strong>in</strong>g is most often caused by substance abuse, recklessness or substancegiven or taken <strong>in</strong> error or <strong>in</strong>advertently.There are different absorption routes: via the digestive tract (medic<strong>in</strong>es, alcohol, mushrooms,detergents, and so on), the respiratory tract (carbon monoxide, for example), the sk<strong>in</strong> and mucousmembranes (atrop<strong>in</strong>e, pesticides, caustic substances, and so on) as well as the soft tissues (variousdrugs).The most common causes of mortality from accidental poison<strong>in</strong>g <strong>in</strong> Poland are alcohol abuse, leaksfrom gas <strong>in</strong>stallations (ma<strong>in</strong>ly <strong>in</strong> old build<strong>in</strong>gs or dwell<strong>in</strong>gs <strong>in</strong>habited by poor families), a lack of safestorage for medic<strong>in</strong>es and chemicals and children lack<strong>in</strong>g appropriate care.Analysis and <strong>in</strong>terpretation: There is a clear difference between the sexes <strong>in</strong> accidental poison<strong>in</strong>grelatedmortality (about five times more deaths occur among males than females) and there are alsosignificant disparities between age groups. More detailed data show the peak of accidental poison<strong>in</strong>grelatedmortality among the 40–49 year age group <strong>in</strong> both sexes. A decreas<strong>in</strong>g death rate is observedafter the age of 50. In males, higher accidental poison<strong>in</strong>g-related death rates occur <strong>in</strong> rural areas(except among those under 20 years) while for females, higher rates are found <strong>in</strong> urban sett<strong>in</strong>gs(except among those over 64 years).Accidental poison<strong>in</strong>g-related mortality peaked <strong>in</strong> Poland <strong>in</strong> 2005–2006, when a high number ofdeaths was recorded. S<strong>in</strong>ce then, there has been a decl<strong>in</strong><strong>in</strong>g trend (reduction by approximately 5%every year). The ma<strong>in</strong> causes of mortality from accidental poison<strong>in</strong>g <strong>in</strong> Poland are:• 75% – accidental poison<strong>in</strong>g by alcohol (ICD-10 code X45)• 17% – accidental poison<strong>in</strong>g by other gases and vapours (ICD-10 code X47).Policy implications: In Poland, about 2000 deaths are reported every year as a result of accidental poison<strong>in</strong>g. Nearly 92% of such deaths are caused by alcohol consumption and exposureto gases. People aged between 40 and 64 years have a higher risk of mortality from accidental poison<strong>in</strong>g than any other age group.Key policy-mak<strong>in</strong>g activities should be focused on national campaigns aga<strong>in</strong>st alcoholism and drug abuse on the one hand, and modernization of old gas <strong>in</strong>stallations and prevention ofgas leaks (especially <strong>in</strong> old build<strong>in</strong>gs) on the other.
146 Annex 1. National environmental health <strong>in</strong>equality fact sheetsMortality from falls by age and sex RomaniaKEY MESSAGE: The risk of death from falls is almost five times higher for males thanfemales <strong>in</strong> Romania. The groups at greatest risk are children aged 0–4, males over 45 yearsand females over 75 years.Data source: Data on deaths by falls are recorded by the Romanian National Institute of Statistics,based on the data reported by all health units and providers. Data are available at the national levelat the National Centre for Public <strong>Health</strong> Information and Statistics, with<strong>in</strong> the National Institute ofPublic <strong>Health</strong>. Data stratified by sex and age groups are available on request.Data description: Deaths caused by falls (ICD-10 codes W10–W19) are reported by all medicalproviders via death certificates to the district offices of the National Institute of Statistics. Data arestratified by sex and 5-year age groups <strong>in</strong> categories from 0–4 to 85+.Data coverage: The available data have national coverage from 1970. The ICD-10 classification hasbeen used s<strong>in</strong>ce 1994. A validation process for the ma<strong>in</strong> cause of death is made at the district publichealth directorates.Social dimension: This <strong>in</strong>equality fact sheet stratifies mortality due to falls by sex and age groups,aim<strong>in</strong>g to assess the magnitude of <strong>in</strong>equality and to identify potential target groups for preventive<strong>in</strong>terventions.6050403020100Mortality from falls by age and sex (2005 and 2009)Males, 2005 Females, 2005 Males, 2009 Females, 2009Mortality rate/100 0000–4 5–14 15–24 25–34 35–44 45–54 55–64 65–74 75–84 85+ TotalAge groupContext: A country assessment carried out by the WHO Regional Office for <strong>Europe</strong> on the statusof the implementation of Regional Committee resolution EUR/RC55/R9 and <strong>Europe</strong>an Councilrecommendation 2007/C 164/01 on the prevention of <strong>in</strong>jury and promotion of safety revealed thatdespite the absence of a national policy for <strong>in</strong>jury prevention, several preventive measures are <strong>in</strong> placeto reduce numbers of falls and their health consequences. These <strong>in</strong>clude regulatory measures forchild-specific environments, improvement of emergency responses for all types of emergency, andhealth promotion <strong>in</strong>itiatives on life skills, <strong>in</strong>clud<strong>in</strong>g fall prevention.Nevertheless, the results show that the national standardized mortality rate from falls is higher than<strong>in</strong> the EU and the WHO <strong>Europe</strong>an Region, account<strong>in</strong>g for about 1400 preventable deaths per year.The recent mortality trend even shows an <strong>in</strong>crease from 6.4/100 000 (2005) to 6.8/100 000 (2009),<strong>in</strong>dicat<strong>in</strong>g that future action is necessary.Analysis and <strong>in</strong>terpretation: The overall crude death rate from falls <strong>in</strong>creased from 6.4/100 000<strong>in</strong> 2005 to 6.8/100 000 <strong>in</strong> 2009, signall<strong>in</strong>g a high and <strong>in</strong>creas<strong>in</strong>g number (about 1400 people) ofpreventable deaths. The risk of death from falls is about five times higher for males than for females.The <strong>in</strong>cidence of fatal falls <strong>in</strong> females slightly decl<strong>in</strong>ed from 2.7/100 000 <strong>in</strong> 2005 to 2.5/100 000 <strong>in</strong>2009.The age distribution of mortality for 2005 and 2009 reveals <strong>in</strong>creas<strong>in</strong>g values for males (total male<strong>in</strong>cidence rose from 10.3/100 000 to 11.3/100 000), especially <strong>in</strong> the case of males aged 55 years andabove. However, there is a constant presence of three peaks of risk that could be tackled:• the 0–4 year age group (both sexes)• males over 45 years, <strong>in</strong>creas<strong>in</strong>g with age• females over 75 years, <strong>in</strong>creas<strong>in</strong>g with age.Policy implications: Accord<strong>in</strong>g to the mortality data, the most vulnerable groups are children (especially boys) aged 0–4 years and <strong>in</strong>dividuals above 55 years, for whom the level of riskstrongly <strong>in</strong>creases with ris<strong>in</strong>g age, especially for males. Specific public health <strong>in</strong>terventions for these target groups should be designed and implemented. Education and <strong>in</strong>formation onrisks, identification of people at risk, secondary prevention to improve adaptability to new physical conditions, and screen<strong>in</strong>g for high-risk conditions and visibility or hear<strong>in</strong>g impairmentshould be undertaken, with prompt secondary <strong>in</strong>tervention accessibility and rehabilitation procedures to avoid complications. To reduce the magnitude of risk of death by falls forvulnerable groups, systematic education of those responsible for children and the elderly should also be implemented. Specific surveys and better monitor<strong>in</strong>g of the circumstances oflethal accidents, together with a systematic validation procedure for cod<strong>in</strong>g the cause of death on the death certificate, could contribute to the provision of fuller evidence for <strong>in</strong>tervention.
<strong>Environmental</strong> health <strong>in</strong>equalities <strong>in</strong> <strong>Europe</strong> 147Exposure to traffic noise with<strong>in</strong> residential areas by household <strong>in</strong>come level NetherlandsKEY MESSAGE: <strong>Inequalities</strong> <strong>in</strong> traffic noise exposure by <strong>in</strong>come level are small butpresent <strong>in</strong> the Netherlands.Data source: Data on road, rail and air traffic noise exposure were modelled with the Dutch GISnoise calculation model EMPARA version 2004-1. In addition, the comb<strong>in</strong>ed noise exposure fromthese sources was calculated. Input data are available from different Dutch data sources and areirregularly updated. Output data on noise were comb<strong>in</strong>ed with data on hous<strong>in</strong>g locations from theAddress Coord<strong>in</strong>ates of the Netherlands database.Data description: The parameter is def<strong>in</strong>ed as modelled traffic noise level at home.Data coverage: Data are available for the whole country. Input data were from 2000–2002. For roadand rail traffic the resolution was 25 × 25 m; for air traffic noise the resolution was 250 × 250 m. Thenoise levels with<strong>in</strong> these grids were assigned to all dwell<strong>in</strong>gs with<strong>in</strong> that grid.Social dimension: For this <strong>in</strong>equality fact sheet noise data were comb<strong>in</strong>ed with <strong>in</strong>come data at the6-digit postcode level (about the size of a street). Income data were derived from the “Geomarktprofiel”telephone survey of Dutch residents <strong>in</strong> 2001, <strong>in</strong> which people were asked to characterize the dom<strong>in</strong>ant<strong>in</strong>come level <strong>in</strong> their postcode area.76543210Traffic noise exposure above 65dB(A) <strong>in</strong> residential areas by household <strong>in</strong>comeHigh <strong>in</strong>comeIncome above averageAverage <strong>in</strong>comeLow <strong>in</strong>comeM<strong>in</strong>imum <strong>in</strong>comePercentage of householdsRoad traffic Rail traffic Air traffic Comb<strong>in</strong>ed trafficContext: In the densely populated country of the Netherlands a large proportion of the population(80%) is exposed to traffic noise of more than 50 dB(A). Several noise measures are taken to reducenoise exposure, such as noise barriers, quieter road surfaces, and <strong>in</strong>sulation of homes. However,<strong>in</strong>creas<strong>in</strong>g traffic noise rema<strong>in</strong>s a problem, with adverse effects on health and well-be<strong>in</strong>g.Dutch environmental policy focuses on the general population and not on specific subpopulations.Spatial plans are tested for noise standards. These standards are set by the state to ensure a safe andhealthy liv<strong>in</strong>g environment for all. The noise distribution among the population <strong>in</strong> the Netherlandsis the result of a complex <strong>in</strong>teraction of public policy decisions, market forces, historical context andpublic perceptions. To understand exposure differences among socioeconomic groups and take themost effective policy measures it is important to unravel the complex underly<strong>in</strong>g mechanisms.Analysis and <strong>in</strong>terpretation: The data show the percentage of homes per <strong>in</strong>come category with amodelled noise level higher than 65 dB(A) for different sources of traffic noise (road, rail and airtraffic, and a comb<strong>in</strong>ation of these). The results are mixed. In general, the differences between <strong>in</strong>comecategories are small. Lower-<strong>in</strong>come categories are exposed to slightly higher noise levels than higher<strong>in</strong>comeones, depend<strong>in</strong>g on the source of noise. Differences are most pronounced for rail traffic; thismay be because workers’ dwell<strong>in</strong>gs tended historically to be built close to railways. Based on regionalanalyses cover<strong>in</strong>g areas with a large airport (not shown here), higher-<strong>in</strong>come categories are exposedto higher air traffic noise levels <strong>in</strong> the proximity of large airports. This maybe expla<strong>in</strong>ed by the factthat flight paths are planned over less densely populated areas, where more high-<strong>in</strong>come householdslive. No clear trend was found for road traffic. No robust explanation is available, but it may beassumed that some higher-<strong>in</strong>come households live close to busy roads for accessibility reasons.It must be noted that modelled noise exposure beyond 65 dB(A) does not correspond entirely to thepercentage of the population compla<strong>in</strong><strong>in</strong>g about noise.Policy implications: Dutch environmental policy <strong>in</strong> relation to spatial plann<strong>in</strong>g often focuses on the general population rather than specific target groups. The results above show thatsuch an approach can provide fairly equal outcomes to the population, as the differences between <strong>in</strong>come categories are small. However, <strong>in</strong>equalities may grow due to the current economicsituation and political climate. Lower-<strong>in</strong>come categories often have fewer choices about where to live and are more frequently <strong>in</strong> weaker health. Includ<strong>in</strong>g social dimensions <strong>in</strong> spatialplann<strong>in</strong>g would give <strong>in</strong>sight <strong>in</strong>to the effects for different <strong>in</strong>come categories and, if necessary, enable planners to take precautions. Furthermore, policy-makers should take <strong>in</strong>to accountany accumulation of issues <strong>in</strong> the neighbourhood and at work and focus not only on problems, but also on the amenities of the local environment, such as quiet and green space. Theseenvironmental amenities may improve health; for example, through stress reduction.
148 Annex 1. National environmental health <strong>in</strong>equality fact sheetsLack of access to recreational/green space by region Spa<strong>in</strong>KEY MESSAGE: Access to green space varies significantly among different regions <strong>in</strong>Spa<strong>in</strong>. Regional variation strongly exceeds variation by <strong>in</strong>come or social class. A north–south distribution is apparent.Data source: Data on the lack of access to green space are taken from the National <strong>Health</strong> Surveycarried out every few years by the National Institute of Statistics <strong>in</strong> collaboration with the M<strong>in</strong>istry of<strong>Health</strong>, Social Policy and Equality. The reported data for this fact sheet are taken from the last survey<strong>in</strong> 2006 which <strong>in</strong>cluded 31 300 homes, distributed as 2236 census sections. Methodology and datacan be downloaded from: http://www.msps.es/estadEstudios/estadisticas/encuestaNacional/home.htm.10080604020Lack of access to green space <strong>in</strong> regions of Spa<strong>in</strong>Not a problemSlight problemSignificant problemData description: The parameter is def<strong>in</strong>ed as “homes with lack of access to green space” and refersto the response given by members of a household to the survey question “does your home have one ofthe follow<strong>in</strong>g problems?” where the problem listed was “lack of access to green space”. The percentageof respondents answer<strong>in</strong>g “significant problem”, “slight problem” or “not a problem” was recorded.Data coverage: The survey has national coverage but can be broken down <strong>in</strong>to various territorialunits such as the autonomous communities, which represent Spanish regions.0AndalucíaCeuta y MelillaCanariasCommunitatValencianaMurciaBalearesExtremaduraCastilla-La ManchaCataluñaMadridPaísVascoGaliciaAragónRiojaNavarraCastillay LeónAsturiasCantabriaPercentage of <strong>in</strong>habitantsSouthern regions Northern regionsSocial dimension: This <strong>in</strong>equality fact sheet stratifies the percentage of people report<strong>in</strong>g a lack ofaccess to green space per region <strong>in</strong> Spa<strong>in</strong>. No evidence for a social dimension of this <strong>in</strong>equality (suchas by <strong>in</strong>come) was found.Context: Access to green space has been found to benefit many aspects of health and well-be<strong>in</strong>g,enabl<strong>in</strong>g residents – particularly those <strong>in</strong> urban areas – to cope better with the stresses of liv<strong>in</strong>g <strong>in</strong>large conurbations. Generally, the proportion of green space per person dim<strong>in</strong>ishes as populationdensity <strong>in</strong>creases; thus compact cities show very low per capita green space allocation. In Spa<strong>in</strong> thereis significant variability <strong>in</strong> the degree of urbanization among the regions.A number of social variables such as <strong>in</strong>come and education level were analysed but did not expla<strong>in</strong> thevariability <strong>in</strong> access to green space among autonomous communities. Analysed at the geographicallevel, it was not possible to expla<strong>in</strong> <strong>in</strong>equalities <strong>in</strong> access to green space <strong>in</strong> terms of a social dimension.However, there seems to be a clear north–south spatial pattern, with the lowest provision of greenspace <strong>in</strong> the regions <strong>in</strong> the south.Analysis and <strong>in</strong>terpretation: The problem of lack of access to green space among households <strong>in</strong>different regions presents significant variability. The graph presents southern and northern regions(represent<strong>in</strong>g the autonomous communities) <strong>in</strong> decreas<strong>in</strong>g order accord<strong>in</strong>g to the comb<strong>in</strong>edpercentage of respondents report<strong>in</strong>g “significant problem” or “slight problem” of access to green spaceand thus <strong>in</strong> order of decreas<strong>in</strong>g problem of lack of access to green space. It appears, with a fewexceptions, that the percentage of respondents consider<strong>in</strong>g access to green space to be a problem ishigher <strong>in</strong> (mostly) southern regions (such as Andalucía, Canarias, Comunitat Valenciana, Murcia,Baleares, Extremadura) than <strong>in</strong> northern regions (such as Cantabria, Asturias, Castilla y Leon,Navarra, La Rioja, País Vasco). This could possibly be caused by climatic differences among regions,where most southern regions have warmer and drier climates, hence hav<strong>in</strong>g fewer green areas.However, this would not necessarily imply a lack of access to natural space.The differences among the regions could not be expla<strong>in</strong>ed <strong>in</strong> terms of a social dimension. Severalsocial variables such as <strong>in</strong>come level, education level and social class as def<strong>in</strong>ed by occupation wereanalysed, but did not expla<strong>in</strong> regional differences. It appears that the regional north–south disparityis greater than the disparity due to <strong>in</strong>come, education or social class of the respondents. Higherdisaggregation of data by prov<strong>in</strong>ces would enable a more detailed analysis.Policy implications: There is a significant difference <strong>in</strong> access to green space across different regions <strong>in</strong> Spa<strong>in</strong>. The factors determ<strong>in</strong><strong>in</strong>g this variability cannot be elucidated through thisanalysis, as the regions <strong>in</strong>clude both urban and rural areas, as well as populations of vary<strong>in</strong>g <strong>in</strong>come and social levels. A higher geographical segregation and <strong>in</strong>dependent study of urbanand rural areas would enable a more rigorous analysis of the relation between access to green space and level of <strong>in</strong>come and social class.At this geographical level, there were no significant differences <strong>in</strong> access to green space accord<strong>in</strong>g to level of <strong>in</strong>come or social class as determ<strong>in</strong>ed by occupation. The apparent north–southdistribution <strong>in</strong> access to green space may thus be <strong>in</strong>fluenced by per capita <strong>in</strong>come, degree of urbanization or simply climate. However, it <strong>in</strong>dicates that southern regions may need to bemore active <strong>in</strong> provid<strong>in</strong>g high-quality green space to the population.
<strong>Environmental</strong> health <strong>in</strong>equalities <strong>in</strong> <strong>Europe</strong> 149Potential smoke exposure at home by SES GermanyKEY MESSAGE: In Germany, children liv<strong>in</strong>g <strong>in</strong> households with low SES are moreaffected by tobacco smoke exposure at home than those with higher SES.Smokers <strong>in</strong> the household of non-smok<strong>in</strong>g children by SESData source: Data on the presence of smokers <strong>in</strong> the households of 1790 children aged 3 to 14years are taken from the Federal Environment Agency’s German <strong>Environmental</strong> Survey 2003/6for Children (GerES IV); data on SES from the concurrent German <strong>Health</strong> Survey for Childrenand Adolescents (KiGGS) study by the Robert Koch Institute. Public use files with data fromGerES IV and KiGGS are available on request via http://www.uba.de/survey and http://www.kiggs.de,respectively (<strong>in</strong> German).Data description: In question 72 of the questionnaire, every household member was listed with thepossible values “smoker” or “non-smoker”. The total number of smokers liv<strong>in</strong>g <strong>in</strong> the household wassummarized.Data coverage: The available data of GerES IV are representative of children <strong>in</strong> Germany. Futuresurveys are envisaged.Social dimension: This <strong>in</strong>equality fact sheet stratifies the presence of smokers <strong>in</strong> the householdby SES. The SES <strong>in</strong>dex comb<strong>in</strong>es <strong>in</strong>formation on the parents’ educational and professional statusand on the household’s net <strong>in</strong>come. The low SES group comprises approximately the lowest 25%,the middle SES group approximately the middle 50% and the high SES group approximately thehighest 25% of the children.Context: It is well known that children’s health is affected by parental smok<strong>in</strong>g. Children of parentswho smoke show, for example, an <strong>in</strong>creased frequency of sudden <strong>in</strong>fant death syndrome, acute andchronic <strong>in</strong>flammation of the middle ear, asthma and <strong>in</strong>fections of the lower respiratory tracts. Almostone-half of children aged up to 17 years are liv<strong>in</strong>g <strong>in</strong> a household with at least one smok<strong>in</strong>g parent(data from KiGGS study).With the aim of improv<strong>in</strong>g the health outcomes for these children, it is important to know whichpart of the population is most affected by (second-hand) smoke. With this knowledge, targeted<strong>in</strong>formation and prevention measures can be taken <strong>in</strong> order to improve further the protection ofnon-smokers – <strong>in</strong>clud<strong>in</strong>g children.Encourag<strong>in</strong>g their parents to ban smok<strong>in</strong>g at home is likely to improve health outcomes for thesechildren.High SESMiddle SESLow SES38.752.466.039.0Percentage of households29.724.0No smoker One smoker More than one smokerAnalysis and <strong>in</strong>terpretation: Children <strong>in</strong> low SES families are more prone to be exposed toenvironmental tobacco smoke. In the GerES IV data a strong social gradient of number of smokers <strong>in</strong>the children’s households could be observed: accord<strong>in</strong>g to the parent <strong>in</strong>terviews, 34% of the high SESnon-smok<strong>in</strong>g children live <strong>in</strong> households with one or more smokers, but this percentage <strong>in</strong>creases to61% for the low SES non-smok<strong>in</strong>g children.The f<strong>in</strong>d<strong>in</strong>gs from the questionnaire data were confirmed by nicot<strong>in</strong>e and cot<strong>in</strong><strong>in</strong>e (a nicot<strong>in</strong>emetabolite) analysed <strong>in</strong> ur<strong>in</strong>e, as well as benzene measured <strong>in</strong> <strong>in</strong>door air. The analyses revealed adist<strong>in</strong>ct social gradient for both cot<strong>in</strong><strong>in</strong>e <strong>in</strong> children’s ur<strong>in</strong>e and benzene <strong>in</strong> the air of children’s rooms:the lower the SES, the higher the proportion of children exposed to tobacco smoke (cot<strong>in</strong><strong>in</strong>e levelsabove the limit of quantification: 70% versus 32%; mean of benzene: 2.56 µg/m³ versus 1.70 µg/m³).This reflects the fact that <strong>in</strong> low SES families smok<strong>in</strong>g is more prevalent than <strong>in</strong> families with highSES.18.022.49.6Policy implications: The best prevention of second-hand smoke is a low rate of tobacco consumption <strong>in</strong> the whole society. Together with a high tax on tobacco, an advertis<strong>in</strong>g ban ontobacco products and measures to prevent people from start<strong>in</strong>g to smoke, as well as measures to help smokers to stop their tobacco consumption, smok<strong>in</strong>g bans are of high importance.Tobacco control measures for the work<strong>in</strong>g environment are <strong>in</strong> place, and s<strong>in</strong>ce September 2007 smok<strong>in</strong>g has been banned <strong>in</strong> all build<strong>in</strong>gs of the federal government, on public transportand at passenger stations.In addition, smok<strong>in</strong>g <strong>in</strong> restaurants and other public places has been banned (unfortunately with numerous exceptions) <strong>in</strong> all federal states of Germany s<strong>in</strong>ce the beg<strong>in</strong>n<strong>in</strong>g of 2008.Harmonization of the different laws <strong>in</strong> the federal states (without exceptions), as well as targeted <strong>in</strong>formation and prevention measures for highly affected sections of the population –such as people/families with a low SES – would help to further reduce tobacco consumption <strong>in</strong> society.
150 Annex 1. National environmental health <strong>in</strong>equality fact sheetsExposure to second-hand smoke at work by sex, age, <strong>in</strong>come, and employment ItalyKEY MESSAGE: The 2005 law bann<strong>in</strong>g smok<strong>in</strong>g <strong>in</strong> <strong>in</strong>door public places <strong>in</strong> Italy alsoaffected exposure to second-hand tobacco smoke. Nevertheless, differences <strong>in</strong> secondhandsmoke exposure rema<strong>in</strong>, and are especially strong <strong>in</strong> workplaces.Data source: Data are taken from the Eurobarometer survey on tobacco (2009), and the nationalannual survey on smok<strong>in</strong>g conducted by DOXA, the Italian branch of the Gallup InternationalAssociation, and the Italian National Institute of <strong>Health</strong>.Data description: Data on exposure to tobacco smoke at the workplace are given as a percentage ofresponses to the question “how often are you exposed to tobacco smoke <strong>in</strong>doors at your workplace?”Survey respondents are a representative sample of the total population over 14 years.Data coverage: Data relate to Eurobarometer data of 2009. Reported data by DOXA are analysedfor the period 2005–2009. The questionnaires have national coverage.Social dimension: This <strong>in</strong>equality fact sheet analyses exposure to tobacco smoke at the workplace bysex, age and SES. The data show SES stratification by self-position<strong>in</strong>g on a social scale, as well as byoccupational position, which reflects a similar situation.50403020100Exposure to second-hand tobacco smoke at work (2009)MaleFemale15–2425–3940–5455+LowMediumHighSelfemployedManagersOtherwhitecollarManualworkersPercentage of work<strong>in</strong>g populationSex Age SES (self-position<strong>in</strong>g) OccupationalpositionContext: A new law impos<strong>in</strong>g a ban on smok<strong>in</strong>g <strong>in</strong> public and at workplaces, allow<strong>in</strong>g it only <strong>in</strong>specially designated spaces, came <strong>in</strong>to force <strong>in</strong> Italy on 10 January 2005. The law has had substantialimmediate effects, lead<strong>in</strong>g to approximately 90% of public places becom<strong>in</strong>g smoke-free. Forworkplaces other than hospitality venues, this percentage decreases from 90 to 70 (accord<strong>in</strong>g to theDOXA surveys of 2005, 2006, 2007, 2008 and 2009).While the percentage of smoke-free places has rema<strong>in</strong>ed constant over time for workplaces (andslightly decreased to 85% for public places), the Italian population’s favourable attitude towards thesmok<strong>in</strong>g ban law has <strong>in</strong>creased over time (Eurobarometer data).Although the impact of a law apply<strong>in</strong>g universally to every work environment was expected to be theequalization of exposure for all social categories of workers, reported data <strong>in</strong>dicate that differencesrema<strong>in</strong>.Analysis and <strong>in</strong>terpretation: Eurobarometer data show large <strong>in</strong>equalities <strong>in</strong> exposure to secondhandsmoke at work accord<strong>in</strong>g to both SES and occupational scale, <strong>in</strong> favour of more advantagedpositions. The data refer to respondents cit<strong>in</strong>g any period of exposure (less than 1 hour, 1–5 hours,more than 5 hours).The pollution levels from second-hand smoke <strong>in</strong> public and at workplaces have been reduced by thelaw, as demonstrated by local studies on particulate matter with an aerodynamic diameter smallerthan 2.5 µm (PM 2.5) and ultraf<strong>in</strong>e particles and nicot<strong>in</strong>e concentrations <strong>in</strong> <strong>in</strong>door air of public places,and on the presence of ur<strong>in</strong>ary cot<strong>in</strong><strong>in</strong>e <strong>in</strong> non-smok<strong>in</strong>g employees of these workplaces, but theirsocial distribution is unknown. Local studies on hospital admissions for heart failure suggest thatsmok<strong>in</strong>g bans may also be effective <strong>in</strong> reduc<strong>in</strong>g the impact of second-hand smoke exposure oncoronary heart disease and narrow<strong>in</strong>g its socioeconomic distribution.However, social <strong>in</strong>equalities <strong>in</strong> exposure to second-hand smoke at work are still observed <strong>in</strong> ItalianEurobarometer data at the end of 2009, probably due to a selective implementation of the ban, withlower compliance among self-employed and manual workers.Policy implications: A smok<strong>in</strong>g ban is a good policy for controll<strong>in</strong>g exposure to second-hand smoke at work, and should also be effective <strong>in</strong> tackl<strong>in</strong>g social <strong>in</strong>equalities <strong>in</strong> smoke exposureat work, due to the higher prevalence of smokers among blue-collar workers.Despite the successful Italian ban on smok<strong>in</strong>g <strong>in</strong> public and workplaces of 2005, significant social <strong>in</strong>equalities <strong>in</strong> exposure to smoke at work were still observed by 2009: among 30% ofworkplaces did not comply with the law. Low-<strong>in</strong>come, manual and self-employed workers are most affected by cont<strong>in</strong>ued exposure.These disappo<strong>in</strong>t<strong>in</strong>g results <strong>in</strong> the workplace suggest the need to develop selective programmes to ensure enforcement of the law <strong>in</strong> occupational environments.
ANNEX2EXAMPLES OF NATIONALPRACTICES IN ANALYSISAND PRESENTATIONOF ENVIRONMENTALHEALTH INEQUALITIES
152Annex 2Annex 2. Examples ofnational practices <strong>in</strong>analysis and presentationof environmental health<strong>in</strong>equalitiesCONTENTS<strong>Environmental</strong> health <strong>in</strong>equality action <strong>in</strong> France: a report on the SIGFRIED Project 153The United K<strong>in</strong>gdom susta<strong>in</strong>able development <strong>in</strong>dicators: report<strong>in</strong>g on environmental<strong>in</strong>equalities 158Identification of environmental health <strong>in</strong>equalities <strong>in</strong> populations liv<strong>in</strong>g close to wastedisposal sites <strong>in</strong> Italy 161Assess<strong>in</strong>g and report<strong>in</strong>g on <strong>in</strong>equalities related to lack of heated space and <strong>in</strong>doorpollution <strong>in</strong> Serbia and Montenegro 164Analysis and presentation of environmental health <strong>in</strong>equalities concern<strong>in</strong>g “greenspace” <strong>in</strong> Scotland 168Assessment of environmental health <strong>in</strong>equalities <strong>in</strong> F<strong>in</strong>land: residential exposure toambient air pollution from wood combustion and traffic 171<strong>Environmental</strong> health <strong>in</strong>equality report on the impact of SES on the prevalence ofallergies and respiratory diseases and symptoms <strong>in</strong> Hungarian children 175
<strong>Environmental</strong> health <strong>in</strong>equalities <strong>in</strong> <strong>Europe</strong> 153<strong>Environmental</strong> health <strong>in</strong>equalityaction <strong>in</strong> France: a report on theSIGFRIED ProjectIntroductionAnalys<strong>in</strong>g the associations between the environment and health has become a major issue for publichealth <strong>in</strong> France, brought <strong>in</strong>to focus by the country’s National <strong>Environmental</strong> <strong>Health</strong> Action Plans(NEHAPs). The second NEHAP of 2009 was prepared <strong>in</strong> response to the Fourth M<strong>in</strong>isterialConference on Environment and <strong>Health</strong>, organized by the <strong>World</strong> <strong>Health</strong> <strong>Organization</strong> <strong>in</strong> 2004.<strong>Environmental</strong> <strong>in</strong>equality has become a fundamental theme that guides policy developments <strong>in</strong> Franceand the NEHAP has been adopted <strong>in</strong> every region.The SIGFRIED Project, led by INERIS (the French National Institute for Industrial Environmentand Risks), has been set up to identify and stratify environmental <strong>in</strong>dicators and to map environmentaldisparities us<strong>in</strong>g spatial analysis techniques. The <strong>in</strong>dicators br<strong>in</strong>g together environmental and populationdata for several research applications:• to highlight vulnerable areas with significantly elevated exposure risk <strong>in</strong>dicators <strong>in</strong> order to def<strong>in</strong>eenvironmental monitor<strong>in</strong>g campaigns, to manage and plan remedial actions;• to map environmental disparities throughout France;• to provide environmental <strong>in</strong>dicators to quantify spatial relationships between environment, diseaseand socioeconomic data.This project uses the GIS-based modell<strong>in</strong>g platform PLAINE (<strong>Environmental</strong> <strong>in</strong>equalities analysisplatform), which allows the ongo<strong>in</strong>g systematic collection, <strong>in</strong>tegration and analysis of data on emissionsources, environmental contam<strong>in</strong>ation, exposure to environmental hazards, population and health. 1The Equit’area Project, led by EHESP (the School of Public <strong>Health</strong>), is <strong>in</strong>vestigat<strong>in</strong>g the associationbetween <strong>in</strong>fant mortality, deprivation and proximity to pollut<strong>in</strong>g <strong>in</strong>dustries. 2 A specific deprivation<strong>in</strong>dex was calculated us<strong>in</strong>g the smallest adm<strong>in</strong>istrative unit for which socioeconomic and demographic<strong>in</strong>formation is available from the National Institute of Statistics and Economic Studies (INSEE) 1999census data.Data and methodologyThe case study comb<strong>in</strong>ed <strong>in</strong>formation from national databases and a spatial approach to <strong>in</strong>crease theeffectiveness of the maps used for plann<strong>in</strong>g and decision-mak<strong>in</strong>g on safeguard<strong>in</strong>g public health. Aspatial database was assembled from a set of variables characteriz<strong>in</strong>g environmental and populationdata. This approach <strong>in</strong>tegrated the emissions register and census data onto the map and analysed thespatial relationships between emissions sources and socioeconomic <strong>in</strong>dicators. The follow<strong>in</strong>g examplesshow the results produced by apply<strong>in</strong>g this method to data from the Nord-Pas-de-Calais region ofFrance, us<strong>in</strong>g different adm<strong>in</strong>istrative scales depend<strong>in</strong>g on objectives and data availability.1 Caudeville J et al. (2011). Construction d’une plate-forme <strong>in</strong>tégrée pour la cartographie de l’exposition des populations aux substanceschimiques de l’environnement. Environnement, Risques et Santé, 10(3):239–242.2 Padilla C et al. (2011). Mortalité <strong>in</strong>fantile, défaveur et proximité aux <strong>in</strong>dustries polluantes: une analyse spatiale conduites à f<strong>in</strong>e échelle(agglomération de Lille, France). Environnement, Risques et Santé, 10(3):216–221.
154Annex 2Emission source data (road traffic and <strong>in</strong>dustrial) from national databases were used to build a proximity<strong>in</strong>dicator to pollution sources as a proxy for exposure (see Fig. 1). Census data were used to buildsocioeconomic <strong>in</strong>dicators (see Fig. 2). Proximity <strong>in</strong>dicators were then stratified on the demographical<strong>in</strong>formation and spatial relationships between environmental and socioeconomic data were mapped andanalysed (see Fig. 3).Road traffic and <strong>in</strong>dustrial site proximity <strong>in</strong>dicatorsTwo ma<strong>in</strong> data sources were used.• The <strong>in</strong>dustrial facilities data used <strong>in</strong> the study were extracted from the French Register of PollutantEmissions from 2003 to 2009. The collection of these data meets the requirements of the EUprotocol on Pollutant Release and Transfer Registers (PRTR), signed <strong>in</strong> Kiev <strong>in</strong> 2003, and thoseof the EU regulation concern<strong>in</strong>g the establishment of a <strong>Europe</strong>an PRTR (Regulation (EC) No.166/2006, 18 January 2006).• Emission source data on road locations and traffic capacity were compiled us<strong>in</strong>g a georeferencednational emissions database: the National Spatialized Inventory.Emission source data were collected, harmonized and stored on a GIS. Distance-to-source <strong>in</strong>dicators(proxy) were built us<strong>in</strong>g adapted distances and a GIS-based buffer tool (see Fig. 1). Buffer zones aroundsources were generated us<strong>in</strong>g different distances related to emission type, such as 1 km from <strong>in</strong>dustrialsites and 200 m from roads, and were used to create the proximity <strong>in</strong>dicators.Proxies were then aggregated us<strong>in</strong>g referent grid or adm<strong>in</strong>istrative boundaries. Analys<strong>in</strong>g the relationshipsbetween environmental and population <strong>in</strong>dicators means that data could be presented under a commondenom<strong>in</strong>ator, such as their spatial location or distribution. This was achieved by depict<strong>in</strong>g the differentdata as layers and superimpos<strong>in</strong>g these layers <strong>in</strong> the same geographical system. In the above example,data were normalized by surface unit and aggregated on county boundaries us<strong>in</strong>g geometric ratios.Socioeconomic <strong>in</strong>dicatorsSeveral data sources were used:• adm<strong>in</strong>istrative boundary <strong>in</strong>formation, vary<strong>in</strong>g accord<strong>in</strong>g to the unit scale of analysis• population data from INSEE 2006 census data.The Townsend deprivation <strong>in</strong>dex presented here (see Fig. 2) was calculated us<strong>in</strong>g four variables fromdata provided by rout<strong>in</strong>e census surveys:• economically active people unemployed• households with more than one person per room• households without a car• households not owner-occupied.Negative values of the overall Townsend scores reflect less deprived areas; positive values reflect moredeprived areas.Socioeconomic <strong>in</strong>dicators (also called deprivation <strong>in</strong>dices) are widely used <strong>in</strong> public health, both <strong>in</strong>epidemiological analysis and <strong>in</strong> allocation of resources.
<strong>Environmental</strong> health <strong>in</strong>equalities <strong>in</strong> <strong>Europe</strong> 155Fig. 1. Areas with proximity to <strong>in</strong>dustrial sites and pr<strong>in</strong>cipal roads us<strong>in</strong>g buffer zonesSource: INERIS.Fig. 2. Mapp<strong>in</strong>g the Townsend <strong>in</strong>dex on the case study areaSource: Nord-Pas-de-Calais Regional <strong>Health</strong> Observatory.ResultsStratification of environmental <strong>in</strong>dicators on population data<strong>Environmental</strong> <strong>in</strong>dicators were aggregated with population data (<strong>in</strong> this case, stratified by age and sex)to quantify and map population under risk from exposure. Fig. 3 locates (a) and quantifies (b) residentialpopulations close to <strong>in</strong>dustrial sites (with<strong>in</strong> 1 km). In this example, around 16% of the population <strong>in</strong>the Nord-Pas-de-Calais region (700 000 <strong>in</strong>habitants) is liv<strong>in</strong>g <strong>in</strong> close proximity to an <strong>in</strong>dustrial site. Asimilar approach was used to aggregate the traffic map with the demographic data.
156Annex 2Fig. 3. Aggregation of <strong>in</strong>dustrial <strong>in</strong>dicators with gender and age subgroup dataSource: INERIS.Other types of aggregation could also be studied, such as socioeconomic subgroups or <strong>in</strong>come levels.Analys<strong>in</strong>g relationships between environmental and socioeconomic <strong>in</strong>dices<strong>Environmental</strong> and socioeconomic <strong>in</strong>dices were then analysed us<strong>in</strong>g different spatial scales <strong>in</strong> order toassess <strong>in</strong>equality relationships. The bivariate local Moran test identifies spatial patterns <strong>in</strong> two variables.The black areas <strong>in</strong> Fig. 4(a) show correlations between high-risk environmental and socioeconomic<strong>in</strong>dicators at the county level: <strong>in</strong> these areas, the strongest <strong>in</strong>equalities are detected for both deprivationand proximity to <strong>in</strong>dustrial sites. The white clusters show areas where the results are low for both<strong>in</strong>dicators, and the grey areas show negative correlations or outliers.Fig. 4. Bivariate local Moran results and Equit’area Project results(a) Source: INERIS.(b) Source: EHESP.A relevant spatial scale is essential to capture and identify <strong>in</strong>equality phenomena. Other approaches canalso be used <strong>in</strong> order to ref<strong>in</strong>e this analysis. The Equit’area Project used the smallest adm<strong>in</strong>istrative unit<strong>in</strong> France for which socioeconomic and demographic <strong>in</strong>formation is available from the national census.An <strong>in</strong>dex was constructed us<strong>in</strong>g a pr<strong>in</strong>cipal component analysis from a selection of 20 socioeconomicand demographic variables, reflect<strong>in</strong>g multiple dimensions of socioeconomic deprivation such as <strong>in</strong>come,education atta<strong>in</strong>ment, employment, hous<strong>in</strong>g characteristics, family structure, and immigration status.
<strong>Environmental</strong> health <strong>in</strong>equalities <strong>in</strong> <strong>Europe</strong> 157The study sett<strong>in</strong>g was the black area highlighted by the local Moran test: the Lille metropolitan area,an urban area of 85 municipalities (about 612 km²). As shown <strong>in</strong> Fig. 4(b), most pollut<strong>in</strong>g <strong>in</strong>dustriesidentified are located <strong>in</strong> areas with a high deprivation score.ConclusionsThe examples presented here show how GIS can be used to build <strong>in</strong>dices <strong>in</strong> order to map and analyseenvironmental and socioeconomic <strong>in</strong>equalities. The <strong>in</strong>itial screen<strong>in</strong>g approach enables identificationof a vulnerable area where a more ref<strong>in</strong>ed approach is developed at a smaller scale. In this particularaggregation, the results demonstrate that most of the pollut<strong>in</strong>g <strong>in</strong>dustries are localized <strong>in</strong> areas with ahigh deprivation score.The geography of census data clearly has a fundamental <strong>in</strong>fluence on any study for which the data areused. Associations observed at the regional level applied to <strong>in</strong>dividuals with<strong>in</strong> the regions can lead toa so-called ecological fallacy. Nevertheless, those approaches allow a quantification of relationships <strong>in</strong>order to identify areas that accumulate different types of <strong>in</strong>equalities, such as health, environmental andsocioeconomic.In the SIGFRIED Project, strong correlations were also found between cancer and socioeconomic<strong>in</strong>dicators <strong>in</strong> this region. All these results facilitate the management and plann<strong>in</strong>g of targeted responseactions <strong>in</strong> order to m<strong>in</strong>imize health <strong>in</strong>equalities.
158 Annex 2The United K<strong>in</strong>gdom susta<strong>in</strong>abledevelopment <strong>in</strong>dicators: report<strong>in</strong>g onenvironmental <strong>in</strong>equalitiesIntroductionIn 2005 the United K<strong>in</strong>gdom committed, as part of its susta<strong>in</strong>able development strategy, to report onenvironmental <strong>in</strong>equalities with<strong>in</strong> its measures of susta<strong>in</strong>able development.A methodology was developed through a series of studies exam<strong>in</strong><strong>in</strong>g environmental quality <strong>in</strong>dicatorsrelated to economic and social data l<strong>in</strong>ked to specific geographical areas nationwide. As part of thisproject, the Environment Agency with the Department of the Environment, academic researchers andnongovermental organizations developed a list of environmental quality variables to be imported <strong>in</strong>to aGIS tool known as the <strong>Environmental</strong> Quality Index (see Table 1 for the variables covered). The GIStool provides an illustration to different users, often work<strong>in</strong>g at different geographical scales, of therelative environmental quality of an area compared to national and local averages.The geographical display of different environmental <strong>in</strong>dicators alongside social and economic data fora given area provides users with an ability to articulate their own priority <strong>in</strong>terests for report<strong>in</strong>g. Anannual snapshot of environmental equality was also generated, illustrat<strong>in</strong>g as broadly as possible thespread of environmental quality across the social gradient.Data and methodologyIn order to develop a s<strong>in</strong>gle <strong>in</strong>dicator summariz<strong>in</strong>g overall environmental <strong>in</strong>equality, the limitations ofthe data would need to be accepted <strong>in</strong> mov<strong>in</strong>g from a highly <strong>in</strong>volved and flexible GIS to a s<strong>in</strong>gle graphthat captured a fair reflection of the data presented.Given the spatial resolution of the data, broken down to areas with an average number of 1500 residents,a rationalization of what could be illustrated was required. Researchers and the government were alsokeen to avoid stigmatis<strong>in</strong>g areas based on nationally aggregated data, so the data was displayed aga<strong>in</strong>stdeciles (groups of 10%) of the population broken down by deprivation rather than spatially.Deprivation <strong>in</strong>dices are an approach to measur<strong>in</strong>g social and economic disadvantage <strong>in</strong> the UnitedK<strong>in</strong>gdom, derived from over 30 years of work by the government to provide policy-makers with<strong>in</strong>formation on the geographic nature of social and economic policy priorities. As such, across thedifferent countries with<strong>in</strong> the United K<strong>in</strong>gdom, locally determ<strong>in</strong>ed <strong>in</strong>dices of multiple deprivation havebeen developed and published periodically by governments <strong>in</strong> England, Wales, Scotland and NorthernIreland. 3Across these different geographical areas different methodological approaches have been selected thatarticulate the issues perta<strong>in</strong><strong>in</strong>g to the different countries. Evidently, the geography of these nationsvaries markedly, as does the geographical scale at which policy <strong>in</strong>terventions are made.3 More <strong>in</strong>formation regard<strong>in</strong>g <strong>in</strong>dices of multiple deprivation is available from the Office of National Statistics (www.ons.gov.uk) and from theDepartment for Communities and Local Government (www.imd.communities.gov.uk).
<strong>Environmental</strong> health <strong>in</strong>equalities <strong>in</strong> <strong>Europe</strong> 159Table 1. Index of Multiple Deprivation and environmental quality spatial statistics available <strong>in</strong> EnglandIndex of Multiple Deprivation – Liv<strong>in</strong>g EnvironmentIndoor liv<strong>in</strong>gOutdoor liv<strong>in</strong>g<strong>Environmental</strong> quality <strong>in</strong>dicatorsProximity to regulated sitesCarbon dioxide emissionsEcological footpr<strong>in</strong>tDerelict landFly tipp<strong>in</strong>gLitterDetritusGraffitiGreen spaceBiodiversityFlood riskRiver water qualityCentral heat<strong>in</strong>gHous<strong>in</strong>g conditionRoad traffic accidentsComb<strong>in</strong>ed air quality <strong>in</strong>dicatorsNitrogen dioxideParticulate matter (PM10)Sulphur dioxideBenzeneAs an example, an <strong>in</strong>dicator of environmental equality has been developed for England as a geographicalarea that covers 11 environmental conditions or characteristics: river water quality, air quality, greenspace, biodiversity, flood risk, litter, hous<strong>in</strong>g condition, road accidents and the presence of regulated sites,<strong>in</strong>clud<strong>in</strong>g waste management sites, landfill sites or sewage treatment works. Fig. 5 below illustrates – forthe deprivation deciles represent<strong>in</strong>g high to low levels of the English Indices of Multiple Deprivation –the degree to which environmental conditions affect these populations.Fig. 5. <strong>Environmental</strong> conditions by deprivation deciles <strong>in</strong> EnglandPrevalence (%)100908070605040304 or more conditions3 conditions2 conditions1 condition20100LeastdeprivedareasLevel of deprivationMostdeprivedareasSource: Department for Environment, Food and Rural Affairs, Environment Agency (England & Wales), Department forCommunities and Local Government.Note: for each of the environmental conditions, the population liv<strong>in</strong>g <strong>in</strong> areas with, <strong>in</strong> relative terms, the 10% least favourableconditions have been determ<strong>in</strong>ed.
160 Annex 2ResultsAs is evident from Fig. 5 above, there is a clear bias toward improved environmental quality amongpopulations that are also less socially and economically disadvantaged (or deprived). This general trendhas emerged <strong>in</strong> each publication of the data, despite the adjusted list of environmental conditionsmeasured (as a result of data availability and spatial coverage).This has resulted <strong>in</strong> some significant f<strong>in</strong>d<strong>in</strong>gs for policy-makers.• It is clear that people <strong>in</strong> deprived areas experience greater exposure to air pollution, flood<strong>in</strong>g, closeproximity to large <strong>in</strong>dustrial and waste management sites and poor river water quality. The evidenceshows that the poorer the population, the more exposed it is to more unfavourable environmentalconditions.• Around 0.2% of people liv<strong>in</strong>g <strong>in</strong> the least deprived areas may experience four or more environmentalconditions that are “least favourable”. This rises to around 17% of people liv<strong>in</strong>g <strong>in</strong> the most deprivedareas.ConclusionsIn June 2011, the United K<strong>in</strong>gdom Government produced a 60-year vision for the natural environment<strong>in</strong> England, publish<strong>in</strong>g a White Paper entitled The natural choice: secur<strong>in</strong>g the value of nature. 4 In thishigh-level policy document the <strong>in</strong>dicator of environmental quality was presented to illustrate not onlythe presence of environmental <strong>in</strong>equality <strong>in</strong> England, but also to endorse the value of environmentalimprovement and good stewardship to promote better and healthier lives <strong>in</strong> England. The <strong>in</strong>dicator ofenvironmental quality has thus been exemplary <strong>in</strong> help<strong>in</strong>g to set clear policy goals for the governmentand its partners to improve health and well-be<strong>in</strong>g and the environment.4 http://www.defra.gov.uk/environment/natural/whitepaper/, accessed 21 September 2011.
<strong>Environmental</strong> health <strong>in</strong>equalities <strong>in</strong> <strong>Europe</strong> 161Identification of environmentalhealth <strong>in</strong>equalities <strong>in</strong> populationsliv<strong>in</strong>g close to waste disposal sites <strong>in</strong>ItalyIntroductionThe patterns of associations between proximity to waste disposal sites and social deprivation, basedon <strong>in</strong>ternational data, have recently been reviewed. 5 Similar assessments are be<strong>in</strong>g worked on <strong>in</strong> Italy,and several projects have been developed at both regional and local levels to assess the health effects ofexposure to environmental pollution from waste disposal facilities, ma<strong>in</strong>ly <strong>in</strong>c<strong>in</strong>erators and landfills. TheMoniter Project <strong>in</strong> the Emilia–Romagna region (www.moniter.it), the ERAS Project (www.eraslazio.it)<strong>in</strong> the Lazio region, and various studies performed <strong>in</strong> the Campania region provide useful <strong>in</strong>formationon the measurement of <strong>in</strong>equality <strong>in</strong> waste site exposure.At the national level, with<strong>in</strong> the EU Integrated Assessment of <strong>Health</strong> Risks of <strong>Environmental</strong> Stressors<strong>in</strong> <strong>Europe</strong> Project (INTARESE), the “Waste” work package, coord<strong>in</strong>ated by Dr Francesco Forastiereof the Lazio Region <strong>Health</strong> Service, has developed <strong>in</strong>dicators for the health impact of pollution fromthe entire process of disposal of municipal solid waste, collect<strong>in</strong>g data from three different countries(Italy, Slovakia and England) for a total of 905 municipal urban solid waste landfills and 53 waste<strong>in</strong>c<strong>in</strong>erators. The follow<strong>in</strong>g example refers to the work on Italy with<strong>in</strong> this project. 6 A project funded bythe Italian M<strong>in</strong>istry of <strong>Health</strong> is currently consider<strong>in</strong>g the health-related issues of waste, with the aimof characteriz<strong>in</strong>g population exposures <strong>in</strong> different regions.Data and methodologyCountry-specific sources of <strong>in</strong>formation were identified and data about Italian municipal solid wasteproduction and management were provided by the Italian <strong>Environmental</strong> Protection Agency (APAT).Data were checked for consistency and <strong>in</strong>tegrated with <strong>in</strong>formation collected from an <strong>in</strong>dependent body,the National Waste Observatory. Local databases were used where available to improve <strong>in</strong>formation onthe waste facilities. The assessment referred to the situation <strong>in</strong> 2001.APAT provided a database of <strong>in</strong>formation on <strong>in</strong>c<strong>in</strong>erators operat<strong>in</strong>g dur<strong>in</strong>g the period 2001–2007. Inaddition, a detailed census of the 52 <strong>in</strong>c<strong>in</strong>erators operat<strong>in</strong>g <strong>in</strong> 2005 was made by the National Agencyfor New Technologies, Energy and Susta<strong>in</strong>able Economic Development, funded by the NationalAssociation of Stakeholders <strong>in</strong> Waste Management (Federambiente).APAT also provided a database of landfill sites <strong>in</strong> Italy (a total of 619 <strong>in</strong> 2001) with <strong>in</strong>formation on thetotal capacity and waste land filled per year. Unfortunately, the database did not conta<strong>in</strong> GIS coord<strong>in</strong>atesand it was impossible to retrieve this <strong>in</strong>formation for the entire country. Us<strong>in</strong>g contacts with regionalenvironmental authorities, geographical <strong>in</strong>formation could be obta<strong>in</strong>ed for five regions: Piemonte andEmilia–Romagna (<strong>in</strong> the north), Toscana and Abruzzi (<strong>in</strong> the central region), and Campania (<strong>in</strong> thesouth), cover<strong>in</strong>g a total of 118 landfills. For the rest of the country, it was assumed (with a moderatelevel of confidence) that the characteristics (sex, age and SES) of the population around the 501 miss<strong>in</strong>glandfills were similar to those of the 118 studied sites.5 Martuzzi M, Mitis F and Forastiere F (2010). <strong>Inequalities</strong>, <strong>in</strong>equities, environmental justice <strong>in</strong> waste management and health. <strong>Europe</strong>an Journalof Public <strong>Health</strong>, 20(1):21–6.6 Forastiere F et al. (2011). <strong>Health</strong> impact assessment of waste management facilities <strong>in</strong> three <strong>Europe</strong>an countries. <strong>Environmental</strong> <strong>Health</strong>, 10:53.
162 Annex 2Census tracts are the smallest units of aggregated population data that are available and geocoded <strong>in</strong>Italy. There are 352 138 census tracts, with 162 residents on average <strong>in</strong> each (rang<strong>in</strong>g from 0 to 3386people). GIS coord<strong>in</strong>ates of all <strong>in</strong>c<strong>in</strong>erators and landfills were collected where available (country-widefor <strong>in</strong>c<strong>in</strong>erators and with<strong>in</strong> five regions for landfills), and the population liv<strong>in</strong>g with<strong>in</strong> a specific radiusof both <strong>in</strong>c<strong>in</strong>erators and landfills was classified accord<strong>in</strong>g to the census tract and its deprivation value.For each census tract <strong>in</strong> Italy, a deprivation <strong>in</strong>dex was available from a national project funded by theM<strong>in</strong>istry of <strong>Health</strong>, 7 summariz<strong>in</strong>g five dimensions of socioeconomic position (education, occupation,home ownership, family composition and nationality), by mean of an unweighted average of z-scores ofeach factor. For the purpose of this study, the correspond<strong>in</strong>g population was distributed <strong>in</strong> qu<strong>in</strong>tiles ofdeprivation, rang<strong>in</strong>g from very well off (level I) to very underprivileged (level V).The distance from the po<strong>in</strong>t source (landfill site and/or <strong>in</strong>c<strong>in</strong>erator) was used to estimate the exposedpopulation. Buffer zones of 3 km around <strong>in</strong>c<strong>in</strong>erators 8 and 2 km around landfill sites 9 were used as thelikely limits of the dispersion of emissions. For each plant (<strong>in</strong>c<strong>in</strong>erators and landfills), <strong>in</strong>creas<strong>in</strong>g distance(1, 2 and 3 km) from the centre (the formal address of the plant) was def<strong>in</strong>ed and the census tracts thatmatched these areas were <strong>in</strong>cluded <strong>in</strong> the study.ResultsTable 2 shows the characteristics of the populations liv<strong>in</strong>g close to the <strong>in</strong>c<strong>in</strong>erators <strong>in</strong> Italy. More than amillion people are affected, <strong>in</strong>clud<strong>in</strong>g 9010 neonates. More than 19% of the affected population is aged65+ and the socioeconomic distribution is skewed towards higher deprivation (25% <strong>in</strong> class V (deprived)versus 12.6% <strong>in</strong> class I (less deprived)). More than half of the affected population lives close to plantsbuilt after 1990. The majority of residents with<strong>in</strong> 3 km (64.4%) are located <strong>in</strong> the 2–3 km buffer zones.Table 2. Characteristics of residents liv<strong>in</strong>g with<strong>in</strong> 3 km of an <strong>in</strong>c<strong>in</strong>erator <strong>in</strong> Italy, 2001Variable N %Total 1 060 569SexM 511 831 48.3F 548 738 51.7Age0 9 010 0.81–14 123 061 11.615–44 435 825 41.145–64 289 430 27.365+ 203 243 19.2SESI 133 211 12.6II 159 735 15.1III 223 059 21.0IV 257 009 24.2V 264 401 24.9Miss<strong>in</strong>g 23 154 2.2Distance0–1 km 50 990 4.81–2 km 326 798 30.82–3 km 682 781 64.47 Caranci N et al. (2010). The Italian deprivation <strong>in</strong>dex at census block level: def<strong>in</strong>ition, description and association with general mortality.Epidemiologia e Prevenzione, 34(4):167–76.8 Elliott P et al. (1996). Cancer <strong>in</strong>cidence near municipal solid waste <strong>in</strong>c<strong>in</strong>erators <strong>in</strong> Great Brita<strong>in</strong>. British Journal of Cancer, 73(5):702–10.9 Elliott P et al. (2001). Risk of adverse birth outcomes <strong>in</strong> populations liv<strong>in</strong>g near landfill sites. British Medical Journal, 323:363–8.
<strong>Environmental</strong> health <strong>in</strong>equalities <strong>in</strong> <strong>Europe</strong> 163Table 3 shows the characteristics of the population liv<strong>in</strong>g close to the 118 landfills <strong>in</strong> the five regions withgeocoded data, and the correspond<strong>in</strong>g figures for the whole country, assum<strong>in</strong>g that the characteristics(sex, age and SES) of people around the 501 miss<strong>in</strong>g landfills were similar to those of the 118 studiedsites. In Italy, more than 1 350 000 people would be affected, <strong>in</strong>clud<strong>in</strong>g 11 766 neonates. More than 18%of the population is aged 65+ and the socioeconomic distribution is skewed towards higher deprivation(26% <strong>in</strong> class V versus 13% <strong>in</strong> class I). The majority of residents with<strong>in</strong> 2 km (85.7%) are located <strong>in</strong> the1–2 km buffer zone.Table 3. Characteristics of residents liv<strong>in</strong>g with<strong>in</strong> 2 km of a landfill site <strong>in</strong> Italy, 2001VariableN(observed data <strong>in</strong> fiveregions)% N(estimated data at the nationallevel)Total 257 513 1 350 852SexM 125 750 48.8 659 655F 131 763 51.2 691 197Age0 2 243 0.9 11 7661–14 32 801 12.7 172 06615–44 107 244 41.6 562 57745–64 67 971 26.4 356 56065+ 47 254 18.4 247 883SESI 34 252 13.3 179 678II 38 715 15.0 203 090III 57 801 22.4 303 210IV 59 320 23.0 311 179V 67 339 26.1 353 244Miss<strong>in</strong>g 86 0.0 451Distance0–1 km 36 716 14.3 192 6031–2 km 220 797 85.7 1 158 249ConclusionsA direct relationship between small area deprivation and residence near <strong>in</strong>c<strong>in</strong>erators and landfills wasfound <strong>in</strong> Italy. Population estimates of social <strong>in</strong>equalities <strong>in</strong> exposure to residence near landfills are lessreliable at the national level, due to the lack of complete <strong>in</strong>formation about the accurate location ofplants.These f<strong>in</strong>d<strong>in</strong>gs provide useful <strong>in</strong>formation to take <strong>in</strong>to account, together with other factors such as thetransport of waste from sources to plants, that could contribute significantly to the overall impact ofthese facilities.
164 Annex 2Assess<strong>in</strong>g and report<strong>in</strong>g on<strong>in</strong>equalities related to lack of heatedspace and <strong>in</strong>door pollution <strong>in</strong> Serbiaand MontenegroIntroductionPoverty reflects a lack of household capital: households are poor if they are not able to meet their basicneeds or secure a healthy lifestyle. Households’ strategies for cop<strong>in</strong>g with their <strong>in</strong>ability to obta<strong>in</strong> energyservices often have unwelcome consequences. Especially poor households practise a risky form of energysav<strong>in</strong>g to reduce costs, such as us<strong>in</strong>g cheap and low-quality fuels, reduc<strong>in</strong>g the number of heated roomsand us<strong>in</strong>g fuels, such as unseasoned wood, that produce <strong>in</strong>door pollution.This work presents some evidence of the <strong>in</strong>fluence of poverty and social <strong>in</strong>equality on health <strong>in</strong> Serbiaand Montenegro. The assessment was performed through the United Nations Development Programme(UNDP) dur<strong>in</strong>g 2002 and 2003, <strong>in</strong>vestigat<strong>in</strong>g the energy sector <strong>in</strong> Serbia and Montenegro. 10Data and methodologyThree surveys and a series of focus group <strong>in</strong>terviews were conducted to understand the structure ofenergy services <strong>in</strong> Serbia and Montenegro. Two surveys exam<strong>in</strong>ed households: the first exam<strong>in</strong>ed actualenergy usage patterns (consumption, appliances) and the second explored perceptions about energyprocesses and services. The perception survey was conducted to test the reliability of the f<strong>in</strong>d<strong>in</strong>gs ofthe energy usage survey and to provide additional <strong>in</strong>sights <strong>in</strong>to energy consumption patterns as wellas people’s perceptions, needs, apprehensions and expectations about energy. A third survey looked atenergy providers and auxiliary services. A series of focus group <strong>in</strong>terviews was conducted with energyusers to ga<strong>in</strong> a deeper understand<strong>in</strong>g of the complex processes exam<strong>in</strong>ed <strong>in</strong> the surveys.The energy usage survey was adm<strong>in</strong>istered to a random sample of 1720 households. Municipalities,neighbourhoods, streets, houses and apartments were randomly selected. The perception survey wasconducted on a separate sample of 1650 households randomly selected from the 2002 census <strong>in</strong> Serbiaand vot<strong>in</strong>g lists <strong>in</strong> Montenegro. All f<strong>in</strong>d<strong>in</strong>gs were compared with the results of the Liv<strong>in</strong>g StandardsMeasurement Study survey conducted as part of Serbia and Montenegro’s Poverty Reduction StrategyProcess, which sampled more than 6500 households, and the household consumption survey conductedby the Federal Statistical Office. The results of the household survey were used for a cluster analysis todist<strong>in</strong>guish groups of households based on their energy patterns and welfare status.The energy usage survey reveals that dur<strong>in</strong>g the 2002/2003 heat<strong>in</strong>g season, the most frequently usedfuels were wood and coal (61% of households), district heat<strong>in</strong>g (<strong>in</strong>clud<strong>in</strong>g central heat<strong>in</strong>g) (22%) andelectricity (12%). In urban settlements, almost equal numbers of households used wood and coal (40%)and district heat<strong>in</strong>g (38%), while 16% of households used electricity as the primary fuel for heat<strong>in</strong>g. Inrural settlements, 87% of households used wood and coal, and only 7% used electricity as the primaryfuel for heat<strong>in</strong>g. Gas was used as a heat<strong>in</strong>g fuel mostly <strong>in</strong> Vojvod<strong>in</strong>a (13% of households). In Belgradealmost half of households (47%) used district heat<strong>in</strong>g.10 UNDP (2004). Stuck <strong>in</strong> the past: energy, environment and poverty <strong>in</strong> Serbia and Montenegro. Belgrade, UNDP (http://www.undp.org/energy/docs/Stuck_<strong>in</strong>_the_Past.pdf, accessed 21 September 2011).
<strong>Environmental</strong> health <strong>in</strong>equalities <strong>in</strong> <strong>Europe</strong> 165<strong>Inequalities</strong> related to heat<strong>in</strong>gThe surveys revealed that many households <strong>in</strong> Serbia and Montenegro lack sufficient heat<strong>in</strong>g conditions.• More than one-third of households (37%) assess their quality of heat<strong>in</strong>g as poor and <strong>in</strong>sufficient.The percentage is higher (42%) among people over 60.• Households that use electricity for heat<strong>in</strong>g, households with below average economic status andhouseholds that heat less than 5 m 2 per household member assess their quality of heat<strong>in</strong>g as poorand <strong>in</strong>sufficient much more frequently than other households.• To cut energy expenses, 17% of households reduce the temperature <strong>in</strong> the rooms they heat, and 27%of households reduce the number of rooms they heat. Households that use electricity for heat<strong>in</strong>gand households with below average economic status are more likely than other households to lowerthe temperature and reduce the number of rooms they heat (see Table 4).• Households that assess their quality of heat<strong>in</strong>g as poor and <strong>in</strong>sufficient, households that heat lessthan 10 m 2 per household member and households whose economic status is below average aremore likely to experience health problems (see Table 4).Table 4. Socioeconomic <strong>in</strong>dicators, by heated space and type of fuel (%, except where otherwise <strong>in</strong>dicated)Indicator Heated space Type of fuelLess than10 m 2 ofheated spaceper householdmemberMore than 20m 2 of heatedspace perhouseholdmemberElectricityDistrictheat<strong>in</strong>gWoodand coalOtherIncomeUp to 2500 33.3 8.4 13.0 4.4 27.3 19.2 20.0d<strong>in</strong>ars ($42)per householdmember <strong>in</strong> June2003More than 9000 0.7 21.8 12.3 20.6 2.0 13.7 8d<strong>in</strong>ars ($150)per householdmember <strong>in</strong> June2003Average total 46 102 81 103 54 83 69household<strong>in</strong>come permember (US$)Highest educational level atta<strong>in</strong>edPrimary school 38.2 15.4 12.1 8.1 36.3 19.1 26.2University or 7.0 22.8 19.2 25.9 8.3 14.3 13.8college degreeHousehold size and compositionFive or more 33.7 9.0 18.9 10.4 26.7 23.8 22.0membersTwo or more 24.1 9.1 18.0 9.9 18.6 21.0 16.8children underthe age of 18Three- generation 33.5 12.9 16.7 9.4 30.9 26.0 24.1household<strong>Health</strong> statusProportion ofhouseholdswithout healthproblems59.0 69.9 69.2 73.2 60.4 66.5 64.7AllhouseholdsSource: perception survey.Note: the differences are even more significant for heated space per member of up to 5 m 2 . About 47% of households with atleast five members and 34% of households with at least two children heat no more than 5 m 2 per household member; 40% ofthese households are three-generation households. About 59% of households that heat no more than 5 m 2 had <strong>in</strong>come perhousehold member of less than 2500 d<strong>in</strong>ars ($42) <strong>in</strong> June, while none had <strong>in</strong>come per household member of more than 9000d<strong>in</strong>ars ($150).
166 Annex 2<strong>Inequalities</strong> <strong>in</strong> <strong>in</strong>door air pollutionThe survey also <strong>in</strong>dicated that <strong>in</strong> relation to heat<strong>in</strong>g conditions, many households suffer from healthproblems related to <strong>in</strong>door air pollution.• Households with at least five members were more likely to use wood or coal for heat<strong>in</strong>g (81%).• Households that heat less than 10 m 2 per member are most likely to burn wood or coal (81%);households heat<strong>in</strong>g more than 20 m 2 per member use district heat<strong>in</strong>g (46%), coal and wood (38%),electricity (8%) and gas (5%) (see Table 5).• Households <strong>in</strong> apartments with district heat<strong>in</strong>g make up a disproportionately high percentageof people with university or college education and people work<strong>in</strong>g <strong>in</strong> trade, transport andcommunications, f<strong>in</strong>ance, public adm<strong>in</strong>istration, police and military, education, health care andsocial welfare. Households that burn solid fuels represent a higher than average share of peoplework<strong>in</strong>g <strong>in</strong> agriculture, trade and crafts.Table 5. Reduction of heated space <strong>in</strong> apartments, by type of fuelSpace per household Electricity District heat<strong>in</strong>g Wood and coal Other TotalmemberHeated space of less 38.9% 4.2% 51.9% 28.0% 38.5%than 10 m 2Heated space of 43.5% 44.7% 32.4% 43.0% 37.0%10–20 m 2Heated space more 17.7% 51.0% 15.7% 28.9% 24.5%than 20 m 2All rooms heated 26.7% 95.6% 19.2% 29.1% 37.6%Only some rooms 73.3% 4.4% 80.8% 70.9% 62.4%heatedAverage apartmentspace72.8 m 2 61.9 m 2 86.9 m 2 109.3 m 2 * 80.7 m 2Source: perception survey.* This figure reflects the effect of one hous<strong>in</strong>g unit of more than 900 m 2 , which <strong>in</strong>creased the average.<strong>Inequalities</strong> <strong>in</strong> associated health conditionsThe household surveys shed light on the relation between health problems and lack of heated space and<strong>in</strong>door pollution.• People who live <strong>in</strong> homes with a heated area of less than 10 m 2 per household member have a higher<strong>in</strong>cidence of health problems (41%) than people who live <strong>in</strong> households with larger heated areas permember (30%).• There are statistically significant differences <strong>in</strong> the number of household members with healthproblems between households us<strong>in</strong>g wood for heat<strong>in</strong>g (39.6%) and those us<strong>in</strong>g district heat<strong>in</strong>g(26.8%) (see Table 4).• There are significant differences <strong>in</strong> the number of health problems between groups us<strong>in</strong>g residentialheat<strong>in</strong>g based on electricity (12.2%), or us<strong>in</strong>g air conditioners (18.4%) or central heat<strong>in</strong>g (26.3%), <strong>in</strong>comparison to the group us<strong>in</strong>g naphtha burn<strong>in</strong>g stoves (56%), solid fuel light cook<strong>in</strong>g stoves (42.1%)and gas heaters (41.9%).• The difference <strong>in</strong> the <strong>in</strong>cidence of health problems and type of heat<strong>in</strong>g is most apparent <strong>in</strong> the caseof users of electricity masonry stoves (8.7% hav<strong>in</strong>g health problems) and users of solid fuels masonrystoves (36.7% hav<strong>in</strong>g health problems).
<strong>Environmental</strong> health <strong>in</strong>equalities <strong>in</strong> <strong>Europe</strong> 167ConclusionsHouseholds are suffer<strong>in</strong>g from lack of heat and high levels of <strong>in</strong>door air pollution. Dur<strong>in</strong>g the w<strong>in</strong>termany poor households heat only half of their liv<strong>in</strong>g space <strong>in</strong> order to save on energy costs. More than25% of households heat less than 10 m 2 per person, considered to be the necessary m<strong>in</strong>imum. About60% of the population uses wood and lignite coal – the worst polluters – as their major source of energyfor heat<strong>in</strong>g, domestic hot water and cook<strong>in</strong>g.Indoor air pollution is considerable and is correlated with chronic illnesses, <strong>in</strong>clud<strong>in</strong>g respiratorydisease. The health and demographic statistics, survey evidence, mortality patterns and anecdotalevidence together lead to a stark conclusion: <strong>in</strong>door pollution is hav<strong>in</strong>g deleterious effects on 1.5 millionhouseholds <strong>in</strong> Serbia and Montenegro.<strong>Health</strong> problems and w<strong>in</strong>ter mortality are closely affiliated to the above factors. Mortality <strong>in</strong> Serbiaand Montenegro dur<strong>in</strong>g the w<strong>in</strong>ter months can be more than 30% higher than the monthly averagemortality rate, with poor households disproportionately affected. Flu epidemics, weather conditions,<strong>in</strong>adequate cloth<strong>in</strong>g, <strong>in</strong>sufficient physical activity, bad nutrition, and high-density hous<strong>in</strong>g expla<strong>in</strong> partof the differential, but energy-related factors – such as <strong>in</strong>creased <strong>in</strong>door air pollution, <strong>in</strong>adequate homeheat<strong>in</strong>g and low temperatures <strong>in</strong> bedrooms – also play a role, often <strong>in</strong>teract<strong>in</strong>g with other factors.
168 Annex 2Analysis and presentation ofenvironmental health <strong>in</strong>equalitiesconcern<strong>in</strong>g “green space” <strong>in</strong> ScotlandIntroductionThe term “green space” is used to describe any vegetated land or water with<strong>in</strong> or adjo<strong>in</strong><strong>in</strong>g an urban area.Thus, it <strong>in</strong>cludes:• disused railway l<strong>in</strong>es, rivers and canals (sometimes called “green corridors”);• woods, grassed areas, parks, gardens, play<strong>in</strong>g fields, children’s play areas, cemeteries and allotments;• countryside immediately adjo<strong>in</strong><strong>in</strong>g a town which people can access from their homes. 11Green space can also describe derelict, vacant and even contam<strong>in</strong>ated land which has the potentialto be transformed. Quality green spaces contribute to improv<strong>in</strong>g health and well-be<strong>in</strong>g for urbancommunities. Nested with<strong>in</strong> the Scottish Government’s strategic objective for a healthier Scotland is anobjective to susta<strong>in</strong> and improve health, especially <strong>in</strong> disadvantaged communities. A taskforce chargedwith br<strong>in</strong>g<strong>in</strong>g forward an action plan to tackle health <strong>in</strong>equalities <strong>in</strong> Scotland identified several key rolesof green spaces <strong>in</strong> creat<strong>in</strong>g healthy, susta<strong>in</strong>able communities.• Green spaces provide valuable opportunities for social, physical, environmental and purposefulactivities that enhance the well-be<strong>in</strong>g of the whole population and can be particularly beneficial topeople struggl<strong>in</strong>g with poor mental health.• Green spaces improve physical health by provid<strong>in</strong>g no-cost opportunities for sports, walk<strong>in</strong>g, cycl<strong>in</strong>g,garden<strong>in</strong>g and conservation work. They <strong>in</strong>crease levels of physical activity and reduce the risk ofpeople hav<strong>in</strong>g a range of illnesses or poor health – they are particularly valuable <strong>in</strong> low-<strong>in</strong>comecommunities.• Green spaces support children’s physical and social development by offer<strong>in</strong>g opportunities for playand physical activity that are essential for early years development, as well as for older childrenand teenagers. In low-<strong>in</strong>come communities where private gardens are few, public green spaces areparticularly crucial <strong>in</strong> support<strong>in</strong>g children’s development.• Green spaces offer improved community health through the role of green <strong>in</strong>frastructure and greennetworks, which reduce health risks from traffic, air pollution, noise flood<strong>in</strong>g and temperatureextremes, as well as provid<strong>in</strong>g opportunities for physical and social activity and play.By contrast, degraded and poor quality green space is considered to limit development of healthysusta<strong>in</strong>able communities by:• discourag<strong>in</strong>g physical activity• underm<strong>in</strong><strong>in</strong>g well-be<strong>in</strong>g• <strong>in</strong>creas<strong>in</strong>g social isolation• damag<strong>in</strong>g community morale• deny<strong>in</strong>g children access to outdoor play• <strong>in</strong>creas<strong>in</strong>g health <strong>in</strong>equalities.An understand<strong>in</strong>g of how proximity of, and access to, urban green space aligns with social variables is ofconsiderable policy significance and can <strong>in</strong>form <strong>in</strong>terventions with potential to bear directly on health,well-be<strong>in</strong>g and <strong>in</strong>equities <strong>in</strong> health. Organized approaches to secur<strong>in</strong>g better green space, distributed11 Greenspace Scotland (2004). What is greenspace? Stirl<strong>in</strong>g, Greenspace Scotland (http://www.greenspacescotland.org.uk/default.asp?page=26,accessed 26 September 2011).
<strong>Environmental</strong> health <strong>in</strong>equalities <strong>in</strong> <strong>Europe</strong> 169more equitably between population groups, are consistent with the Scottish Government’s strategicaspirations to deliver a wealthier and fairer and a healthier Scotland. The right sort of green space,appropriately located <strong>in</strong> relation to population, is also consistent with the rema<strong>in</strong><strong>in</strong>g three ScottishGovernment strategic objectives; namely, to create a safer and stronger, a smarter and a greener Scotland.The collection of appropriate measures of green space aligned to social variables is potentially veryvaluable <strong>in</strong> policy terms.Analysis of accessibility of green space raises a further issue. Technically, measur<strong>in</strong>g proximity can bedone at various levels of sophistication: firstly, Euclidian distance can be used and a factor <strong>in</strong>corporatedto divide or multiply the distance to account for network distance; secondly, if required, actual accesspo<strong>in</strong>ts can be mapped for some green spaces (such as conventional parks) and then used with networkanalysis. However, proximity is only one factor that impacts on accessibility and use of green space;perception of crime, functionality and design can also <strong>in</strong>fluence use and these can be considered undercommunity consultation.Data and methodologyOver the last decade the analysis of green space has been significantly improved by the availability ofdetailed georeferenced socioeconomic and health data. These data can be comb<strong>in</strong>ed with detailed greenspace data, usually with<strong>in</strong> a GIS. This has allowed researchers to undertake a more detailed analysis ofthe issue and also aided the presentation of this topic to policy-makers.Most of these data come from government or quasi-government sources and the open<strong>in</strong>g up of nationalmapp<strong>in</strong>g organizations’ data sets, and much is now available for <strong>in</strong>teractive mapp<strong>in</strong>g on web sites.The example of Scotland (similar data and analyses have also been produced <strong>in</strong> England and Wales)illustrates the data sets available and result<strong>in</strong>g analyses have been based on the follow<strong>in</strong>g elements:• datazones – small area units of 500–1000 people, represent<strong>in</strong>g the default unit for the collection ofmost government data <strong>in</strong> Scotland;• the Scottish Index of Multiple Deprivation 12 – a range of socioeconomic data at datazone units,based on 38 <strong>in</strong>dicators available <strong>in</strong> a range of doma<strong>in</strong>s, <strong>in</strong>clud<strong>in</strong>g <strong>in</strong>come, employment, health,education, skills and tra<strong>in</strong><strong>in</strong>g, hous<strong>in</strong>g, geographic access and crime;• unit postcodes – approximately 15 households tied to a unique identifier and a classification of thesepostcodes on an urban rural scale;• Ordnance Survey (the mapp<strong>in</strong>g agency of the United K<strong>in</strong>gdom Government) “MasterMap AddressLayer 2” (based on the Local Land and Property Gazetteer), which maps every <strong>in</strong>dividual build<strong>in</strong>g<strong>in</strong> the country;• detailed classification of green space by type at the local authority level, as well as some nationallyavailable data sets. 13By spatially <strong>in</strong>tegrat<strong>in</strong>g different sets of data with<strong>in</strong> a GIS it is possible to get an understand<strong>in</strong>g of thespatial distribution of green space, and the quality and potential impacts on health. An early example ofthis approach was carried out for the Scottish and Northern Ireland Forum for <strong>Environmental</strong> Research(SNIFFER), compris<strong>in</strong>g the Scottish Executive, Scottish <strong>Environmental</strong> Protection Agency, ForestryCommission Scotland and Scottish Natural Heritage. 1412 Scottish Government (2010). Scottish Index of Multiple Deprivation. Ed<strong>in</strong>burgh, Scottish Government (http://scotland.gov.uk/Topics/Statistics/SIMD, accessed 26 September 2011).13 Scottish Government (2008). Plann<strong>in</strong>g Advice Note 65. Ed<strong>in</strong>burgh, Scottish Government (http://www.scotland.gov.uk/Resource/Doc/225179/0060935.pdf, accessed 26 September 2011).14 Fairburn J et al. (2005). Investigat<strong>in</strong>g environmental justice <strong>in</strong> Scotland: l<strong>in</strong>ks between measures of environmental quality and socialdeprivation. Ed<strong>in</strong>burgh, SNIFFER.
170Annex 2ResultsAll of Scotland has now been mapped <strong>in</strong> detail at the local authority level for green space access. Theearly proximity (Euclidean) studies have been improved by the use of analysis of routes to green space;this also allows planners to evaluate how many people will be affected by improvements to green space,as well as improvements to possible routes. For example, by classify<strong>in</strong>g the population <strong>in</strong>to 10 deciles bythe Scottish Index of Multiple Deprivation it was possible to show that people <strong>in</strong> deciles 9 and 10 (thetwo wealthiest) were twice as likely as those <strong>in</strong> any other decile to be liv<strong>in</strong>g near a local nature reserve.Complement<strong>in</strong>g the quantitative/GIS method has been the use of largely qualitative methods foruse <strong>in</strong> community consultation. Greenspace Scotland, Scottish Natural Heritage and the Institute ofOccupational Medic<strong>in</strong>e produced a health impact assessment guide for green space, which is <strong>in</strong>tendedto aid the assessment of health and equity impacts of exist<strong>in</strong>g and proposed green space. 15 It is hopedthat the guidance will contribute to a greater recognition of green space’s role <strong>in</strong> improv<strong>in</strong>g health andgreater emphasis on the health effects of green space <strong>in</strong> proposals.Start<strong>in</strong>g <strong>in</strong> 2010, the Scottish Household Survey is now publish<strong>in</strong>g data on perceived green spacequality across Scotland, by Index of Multiple Deprivation and local authority of residence. An exampleis provided <strong>in</strong> Fig. 6.Fig. 6. Percentage of adults (aged 16+) who agreed there were any ‘safe and pleasant’ parks or green spacesavailable <strong>in</strong> the area, by Scottish Index of Multiple Deprivation qu<strong>in</strong>tile, 20091009080706050403020100Percentage1 - mostdeprived2 3 4 5 - leastAreadeprivedConclusions and opportunities for replicationThis approach provides a very strong evidence base for policy-makers at the local level and can be used<strong>in</strong> particular to br<strong>in</strong>g together local authorities to develop <strong>in</strong>tegrated and spatially targeted policy. In fact,Forestry Commission Scotland used just such an approach when mak<strong>in</strong>g grants available to improvegreen spaces and to plant new woodlands.The difficulties for many countries <strong>in</strong> replicat<strong>in</strong>g the approach to green space described <strong>in</strong> this exampleat the national level (and <strong>in</strong> some case even at the local level) must be acknowledged. However, it isundoubtedly the case that such an approach could be replicated by local authorities <strong>in</strong> some countries.Local authorities will generally have a local gazetteer (usually conta<strong>in</strong><strong>in</strong>g <strong>in</strong>formation down to the<strong>in</strong>dividual house), data on the location of green space and some socioeconomic data for the population.Such an approach does need a reasonably high level of technical competency, especially <strong>in</strong> GIS. However,there are several detailed guidance manuals available from the United K<strong>in</strong>gdom demonstrat<strong>in</strong>g how touse this approach.15 Greenspace Scotland (2008). <strong>Health</strong> impact assessment of greenspace – a guide. Stirl<strong>in</strong>g, Greenspace Scotland (http://www.greenspacescotland.org.uk/upload/File/Greenspace%20HIA.pdf, accessed 26 September 2011).
<strong>Environmental</strong> health <strong>in</strong>equalities <strong>in</strong> <strong>Europe</strong> 171Assessment of environmental health<strong>in</strong>equalities <strong>in</strong> F<strong>in</strong>land: residentialexposure to ambient air pollutionfrom wood combustion and trafficIntroductionThe methods and results below are extracted from the f<strong>in</strong>al report of the F<strong>in</strong>nish PILTTI study. 16The ma<strong>in</strong> results will also be published <strong>in</strong> two scientific articles. 17 18 In addition to the material brieflysummarized below, the PILTTI study also used a GIS to map the distribution of the two types ofexposure over F<strong>in</strong>land, estimated the health impacts and forecasted the changes <strong>in</strong> exposure and healthimpacts to 2020.The aim of the PILTTI project was to assess the adverse health effects from air pollution by primaryf<strong>in</strong>e particulate matter (aerodynamic diameter smaller than 2.5 µm (PM 2.5)) <strong>in</strong> F<strong>in</strong>land from trafficand domestic wood combustion – how the exposures and risks are distributed <strong>in</strong> space, time and acrossthe sociodemographic strata. PM 2.5is the air contam<strong>in</strong>ant, and most likely also the environmentalcontam<strong>in</strong>ant, with the highest burden of disease impact <strong>in</strong> F<strong>in</strong>land, <strong>Europe</strong> and the world. The twosources be<strong>in</strong>g assessed are those with the greatest contrast <strong>in</strong> area covered, and thus the greatest exposureand risk differences. They are also the PM 2.5sources on which national regulation and local actions canexert the highest impacts. They therefore provide a relevant target for environmental health <strong>in</strong>equalityassessment.Data and methodologyResidential location and sociodemographic population data for F<strong>in</strong>land were obta<strong>in</strong>ed from the StatisticsF<strong>in</strong>land Grid Database (www.stat.fi/tup/ruututietokanta/<strong>in</strong>dex_en.html). The data set conta<strong>in</strong>edpopulation numbers for F<strong>in</strong>land on a resolution of 250 x 250 m 2 for 2004. For exposure modell<strong>in</strong>g, thepopulation data were transformed <strong>in</strong>to 1 km 2 spatial resolution with GIS-based modell<strong>in</strong>g platformArcMap 9.2.Source emission data for domestic wood combustion and traffic were divided <strong>in</strong>to two categoriesbecause of different temporal variations <strong>in</strong> the data, and different dispersion characteristics. The fourcategories were:• domestic wood combustion <strong>in</strong> residential build<strong>in</strong>gs• domestic wood combustion <strong>in</strong> recreational build<strong>in</strong>gs• direct traffic emissions, tailpipe, tyre and brake wear• suspended traffic emissions (road dust).16 Ahtoniemi P et al. (2010). <strong>Health</strong> risks from nearby sources of f<strong>in</strong>e particulate matter: domestic wood combustion and road traffic (PILTTI).Helsk<strong>in</strong>ki, National Institute for <strong>Health</strong> and Welfare.17 Taimisto P et al. (2011). Evaluation of <strong>in</strong>take fractions for different subpopulations due to primary f<strong>in</strong>e particulate matter (PM2.5) emitted fromdomestic wood combustion and traffic <strong>in</strong> F<strong>in</strong>land. Air Quality, Atmosphere & <strong>Health</strong>, 4(3–4):199–209.18 Karvosenoja N et al. (2011). Integrated model<strong>in</strong>g assessments of the population exposure <strong>in</strong> F<strong>in</strong>land to primary PM2.5 from traffic anddomestic wood combustion on the resolutions of 1 and 10 km. Air Quality, Atmosphere & <strong>Health</strong>, 4(3–4):179–188.
172Annex 2PM 2.5emissions of domestic wood combustion and road traffic were calculated with the F<strong>in</strong>nish RegionalEmission Scenario model of the F<strong>in</strong>nish Environment Institute. 19 The emissions are calculated from theparameters of activity levels, emission factors and emission control technologies for F<strong>in</strong>land <strong>in</strong> 2000 anddisaggregated to 1 km and 1 hour resolutions.Emission–exposure relationships for emissions of domestic wood combustion <strong>in</strong> residential andrecreational build<strong>in</strong>gs, as well as direct and suspended traffic emissions for the entire population ofF<strong>in</strong>land, were estimated us<strong>in</strong>g the <strong>in</strong>take fraction (iF) concept. The estimation of iFs for air pollutionemissions are based on emission, dispersion, concentration, population and breath<strong>in</strong>g rate data.The applied atmospheric dispersion model was the Urban Dispersion Modell<strong>in</strong>g system developed atthe F<strong>in</strong>nish Meteorological Institute. Meteorological data from 10 synoptic weather stations from 2000to 2003 were used <strong>in</strong> the calculations.Incremental PM 2.5concentrations were calculated for <strong>in</strong>cremental unit emissions with a 1 km gridresolution for each of the four source categories – <strong>in</strong> total for 783 900 grid cells. Each source wasassumed to be <strong>in</strong> the centre of a 40 x 40 km 2 grid for domestic wood combustion and 20 x 20 km 2 gridfor road traffic emissions. Contributions from the more distant sources to the concentration <strong>in</strong> a gridcell were ignored. The iFs, and further the exposure and risk estimates for the populations and sources<strong>in</strong> each grid cell, were calculated us<strong>in</strong>g the actual source emission and population data with statisticalcomputation and graphic system R version 2.7.0.ResultsBecause the high spatial resolution population statistics also <strong>in</strong>clude data on the sex, age and educationlevel of each <strong>in</strong>dividual, the average exposures to the four PM 2.5categories from the two traffic and twowood combustion sources, and thus the exposure differences between the different sociodemographicgroups, could be estimated. These are shown <strong>in</strong> Fig. 7.Females appear to experience slightly higher exposures to traffic PM 2.5but equal exposures to woodcombustion PM 2.5compared to males. The difference is somewhat unexpected for traffic PM 2.5, but issmall and statistically <strong>in</strong>significant.Children experience the lowest and adults the highest exposures to traffic particles. The elderlyexperience the lowest exposures to wood combustion particles. The differences, however, are small, andthe presumably higher vulnerability of children may more than elim<strong>in</strong>ate the advantage ga<strong>in</strong>ed fromlower exposure.Those with high school and higher education experience significantly higher exposures to traffic PM 2.5and also higher exposure to wood combustion PM 2.5than those with lower levels of education. Regard<strong>in</strong>gexposure to traffic PM 2.5, the average exposure level is highest for those with high school education,but the college/university educated also experience significantly higher exposure levels than those withvocational school education or less. The differences <strong>in</strong> the exposures to PM 2.5from wood combustionare small <strong>in</strong> comparison, but <strong>in</strong>crease consistently with the education level.Compared to <strong>in</strong>ternational studies, these f<strong>in</strong>d<strong>in</strong>gs could be considered unexpected, yet it is quite credible<strong>in</strong> the context of F<strong>in</strong>nish cities, where on the one hand the most expensive hous<strong>in</strong>g is often found <strong>in</strong> citycentres close to the busiest traffic, and on the other hand wood combustion is a supplementary source ofheat <strong>in</strong> the mostly electrically-heated suburban homes that lie outside of district heat<strong>in</strong>g networks. Thelower socioeconomic groups, conversely, are more likely to live <strong>in</strong> suburban high-rise build<strong>in</strong>gs, heatedvia district heat<strong>in</strong>g pipel<strong>in</strong>es, with no equipment for wood burn<strong>in</strong>g, and distanced from the busiest19 Karvosenoja N. (2008). Emission scenario model for regional air pollution. Hels<strong>in</strong>ki, F<strong>in</strong>nish Environment Institute (Monographs of the BorealEnvironment Research, No. 32; http://lib.tkk.fi/Diss/2008/isbn9789521131851/isbn9789521131851.pdf, accessed 26 September 2011).
<strong>Environmental</strong> health <strong>in</strong>equalities <strong>in</strong> <strong>Europe</strong> 173traffic zones. The results highlight the fact that the impacts of many, if not most, SES parameters onpollution exposures are not universal, but are affected by local social, economic and urban developmenthistories and cultures, and therefore require local analysis with local data.Note that the exposure data were estimated from outdoor concentrations; the differences <strong>in</strong> theoutdoor–<strong>in</strong>door transportation of particles were ignored, the data on exposure to traffic particles do not<strong>in</strong>clude personal exposure while <strong>in</strong> transport, and the data on exposure to wood combustion particlesdo not <strong>in</strong>clude <strong>in</strong>door exposure to particles emitted from fireplaces directly <strong>in</strong>to <strong>in</strong>door air. Tak<strong>in</strong>g <strong>in</strong>toconsideration the additional more direct fields of traffic and <strong>in</strong>door sources would amplify the estimateddifferences.Fig. 7. Average exposure (μg/m 3 ) of different subpopulations to primary PM 2.5from domestic woodcombustion and traffic <strong>in</strong> F<strong>in</strong>land <strong>in</strong> 2000Average exposure (µg/m³)1.41.21.00.80.60.40.2SexFemaleMale0.0Traffic exhaustand wearTrafficsuspensionResidential build<strong>in</strong>gsRecreational build<strong>in</strong>gsAverage exposure (µg/m³)1.41.21.00.80.60.40.2AgeChildren (0–17)Adults (18–64)Elderly (65+)0.0Traffic exhaustand wearTrafficsuspensionResidential build<strong>in</strong>gsRecreational build<strong>in</strong>gsEducationAverage exposure (µg/m³)1.81.61.41.21.00.80.60.40.2Higher educationHigh schoolVocational educationComprehensive school0.0Traffic exhaustand wearTrafficsuspensionResidentialbuild<strong>in</strong>gsRecreational build<strong>in</strong>gsEmission source categoryNote: the levels are averages of exposure to PM 2.5from specific sources; for example, the average exposure level of the highschool-educated population to traffic generated PM 2.5(exhaust, tyre and brake wear and road dust) is 1.7 + 1.0 = 2.7µg/m 3 .The total average PM 2.5exposure from all sources is approximately 10 µg/m 3 .
174Annex 2ConclusionsWhile there are cont<strong>in</strong>u<strong>in</strong>g national and EU-based policy actions to reduce exposure to traffic andheat<strong>in</strong>g generated PM 2.5, these results have not led to any actions for reduc<strong>in</strong>g the socioeconomicdifferences <strong>in</strong> exposure and risk. The reasons are the small and <strong>in</strong>significant differences between thesex and age groups, the relatively low exposure of children, and the fact that the higher exposure of themore educated does not reflect social deprivation or lack of choice and is compensated by their generallybetter underly<strong>in</strong>g health status. However, the data have been useful to confirm that no action is requireddue to a very low level of environmental health <strong>in</strong>equalities <strong>in</strong> the F<strong>in</strong>nish population.The analysis method is <strong>in</strong> itself universally applicable, but requires <strong>in</strong>dividual level residential location,hous<strong>in</strong>g and sociodemographic data, which are available from the census data <strong>in</strong> F<strong>in</strong>land but not <strong>in</strong> allcountries. It also requires data on wood heat<strong>in</strong>g <strong>in</strong> each build<strong>in</strong>g and traffic flows on each road l<strong>in</strong>k,which are prohibitively expensive to generate if not otherwise available.
<strong>Environmental</strong> health <strong>in</strong>equalities <strong>in</strong> <strong>Europe</strong> 175<strong>Environmental</strong> health <strong>in</strong>equalityreport on the impact of SES onthe prevalence of allergies andrespiratory diseases and symptoms <strong>in</strong>Hungarian childrenIntroductionThe aim of the National Children’s Respiratory <strong>Health</strong> Survey was to assess the relationship betweenthe prevalence of allergic and asthmatic symptoms and chronic bronchitis <strong>in</strong> third grade schoolchildrenand social deprivation at the settlement level <strong>in</strong> Hungary. This representative study is the first attemptto assess the impact of social <strong>in</strong>equalities on respiratory health <strong>in</strong> Hungarian children at a community(settlement) level.Data and methodologyA national cross-sectional study was performed <strong>in</strong> autumn 2005. 20 All children <strong>in</strong> third grade classes withmore than 10 children <strong>in</strong> any elementary school of Hungary were <strong>in</strong>vited to participate. Questionnairesto be completed by the parents were sent to the head teachers of the schools, accompanied by a letterabout the objectives of the study. The questionnaires served as sources of <strong>in</strong>formation on the children’spresent and past health status, per<strong>in</strong>atal conditions, the parents’ respiratory health and smok<strong>in</strong>g habits,the home environment and the SES of the family.2726 schools were <strong>in</strong>vited and 2160 schools (79.2%) participated <strong>in</strong> the survey. Out of the 82 082questionnaires sent out to these schools, 62 711 were returned (76.4%). Based on the questionnaire<strong>in</strong>formation, comb<strong>in</strong>ed data on variables <strong>in</strong>clud<strong>in</strong>g chronic bronchitic symptoms, asthmatic symptomsdur<strong>in</strong>g the last 12 months and allergic symptoms were constructed. The presence of chronic bronchiticsymptoms was based on at least one positive answer to three questions (whether the child usually coughs<strong>in</strong> the morn<strong>in</strong>g, dur<strong>in</strong>g the day or at night <strong>in</strong> the autumn/w<strong>in</strong>ter season; whether the child coughed onmost days for at least three months consecutively <strong>in</strong> the last autumn/w<strong>in</strong>ter season; whether the childusually coughs up phlegm when he/she does not have a cold). The assessment of asthmatic symptomswas based on at least one positive answer to five questions, all related to the last 12 months (whether thechild’s chest sounded wheezy or whistl<strong>in</strong>g; whether the child’s chest sounded wheezy dur<strong>in</strong>g or afterexercise; whether the child was woken up by wheez<strong>in</strong>g; whether the child suffered from a dry cough atnight; whether the child was treated for asthma). There was a separate question about whether asthmahad ever been diagnosed by a physician. Questions on allergies covered allergies to house dust, pets,pollen, mould, food, medic<strong>in</strong>e or anyth<strong>in</strong>g else, and whether an allergy had been diagnosed by a doctor.20 Paldy A et al. (2009). Impact of socioeconomic state on the prevalence of allergic and respiratory symptoms and diseases and <strong>in</strong> Hungarianchildren population. Epidemiology, 20(6):S178. The study was funded by <strong>Europe</strong>an health and environment <strong>in</strong>formation system for riskassessment and disease mapp<strong>in</strong>g (EUROHEIS) project no. 2006126.
176Annex 2Characterization of SES of the population at the settlement level:development of a deprivation <strong>in</strong>dexTo develop the deprivation <strong>in</strong>dex, socioeconomic <strong>in</strong>dicators were chosen at the settlement level from theM<strong>in</strong>istry of Local Government and Regional Development’s regional <strong>in</strong>formational system database.The data were derived orig<strong>in</strong>ally from the Hungarian Central Statistical Office (2001 census) and theHungarian Tax and F<strong>in</strong>ancial Control Adm<strong>in</strong>istration. The selected <strong>in</strong>dicators were:• <strong>in</strong>come (gross <strong>in</strong>come serv<strong>in</strong>g as a basis of personal <strong>in</strong>come tax per permanent head of population);• low qualification level (proportion of the total population older than 15 years with only basiceducation or illiterate);• unemployment (proportion of total population of work<strong>in</strong>g age);• s<strong>in</strong>gle-parent families (proportion of families with children);• large families (proportion of families with three or more children);• density of hous<strong>in</strong>g (number of people per room);• car ownership (passenger cars per 100 <strong>in</strong>habitants).Fig. 8. Spatial distribution of SES <strong>in</strong> the settlements, banded by quartileThe variables were transformed us<strong>in</strong>g natural log transformation and standardization. Each variable wasstandardized as a z-score based on <strong>in</strong>dividual observations, the arithmetic mean of all observations, andthe standard deviation. The weight of each <strong>in</strong>dicator was determ<strong>in</strong>ed from the statistical relationshipsbetween them. Individual weights were estimated us<strong>in</strong>g factor analysis. The area-specific <strong>in</strong>dex wascalculated as a weighted sum of the z-scores, with higher values represent<strong>in</strong>g greater deprivation: apositive <strong>in</strong>dex <strong>in</strong>dicates that the SES is lower than the average, and the converse was shown by negative<strong>in</strong>dex values. 21The descriptive ecological study was carried out us<strong>in</strong>g Rapid Inquiry Facility (RIF) software and thespatial <strong>in</strong>equality of morbidity was def<strong>in</strong>ed by the RIF “disease mapp<strong>in</strong>g” tool, expressed as relative risksobta<strong>in</strong>ed by us<strong>in</strong>g the empirical Bayes method. Investigation of the association between deprivation and21 Juhász A et al. (2010). Development of a Deprivation Index and its relation to premature mortality due to diseases of the circulatory system <strong>in</strong>Hungary, 1998–2004. Social Science & Medic<strong>in</strong>e, 70(9):1342–9.
<strong>Environmental</strong> health <strong>in</strong>equalities <strong>in</strong> <strong>Europe</strong> 177the spatial distribution of morbidity from diseases of the respiratory system <strong>in</strong> Hungary was carriedout us<strong>in</strong>g the RIF “risk analysis” tool. In the risk analysis module the settlements were grouped <strong>in</strong>todeprivation quartiles, and morbidity rates and risks were calculated for each quartile. Chi-square testsfor homogeneity and for l<strong>in</strong>ear trend were implemented to test global associations of the deprivation<strong>in</strong>dex and relative risk of morbidity from diseases of the respiratory system.ResultsDistribution of socially disadvantaged areasTwo large deprived areas were identified <strong>in</strong> the north-eastern/eastern and south-western sections ofHungary. Parts of counties Borsod-Abaúj-Zemplén and Szabolcs-Szatmár-Bereg <strong>in</strong> the north-eastproved to be the most deprived and underdeveloped parts of the country (see Fig. 8).Distribution of respiratory diseasesBudapest proved to be the have the lowest risk of respiratory disease <strong>in</strong> Hungary. High-risk areas wereobserved <strong>in</strong> the north-east for chronic bronchitis (see Fig. 9) and asthmatic symptoms <strong>in</strong> both sexes, and<strong>in</strong> the central Hungarian region for allergies.Fig. 9. Territorial <strong>in</strong>equalities of acute bronchitis symptoms <strong>in</strong> the settlementsComb<strong>in</strong>ation of social statistics and disease riskAs a result of ecological risk analysis, a significant association was detected between the SES quartilesand the relative risk of the diseases and symptoms <strong>in</strong>vestigated. An upward trend was observed <strong>in</strong> therisk of morbidity from diseases of the respiratory system by the degree of deprivation (see Fig. 10).This study <strong>in</strong>dicated that allergic and asthmatic symptoms <strong>in</strong> children, as well as symptoms of bronchitis,are more frequent <strong>in</strong> socially deprived areas of the country. The f<strong>in</strong>d<strong>in</strong>gs also contradict previous evidencethat allergic diseases are more common among wealthier populations.
178Annex 2Fig. 10. The impact of SES on acute bronchitisRelative risk of acute bronchitis symptomsMalesFemales2.231.821.491.2210.820.670.55-2.5 -2 -1.5 -1 -0.5 0 0.5 1 1.5 2 2.5SESConclusionsThe data show that low levels of education, unemployment, low <strong>in</strong>come and high rates of exposureto passive smok<strong>in</strong>g (supported by the questionnaire data) significantly contribute to the respiratorymorbidity of children.Based on the results of this and other similar <strong>in</strong>equality-driven surveys, specific and regionallytargetedmeasures should be taken to decrease social <strong>in</strong>equalities <strong>in</strong> Hungary <strong>in</strong> order to lower the riskof respiratory diseases <strong>in</strong> deprived areas of the country. The regional “clos<strong>in</strong>g-up” programmes of theNational Development Plan should also tackle this issue. <strong>Health</strong> promotion campaigns should focus onrais<strong>in</strong>g parental awareness, draw<strong>in</strong>g attention to the impacts of passive smok<strong>in</strong>g.
ANNEX3Assessment OFPRIORITY AREAS FORNATIONAL ACTION
180 Annex 3. Country rank<strong>in</strong>g of priority areas for national actionAnnex 3. Assessment of priority areas fornational actionHous<strong>in</strong>g-related <strong>in</strong>equalitiesIndicator Inadequatewater supplyInequality dimension By urban/ruralpopulationComments oncalculation of <strong>in</strong>equalityrank<strong>in</strong>gLack of flush toilet <strong>in</strong> dwell<strong>in</strong>g Lack of bath or shower <strong>in</strong>dwell<strong>in</strong>gOvercrowd<strong>in</strong>g Dampness <strong>in</strong> the home Inability to keep home warm<strong>in</strong> w<strong>in</strong>terFig. 3 Fig. 5 Fig. 6 Fig. 9 Fig. 10 Fig. 11 Fig. 12 Fig. 13 Fig. 14 Fig. 15 Fig. 17 Fig. 19Impossibledue to largenumber ofcountries withfull coverageBy relativepoverty levelInequalityratio: <strong>in</strong>comebelow/aboverelativepovertythresholdDisadvantaged group Rural areas Below relativepoverty level(all report<strong>in</strong>gcountries)By householdtypeInequalityratio: s<strong>in</strong>gleparenthouseholds/allhouseholdsBalanced:s<strong>in</strong>gle-parenthouseholds<strong>in</strong> 14, allhouseholds <strong>in</strong>16 countriesBy <strong>in</strong>comequ<strong>in</strong>tileInequalityratio: lowest/highest<strong>in</strong>comequ<strong>in</strong>tileLowest <strong>in</strong>comequ<strong>in</strong>tile (29 of30 countries)By householdtypeInequalityratio: s<strong>in</strong>gleparenthouseholds/all householdswith childrenS<strong>in</strong>gle-parenthouseholds(24 of 30countries)By householdtypeInequalityratio: s<strong>in</strong>gleparenthousehold/allhouseholdsS<strong>in</strong>gle-parenthouseholds(29 of 30countries)By <strong>in</strong>comequ<strong>in</strong>tileInequalityratio: lowest/highest<strong>in</strong>comequ<strong>in</strong>tileLowest <strong>in</strong>comequ<strong>in</strong>tile (allreport<strong>in</strong>gcountries)AlbaniaAndorraArmeniaAustria *AzerbaijanBelarusBelgiumBosnia and Herzegov<strong>in</strong>aBulgaria * *CroatiaCyprus * *Czech Republic *DenmarkEstonia *F<strong>in</strong>landFrance *By householdtypeInequalityratio: s<strong>in</strong>gleparenthousehold/allhouseholdsS<strong>in</strong>gle-parenthouseholds(28 of 30countries)By <strong>in</strong>comequ<strong>in</strong>tileInequalityratio: lowest/highest<strong>in</strong>comequ<strong>in</strong>tileLowest <strong>in</strong>comequ<strong>in</strong>tile (allreport<strong>in</strong>gcountries)By relativepoverty levelInequalityratio: <strong>in</strong>comebelow/aboverelativepovertythresholdBelow relativepoverty level(all report<strong>in</strong>gcountries)By householdtypeInequalityratio: highest/lowestprevalencerate of threehouseholdtypesS<strong>in</strong>gle-parenthouseholds(23 of 30countries)Inability tokeep homecool <strong>in</strong>summerBy <strong>in</strong>comequ<strong>in</strong>tileInequalityratio: lowest/highest<strong>in</strong>comequ<strong>in</strong>tileLowest <strong>in</strong>comequ<strong>in</strong>tile (25 of27 countries)
<strong>Environmental</strong> health <strong>in</strong>equalities <strong>in</strong> <strong>Europe</strong> 181GeorgiaGermanyGreece * * *Hungary * * *Iceland *Ireland *IsraelItaly *KazakhstanKyrgyzstanLatvia *Lithuania *Luxembourg *MaltaMKD [a]MonacoMontenegroNetherlandsNorway *PolandPortugal *Republic of MoldovaRomania *Russian FederationSan Mar<strong>in</strong>oSerbiaSlovakia * *SloveniaSpa<strong>in</strong>Sweden *SwitzerlandTajikistanTurkeyTurkmenistanUkra<strong>in</strong>eUnited K<strong>in</strong>gdom * *UzbekistanLegend:Countries with suggested priority for national action (def<strong>in</strong>ed as countries be<strong>in</strong>g <strong>in</strong> the fourth quartile for both the absolute and the relative <strong>in</strong>equality dimensions, or <strong>in</strong>For details, please see the third quartile for one and <strong>in</strong> the fourth quartile for the other <strong>in</strong>equality dimension)method example <strong>in</strong> Countries that would be classified as hav<strong>in</strong>g a suggested priority for national action if they fell <strong>in</strong>to a higher quartile for just one of the two <strong>in</strong>equality dimensionsChapter 6.Countries with no suggested priority for national actionMiss<strong>in</strong>g dataNotes: * Inequality ratio reversed; [a] ISO code for the former Yugoslav Republic of Macedonia.
182 Annex 3. Country rank<strong>in</strong>g of priority areas for national actionInjury-related <strong>in</strong>equalitiesIndicator Work-related <strong>in</strong>juries Fatal transport-related <strong>in</strong>juries Un<strong>in</strong>tentional fatal poison<strong>in</strong>g Fatal fallsFig. 21 Fig. 23 Fig. 25b Fig. 25a Fig. 26 Fig. 29 Table 6 Table 6 Fig. 32Inequality dimension By sex By age group Mortality rate of alltransport <strong>in</strong>juriesby age groupComments on calculation of<strong>in</strong>equality rank<strong>in</strong>gInequality ratio:male/femaleDisadvantaged group Males (all report<strong>in</strong>gcountries)AlbaniaAndorraArmeniaAustriaAzerbaijanBelarusBelgiumBosnia and Herzegov<strong>in</strong>aBulgariaCroatiaCyprusCzech RepublicDenmarkEstoniaF<strong>in</strong>landFranceGeorgiaGermanyGreeceHungaryIcelandIrelandIsraelItalyKazakhstanInequality ratio:highest/lowest<strong>in</strong>cidence of threeage groupsInequality ratio:highest/lowestmortality rate offour age groupsRTI mortality rateby age groupInequality ratio:highest/lowestmortality rate offour age groupsRTI mortality rateby sexInequality ratio:male/femaleVaries strongly Varies strongly Varies strongly Males (all report<strong>in</strong>gcountries)Poison<strong>in</strong>g mortalityrate (all causes)by sexInequality ratio:male/femaleMales (all report<strong>in</strong>gcountries)Poison<strong>in</strong>g mortalityrate (exclud<strong>in</strong>galcohol poison<strong>in</strong>g)by sexInequality ratio:male/femaleMales (all report<strong>in</strong>gcountries)Alcohol poison<strong>in</strong>gmortality rate bysexInequality ratio:male/femaleMales (27 of 28countries)Fall mortality rateby sexInequality ratio:male/femaleMales (all report<strong>in</strong>gcountries)
<strong>Environmental</strong> health <strong>in</strong>equalities <strong>in</strong> <strong>Europe</strong> 183KyrgyzstanLatviaLithuaniaLuxembourgMaltaMKD [a]MonacoMontenegroNetherlands *NorwayPolandPortugalRepublic of MoldovaRomaniaRussian FederationSan Mar<strong>in</strong>oSerbiaSlovakiaSloveniaSpa<strong>in</strong>SwedenSwitzerlandTajikistanTurkeyTurkmenistanUkra<strong>in</strong>eUnited K<strong>in</strong>gdom [b] [b]UzbekistanLegend:Countries with suggested priority for national action (def<strong>in</strong>ed as countries be<strong>in</strong>g <strong>in</strong> the fourth quartile for both the absolute and the relative <strong>in</strong>equality dimensions, orFor details, please see method <strong>in</strong> the third quartile for one and <strong>in</strong> the fourth quartile for the other <strong>in</strong>equality dimension)example <strong>in</strong> Chapter 6. Countries that would be classified as hav<strong>in</strong>g a suggested priority for national action if they fell <strong>in</strong>to a higher quartile for just one of the two <strong>in</strong>equality dimensionsCountries with no suggested priority for national actionMiss<strong>in</strong>g dataNotes: * Inequality ratio reversed; [a] ISO code for the former Yugoslav Republic of Macedonia; [b] data for work <strong>in</strong>juries are based on values for Great Brita<strong>in</strong> as UK data are not available.
184 Annex 3. Country rank<strong>in</strong>g of priority areas for national actionEnvironment-related <strong>in</strong>equalitiesIndicator Noise exposureat homeLack of access to recreational or green areas Second-hand smoke exposure at home Second-hand smoke exposure at workInequality dimension By relativepoverty levelComments on calculation of<strong>in</strong>equality rank<strong>in</strong>gFig. 34 Fig. 36 Fig. 36 Fig. 37 Fig. 39 Fig. 39 Fig. 40 Fig. 42 Fig. 42 Fig. 43By occupationInequality ratio:<strong>in</strong>come below/above relativepoverty thresholdDisadvantaged group Below relativepoverty level (24of 30 countries)By sex By <strong>in</strong>comequartileInequality ratio:female/maleFemales (19 of 31countries)Inequality ratio:lowest/highest<strong>in</strong>come quartileHighest <strong>in</strong>comequartile (18 of 31countries)By difficultypay<strong>in</strong>g billsInequality ratio:difficulty pay<strong>in</strong>gbills most of time/no difficultyDifficulty pay<strong>in</strong>gbills most oftime (23 of 31countries)By sex By self-assessedsocial positionInequality ratio:female/maleBalanced:females <strong>in</strong> 16,males <strong>in</strong> 14countriesInequality ratio:low/high socialpositionLow socialposition (26 of 30countries)By difficultypay<strong>in</strong>g billsInequality ratio:difficulty pay<strong>in</strong>gbills most of time/no difficultyDifficulty pay<strong>in</strong>gbills most oftime (24 of 28countries)By sex By self-assessedsocial positionInequality ratio:male/femaleMales (25 of 30countries)Inequality ratio:low/high socialpositionLow socialposition (21 of 28countries)AlbaniaAndorraArmeniaAustria * * * * *Inequality ratio:manual worker/managerManual workers(25 of 30countries)AzerbaijanBelarusBelgium *Bosnia and Herzegov<strong>in</strong>aBulgaria * *Croatia * * * *Cyprus * * * *Czech Republic *Denmark *Estonia * * *F<strong>in</strong>land * *France * *GeorgiaGermany *Greece * * * * * *Hungary * * * * *IcelandIreland *IsraelItalyKazakhstan
<strong>Environmental</strong> health <strong>in</strong>equalities <strong>in</strong> <strong>Europe</strong> 185KyrgyzstanLatvia *Lithuania * * * * *Luxembourg * *Malta * *MKD [a] * * *MonacoMontenegroNetherlands * *Norway *Poland * * * * *Portugal * * * * *Republic of MoldovaRomania * * * * *Russian FederationSan Mar<strong>in</strong>oSerbiaSlovakia * * *Slovenia *Spa<strong>in</strong> * *Sweden * * *SwitzerlandTajikistanTurkey * * * *TurkmenistanUkra<strong>in</strong>eUnited K<strong>in</strong>gdom *UzbekistanLegend:Countries with suggested priority for national action (def<strong>in</strong>ed as countries be<strong>in</strong>g <strong>in</strong> the fourth quartile for both the absolute and the relative <strong>in</strong>equality dimensions, orFor details, please see method <strong>in</strong> the third quartile for one and <strong>in</strong> the fourth quartile for the other <strong>in</strong>equality dimension)example <strong>in</strong> Chapter 6. Countries that would be classified as hav<strong>in</strong>g a suggested priority for national action if they fell <strong>in</strong>to a higher quartile for just one of the two <strong>in</strong>equality dimensionsCountries with no suggested priority for national actionMiss<strong>in</strong>g dataNotes: * Inequality ratio reversed; [a] ISO code for the former Yugoslav Republic of Macedonia.
ANNEX4COUNTRYABBREVIATIONS
188 Annex 4. Country abbreviationsAnnex 4. CountryabbreviationsALBAlbaniaLTULithuaniaANDAndorraLUXLuxembourgARMArmeniaMATMaltaAUTAustriaMONMonacoAZEAzerbaijanMNEMontenegroBLRBelarusNETNetherlandsBELBelgiumNORNorwayBIHBosnia and Herzegov<strong>in</strong>aPOLPolandBULBulgariaPORPortugalCROCroatiaMDARepublic of MoldovaCYPCyprusROMRomaniaCZHCzech RepublicRUSRussian FederationDENDenmarkSMRSan Mar<strong>in</strong>oESTEstoniaSRBSerbiaFINF<strong>in</strong>landSVKSlovakiaFRAFranceSVNSloveniaGEOGeorgiaSPASpa<strong>in</strong>DEUGermanySWESwedenGREGreeceSWISwitzerlandHUNHungaryTJKTajikistanICEIREISRITAKAZKGZLVAIcelandIrelandIsraelItalyKazakhstanKyrgyzstanLatviaMKDTURTKMUKRUNKUZBThe former Yugoslav Republic ofMacedonia (ISO code)TurkeyTurkmenistanUkra<strong>in</strong>eUnited K<strong>in</strong>gdomUzbekistan
ANNEX5Abbreviations
190 Annex 5. AbbreviationsAnnex 5. AbbreviationsAPATCOCSDHDALYdB(A)DMDBEHESPENHISEQLSEUEU-SILCEU15EU27EWDFEANTSAGBDGerES IVGISHiAPICD-10iFINERISINSEEISO<strong>Environmental</strong> Protection Agency(of Italy)carbon monoxideCommission on Social Determ<strong>in</strong>antsof <strong>Health</strong>disability-adjusted life yearA-weighted decibels<strong>Europe</strong>an detailed mortality databaseSchool of Public <strong>Health</strong> (of France)Environment and <strong>Health</strong>Information System<strong>Europe</strong>an Quality of Life Survey<strong>Europe</strong>an UnionEU Statistics on Income and Liv<strong>in</strong>gConditionsthe 15 countries belong<strong>in</strong>g to the EUbefore May 2004the 27 countries belong<strong>in</strong>g to the EUafter January 2007excess w<strong>in</strong>ter death<strong>Europe</strong>an Federation of NationalOrganisations work<strong>in</strong>g with theHomelessglobal burden of diseaseGerman <strong>Environmental</strong> Survey2003/6 for Childrengeographical <strong>in</strong>formation system<strong>Health</strong> <strong>in</strong> all policiesWHO International StatisticalClassification of Diseases andRelated <strong>Health</strong> Problems, tenthrevision<strong>in</strong>take fractionNational Institute for IndustrialEnvironment and Risks (of France)National Institute of Statistics andEconomic Studies (of France)International <strong>Organization</strong> forStandardizationJMP Jo<strong>in</strong>t Monitor<strong>in</strong>g Programme (forWater Supply and Sanitation)KiGGS German <strong>Health</strong> Survey for Childrenand AdolescentsMDB <strong>Europe</strong>an mortality databaseMKD ISO code for the former YugoslavRepublic of MacedoniaMTL1 mortality tabulation list 1NEHAP National <strong>Environmental</strong> <strong>Health</strong>Action PlanNMS12 the 12 new Member States whichjo<strong>in</strong>ed the <strong>Europe</strong>an Union <strong>in</strong> 2004and 2007NUTS Nomenclature of Units for TerritorialStatisticsOECD Organisation for Economic Cooperationand DevelopmentOHCHR Office of the High Commissionerfor Human RightsPM 2.5particulate matter with anaerodynamic diameter smaller than2.5 µmPRTR Pollutant Release and TransferRegisterPTSD post-traumatic stress disorderRIF Rapid Inquiry Facility (software)RTI road traffic <strong>in</strong>jurySES socioeconomic statusSLC Survey of Liv<strong>in</strong>g Conditions (ofNorway)SNIFFER Scottish and Northern IrelandForum for <strong>Environmental</strong> ResearchSR sex ratioUNDP United Nations DevelopmentProgrammeUNECE United Nations EconomicCommission for <strong>Europe</strong>
Recent debate on the social determ<strong>in</strong>ants of health has <strong>in</strong>dicated that the unequaldistribution of health and well-be<strong>in</strong>g <strong>in</strong> national populations is a major challengefor public health governance. This is equally true for environmental health conditionsand for exposure to environmental risk, which varies strongly by a range ofsociodemographic determ<strong>in</strong>ants and thus causes <strong>in</strong>equalities <strong>in</strong> exposure to – andpotentially <strong>in</strong> disease result<strong>in</strong>g from – environmental conditions.Interventions tackl<strong>in</strong>g such environmental health <strong>in</strong>equalities need to be based onan assessment of their magnitude and on the identification of population groupsthat are most exposed or most vulnerable to environmental risks. However, data toquantify the environmental health <strong>in</strong>equality situation are not abundant, mak<strong>in</strong>gcomprehensive assessments difficult at both national and <strong>in</strong>ternational levels.Follow<strong>in</strong>g up on the commitments made by Member States at the Fifth M<strong>in</strong>isterialConference on Environment and <strong>Health</strong> <strong>in</strong> Parma, Italy (2010), the WHORegional Office for <strong>Europe</strong> has carried out a basel<strong>in</strong>e assessment of the magnitudeof environmental health <strong>in</strong>equality <strong>in</strong> the <strong>Europe</strong>an Region based on a core set of14 <strong>in</strong>equality <strong>in</strong>dicators. The ma<strong>in</strong> f<strong>in</strong>d<strong>in</strong>gs of the assessment report <strong>in</strong>dicate thatsocioeconomic and demographic <strong>in</strong>equalities <strong>in</strong> risk exposure are present <strong>in</strong> allcountries and need to be tackled throughout the Region. However, the report alsodemonstrates that each country has a specific portfolio of <strong>in</strong>equalities, document<strong>in</strong>gthe need for country-specific <strong>in</strong>equality assessments and tailored <strong>in</strong>terventionson the national priorities.<strong>World</strong> <strong>Health</strong> <strong>Organization</strong>Regional Office for <strong>Europe</strong>Scherfigsvej 8, DK-2100 Copenhagen Ø, DenmarkTel.: +45 39 17 17 17. Fax: +45 39 17 18 18E-mail: contact@euro.who.<strong>in</strong>tWeb site: www.euro.who.<strong>in</strong>t