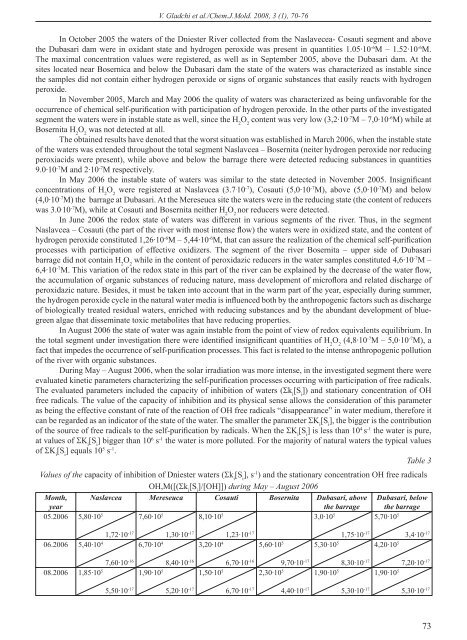
V. Gladchi et al./Chem.J.Mold. 2008, 3 (1), 70-76In October 2005 the waters <strong>of</strong> the Dniester River collected from the Naslavecea- Cosauti segment and abovethe Dubasari dam were in oxidant state and hydrogen peroxide was present in quantities 1.05·10 -6 M – 1.52·10 -6 M.The maximal concentration values were registered, as well as in September 2005, above the Dubasari dam. At thesites located near Bosernica and below the Dubasari dam the state <strong>of</strong> the waters was characterized as instable sincethe samples did not contain either hydrogen peroxide or signs <strong>of</strong> organic substances that easily reacts with hydrogenperoxide.In November 2005, March and May 2006 the quality <strong>of</strong> waters was characterized as being unfavorable for theoccurrence <strong>of</strong> chemical self-purification with participation <strong>of</strong> hydrogen peroxide. In the other parts <strong>of</strong> the investigatedsegment the waters were in instable state as well, since the H 2O 2content was very low (3,2·10 -7 M – 7,0·10 -6 M) while atBosernita H 2O 2was not detected at all.The obtained results have denoted that the worst situation was established in March 2006, when the instable state<strong>of</strong> the waters was extended throughout the total segment Naslavcea – Bosernita (neiter hydrogen peroxide nor reducingperoxiacids were present), while above and below the barrage there were detected reducing substances in quantities9.0·10 -7 M and 2·10 -7 M respectively.In May 2006 the instable state <strong>of</strong> waters was similar to the state detected in November 2005. Insignificantconcentrations <strong>of</strong> H 2O 2were registered at Naslavcea (3.7 . 10 -7 ), Cosauti (5,0·10 -7 M), above (5,0·10 -7 M) and below(4,0·10 -7 M) the barrage at Dubasari. At the Mereseuca site the waters were in the reducing state (the content <strong>of</strong> reducerswas 3.0 . 10 -7 M), while at Cosauti and Bosernita neither H 2O 2nor reducers were detected.In June 2006 the redox state <strong>of</strong> waters was different in various segments <strong>of</strong> the river. Thus, in the segmentNaslavcea – Cosauti (the part <strong>of</strong> the river with most intense flow) the waters were in oxidized state, and the content <strong>of</strong>hydrogen peroxide constituted 1,26·10 -6 M – 5,44·10 -6 M, that can assure the realization <strong>of</strong> the chemical self-purificationprocesses with participation <strong>of</strong> effective oxidizers. The segment <strong>of</strong> the river Bosernita – upper side <strong>of</strong> Dubasaribarrage did not contain H 2O 2while in the content <strong>of</strong> peroxidazic reducers in the water samples constituted 4,6·10 -7 M –6,4·10 -7 M. This variation <strong>of</strong> the redox state in this part <strong>of</strong> the river can be explained by the decrease <strong>of</strong> the water flow,the accumulation <strong>of</strong> organic substances <strong>of</strong> reducing nature, mass development <strong>of</strong> micr<strong>of</strong>lora and related discharge <strong>of</strong>peroxidazic nature. Besides, it must be taken into account that in the warm part <strong>of</strong> the year, especially during summer,the hydrogen peroxide cycle in the natural water media is influenced both by the anthropogenic factors such as discharge<strong>of</strong> biologically treated residual waters, enriched with reducing substances and by the abundant development <strong>of</strong> bluegreenalgae that disseminate toxic metabolites that have reducing properties.In August 2006 the state <strong>of</strong> water was again instable from the point <strong>of</strong> view <strong>of</strong> redox equivalents equilibrium. Inthe total segment under investigation there were identified insignificant quantities <strong>of</strong> H 2O 2(4,8·10 -7 M – 5,0·10 -7 M), afact that impedes the occurrence <strong>of</strong> self-purification processes. This fact is related to the intense anthropogenic pollution<strong>of</strong> the river with organic substances.During May – August 2006, when the solar irradiation was more intense, in the investigated segment there wereevaluated kinetic parameters characterizing the self-purification processes occurring with participation <strong>of</strong> free radicals.The evaluated parameters included the capacity <strong>of</strong> inhibition <strong>of</strong> waters (k i[S i]) and stationary concentration <strong>of</strong> OHfree radicals. The value <strong>of</strong> the capacity <strong>of</strong> inhibition and its physical sense allows the consideration <strong>of</strong> this parameteras being the effective constant <strong>of</strong> rate <strong>of</strong> the reaction <strong>of</strong> OH free radicals “disappearance” in water medium, therefore itcan be regarded as an indicator <strong>of</strong> the state <strong>of</strong> the water. The smaller the parameter K i[S i], the bigger is the contribution<strong>of</strong> the source <strong>of</strong> free radicals to the self-purification by radicals. When the K i[S i] is less than 10 4 s -1 the water is pure,at values <strong>of</strong> K i[S i] bigger than 10 6 s -1 the water is more polluted. For the majority <strong>of</strong> natural waters the typical values<strong>of</strong> K i[S i] equals 10 5 s -1 .Table 3Values <strong>of</strong> the capacity <strong>of</strong> inhibition <strong>of</strong> Dniester waters (k i[S i], s -1 ) and the stationary concentration OH free radicalsOH,M([(k i[S i]/[OH]]) during May – August 2006Month,yearNaslavcea Mereseuca Cosauti Bosernita Dubasari, abovethe barrageDubasari, belowthe barrage05.2006 5,80·10 5 1,72·10 -17 7,60·10 5 1,30·10 -17 8,10·10 5 1,23·10 -17 3,0·10 5 1,75·10 -17 5,70·10 5 3,4·10 -1706.2006 5,40·10 4 7,60·10 -16 6,70·10 4 8,40·10 -16 3,20·10 4 6,70·10 -16 5,60·10 5 9,70·10 -17 5,30·10 5 8,30·10 -17 4,20·10 5 7,20·10 -1708.2006 1,85·10 5 5,50·10 -17 1,90·10 5 5,20·10 -17 1,50·10 5 6,70·10 -17 2,30·10 5 4,40·10 -17 1,90·10 5 5,30·10 -17 1,90·10 5 5,30·10 -1773
V. Gladchi et al./Chem.J.Mold. 2008, 3 (1), 70-76In May 2006 the Dniester water were in normal state from the point <strong>of</strong> view <strong>of</strong> chemical self-purification byfree radicals (see table). The parameter K i[S i] had values <strong>of</strong> the order 10 5 s -1 , while the stationary content <strong>of</strong> OH freeradicals was varying in the limits 1.30 ·10 -17 M – 3.40 ·10 -17 M. More intensively the processes <strong>of</strong> self-purification byradicals were taking place below the Dubasari barrage (k i[S i] = 3,0·10 5 s -1 ), and least intensively at Mereseuca andCosauti (k i[S i] = 7.6·10 5 s -1 and 8.10·10 5 s -1 ).In June 2006 the waters <strong>of</strong> the segment Naslavcea – Cosauti were characterized by high purity since the values <strong>of</strong>the capacity <strong>of</strong> inhibition constituting 3.20·10 4 – 6.70·10 4 s -1 . The sector Bosernita – upper side <strong>of</strong> the Dubasari barragewas also considered favorable for the occurrence <strong>of</strong> intense self-purification processes. The values <strong>of</strong> the capacity <strong>of</strong>inhibition were in the limits <strong>of</strong> the order 10 5 s -1 .In August 2006 the values <strong>of</strong> the capacity <strong>of</strong> inhibition constituted 2.0 . 10 5 s -1 (1.50·10 5 – 1.90·10 5 s -1 ) in all thesampling sites, except at Bosernita where k i[S i] = 2.3·10 5 s -1 . This fact denotes that in August the values <strong>of</strong> the capacity<strong>of</strong> inhibition <strong>of</strong> Dniester waters indicated a normal occurrence <strong>of</strong> self-purification process with participation <strong>of</strong> freeradicals.The self-purification processes <strong>of</strong> Dniester waters occur with participation <strong>of</strong> OH free radicals and during theseasons with high solar activity this process occur in normal conditions and the observations prove that the capacity <strong>of</strong>inhibition <strong>of</strong> waters indicate a normal state <strong>of</strong> waters. The investigated segment <strong>of</strong> the river have shown the followingcorrelation between redox agents (Table 4).Table 4The correlation equations and correlation coefficients <strong>of</strong> the redox parametersCorrelation parameters Correlation equations Correlation coefficientsNaslavcea[H 2O 2] =ƒrH [H 2O 2] = 1.45·10 -6·rH-3.94·10-5 r = 0.7[H 2O 2] =ƒ(CBO) [H 2O 2] = 6,68·10 -7·CBO – 6.24·10 -7 r = 0.7[H 2O 2] =ƒ(%O 2) [H 2O 2] = 4.23·10 -8·(%O 2) – 3.43·10 -6 r = 0.43-rH = ƒ[PO 4]3-rH =1.20·[PO 4] + 26.55 r = 0.4rH = ƒ(%O 2) rH = 0.01·(%O 2) + 26.00 r = 0.6[NO 2-]= ƒ[O 2] [NO 2] = 0.002·[O 2] +0.008 r = 0.3CBO= ƒ[O 2] CBO = 0.259·[O 2] +1.164 r = 0.6MereseucaCBO= ƒ[O 2] CBO = 0,49·[O 2] – 2,345 r = 0,7[NO 2-]= ƒ[O 2] [NO 2] = 0,003·[O 2] - 3,49·10 -6 r = 0,4BosernitarH = ƒ(%O 2) rH = 0,02·(%O 2) + 26,09 r = 0,5rH = ƒ(pH) rH = 1,76·pH +14,17 r = 0,9[H 2O 2] =ƒ(%O 2) [H 2O 2] = 1,73·10 -8·(%O 2) – 1,54·10 -6 r = 0,8[NO 2-]= ƒ[O 2] [NO 2-] = 0,002·[O 2] + 0,002 r = 0,5Cosauti[H 2O 2] =ƒ(CBO) [H 2O 2] = 2,24·10 -7·CBO + 2,66·10 -7 r = 0,5[H 2O 2] =ƒ(%O 2) [H 2O 2] = 9,13·10 -9·(%O 2) – 1,39·10 -7 r = 0,4rH = ƒ[NO 2-] rH = 9,99·[NO 2-] + 27,75 r = 0,6rH = ƒ[O 2] rH = 0,06·[O 2] + 27, 72 r = 0,6CBO= ƒ[O 2] CBO = 0,16·[O 2] + 1,26 r = 0,3Dubasari, above the damCBO= ƒ[O 2] CBO = 0,63·[O 2] – 2,303 r = 0,7[NO 2-]= ƒ[O 2] [NO 2-] = 0,003·[O 2] - 0,0008 r = 0,3Dubasari, below the damrH = ƒ(pH) rH = 2,16·pH +9,13 r = 0,5rH = ƒ[O 2] rH = 0,38·[O 2] + 22,75 r = 0,4ConclusionsThe investigations carried out in the segment Naslavcea (below the barrage <strong>of</strong> the buffer reservoir) and Dubasari(below the barrage at) allowed the drawing <strong>of</strong> following conclusions.The oxygen regime <strong>of</strong> Dniester was characterized by following peculiarities:The content <strong>of</strong> dissolved oxygen in the waters <strong>of</strong> Naslavcea was always lower than in other sections <strong>of</strong> the river.The normal saturation <strong>of</strong> Dniester waters at this section line occurred only in spring, although in summer and in autumnthe saturation <strong>of</strong> waters was permanently below the norms, constituting in average 70.5% in summer and 79.5% inautumn.74
- Page 7:
Chemistry Journal of Moldova. Gener
- Page 10:
Chemistry Journal of Moldova. Gener
- Page 14 and 15:
Gh. Duca et al./Chem.J. Mold.. 2008
- Page 16 and 17:
Gh. Duca et al./Chem.J. Mold.. 2008
- Page 20 and 21:
Gh. Duca et al./Chem.J. Mold.. 2008
- Page 22 and 23:
Gh. Duca et al./Chem.J. Mold.. 2008
- Page 24 and 25: Gh. Duca et al./Chem.J. Mold.. 2008
- Page 26 and 27: Gh. Duca et al./Chem.J. Mold.. 2008
- Page 28 and 29: Gh. Duca et al./Chem.J. Mold.. 2008
- Page 30 and 31: Gh. Duca et al./Chem.J. Mold.. 2008
- Page 32 and 33: Chemistry Journal of Moldova. Ion D
- Page 34 and 35: Ion Dranca/Chem.J. Mold. 2008, 3 (1
- Page 36 and 37: Ion Dranca/Chem.J. Mold. 2008, 3 (1
- Page 38 and 39: Ion Dranca/Chem.J. Mold. 2008, 3 (1
- Page 40 and 41: Ion Dranca/Chem.J. Mold. 2008, 3 (1
- Page 42 and 43: Ion Dranca/Chem.J. Mold. 2008, 3 (1
- Page 44 and 45: Ion Dranca/Chem.J. Mold. 2008, 3 (1
- Page 46 and 47: M. Revenco et al./Chem.J. Mold. 200
- Page 48 and 49: M. Revenco et al./Chem.J. Mold. 200
- Page 50 and 51: Gh. Zgherea/Chem.J. Mold. 2008, 3 (
- Page 52 and 53: Gh. Zgherea/Chem.J. Mold. 2008, 3 (
- Page 54 and 55: Gh. Zgherea/Chem.J. Mold. 2008, 3 (
- Page 56 and 57: Gh. Zgherea/Chem.J. Mold. 2008, 3 (
- Page 58 and 59: G. Vasile et al./Chem.J. Mold. 2008
- Page 60 and 61: G. Vasile et al./Chem.J. Mold. 2008
- Page 62 and 63: G. Vasile et al./Chem.J. Mold. 2008
- Page 64 and 65: V. Mukhin et al./Chem.J.Mold. 2008,
- Page 66 and 67: V. Mukhin et al./Chem.J.Mold. 2008,
- Page 68 and 69: Chemistry Journal of Moldova. N. Ku
- Page 70 and 71: N. Kulikov et al./Chem.J.Mold. 2008
- Page 72 and 73: V. Gladchi et al./Chem.J.Mold. 2008
- Page 76 and 77: V. Gladchi et al./Chem.J.Mold. 2008
- Page 78 and 79: Chemistry Journal of Moldova. R. St
- Page 80 and 81: R. Sturza et al./Chem.J.Mold. 2008,
- Page 82 and 83: R. Sturza et al./Chem.J.Mold. 2008,
- Page 84 and 85: R. Sturza et al./Chem.J.Mold. 2008,
- Page 86 and 87: Chemistry Journal of Moldova. V. Bo
- Page 88 and 89: V. Boldescu et al./Chem.J.Mold. 200
- Page 90 and 91: Chemistry Journal of Moldova. I. Lu
- Page 92 and 93: I. Lunga et al./Chem.J.Mold. 2008,
- Page 94 and 95: I. Lunga et al./Chem.J.Mold. 2008,
- Page 96 and 97: N.Gorinchoy et al./Chem.J.Mold. 200
- Page 98 and 99: N.Gorinchoy et al./Chem.J.Mold. 200
- Page 100 and 101: N.Gorinchoy et al./Chem.J.Mold. 200
- Page 102 and 103: N.Gorinchoy et al./Chem.J.Mold. 200
- Page 104 and 105: N.Gorinchoy et al./Chem.J.Mold. 200
- Page 106 and 107: Chemistry Journal of Moldova. N.Gor
- Page 108 and 109: N.Gorinchoy et al./Chem.J.Mold. 200
- Page 110 and 111: N.Gorinchoy et al./Chem.J.Mold. 200
- Page 112 and 113: N.Gorinchoy et al./Chem.J.Mold. 200
- Page 114 and 115: I. Ogurtsov, A. Tihonovschi / Chem.
- Page 116 and 117: I. Ogurtsov, A. Tihonovschi / Chem.
- Page 118 and 119: I. Ogurtsov, A. Tihonovschi / Chem.
- Page 120 and 121: M. Gonta et al./Chem.J.Mold. 2008,
- Page 122 and 123: M. Gonta et al./Chem.J.Mold. 2008,
- Page 124 and 125:
M. Gonta et al./Chem.J.Mold. 2008,
- Page 126 and 127:
M. Gonta et al./Chem.J.Mold. 2008,
- Page 128 and 129:
Chemistry Journal of Moldova. N. Se
- Page 130 and 131:
Chemistry Journal of Moldova. D. Ba
- Page 132 and 133:
D. Batîr/Chem.J.Mold. 2008, 3 (1),
- Page 134 and 135:
CHEMISTRY JOURNAL OF MOLDOVA.Genera
- Page 136 and 137:
CHEMISTRY JOURNAL OF MOLDOVA.Genera
- Page 138:
CHEMISTRY JOURNAL OF MOLDOVA.Genera