Statistics in the Courtroom: United States v. Kristen Gilbert George W ...
Statistics in the Courtroom: United States v. Kristen Gilbert George W ...
Statistics in the Courtroom: United States v. Kristen Gilbert George W ...
- No tags were found...

Create successful ePaper yourself
Turn your PDF publications into a flip-book with our unique Google optimized e-Paper software.
<strong>Statistics</strong> <strong>in</strong> <strong>the</strong> <strong>Courtroom</strong>: <strong>United</strong> <strong>States</strong> v. <strong>Kristen</strong> <strong>Gilbert</strong><strong>George</strong> W. Cobb and Stephen Gehlbach<strong>George</strong> Cobb (GCobb@MtHolyoke.edu) is Robert L. Rooke Professor of <strong>Statistics</strong> atMount Holyoke College. He is also currently Vice-President of <strong>the</strong> American StatisticalAssociation. He received an AB <strong>in</strong> Russian from Dartmouth, MS <strong>in</strong> Biometry from <strong>the</strong>Medical College of Virg<strong>in</strong>ia, and PhD <strong>in</strong> statistics from Harvard. His current <strong>in</strong>terests<strong>in</strong>clude statistics education, design of experiments, statistics and <strong>the</strong> law, Markov Cha<strong>in</strong>Monte Carlo, and DNA microarrays.Stephen Gehlbach is professor and Dean emeritus of <strong>the</strong> School of Public Health andHealth Sciences at <strong>the</strong> University of Massachusetts at Amherst. He is a cl<strong>in</strong>icalepidemiologist with an MD degree from Case-Western Reserve University and an MPHfrom <strong>the</strong> University of North Carol<strong>in</strong>a-Chapel Hill. Recent research activities have<strong>in</strong>volved develop<strong>in</strong>g statistical models for predict<strong>in</strong>g mortality <strong>in</strong> <strong>in</strong>tensive care units, andcl<strong>in</strong>ical recognition of osteoporosis and vertebral fracture.A nurse accused. By <strong>the</strong> mid-1990s, <strong>Kristen</strong> <strong>Gilbert</strong> had been work<strong>in</strong>g for several yearsas a nurse at <strong>the</strong> Veteran’s Adm<strong>in</strong>istration Hospital <strong>in</strong> Northampton, Massachusetts. Fora time, she had been one of <strong>the</strong> nurses <strong>the</strong> o<strong>the</strong>rs most often looked up to as an exampleof skill and competence. She had established a reputation for be<strong>in</strong>g particularly good <strong>in</strong> acrisis. If a patient went <strong>in</strong>to cardiac arrest, for example, she was often <strong>the</strong> first to noticethat someth<strong>in</strong>g was wrong. She would sound <strong>the</strong> “code blue” or code -- <strong>the</strong> signal thatbrought <strong>the</strong> aid of <strong>the</strong> resuscitation team. She stayed calm, and she knew how to give ashot of <strong>the</strong> stimulant ep<strong>in</strong>ephr<strong>in</strong>e, a syn<strong>the</strong>tic form of adrenal<strong>in</strong>e, to try to restart apatient’s heart. Often <strong>the</strong> adrenal<strong>in</strong>e did its job, <strong>the</strong> heart began to beat aga<strong>in</strong>, and <strong>the</strong>patient’s life was saved.Lately, though, o<strong>the</strong>r nurses had become <strong>in</strong>creas<strong>in</strong>gly suspicious that someth<strong>in</strong>g was notright. To some, it seemed that <strong>the</strong>re were too many codes called, too many crises, when<strong>Gilbert</strong> was on <strong>the</strong> ward. Over time, <strong>the</strong> suspicions became stronger. Several patientswho went <strong>in</strong>to arrest died, and to some of <strong>the</strong> staff, <strong>the</strong> number of deaths was a s<strong>in</strong>istersign. An <strong>in</strong>vestigation was launched. Although an <strong>in</strong>itial report by <strong>the</strong> VA found that <strong>the</strong>numbers of deaths were consistent with <strong>the</strong> patterns at o<strong>the</strong>r VA hospitals, <strong>the</strong> suspicionsof <strong>the</strong> staff rema<strong>in</strong>ed. Eventually, after additional <strong>in</strong>vestigation, <strong>in</strong>clud<strong>in</strong>g a statisticalanalysis by one of us (Gehlbach), Assistant US Attorney William Welch convened agrand jury <strong>in</strong> 1998 to hear <strong>the</strong> evidence aga<strong>in</strong>st <strong>Gilbert</strong>. Welch accused her of hav<strong>in</strong>gkilled several patients by giv<strong>in</strong>g <strong>the</strong>m fatal doses of heart stimulant, and he wanted her<strong>in</strong>dicted for multiple murders.<strong>Kristen</strong> <strong>Gilbert</strong> was a mo<strong>the</strong>r with two young children. Although she was divorced, shehad been dat<strong>in</strong>g a male friend for some time. She had a steady job, one that paidreasonably well, and her skill as a nurse was generally recognized. What could possiblymotivate her to commit <strong>the</strong> murders that she was now suspected of? These were not“mercy kill<strong>in</strong>gs”: The victims <strong>in</strong> <strong>the</strong> <strong>in</strong>dictment Welch was seek<strong>in</strong>g were not old men orSAGTU Cobb/Gehlbach 1 9/20/2004
<strong>in</strong> poor health; ra<strong>the</strong>r, <strong>the</strong>y were middle-aged, and healthy enough that <strong>the</strong>ir deaths wereunexpected. Accord<strong>in</strong>g to prosecutor Welch, <strong>Kristen</strong> <strong>Gilbert</strong> did have a reason for whatshe had done. She liked <strong>the</strong> thrill of a crisis, she needed <strong>the</strong> recognition that came fromher skillful handl<strong>in</strong>g of a cardiac arrest, and, especially, she wanted to impress herboyfriend, who also worked at <strong>the</strong> hospital.Part of <strong>the</strong> evidence aga<strong>in</strong>st <strong>Gilbert</strong> dealt with her motivation, part of it came from <strong>the</strong>testimony of co-workers about her access to <strong>the</strong> ep<strong>in</strong>ephr<strong>in</strong>e she was accused of us<strong>in</strong>g <strong>in</strong><strong>the</strong> alleged murders, and part came from a physician who testified about <strong>the</strong> symptoms of<strong>the</strong> men who had died. Taken toge<strong>the</strong>r, this evidence was certa<strong>in</strong>ly suggestive, but wouldit be conv<strong>in</strong>c<strong>in</strong>g? No one had seen <strong>Gilbert</strong> give fatal <strong>in</strong>jections, and although <strong>the</strong>patients’ deaths were unexpected, <strong>the</strong> symptoms could have been considered consistentwith o<strong>the</strong>r possible causes of death. It turned out that a major part of <strong>the</strong> evidence aga<strong>in</strong>st<strong>Gilbert</strong> was statistical.Statistical hypo<strong>the</strong>sis test<strong>in</strong>g I. A key question for <strong>the</strong> grand jurors was this: Was ittrue that <strong>the</strong>re were more deaths when <strong>Kristen</strong> <strong>Gilbert</strong> was work<strong>in</strong>g? Not just one or twoextra deaths -- one or two could easily be due just to co<strong>in</strong>cidence -- but enough extra tobe truly suspicious? If not, <strong>the</strong>re might not be enough evidence to justify br<strong>in</strong>g<strong>in</strong>g <strong>Gilbert</strong>to trial. On <strong>the</strong> o<strong>the</strong>r hand, an answer of yes would call for an explanation, and enougho<strong>the</strong>r evidence po<strong>in</strong>ted to <strong>Gilbert</strong> to make an <strong>in</strong>dictment all but certa<strong>in</strong>.The prosecutors recognized that <strong>the</strong> key question about excess deaths was one that couldonly be answered us<strong>in</strong>g statistics, and so <strong>the</strong>y asked Stephen Gehlbach, who had done <strong>the</strong>statistical analysis of <strong>the</strong> hospital records, to present a summary of <strong>the</strong> results to <strong>the</strong> grandjury. In what follows, we will present you with a similar summary of <strong>the</strong> statisticalevidence. As you read through <strong>the</strong> summary, imag<strong>in</strong>e yourself as one of <strong>the</strong> grand jurors:do you f<strong>in</strong>d <strong>the</strong> evidence strong enough to br<strong>in</strong>g <strong>Gilbert</strong> to trial?The statistical substance <strong>in</strong>volves hypo<strong>the</strong>sis test<strong>in</strong>g, a form of reason<strong>in</strong>g that usesprobability calculations to decide whe<strong>the</strong>r or not an observed outcome should be regardedas so very unusual -- so extreme -- that it qualifies as a “scientific surprise.” The logicand <strong>in</strong>terpretation of hypo<strong>the</strong>sis test<strong>in</strong>g is fundamental to a lot of work <strong>in</strong> <strong>the</strong> natural andsocial sciences, important enough that anyone serious about understand<strong>in</strong>g how scienceworks should understand this form of reason<strong>in</strong>g. Unfortunately, <strong>in</strong> many statisticscourses, <strong>the</strong> logic of hypo<strong>the</strong>sis test<strong>in</strong>g is taught at <strong>the</strong> same time as some of <strong>the</strong>probability calculations that you need for particular applications, and <strong>the</strong> details of <strong>the</strong>computations tend to eclipse <strong>the</strong> underly<strong>in</strong>g logic. Part of <strong>the</strong> challenge fac<strong>in</strong>g Gehlbachwas to make <strong>the</strong> logic clear to <strong>the</strong> grand jury, without go<strong>in</strong>g <strong>in</strong>to <strong>the</strong> details of <strong>the</strong>calculations.Gehlbach’s testimony to <strong>the</strong> grand jury. Dr. Gehlbach’s testimony was deliveredorally, with Gehlbach <strong>in</strong> <strong>the</strong> witness stand, talk<strong>in</strong>g to <strong>the</strong> members of <strong>the</strong> grand jury. Thenext several paragraphs summarize three parts of Gehlbach’s testimony, a first part about<strong>the</strong> pattern of deaths, by shift and by year, on <strong>the</strong> medical ward where <strong>Gilbert</strong> worked, asecond part about variability and p-values, and a third part about a statistical test forSAGTU Cobb/Gehlbach 2 9/20/2004
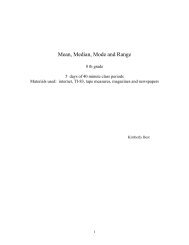
whe<strong>the</strong>r <strong>the</strong> pattern l<strong>in</strong>k<strong>in</strong>g <strong>the</strong> excess deaths to <strong>Gilbert</strong>’s presence on <strong>the</strong> ward was tooextreme to be regarded as due to ord<strong>in</strong>ary, expectable variability. The summaries don’tuse <strong>the</strong> exact words from <strong>the</strong> grand jury testimony, but <strong>the</strong>y cover some of <strong>the</strong> samesubstance.Part One: The pattern of deaths.(Imag<strong>in</strong>e that at this po<strong>in</strong>t <strong>in</strong> Gehlbach’s testimony, <strong>the</strong> jurors are look<strong>in</strong>g at agraph like <strong>the</strong> one <strong>in</strong> Display 1.)Dr. Gehlbach: “The graph you see shows data from <strong>the</strong> VA hospital where <strong>Kristen</strong><strong>Gilbert</strong> worked. Each set of three bars shows one year’s worth of data, start<strong>in</strong>g <strong>in</strong>1988, and runn<strong>in</strong>g through 1997. With<strong>in</strong> each set of three bars, <strong>the</strong>re is one barfor each shift. The left bar is for <strong>the</strong> night shift, midnight to 8 a.m.; <strong>the</strong> middle baris for <strong>the</strong> day shift, 8 a.m. to 4 p.m., and <strong>the</strong> right bar is for <strong>the</strong> even<strong>in</strong>g shift, 4p.m. to midnight. The height of each bar tells how many deaths <strong>the</strong>re were on ashift for <strong>the</strong> year <strong>in</strong> question.“Now look at <strong>the</strong> pattern from one year to <strong>the</strong> next. For <strong>the</strong> first two years, ’88and ’89, <strong>the</strong> bars are short, show<strong>in</strong>g roughly ten deaths per year on each shift.Then <strong>the</strong>re is a dramatic <strong>in</strong>crease. For <strong>the</strong> years 1990 through 1995, <strong>the</strong>re is oneshift <strong>in</strong> each set of three with 25 to 35 deaths per year. Then for <strong>the</strong> last twoyears, <strong>the</strong> bars are all short aga<strong>in</strong>, a bit under ten deaths per year on each shift.“How does this pattern fit with <strong>Kristen</strong> <strong>Gilbert</strong>’s time at <strong>the</strong> VA? It turns out thatMs. <strong>Gilbert</strong> began work on Ward C, <strong>the</strong> medical ward, <strong>in</strong> March of 1990, andstopped work<strong>in</strong>g at <strong>the</strong> VA <strong>in</strong> February of 1996. Look<strong>in</strong>g at <strong>the</strong> deaths by year,<strong>the</strong> pattern tracks Ms. <strong>Gilbert</strong>’s work history: small numbers of deaths <strong>in</strong> yearswhen she didn’t work at <strong>the</strong> VA, and large numbers when she was <strong>the</strong>re.“We can learn more by look<strong>in</strong>g at <strong>the</strong> different shifts. You’ll notice that <strong>in</strong> eachof <strong>the</strong> years that Ms. <strong>Gilbert</strong> worked on Ward C, one of <strong>the</strong> three shifts alwaysshows more deaths than <strong>the</strong> o<strong>the</strong>r two. For five of <strong>the</strong>se six years, 1991 through1995, it’s <strong>the</strong> even<strong>in</strong>g shift that stands out. Dur<strong>in</strong>g <strong>the</strong>se five years, Ms. <strong>Gilbert</strong>was assigned to <strong>the</strong> even<strong>in</strong>g shift.“What about <strong>the</strong> exception, 1990? That year it is <strong>the</strong> night shift, not <strong>the</strong> even<strong>in</strong>gshift, that stands out as hav<strong>in</strong>g an unusually large number of deaths. Well, it turnsout that 1990 was also an exception for <strong>Kristen</strong> <strong>Gilbert</strong>’s work history. That yearshe was assigned not to <strong>the</strong> even<strong>in</strong>g shift, but to <strong>the</strong> night shift.SAGTU Cobb/Gehlbach 3 9/20/2004
D e a th s o n th e M e d ic a l W a rdb y y e a r a n d s h ift4030Deaths201008 8 8 9 9 0 9 1 9 2 9 3 9 4 9 5 9 6 9 7Y e a rDisplay 1: The pattern of deaths, by year and by shiftIn each set of three bars, left = night (midnight - 8 am), middle = day(8am - 4 pm), right = even<strong>in</strong>g (4pm - midnight).At this po<strong>in</strong>t <strong>in</strong> <strong>the</strong> argument, <strong>the</strong>re is a clear pattern associat<strong>in</strong>g <strong>Gilbert</strong>’s presence wi<strong>the</strong>xcess deaths. However, <strong>in</strong> pr<strong>in</strong>ciple <strong>the</strong> pattern might be noth<strong>in</strong>g more than <strong>the</strong> result oford<strong>in</strong>ary, expectable variation. The goal of a statistical test <strong>in</strong> this situation would be todeterm<strong>in</strong>e whe<strong>the</strong>r <strong>the</strong> numbers of excess deaths were too extreme to be accounted for bysuch variation. In order to prepare <strong>the</strong> jurors to th<strong>in</strong>k about a statistical test here,Gehlbach first expla<strong>in</strong>ed <strong>the</strong> basic ideas <strong>in</strong> a more familiar context:Part Two: Variability and p-values.Dr. Gehlbach: “To understand <strong>the</strong> idea of a statistical test, th<strong>in</strong>k about toss<strong>in</strong>g a co<strong>in</strong>.How can you decide whe<strong>the</strong>r <strong>the</strong>re’s someth<strong>in</strong>g suspicious about a set of ten co<strong>in</strong>flips? Ord<strong>in</strong>arily, we expect a co<strong>in</strong> to be fair, which means <strong>the</strong>re’s a 50-50 chanceof heads. This is our hypo<strong>the</strong>sis, <strong>the</strong> start<strong>in</strong>g po<strong>in</strong>t of our reason<strong>in</strong>g. If you flipten times, and <strong>the</strong> co<strong>in</strong> is fair, <strong>the</strong>n on average you’d expect five heads to showup. But you know that you might get six, seven, or even eight heads. Th<strong>in</strong>gsvary, and sometimes <strong>the</strong> variation is due just to chance.“Now suppose you got ten heads <strong>in</strong> ten flips. Is that result extreme enough to besuspicious? How extreme an outcome do we need before we should doubt ourhypo<strong>the</strong>sis that <strong>the</strong> chance of heads is 50-50?“To answer this question, statisticians compute a p-value: start with <strong>the</strong>hypo<strong>the</strong>sis – a 50-50 chance of heads – and compute <strong>the</strong> probability of six heads,or seven heads, and so on. It turns out that <strong>the</strong> probability of at least six heads <strong>in</strong>ten flips is about 0.38. This means that 38% of <strong>the</strong> time when you make ten flipsSAGTU Cobb/Gehlbach 4 9/20/2004
with a fair co<strong>in</strong>, you’ll get at least six heads. If someth<strong>in</strong>g happens 38% of <strong>the</strong>time, <strong>the</strong>re’s noth<strong>in</strong>g surpris<strong>in</strong>g or suspicious about it.“For seven heads, <strong>the</strong> p-value is about 0.17: About 17% of <strong>the</strong> time you do tenflips of a fair co<strong>in</strong>, you’ll get seven heads or more. So seven out of ten isn’t reallysurpris<strong>in</strong>g ei<strong>the</strong>r.“If you get n<strong>in</strong>e heads <strong>in</strong> ten flips, however, that’s unusual. If <strong>the</strong> co<strong>in</strong> is fair,<strong>the</strong>n you’re unlikely to get a result that extreme. The probability, or p-value, for 9or more heads, is only about 0.01, or 1%.“For ten out of ten, <strong>the</strong> p-value is about 0.001, or one <strong>in</strong> a thousand. This is aresult so extreme that you’d almost never get it from a fair co<strong>in</strong>. If you saw mepull a co<strong>in</strong> out of my pocket, flip it ten times, and get heads every time, you’d bejustified <strong>in</strong> th<strong>in</strong>k<strong>in</strong>g <strong>the</strong>re’s someth<strong>in</strong>g go<strong>in</strong>g on besides just chance variation.“That’s how statisticians use a p-value. If we see a result with a really low p-value, <strong>the</strong>n ei<strong>the</strong>r we’ve seen a really rare outcome, or else <strong>the</strong> hypo<strong>the</strong>sis we usedto compute <strong>the</strong> p-value must be wrong.“In many medical trials -- test<strong>in</strong>g whe<strong>the</strong>r antihistam<strong>in</strong>es relieve your symptomsof allergies, or th<strong>in</strong>gs like that – we compute a p-value assum<strong>in</strong>g <strong>the</strong> drug has noeffect, and a probability of one out of a hundred is unusual enough, and <strong>the</strong>evidence would be considered strong enough, to conclude that <strong>the</strong> medic<strong>in</strong>eactually worked.Now, with <strong>the</strong> basic logic out on <strong>the</strong> table, it was time to present a formal test. Whatfollows is just one very focused part of <strong>the</strong> set of tests Gehlbach actually presented.Part Three: A statistical test.At this po<strong>in</strong>t Gehlbach showed <strong>the</strong> jury data like <strong>the</strong> table <strong>in</strong> Display 2.Dr. Gehlbach: “The table summarizes records for <strong>the</strong> eighteen months lead<strong>in</strong>g up to<strong>the</strong> end of February, 1996. (That February was <strong>the</strong> month when Ms. <strong>Gilbert</strong>’s coworkersmet with <strong>the</strong>ir supervisor to express <strong>the</strong>ir concerns; shortly after that, Ms.<strong>Gilbert</strong> took a medical leave.) With 547 days dur<strong>in</strong>g <strong>the</strong> period <strong>in</strong> question, andthree shifts per day, <strong>the</strong>re were 1641 shifts <strong>in</strong> all. Out of <strong>the</strong>se 1641 shifts, <strong>the</strong>rewere 74 for which <strong>the</strong>re was at least one death.“Now th<strong>in</strong>k of each shift as like a co<strong>in</strong> flip, with a death on <strong>the</strong> shift if <strong>the</strong> co<strong>in</strong>lands heads. The fraction of shifts with a death is 74/1641 or 0.045. This meansthat out of every 100 shifts, you would expect four-and-one-half shifts, or 4.5%,with at least one death. It’s like toss<strong>in</strong>g a co<strong>in</strong>, one toss per shift, with aprobability of 0.045 that <strong>the</strong> toss lands heads.SAGTU Cobb/Gehlbach 5 9/20/2004
“Now let’s look just at <strong>the</strong> shifts when Ms. <strong>Gilbert</strong> worked. There were 257 of<strong>the</strong>se. If <strong>the</strong> deaths distributed <strong>the</strong>mselves like co<strong>in</strong>s land<strong>in</strong>g heads, we’d expectbetween 11 and 12 of <strong>the</strong>se shifts to experience a death, because 4.5% of 257 is11.6.“What does <strong>the</strong> record show? As you can see from <strong>the</strong> table, <strong>the</strong>re were <strong>in</strong> factnot 11 or 12 shifts with a death, but 40. How extreme is 40? Could you get anumber like that just from chance variation, or is 40 really suspicious? To answerthat, we compute a p-value.“Assume that <strong>the</strong> 257 shifts that Ms. <strong>Gilbert</strong> worked behaved like co<strong>in</strong> tosses,with a chance of heads equal to 0.045. What is <strong>the</strong> probability of 40 or moredeaths? The p-value turns out to be less than one <strong>in</strong> one hundred million. In o<strong>the</strong>rwords, it is virtually impossible to get as many as 40 shifts with deaths fromord<strong>in</strong>ary, chance-like variation.Number of days 547Number of shifts 1641 <strong>Gilbert</strong> Death on Shift?Number of deaths 74 present? Yes No TotalDeaths per shift 0.045 Yes 40 217 257Shifts with KG present 257 No 34 1350 1384Expected number of deaths 11.59 Total 74 1567 1641Observed number of deaths 40Display 2: The basis of <strong>the</strong> statistical test<strong>Gilbert</strong> on trial. The grand jury found <strong>the</strong> evidence persuasive and <strong>Gilbert</strong> was <strong>in</strong>dicted.Because <strong>the</strong> VA hospital is legally <strong>the</strong> property of <strong>the</strong> federal government, <strong>Gilbert</strong> wouldstand trial <strong>in</strong> federal district court, on four counts of murder and three additional counts ofattempted murder. The question of jurisdiction was important because, although <strong>the</strong> stateof Massachusetts has no death penalty, <strong>Gilbert</strong> was fac<strong>in</strong>g a federal <strong>in</strong>dictment, governedby federal ra<strong>the</strong>r than state laws, and US Attorney Welch decided to ask for <strong>the</strong> deathpenalty. <strong>Kristen</strong> <strong>Gilbert</strong> would be on trial for her life.Before <strong>the</strong> trial got under way, <strong>the</strong> judge, Michael A. Ponser, had to rule on whe<strong>the</strong>r <strong>the</strong>jury should be allowed to hear <strong>the</strong> statistical evidence. On <strong>the</strong> one hand this seems like a“no-bra<strong>in</strong>er.” After all if <strong>the</strong> evidence was an important part of what was presented to <strong>the</strong>grand jury, if it was appropriate for <strong>the</strong>m to hear, and <strong>the</strong>y found it compell<strong>in</strong>g, whatcould possibly be wrong with lett<strong>in</strong>g <strong>the</strong> trial jury hear <strong>the</strong> same testimony? On <strong>the</strong> o<strong>the</strong>rhand, a counterargument might be that allow<strong>in</strong>g <strong>the</strong> statistical evidence would just lead to<strong>the</strong> unhelpful distraction of “duel<strong>in</strong>g experts.” The court system allows expert testimonywhen <strong>the</strong> evidence <strong>in</strong>volves specialized technical or scientific issues that go beyond whatmembers of <strong>the</strong> jury would ord<strong>in</strong>arily be familiar with. The purpose of <strong>the</strong> experts is toprovide explanations of <strong>the</strong> science or of <strong>the</strong> technical facts <strong>in</strong>volved, along with <strong>the</strong>appropriate conclusions -- <strong>in</strong> o<strong>the</strong>r words, to help <strong>the</strong> jury understand <strong>the</strong> evidence better-- and <strong>the</strong> US Supreme Court has set guidel<strong>in</strong>es aimed at mak<strong>in</strong>g sure that unscientifictestimony is not admitted. The goal is to help ensure that <strong>the</strong> verdict will be scientificallySAGTU Cobb/Gehlbach 6 9/20/2004
sound. Never<strong>the</strong>less, attorneys sometimes say that if <strong>the</strong>re is expert testimony on oneside, <strong>the</strong> o<strong>the</strong>r side hires ano<strong>the</strong>r expert who will disagree, and <strong>the</strong> jury, ra<strong>the</strong>r than th<strong>in</strong>kthrough <strong>the</strong> explanations, will simply ignore it all. One expert cancels <strong>the</strong> o<strong>the</strong>r.Although this view may be overly cynical, no doubt it does have a basis <strong>in</strong> fact.Ra<strong>the</strong>r than just rely on <strong>the</strong> crude strategy of “duel<strong>in</strong>g experts,” <strong>Gilbert</strong>’s defenseattorneys asked <strong>the</strong> o<strong>the</strong>r of <strong>the</strong> two of us (Cobb), to prepare a written report for <strong>the</strong> judgesummariz<strong>in</strong>g <strong>the</strong> reasons why it would not be appropriate for <strong>the</strong> new jury, <strong>the</strong> trial jury,to hear <strong>the</strong> same evidence that Gehlbach had presented earlier to <strong>the</strong> grand jury. In <strong>the</strong>next several paragraphs, you will read a summary of <strong>the</strong> ma<strong>in</strong> po<strong>in</strong>ts <strong>in</strong> that report. Thistime, put yourself <strong>in</strong> <strong>the</strong> position of Judge Ponsor: Do you f<strong>in</strong>d <strong>the</strong>se po<strong>in</strong>ts persuasive?Would you have allowed <strong>the</strong> jury to hear <strong>the</strong> statistical evidence, or not?Hypo<strong>the</strong>sis test<strong>in</strong>g II. So far, <strong>in</strong> <strong>the</strong> Gehlbach testimony, <strong>the</strong> <strong>in</strong>terpretation of hypo<strong>the</strong>sistest<strong>in</strong>g has focused on what it is that a t<strong>in</strong>y p-value does tell you. It tells you that <strong>the</strong>observed result is too extreme to be expla<strong>in</strong>ed as due to chance-like variation. This wasexactly <strong>the</strong> relevant issue for <strong>the</strong> grand jury: Were <strong>the</strong>re so many excess deaths when<strong>Gilbert</strong> was present as to be suspicious <strong>in</strong> <strong>the</strong> eyes of science? The clear answer was yes.In <strong>the</strong> Cobb report, <strong>the</strong> focus was on th<strong>in</strong>gs that t<strong>in</strong>y p-values do not tell you.Unfortunately for people who need to understand hypo<strong>the</strong>sis test<strong>in</strong>g, <strong>the</strong>se <strong>in</strong>validconclusions are a constant temptation. They seem to make sense <strong>in</strong>tuitively, but <strong>the</strong>y arewrong, and so <strong>the</strong>y have great potential to mislead <strong>the</strong> unwary. This potential for logicalmischief was <strong>the</strong> basis for <strong>the</strong> defense team’s request that Judge Ponsor not allowAttorney Welch to present statistical evidence to <strong>the</strong> trial jury.Cobb’s report to Judge Ponsor. Leav<strong>in</strong>g aside a variety of secondary technical issues,<strong>the</strong> Cobb report made three ma<strong>in</strong> po<strong>in</strong>ts. One of <strong>the</strong>m was to agree with <strong>the</strong> bottom l<strong>in</strong>econclusion <strong>in</strong> Gehlbach’s testimony. The o<strong>the</strong>r two dealt with two limitations on whatyou can learn from a t<strong>in</strong>y p-value.Po<strong>in</strong>t One: The defense and prosecution statisticians agree! As mentioned earlier, often<strong>the</strong> two experts who provide testimony on scientific evidence disagree. However, thatwas not what happened <strong>in</strong> <strong>the</strong> <strong>Gilbert</strong> case. Cobb’s report agreed with Gehlbach’stestimony before <strong>the</strong> grand jury. We both thought <strong>the</strong> pattern l<strong>in</strong>k<strong>in</strong>g <strong>Gilbert</strong>’s presenceon <strong>the</strong> ward with excess deaths was far, far too strong to be regarded as mere co<strong>in</strong>cidencedue to chance-like variation. We both thought, too, that <strong>in</strong> <strong>the</strong> absence of any <strong>in</strong>nocentexplanation for <strong>the</strong> pattern, <strong>the</strong> association was more than strong enough to justify <strong>the</strong><strong>in</strong>dictment. Why <strong>the</strong>n, shouldn’t <strong>the</strong> trial jury hear <strong>the</strong> testimony? To answer thatquestion we proceed with Cobb’s o<strong>the</strong>r two po<strong>in</strong>ts.Po<strong>in</strong>t Two: Association is not causation. The grand jury and <strong>the</strong> trial jury have quitedifferent decisions to make as <strong>the</strong>y weigh <strong>the</strong> evidence, and <strong>the</strong> difference is closely tiedto what a p-value does and does not tell you. The grand jury had to decide whe<strong>the</strong>r or not<strong>Gilbert</strong> should stand trial. Was <strong>the</strong>re enough suspicion to justify <strong>the</strong> expense to <strong>the</strong>government and <strong>the</strong> psychological burden on <strong>Gilbert</strong> to hold what promised to be a longand expensive trial? A grand jury does not have to decide guilt or <strong>in</strong>nocence beyond aSAGTU Cobb/Gehlbach 7 9/20/2004
easonable doubt. For <strong>the</strong>m, <strong>the</strong> standard is much lower. They are simply asked todeterm<strong>in</strong>e whe<strong>the</strong>r <strong>the</strong> level of suspicion is high enough. This is precisely <strong>the</strong> k<strong>in</strong>d ofquestion that logic of hypo<strong>the</strong>sis test<strong>in</strong>g is designed to answer. In statistics, and <strong>in</strong>science generally, <strong>the</strong> bar is set quite high for what deserves to be considered strongsuspicion, typically a p-value of .05 or .01.A low p-value establishes suspicion by rul<strong>in</strong>gout chance variation as an explanation. Notice that a low p-value does not provide anexplanation. It doesn’t say, “Here. This is <strong>the</strong> reason for <strong>the</strong> excess deaths.” What itsays is much more limited: “Whatever <strong>the</strong> explanation may be, you can be quiteconfident that it is not mere chance variation.”The trial jury isn’t asked to decide whe<strong>the</strong>r <strong>the</strong> facts look suspicious. By <strong>the</strong> time a casecomes to trial, <strong>the</strong> decision about suspicion has already been made. The trial jury isasked to decide <strong>the</strong> reason for <strong>the</strong> suspicious facts. Were <strong>the</strong> excess deaths caused by<strong>Gilbert</strong> giv<strong>in</strong>g fatal <strong>in</strong>jections? Or were <strong>the</strong>re enough uncerta<strong>in</strong>ties that <strong>the</strong> cause couldnot be determ<strong>in</strong>ed beyond a reasonable doubt? Because a low p-value cannot tell youabout cause, <strong>the</strong> Cobb report argued, <strong>the</strong> statistical evidence was not an appropriate partof <strong>the</strong> evidence for <strong>the</strong> trial jury.But wait. Isn’t statistical evidence used all <strong>the</strong> time to draw conclusions about cause?Doesn’t <strong>the</strong> FDA use statistics to decide whe<strong>the</strong>r a particular medication will cause adisease to go away, or at least cause its symptoms to go away, or whe<strong>the</strong>r that samemedication will cause side effects? Didn’t scientists use hypo<strong>the</strong>sis test<strong>in</strong>g to decide, forexample, that antihistam<strong>in</strong>es can relieve <strong>the</strong> symptoms of allergies? If hypo<strong>the</strong>sis test<strong>in</strong>gcan tell us about cause <strong>in</strong> <strong>the</strong>se situations, why not <strong>in</strong> <strong>the</strong> <strong>Gilbert</strong> case also?The answer <strong>in</strong>volves what some statisticians consider to be <strong>the</strong> s<strong>in</strong>gle most importantcontribution that statistics has made <strong>in</strong> <strong>the</strong> last 100 years: an understand<strong>in</strong>g of <strong>the</strong>difference between an observational study and a randomized experiment. The statisticalanalysis <strong>in</strong> <strong>the</strong> <strong>Gilbert</strong> case is based on observational data; <strong>in</strong> <strong>the</strong> studies used to decidesuch th<strong>in</strong>gs as whe<strong>the</strong>r tak<strong>in</strong>g aspir<strong>in</strong> lowers <strong>the</strong> risk of heart attacks, <strong>the</strong> data come fromrandomized experiments. The dist<strong>in</strong>ction here is so important that it is worth paus<strong>in</strong>g totake a look at it <strong>in</strong> more detail.An important dist<strong>in</strong>ction: Observational studies versus randomized experiments. Afamous study from <strong>the</strong> early research on smok<strong>in</strong>g and health illustrate whyobservational studies can be mislead<strong>in</strong>g about cause and effect. Look at <strong>the</strong> deathrates from that study, and notice what <strong>the</strong> “obvious” conclusion would be:Non-smokers 20.2Cigarette smokers 20.5Cigar and pipe smokers 35.3Display 3: Death rates, <strong>in</strong> deaths per 1000 people per yearThe sample sizes <strong>in</strong> this study were huge, and <strong>the</strong> t<strong>in</strong>y p-values conclusively rule outchance variation as an explanation for <strong>the</strong> differences among <strong>the</strong> three groups.SAGTU Cobb/Gehlbach 8 9/20/2004
Tak<strong>in</strong>g <strong>the</strong> numbers at face value would leave us with <strong>the</strong> conclusion that cigarettesmok<strong>in</strong>g carries only a m<strong>in</strong>iscule risk, but that pipes and cigars are highly dangerous.To avoid this logical trap, you need to recognize that a low p-value, by itself, does notprove a cause-and-effect relationship; it only elim<strong>in</strong>ates chance as one of <strong>the</strong> possiblecause. For this study, <strong>the</strong>re was ano<strong>the</strong>r cause at work beh<strong>in</strong>d <strong>the</strong> scenes: age. Thenon-smokers, on average, were 54.9 years old; <strong>the</strong> cigarette smokers only 50.5, and<strong>the</strong> cigar and pipe smokers were 15 years older, at 65.9. Because <strong>the</strong> researchers hadthis additional <strong>in</strong>formation, <strong>the</strong>y were able to use statistical methods to adjust for <strong>the</strong>effect of <strong>the</strong> “lurk<strong>in</strong>g variable,” age. The adjusted death rates are <strong>in</strong> l<strong>in</strong>e with whatwe have come to expect:Non-smokers 20.3Cigarette smokers 28.3Cigar and pipe smokers 21.2Display 4: Death rates, adjusted for age, <strong>in</strong> deaths per 1000 people per yearFor our purposes, <strong>the</strong> key po<strong>in</strong>t is this: With an observational study, you can neverknow for certa<strong>in</strong> whe<strong>the</strong>r your numbers look <strong>the</strong> way <strong>the</strong>y do for <strong>the</strong> reasons youknow about, or whe<strong>the</strong>r, <strong>in</strong>stead, <strong>the</strong>re are hidden causes at work. With a randomizedexperiment, <strong>the</strong> groups be<strong>in</strong>g compared are created us<strong>in</strong>g randomness or chance. If<strong>the</strong> group sizes are large enough, <strong>the</strong> randomization process evens out all possible<strong>in</strong>fluences that might make one group different from ano<strong>the</strong>r. The beauty and powerof <strong>the</strong> randomization is that it evens out all unwanted <strong>in</strong>fluences, <strong>in</strong>clud<strong>in</strong>g <strong>the</strong> onesyou don’t know about.Consider how randomization worked for an <strong>in</strong>fluential study of aspir<strong>in</strong> and heartattacks. Back <strong>in</strong> <strong>the</strong> 1980s, researchers began a huge study <strong>in</strong>volv<strong>in</strong>g 21,996physicians across <strong>the</strong> US. All of <strong>the</strong>m had volunteered to take part. Some wereolder; some were younger. Some were overweight; o<strong>the</strong>rs were not. Some exercisedregularly; o<strong>the</strong>rs didn’t. Cholesterol levels varied from low to very high. In short,<strong>the</strong>re were many <strong>in</strong>fluences, both known and unknown, that caused big differences <strong>in</strong><strong>the</strong> risk of heart attack. To ensure that all <strong>the</strong>se <strong>in</strong>fluences would even out, <strong>the</strong>researchers used a chance device to assign each physician to one of two groups.Those assigned to <strong>the</strong> treatment group took a daily pill that actually conta<strong>in</strong>ed aspir<strong>in</strong>.Those assigned to <strong>the</strong> placebo group also took a daily pill, one that was identical to<strong>the</strong> o<strong>the</strong>r pill, except that it conta<strong>in</strong>ed no aspir<strong>in</strong>.The results of <strong>the</strong> study were strik<strong>in</strong>g. Even before <strong>the</strong> study was supposed to haveended, prelim<strong>in</strong>ary p-values were so low that <strong>the</strong> scientists <strong>in</strong> charge of <strong>the</strong> researchdecided to call an end to <strong>the</strong> experiment so that <strong>the</strong> physicians <strong>in</strong> <strong>the</strong> placebo groupcould start tak<strong>in</strong>g <strong>the</strong> aspir<strong>in</strong> if <strong>the</strong>y wanted to.In a nutshell, here is <strong>the</strong> key difference between <strong>the</strong> experiment and <strong>the</strong> observationalstudy. In <strong>the</strong> observational study, when a low p-value ruled out chance variation asan explanation for <strong>the</strong> differences <strong>in</strong> death rates, it was not clear what was caus<strong>in</strong>gSAGTU Cobb/Gehlbach 9 9/20/2004
those rates to differ. The difference <strong>in</strong> rates might have been caused by differences <strong>in</strong>smok<strong>in</strong>g habits, might have been caused by differences <strong>in</strong> age, and might have beencaused by any of a number of o<strong>the</strong>r <strong>in</strong>fluences. The p-value alone was of no help <strong>in</strong>decid<strong>in</strong>g <strong>the</strong> cause. In <strong>the</strong> experiment, one possible cause -- aspir<strong>in</strong> -- was s<strong>in</strong>gledout for <strong>in</strong>vestigation, and <strong>the</strong> experiment was carefully designed to elim<strong>in</strong>ate all o<strong>the</strong>rpossible causes, apart from chance-like variability. When a statistical test was <strong>the</strong>nable to rule out chance variability, <strong>the</strong>re was only one possible explanation left, <strong>the</strong>cause that was s<strong>in</strong>gled out for study. Observational studies can be useful; after all<strong>the</strong>y did play a large part <strong>in</strong> mak<strong>in</strong>g <strong>the</strong> l<strong>in</strong>k between smok<strong>in</strong>g and cancer, but onemust work very hard to elim<strong>in</strong>ate <strong>the</strong> many uncontrolled factors as possibleexplanations for <strong>the</strong> observed association. Randomized experiments make it mucheasier to draw causal conclusions.The data <strong>in</strong> <strong>the</strong> <strong>Gilbert</strong> trial was observational. To make it an experiment, <strong>Gilbert</strong>’spresence on <strong>the</strong> ward would have had to be assigned us<strong>in</strong>g a chance device to decidewhich shifts she worked. Because <strong>the</strong>re was no experiment, <strong>the</strong> t<strong>in</strong>y p-value, though itruled out chance as an explanation for <strong>the</strong> excess deaths, did not rule out o<strong>the</strong>r possibleexplanations. In his rul<strong>in</strong>g, Judge Ponsor gave a hypo<strong>the</strong>tical example that wouldproduce similarly damag<strong>in</strong>g statistical evidence: Suppose that on a shift when <strong>Gilbert</strong>was present, a boiler had accidentally exploded and killed several dozen patients. Suchan accident could lead to a t<strong>in</strong>y p-value show<strong>in</strong>g that <strong>Gilbert</strong>’s presence was associatedwith a very high number of deaths, but it would not be evidence of her guilt. Asstatisticians often say, “Association is not causation.” The temptation, especially when<strong>the</strong> evidence of association is strong and <strong>the</strong>re is a plausible explanation, is to concludethat <strong>the</strong> test provides evidence that <strong>the</strong> explanation is right. With observational data, sucha conclusion would be based on false logic.Po<strong>in</strong>t Three: The Prosecutor’s Fallacy. The Cobb report po<strong>in</strong>ted out a second, closelyrelated temptation that is present with hypo<strong>the</strong>sis test<strong>in</strong>g. The p-value is a conditionalprobability, computed by assum<strong>in</strong>g that a result is due to chance-like variation. Itsummarizes logic that goes as follows: “If <strong>the</strong> cause is just random variation, <strong>the</strong>n <strong>the</strong>extreme result is very unlikely. We got an extreme result. Therefore, it is not reasonableto th<strong>in</strong>k that random variation is <strong>the</strong> cause.” Notice that this logic says noth<strong>in</strong>g abouto<strong>the</strong>r causes. If <strong>the</strong>re was a boiler explosion, for example, <strong>the</strong> extreme result would notbe at all surpris<strong>in</strong>g.Now look at how slippery <strong>the</strong> logic can get if you’re not careful: “Suppose <strong>Gilbert</strong> is notguilty, and that <strong>the</strong> deaths behave <strong>in</strong> a chance-like way, like co<strong>in</strong> tosses. Then <strong>the</strong>probability is less than 1 out of a hundred million that you would see so may excessdeaths on <strong>Gilbert</strong>’s shifts.” (Correct.) It’s a quick jump to <strong>the</strong> follow<strong>in</strong>g shorter version:“If <strong>Gilbert</strong> is <strong>in</strong>nocent, <strong>the</strong>n it would be almost impossible to get so many excess deaths.”(Also correct.) And <strong>the</strong>n, “With this many excess deaths, <strong>the</strong> chance is less than 1 <strong>in</strong> ahundred million that <strong>Gilbert</strong> is <strong>in</strong>nocent.” (Not valid.) This k<strong>in</strong>d of “reason<strong>in</strong>g” is sotempt<strong>in</strong>g, and so common, that it has become known to statisticians as <strong>the</strong> prosecutor’sfallacy. Because <strong>the</strong> false logic beckons so seductively, it is often used as <strong>the</strong> basis forSAGTU Cobb/Gehlbach 10 9/20/2004
argu<strong>in</strong>g, as <strong>the</strong> Cobb report did, that <strong>the</strong> statistical evidence was likely to bemis<strong>in</strong>terpreted by <strong>the</strong> jury <strong>in</strong> a way that favored <strong>the</strong> prosecution, and was <strong>the</strong>refore“prejudicial.”Conclusion. Judge Ponsor ruled that <strong>the</strong> statistical evidence should not be allowed attrial. Never<strong>the</strong>less, <strong>the</strong> o<strong>the</strong>r, non-statistical evidence proved to be enough to conv<strong>in</strong>ce<strong>the</strong> jury, and, after many days of deliberation, <strong>Gilbert</strong> was convicted on three counts offirst degree murder, one count of second degree murder, and two counts of attemptedmurder. After a penalty phase of <strong>the</strong> trial, <strong>the</strong> jury voted 8 to 4 for a death sentence, andbecause <strong>the</strong> vote was not unanimous, <strong>Gilbert</strong>’s life was spared. She is now serv<strong>in</strong>g asentence of life <strong>in</strong> prison without possibility of parole.The statistical analysis that uncovered <strong>the</strong> pattern l<strong>in</strong>k<strong>in</strong>g <strong>Gilbert</strong>’s presence to <strong>the</strong> excessdeaths was an essential part of <strong>the</strong> process that brought her to justice. The two juries that<strong>Gilbert</strong> faced, and <strong>the</strong>ir different roles <strong>in</strong> our system of justice, illustrate neatly <strong>the</strong> proper<strong>in</strong>terpretation of hypo<strong>the</strong>sis test<strong>in</strong>g. First, a small p-value does allow you to rule outchance-like variability as a plausible explanation for an observed pattern. It tells you thatthat <strong>the</strong> observed pattern is so extreme as to qualify as a surprise <strong>in</strong> <strong>the</strong> eyes of science.Second, if your data are observational, a small p-value does not tell you what has caused<strong>the</strong> surprise. Association is not causation. Inferences about cause are much morestraightforward with a randomized experiment.Additional Read<strong>in</strong>gs:Cameron, J.B. (2001), “<strong>Gilbert</strong> guilty of four murders,” Daily Hampshire Gazette, March15, 2001.DeGroot, M. H., Fienberg, S. E., and Kadane, J. B. (1994), <strong>Statistics</strong> and <strong>the</strong> Law. JohnWiley.F<strong>in</strong>kelste<strong>in</strong>, M. O. (2001), <strong>Statistics</strong> for Lawyers, 2 nd edition. Spr<strong>in</strong>ger-Verlag.Gastwirth, J. L. (Ed.). (2000), Statistical Science <strong>in</strong> <strong>the</strong> <strong>Courtroom</strong>, Spr<strong>in</strong>ger- Verlag.Gastwirth, J. L. (1998), Statistical Reason<strong>in</strong>g <strong>in</strong> Law and Public Policy, Academic Press.Good, P. I. (2001), Apply<strong>in</strong>g <strong>Statistics</strong> <strong>in</strong> <strong>the</strong> <strong>Courtroom</strong>, CRC Press.Zeisel, H., and Kaye, D. H. (1997), Prove it with Figures, Spr<strong>in</strong>ger-Verlag.SAGTU Cobb/Gehlbach 11 9/20/2004