baseline avian studies for the proposed maiden wind ... - WEST, Inc.
baseline avian studies for the proposed maiden wind ... - WEST, Inc.
baseline avian studies for the proposed maiden wind ... - WEST, Inc.
- No tags were found...

You also want an ePaper? Increase the reach of your titles
YUMPU automatically turns print PDFs into web optimized ePapers that Google loves.
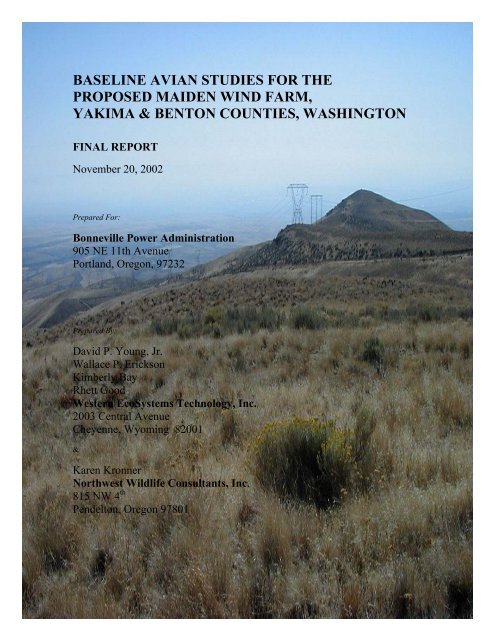
BASELINE AVIAN STUDIES FOR THEPROPOSED MAIDEN WIND FARM,YAKIMA & BENTON COUNTIES, WASHINGTONFINAL REPORTNovember 20, 2002Prepared For:Bonneville Power Administration905 NE 11th AvenuePortland, Oregon, 97232Prepared By:David P. Young, Jr.Wallace P. EricksonKimberly BayRhett GoodWestern EcoSystems Technology, <strong>Inc</strong>.2003 Central AvenueCheyenne, Wyoming 82001&Karen KronnerNorthwest Wildlife Consultants, <strong>Inc</strong>.815 NW 4 thPendelton, Oregon 97801
BASELINE AVIAN STUDIES FOR THEPROPOSED MAIDEN WIND FARM,YAKIMA AND BENTON COUNTIES, WASHINGTONFINAL REPORTApril 2001 - April 2002Prepared For:Bonneville Power Administration905 NE 11th AvenuePortland, Oregon, 97232Prepared By:David P. Young, Jr.Wallace P. EricksonKimberly BayRhett GoodWestern EcoSystems Technology, <strong>Inc</strong>.2003 Central AvenueCheyenne, Wyoming 82001&Karen KronnerNorthwest Wildlife Consultants, <strong>Inc</strong>.815 NW 4 thPendelton, Oregon 97801November 20, 2002
FINAL REPORTMAIDEN WIND PROJECT BASELINE AVIAN STUDIESEXECUTIVE SUMMARYBonneville Power Administration is evaluating whe<strong>the</strong>r to purchase power from a <strong>proposed</strong> <strong>wind</strong>power development in Benton and Yakima Counties, Washington. The <strong>proposed</strong> Maiden WindFarm is located in <strong>the</strong> Rattlesnake Hills nor<strong>the</strong>ast of <strong>the</strong> town of Sunnyside, Washington. The<strong>proposed</strong> development could be up to 494 MW with as many as 549 turbines and four mettowers depending on factors such as turbine model selected and power purchase agreements.In support of <strong>the</strong> environmental impact evaluation <strong>for</strong> <strong>the</strong> project, a detailed 12-month <strong>baseline</strong><strong>avian</strong> resources study plan was developed and implemented at <strong>the</strong> site to assist in project designand <strong>for</strong> use in evaluating potential <strong>avian</strong> impacts from <strong>the</strong> project. The study protocol wasdeveloped based on expertise and experience of <strong>WEST</strong>, <strong>Inc</strong>. and NWC, <strong>Inc</strong>. studying <strong>wind</strong>power effects on birds and wildlife and in cooperation with <strong>the</strong> Washington Department of Fishand Wildlife and <strong>the</strong> U.S. Fish and Wildlife Service. In<strong>for</strong>mation and results from <strong>the</strong> <strong>baseline</strong><strong>avian</strong> study have been used in <strong>the</strong> overall environmental impact assessment <strong>for</strong> <strong>the</strong> project.Studies conducted <strong>for</strong> <strong>the</strong> project include fixed-point surveys which targeted raptors and largebirds, paired-plots surveys which targeted breeding passerines in <strong>the</strong> study area, raptor nestsurveys, vegetation/habitat mapping, and general wildlife observations. The principal goals of<strong>the</strong> <strong>baseline</strong> <strong>studies</strong> were to: (1) quantitatively describe <strong>the</strong> temporal and spatial use by birds of<strong>the</strong> study area; and (2) provide <strong>baseline</strong> in<strong>for</strong>mation on <strong>avian</strong> species and <strong>the</strong>ir habitat sufficientto use in evaluating <strong>the</strong> probable impact of <strong>the</strong> development. Detailed study methodology of <strong>the</strong>surveys <strong>for</strong> each component is provided below in <strong>the</strong> text of <strong>the</strong> report.For <strong>the</strong> <strong>avian</strong> use surveys (fixed point surveys), use estimates of <strong>the</strong> study area by species andgroups are calculated as <strong>the</strong> number of detections per survey (ei<strong>the</strong>r 10 or 30 minutes dependingon <strong>the</strong> survey type) standardize to a fixed plot (ei<strong>the</strong>r 100 m or 800 m). Two measures of speciesdiversity in <strong>the</strong> study area were also calculated. Frequency of occurrence was calculated as <strong>the</strong>percent of surveys where a particular species was observed. Species composition wasrepresented by <strong>the</strong> mean use <strong>for</strong> a species divided by <strong>the</strong> total use <strong>for</strong> all species and multipliedby 100 to provide percent composition. An exposure index was calculated by species and groupwhich was a relative measure of <strong>the</strong> risk of each species coming in contact with a turbine basedon use of <strong>the</strong> study area, <strong>the</strong> proportion of observations of a species flying, and <strong>the</strong> proportion ofobservations of a species flying within <strong>the</strong> rotor swept area. Detailed analyses of <strong>the</strong> data andadditional results are provided below in <strong>the</strong> text and tables of <strong>the</strong> report.A total of 336 30-minute point count surveys were conducted between April 20, 2001 and April11, 2002. Based on <strong>the</strong>se fixed-point surveys, passerines comprised 81.0% of all birds observed;corvids (magpies, crows, and ravens) comprised 9.6% of all birds observed; raptors comprised4.8% of all birds observed; and all o<strong>the</strong>r groups combined (e.g., upland game birds, doves,waterfowl, shorebirds) comprised 4.6% of all birds observed. Based on <strong>the</strong> use estimates from<strong>the</strong> fixed-point surveys, <strong>the</strong> three most abundant species in <strong>the</strong> study area were horned lark (7.2detections/30-minute survey), common raven (1.2 detection/30-minute survey) and westernmeadowlark (0.67 detections/survey). Toge<strong>the</strong>r <strong>the</strong>se species comprised more than 76% of <strong>the</strong>total bird use during <strong>the</strong> fixed-point surveys. The most abundant raptors observed were nor<strong>the</strong>rnharrier (51 detections), American kestrel (35), red-tailed hawk (30), Swainson’s hawk (26). Oni
FINAL REPORTMAIDEN WIND PROJECT BASELINE AVIAN STUDIESaverage approximately one nor<strong>the</strong>rn harrier was observed every 7 surveys, one American kestrelevery 10 surveys, one red-tailed hawk every 12 surveys, and one Swainson’s hawk every 16surveys. As a group, approximately 0.56 raptors were observed per 30-minute survey orapproximately 1 raptor every two 30-minute surveys.Two aerial surveys <strong>for</strong> raptor nests were completed (April 30–May 2 and June 18-19, 2001)within <strong>the</strong> raptor nest study area (<strong>the</strong> study area plus five-mile radius buffer). The total areasurveyed was approximately 609 km 2 (235 square miles). A total of 107 raptor or large sticknests were located, 55 of which were classified as active nests during <strong>the</strong> first survey. Nestdensity <strong>for</strong> buteos (ferruginous hawk, red-tailed hawk, Swainson’s hawk) was approximately0.04 nest/km 2 (0.11 nest/mi 2 ). Nest density <strong>for</strong> all raptors located (buteos, falcons, owls) wasapproximately 0.06 nest/km 2 (0.16 nest/mi 2 ).Fifteen paired-plots (30 total points) were established within <strong>the</strong> grassland and shrub-steppehabitat in <strong>the</strong> study area and surveyed once each month from May-July. Ten-minute surveyswere conducted at each point on a survey day with <strong>the</strong> focus of recording breeding passerines in<strong>the</strong> study area. Based on use, <strong>the</strong> three most abundant species observed during <strong>the</strong> paired-plotsurveys were horned lark (2.98 detections/10-minute survey), western meadowlark (1.41detections/survey), and vesper sparrow (1.19 detections/survey). Toge<strong>the</strong>r, <strong>the</strong>se speciescomprised more than 74% of <strong>the</strong> total use during <strong>the</strong> paired-plot surveys. As expected,grassland/shrub-steppe species were <strong>the</strong> most abundant group observed with approximately 7individuals seen during each 10-minute survey. The most abundant raptor observed during <strong>the</strong>paired-plot surveys was nor<strong>the</strong>rn harrier (6 observations). As a group, less than 0.1 raptor wasobserved per10-minute survey, or approximately 1 raptor every 11 surveys.Four basic habitat types (agriculture, steppe, riparian, and wetland) occur in <strong>the</strong> study area. Theagriculture habitat type is comprised of one vegetation type, cropland, and makes upapproximately 35% of <strong>the</strong> study area (6419 acres). The steppe habitat is comprised of four types,grassland steppe, shrub steppe, lithosol, and rock outcrop shrub. The steppe habitats combinedmake up approximately 64% of <strong>the</strong> study area (8527 acres). Riparian habitat was found in drawsbelow springs and along Sulphur Creek. Riparian habitat comprised 1% of <strong>the</strong> study area (135acres). The wetland vegetation type was a minor component of <strong>the</strong> study area and comprised
FINAL REPORTMAIDEN WIND PROJECT BASELINE AVIAN STUDIESAn active ferruginous hawk nest was located in <strong>the</strong> study area during <strong>the</strong> raptor nest survey;however, this nest failed to produce chicks in 2001. Estimated impacts from <strong>the</strong> project are notexpected to exceed what has been reported from o<strong>the</strong>r newer generation <strong>wind</strong> plants that havebeen studied. Additional discussion topics and potential mitigation measures to off-set orminimize impacts are addressed in <strong>the</strong> text below.iii
FINAL REPORTMAIDEN WIND PROJECT BASELINE AVIAN STUDIESTABLE OF CONTENTS1.0 INTRODUCTION....................................................................................................... 12.0 STUDY AREA........................................................................................................... 23.0 METHODS ................................................................................................................ 33.1 FIXED-POINT SURVEY............................................................................................................. 33.1.1 Survey Plots..................................................................................................................... 33.1.2 Observation Schedule......................................................................................................43.2 RAPTOR NEST SURVEY........................................................................................................... 53.3 PAIRED-PLOT SURVEYS .......................................................................................................... 53.4 GENERAL WILDLIFE OBSERVATIONS...................................................................................... 63.5 VEGETATION MAPPING........................................................................................................... 63.6 DATA COMPILATION AND REPORT PREPARATION ................................................................. 63.6.1 Data Compilation and Storage ....................................................................................... 63.6.2 Quality Assurance/Quality Control (QA/QC)................................................................. 63.7 STATISTICAL ANALYSIS AND PRODUCTS ................................................................................ 74.0 RESULTS ................................................................................................................. 94.1 FIXED-POINT RAPTOR AND LARGE BIRD SURVEYS................................................................. 94.1.1 Avian Use ........................................................................................................................ 94.1.2 Frequency of Occurrence and Species Composition .................................................... 104.1.3 Flight Height Characteristics........................................................................................ 114.1.4 Exposure index .............................................................................................................. 114.1.5 Spatial Use .................................................................................................................... 124.2 RAPTOR NEST SURVEY......................................................................................................... 124.3 PAIRED-PLOT SURVEYS ........................................................................................................ 134.3.1 Avian Use ...................................................................................................................... 134.3.2 Frequency of Occurrence and Species Composition .................................................... 144.4 GENERAL WILDLIFE AND IN-TRANSIT OBSERVATIONS ........................................................ 144.4.1 Avian species................................................................................................................. 144.4.2 Threatened, Endangered, State Species of Concern, and Species of Interest............... 144.4.3 Non <strong>avian</strong> species.......................................................................................................... 154.5 VEGETATION MAPPING......................................................................................................... 155.0 SUMMARY AND DISCUSSION.............................................................................. 185.1 AVIAN USE........................................................................................................................... 185.2 SPECIES DIVERSITY .............................................................................................................. 185.3 RISK OF TURBINE COLLISION ............................................................................................... 195.3.1 Exposure Index.............................................................................................................. 195.3.2 Raptors .......................................................................................................................... 195.3.3 Passerines...................................................................................................................... 205.3.5 O<strong>the</strong>r Groups/Species ................................................................................................... 205.4 RAPTOR NESTING ................................................................................................................. 21iv
FINAL REPORTMAIDEN WIND PROJECT BASELINE AVIAN STUDIES5.5 MITIGATION AND MONITORING............................................................................................ 215.5.1 Technical Advisory Committee...................................................................................... 215.5.2 Mitigation Measures ..................................................................................................... 215.5.3 Monitoring..................................................................................................................... 226.0 REFERENCES & LITERATURE CITED................................................................. 23LIST OF TABLESTable 1. Avian species/group observed while conducting fixed-point surveys (April 20, 2001-April 11, 2002) on <strong>the</strong> Maiden Project Site. ..................................................................................24Table 2. Avian species/groups observed within 800 m of point and estimated mean use <strong>for</strong> fixedpointsurveys (April 20, 2001 - April 11, 2002). ...........................................................................27Table 3. Avian species/groups observed within 800 m of point and estimated frequency ofoccurrence <strong>for</strong> fixed-point surveys (April 20, 2001 - April 11, 2002). .........................................29Table 4. Avian species/groups observed within 800 m of point and estimated group composition<strong>for</strong> fixed-point surveys (April 20, 2001 - April 11, 2002).............................................................31Table 5. Flight height characteristics by species observed during fixed-point surveys.................33Table 6. Mean exposure indices calculated by species observed during fixed-point surveys (April20, 2001 - April 11, 2002) .............................................................................................................35Table 7. Raptor and large bird nests located in <strong>the</strong> raptor nest survey area ..................................37Table 8. Avian species observed during <strong>the</strong> three paired-point surveys........................................38Table 9. Average use, frequency of occurrence, and percent composition by species <strong>for</strong> pairedplot surveys <strong>for</strong> all three survey dates............................................................................................40Table 10. Average use, frequency of occurrence, and percent composition by group <strong>for</strong> pairedplot surveys <strong>for</strong> all three survey dates............................................................................................41Table 11. Average use separated by plot <strong>for</strong> each species <strong>for</strong> all three survey dates ....................42Table 12. Average use separated by plot <strong>for</strong> each group <strong>for</strong> all three survey dates ......................43Table 13. Number of groups and total number of individuals of <strong>avian</strong> species of interest,mammals, and reptiles observed incidentally on-site ....................................................................44Table 14. Vegetation types in <strong>the</strong> study area........................................................................................ 45v
FINAL REPORTMAIDEN WIND PROJECT BASELINE AVIAN STUDIESLIST OF FIGURESFigure 1. Proposed Maiden Wind Farm location..........................................................................46Figure 2. Maiden Wind Farm study area map ..............................................................................47Figure 3. Fixed-point survey plots and 800 m buffer ...................................................................48Figure 4. Raptor nest survey area .................................................................................................49Figure 5. Paired-plot survey plots and 100 m buffer ....................................................................50Figure 6. Mean use and frequency of occurrence <strong>for</strong> passerines by survey period......................51Figure 7. Mean use and frequency of occurrence <strong>for</strong> corvids by survey period...........................52Figure 8. Mean use and frequency of occurrence <strong>for</strong> raptors by survey period ...........................53Figure 9. Mean use and frequency of occurrence <strong>for</strong> passerines by station .................................54Figure 10. Mean use and frequency of occurrence <strong>for</strong> corvids by station....................................55Figure 11. Mean use and frequency of occurrence <strong>for</strong> raptors by station.....................................56Figure 12. Mean number of species per survey by survey period ................................................57Figure 13. Nor<strong>the</strong>rn harrier flight paths and perch location recorded during <strong>the</strong> fixed-pointsurveys and incidentally on <strong>the</strong> Maiden Wind Site .......................................................................58Figure 14. Buteo flight paths and perch location recorded during <strong>the</strong> fixed-point surveys andincidentally on <strong>the</strong> Maiden Wind Site ...........................................................................................59Figure 15. Falcon flight paths and perch location recorded during <strong>the</strong> fixed-point surveys andincidentally on <strong>the</strong> Maiden Wind Site ...........................................................................................60Figure 16. O<strong>the</strong>r raptor and large bird flight paths and perch location recorded during <strong>the</strong> fixedpointsurveys and incidentally on <strong>the</strong> Maiden Wind Site ..............................................................61vi
FINAL REPORTMAIDEN WIND PROJECT BASELINE AVIAN STUDIES1.0 INTRODUCTIONBonneville Power Administration (BPA) is evaluating whe<strong>the</strong>r to purchase power from a<strong>proposed</strong> <strong>wind</strong> power development in Yakima and Benton Counties, Washington. The<strong>proposed</strong> site <strong>for</strong> <strong>the</strong> Maiden Wind Farm is located primarily in <strong>the</strong> Rattlesnake Hillsnor<strong>the</strong>ast of <strong>the</strong> town of Sunnyside, Washington. The <strong>proposed</strong> development could be upto 494 MW with as many as 549 turbines and four meteorological towers (met towers)depending on factors such as <strong>the</strong> turbine model selected and power purchase agreements.BPA contracted with Western EcoSystems Technology, <strong>Inc</strong>. (<strong>WEST</strong>) and NorthwestWildlife Consultants, <strong>Inc</strong>. (NWC) to develop a study protocol and conduct a twelvemonth<strong>baseline</strong> study of <strong>avian</strong> use of <strong>the</strong> project area. BPA has committed tocharacterizing <strong>the</strong> <strong>avian</strong> use and resources at <strong>the</strong> Maiden site to estimate <strong>the</strong> level ofpotential impacts <strong>the</strong> project could have on <strong>the</strong>se resources. The following reportcontains <strong>the</strong> results of <strong>the</strong> <strong>avian</strong> <strong>baseline</strong> study <strong>for</strong> <strong>the</strong> one-year period from April 2001 toApril 2002. This <strong>baseline</strong> study provides data <strong>for</strong> describing <strong>the</strong> temporal and spatial useby birds of <strong>the</strong> study area and <strong>for</strong> evaluating <strong>the</strong> probable impact of <strong>wind</strong> powerdevelopment in <strong>the</strong> study area. In<strong>for</strong>mation and results from <strong>the</strong> <strong>baseline</strong> <strong>avian</strong> studyhave been used in <strong>the</strong> overall environmental impact assessment <strong>for</strong> <strong>the</strong> project.Key questions addressed by <strong>the</strong> study include:• What <strong>avian</strong> species and o<strong>the</strong>r wildlife use <strong>the</strong> study area?• What vegetation/habitat types are present in <strong>the</strong> study area?• Where in <strong>the</strong> study area (spatial use) do birds occur and what vegetationtypes/habitats do <strong>the</strong>y use?• What is <strong>the</strong> seasonal and daily (temporal) use of <strong>the</strong> study area <strong>for</strong> given speciesor groups of species?• Are <strong>the</strong>re key habitat features (biotic and/or abiotic) that increase <strong>the</strong> probabilityof <strong>avian</strong> use of an area?• If determinable, do individual species or groups of species exhibit distinctivebehavior patterns over specific habitats, land<strong>for</strong>ms, time of day, or seasons?• How do indices of use of <strong>the</strong> study area by raptors and o<strong>the</strong>r birds compare witho<strong>the</strong>r <strong>wind</strong> plants that have been studied in western North America (e.g.,Minnesota, Oregon, Washington, Wyoming, Cali<strong>for</strong>nia)?The protocol follows similar <strong>avian</strong> <strong>studies</strong> at <strong>the</strong> Vansycle and Stateline Wind Plant inOregon and Washington (Erickson et al. 2000), <strong>the</strong> Buffalo Ridge Wind Plant insouthwest Minnesota (Johnson et al. 2000a), <strong>the</strong> Foote Creek Rim Wind Plant inWyoming (Johnson et al. 2000b), and o<strong>the</strong>r <strong>proposed</strong> <strong>wind</strong> plants in Oregon andWashington (e.g., Nine Canyon, and Condon <strong>wind</strong> sites). The Washington Department1
FINAL REPORTMAIDEN WIND PROJECT BASELINE AVIAN STUDIESof Fish and Wildlife (WDFW) and <strong>the</strong> U.S. Fish and Wildlife Service (USFWS) wereprovided a copy of <strong>the</strong> study protocol <strong>for</strong> review and comment prior to implementation.2.0 STUDY AREAThe Maiden project area is within <strong>the</strong> Columbia Basin Physiographic Province (Franklinand Dyrness 1988). The study area is approximately 12 miles nor<strong>the</strong>ast of Sunnyside and24 miles northwest of Richland, Washington (Figure 1). The study area is east and southof <strong>the</strong> Department of Energy, Han<strong>for</strong>d Site. The initial development would be located in<strong>the</strong> Rattlesnake Hills along <strong>the</strong> primary ridgeline. The north edge of <strong>the</strong> site isapproximately <strong>the</strong> top of <strong>the</strong> ridge with <strong>the</strong> site encompassing a portion of <strong>the</strong> southfacingslope (Figure 2). Expansion of <strong>the</strong> <strong>wind</strong> farm would occur to <strong>the</strong> south and east of<strong>the</strong> initial development in flat to rolling terrain that is primarily agriculture (Figure 2).The vegetation of <strong>the</strong> study area is a mix of grassland/shrub-steppe and drylandagriculture (wheat fields). The grassland/shrub-steppe community is predominantly bigsagebrush (Artemisia tridentata), bluebunch wheatgrass (Pseudoroegneria spicata), andSandberg’s bluegrass (Poa secunda), with <strong>the</strong> introduced species cheatgrass (Bromustectorum) common in disturbed areas (see also Eagle Cap Consulting 2001 <strong>for</strong> additionalvegetation species common in <strong>the</strong> study area). Agriculture and livestock grazing haveconverted <strong>the</strong> overall area to a mosaic of grazed shrub and grassland-steppe,Conservation Reserve Program (CRP) pastures, and cultivated wheat fields. The areawhere <strong>wind</strong> turbines would be located is primarily grassland and shrub-steppe ridge topsand south facing slopes, and areas of dryland wheat. Prevailing <strong>wind</strong>s are from <strong>the</strong>southwest.The primary study area includes <strong>the</strong> <strong>proposed</strong> development area or <strong>the</strong> location of <strong>the</strong><strong>wind</strong> turbines and associated facilities such as met towers, substations, new roads,operations and maintenance facility, underground and overhead powerlines, andconstruction permit areas <strong>for</strong> gravel/borrow material, plant sites, equipment storage orlay-down areas, parking areas, and <strong>the</strong> area within a buffer of approximately 1 mile (1.6km) from all project facilities. All <strong>avian</strong> use surveys, general wildlife observations, andvegetation surveys occurred within <strong>the</strong> study area.The raptor nest study area included <strong>the</strong> primary study area and <strong>the</strong> surrounding areawithin five miles. The helicopter surveys <strong>for</strong> raptor and o<strong>the</strong>r large bird nests occurredwithin this area.2
FINAL REPORTMAIDEN WIND PROJECT BASELINE AVIAN STUDIES3.0 METHODSThe <strong>avian</strong> <strong>baseline</strong> study consisted of five components:1. Fixed-point surveys: point count surveys which target raptors and o<strong>the</strong>r largebirds;2. Raptor nest survey: aerial surveys to locate raptor nests on and within five milesof <strong>the</strong> site;3. Paired-plot surveys: point count surveys which target breeding passerines andsmall birds;4. General wildlife observations: observations of o<strong>the</strong>r wildlife and species ofinterest made while traveling (in-transit) between survey points or incidentallywhile on site;5. Vegetation/habitat mapping.3.1 Fixed-point SurveyThe primary objective of <strong>the</strong> fixed-point surveys was to estimate <strong>the</strong> spatial and temporaluse of <strong>the</strong> Maiden site by raptors and o<strong>the</strong>r large birds. Point counts (variable circularplots) were conducted on site using methods described by Reynolds et al. (1980). Thefixed points were selected to survey as much of <strong>the</strong> study area as possible (Figure 3). Allbirds observed during <strong>the</strong> point counts were recorded, however, <strong>the</strong> emphasis of <strong>the</strong>surveys was in locating and counting raptors and o<strong>the</strong>r large birds (waterfowl, shorebirds,waterbirds, corvids, and grouse), which are commonly thought to be most at risk fromcollisions with turbines. Binoculars were used diligently throughout <strong>the</strong> observationperiods to view likely perch sites, areas where birds might not be detectable due tobackground color and/or texture, and sites where birds have been previously observed.3.1.1 Survey PlotsEight survey plots were established over <strong>the</strong> entire study area: four points in <strong>the</strong> areadesignated <strong>for</strong> <strong>the</strong> initial development which were primarily in grassland/shrub-steppehabitats (labeled points A, B, C, D) and four points in <strong>the</strong> expansion area (labeled F, I, J,K) 1 , which were primarily in agriculture habitats. Each survey plot is a variable circularplot centered on an observation point permanently marked in <strong>the</strong> field. Observationpoints were established so that 800 m radius circles surrounding each point did notoverlap (Figure 3). All birds observed were recorded, however, <strong>the</strong> survey concentratedin <strong>the</strong> area within an approximate 800 m (0.5 mi) radius circle centered on <strong>the</strong>1 Originally 8 points were labeled A-H, however, <strong>the</strong> boundaries of <strong>the</strong> <strong>proposed</strong> development area changed due tolandowner leases and <strong>the</strong>re<strong>for</strong>e <strong>the</strong> survey point layout changed. The original points E, G, and H were dropped and threenew points added and labeled I, J, K to avoid confusion with data collected from a few initial surveys at <strong>the</strong> earlier points.3
FINAL REPORTMAIDEN WIND PROJECT BASELINE AVIAN STUDIESobservation point. Landmarks were located to identify <strong>the</strong> 800 m distance from eachobservation point. Observations of birds beyond <strong>the</strong> 800 m radius were recorded andlogged in <strong>the</strong> database, however, only observations within 800 m of <strong>the</strong> fixed point wereincluded in <strong>the</strong> analyses so that results were standardized among points as well as witho<strong>the</strong>r similar <strong>studies</strong> at o<strong>the</strong>r <strong>wind</strong> plants.Survey periods lasted <strong>for</strong> 30 minutes at each point. All points were visited once per weekbetween April 20, 2001 and April 11, 2002, wea<strong>the</strong>r permitting. All native wildlifeobserved during each survey period were assigned a unique observation number. Raptorsand o<strong>the</strong>r large birds were plotted on a map of <strong>the</strong> survey plot. Wea<strong>the</strong>r in<strong>for</strong>mation suchas temperature, <strong>wind</strong> speed, <strong>wind</strong> direction and cloud cover was recorded <strong>for</strong> eachsurvey. The date, start and end time of <strong>the</strong> observation period, species or best possibleidentification, number of individuals, sex and age class (if possible), distance from plotcenter when first observed, closest distance, altitude above ground, activity (behavior),and habitat(s) were recorded. Flight or movement paths were mapped and given <strong>the</strong>corresponding unique observation number.Four instantaneous counts were conducted during each 30-minute observation period.The first instantaneous count was made at <strong>the</strong> beginning of <strong>the</strong> observation period and <strong>the</strong>remaining counts occurred at 10-minute intervals. An instantaneous count consists of asummary of all birds present in and near <strong>the</strong> plot at a particular time. During <strong>the</strong>instantaneous count, <strong>the</strong> observer made a 360-degree visual scan of <strong>the</strong> survey plot. Foreach raptor or large bird seen during an instantaneous count, <strong>the</strong> approximate heightabove ground and approximate distance from <strong>the</strong> observer was recorded.The behavior of each raptor/large bird observed and <strong>the</strong> habitat in which or over which<strong>the</strong> bird occurred was recorded. Habitats were recorded as fallow, CRP, stubble, wheat,plowed, tree, riparian, grassland/shrub-steppe, and o<strong>the</strong>r. Behavior categories recognizedinclude perched, soaring, flapping, flushed, circle/soaring, hunting, gliding, and o<strong>the</strong>r.The initial flight patterns and habitats (first observation) were uniquely identified on <strong>the</strong>data sheet and subsequent patterns and habitats (if any) also recorded. The general flightdirection of observed birds was recorded on <strong>the</strong> data sheet map. Approximate fligh<strong>the</strong>ight at first observation was recorded to <strong>the</strong> nearest meter and <strong>the</strong> approximate lowestflight height and highest flight height observed were also recorded. Any comments orunusual observations were also recorded.3.1.2 Observation ScheduleSampling intensity <strong>for</strong> <strong>the</strong> study area was designed to document <strong>avian</strong> use and behaviorby habitat within <strong>the</strong> study area. Depending on <strong>the</strong> wea<strong>the</strong>r, at least one observer was at<strong>the</strong> site one day per week. Surveys were conducted weekly and survey periods werescheduled to approximately cover all daylight hours. During a set of surveys, eachselected plot was visited once. Observation days were divided into two periods, morning(6-12) and afternoon (12-6), with each station being surveyed <strong>for</strong> 30 minutes during oneof <strong>the</strong>se periods. To <strong>the</strong> extent practical, a pre-established schedule was developed by <strong>the</strong>field personnel to ensure that each station was surveyed about <strong>the</strong> same number of timeseach period of <strong>the</strong> day during each season. The schedule was flexible in response to4
FINAL REPORTMAIDEN WIND PROJECT BASELINE AVIAN STUDIESadverse wea<strong>the</strong>r conditions (e.g., fog), which caused delays and/or rescheduling ofsurveys.3.2 Raptor Nest SurveyThe objective of <strong>the</strong> raptor nest survey was to ga<strong>the</strong>r in<strong>for</strong>mation on species nesting in<strong>the</strong> area including nest locations visible from <strong>the</strong> air, nesting season (timing), and nestsuccess. The nest survey area included <strong>the</strong> full study area and <strong>the</strong> area within anapproximate 5-mile buffer (Figure 4). The focal species <strong>for</strong> <strong>the</strong> nesting surveys wasferruginous hawk (Buteo regalis), a state threatened species known to occur in Bentonand Yakima counties. Richardson (1996) reports <strong>the</strong> average home range <strong>for</strong> ferruginoushawks in Washington at 79 km 2 (30 mi 2 ). The 5-mile buffer was deemed sufficient toidentify nesting raptors and, in particular, ferruginous hawks potentially affected by <strong>the</strong><strong>wind</strong> plant.The initial nest survey was conducted via helicopter from April 30 - May 2, 2001 whenferruginous hawks in <strong>the</strong> study area would be actively incubating or brooding/attendingyoung (Richardson 1996). GPS coordinates were recorded <strong>for</strong> all raptor or o<strong>the</strong>r largebird species nests located and mapped on topographic maps (1:24,000 scale). A followupsurvey was conducted on June 18 and 19 to visit located nests and look <strong>for</strong> evidenceof nest success (e.g., fledged young nearby, full-grown chicks in <strong>the</strong> nest) and new nestsof late nesting species [e.g., Swainson’s hawk (Buteo swainsoni)].Locations of all nests, including inactive nests, were recorded as <strong>the</strong>y may be occupiedduring o<strong>the</strong>r years. All nests, whe<strong>the</strong>r active or inactive, were given a uniqueidentification number and <strong>the</strong>ir locations recorded in Universal Transverse Mercator(UTM) coordinates. The surveys were conducted by a wildlife biologist experienced inraptor nest surveys. All trees and o<strong>the</strong>r structures, such as power poles with plat<strong>for</strong>msand old <strong>wind</strong>mills, were checked. Permission to fly over <strong>the</strong> Han<strong>for</strong>d Site, Arid LandsEcology Reserve (ALE) was also obtained to cover <strong>the</strong> portion of <strong>the</strong> ALE within fivemiles of <strong>the</strong> <strong>proposed</strong> project. Data about raptor nest sites and nest success wereopportunistically ga<strong>the</strong>red during o<strong>the</strong>r surveys in <strong>the</strong> study area that were visible from<strong>the</strong> routes <strong>the</strong> observers regularly traveled.3.3 Paired-plot SurveysThe primary objective of <strong>the</strong> paired-plot surveys was to characterize <strong>the</strong> breedingpasserine community of <strong>the</strong> shrub- and grassland-steppe habitat on <strong>the</strong> site. A secondaryobjective was to ga<strong>the</strong>r in<strong>for</strong>mation that may be used to estimate potential displacementeffects due to development of <strong>the</strong> site. A paired-plot point-count study design wasutilized to count birds at <strong>proposed</strong> turbine locations and at points in areas where noturbines would be constructed. Paired-points were approximately 300 m apart andoriented perpendicular to <strong>proposed</strong> turbine strings (Figure 5), and were established usinga systematic sample to get good coverage of <strong>the</strong> study area. Survey methods were similarto point count methods used <strong>for</strong> <strong>the</strong> fixed-points except that survey duration was 10minutes at each survey point. All birds seen during <strong>the</strong> point counts were recorded;5
FINAL REPORTMAIDEN WIND PROJECT BASELINE AVIAN STUDIEShowever, <strong>the</strong> emphasis of <strong>the</strong> surveys was passerines within a 100 m radius of <strong>the</strong> point.All paired-plots were visited once each month in May, June, and July.3.4 General Wildlife ObservationsThe objective of <strong>the</strong> general wildlife observations was to document o<strong>the</strong>r wildlifeoccupying <strong>the</strong> study area. All mammals, reptiles, amphibians, and <strong>avian</strong> species ofinterest (e.g., state species of concern 2 , raptors, waterfowl, upland game birds) sightedwhile field observers were on-site or traveling between plots were recorded on datasheets <strong>for</strong> incidental observations. The data recorded are similar to those recorded duringo<strong>the</strong>r surveys. The observation number, date, time, species, number, sex/age class, heightabove ground (<strong>for</strong> birds), and habitat were recorded and <strong>the</strong> point of first observation wasmapped on a project map with a corresponding observation number.3.5 Vegetation MappingThe objective of <strong>the</strong> vegetation mapping was to characterize habitats in <strong>the</strong> area andpotential <strong>avian</strong> community that may be impacted. The vegetation of <strong>the</strong> study area wasmapped on 1:24000 scale USGS topographic maps based on aerial photos (BentonCounty) and ground observations. In<strong>for</strong>mation from <strong>the</strong> vegetation mapping was used tohelp locate <strong>avian</strong> survey points, describe habitat used by <strong>avian</strong> species observed, anddetermine <strong>the</strong> need <strong>for</strong> more detailed vegetation impact analyses. For each vegetationtype identified in <strong>the</strong> study area, a list of dominant species was compiled based on fieldsurveys and from previous work when available.3.6 Data Compilation and Report Preparation3.6.1 Data Compilation and StorageA database was created to store, retrieve and organize field observations. Data from field<strong>for</strong>ms were keyed into electronic data files using a pre-defined <strong>for</strong>mat that madesubsequent data analysis straight<strong>for</strong>ward. All field data <strong>for</strong>ms, field notebooks, andelectronic data files have been retained <strong>for</strong> future reference.3.6.2 Quality Assurance/Quality Control (QA/QC)QA/QC measures were implemented at all stages of <strong>the</strong> study, including in <strong>the</strong> field,during data entry, during data analysis, and report writing. At <strong>the</strong> end of each survey day,each observer was responsible <strong>for</strong> inspecting his or her data <strong>for</strong>ms <strong>for</strong> completeness,accuracy, and legibility. The study team leader periodically reviewed data <strong>for</strong>ms toensure completeness and legibility; any problems detected were corrected. Any changesmade to <strong>the</strong> data <strong>for</strong>ms were initialed and dated by <strong>the</strong> person making <strong>the</strong> change.The electronic database was compared to <strong>the</strong> original data sheets by randomly choosingelectronic records and verifying <strong>the</strong>se with <strong>the</strong> field data sheet. Any errors detected werecorrected by referencing <strong>the</strong> raw data <strong>for</strong>ms and/or consulting with <strong>the</strong> observer(s) whocollected <strong>the</strong> data. Any irregular codes detected, or any data suspected as questionable,2 State Species of Concern are collectively state endangered, threatened, sensitive, and candidate species.6
FINAL REPORTMAIDEN WIND PROJECT BASELINE AVIAN STUDIESwere discussed with <strong>the</strong> observer and study team leader. All changes made to <strong>the</strong> rawdata were documented <strong>for</strong> future reference. Any errors or suspect data identified in laterstages of analysis were traced back to <strong>the</strong> raw data <strong>for</strong>ms, and appropriate changes in allsteps were made.3.7 Statistical Analysis and ProductsStatistics/data generated <strong>for</strong> <strong>the</strong> study area include <strong>the</strong> following:• Species list and number detected by season;• Vegetation/habitat mapping;• Raptor nest locations by species;• Raptor nest occupancy and success;• Relative use by species, species group, and season;• Mean frequency of occurrence and species composition;• Spring/Summer passerine use by survey plots;• Exposure indices by species and species group;• Mean flight characteristics by species and species group;• Wildlife observed in <strong>the</strong> study area.The number of raptors and o<strong>the</strong>r species seen during each point count survey wasstandardized to a unit area and unit time searched. For example, if 4 raptors were seenduring a survey at a point with a viewing area of 2.01 km 2 , <strong>the</strong>se data may bestandardized to 4/2.01 = 1.98 raptors/km 2 in a 30-minute survey. Mean use is reported as<strong>the</strong> number of individuals observed per 30-minute (or 10-minute) survey.The frequency of occurrence by species is calculated as <strong>the</strong> percent of surveys in which aparticular species is observed. Species composition is represented by <strong>the</strong> mean use <strong>for</strong> aspecies divided by <strong>the</strong> total use <strong>for</strong> all species and multiplied by 100 to provide percentcomposition. Frequency of occurrence and percent composition provide relativeestimates of <strong>the</strong> <strong>avian</strong> diversity of <strong>the</strong> study area. A particular species may have high useestimates of <strong>the</strong> site based on just a few observations of large flocks, however, <strong>the</strong>frequency of occurrence will indicate that it occurs during very few of <strong>the</strong> surveys and<strong>the</strong>re<strong>for</strong>e, may be less likely affected by <strong>the</strong> project.A relative index to collision exposure (R) was calculated <strong>for</strong> bird species observed during<strong>the</strong> fixed-point surveys using <strong>the</strong> following <strong>for</strong>mula:R = A*P f *P tWhere A = mean relative use <strong>for</strong> species i (observations within 800 m of observer)averaged across all surveys, P f = proportion of all observations of species i where activitywas recorded as flying (an index to <strong>the</strong> approximate percentage of time species i spendsflying during <strong>the</strong> daylight period), and P t = proportion of all flight height observations ofspecies i within <strong>the</strong> rotor-swept area (RSA). This index does not account <strong>for</strong> differences7
FINAL REPORTMAIDEN WIND PROJECT BASELINE AVIAN STUDIESin behavior o<strong>the</strong>r than flight characteristics (i.e., flight heights and percent of birdsobserved flying).Data were plotted (means and standard deviation) to illustrate differences in raptor ando<strong>the</strong>r bird use between survey period (season) and stations (habitat). Maps of raptor andlarge bird spatial use by observation point as well as <strong>the</strong> whole study area weredeveloped. For analysis, seasons were defined as follows: spring, April 20-May 15, 2001and March 16 - April 11, 2002; summer, May 16 - August 15, 2001; fall, August 16 -October 31, 2001; and winter, November 1, 2001 - March 15, 2002.8
FINAL REPORTMAIDEN WIND PROJECT BASELINE AVIAN STUDIES4.0 RESULTS4.1 Fixed-point Raptor and Large Bird SurveysSurveys were conducted at 8 fixed-point count stations located within <strong>the</strong> study area(Figure 3) approximately once each week between April 20, 2001 and April 11, 2002. Atotal of 336 30-minute point count surveys were conducted.A total of 62 <strong>avian</strong> species and an additional 11 unidentified bird types (best possibleidentifications, e.g. unidentified accipiter) were observed during <strong>the</strong> fixed-point surveys(Table 1). 4,736 total observations in 1,437 different groups 3 were recorded during <strong>the</strong>fixed-point surveys (Table 1). These are simply raw counts of observations, that are notstandardized by <strong>the</strong> number of hours of observation, but do provide an overall list of whatwas observed. These counts likely contain duplicate sightings of <strong>the</strong> same birds.Passerines were by far <strong>the</strong> most numerous group; horned lark and western meadowlarkwere <strong>the</strong> most numerous species observed. Passerines comprised 68.0% of all groupsobserved and 81.0% of <strong>the</strong> total number of birds observed. Raptors comprised 13.6% ofall groups and 4.8% of all birds observed. Corvids (magpies, crows, and ravens)comprised 16.4% of all groups and 9.6% of all birds observed. O<strong>the</strong>r birds (waterfowl,shorebirds, doves, upland game birds, and o<strong>the</strong>r non-passerine species) comprised 1.9%of all groups and 4.6% of all birds observed due mainly to a few large flocks of Canadageese observed flying over <strong>the</strong> study area during <strong>the</strong> fixed-point surveys. Upland gamebirds observed on <strong>the</strong> site included three introduced species, ring-necked pheasant,chukar, and Hungarian (gray) partridge.Observations varied by season (Table 1), with summer having <strong>the</strong> most groups observedand fall <strong>the</strong> most individuals. Winter had <strong>the</strong> second highest number of individualsobserved but <strong>the</strong> fewest number of groups.4.1.1 Avian UseTo standardize <strong>the</strong> data <strong>for</strong> comparison between points and with o<strong>the</strong>r <strong>studies</strong>, <strong>avian</strong> use,frequency of occurrence, and species composition were calculated only fromobservations within 800 m of <strong>the</strong> observation point. Because individual birds were notmarked, counts do not distinguish between individuals; ra<strong>the</strong>r, <strong>the</strong>y provide an estimateof <strong>avian</strong> use of <strong>the</strong> study area. For example, if one red-tailed hawk was observed duringfive surveys, it is unknown if this was <strong>the</strong> same bird seen five times or five different birdsseen once. But this does provide an index of how often or frequent red-tailed hawks occurin <strong>the</strong> study area, and <strong>the</strong>re<strong>for</strong>e are at risk of being impacted by <strong>the</strong> <strong>proposed</strong> project.Any reference to abundance refers to <strong>the</strong> use estimates and not absolute density ornumbers of individuals. Avian use by species was calculated as <strong>the</strong> mean number ofobservations per 30-minute survey (Table 3).3 Group is defined as an observation of a species of bird regardless of number seen toge<strong>the</strong>r. For example, a flock of 8 horned larksflying toge<strong>the</strong>r is a group as well as an individual horned lark observed by itself.9
FINAL REPORTMAIDEN WIND PROJECT BASELINE AVIAN STUDIESBased on use, <strong>the</strong> three most abundant species in <strong>the</strong> study area were horned lark (7.24detections/30-minute survey), common raven (1.16 detections/survey) and westernmeadowlark (0.67 detections/survey). Toge<strong>the</strong>r <strong>the</strong>se species comprised more than 73%of <strong>the</strong> total bird use during <strong>the</strong> fixed-point surveys (Table 2). Passerines were <strong>the</strong> mostabundant group observed with approximately 10 individuals seen during each 30-minutesurvey (Table 2). The most abundant raptors observed were nor<strong>the</strong>rn harrier (0.14detections/30-minute survey), American kestrel (0.10), red-tailed hawk (0.08), andSwainson’s hawk (0.06) (Table 2). On average approximately one nor<strong>the</strong>rn harrier wasobserved every 7 30-minute surveys, one American kestrel every 11 surveys, one redtailedhawk every 12 surveys, and one Swainson’s hawk was observed every 16 surveys.As a group, approximately 0.56 raptors were observed per 30-minute survey (Table 2) orapproximately 1 raptor every 2 surveys.Mean use <strong>for</strong> passerines, corvids, and raptors, <strong>the</strong> three most abundant groups based onuse (Table 2), was plotted by survey period. Passerine use generally increasedthroughout <strong>the</strong> study period, with <strong>the</strong> highest use occurring during <strong>the</strong> fall migrationperiod (Figure 6). Larger flocks of horned larks and o<strong>the</strong>r passerines were observed in<strong>the</strong> fall and winter. Corvid use was similar in <strong>the</strong> fall and winter periods, and lowestduring <strong>the</strong> spring and summer (Figure 7). Raptor use tended to increase throughout <strong>the</strong>spring, summer, fall period, but dropped off in <strong>the</strong> winter (Figure 8). Mean use <strong>for</strong> <strong>the</strong>sethree groups was also plotted by survey station. Passerine use was generally higher in <strong>the</strong>survey plots located primarily in agriculture fields, points F, I, J, K (Figure 9); corvid usevaried across all plots (Figure 10); and raptor use was also highest in <strong>the</strong> agriculturalareas (Figure 11).4.1.2 Frequency of Occurrence and Species CompositionThe frequency of occurrence was calculated as <strong>the</strong> percent of surveys where a particularspecies was observed (Table 3). Species composition is represented by <strong>the</strong> mean use <strong>for</strong>a species divided by <strong>the</strong> total use <strong>for</strong> all species and multiplied by 100 to provide percentcomposition (Table 4). Frequency of occurrence and percent composition providerelative estimates of <strong>the</strong> <strong>avian</strong> diversity of <strong>the</strong> study area. For example, only threespecies were observed in more than one-third (33%) of <strong>the</strong> surveys, horned lark (74%),common raven (45%), western meadowlark (33%), and <strong>the</strong>se three species made upnearly three-quarters of all bird use (74%). The vast majority of species were observed inless than 5% of <strong>the</strong> surveys (Table 3). The most frequently observed raptor was nor<strong>the</strong>rnharrier seen in approximately 12% of all surveys but comprising only 1.2% of <strong>the</strong> totaluse. American kestrel was seen in approximately 8% of all surveys but comprised only0.9% of <strong>the</strong> total use. In contrast, horned larks were observed during more than 74% ofall surveys and comprised approximately 61% of <strong>the</strong> total use (Table 4).As a group, and due primarily to <strong>the</strong> abundance of horned larks, passerines comprisedmore than 83% of <strong>the</strong> <strong>avian</strong> use and were observed in nearly 85% of all <strong>the</strong> surveys(Table 3). Raptor use of <strong>the</strong> site as a group was relatively low with less than one raptorobserved during each 30-minute survey (Table 2) and during approximately 45% of <strong>the</strong>surveys (Table 3). Overall, based on <strong>the</strong> use estimates, raptors, as a group, comprised4.7% of all <strong>avian</strong> use (Table 4).10
FINAL REPORTMAIDEN WIND PROJECT BASELINE AVIAN STUDIESFrequency of occurrence <strong>for</strong> passerines, corvids, and raptors, <strong>the</strong> three most abundantgroups based on use (Table 4), was plotted by survey period. Passerine occurrence wasgenerally steady across <strong>the</strong> study period but dropped during <strong>the</strong> winter (Figure 6). Corvidoccurrence was similar in <strong>the</strong> fall and winter periods, and lowest during <strong>the</strong> spring andsummer (Figure 7). Raptor occurrence increased throughout <strong>the</strong> spring, summer, and fallbut was very low in <strong>the</strong> winter (Figure 8). Frequency of occurrence <strong>for</strong> <strong>the</strong>se threegroups was also plotted by survey station. Passerine occurrence was variable but slightlyhigher in <strong>the</strong> survey plots dominated by agriculture fields (Figure 9); corvid occurrencewas highest in <strong>the</strong> grassland/shrub-steppe plots (Figure 10); and raptor occurrence washighest in <strong>the</strong> agricultural areas (Figure 11).An additional index of species diversity is <strong>the</strong> mean number of species observed persurvey. In general, <strong>the</strong> mean number of species per survey was relatively stable through<strong>the</strong> spring, summer, and fall but dropped during <strong>the</strong> winter (Figure 12).4.1.3 Flight Height CharacteristicsThe proportion of observations of a bird species flying within <strong>the</strong> rotor swept areaprovides a rough estimate of <strong>the</strong> propensity of that species to fly within <strong>the</strong> area occupiedby <strong>the</strong> turbine rotors (Table 5). Since <strong>the</strong> turbine sizes have yet to be determined, <strong>the</strong>“zone of risk” used included <strong>the</strong> area from 25 m above ground level (AGL) to 125 mAGL, which is <strong>the</strong> union of rotor swept areas <strong>for</strong> smaller (e.g., 900 kw) and larger (e.g., 2MW) turbines being considered. Most of <strong>the</strong> passerines observed, with <strong>the</strong> exception of<strong>the</strong> swallows, were regularly observed flying less than 10 meters above <strong>the</strong> ground. Thelarger birds tend to fly higher, and frequently flew greater than 25 meters high, which iswithin <strong>the</strong> primary zone of influence <strong>for</strong> turbine blades <strong>for</strong> most newer generationturbines. As a group, 51% of corvids were observed in <strong>the</strong> zone of risk, followed byraptors (48%), whereas passerines were not likely to be observed within <strong>the</strong> zone of risk(6%) (Table 7). Waterfowl had <strong>the</strong> greatest percent of individuals observed within <strong>the</strong>zone of risk, however, only 3 groups of waterfowl were observed.4.1.4 Exposure indexThe exposure index is a relative measure of <strong>the</strong> risk of each species observed on-siteduring <strong>the</strong> fixed-point surveys coming in contact with a turbine, based on <strong>the</strong> use(measure of abundance) of <strong>the</strong> site by <strong>the</strong> species and <strong>the</strong> flight characteristics observed<strong>for</strong> that species. Common raven, gray-crowned rosy finch, and horned lark had <strong>the</strong>highest exposure indices (Table 6). Horned lark was by far <strong>the</strong> most abundant speciesobserved, but was nearly always observed below <strong>the</strong> zone of risk, whereas <strong>the</strong> one largeflock of rosy finches observed flying was within <strong>the</strong> zone of risk. Mortality <strong>studies</strong> ato<strong>the</strong>r <strong>wind</strong> plants have indicated that although ravens are often observed at <strong>wind</strong> plantswithin <strong>the</strong> zone of risk, <strong>the</strong>y appear to be less susceptible to collision with <strong>wind</strong> turbinesthan o<strong>the</strong>r similar size birds (e.g., raptors, waterfowl). Raptor species with <strong>the</strong> highestexposure index <strong>for</strong> <strong>the</strong> study area include Swainson’s hawk, red-tailed hawk and nor<strong>the</strong>rnharrier. Although nor<strong>the</strong>rn harrier and American kestrel were <strong>the</strong> most abundant raptorspecies observed, both species were observed less often in <strong>the</strong> zone of risk than <strong>the</strong> buteospecies.11
FINAL REPORTMAIDEN WIND PROJECT BASELINE AVIAN STUDIES4.1.5 Spatial UsePoint of first observation, approximate flight paths, and perch locations were mapped <strong>for</strong>raptors and o<strong>the</strong>r large birds observed in <strong>the</strong> project area (Figures 13-16). The objectiveof mapping observed bird locations was to look <strong>for</strong> areas of concentrated use by raptorsand o<strong>the</strong>r large birds. Nor<strong>the</strong>rn harriers were <strong>the</strong> most common raptor observed. Mostnor<strong>the</strong>rn harrier observations were made in <strong>the</strong> agricultural portion of <strong>the</strong> study area(points F, I, J, K), which was generally flat to gently sloping (Figure 13). No patterns inspatial use by nor<strong>the</strong>rn harriers were noted. Buteo observations occurred throughout <strong>the</strong>project area (Figure 14). No obvious patterns in spatial use were noted by buteos,however, <strong>the</strong>re was a concentration of observations associated with <strong>the</strong> powerlinesrunning across <strong>the</strong> western portion of <strong>the</strong> area (Figure 14). Falcon observations alsooccurred throughout <strong>the</strong> project area (Figure 15). Prairie falcons were mostly observed in<strong>the</strong> steppe habitats while American kestrels appear to be more abundant in <strong>the</strong> agricultureareas (Figure 15). While <strong>the</strong>re were very few golden eagle observations, <strong>the</strong>y appeared tobe somewhat concentrated around <strong>the</strong> powerlines in <strong>the</strong> western part of <strong>the</strong> project area(Figure 16). Waterfowl observations were of flocks making long distance movementsacross <strong>the</strong> study area (Figure 16).4.2 Raptor Nest SurveyTwo aerial surveys <strong>for</strong> raptor nests were completed within <strong>the</strong> raptor nest study area(RNA) (<strong>the</strong> study area plus five-mile radius buffer). The total RNA was approximately235 square miles (609 km 2 ) (Figure 4). A total of 107 raptor or large stick nests werelocated, 55 of which were classified as active nests during <strong>the</strong> first survey (Table 7). Nestdensity <strong>for</strong> buteos (ferruginous hawk, red-tailed hawk, Swainson’s hawk) was 0.04nest/km 2 (0.11 nest/mi 2 ). Nest density <strong>for</strong> all raptors located (buteos, falcons, owls) wasapproximately 0.06 nest/km 2 (0.16 nest/mi 2 ).During <strong>the</strong> second raptor nest survey of <strong>the</strong> study area, two new active Swainson’s hawknests were located and two nests initially recorded as a common raven and great-hornedowl were occupied by Swainson’s hawks. The second survey was intended to gain asmuch in<strong>for</strong>mation as possible about nest success from <strong>the</strong> active nests located during <strong>the</strong>first survey. Based on <strong>the</strong> second survey, five raptors, ferruginous hawk, red-tailed hawk,Swainson’s hawk, prairie falcon, and barn owl, as well as common ravens, wereconfirmed producing or fledging chicks in <strong>the</strong> study area (Table 7). Swainson’s hawksgenerally nest later than o<strong>the</strong>r buteos and some of <strong>the</strong> Swainson’s hawk nests in <strong>the</strong> studyarea had not produced young by <strong>the</strong> second visit. While <strong>the</strong>se nest success rates arebased on relatively small sample sizes, <strong>the</strong>y provide an estimate of approximate nestsuccess (i.e., percent of nests that are successful by species), and a record of successfulbreeding by several raptor species in <strong>the</strong> study area.In general, <strong>the</strong> RNA contained relatively poor habitat in terms of nest site availability.No large riparian corridors are encompassed by <strong>the</strong> five-mile radius buffer of <strong>the</strong> site and<strong>the</strong>re are no large cliffs or highwalls. Suitable raptor nesting structures consistedprimarily of isolated trees, power poles, rocky outcrops, and low rocky cliffs. The aerial12
FINAL REPORTMAIDEN WIND PROJECT BASELINE AVIAN STUDIESsurvey method enables/facilitates locating nests which are easily seen from <strong>the</strong> air andgenerally focuses on locating suitable raptor nest structures. Ground nesting species aregenerally missed with this type of survey. It is likely that some ground nesting speciessuch as nor<strong>the</strong>rn harriers, short-eared owls, and burrowing owls nest within <strong>the</strong> surveyarea. The number of <strong>the</strong>se species is unknown. The WDFW Priority Habitats andSpecies database was queried <strong>for</strong> <strong>the</strong> study area. This database indicates that burrowingand short-eared owls nest in <strong>the</strong> study area. This database also documents Swainson’shawk, red-tailed hawk, ferruginous hawk, and prairie falcon nesting in <strong>the</strong> study area.With <strong>the</strong> exception of burrowing and short-eared owls, all of <strong>the</strong>se species were recordedduring <strong>the</strong> raptor nest surveys.4.3 Paired-plot SurveysFifteen paired-plots (30 total points) were established in native habitats within <strong>the</strong> studyarea (Figure 5). These points were surveyed three times, once each in May, June, andJuly. While all birds observed were recorded, <strong>the</strong> focus of <strong>the</strong> surveys was to recordbreeding passerines and o<strong>the</strong>r small birds, primarily grassland/shrub-steppe species. Thesurvey ef<strong>for</strong>t concentrated on identifying birds within 100 m of <strong>the</strong> survey point.A total of 28 <strong>avian</strong> species and an additional 6 unidentified bird types (best possibleidentifications, e.g. unidentified hummingbird) were observed during <strong>the</strong> paired-plot(passerine) surveys (Table 8). Horned lark and western meadowlark were <strong>the</strong> mostnumerous species observed, comprising 34.3% and 27.3% of all groups and 34.9% and25.1% of all birds observed respectively. Grassland/shrub-steppe species were <strong>the</strong> mostcommon groups observed comprising nearly 91% of all groups and 88% of all birdsobserved. No waterfowl and only one shorebird (killdeer) were observed during <strong>the</strong>surveys. Raptors comprised only 1.9% of all groups and 1.7% of all birds observed.4.3.1 Avian UseAvian use by species was calculated as <strong>the</strong> mean number of observations per 10-minutesurvey within 100 m of <strong>the</strong> point (Table 10). 841 total observations in 726 differentgroups 4 were observed during <strong>the</strong> paired-plot surveys (Table 8). As with <strong>the</strong> fixed-pointsurveys, <strong>the</strong>se are simply raw counts of observations, that were not standardized by <strong>the</strong>number of hours of observation or distance from observer, but do provide an overall listof what was observed. Because individual birds were not marked, <strong>the</strong>se counts also donot distinguish between individuals; ra<strong>the</strong>r, <strong>the</strong>y provide an estimate of use. Reference toabundance refers to <strong>the</strong> use estimates and not absolute density or numbers of individuals.Based on use, <strong>the</strong> three most abundant species observed during <strong>the</strong> paired-plot surveyswere horned lark (2.98 detections/10-minute survey), western meadowlark (1.41detections/survey), and vesper sparrow (1.19 detections/survey). Toge<strong>the</strong>r, <strong>the</strong>se speciescomprised more than 74% of <strong>the</strong> total use during <strong>the</strong> paired-plot surveys (Table 10). Asexpected, grassland/shrub-steppe species were <strong>the</strong> most abundant group observed withapproximately 7 individuals seen during each 10-minute survey (Table 11). The most4 Group is defined as an observation of a species of bird regardless of number seen toge<strong>the</strong>r. For example, a flock of 8 horned larksflying toge<strong>the</strong>r is a group as well as an individual horned lark observed by itself.13
FINAL REPORTMAIDEN WIND PROJECT BASELINE AVIAN STUDIESabundant raptor observed during <strong>the</strong> paired-plot surveys was nor<strong>the</strong>rn harrier (6observations) (Table 9). As a group, less than 0.1 raptor was observed/10-minute survey(Table 11), or approximately 1 raptor every 11 surveys.The paired-plot survey was set up so that one point of each pair was located at a <strong>proposed</strong>turbine location (ridge top) and one point off-set perpendicular to <strong>the</strong> turbine string by300 m (ridge slope or valley). This design will enable post-construction displacementeffect monitoring if desired. Use was calculated separately <strong>for</strong> <strong>the</strong> turbine points and <strong>the</strong>off-set points (Table 12) <strong>for</strong> possible future use in understanding displacement effects.The offset points indicated slightly higher overall use, as well as use by grassland/shrubsteppeand raptor species compared to <strong>the</strong> turbine plots, but <strong>the</strong> differences were notstatistically significant (Table 13).4.3.2 Frequency of Occurrence and Species CompositionThe frequency of occurrence was calculated as <strong>the</strong> percent of surveys where a particularspecies was observed (Table 10). Species composition is represented by <strong>the</strong> mean use<strong>for</strong> a species divided by <strong>the</strong> total use <strong>for</strong> all species and multiplied by 100 to providepercent composition (Table 10). Four species were observed in more than 30% of <strong>the</strong>surveys, horned lark (86%), western meadowlark (82%), vesper sparrow (74%), andgrasshopper sparrow (32%) (Table 10), and <strong>the</strong>se four species made up nearly 84% of <strong>the</strong><strong>avian</strong> use during <strong>the</strong> paired-plot surveys. The vast majority of species were observed inless than 5% of <strong>the</strong> surveys. The most frequently observed raptor was nor<strong>the</strong>rn harrierwhich was seen in approximately 3% of all surveys but comprising only 0.5% of all <strong>avian</strong>use. Horned larks were observed during more than 85% of all surveys and comprisednearly 42% of <strong>the</strong> <strong>avian</strong> use during <strong>the</strong> paired-plot surveys (Table 10).As a group, due primarily to <strong>the</strong> abundance of horned larks on <strong>the</strong> site, <strong>the</strong>grassland/shrub-steppe species comprised nearly 93% of all bird observations and wereobserved during all <strong>the</strong> surveys (Table 11). Raptor use of <strong>the</strong> site as a group wasrelatively low. Raptors were seen in approximately 9% of <strong>the</strong> surveys and averaged lessthan one raptor observed during each 10-minute survey. Overall, based on <strong>the</strong> useestimates, raptors, as a group, only comprised 1.2% of all <strong>avian</strong> use during <strong>the</strong> paired-plotsurveys (Table 11).4.4 General Wildlife and In-Transit Observations4.4.1 Avian speciesAvian species of interest were recorded when observed on-site during periods whenobservers were traveling to survey points, in-transit between survey points, or on-site <strong>for</strong>o<strong>the</strong>r purposes (Table 14). Several <strong>avian</strong> species of interest were observed on-siteoutside of <strong>the</strong> scheduled surveys (fixed-point or paired-plot), including merlin, sagethrasher, sage sparrow, and loggerhead shrike.4.4.2 Threatened, Endangered, State Species of Concern, and Species of InterestOne bald eagle was observed in <strong>the</strong> study area on March 20, 2002. This observation wasmade incidentally while <strong>the</strong> observer was traveling to <strong>the</strong> survey points, so did not factor14
FINAL REPORTMAIDEN WIND PROJECT BASELINE AVIAN STUDIESinto <strong>the</strong> use estimates <strong>for</strong> <strong>the</strong> site. The bald eagle was observed perched on <strong>the</strong> ground<strong>for</strong>aging on an unknown carcass and was accompanied by 15 common ravens.One state endangered species, peregrine falcon, was observed on-site. Two peregrinefalcons were observed during a fixed-point count on September 30, 2001. One statethreatened species, ferruginous hawk, was also observed on-site. Several observations offerruginous hawk were made incidentally on-site and during fixed-point and paired-plotsurveys, and an active ferruginous nest was located on-site during <strong>the</strong> April 30, 2001raptor nest survey. Several state candidate species were recorded on <strong>the</strong> site includingmerlin, golden eagle, sage thrasher, loggerhead shrike, and sage sparrow.4.4.3 Non <strong>avian</strong> speciesFive species of mammals, elk (Cervis elaphus), mule deer (Odocoileus hemionus),Townsend’s ground squirrel (Spermophilus townsendii), porcupine (Erethizon dorsatum),and coyote (Canis latrans); and two species of reptiles, short-horned lizard (Phrynosomadouglassi), and yellow-bellied racer (Coluber constrictor) were observed in <strong>the</strong> studyarea during <strong>the</strong> <strong>studies</strong>. Sign (scat) from one additional mammal, unidentified jackrabbit(Lepus sp.) was also found on site. Elk and mule deer were fairly common on-site. Atotal of 176 elk and 67 mule deer were observed in 5 and 17 groups respectively (Table14). Both elk and mule deer were observed primarily along <strong>the</strong> ridgeline of RattlesnakeRidge and <strong>the</strong> adjoining slopes. However, mule deer were also observed in <strong>the</strong> easternsections of <strong>the</strong> study area which consist primarily of agricultural (wheat) fields.4.5 Vegetation MappingThe vegetation in <strong>the</strong> study area was classified into seven types (Table 14). Vegetationtype refers to <strong>the</strong> generally recognizable assemblage of plant species that currently existsin a pattern across <strong>the</strong> landscape. Vegetation types were determined based on a visualassessment of dominant and co-dominant plant species. Vegetation types varied inquality from site to site depending on <strong>the</strong> aspect, soil depth, percentage of non-nativeplants, and land use, all of which can influence <strong>the</strong> extent of wildlife use within <strong>the</strong>habitat type.Agricultural. This vegetation type consists of all lands within <strong>the</strong> study area used <strong>for</strong> <strong>the</strong>production of crops, primarily non-irrigated wheat. These areas provide <strong>for</strong>aging andcover areas <strong>for</strong> some common wildlife species such as horned larks and westernmeadowlarks. Agriculture also provides <strong>for</strong>aging areas <strong>for</strong> raptors due, presumably, to aconcentration or abundance of small mammals. Agricultural habitat is found in <strong>the</strong>eastern portion of <strong>the</strong> study area (Figure 6).Riparian. Riparian habitat includes those areas adjacent to streams, springs, and seepswithin <strong>the</strong> study area. Riparian habitat is typically narrow and often confined within <strong>the</strong>steep walls of drainages. Tree and shrub species are common in most riparian habitat.Common tree and shrub species include chokecherry (Prunus virginiana), golden current(Ribes aureum), and red-osier dogwood (Cornus sericea ssp. sericea) in <strong>the</strong> higherelevation riparian habitat, and black cottonwood (Populus balsamifera ssp. trichocarpa)and various willows (Salix spp.) in <strong>the</strong> lower elevations. Common understory plants15
FINAL REPORTMAIDEN WIND PROJECT BASELINE AVIAN STUDIESinclude various rush species (Juncus spp.), speedwell species (Veronica spp.), and mesicgrasses such as spike bentgrass (Agrostis exarata) and slender hairgrass (Deschampsiaelongata). Riparian areas are of high value to wildlife <strong>for</strong> water, food, and shelterthroughout <strong>the</strong> year. Where trees are present, riparian areas provide habitat <strong>for</strong> nestingbirds, particularly raptors. They also serve as travel corridors <strong>for</strong> wildlife.Shrub-Steppe. Big sagebrush and/or threetip sage (Artemesia tripartita) are <strong>the</strong> dominantshrub species in <strong>the</strong> shrub-steppe habitat type. Big sagebrush is more common at <strong>the</strong>lower elevations in deeper soils, where in some areas it reaches 4 to 5 feet tall. Threetipsage is more common on <strong>the</strong> upper slopes in drier, shallower soils. Bluebunchwheatgrass and cheatgrass are <strong>the</strong> most common grasses associated with this habitat type;Idaho fescue (Festuca idahoensis), Sandberg’s bluegrass, and Cusick’s bluegrass (Poacusickii) also occur. Common <strong>for</strong>bs include longleaf phlox (Phlox longifolia), yarrow(Achellia millifolium), sulphur lupine (Lupinus sulphureus), and largeflower triteleia(Triteleia grandiflora var. grandiflora). Some areas of shrub-steppe habitat showevidence of recent burns. The condition of this habitat type in <strong>the</strong> study area ranges frompoor quality (heavily grazed and weedy) to good quality (lightly grazed, vigorous shrubs)habitat. The shrub-steppe provides important habitat <strong>for</strong> many species; <strong>for</strong> example, deerand small game find escape cover, breeding habitat, and <strong>for</strong>age in <strong>the</strong> shrub-steppe.Several State candidate species, loggerhead shrike, sage thrasher, and sage sparrow alsoutilize <strong>the</strong> shrub-steppe type <strong>for</strong> cover and nesting.Grassland-Steppe. The grassland-steppe encompasses those areas where grass speciesare dominant; however, scattered shrubs (low density) also occur. Much of <strong>the</strong>grassland-steppe is dominated by cheatgrass; o<strong>the</strong>r common grass species found includebulbous bluegrass (Poa bulbosa) and varying amounts of native grasses, such asbluebunch wheatgrass, Sandberg’s bluegrass, and Idaho fescue. In some isolated moistareas, giant wildrye is dominant. Common <strong>for</strong>bs include longleaf phlox and sulphurlupine. The grassland-steppe tends to occur at higher elevations and on steeper slopesthan <strong>the</strong> shrub-steppe, and those areas where <strong>the</strong> soils appear to be shallower. Like <strong>the</strong>shrub-steppe, <strong>the</strong> grassland-steppe is subject to grazing with habitat quality varying frompoor to good. The grassland-steppe provides cover, breeding habitat, and <strong>for</strong>age <strong>for</strong> avariety of bird and wildlife species.Lithosol Habitat. The lithosol habitat is a subset of <strong>the</strong> grassland-steppe. Lithosol refersto areas of exposed shallow, rocky soils, as found along some areas of <strong>the</strong> ridgetop. Inthis habitat, various buckwheats (Eriogonum spp.) and Sandberg’s bluegrass aredominant. Vegetative cover is sparse. This habitat appears to provide limited value <strong>for</strong>birds and o<strong>the</strong>r wildlife; however, it likely receives occasional use by various birds, smallmammals, and reptiles (e.g., short-horned lizard) and creates a mosaic of steppe habitatswhere it is present, increasing species diversity and habitat variability.Rocky Outcrop/Shrub. This habitat type is found on <strong>the</strong> upper steep, north-facing slopeof Rattlesnake Hill. This habitat is limited in size, making up only a small portion of <strong>the</strong>total habitat in <strong>the</strong> study area. Dominant shrub species include chokecherry and squawcurrent. Although small in size, this habitat type provides habitat <strong>for</strong> nesting birds,16
FINAL REPORTMAIDEN WIND PROJECT BASELINE AVIAN STUDIESincluding raptors, as well as food and shelter throughout <strong>the</strong> year <strong>for</strong> passerines andupland game species.Wetlands. The wetland habitat type includes those areas that may meet <strong>the</strong> Army Corpsof Engineers’ (ACOE) definition of a wetland and may be regulated by that agency. In<strong>the</strong> study area, six locations qualify as wetlands; five are associated with springs and <strong>the</strong>sixth is located along Sulphur Creek where <strong>the</strong> access road crosses <strong>the</strong> creek. Thewetland habitats are very small in size (0.04 acres or less), and are heavily used by cattle.Common plant species associated with <strong>the</strong> wetlands include celery-leaved buttercup(Ranunculus sceleratus), yellow monkeyflower (Mimulus guttatus), speedwell (Veronicaanagallis-aquatica), and water-cress (Rorippa nasturtium-aquaticum). Although <strong>the</strong>wetlands receive heavy cattle use, <strong>the</strong>y also provide important habitat and water sources<strong>for</strong> o<strong>the</strong>r species such as big game, reptiles, songbirds, bats, and game birds, which willconcentrate <strong>the</strong>ir activities near <strong>the</strong>se watering sites at various times of <strong>the</strong> year.17
FINAL REPORTMAIDEN WIND PROJECT BASELINE AVIAN STUDIES5.0 SUMMARY AND DISCUSSION5.1 Avian UseBased on <strong>the</strong> fixed-point surveys, three species made up <strong>the</strong> vast majority ofobservations: horned lark, common raven, and western meadowlark. Toge<strong>the</strong>r <strong>the</strong>sethree species comprised nearly three-quarters of all birds observed during <strong>the</strong> fixed-pointsurveys. This trend held across all seasons. On average, slightly more than 7 hornedlarks, slightly more than 1 raven, and approximately 1 western meadowlark wereobserved during every 30-minute survey. The fourth most common bird recorded wasunidentified passerine followed by vesper sparrow. It is likely than many of <strong>the</strong>unidentified passerines recorded were actually horned larks, based on <strong>the</strong> abundance ofthis species on <strong>the</strong> site, but were at distances from observers that made identificationdifficult. Highest passerine use occurred during <strong>the</strong> fall and winter due primarily to largeflocks of horned larks observed during <strong>the</strong>se seasons (Figure 6).The paired-plot surveys were designed to target breeding grassland/shrub-steppe speciesthat occupy <strong>the</strong> site. Use estimates from <strong>the</strong>se surveys reflect <strong>the</strong> fixed-point surveyresults, with <strong>the</strong> exception that common raven drops out of <strong>the</strong> three most abundantspecies (based on use) and is replaced by vesper sparrow, <strong>the</strong> fifth most abundant speciesduring fixed-point surveys.Over all three seasons, <strong>the</strong> most abundant raptors observed in order were nor<strong>the</strong>rn harrier,American kestrel, red-tailed hawk, and Swainson’s hawk. On average approximately onenor<strong>the</strong>rn harrier was observed every 7 surveys, one American kestrel every 11 surveys,one red-tailed hawk every 12 surveys, and one Swainson’s hawk was observed every 16surveys. The most abundant raptor varied by season, however, and raptor use and raptorspecies observed were highest in <strong>the</strong> fall (Table 2, Figure 8). As expected, and similar tomost o<strong>the</strong>r <strong>wind</strong> sites studied, raptor use dropped substantially during <strong>the</strong> winter.5.2 Species DiversityFrequency of occurrence and percent composition were calculated to provide a relativeestimate of <strong>the</strong> <strong>avian</strong> diversity of <strong>the</strong> study area. These statistics reflect <strong>the</strong> results of <strong>the</strong>use calculations in that <strong>the</strong>re is relatively low species diversity on <strong>the</strong> site with threespecies (horned lark, common raven, western meadowlark) making up <strong>the</strong> vast majorityof <strong>the</strong> observations. For example, <strong>the</strong>se three species were <strong>the</strong> only species observed inmore than 30% of <strong>the</strong> surveys with <strong>the</strong> vast majority of species observed in less than 5%of <strong>the</strong> surveys (336 total surveys), and comprised more than three-quarters of all bird useat <strong>the</strong> site (76.5%). Horned larks had <strong>the</strong> greatest influence on <strong>the</strong>se statistics. Theywere observed during more than 74% of all surveys and comprised greater than 61% ofall bird use.The most frequently observed raptor was nor<strong>the</strong>rn harrier, seen in approximately 12% ofall surveys but comprising only 1.2% of all bird use. American kestrel was seen in18
FINAL REPORTMAIDEN WIND PROJECT BASELINE AVIAN STUDIESapproximately 8% of all surveys and comprised 0.9% of all birds use. Overall, raptors asa group comprised 4.7% of all bird use with less than one raptor observed during each30-minute survey (0.56). In contrast, due primarily to <strong>the</strong> abundance of horned larks on<strong>the</strong> site, passerines comprised nearly 85% of all bird observations and approximately 10passerines were observed during each 30-minute survey.5.3 Risk of Turbine Collision5.3.1 Exposure IndexThe species with <strong>the</strong> highest exposure indices <strong>for</strong> <strong>the</strong> site were common raven, graycrownedrosy finch, and horned lark (Table 7). Horned lark is by far <strong>the</strong> most abundantspecies observed, but was nearly always observed below <strong>the</strong> zone of risk, whereas <strong>the</strong>one observation of a flock of 52 rosy finches was observed flying within <strong>the</strong> zone of risk.Mortality <strong>studies</strong> at o<strong>the</strong>r <strong>wind</strong> plants have indicated that although ravens are oftenobserved at <strong>wind</strong> plants within <strong>the</strong> zone of risk, <strong>the</strong>y appear to be less susceptible tocollision with <strong>wind</strong> turbines than o<strong>the</strong>r similar size birds (e.g., raptors, waterfowl).Raptor species with <strong>the</strong> highest exposure index include Swainson’s hawk, red-tailedhawk and nor<strong>the</strong>rn harrier. Although nor<strong>the</strong>rn harrier and American kestrel were <strong>the</strong>most abundant raptor species observed, both species were observed less often in <strong>the</strong> zoneof risk than <strong>the</strong> buteo species.5.3.2 RaptorsBased on <strong>the</strong> relative low use of <strong>the</strong> study area by raptors, potential raptor mortality <strong>for</strong>this project is expected to be low. One potentially confounding factor is <strong>the</strong> presence ofthree active raptor nests (one ferruginous hawk, one red-tailed hawk, one prairie falcon)in <strong>the</strong> study area during <strong>the</strong> 2001 raptor nest survey that were within 0.25 to 0.5 mile of<strong>proposed</strong> project features. The presence of <strong>the</strong>se nests may put adult birds of <strong>the</strong> nestingpair at greater risk while <strong>the</strong>y actively attend young in <strong>the</strong> nest and may put fledglingjuveniles at risk due simply to <strong>the</strong>ir proximity to turbines. The raptors expected to bemost at risk of collision are <strong>the</strong> species most abundant in <strong>the</strong> study area, Americankestrel, nor<strong>the</strong>rn harrier, and red-tailed hawk. All three of <strong>the</strong>se species have also beencasualties at o<strong>the</strong>r studied <strong>wind</strong> plants (see Erickson et al. 2001).Raptor use of <strong>the</strong> Maiden site was similar to o<strong>the</strong>r <strong>wind</strong> plants studied. As a group,overall raptor use of <strong>the</strong> study area was approximately 0.56 raptors observed per 30-minute survey or roughly one raptor observed every 1.8 surveys. For comparison, raptoruse at three <strong>wind</strong> plants studied with <strong>the</strong> same methods 5 varied from slightly lower tomuch higher. Raptor use at <strong>the</strong> Vansycle Wind Plant was approximately 0.55 raptors per30-minute survey; at <strong>the</strong> Buffalo Ridge Wind Plant raptor use was approximately 0.74raptors per 30-minute survey; and at <strong>the</strong> Foote Creek Rim Wind Plant raptor use wasapproximately 1.10 raptors per 30-minute survey.Raptor mortality at o<strong>the</strong>r newer generation <strong>wind</strong> plants is very low. The estimate ofraptor mortality at <strong>the</strong> Foote Creek Rim Wind Plant in Wyoming is <strong>the</strong> highest observed5 Fixed-point surveys were conducted following <strong>the</strong> same methods at all three <strong>wind</strong> plants but had variable survey duration. Thecalculated use at <strong>the</strong>se <strong>wind</strong> plants was standardized to 30-minute duration surveys under <strong>the</strong> assumption that raptor observations wereuni<strong>for</strong>m across time <strong>for</strong> each survey period.19
FINAL REPORTMAIDEN WIND PROJECT BASELINE AVIAN STUDIESand is 0.036 raptors per turbine per year based on a two-year study of 69 turbines(Erickson et al. 2001). No raptor mortality was observed at <strong>the</strong> Vansycle Wind Plant inOregon during a one-year study; and 0.001 raptors per turbine per year were found at <strong>the</strong>Buffalo Ridge Wind Plant in Minnesota during a four-year study (Erickson et al. 2001).Considering <strong>the</strong>se mortality results as well as raptor use estimates at <strong>the</strong>se <strong>wind</strong> plants, itis estimated that potential mortality of raptors at <strong>the</strong> <strong>proposed</strong> project would be less thanone-half that of <strong>the</strong> Foote Creek Rim Wind Plant (or less than 0.016 raptors per turbineper year); approximately equal to that of <strong>the</strong> Buffalo Ridge Wind Plant (or approximately0.001 raptor per turbine per year); or slightly greater than that of <strong>the</strong> Vansycle Wind Plant(or greater than 0 raptors per turbine per year). Using <strong>the</strong>se raptor mortality rates, a rangeof 0 to 9 raptor fatalities per year at <strong>the</strong> Maiden Wind Farm could occur if all 549turbines were constructed. This estimate would be lower if only a portion of <strong>the</strong> <strong>wind</strong>plant is constructed.5.3.3 PasserinesPasserines have been <strong>the</strong> most abundant <strong>avian</strong> fatality at o<strong>the</strong>r <strong>wind</strong> plants studied (seeJohnson et al. 2000, Young et al. 2001, Erickson et al. 2000), often comprising more than80% of <strong>the</strong> <strong>avian</strong> fatalities. Both migrant and resident passerine fatalities have beenobserved. Given that passerines make up <strong>the</strong> vast majority of <strong>the</strong> <strong>avian</strong> observations onsite,it is expected passerines would make up <strong>the</strong> largest proportion of fatalities.Common species such as horned larks, western meadowlarks and vesper sparrows (allconfirmed casualties at o<strong>the</strong>r <strong>wind</strong> plants) would be most at risk. Nocturnal migratingspecies may also be affected, but would not be expected to be found in large numbersbased on data collected at o<strong>the</strong>r <strong>wind</strong> plants [i.e., no large mortality events documented at<strong>wind</strong> plants (Erickson et al. 2001)].Carcass search <strong>studies</strong> at <strong>the</strong> Foote Creek Rim Wind Plant, Wyoming, have found <strong>avian</strong>casualties associated with guyed met towers. Based on searches of five permanent mettowers at Foote Creek Rim over a two-year period, it was estimated that <strong>the</strong>se towersresulted in 7.5 <strong>avian</strong> casualties per tower per year, <strong>the</strong> majority of which were passerines(Young et al. 2001). The four permanent met towers <strong>proposed</strong> <strong>for</strong> <strong>the</strong> project, if guyed,would be expected to result in collision deaths <strong>for</strong> passerines at <strong>the</strong> site.5.3.4 WaterfowlSome waterfowl mortality has been documented at o<strong>the</strong>r <strong>wind</strong> plants (Johnson et al.2000), although <strong>studies</strong> at Foote Creek Rim, Vansycle, and Buffalo Ridge have notdocumented mortality of Canada geese, one of two waterfowl species observed flyingover <strong>the</strong> Maiden study area. Because of <strong>the</strong> low use of <strong>the</strong> site by waterfowl, nowaterfowl mortality would be expected from <strong>the</strong> project.5.3.5 O<strong>the</strong>r Groups/SpeciesO<strong>the</strong>r <strong>avian</strong> groups (e.g., upland game birds, doves, shorebirds) occur in relatively lownumbers within <strong>the</strong> study area and mortality would be expected to be low. O<strong>the</strong>r speciesonly observed during migration may be at risk; however, mortality would be expected tobe low given <strong>the</strong> low use estimates by o<strong>the</strong>r species.20
FINAL REPORTMAIDEN WIND PROJECT BASELINE AVIAN STUDIES5.4 Raptor NestingTwo aerial surveys <strong>for</strong> raptor nests were completed within <strong>the</strong> raptor nest study area(RNA) (<strong>the</strong> study area plus five-mile radius buffer). The total RNA was approximately235 square miles (609 km 2 ) (Figure 4). Nest density <strong>for</strong> buteos (ferruginous hawk, redtailedhawk, Swainson’s hawk) was 0.04 nest/km 2 (0.11 nest/mi 2 ) and <strong>for</strong> all raptors(buteos, falcons, owls) was approximately 0.06 nest/km 2 (0.16 nest/mi 2 ). This index ofraptor nest density falls within <strong>the</strong> range of o<strong>the</strong>r <strong>wind</strong> plants that have been studied. Forexample, <strong>the</strong> nest density in a 10-mile buffer surrounding <strong>the</strong> Foote Creek Rim WindPlant in Wyoming is 0.07 nest/km 2 (0.19 nest/mi 2 ) (Johnson et al., 2000b). Nest densitywithin a 2-mile buffer around <strong>the</strong> Stateline Wind Plant in Oregon and Washington is 0.08nest/km 2 (0.20 nest/mi 2 ) (URS and <strong>WEST</strong> 2001).5.5 Mitigation and Monitoring5.5.1 Technical Advisory CommitteeIt is recommended that a Technical Advisory Committee (TAC) be <strong>for</strong>med to evaluate<strong>the</strong> mitigation and monitoring program and determine <strong>the</strong> need <strong>for</strong> fur<strong>the</strong>r <strong>studies</strong> orfur<strong>the</strong>r mitigation measures should <strong>the</strong> project go <strong>for</strong>ward. The TAC should becomposed of representatives from Bonneville Power Administration, WashingtonDepartment of Fish and Wildlife, U.S. Fish and Wildlife Service, Yakima and BentonCounties, landowners, and <strong>the</strong> project proponent. The role of <strong>the</strong> TAC will be tocoordinate appropriate habitat and <strong>avian</strong> fatality mitigation measures, monitor impacts towildlife and habitat, and address issues that arise regarding wildlife impacts duringconstruction and operation of <strong>the</strong> <strong>wind</strong> plant. The post-construction monitoring planshould be developed in coordination with <strong>the</strong> TAC.5.5.2 Mitigation MeasuresThe following are potential mitigation measures <strong>for</strong> impacts to wildlife from constructionand operation of <strong>the</strong> Maiden Wind Farm:• An environmental inspector should be designated by <strong>the</strong> Technical AdvisoryCommittee (TAC) (see above) and/or BPA to monitor construction activity andensure compliance with <strong>the</strong> mitigation measures.• Sensitive habitat areas such as <strong>the</strong> springs, riparian corridors, and raptor nest sitesshould be mapped, flagged, and identified to all contractors working on-site andshould be designated as no disturbance zones during <strong>the</strong> construction phase. Ifany new nesting, denning, or o<strong>the</strong>rwise sensitive wildlife sites are located duringconstruction, <strong>the</strong>se areas should also be mapped and flagged and included in <strong>the</strong>off-limit areas.• During project construction, best management practices should be employed toreduce peripheral impacts to adjacent vegetation and habitats and to minimize <strong>the</strong>construction footprint.21
FINAL REPORTMAIDEN WIND PROJECT BASELINE AVIAN STUDIES• A site management plan should be developed in coordination with <strong>the</strong> TAC toaddress <strong>the</strong> following items at a minimum:• minimizing road construction and vehicle use where possible to reduceimpacts to shrub-steppe habitats• educating construction personnel to <strong>the</strong> sensitive nature of <strong>the</strong> habitat andwildlife resources• maintaining and en<strong>for</strong>cing reasonable driving speeds so as not to harass oraccidentally strike wildlife• providing adequate on-site waste disposal• identifying off-limit zones• identifying fire management and erosion control procedures.• The raptor nests on-site should be monitored <strong>for</strong> activity prior to construction of<strong>the</strong> <strong>wind</strong> plant to determine <strong>the</strong> need <strong>for</strong> construction timing restrictions around<strong>the</strong> nests or adjustment to <strong>the</strong> project design to avoid impacts.• Consideration should be made <strong>for</strong> moving or eliminating all turbines within 0.25mile of raptor nests on-site.• All power and communication lines on-site should be buried underground wherefeasible.• Consideration should be made <strong>for</strong> using free standing non-guyed met towers onsite.5.5.3 MonitoringA post construction monitoring study is recommended <strong>for</strong> <strong>the</strong> project to quantify impactsto <strong>avian</strong> species and assess <strong>the</strong> adequacy of mitigation measures implemented. Amonitoring plan <strong>for</strong> <strong>the</strong> project should consider <strong>the</strong> following components: 1) fatalitymonitoring involving standardized carcass searches, scavenger removal trials, searcherefficiency trials, and reporting of incidental fatalities by maintenance personnel ando<strong>the</strong>rs; 2) a minimum of one breeding season of post construction paired-plot surveys; 3)a minimum of one post construction breeding season raptor nest survey of <strong>the</strong> study areaand a 2-mile buffer to locate active raptor nests potentially affected by <strong>the</strong> constructionand operation of <strong>the</strong> <strong>wind</strong> plant.The protocol <strong>for</strong> <strong>the</strong> fatality monitoring study should be similar to protocols used at <strong>the</strong>Vansycle Wind Plant in nor<strong>the</strong>astern Oregon (Erickson et al. 2000) and <strong>the</strong> StatelineWind Plant in Washington and Oregon (FPL et al. 2001).22
FINAL REPORTMAIDEN WIND PROJECT BASELINE AVIAN STUDIES6.0 REFERENCES & LITERATURE CITEDErickson, W. P., G. D. Johnson, M. Dale Strickland, and Karen Kronner. 2000. Avian and bat mortalityassociated with <strong>the</strong> Vansycle Wind Project, Umatilla County Oregon. 1999 study year. Technicalreport submitted to Umatilla County Department of Resource Services and Development,Pendleton, Oregon. 22 pp.Erickson, W.P., G.D. Johnson, M.D. Strickland, D.P. Young, Jr., K.J. Sernka, R.E. Good. 2001. AvianCollisions with Wind Turbines: A Summary of Existing Studies and Comparisons to O<strong>the</strong>rSources of Avian Collision Mortality in <strong>the</strong> United States. National Wind CoordinatingCommittee (NWCC) Resource Document. August 2001.FPL Energy <strong>Inc</strong>., W.P. Erickson and K. Kronner. 2001. Avian and bat monitoring plan <strong>for</strong> <strong>the</strong> Washingtonportion of <strong>the</strong> Stateline Wind Project. Technical Report prepared <strong>for</strong> Walla Walla RegionalPlanning Department. May, 2001.Franklin, Jeny F. and C.T. Dyrness. 1988. Natural vegetation of Oregon and Washington. Oregon StateUniversity Press, Corvallis, Oregon. 452 pp.Johnson, G.D., W. P. Erickson, M. D. Strickland, M. F. Shepherd and D. A. Shepherd. 2000a. AvianMonitoring Studies. Buffalo Ridge, Minnesota Wind Resource Area, 1996-1999, Results of a 4-year Study. Technical Report prepared <strong>for</strong> Nor<strong>the</strong>rn States Power Co., Minneapolis, MN. 212 pp.Johnson, G.D., D. P. Young, Jr., W.P. Erickson, C.E. Derby, M.D. Strickland, and R.E. Good. 2000b.Final Report, Wildlife Monitoring Studies, SeaWest Windpower Project, Carbon County,Wyoming, 1995-1999. Technical report prepared <strong>for</strong>: SeaWest Energy Corporation, San Diego,Cali<strong>for</strong>nia and Bureau of Land Management, Rawlins, Wyoming. August 9, 2000.Richardson, S.A. 1996. Washington State Recovery Plan <strong>for</strong> <strong>the</strong> Ferruginous Hawk, August 1996.Washington Department of Fish and Wildlife, Olympia, Washington.Reynolds, R.T., J.M. Scott, and R.A. Nussbaum. 1980. A Variable Circular-Plot Method <strong>for</strong> EstimatingBird Numbers. Condor 82(3): 309-313.The Nature Conservancy (TNC). 1999. Biodiversity Inventory and Analysis of <strong>the</strong> Han<strong>for</strong>d Site. FinalReport: 1994-1999. The Nature Conservancy of Washington, The Bullitt Foundation, and TheNorthwest Fund <strong>for</strong> <strong>the</strong> Environment, Seattle Washington.URS and <strong>WEST</strong>. 2001. Avian <strong>baseline</strong> study <strong>for</strong> <strong>the</strong> Stateline Project, Vansycle Ridge, Oregon andWashington. Technical report prepared <strong>for</strong> ESI Vansycle Partners, L.P.Young, Jr., D.P., W.P. Erickson, G.D. Johnson, M.D. Strickland, and R.E. Good. 2001. Final Report,Avian and Bat Mortality Associated with <strong>the</strong> Initial Phase of <strong>the</strong> Foote Creek Rim WindpowerProject, Carbon County, Wyoming. November 3, 1998 – December 31, 2000. Technical reportprepared by <strong>WEST</strong>, <strong>Inc</strong>. <strong>for</strong> SeaWest Windpower, <strong>Inc</strong>, San Diego, Cali<strong>for</strong>nia and Bureau of LandManagement, Rawlins, Wyoming. October 1, 2001.23
FINAL REPORTMAIDEN WIND PROJECT BASELINE AVIAN STUDIESTable 1. Avian species/groups observed while conducting fixed-point surveys (April 20, 2001 - April 11,2002) on <strong>the</strong> Maiden Project Site. aSummer Fall Winter Spring Grand TotalSpecies/Group #obs. b #groups c #obs.#groups#obs.#groups#obs.#groups#obs.#groupsWaterfowlCanada Goose 15 1 0 0 140 1 0 0 155 2Mallard 0 0 0 0 8 1 0 0 8 1Subtotal 15 1 0 0 148 2 0 0 163 3ShorebirdsKilldeer 0 0 1 1 0 0 0 0 1 1CorvidsBlack-billed Magpie 2 2 7 5 2 2 0 0 11 9Common Raven 79 45 172 68 138 75 55 39 444 227Subtotal 81 47 179 73 140 77 55 39 455 236Upland GamebirdsCali<strong>for</strong>nia Quail 0 0 0 0 0 0 2 1 2 1Chukar 7 3 6 2 0 0 4 3 17 8Gray (Hungarian) Partridge 0 0 4 1 0 0 0 0 4 1Ring-necked Pheasant 1 1 0 0 0 0 2 2 3 3Subtotal 8 4 10 3 0 0 8 6 26 13Dovesmourning dove 5 3 14 1 0 0 2 1 21 5RaptorsAccipiterCooper's Hawk 0 0 4 4 0 0 0 0 4 4Sharp-shinned Hawk 0 0 1 1 0 0 0 0 1 1Unidentified Accipiter 1 1 2 2 0 0 0 0 3 3Subtotal 1 1 7 7 0 0 0 0 8 8ButeosFerruginous Hawk 1 1 1 1 0 0 4 4 6 6Rough-legged Hawk 0 0 4 4 6 6 3 3 13 13Red-tailed Hawk 16 14 10 7 0 0 4 4 30 25Swainson's Hawk 20 14 3 2 0 0 3 3 26 19Unidentified Buteo 9 7 13 9 8 5 10 7 40 28Subtotal 46 36 31 23 14 11 24 21 115 91EaglesGolden Eagle 0 0 1 1 4 3 1 1 6 5HarriersNor<strong>the</strong>rn Harrier 16 16 21 19 6 6 8 8 51 49FalconsAmerican Kestrel 3 3 25 20 2 2 5 5 35 30Peregrine Falcon 0 0 2 1 0 0 0 0 2 1Prairie Falcon 2 2 6 6 2 2 2 2 12 12Subtotal 5 5 33 27 4 4 7 7 49 43Raptor Subtotal 68 58 93 77 28 24 40 37 229 19624
FINAL REPORTMAIDEN WIND PROJECT BASELINE AVIAN STUDIESTable 1. Avian species/groups observed while conducting fixed-point surveys (April 20, 2001 - April 11,2002) on <strong>the</strong> Maiden Project Site. aSummer Fall Winter Spring Grand TotalSpecies/Group # # # # # # # # # #obs. b groups c obs. groups obs. groups obs. groups obs. groupsPasserinesAmerican Goldfinch 1 1 0 0 522 3 0 0 523 4American Pipit 0 0 22 2 0 0 0 0 22 2American Robin 4 2 0 0 2 1 4 1 10 4Barn Swallow 4 2 0 0 0 0 0 0 4 2Brown-headed cowbird 0 0 2 1 0 0 0 0 2 1Brewer's Sparrow 20 17 0 0 0 0 5 4 25 21Cassin's Finch 11 3 0 0 0 0 0 0 11 3Cliff Swallow 6 3 0 0 0 0 0 0 6 3Dark-eyed Junco 0 0 54 13 1 1 1 1 56 15European Starling 2 1 0 0 0 0 0 0 2 1Golden-crowned Kinglet 0 0 3 3 0 0 1 1 4 4Gray-crowned Rosy Finch 0 0 0 0 52 1 0 0 52 1Grasshopper Sparrow 6 6 0 0 0 0 1 1 7 7House Finch 3 2 0 0 20 1 0 0 23 3Horned Lark 377 213 1148 137 650 108 262 134 2437 592Lapland Longspur 0 0 0 0 1 1 0 0 1 1Loggerhead Shrike 2 2 0 0 0 0 1 1 3 3Mountain Bluebird 0 0 5 2 0 0 0 0 5 2N. Rough-winged Swallow 0 0 20 2 0 0 0 0 20 2Red-breasted Nuthatch 0 0 0 0 0 0 1 1 1 1Rock Wren 6 6 2 2 0 0 3 2 11 10Say's Phoebe 0 0 2 2 0 0 0 0 2 2Sage Thrasher 1 1 1 1 0 0 0 0 2 2Savannah Sparrow 1 1 0 0 0 0 2 2 3 3Snow Bunting 0 0 0 0 8 1 0 0 8 1Spotted Towhee 3 3 1 1 0 0 0 0 4 4Swainson's Thrush 0 0 1 1 0 0 0 0 1 1Tree Swallow 12 1 0 0 0 0 0 0 12 1Varied Thrush 0 0 1 1 0 0 1 1 2 2Vesper Sparrow 38 30 6 5 0 0 25 20 69 55Violet-green Swallow 0 0 0 0 0 0 1 1 1 1White-crowned Sparrow 0 0 14 3 0 0 0 0 14 3Western Bluebird 0 0 0 0 0 0 1 1 1 1Western Kingbird 1 1 4 3 0 0 2 1 7 5Western Meadowlark 112 91 29 23 11 10 80 61 232 185Western Tanager 4 1 0 0 0 0 0 0 4 1Wilson's Warbler 0 0 1 1 0 0 0 0 1 1Yellow-rumped Warbler 0 0 1 1 0 0 0 0 1 1Yellow Warbler 0 0 1 1 0 0 0 0 1 1Unidentified Blackbird 0 0 0 0 0 0 2 1 2 1Unidentified Bluebird 0 0 0 0 0 0 1 1 1 1Unidentified Finch 0 0 35 1 0 0 0 0 35 1Unidentified Flycatcher 5 2 3 2 0 0 0 0 8 4Unidentified Passerine 0 0 145 2 34 3 6 4 185 9Unidentified Sparrow 0 0 1 1 0 0 0 0 1 1Unidentified Swallow 4 3 7 3 0 0 1 1 12 7Unidentified Warbler 0 0 1 1 0 0 0 0 1 1Subtotal 623 392 1510 215 1301 130 401 240 3835 97725
FINAL REPORTMAIDEN WIND PROJECT BASELINE AVIAN STUDIESTable 1. Avian species/groups observed while conducting fixed-point surveys (April 20, 2001 - April 11,2002) on <strong>the</strong> Maiden Project Site. aSummer Fall Winter Spring Grand TotalSpecies/Group # # # # # # # # # #obs. b groups c obs. groups obs. groups obs. groups obs. groupsO<strong>the</strong>r BirdsCommon Nighthawk 1 1 0 0 0 0 0 0 1 1Nor<strong>the</strong>rn Flicker 0 0 2 2 0 0 1 1 3 3Unidentified Hummingbird 2 2 0 0 0 0 0 0 2 2Subtotal 3 3 2 2 0 0 1 1 6 6Grand Total 803 508 1809 372 1617 233 507 324 4736 1437a <strong>Inc</strong>ludes observations recorded at distances greater than 800 m from <strong>the</strong> observer.b Number of observed (individuals detected).c Number of groups observed. Group is defined as an observation of a species regardless of number seen toge<strong>the</strong>r.26
FINAL REPORTMAIDEN WIND PROJECT BASELINE AVIAN STUDIESTable 2. Avian species/groups observed within 800 m of point and estimated mean use <strong>for</strong> fixed-point surveys (April20, 2001 - April 11, 2002).Summer Use Fall Use Winter Use Spring Use Overall UseSpecies/Group mean st dev mean st dev mean st dev mean st dev mean st devWaterfowl 0.14 0.52 0.00 0.00 0.11 0.33 0.00 0.00 0.07 0.44Canada goose 0.14 0.52 0.00 0.00 0.00 0.00 0.00 0.00 0.04 0.29mallard 0.00 0.00 0.00 0.00 0.11 0.33 0.00 0.00 0.02 0.15Shorebirdskilldeer 0.00 0.00 0.01 0.04 0.00 0.00 0.00 0.00 0.00 0.02Corvids 0.74 0.59 1.79 1.79 1.49 0.45 0.70 0.53 1.19 1.13common raven 0.72 0.61 1.72 1.72 1.46 0.43 0.70 0.53 1.16 1.10black-billed magpie 0.02 0.05 0.07 0.15 0.03 0.06 0.00 0.00 0.03 0.09Upland Gamebirds 0.08 0.14 0.10 0.20 0.00 0.00 0.10 0.15 0.07 0.15Cali<strong>for</strong>nia quail 0.00 0.00 0.00 0.00 0.00 0.00 0.03 0.09 0.01 0.04chukar 0.07 0.14 0.06 0.16 0.00 0.00 0.06 0.11 0.05 0.12gray partridge 0.00 0.00 0.04 0.14 0.00 0.00 0.00 0.00 0.01 0.08ring-necked pheasant 0.01 0.03 0.00 0.00 0.00 0.00 0.02 0.04 0.01Doves 0.03mourning dove 0.05 0.10 0.15 0.51 0.00 0.00 0.03 0.09 0.06 0.28Raptors 0.52 0.54 0.93 0.75 0.23 0.43 0.44 0.57 0.56 0.73Accipiters 0.01 0.03 0.07 0.10 0.00 0.00 0.00 0.00 0.02 0.06Cooper's hawk 0.00 0.00 0.04 0.08 0.00 0.00 0.00 0.00 0.01 0.05sharp-shinned hawk 0.00 0.00 0.01 0.04 0.00 0.00 0.00 0.00 0.00 0.02unidentified accipiter 0.01 0.03 0.02 0.05 0.00 0.00 0.00 0.00 0.01 0.03Buteos 0.33 0.32 0.28 0.16 0.04 0.07 0.21 0.31 0.23 0.26ferruginous hawk 0.01 0.03 0.01 0.04 0.00 0.00 0.06 0.18 0.02 0.08Swainson's hawk 0.15 0.23 0.03 0.08 0.00 0.00 0.04 0.08 0.06 0.15red-tailed hawk 0.13 0.13 0.10 0.14 0.00 0.00 0.04 0.09 0.08 0.12rough-legged hawk 0.00 0.00 0.04 0.11 0.04 0.07 0.03 0.06 0.03 0.07unidentified buteo 0.04 0.06 0.09 0.12 0.00 0.00 0.03 0.08 0.04 0.09Eaglesgolden eagle 0.00 0.00 0.01 0.04 0.06 0.13 0.02 0.04 0.02 0.07Harriersnor<strong>the</strong>rn harrier 0.13 0.11 0.22 0.21 0.07 0.13 0.12 0.09 0.14 0.15Falcons 0.05 0.08 0.34 0.24 0.06 0.10 0.10 0.12 0.15 0.19American kestrel 0.03 0.07 0.26 0.25 0.03 0.08 0.07 0.08 0.10 0.18prairie falcon 0.02 0.05 0.06 0.08 0.04 0.07 0.03 0.06 0.04 0.07peregrine falcon 0.00 0.00 0.02 0.07 0.00 0.00 0.00 0.00 0.01 0.04Passerines 5.99 2.36 15.73 13.59 11.21 10.36 5.97 1.46 9.89 9.52American goldfinch 0.01 0.03 0.00 0.00 0.31 0.66 0.00 0.00 0.07 0.32American pipit 0.00 0.00 0.23 0.79 0.00 0.00 0.00 0.00 0.07 0.42American robin 0.04 0.11 0.00 0.00 0.03 0.08 0.06 0.18 0.03 0.10barn swallow 0.04 0.11 0.00 0.00 0.00 0.00 0.00 0.00 0.01 0.06Brewer's sparrow 0.19 0.27 0.00 0.00 0.00 0.00 0.07 0.11 0.07 0.1827
FINAL REPORTMAIDEN WIND PROJECT BASELINE AVIAN STUDIESTable 2. Avian species/groups observed within 800 m of point and estimated mean use <strong>for</strong> fixed-point surveys (April20, 2001 - April 11, 2002).Summer Use Fall Use Winter Use Spring Use Overall UseSpecies/Group mean st dev mean st dev mean st dev mean st dev mean st devbrown-headed cowbird 0.00 0.00 0.02 0.07 0.00 0.00 0.00 0.00 0.01 0.04Cassin's finch 0.11 0.24 0.00 0.00 0.00 0.00 0.00 0.00 0.03 0.14cliff swallow 0.06 0.15 0.00 0.00 0.00 0.00 0.00 0.00 0.02 0.09dark-eyed junco 0.00 0.00 0.56 1.12 0.01 0.04 0.02 0.04 0.17 0.63European starling 0.02 0.07 0.00 0.00 0.00 0.00 0.00 0.00 0.01 0.04golden-crowned kinglet 0.00 0.00 0.03 0.08 0.00 0.00 0.02 0.04 0.01 0.05grasshopper sparrow 0.06 0.06 0.00 0.00 0.00 0.00 0.02 0.04 0.02 0.05gray-crowned rosy finch 0.00 0.00 0.00 0.00 0.72 2.17 0.00 0.00 0.15 1.00horned lark 3.63 1.29 11.96 13.78 9.11 10.80 3.94 1.88 7.24 9.40house finch 0.03 0.07 0.00 0.00 0.28 0.83 0.00 0.00 0.07 0.39lapland longspur 0.00 0.00 0.00 0.00 0.01 0.04 0.00 0.00 0.00 0.02loggerhead shrike 0.02 0.07 0.00 0.00 0.00 0.00 0.02 0.04 0.01 0.04mountain bluebird 0.00 0.00 0.05 0.18 0.00 0.00 0.00 0.00 0.01 0.10n. rough-winged swal1. 0.00 0.00 0.21 0.68 0.00 0.00 0.00 0.00 0.06 0.37red-breasted nuthatch 0.00 0.00 0.00 0.00 0.00 0.00 0.01 0.04 0.00 0.02rock wren 0.06 0.10 0.02 0.05 0.00 0.00 0.05 0.09 0.03 0.07sage thrasher 0.01 0.03 0.01 0.04 0.00 0.00 0.00 0.00 0.01 0.03savannah sparrow 0.01 0.03 0.00 0.00 0.00 0.00 0.03 0.08 0.01 0.04Say's phoebe 0.00 0.00 0.02 0.05 0.00 0.00 0.00 0.00 0.01 0.03snow bunting 0.00 0.00 0.00 0.00 0.11 0.33 0.00 0.00 0.02 0.15spotted towhee 0.03 0.07 0.01 0.04 0.00 0.00 0.00 0.00 0.01 0.05Swainson's thrush 0.00 0.00 0.01 0.04 0.00 0.00 0.00 0.00 0.00 0.02tree swallow 0.12 0.42 0.00 0.00 0.00 0.00 0.00 0.00 0.04 0.23unidentified blackbird 0.00 0.00 0.00 0.00 0.00 0.00 0.03 0.09 0.01 0.04unidentified bluebird 0.00 0.00 0.00 0.00 0.00 0.00 0.02 0.04 0.00 0.02unidentified finch 0.00 0.00 0.36 1.26 0.00 0.00 0.00 0.00 0.10 0.68unidentified flycatcher 0.05 0.14 0.03 0.08 0.00 0.00 0.00 0.00 0.02 0.09unidentified passerine 0.00 0.00 1.51 5.23 0.47 1.32 0.08 0.16 0.55 2.85unidentified sparrow 0.00 0.00 0.01 0.04 0.00 0.00 0.00 0.00 0.00 0.02unidentified swallow 0.04 0.08 0.07 0.22 0.00 0.00 0.01 0.04 0.04 0.12unidentified warbler 0.00 0.00 0.01 0.04 0.00 0.00 0.00 0.00 0.00 0.02varied thrush 0.00 0.00 0.01 0.04 0.00 0.00 0.02 0.04 0.01 0.03vesper sparrow 0.37 0.36 0.06 0.08 0.00 0.00 0.36 0.26 0.20 0.28violet-green swallow 0.00 0.00 0.00 0.00 0.00 0.00 0.01 0.04 0.00 0.02western bluebird 0.00 0.00 0.00 0.00 0.00 0.00 0.02 0.04 0.00 0.02western kingbird 0.01 0.03 0.04 0.08 0.00 0.00 0.03 0.09 0.02 0.06western meadowlark 1.08 0.71 0.30 0.25 0.15 0.29 1.16 0.80 0.67 0.70western tanager 0.04 0.14 0.00 0.00 0.00 0.00 0.00 0.00 0.01 0.08white-crowned sparrow 0.00 0.00 0.15 0.38 0.00 0.00 0.00 0.00 0.04 0.21Wilson's warbler 0.00 0.00 0.01 0.04 0.00 0.00 0.00 0.00 0.00 0.02yellow warbler 0.00 0.00 0.01 0.04 0.00 0.00 0.00 0.00 0.00 0.02yellow-rumped warbler 0.00 0.00 0.01 0.04 0.00 0.00 0.00 0.00 0.00 0.02O<strong>the</strong>r Birds 0.03 0.05 0.02 0.05 0.00 0.00 0.02 0.04 0.02 0.04common nighthawk 0.01 0.03 0.00 0.00 0.00 0.00 0.00 0.00 0.00 0.02nor<strong>the</strong>rn flicker 0.00 0.00 0.02 0.05 0.00 0.00 0.02 0.04 0.01 0.03unid’d hummingbird 0.02 0.05 0.00 0.00 0.00 0.00 0.00 0.00 0.01 0.03All Birds 7.55 13.92 18.73 1.73 13.03 2.53 7.27 10.47 11.86 18.1628
FINAL REPORTMAIDEN WIND PROJECT BASELINE AVIAN STUDIESTable 3. Avian species/groups observed within 800 m of point and estimated frequency ofoccurrence <strong>for</strong> fixed-point surveys (April 20, 2001-April 11, 2002).Summer Fall Winter Spring OverallSpecies/Group % Freq % Freq % Freq % Freq % FreqWaterfowl 0.96 0.00 1.39 0.00 0.60Canada goose 0.96 0.00 0.00 0.00 0.30mallard 0.00 0.00 1.39 0.00 0.30Shorebirdskilldeer 0.00 1.04 0.00 0.00 0.30Corvids 32.69 52.08 60.83 40.21 45.69common raven 30.77 50.00 60.83 40.21 44.50black-billed magpie 1.92 5.21 2.78 0.00 2.68Upland Gamebirds 3.85 3.13 0.00 4.38 2.92Cali<strong>for</strong>nia quail 0.00 0.00 0.00 1.56 0.30Chukar 2.88 2.08 0.00 2.81 2.02gray partridge 0.00 1.04 0.00 0.00 0.30ring-necked pheasant 0.96 0.00 0.00 1.56 0.60Dovesmourning Dove 2.88 1.04 0.00 1.56 1.49Raptors 43.27 70.83 18.33 37.12 44.63Accipiters 0.96 7.29 0.00 0.00 2.38Cooper's hawk 0.00 4.17 0.00 0.00 1.19sharp-shinned hawk 0.00 1.04 0.00 0.00 0.30unidentified accipiter 0.96 2.08 0.00 0.00 0.89Buteos 24.04 20.83 3.61 14.48 16.92ferruginous hawk 0.96 1.04 0.00 4.69 1.49Swainson's hawk 9.62 2.08 0.00 4.03 4.34red-tailed hawk 10.58 6.25 0.00 4.38 5.89rough-legged hawk 0.00 4.17 3.61 3.13 2.56unidentified buteo 3.85 7.29 0.00 1.39 3.54Eaglesgolden eagle 0.00 1.04 2.78 1.56 1.19Harriersnor<strong>the</strong>rn harrier 13.46 15.63 5.56 12.01 12.11Falcons 4.81 26.04 6.39 9.06 12.02American kestrel 2.88 18.75 2.78 5.94 7.98prairie falcon 1.92 6.25 3.61 3.13 3.75peregrine falcon 0.00 1.04 0.00 0.00 0.30Passerines 94.23 83.33 69.72 89.06 84.88American goldfinch 0.96 0.00 2.78 0.00 0.89American pipit 0.00 2.08 0.00 0.00 0.60American robin 1.92 0.00 1.39 1.56 1.19barn swallow 1.92 0.00 0.00 0.00 0.6029
FINAL REPORTMAIDEN WIND PROJECT BASELINE AVIAN STUDIESTable 3. Avian species/groups observed within 800 m of point and estimated frequency ofoccurrence <strong>for</strong> fixed-point surveys (April 20, 2001-April 11, 2002).Summer Fall Winter Spring OverallSpecies/Group % Freq % Freq % Freq % Freq % FreqBrewer's sparrow 14.42 0.00 0.00 6.08 5.62brown-headed cowbird 0.00 1.04 0.00 0.00 0.30Cassin's finch 2.88 0.00 0.00 0.00 0.89cliff swallow 2.88 0.00 0.00 0.00 0.89dark-eyed junco 0.00 8.33 1.39 1.56 2.98European starling 0.96 0.00 0.00 0.00 0.30golden-crowned kinglet 0.00 2.08 0.00 1.56 0.89grasshopper sparrow 5.77 0.00 0.00 1.56 2.08gray-crowned rosy finch 0.00 0.00 1.39 0.00 0.30horned lark 85.58 66.67 62.78 79.86 74.20house finch 1.92 0.00 1.39 0.00 0.89lapland longspur 0.00 0.00 1.39 0.00 0.30loggerhead shrike 0.96 0.00 0.00 1.56 0.60mountain bluebird 0.00 2.08 0.00 0.00 0.60n. rough-winged swallow 0.00 2.08 0.00 0.00 0.60red-breasted nuthatch 0.00 0.00 0.00 1.25 0.24rock wren 5.77 2.08 0.00 3.13 2.98sage thrasher 0.96 1.04 0.00 0.00 0.60savannah sparrow 0.96 0.00 0.00 1.39 0.56Say's phoebe 0.00 2.08 0.00 0.00 0.60snow bunting 0.00 0.00 1.39 0.00 0.30spotted towhee 1.92 1.04 0.00 0.00 0.89Swainson's thrush 0.00 1.04 0.00 0.00 0.30tree swallow 0.96 0.00 0.00 0.00 0.30unidentified blackbird 0.00 0.00 0.00 1.56 0.30unidentified bluebird 0.00 0.00 0.00 1.56 0.30unidentified finch 0.00 1.04 0.00 0.00 0.30unidentified flycatcher 1.92 2.08 0.00 0.00 1.19unidentified passerine 0.00 1.04 4.17 5.31 2.20unidentified sparrow 0.00 1.04 0.00 0.00 0.30unidentified swallow 2.88 3.13 0.00 1.39 2.05unidentified warbler 0.00 1.04 0.00 0.00 0.30varied thrush 0.00 1.04 0.00 1.56 0.60vesper sparrow 23.08 5.21 0.00 23.37 13.08violet-green swallow 0.00 0.00 0.00 1.25 0.24western bluebird 0.00 0.00 0.00 1.56 0.30western kingbird 0.96 3.13 0.00 1.56 1.49western meadowlark 49.04 18.75 9.72 54.10 32.92western tanager 0.96 0.00 0.00 0.00 0.30white-crowned sparrow 0.00 2.08 0.00 0.00 0.60Wilson's warbler 0.00 1.04 0.00 0.00 0.30yellow warbler 0.00 1.04 0.00 0.00 0.30yellow-rumped warbler 0.00 1.04 0.00 0.00 0.30O<strong>the</strong>r Birds 2.88 2.08 0.00 1.56 1.79common nighthawk 0.96 0.00 0.00 0.00 0.30nor<strong>the</strong>rn flicker 0.00 2.08 0.00 1.56 0.89unidentified hummingbird 1.92 0.00 0.00 0.00 0.6030
FINAL REPORTMAIDEN WIND PROJECT BASELINE AVIAN STUDIESTable 4. Avian species/groups observed within 800 m of point and estimated group composition<strong>for</strong> fixed-point surveys (April 20, 2001- April 11, 2002).Summer Fall Winter Spring OverallSpecies/Group % Comp % Comp % Comp % Comp % CompWaterfowl 1.91 0.00 0.85 0.00 0.58Canada goose 1.91 0.00 0.00 0.00 0.38mallard 0.00 0.00 0.85 0.00 0.20Shorebirdskilldeer 0.00 0.06 0.00 0.00 0.03Corvids 9.81 9.57 11.40 9.70 10.06common raven 9.55 9.18 11.19 9.70 9.79black-billed magpie 0.25 0.39 0.21 0.00 0.28Gamebirds 1.02 0.56 0.00 1.42 0.62Cali<strong>for</strong>nia quail 0.00 0.00 0.00 0.43 0.05chukar 0.89 0.33 0.00 0.77 0.42gray partridge 0.00 0.22 0.00 0.00 0.10ring-necked pheasant 0.13 0.00 0.00 0.22 0.05Dovesmourning dove 0.64 0.78 0.00 0.43 0.53Raptors 6.88 4.95 1.73 6.12 4.71Accipiters 0.13 0.39 0.00 0.00 0.20Cooper's hawk 0.00 0.22 0.00 0.00 0.10sharp-shinned hawk 0.00 0.06 0.00 0.00 0.03unidentified accipiter 0.13 0.11 0.00 0.00 0.08Buteos 4.33 1.50 0.28 2.83 1.93ferruginous hawk 0.13 0.06 0.00 0.86 0.15Swainson's hawk 2.04 0.17 0.00 0.55 0.54red-tailed hawk 1.66 0.56 0.00 0.60 0.65rough-legged hawk 0.00 0.22 0.28 0.43 0.22unidentified buteo 0.51 0.50 0.00 0.38 0.37Eaglesgolden eagle 0.00 0.06 0.43 0.22 0.15Harriersnor<strong>the</strong>rn harrier 1.78 1.17 0.53 1.65 1.20Falcons 0.64 1.84 0.49 1.42 1.23American kestrel 0.38 1.39 0.21 0.99 0.87prairie falcon 0.25 0.33 0.28 0.43 0.32peregrine falcon 0.00 0.11 0.00 0.00 0.05Passerines 79.36 83.98 86.02 82.12 83.33American goldfinch 0.13 0.00 2.34 0.00 0.58American pipit 0.00 1.22 0.00 0.00 0.55American robin 0.51 0.00 0.21 0.86 0.25barn swallow 0.51 0.00 0.00 0.00 0.1031
FINAL REPORTMAIDEN WIND PROJECT BASELINE AVIAN STUDIESTable 4. Avian species/groups observed within 800 m of point and estimated group composition<strong>for</strong> fixed-point surveys (April 20, 2001- April 11, 2002).Summer Fall Winter Spring OverallSpecies/Group % Comp % Comp % Comp % Comp % CompBrewer's sparrow 2.55 0.00 0.00 1.03 0.62brown-headed cowbird 0.00 0.11 0.00 0.00 0.05Cassin's finch 1.40 0.00 0.00 0.00 0.28cliff swallow 0.76 0.00 0.00 0.00 0.15dark-eyed junco 0.00 3.00 0.11 0.22 1.40European starling 0.25 0.00 0.00 0.00 0.05golden-crowned kinglet 0.00 0.17 0.00 0.22 0.10grasshopper sparrow 0.76 0.00 0.00 0.22 0.18gray-crowned rosy finch 0.00 0.00 5.54 0.00 1.30horned lark 48.03 63.85 69.92 54.25 61.04house finch 0.38 0.00 2.13 0.00 0.58lapland longspur 0.00 0.00 0.11 0.00 0.03loggerhead shrike 0.25 0.00 0.00 0.22 0.08mountain bluebird 0.00 0.28 0.00 0.00 0.13n. rough-winged swallow 0.00 1.11 0.00 0.00 0.50red-breasted nuthatch 0.00 0.00 0.00 0.17 0.02rock wren 0.76 0.11 0.00 0.65 0.28sage thrasher 0.13 0.06 0.00 0.00 0.05savannah sparrow 0.13 0.00 0.00 0.38 0.07Say's phoebe 0.00 0.11 0.00 0.00 0.05snow bunting 0.00 0.00 0.85 0.00 0.20spotted towhee 0.38 0.06 0.00 0.00 0.10Swainson's thrush 0.00 0.06 0.00 0.00 0.03tree swallow 1.53 0.00 0.00 0.00 0.30unidentified blackbird 0.00 0.00 0.00 0.43 0.05unidentified bluebird 0.00 0.00 0.00 0.22 0.03unidentified finch 0.00 1.95 0.00 0.00 0.88unidentified flycatcher 0.64 0.17 0.00 0.00 0.20unidentified passerine 0.00 8.06 3.62 1.12 4.62unidentified sparrow 0.00 0.06 0.00 0.00 0.03unidentified swallow 0.51 0.39 0.00 0.19 0.30unidentified warbler 0.00 0.06 0.00 0.00 0.03varied thrush 0.00 0.06 0.00 0.22 0.05vesper sparrow 4.84 0.33 0.00 5.00 1.69violet-green swallow 0.00 0.00 0.00 0.17 0.02western bluebird 0.00 0.00 0.00 0.22 0.03western kingbird 0.13 0.22 0.00 0.43 0.18western meadowlark 14.27 1.61 1.17 15.94 5.67western tanager 0.51 0.00 0.00 0.00 0.10white-crowned sparrow 0.00 0.78 0.00 0.00 0.35Wilson's warbler 0.00 0.06 0.00 0.00 0.03yellow warbler 0.00 0.06 0.00 0.00 0.03yellow-rumped warbler 0.00 0.06 0.00 0.00 0.03O<strong>the</strong>r Birds 0.38 0.11 0.00 0.22 0.15common nighthawk 0.13 0.00 0.00 0.00 0.03nor<strong>the</strong>rn flicker 0.00 0.11 0.00 0.22 0.08unid’d hummingbird 0.25 0.00 0.00 0.00 0.0532
FINAL REPORTMAIDEN WIND PROJECT BASELINE AVIAN STUDIESTable 5. Flight height characteristics by species observed during fixed-point surveys.Species/Group# groups # birds % birds 25-125 m above ground levelflying flying flying below within aboveWaterfowl 3 163 100.00 0.00 85.89 14.11Canada goose 2 155 100.00 0.00 90.32 9.68mallard 1 8 100.00 0.00 0.00 100.00Shorebirdskilldeer 0 0 0.00 N/A N/A N/ACorvids 182 345 75.82 47.83 50.72 1.45common raven 179 342 77.03 47.37 51.17 1.46black-billed magpie 3 3 27.27 100.00 0.00 0.00Upland Gamebirds 0 0 0.00 N/A N/A N/ACali<strong>for</strong>nia quail 0 0 0.00 N/A N/A N/Achukar 0 0 0.00 N/A N/A N/Agray partridge 0 0 0.00 N/A N/A N/Aring-necked pheasant 0 0 0.00 N/A N/A N/ADovesmourning dove 3 17 80.95 100.00 0.00 0.00Raptors 180 207 90.39 33.33 48.31 18.36AccipitersCooper's hawk 4 4 100.00 25.00 50.00 25.00sharp-shinned hawk 1 1 100.00 0.00 100.00 0.00unidentified accipiter 2 2 66.67 50.00 0.00 50.00Buteosferruginous hawk 6 6 100.00 50.00 50.00 0.00Swainson's hawk 19 26 100.00 3.85 73.08 23.08red-tailed hawk 24 29 96.67 10.34 58.62 31.03rough-legged hawk 13 13 100.00 0.00 84.62 15.38unidentified buteo 24 34 85.00 2.94 61.76 35.29Eaglesgolden eagle 5 6 100.00 0.00 33.33 66.67Harriersnor<strong>the</strong>rn harrier 48 50 98.04 78.00 20.00 2.00FalconsAmerican kestrel 24 25 71.43 80.00 16.00 4.00prairie falcon 9 9 75.00 0.00 88.89 11.11peregrine falcon 1 2 100.00 0.00 100.00 0.00Passerines 3 17 80.95 100.00 0.00 0.00American goldfinch 3 522 99.81 100.00 0.00 0.00American pipit 1 18 81.82 100.00 0.00 0.00American robin 1 2 20.00 0.00 100.00 0.00barn swallow 2 4 100.00 100.00 0.00 0.00Brewer's sparrow 4 5 20.00 60.00 40.00 0.0033
FINAL REPORTMAIDEN WIND PROJECT BASELINE AVIAN STUDIESTable 5. Flight height characteristics by species observed during fixed-point surveys.Species/Group# groups # birds % birds 25-125 m above ground levelflying flying flying below within abovebrown-headed cowbird 0 0 0.00 N/A N/A N/ACassin's finch 0 0 0.00 N/A N/A N/Acliff swallow 3 6 100.00 100.00 0.00 0.00dark-eyed junco 6 15 26.79 100.00 0.00 0.00European starling 0 0 0.00 N/A N/A N/Agolden-crowned kinglet 4 4 100.00 100.00 0.00 0.00grasshopper sparrow 2 2 28.57 100.00 0.00 0.00gray-crowned rosy finch 1 52 100.00 0.00 100.00 0.00horned lark 376 1976 81.08 98.38 1.62 0.00house finch 2 21 91.30 4.76 95.24 0.00lapland longspur 0 0 0.00 N/A N/A N/Aloggerhead shrike 1 1 33.33 100.00 0.00 0.00mountain bluebird 2 5 100.00 100.00 0.00 0.00n. rough-winged swallow 2 20 100.00 0.00 100.00 0.00red-breasted nuthatch 1 1 100.00 100.00 0.00 0.00rock wren 1 1 9.09 100.00 0.00 0.00sage thrasher 0 0 0.00 N/A N/A N/Asavannah sparrow 1 1 33.33 100.00 0.00 0.00say's phoebe 1 1 50.00 100.00 0.00 0.00snow bunting 1 8 100.00 0.00 100.00 0.00spotted towhee 0 0 0.00 N/A N/A N/ASwainson's thrush 0 0 0.00 N/A N/A N/Atree swallow 1 12 100.00 100.00 0.00 0.00unidentified blackbird 1 2 100.00 100.00 0.00 0.00unidentified bluebird 0 0 0.00 N/A N/A N/Aunidentified finch 1 35 100.00 100.00 0.00 0.00unidentified flycatcher 1 1 12.50 100.00 0.00 0.00unidentified passerine 9 185 100.00 81.08 18.92 0.00unidentified sparrow 1 1 100.00 100.00 0.00 0.00unidentified swallow 6 10 83.33 80.00 20.00 0.00unidentified warbler 1 1 100.00 100.00 0.00 0.00varied thrush 0 0 0.00 N/A N/A N/Avesper sparrow 10 13 18.84 100.00 0.00 0.00violet-green swallow 0 0 0.00 N/A N/A N/Awestern bluebird 0 0 0.00 N/A N/A N/Awestern kingbird 2 3 42.86 100.00 0.00 0.00western meadowlark 27 38 16.38 97.37 2.63 0.00western tanager 1 4 100.00 100.00 0.00 0.00white-crowned sparrow 1 10 71.43 100.00 0.00 0.00Wilson's warbler 0 0 0.00 N/A N/A N/Ayellow warbler 0 0 0.00 N/A N/A N/Ayellow-rumped warbler 0 0 0.00 N/A N/A N/AO<strong>the</strong>r Birds 5 5 83.33 80.00 20.00 0.00common nighthawk 1 1 100.00 0.00 100.00 0.00nor<strong>the</strong>rn flicker 3 3 100.00 100.00 0.00 0.00unidentified hummingbird 1 1 50.00 100.00 0.00 0.00All Birds 850 3717 78.48 82.35 15.87 1.7834
FINAL REPORTMAIDEN WIND PROJECT BASELINE AVIAN STUDIESTable 6. Mean exposure indices calculated by species observed during fixed-point surveys(April 20, 2001-April 11, 2002).Mean use % Flying % Flying ExposureSpecies/Groupwithin RSA IndexWaterfowlCanada goose 0.04 100.00 90.32 0.04mallard 0.02 100.00 0.00 0.00Shorebirdskilldeer 0.00 0.00 n/a 0.00Corvidscommon raven 1.16 77.03 51.17 0.46black-billed magpie 0.03 27.27 0.00 0.00Upland GamebirdsCali<strong>for</strong>nia quail 0.01 0.00 n/a 0.00chukar 0.05 0.00 n/a 0.00gray partridge 0.01 0.00 n/a 0.00ring-necked pheasant 0.01 0.00 n/a 0.00Dovesmourning dove 0.06 80.95 0.00 0.00RaptorsAccipitersCooper's hawk 0.01 100.00 50.00 0.01sharp-shinned hawk 0.00 100.00 100.00 0.00unidentified accipiter 0.01 66.67 0.00 0.00Buteosferruginous hawk 0.02 100.00 50.00 0.01Swainson's hawk 0.06 100.00 73.08 0.05red-tailed hawk 0.08 96.67 58.62 0.04rough-legged hawk 0.03 100.00 84.62 0.02unidentified buteo 0.04 85.00 61.76 0.02Eaglesgolden eagle 0.02 100.00 33.33 0.01Harriersnor<strong>the</strong>rn harrier 0.14 98.04 20.00 0.03FalconsAmerican kestrel 0.10 71.43 16.00 0.01prairie falcon 0.04 75.00 88.89 0.03peregrine falcon 0.01 100.00 100.00 0.01PasserinesAmerican goldfinch 0.07 99.81 0.00 0.00American pipit 0.07 81.82 0.00 0.00American robin 0.03 20.00 100.00 0.01barn swallow 0.01 100.00 0.00 0.00Brewer's sparrow 0.07 20.00 40.00 0.0135
FINAL REPORTMAIDEN WIND PROJECT BASELINE AVIAN STUDIESTable 6. Mean exposure indices calculated by species observed during fixed-point surveys(April 20, 2001-April 11, 2002).Species/GroupMean use % Flying % Flying Exposurewithin RSA Indexbrown-headed cowbird 0.01 0.00 n/a 0.00Cassin's finch 0.03 0.00 n/a 0.00cliff swallow 0.02 100.00 0.00 0.00dark-eyed junco 0.17 26.79 0.00 0.00European starling 0.01 0.00 n/a 0.00golden-crowned kinglet 0.01 100.00 0.00 0.00grasshopper sparrow 0.02 28.57 0.00 0.00gray-crowned rosy finch 0.15 100.00 100.00 0.15horned lark 7.24 81.08 1.62 0.10house finch 0.07 91.30 95.24 0.06lapland longspur 0.00 0.00 n/a 0.00loggerhead shrike 0.01 33.33 0.00 0.00mountain bluebird 0.01 100.00 0.00 0.00n. rough-winged swallow 0.06 100.00 100.00 0.06Red-breasted Nuthatch 0.00 100.00 0.00 0.00rock wren 0.03 9.09 0.00 0.00sage thrasher 0.01 0.00 n/a 0.00savannah sparrow 0.01 33.33 0.00 0.00say's phoebe 0.01 50.00 0.00 0.00snow bunting 0.02 100.00 100.00 0.02spotted towhee 0.01 0.00 n/a 0.00Swainson's thrush 0.00 0.00 n/a 0.00tree swallow 0.04 100.00 0.00 0.00unidentified blackbird 0.01 100.00 0.00 0.00unidentified bluebird 0.00 0.00 n/a 0.00unidentified finch 0.10 100.00 0.00 0.00unidentified flycatcher 0.02 12.50 0.00 0.00unidentified passerine 0.55 100.00 18.92 0.10unidentified sparrow 0.00 100.00 0.00 0.00unidentified swallow 0.04 83.33 20.00 0.01unidentified warbler 0.00 100.00 0.00 0.00varied thrush 0.01 0.00 n/a 0.00vesper sparrow 0.20 18.84 0.00 0.00violet-green Swallow 0.00 0.00 N/A 0.00western bluebird 0.00 0.00 n/a 0.00western kingbird 0.02 42.86 0.00 0.00western meadowlark 0.67 16.38 2.63 0.00western tanager 0.01 100.00 0.00 0.00white-crowned sparrow 0.04 71.43 0.00 0.00Wilson's warbler 0.00 0.00 n/a 0.00yellow warbler 0.00 0.00 n/a 0.00yellow-rumped warbler 0.00 0.00 n/a 0.00O<strong>the</strong>r Birdscommon nighthawk 0.00 100.00 100.00 0.00nor<strong>the</strong>rn flicker 0.01 100.00 0.00 0.00unidentified hummingbird 0.01 50.00 0.00 0.0036
FINAL REPORTMAIDEN WIND PROJECT BASELINE AVIAN STUDIESTable 7. Raptor and large bird nests located in <strong>the</strong> raptor nest survey area (study area plus areawithin a five-mile radius buffer).Number Active Number of Nests Which Total Young ObservedSpeciesNests aProduced Young b (young per successful nest)Ferruginous hawk 4 2 3 (1.5)Red-tailed hawk 14 9 16 (1.78)Swainson’s hawk 9 2 UnknownPrairie falcon 8 3 8 (2.2)Great-horned owl 2 Unknown UnknownBarn owl 1 1 1 (1.0)Common raven 17 6 11Inactive nests 52 N/A N/Aa based on April 30- May 2 surveyb based on June 18-19 survey37
FINAL REPORTMAIDEN WIND PROJECT BASELINE AVIAN STUDIESTable 8. Avian species observed during <strong>the</strong> three paired-point surveysSpecies / GroupNumber ofgroupsTotal numberobservedBlackbirdsBrown-headed Cowbird 5 9European Starling 1 2Unidentified Blackbird 3 4Subtotal 9 15CorvidsBlack-billed Magpie 3 4Common Raven 13 13Subtotal 16 17DovesMourning Dove 1 3FinchesAmerican Goldfinch 1 2Unidentified Finch 1 5Subtotal 2 7FlycatchersWestern Flycatcher 1 1Western Kingbird 1 1Subtotal 2 2Grassland / Shrub SteppeBrewer's Sparrow 37 42Grasshopper Sparrow 40 40Horned Lark 249 294Savannah Sparrow 8 8Sage Thrasher 3 3Vesper Sparrow 111 119White-crowned Sparrow 12 24Western Meadowlark 198 211Subtotal 658 741RaptorsFerruginous Hawk 1 1Nor<strong>the</strong>rn Harrier 6 6Red-tailed Hawk 1 1Sharp-shinned Hawk 1 1Swainson's Hawk 4 5Unidentified Buteo 1 1Subtotal 14 15ShorebirdsKilldeer 1 138
FINAL REPORTMAIDEN WIND PROJECT BASELINE AVIAN STUDIESTable 8. Avian species observed during <strong>the</strong> three paired-point surveysSpecies / GroupNumber ofgroupsTotal numberobservedUpland Game birdsChukar 5 11Gray Partridge 3 4Subtotal 8 15WrensHouse Wren 1 1Rock Wren 3 3Subtotal 4 4O<strong>the</strong>rsAmerican Robin 3 3Golden-crown Kinglet 1 2Unidentified Hummingbird 2 2Unidentified Passerine 2 2Unidentified Warbler 1 1Subtotal 9 10Total 726 84139
FINAL REPORTMAIDEN WIND PROJECT BASELINE AVIAN STUDIESTable 9. Average use, frequency of occurrence, and percent composition by species <strong>for</strong> paired plotsurveys <strong>for</strong> all three survey dates.UseFrequency of PercentSpeciesmean std dev Occurrence CompositionBrown-headed Cowbird 0.0778 0.1876 4.4 1.1European Starling 0.0222 0.0861 1.1 0.3Unidentified Blackbird 0.0000 0.0000 3.3 N/ABlack-billed Magpie 0.0000 0.0000 3.3 N/ACommon Raven 0.0222 0.0586 14.4 0.3Mourning Dove 0.0333 0.1291 1.1 0.5American Goldfinch 0.0222 0.0861 1.1 0.3Unidentified Finch 0.0556 0.2152 1.1 0.8Western Flycatcher 0.0000 0.0000 1.1 N/AWestern Kingbird 0.0111 0.0430 1.1 0.2Brewer's Sparrow 0.3889 0.4115 20.0 5.4Grasshopper Sparrow 0.4111 0.3556 32.2 5.7Horned Lark 2.9778 0.8883 85.6 41.6Savannah Sparrow 0.0556 0.1361 5.6 0.8Sage Thrasher 0.0222 0.0861 2.2 0.3Vesper Sparrow 1.1889 0.5487 74.4 16.6White-crowned Sparrow 0.2222 0.3191 8.9 3.1Western Meadowlark 1.4111 0.4792 82.2 19.7Ferruginous Hawk 0.0000 0.0000 1.1 N/ANor<strong>the</strong>rn Harrier 0.0333 0.0690 5.6 0.5Red-tailed Hawk 0.0111 0.0430 1.1 0.2Sharp-shinned Hawk 0.0111 0.0430 1.1 0.2Swainson's Hawk 0.0222 0.0861 4.4 0.3Unidentified Buteo 0.0111 0.0430 1.1 0.2Killdeer 0.0000 0.0000 1.1 N/AChukar 0.0000 0.0000 5.6 N/AGray Partridge 0.0222 0.0861 3.3 0.3House Wren 0.0111 0.0430 1.1 0.2Rock Wren 0.0111 0.0430 3.3 0.2American Robin 0.0333 0.0934 2.2 0.5Golden-crown Kinglet 0.0222 0.0861 1.1 0.3Unidentified Hummingbird 0.0222 0.0586 2.2 0.3Unidentified Passerine 0.0222 0.0586 2.2 0.3Unidentified Warbler 0.0111 0.0430 1.1 0.240
FINAL REPORTMAIDEN WIND PROJECT BASELINE AVIAN STUDIESTable 10. Average use, frequency of occurrence, and percent composition by group <strong>for</strong> paired plotsurveys <strong>for</strong> all three survey dates.UseFrequency of PercentGroupsmean std dev Occurrence CompositionBlackbirds 0.1000 0.1972 6.7 1.4Corvids 0.0222 0.0586 16.7 0.3Doves 0.0333 0.1291 1.1 0.5Finches 0.0778 0.2260 2.2 1.1Flycatchers 0.0111 0.0430 2.2 0.2Grassland / Shrub-Steppe 6.6778 1.3325 100.0 93.2Raptors 0.0889 0.1067 13.3 1.2Shorebirds 0.0000 0.0000 1.1 N/AUpland Game birds 0.0222 0.0861 8.9 0.3Wrens 0.0222 0.0586 4.4 0.3O<strong>the</strong>rs 0.1111 0.2152 8.9 1.641
FINAL REPORTMAIDEN WIND PROJECT BASELINE AVIAN STUDIESTable 11. Average use separated by plot <strong>for</strong> each species <strong>for</strong> all three survey dates.Turbine PlotsOffset PlotsSpeciesmean std dev mean std devBrown-headed Cowbird 0.0889 0.3443 0.0667 0.1869European Starling 0.0000 0.0000 0.0444 0.1721Unidentified Blackbird 0.0000 0.0000 0.0000 0.0000Black-billed Magpie 0.0000 0.0000 0.0000 0.0000Common Raven 0.0000 0.0000 0.0444 0.1173Mourning Dove 0.0000 0.0000 0.0667 0.2582American Goldfinch 0.0000 0.0000 0.0444 0.1721Unidentified Finch 0.0000 0.0000 0.1111 0.4303Western Flycatcher 0.0000 0.0000 0.0000 0.0000Western Kingbird 0.0000 0.0000 0.0222 0.0861Brewer's Sparrow 0.0889 0.1979 0.6889 0.7814Grasshopper Sparrow 0.4444 0.5443 0.3778 0.3752Horned Lark 3.3111 1.1372 2.6444 1.8015Savannah Sparrow 0.0444 0.1173 0.0667 0.1869Sage Thrasher 0.0000 0.0000 0.0444 0.1721Vesper Sparrow 1.1111 0.9230 1.2667 0.5521White-crowned Sparrow 0.1556 0.4340 0.2889 0.5616Western Meadowlark 1.1556 0.5018 1.6667 0.8452Ferruginous Hawk 0.0000 0.0000 0.0000 0.0000Nor<strong>the</strong>rn Harrier 0.0222 0.0861 0.0444 0.1173Red-tailed Hawk 0.0000 0.0000 0.0222 0.0861Sharp-shinned Hawk 0.0222 0.0861 0.0000 0.0000Swainson's Hawk 0.0222 0.0861 0.0222 0.0861Unidentified Buteo 0.0000 0.0000 0.0222 0.0861Killdeer 0.0000 0.0000 0.0000 0.0000Chukar 0.0000 0.0000 0.0000 0.0000Gray Partridge 0.0444 0.1721 0.0000 0.0000House Wren 0.0000 0.0000 0.0222 0.0861Rock Wren 0.0222 0.0861 0.0000 0.0000American Robin 0.0222 0.0861 0.0444 0.1721Golden-crown Kinglet 0.0000 0.0000 0.0444 0.1721Unidentified Hummingbird 0.0222 0.0861 0.0222 0.0861Unidentified Passerine 0.0222 0.0861 0.0222 0.0861Unidentified Warbler 0.0000 0.0000 0.0222 0.086142
FINAL REPORTMAIDEN WIND PROJECT BASELINE AVIAN STUDIESTable 12. Average use separated by plot <strong>for</strong> each group <strong>for</strong> all three survey dates.Turbine PlotsOffset PlotsGroupsmean std dev mean std devBlackbirds 0.0889 0.3443 0.1111 0.2412Corvids 0.0000 0.0000 0.0444 0.1173Doves 0.0000 0.0000 0.0667 0.2582Finches 0.0000 0.0000 0.1556 0.4519Flycatchers 0.0000 0.0000 0.0222 0.0861Grassland / Shrub-Steppe 6.3111 2.1693 7.0444 1.5679Raptors 0.0667 0.1380 0.1111 0.1627Shorebirds 0.0000 0.0000 0.0000 0.0000Upland Game birds 0.0444 0.1721 0.0000 0.0000Wrens 0.0222 0.0861 0.0222 0.0861O<strong>the</strong>rs 0.0667 0.1380 0.1556 0.353443
FINAL REPORTMAIDEN WIND PROJECT BASELINE AVIAN STUDIESTable 13. Number of groups and <strong>the</strong> total number of individuals of <strong>avian</strong>species of interest, mammals, and reptiles observed incidentally on-site.Species Groups ObservationsBirdsAmerican kestrel 31 36merlin 1 1bald eagle 1 1golden eagle 2 2osprey 1 1ferruginous hawk 1 1rough-legged hawk 6 6red-tailed hawk 12 15Swainson's hawk 3 3nor<strong>the</strong>rn harrier 9 9prairie falcon 5 5short-eared owl 1 2chukar 2 14killdeer 1 1nor<strong>the</strong>rn oriole 2 2common raven 19 27common yellowthroat 1 1gray-crowned rosy finch 3 4loggerhead shrike 4 6rufous hummingbird 1 1sage thrasher 1 2lark sparrow 1 2sage sparrow 1 2red-naped sapsucker 1 1MammalsElk 5 175Mule deer 17 67Townsend’s ground squirrel 1 1porcupine 1 1coyote 1 1jackrabbit (droppings) 1 1Reptilesrattlesnake 1 1Short-horned lizard 2 2Yellow-bellied racer 1 144
FINAL REPORTMAIDEN WIND PROJECT BASELINE AVIAN STUDIESTable 14. Vegetation types in <strong>the</strong> study area.Basic TypeVegetationTypeApprox.AcresPercent ofStudyAreaAgricultural Cropland 6419 35Riparian Riparian 135 1Steppe Shrub-steppe 4217 32General Habitat DescriptionCurrent croplands or recently abandoned cropland;potential to support wildlife variable depending onstage of crop or age since last tilled.Vegetation located along drainages; most drainagesare narrow and steep. Riparian vegetation includesan overstory of scattered chokecherry, goldencurrent, and/or red-osier dogwood, which providepotential habitat <strong>for</strong> nesting raptors when <strong>the</strong> treesare sufficiently large to provide nest plat<strong>for</strong>ms.Riparian areas with dense shrub/trees also providecover <strong>for</strong> big game and o<strong>the</strong>r wildlife.Big sagebrush or threetip sage is dominant with agrass/<strong>for</strong>b understory. The potential to supportwildlife varies depending on habitat quality (degreeof grazing/ weeds)Grasslandsteppe4114 31Predominantly grassland (native and non-nativegrass species), and may have scattered sagebrushpatches. Potential to support wildlife variesdepending on habitat quality (degree ofgrazing/weeds).Lithosolhabitat184 1Shallow-soiled habitat on ridgetops where nativebuckwheats and Sandberg’s bluegrass dominate.Potential to support wildlife varies depending onhabitat quality (degree of grazing/weeds).Rockoutcrop/shrub12
FINAL REPORTMAIDEN WIND PROJECT BASELINE AVIAN STUDIESFigure 1. Proposed Maiden Wind Farm location.46
FINAL REPORTMAIDEN WIND PROJECT BASELINE AVIAN STUDIESFigure 2. Maiden Wind Farm study area map.47
FINAL REPORTMAIDEN WIND PROJECT BASELINE AVIAN STUDIESFigure 3. Fixed point survey plots and 800 m buffer.48
FINAL REPORTMAIDEN WIND PROJECT BASELINE AVIAN STUDIESFigure 4. Raptor nest survey area.49
FINAL REPORTMAIDEN WIND PROJECT BASELINE AVIAN STUDIESFigure 5. Paired-point survey plots and 100 m buffer.50
FINAL REPORTMAIDEN WIND PROJECT BASELINE AVIAN STUDIESFigure 6. Mean use and frequency of occurrence <strong>for</strong> passerines by survey period (dashed linerepresents a smoo<strong>the</strong>d estimate).50PASSERINESMean Use4030201001 10 2030 40spring summer fallsurvey periodwinterspring% Frequency110100908070605040301 10 2030 40spring summer fallsurvey periodwinterspring51
FINAL REPORTMAIDEN WIND PROJECT BASELINE AVIAN STUDIESFigure 7. Mean use and frequency of occurrence <strong>for</strong> corvids by survey period (dashed linerepresents a smoo<strong>the</strong>d estimate).Mean Use76543210CORVIDS1 10 2030 40spring summer fallsurvey periodwinterspring% Frequency9080706050403020101 10 2030 40spring summer fallsurvey periodwinterspring52
FINAL REPORTMAIDEN WIND PROJECT BASELINE AVIAN STUDIESFigure 8. Mean use and frequency of occurrence <strong>for</strong> raptors by survey period (dashed linerepresents a smoo<strong>the</strong>d estimate).1.6RAPTORSMean Use1.20.80.40.01 10 2030 40spring summer fallsurvey periodwinterspring% Frequency7060504030201001 10 2030 40spring summer fallsurvey periodwinterspring53
FINAL REPORTMAIDEN WIND PROJECT BASELINE AVIAN STUDIESFigure 9. Mean use and frequency of occurrence <strong>for</strong> passerines by station (bar represents + 1standard error).30PASSERINESMean Use20100A B C D F I J Ksteppe habitatsSTATIONagriculture100% Frequency90807060A B C D F I J Ksteppe habitatsSTATIONagriculture54
FINAL REPORTMAIDEN WIND PROJECT BASELINE AVIAN STUDIESFigure 10. Mean use and frequency of occurrence <strong>for</strong> corvids by station (bar represents + 1standard error).3CORVIDSMean Use210A B C D F I J Ksteppe habitatsagricultureSTATION70% Frequency6050403020A B C D F I J Ksteppe habitatsSTATIONagriculture55
FINAL REPORTMAIDEN WIND PROJECT BASELINE AVIAN STUDIESFigure 11. Mean use and frequency of occurrence <strong>for</strong> raptors by station (bar represents + 1standard error).1.5RAPTORSMean Use1.00.50.0A B C D F I J Ksteppe habitatsSTATIONagriculture70% Frequency6050403020A B C D F I J Ksteppe habitatsagricultureSTATION56
FINAL REPORTMAIDEN WIND PROJECT BASELINE AVIAN STUDIESFigure 12. Mean number of species per survey by survey period (dashed line represents asmoo<strong>the</strong>d estimate).5# species/survey432101 10 2030 40spring summer fallsurvey periodwinterspring57
FINAL REPORTMAIDEN WIND PROJECT BASELINE AVIAN STUDIESFigure 13. Nor<strong>the</strong>rn harrier flight paths and perch locations recorded during fixed-point surveys and incidentally on <strong>the</strong> Maiden WindSite.58
FINAL REPORTMAIDEN WIND PROJECT BASELINE AVIAN STUDIESFigure 14. Buteo flight paths and perch locations recorded during fixed-point surveys and incidentally on <strong>the</strong> Maiden Wind Site.59
FINAL REPORTMAIDEN WIND PROJECT BASELINE AVIAN STUDIESFigure 15. Falcon flight paths and perch locations recorded during fixed-point surveys and incidentally on <strong>the</strong> Maiden Wind Site.60
FINAL REPORTMAIDEN WIND PROJECT BASELINE AVIAN STUDIESFigure 16. O<strong>the</strong>r raptor and large bird flight paths and perch locations recorded during fixed-point surveys and incidentally on <strong>the</strong>Maiden Wind Site.61