Malawi NI 43-101 - December 2011 - Gold Canyon Resources Inc.
Malawi NI 43-101 - December 2011 - Gold Canyon Resources Inc. Malawi NI 43-101 - December 2011 - Gold Canyon Resources Inc.
Table 5 Analyses of REE in solid samples and leach solutions by MINDECO on samples listed in Table 3 .Assays by Tokyo University by ICP/MS. Leaching by Mitsui Mining R&D Centre, Japan.SamplenoLight REE Mid REE Heavy REELa Ce Pr Nd Sm Eu Gd Tb Dy Ho Er Tm Yb Lu Y TREEppm ppm ppm ppm ppm ppm ppm ppm ppm ppm ppm ppm ppm ppm ppm ppm11052201Asolid 77 133 24 94 17 5 13 2 9 2 5 1 4 1 38 424leach 13 4 4 15 2 1 2 0.2 1 0.2 1 0.1 0.4 0.1 8 5211052201Bsolid 88 181 26 99 19 5 15 2 11 2 5 1 4 1 54 513leach 21 5 7 29 5 2 5 1 3 1 2 0.2 1 0.2 19 9911052201Csolid 100 144 29 117 25 8 26 4 22 4 12 2 10 2 139 642leach 33 5 10 43 8 3 11 1 9 2 5 1 3 0.5 59 19211052301A solid 109 162 29 102 19 5 14 2 10 2 4 1 4 1 31 494leach 1 2 0 1 0.1 0.0 0.1 0.0 0.1 0.0 0.0 0.0 0.0 0.0 0.3 511052301B solid 100 139 26 88 16 4 12 2 8 1 3 0 3 0 21 423leach 0.1 0.2 0.0 0.1 0.0 0.0 0.0 0.0 0.0 0.0 0.0 0.0 0.0 0.0 0.0 111052302A solid 38 64 10 38 7 4 6 1 5 1 2 0 2 0 20 199leach 0.1 0.2 0.1 1 0 0.1 1 0.1 0.5 0.1 0.3 0.0 0.1 0.0 3 711052302B solid 33 72 10 37 7 4 6 1 5 1 2 0.3 2 0.3 19 198leach 0.3 0.2 0.2 1 0.4 0.1 0.5 0.1 0.4 0.1 0.2 0.0 0 0.0 3 711052303A solid 54 150 15 53 10 3 7 1 5 1 3 0.5 3 0.5 24 330leach 2 7 1 3 1 0.2 0.4 0.0 0.2 0.0 0.1 0.0 0 0.0 1 1611052303B solid 54 139 17 70 12 5 8 1 5 1 2 0.3 2 0.4 19 337leach 11 3 4 18 3 1 2 0.2 1 0.2 1 0.1 0.4 0.1 5 5011052303C solid 44 96 15 62 14 6 16 3 16 3 8 1 5 1 86 375leach 6 1 3 17 4 2 7 1 7 1 4 0.4 2 0.3 45 10111052304A solid 107 217 31 113 22 5 17 2 14 3 8 1 7 1 55 603leach 6 12 2 7 1 0 1 0.2 1 0.2 1 0.1 0.4 0.1 6 3811052304B solid 85 287 24 81 15 3 10 2 9 2 5 1 5 1 35 564leach 6 10 2 6 1 0 1 0.1 1 0.1 0.3 0.0 0.2 0.0 3 3111052305 solid 80 186 19 62 12 2 11 2 13 3 9 1 8 1 71 47911052306 solid 127 1447 76 353 129 8 176 43 347 82 264 39 241 31 2131 549511052307 solid 49 226 11 36 6 2 4 1 3 1 1 0 1 0 9 350leach 0 0 0 0 0 0 0 0 0 0 011052308 solid 40 87 10 34 6 1 4 1 4 1 2 0 2 0 14 20730
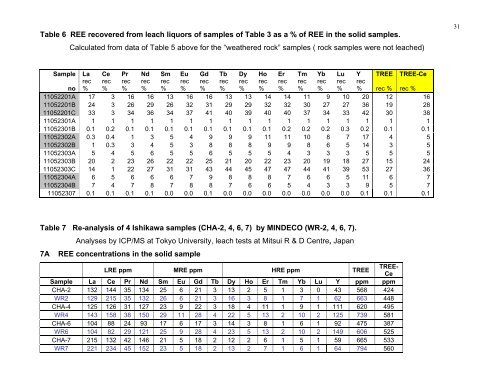
Table 6 REE recovered from leach liquors of samples of Table 3 as a % of REE in the solid samples.Calculated from data of Table 5 above for the “weathered rock” samples ( rock samples were not leached)31Sample La Ce Pr Nd Sm Eu Gd Tb Dy Ho Er Tm Yb Lu Y TREE TREE-Cenorec%rec%rec%rec%rec%rec%rec%rec%rec%rec%rec%rec%rec%rec%rec% rec % rec %11052201A 17 3 16 16 13 16 16 13 13 14 14 11 9 10 20 12 1611052201B 24 3 26 29 26 32 31 29 29 32 32 30 27 27 36 19 2811052201C 33 3 34 36 34 37 41 40 39 40 40 37 34 33 42 30 3811052301A 1 1 1 1 1 1 1 1 1 1 1 1 1 1 1 1 111052301B 0.1 0.2 0.1 0.1 0.1 0.1 0.1 0.1 0.1 0.1 0.2 0.2 0.2 0.3 0.2 0.1 0.111052302A 0.3 0.4 1 3 5 4 9 9 9 11 11 10 8 7 17 4 511052302B 1 0.3 3 4 5 3 8 8 8 9 9 8 6 5 14 3 511052303A 5 4 5 6 5 5 6 5 5 5 4 3 3 3 5 5 511052303B 20 2 23 26 22 22 25 21 20 22 23 20 19 18 27 15 2411052303C 14 1 22 27 31 31 43 44 45 47 47 44 41 39 53 27 3611052304A 6 5 6 6 6 7 9 8 8 8 7 6 6 5 11 6 711052304B 7 4 7 8 7 8 8 7 6 6 5 4 3 3 9 5 711052307 0.1 0.1 0.1 0.1 0.0 0.0 0.1 0.0 0.0 0.0 0.0 0.0 0.0 0.0 0.1 0.1 0.1Table 7 Re-analysis of 4 Ishikawa samples (CHA-2, 4, 6, 7) by MINDECO (WR-2, 4, 6, 7).Analyses by ICP/MS at Tokyo University, leach tests at Mitsui R & D Centre, Japan7A REE concentrations in the solid sampleLRE ppm MRE ppm HRE ppm TREETREE-CeSample La Ce Pr Nd Sm Eu Gd Tb Dy Ho Er Tm Yb Lu Y ppm ppmCHA-2 132 144 35 134 25 6 21 3 13 2 5 1 3 0 43 568 424WR2 129 215 35 132 26 6 21 3 16 3 8 1 7 1 62 663 448CHA-4 125 126 31 127 23 9 22 3 18 4 11 1 9 1 111 620 495WR4 143 158 38 150 29 11 28 4 22 5 13 2 10 2 125 739 581CHA-6 104 88 24 93 17 6 17 3 14 3 8 1 6 1 92 475 387WR6 104 82 29 121 25 9 28 4 23 5 13 2 10 2 149 606 525CHA-7 215 132 42 146 21 5 18 2 12 2 6 1 5 1 59 665 533WR7 221 234 45 152 23 5 18 2 13 2 7 1 6 1 64 794 560
- Page 1 and 2: Geological reporton theCHAMBE BASIN
- Page 3 and 4: 3List of FigurespageFig 1 Relations
- Page 5 and 6: 51 SUMMARYProperty Description Cham
- Page 7 and 8: 7Relationships between companies in
- Page 9 and 10: 9Figure 3. More detailed map of Mal
- Page 11 and 12: 11(b) Purpose of reportAccording to
- Page 13 and 14: Figure 8 General geology of the Mul
- Page 15 and 16: 154 PROPERTY DESCRIPTION AND LOCATI
- Page 17 and 18: 17JOGMEC to Spring Stone Limited by
- Page 19 and 20: 19be required, and also a “Licenc
- Page 21 and 22: 21(d) Climate, length of operating
- Page 23 and 24: 23(c) Significant historical minera
- Page 25 and 26: 25The following year, on May 22-23
- Page 27 and 28: Table 2 Samples collected by J. Ish
- Page 29: Table 4 REE analyses of 3 leached s
- Page 33 and 34: 337D Individual REE composition of
- Page 35 and 36: 35(such as apatite or the barium al
- Page 37 and 38: 376 U and Th, which are generally a
- Page 39 and 40: 9 EXPLORATIONReconnaissance samples
- Page 41 and 42: 41(c) Quality control procedures.Th
- Page 43 and 44: 43leach gives much lower values (se
- Page 45 and 46: TABLE 9 Analyses of REE in 3 Ishika
- Page 47 and 48: CHA-4ppm20015010050ISHMINPCL0La Ce
- Page 49 and 50: Table 11 Results of leaching REE fr
- Page 51 and 52: Table 14 Soils analyzed by Ishikawa
- Page 53 and 54: 53Table 14 c REE leached from soil
- Page 55 and 56: 4 Nature of soilsTwo samples (E6869
- Page 57 and 58: 57Figure 15. Photomicrograph of sam
- Page 59 and 60: Figure 17. Xray diffraction scan of
- Page 61 and 62: 61Figure 19. Polished slab 40 mm lo
- Page 63 and 64: 63Figure 21 Photomicrograph of syen
- Page 65 and 66: 65profiles have well developed lowe
- Page 67 and 68: 67transporting material and people
- Page 69 and 70: 69boundaries. Pits and trenches wil
- Page 71 and 72: 71REFERENCESAnders, E., Grevesse, N
- Page 73 and 74: -lDATE AND SIGNATURE PAGEl, Peter C
- Page 75 and 76: VA11171150 - FinalizedCLIENT : MICG
- Page 77 and 78: ME-MS81 ME-MS81 ME-MS81 ME-MS81 ME-
- Page 79 and 80: 5 TOT-ICP06SAMPLE TotalDESCRIPT%E68
Table 6 REE recovered from leach liquors of samples of Table 3 as a % of REE in the solid samples.Calculated from data of Table 5 above for the “weathered rock” samples ( rock samples were not leached)31Sample La Ce Pr Nd Sm Eu Gd Tb Dy Ho Er Tm Yb Lu Y TREE TREE-Cenorec%rec%rec%rec%rec%rec%rec%rec%rec%rec%rec%rec%rec%rec%rec% rec % rec %11052201A 17 3 16 16 13 16 16 13 13 14 14 11 9 10 20 12 1611052201B 24 3 26 29 26 32 31 29 29 32 32 30 27 27 36 19 2811052201C 33 3 34 36 34 37 41 40 39 40 40 37 34 33 42 30 3811052301A 1 1 1 1 1 1 1 1 1 1 1 1 1 1 1 1 111052301B 0.1 0.2 0.1 0.1 0.1 0.1 0.1 0.1 0.1 0.1 0.2 0.2 0.2 0.3 0.2 0.1 0.111052302A 0.3 0.4 1 3 5 4 9 9 9 11 11 10 8 7 17 4 511052302B 1 0.3 3 4 5 3 8 8 8 9 9 8 6 5 14 3 511052303A 5 4 5 6 5 5 6 5 5 5 4 3 3 3 5 5 511052303B 20 2 23 26 22 22 25 21 20 22 23 20 19 18 27 15 2411052303C 14 1 22 27 31 31 <strong>43</strong> 44 45 47 47 44 41 39 53 27 3611052304A 6 5 6 6 6 7 9 8 8 8 7 6 6 5 11 6 711052304B 7 4 7 8 7 8 8 7 6 6 5 4 3 3 9 5 711052307 0.1 0.1 0.1 0.1 0.0 0.0 0.1 0.0 0.0 0.0 0.0 0.0 0.0 0.0 0.1 0.1 0.1Table 7 Re-analysis of 4 Ishikawa samples (CHA-2, 4, 6, 7) by MINDECO (WR-2, 4, 6, 7).Analyses by ICP/MS at Tokyo University, leach tests at Mitsui R & D Centre, Japan7A REE concentrations in the solid sampleLRE ppm MRE ppm HRE ppm TREETREE-CeSample La Ce Pr Nd Sm Eu Gd Tb Dy Ho Er Tm Yb Lu Y ppm ppmCHA-2 132 144 35 134 25 6 21 3 13 2 5 1 3 0 <strong>43</strong> 568 424WR2 129 215 35 132 26 6 21 3 16 3 8 1 7 1 62 663 448CHA-4 125 126 31 127 23 9 22 3 18 4 11 1 9 1 111 620 495WR4 1<strong>43</strong> 158 38 150 29 11 28 4 22 5 13 2 10 2 125 739 581CHA-6 104 88 24 93 17 6 17 3 14 3 8 1 6 1 92 475 387WR6 104 82 29 121 25 9 28 4 23 5 13 2 10 2 149 606 525CHA-7 215 132 42 146 21 5 18 2 12 2 6 1 5 1 59 665 533WR7 221 234 45 152 23 5 18 2 13 2 7 1 6 1 64 794 560


