

Temporal and fine-scale variation in the biogeochemistry of Jervis Bay
Temporal and fine-scale variation in the biogeochemistry of Jervis Bay
Temporal and fine-scale variation in the biogeochemistry of Jervis Bay
- No tags were found...

You also want an ePaper? Increase the reach of your titles
YUMPU automatically turns print PDFs into web optimized ePapers that Google loves.
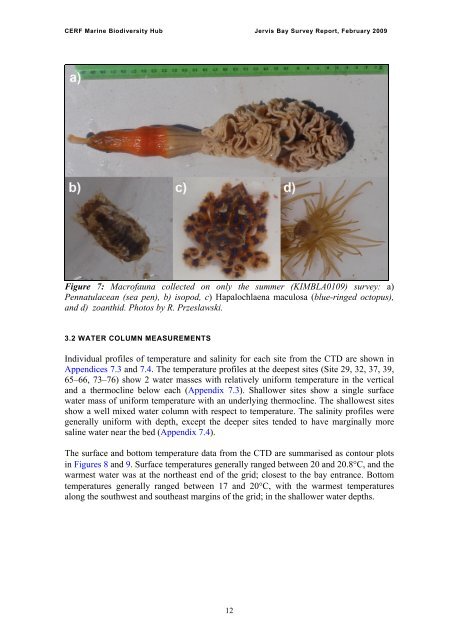
CERF Mar<strong>in</strong>e Biodiversity Hub <strong>Jervis</strong> <strong>Bay</strong> Survey Report, February 2009Figure 7: Macr<strong>of</strong>auna collected on only <strong>the</strong> summer (KIMBLA0109) survey: a)Pennatulacean (sea pen), b) isopod, c) Hapalochlaena maculosa (blue-r<strong>in</strong>ged octopus),<strong>and</strong> d) zoanthid. Photos by R. Przeslawski.3.2 WATER COLUMN MEASUREMENTSIndividual pr<strong>of</strong>iles <strong>of</strong> temperature <strong>and</strong> sal<strong>in</strong>ity for each site from <strong>the</strong> CTD are shown <strong>in</strong>Appendices 7.3 <strong>and</strong> 7.4. The temperature pr<strong>of</strong>iles at <strong>the</strong> deepest sites (Site 29, 32, 37, 39,65–66, 73–76) show 2 water masses with relatively uniform temperature <strong>in</strong> <strong>the</strong> vertical<strong>and</strong> a <strong>the</strong>rmocl<strong>in</strong>e below each (Appendix 7.3). Shallower sites show a s<strong>in</strong>gle surfacewater mass <strong>of</strong> uniform temperature with an underly<strong>in</strong>g <strong>the</strong>rmocl<strong>in</strong>e. The shallowest sitesshow a well mixed water column with respect to temperature. The sal<strong>in</strong>ity pr<strong>of</strong>iles weregenerally uniform with depth, except <strong>the</strong> deeper sites tended to have marg<strong>in</strong>ally moresal<strong>in</strong>e water near <strong>the</strong> bed (Appendix 7.4).The surface <strong>and</strong> bottom temperature data from <strong>the</strong> CTD are summarised as contour plots<strong>in</strong> Figures 8 <strong>and</strong> 9. Surface temperatures generally ranged between 20 <strong>and</strong> 20.8C, <strong>and</strong> <strong>the</strong>warmest water was at <strong>the</strong> nor<strong>the</strong>ast end <strong>of</strong> <strong>the</strong> grid; closest to <strong>the</strong> bay entrance. Bottomtemperatures generally ranged between 17 <strong>and</strong> 20C, with <strong>the</strong> warmest temperaturesalong <strong>the</strong> southwest <strong>and</strong> sou<strong>the</strong>ast marg<strong>in</strong>s <strong>of</strong> <strong>the</strong> grid; <strong>in</strong> <strong>the</strong> shallower water depths.12


