Contents - Institute for Fiscal Studies
Contents - Institute for Fiscal Studies
Contents - Institute for Fiscal Studies

Create successful ePaper yourself
Turn your PDF publications into a flip-book with our unique Google optimized e-Paper software.
SUMMER 2003THE INSTITUTE FORFISCAL STUDIESUpdateThe confirmation of the Child Trust Fund, an endowment paidto everyone at birth <strong>for</strong> them to access in adulthood, was thehighlight of an otherwise uneventful Budget. In this edition ofUpdate, Matthew Wakefield queries whether this is the best wayto support young people. We also examine the impact of MrBrown’s earlier Budgets on poverty and inequality, underlininghow difficult it is to play Robin Hood these days. TheChancellor’s room <strong>for</strong> manoeuvre in supporting the poor infuture Budgets depends on the underlying health of the publicfinances, which Chris Frayne assesses in light of the latest Treasury<strong>for</strong>ecasts. The lack of measures in the Budget did little to limit thenumber of pages in the Finance Bill, strengthening the Tax LawReview Committee’s call <strong>for</strong> more effective scrutiny of taxlegislation, which is described here by Malcolm Gammie. Thetiming of the Budget was not ideal <strong>for</strong> IFS’s residential conferenceon corporate taxation in the previous week, but as Mark Robsonreports, it was a great success, with particular focus on theconstraints imposed by European institutions. Mike Brewer looksat the new tax credits that were launched with some difficulty inApril and asks whether the money will get to the people who areentitled to it. And with regional differentials increasingly on theTreasury’s mind, Helen Simpson looks at differences in the ‘skillpremium’ in wages across the country.<strong>Contents</strong>The trust to fund your child? 2IFS Update is a newsletter<strong>for</strong> members of the<strong>Institute</strong> <strong>for</strong> <strong>Fiscal</strong> <strong>Studies</strong>,7 Ridgmount St,London, WC1E 7AETel: 020 7291 4800Fax: 020 7323 4780Email: mailbox@ifs.org.ukwww.ifs.org.ukChampion of the poor? 3Planning the public finances 5Making tax law 7The new tax credits 8IFS residential conference 2003 9Wages and firm location 10Who does what? 12
M ATTHEW WAKEFIELDThe trust to fund your child?The recent Budget announced the introduction of the Child Trust Fund.An endowment will be paid to every newly born child, but the recipientwill only have access to the money upon reaching adulthood. Is the ChildTrust Fund really a better way to support young people than simplyextending more traditional <strong>for</strong>ms of state intervention?2The Child Trust Fund was proposed in the lead-up to the2001 election, and the 2003 Budget announced that anychild born since 1 September 2002 will have an account. AChild Trust Fund will be a financial asset, created <strong>for</strong> eachnewly born child when an initial endowment is provided bythe State.The accounts will have the following features:• All children will receive an endowment of at least £250,and those from families with the lowest incomes willreceive £500.• Children will be given access to the funds at age 18.• Family and friends of the child can make contributions tothe account during its 18-year term (subject to a limit of£1,000 a year).• No restrictions will be placed on how the matured fundcan be used.• Account providers will compete in an open market.Criteria linked to the child tax credit are expected to meanthat one-third of children will be eligible <strong>for</strong> the largerendowment. The annual cost to the Exchequer of allendowment payments will be around £235 million. If, as ithas suggested it might, the government commits itself tomaking further contributions to accounts as children reachcertain ages, then the cost of paying contributions couldeventually rise to around half a billion pounds annually.Whether or not there will be further governmentcontributions as children age is just one of several as yetunconfirmed features. It would have been preferable to haveannounced a fully specified policy. Which children willreceive accounts has already been decided, even though theconsultation process about the design of the Child TrustFund is not expected to be completed until later thissummer. Providing accounts to all children born since 1September 2002 also means that around 2 million will haveentitlements to endowments be<strong>for</strong>e providers have set upthe accounts, since these are not expected to be availableuntil 2005. The accounts are likely to give children (or theirfamilies) options over where the funds should be invested; itis something of a moot point whether or how children bornbetween September 2002 and early 2005 will becompensated <strong>for</strong> any interest or stock returns lost becausethey were not able to have their endowments invested frombirth.Leaving aside the apparent under-preparedness of thispolicy, it is difficult to find a convincing explanation <strong>for</strong>why the government has chosen to support young peopleusing this policy. To give youngsters an asset that theycannot access until adulthood is a very different means ofsupporting them from the existing cash transfers orsubsidised public service provision. As the median holdingof savings among adults aged under 25 is around £50 – orzero if debt is netted off – these payments will have a largeimpact on the distribution of wealth among 18-year-olds.Even without any additional payments to the fund, theinitial endowment will, assuming a real rate of return of5%, be worth £600 or £1,200 at age 18, depending onwhether it was £250 or £500. If many spend their fundsstraightaway, the impact on the wealth of 19-year-olds willbe smaller, but young adults, who would not otherwise havehad access to these funds, will certainly benefit fromspending the resources.However, the rationale <strong>for</strong> the policy cannot simply comefrom the impact it will have on the wealth of young adults,or the opportunities that will be opened up by giving themspending power. One alternative use of the moneyearmarked <strong>for</strong> the Child Trust Fund that would extendopportunities <strong>for</strong> young people would be extra spending oneducation or training. For example, the government couldhave increased the generosity of the proposed grants <strong>for</strong>those from lower-income families who go on to highereducation. Another alternative would be to give a lumpsum directly to 18-year-olds, contingent on theircircumstances at that age; this looks like a much simplerand better-targeted way to transfer spending power toyoung adults than the proposed policy.The best justifications <strong>for</strong> setting up a Child Trust Fund 18years be<strong>for</strong>e the intended recipient can receive the moneymust lie in the role that such an account could have inteaching youngsters about financial assets and <strong>for</strong>wardplanning. Children might gain more from financial
education if they are able to see their own accountaccumulate during the course of their education. Learningabout financial planning is an ever more important skill intoday’s world of ISAs and private pensions. The Child TrustFund might not be the best way to teach youngsters aboutfinancial management and planning: a more effectivemethod might be to use the £235 million earmarked <strong>for</strong>Child Trust Fund endowment payments to provide extrafinancial education.The arguments considered do not seem to justify theencumbrance of means-testing payments into Child TrustFund accounts. Evidence that families move around theincome distribution as their children grow up suggests thatpayments made conditional on parental income at birthmight not be well targeted against circumstancesthroughout childhood or at age 18. Such means-testingmight also seem unfair to (<strong>for</strong> example) siblings who getdifferent sizes of endowment because their parents’ incomechanged by relatively small amounts between the birth oftheir children. Furthermore, the effectiveness of the meanstest is drawn into question by the fact that children fromricher backgrounds might be better equipped to invest theirfunds in assets that yield high returns. This issue becomeseven more fraught since it is quite possible that theimmediate beneficiaries of the Child Trust Fund will bericher families who can substitute the endowment payment<strong>for</strong> saving that they would have done <strong>for</strong> their children, andso increase their current consumption. Families who wouldnot have saved <strong>for</strong> their children, many of whom will bepoorer families, will have to wait 18 years to benefit fromtheir Child Trust Fund. Given the complications of usingthe Child Trust Fund as a redistributive tool, there is a case<strong>for</strong> saving on the administrative costs of the policy andusing other existing policies to achieve redistributive goals.The Child Trust Fund is an innovative means of providingsupport to young people. Many will undoubtedly benefitfrom the policy. However, the policy as enacted is not fullyspecified and has not been satisfactorily justified.Matthew Wakefield is a Senior ResearchEconomist at IFS.IFS Commentary 85, ‘The Saving Gateway andthe Child Trust Fund: Is Asset-Based Welfare‘Well Fair’?’ (by Carl Emmerson and MatthewWakefield) is available online at:www.ifs.org.uk/pensions/abw.pdfChampion of the poor?Redistribution under New LabourSince Gordon Brown became Chancellor in1997, he has discovered how tough it is toplay Robin Hood in a modern marketeconomy. He has taken from the rich andgiven to the poor – yet incomes in Britainare distributed more unequally now than atany time under his five Conservativepredecessors.Why the paradox? It is certainly not that Mr Brown’sre<strong>for</strong>ms have lacked breadth. Over seven Budgets, he hasleft his mark on income tax, National Insurance, exciseduties, stamp duty and corporate taxes. He has increasedpensions and child benefit. And he has achieved what RoyJenkins described 35 years ago as the ‘philosopher’s stone’ ofsocial security re<strong>for</strong>m, offering help to the less-well-offthrough tax credits as well as benefit payments.Neither have the sums of money involved beeninsignificant. This becomes clear if we compare the tax andbenefit system in the current tax year with the systemLabour inherited (adjusted <strong>for</strong> inflation and the upratingthat would have taken place in any event had Mr Brownsimply put his feet up).In the 400 or so policy measures announced between hisinaugural Budget in July 1997 and last year’s Pre-BudgetReport – including the National Insurance increases andnew tax credits that have just come in – the Chancellor hasin effect taken more than £50 billion with one hand andgiven back more than £50 billion with the other. These arebig numbers, even compared with the £120 billion annualcost of social security or the £400 billion the Treasurycollects in taxes each year.Within these totals, the net effect of changes to personaltaxes, tax credits and benefit payments has been to raise theincomes of the poorest tenth of the population by around15%, while reducing the incomes of the richest tenth by3
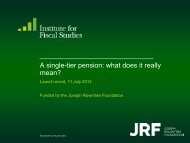
4about 3%. For some re<strong>for</strong>ms – higher business taxes, <strong>for</strong>example – it is hard to identify precisely the householdsmost affected. But, in all probability, these other measureswould show the same pattern, with poorer householdsgaining relative to the better-off.To complain that the government has nonetheless failed toreduce inequality invites the response that it never claimedthat it would. When Tony Blair was questioned on theBBC’s Newsnight two years ago about his attitude toinequality, he refused to say whether a widening gapbetween rich and poor was acceptable. He argued insteadthat it was more important that ‘people on low incomes’should be getting better off.Consistent with that view, the government has focusedrhetoric and resources on reducing poverty, especiallyamong what it sees as particularly vulnerable groups.Specifically, it has promised to ‘eradicate child povertywithin a generation’ and ‘end pensioner poverty in ourcountry’. Recent figures from the Department <strong>for</strong> Workand Pensions show modest progress on both fronts.In its assault on child poverty, the government has this yearearmarked around £21 billion in financial supportspecifically <strong>for</strong> families with children. Since 1996, thisrepresents an increase of 50% on top of inflation and 34%on top of the rise in average earnings. Mr Brown’s belovedtax credits have been the main channel <strong>for</strong> this extra help,with the new means-tested child tax credit set to overtakechild benefit as the biggest source of support <strong>for</strong> children.As a result of these extra resources, child poverty has indeedfallen on the government’s principal target measure.According to the latest official figures, the number ofchildren living in families on less than 60% of medianincome (after deducting housing costs) fell by 100,000 in2001–02 to 3.8 million or about one in three.As an interim target, the government has promised to cutchild poverty on this definition to around 3.1 million by2004–05. On current trends, it looks as though thegovernment could fall more than 200,000 short of itstarget. But even so, child poverty is still at its lowest level inmore than a decade, with further declines in prospect.As <strong>for</strong> pensioners, policy changes between 1997 and lastyear’s Pre-Budget Report add up to a package worth £7.3billion in the current tax year. The largest elements are therises in the basic state pension and minimum incomeguarantee in April 2001 and the introduction of thepension credit due this October.As one might expect, this has reduced pensioner poverty –although there is no official interim target against which tomeasure progress. The number of pensioners with incomesbelow 60% of the median has fallen by 400,000 sinceLabour came to power, reaching 2.2 million, or 22%.Barely half the increased help <strong>for</strong> pensioners has had timeto feed through to the figures, which suggests that thenumber could fall significantly further by 2004–05.To some extent, the numbers are flattered by pensionersmoving from just below the line to just above – the6. 0%5. 0%4. 0%3. 0%2. 0%1. 0%0. 0%-1.0%6.0%5.0%4.0%3.0%2.0%1.0%0.0%-1.0%6.0%5.0%4.0%3.0%2.0%1.0%0.0%-1.0%Figure 1: Real annualised income growthNotes: Incomes are measured be<strong>for</strong>e housing costs and adjusted <strong>for</strong> family size.Quintile 1 is the poorest and quintile 5 the richest.Source: Authors’ calculations using Family Resources Survey andFamily Expenditure Survey.Thatcher 79-90, Real Annual Average BHC Income Growth0.4% 0.4%2.1% 2.1%3.8%1 2 3 4 5Equivalised Income QuintileMajor 90 - 97, Real Annual Average BHC Income Growth1.4%0.6% 0.8% 0.9%0.6%1 2 3 4 5Equivalised Income QuintileBlair 97 - 01, Real Annual Average BHC Income Growth2.8%3.4%2.5% 2.5%1 2 3 4 5Equivalised Income Quintile2.7%numbers below 50% and 70% of median income havemoved less favourably. On the other hand, pensioners havenot fallen behind in relative terms as they normally dowhen the incomes of people in work have been growingstrongly.One might have expected inequality to decline as thesepoverty measures have fallen, especially as the governmentmeasures poverty relative to median incomes rather than afixed level of living standards. Yet the most popular singlemeasure of inequality – the Gini coefficient – showed nostatistically significant change in the latest year. Havingrisen sharply during the Thatcher years, and then fallenslightly under John Major, inequality has risen to andremained at new highs under Labour. This reflects the factthat although the poorest two-fifths of the population haveseen the biggest rises in income since 1997, the richest fifthhave fared better than many middle earners.
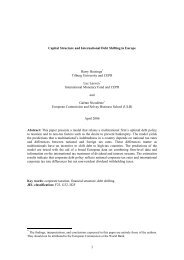
Figure 2: The Gini coefficientNote: Incomes are adjusted <strong>for</strong> family size and measured be<strong>for</strong>e housing costs (BHC)and after housing costs (AHC).Source: Authors’ calculations using Family Resources Survey andFamily Expenditure Survey.0.400AHC0.350Mr Brown’s redistributive ef<strong>for</strong>ts – together with the plightof the financial sector following the stock market bust –may reduce inequality somewhat as it feeds into the figuresover the next few years. But over the longer term, theoutlook <strong>for</strong> egalitarianism is an uncertain one. Someunderlying economic pressures towards greater inequalitymay well persist, while a Chancellor facing weaker publicfinances may find his Robin Hood act tougher to sustain.Gini Coefficient0.3000.2500.200BHC0.150That cherMajorBlair197919811983198519871989This suggests that the government’s poverty reductionef<strong>for</strong>ts are taking place against a backdrop of underlyingeconomic pressures towards greater inequality. Mr Brownhas had to run simply to stand still, and inequality wouldhave been higher had he chosen not to do so.In part, this simply reflects a relatively long period of strongearnings growth <strong>for</strong> people in work, which is no bad thing.In addition, growth in employment may havedisproportionately benefited households where someonewas already in work. Financial returns to skills andeducation, plus the impact of the 1990s’ stock marketboom on City pay, may also have contributed to incomegrowth at the top end.19911993-941995-961997-981999-002001-02This article is based on analysis of the 2003 HouseholdsBelow Average Income figures, carried out by MikeBrewer, Alissa Goodman, Michal Myck and AndrewShephard at IFS.For further reading, see: ‘Sharing in the Nation’sProsperity? Pensioner Poverty in Britain’, IFSCommentary 93 (by Alissa Goodman, Michal Myck andAndrew Shephard); ‘How Has Child Poverty ChangedSince 1998–99? An Update’, IFS Briefing Note 32 (byMike Brewer, Alissa Goodman and Andrew Shephard);and ‘Inequality Under the Labour Government’, IFSBriefing Note 33 (by Andrew Shephard). Alternatively,visit the IFS website at:www.ifs.org.uk/inequality/hbai03.shtmlThe government’s ambition to abolish child poverty isanalysed by Mike Brewer and Paul Gregg in ‘Eradicatingchild poverty in Britain: welfare re<strong>for</strong>m and children since1997’, <strong>for</strong>thcoming in ‘The Welfare We Want?’ (edited byR. Walker and M. Wiseman), The Policy Press, Bristol.C HRIS F RAYNEPlanning the public financesJust a year ago, in April 2002, the Chancellor was <strong>for</strong>ecasting borrowing <strong>for</strong>2002–03 of £11.2 billion. In fact, the government borrowed £25.2 billion inthat year – an increase of £14.0 billion. As well as the out-turn being higher thanpreviously <strong>for</strong>ecast, the Treasury has also increased its medium-term borrowing<strong>for</strong>ecasts. This year, it is expecting to borrow £27.3 billion, compared with a <strong>for</strong>ecastof £13 billion a year ago, while <strong>for</strong>ecasts <strong>for</strong> 2004–05, 2005–06 and 2006–07 are£11 billion, £6 billion and £4 billion higher respectively.5
6The government’s <strong>for</strong>ecasts <strong>for</strong> the surplus on the currentbudget – public sector receipts minus current spending –have also deteriorated. Gordon Brown’s ‘golden rule’, whichwas unveiled alongside the code <strong>for</strong> fiscal stability in July1998, states that the government will run a surplus on thecurrent budget. Sensibly, this is to be assessed over theeconomic cycle rather than in any single year. Back in April2002, the Chancellor was <strong>for</strong>ecasting a cumulative surplusover the economic cycle (which is expected to run from1999 to 2005) of £46 billion. The downward revisions toreceipts and upward revisions to spending we have seen sincethen have reduced this surplus to £32 billion by the 2003Budget.The cyclically adjusted measure of the current budget, whichattempts to adjust <strong>for</strong> the effect of the economic cycle andhence provide a picture of the underlying strength of thepublic finances, went into deficit in 2002–03 <strong>for</strong> the firsttime since the golden rule was introduced. This indicatesthat were there to be no changes to taxation or spendinglevels, the government would expect to miss its golden rulegoing <strong>for</strong>ward if this were an average economic cycle. Inpractice, the fact that the Chancellor thinks there issomething special about this economic cycle means that heis expecting the cyclically adjusted measure to bounce back.One reason <strong>for</strong> this might be that, while there wasadditional spending on the war in Iraq in 2002–03, this isnot expected to persist in the medium term. However,unlike previous years, when the Chancellor predicted thatthe government would break even in the medium term onthe cyclically adjusted current budget, even on a morepessimistic GDP <strong>for</strong>ecast, there is now less scope <strong>for</strong> thegovernment to have overestimated trend output, as some ofthe caution from the <strong>for</strong>ecasts has been removed.This worsening fiscal outlook has prompted muchspeculation about the possibility of either cuts to theChancellor’s spending plans or further tax increases. TheTreasury’s opinion is clear: the extra borrowing is due in partto temporary downturn in the UK and in part to othertemporary factors such as the world economy and fallingequity prices. As neither of these reasons is assumed to bepermanent, the Treasury expects that, over the mediumterm, the fiscal position will return to a healthier state. Theextra borrowing can be absorbed without the fiscal rulesbeing breached, as large surpluses were built up in the earlieryears of the economic cycle. If this view is correct, then thegovernment is in a position to deliver the large spendingincreases set out in its Spending Reviews aimed at deliveringworld-class public services without any further increases intax.Yet concerns remain about whether there is a more longtermproblem with the public finances. Compared with the<strong>for</strong>ecasts made one year earlier, the April 2003 Budgetreduced <strong>for</strong>ecast receipts by £6 billion in 2003–04 becauseof the impact of the downturn in financial companies’profits. By 2006–07, all but £1 billion is expected by theTreasury to bounce back. The <strong>for</strong>tunes of financialcompanies will depend in part on the stock market. In so faras the Treasury’s <strong>for</strong>ecasts <strong>for</strong> tax receipts from financialcompanies require a stock market recovery, the assumptionthat there will be an upturn in the profits of thesecompanies is far from cautious. It is also one that providesthe government with half the total bounce-back in taxrevenues it expects over the medium term and is there<strong>for</strong>e asignificant contributor to the Treasury’s optimism about themedium term.If these concerns were realised, then the government wouldfind itself with a deficit on the current budget in 2005 – theexpected end of the current economic cycle. It would thenbe starting the next economic cycle with a current budgetdeficit and would there<strong>for</strong>e expect to miss the golden rulegoing <strong>for</strong>ward. In this case, either a scaling-back of theplanned spending increases or further tax increases would benecessary. As the Labour government appears to becommitted to improving public services, further increases intax would seem to be the more likely option. In the JanuaryGreen Budget, we suggested that taxes would need to rise by£4 billion <strong>for</strong> the golden rule to be met going <strong>for</strong>ward, whilea £10 billion increase would be necessary to restore cautionto its previous levels. These increases would need to be fullyin place by April 2005. There was little in the Budget thatwould significantly change our <strong>for</strong>ecasts.Chris Frayne is a Senior Research Economist at IFS.For further reading about the public finances andspending, see ‘The IFS Green Budget: January 2003’, IFSCommentary 92 (edited by Robert Chote, Carl Emmersonand Helen Simpson), which is available online at:www.ifs.org.uk/gbfiles/gb2003.shtmlOur online coverage of Budget 2003 can be found at:www.ifs.org.uk/budgetindex.shtml
M ALCOLM G AMMIEMaking tax lawIt is now nearly 10 years since the Tax Law Review Committee (TLRC) first turned itsattention to complexity in taxation. The outcome was the Tax Law Rewrite Project(TLRP), which has recently seen its second major Bill of rewritten tax legislation enactedas the Income Tax (Earnings and Pensions) Act 2003. Although achieving remarkablesuccess in its ef<strong>for</strong>t to turn existing legislation, sometimes of considerable antiquity, into amore comprehensible and accessible structure and language, the Rewrite Project’s remit islimited. In particular, it has no remit to review and question the policy that underliescurrent legislation and which may contribute to complexity.It is not surprising, there<strong>for</strong>e, that there continue to be calls<strong>for</strong> simplification that goes beyond the legal language of thetaxing Acts. In his 2000 Hardman Lecture, Lord Howe, theTLRC President, spoke of the need to institutionalise aprocess that would be relentless in its call <strong>for</strong> taxsimplification. The TLRC responded by establishing aworking party chaired by Sir Alan Budd and with crosspartyrepresentation from both the House of Commons andthe Lords. Its remit was to consider the institutional process<strong>for</strong> developing and enacting tax legislation.The TLRC launched the Budd Report – Making Tax Law –at Westminster in March, shortly be<strong>for</strong>e the Budget. Thereport focuses on the parliamentary input to tax legislationor, perhaps more accurately, the current absence of effectiveinput by the House of Commons. Its central proposal is theestablishment of a Select Committee on Taxation, toconsider and report on the government’s tax proposals, withterms of reference that recognised the need to enquire intothe relative complexity of those proposals. To facilitate thatscrutiny, the report proposes that government should<strong>for</strong>mally engage the process of parliamentary scrutiny bypublishing either draft legislation or a detailed statement ofits proposals.The report does not envisage that Parliament would seek toengage in the pre-legislative consultation process, which hasgrown significantly in recent years. On the other hand, it isanticipated that effective parliamentary scrutiny of anyproposals prior to enactment should impose its owndiscipline on the consultative process and how it isconducted.It could take many years to make any impression on the taxsystem as a whole if all that were done was to tackle newproposals more effectively. The Budd Report also proposes,there<strong>for</strong>e, to establish a Tax Structure Review Project(TSRP), as a parallel and complementary project to theRewrite Project. The remit of the TSRP, in contrast to theTLRP, would be to review current tax legislation free of thepolicy constraints that necessarily surround the TLRP. Assuch, it would work within government to promote thecause of simplicity in the tax system.Nobody can be especially optimistic about change or itspace. Nevertheless, the Budd Report builds on the work ofthe House of Commons’ Modernisation Select Committee.One might at least hope, there<strong>for</strong>e, that the tide is runningin favour of change. And, as the Budd Report notes, ‘if theHouse of Commons is unprepared or unwilling to grasp thenettle of proper Parliamentary scrutiny of tax legislation, itcan scarcely claim to maintain its prerogative to be the onlyHouse competent to consider tax issues’. The establishmentby the Lords’ Economic Affairs Committee of aSubcommittee to examine the Finance Bill is a timelyreminder that others are prepared to act in this field withoutwaiting <strong>for</strong> the Commons.Malcolm Gammie is Research Director of the Tax LawReview Committee at IFS and is at One Essex Court.The committee’s report, ‘Making Tax Law’, TLRCDiscussion Paper DP3, is available on the IFS websiteat: www.ifs.org.uk/taxlaw/budd03.pdf7
M IKE B REWERThe new tax credits: can thegovernment persuade families toclaim them?In April, the personal tax system saw its biggest re<strong>for</strong>m under the present Labourgovernment, when the child tax credit and working tax credit were introduced. The childtax credit will eventually support around 90% of families with children in the UK, andwill deliver more money to parents than child benefit. Because of administrativeproblems, many families, some of whom had applied more than two months in advance,did not receive any tax credits during the first few weeks of the system. The fact that thisdramatic collapse in response times particularly affected those families who chose to bepaid weekly (usually those on the lowest incomes) was especially embarrassing <strong>for</strong> thegovernment. The hope must now be that the Inland Revenue will quickly overcome theseinitial difficulties, because its essential task is to focus on increasing take-up amongstthose who need this financial support the most.8The child tax credit effectively merges together several partsof the tax and benefit system, and was designed to simplifythe structure of financial support <strong>for</strong> parents. The workingtax credit is designed to make work more financiallyattractive, and make low-paid work more financially viable,<strong>for</strong> those on low earnings, with or without children.Why did the government choose to change the benefits andtax credits that were in place <strong>for</strong> families with children? Ithas been continually increasing income-related payments tofamilies because of its desire to reduce child poverty. Tryingto reduce child poverty by increasing child benefit alone,which is paid at the same rate to all parents, would beextremely expensive. But the new tax credits also show thegovernment’s frustration with both income tax and theprevious benefit system. Income tax, presumably, does notallow enough targeting at a family level, and traditionalmeans-tested benefits are perhaps seen as unacceptablycomplicated and stigmatising, and not appropriate <strong>for</strong> aprogramme that covers 90% of families with children.One of the key drawbacks with tax credits is that familiesneed to submit a claim <strong>for</strong> them, in contrast to income taxcuts, which benefit income-tax-payers automatically, anduniversal benefits such as child benefit, which are claimedby virtually all who are entitled. Un<strong>for</strong>tunately, experiencetells us that some families do not claim tax credits ormeans-tested benefits: take-up of the working families’ taxcredit (WFTC) was estimated at around 62–65%, lowerthan that <strong>for</strong> family credit, and much lower than the takeuprates <strong>for</strong> income support and housing benefit (estimatedas over 95% in 1999–2000). Families might not claimbecause they do not know they are eligible or because theydecide not to apply. Quantitative analysis tells us that thoseentitled to smaller amounts and those with higher levels ofeducation are less likely to apply, and longitudinal researchsuggests that families who did not claim WFTC in 2001often either had not heard of it or believed that receivinggovernment money was stigmatising. In total, non-take-upof the WFTC saved the government – and cost low-incomefamilies – around £1.4 billion a year in 2000–01.One of the goals <strong>for</strong> the new tax credits is to increase theproportion of eligible families who actually take up thesupport, by simplifying the system and reducing the stigmaof receiving support. The Inland Revenue estimates that90% of families with children will be eligible <strong>for</strong> the newtax credits, and that 90% of these will claim them in2003–04, implying that around 775,000 families withchildren will be missing out on tax credit payments. Is thisoptimistic? Experience from family credit and the WFTCre<strong>for</strong>ms suggests that take-up could take a few years to riseto its new long-run level, as awareness of the re<strong>for</strong>m spreadsamongst the population; clearly, though, the amount ofadvertising on the new tax credits may speed up this
transition. The fact that over 90% of families with childrenwill be entitled to the child tax credit should reduce thenumber of families who do not claim because they thinkthat they will not be entitled or that they will only beentitled <strong>for</strong> a short time. On the other hand, the way thatthe new tax credits are administered will be different fromthe administration of the old tax credits. The claim <strong>for</strong>m isrelatively long, requiring more in<strong>for</strong>mation than the oldchildren’s tax credit did, including income in<strong>for</strong>mation <strong>for</strong>both members of a couple.The success or failure of the new tax credits depends to alarge extent on the practicalities of administration anddelivery. This makes it hard to predict whether thegovernment will manage to persuade the vast majority ofthose entitled to the tax credits to claim them, and whetherpeople will understand the complicated way in whichentitlements change along with changes in familycircumstances. But the re<strong>for</strong>m certainly shows that theLabour government is happy to increase the administrativeburden on families with children, many of whom will nowcomplete a <strong>for</strong>m similar to the annual tax return completedby those who undergo self-assessment.Mike Brewer is a Senior Research Economist at IFS.The new tax credits are described in IFS Briefing Note35, ‘The New Tax Credits’ (by Mike Brewer), availableonline at: www.ifs.org.uk/taxben/bn35.pdfThe Labour government’s use of means-tested benefits andtax credits is analysed by Mike Brewer, Tom Clark andMatthew Wakefield in ‘Social security in the UK undernew Labour’, <strong>Fiscal</strong> <strong>Studies</strong>, 23(4): 505–37. Researchon the factors affecting take-up of the WFTC, funded bythe Inland Revenue, is ongoing at IFS and due to becompleted in late 2003.M ARK ROBSONIFS residential conference 2003Long-standing members will recall that the IFS residential conference always takes placeat the beginning of every other tax year – just after the Budget, so that we can all take theopportunity to talk about anything interesting in that.Not, alas, in 2003, when the Budget was scheduled, late inthe day, <strong>for</strong> lunchtime on 9 April – in the following week.There wasn’t, as it turns out, anything interesting in it at all– but the timing did mean that the several Inland Revenueofficials who had kindly agreed to speak at the conferencewere disqualified by pre-Budget purdah. This, and the factthat a couple of international speakers had to drop out onaccount of emergencies, might have meant that the monthsof meticulous planning by Malcolm Gammie and JackMintz were ruined.Instead, exploiting both flexibility and ingenuity, this year’sconference – on the international future <strong>for</strong> corporation tax– was a huge success. Attendance, at 120, was higher thanever be<strong>for</strong>e, with particularly gratifying levels ofrepresentation from industry and commerce and fromoutside the UK. Several participants kindly volunteered tomake presentations or chair group sessions at short notice,and the discussion was often lively and surprisinglycontroversial.The strongest theme, emerging at the outset, was theinfluence and constraints imposed on tax policy-making inthe UK – as indeed in all other member states – of theEuropean Union institutions and, in particular, theEuropean Court of Justice. In his imaginative andthoughtful dinner speech, Lord Howe managed to linkthese issues to European <strong>for</strong>eign policy more generally andthe situation in Iraq.The inability to move flexibly and quickly to adjust thecorporate tax system in response to imminent changes inthe USA was felt by many to be a serious problem,especially given the generous approach to interest expensein the UK and continuing decline in marginal rates9
worldwide. In response, some felt that a set of EU-wide,statutory minimum rules was the answer; others stronglyfavoured free competition, championed by Chris Wales.There was also some criticism – vigorously rebutted by itschairman, Gabs Makhlouf – of the OECD <strong>Fiscal</strong> AffairsCommittee in not yet driving <strong>for</strong>ward the debate moreproactively.Amongst the many welcome, frank feedback commentswere several requests to consider options <strong>for</strong> a slightlydifferent <strong>for</strong>mat, venue and indeed time of year, to avoidany further un<strong>for</strong>tunate Budget clashes. These points willall be considered carefully well in advance of 2005, perhapsconsulting members who did not attend this year (as well asthose who did) on what factors would be most likely topersuade them to come too. But certainly, in view of theoverwhelming success of this year’s event, the basic <strong>for</strong>mulahas once again proved its worth.Mark Robson is a member of the IFS ExecutiveCommittee and the Tax Law Review CommitteeH ELEN S IMPSONRegional wage variationand industry locationDo high-skilled workers earn the same wage premium in every corner of Great Britain?Is the relative wage of high- to low-skilled workers different in the South-East and theNorth-East? New research has found evidence of significant differences in the relativewage of high-skilled workers – the ‘skill premium’ – across the British regions. The resultssuggest that relative wages <strong>for</strong> high-skilled workers compared with low-skilled workers areone-third lower in the south-east of England, where high-skilled workers are relativelymore abundant, than in Wales or Scotland. The absolute level of wages in the South-Eastmay be higher <strong>for</strong> both groups of workers, but the relative wage of high-skilled workers islower.?10A central explanation <strong>for</strong> relative wage differences is thatregions specialise in producing different goods dependent ontheir relative endowments of high- and low-skilled workers.We find evidence that this is true in Great Britain – thegreater the difference in relative wages between two regions,the less similarity there is in the range of goods they produce.The findings have important implications <strong>for</strong> regionalresponses to globalisation. Regions within advanced countriessuch as Britain may be differentially affected by increasedimport competition from low-wage countries, depending onthe extent to which they specialise in goods that also use lowskilled-labour-intensiveproduction techniques. The resultsalso relate directly to debates about the role of regionalpolicies designed to attract skilled-labour-intensive industriesto low-skilled-labour-intensive regions.The research focuses on relative factor price equality; moreprecisely, it tests whether the relative wages of high- and lowskilledworkers are equalised across Great Britain. Britain is aparticularly well-suited target <strong>for</strong> this test, given its smallgeographic area and high population density – conditions thatshould strengthen the <strong>for</strong>ces behind factor price convergence(i.e. trade in goods and the mobility of capital and workers).The analysis takes into account the fact that if there areunobserved differences in the quality or productivity ofworkers across regions, then observed wages will generallyvary, even if true ‘quality-adjusted’ wages are the same. Ourtest uses total wage bill payments to high- and low-skilledworkers to control <strong>for</strong> this potential unobserved regionalvariation in the quality, productivity or composition ofworkers within each of the two groups.Spatial variation in relative wages is examined at two levels ofgeographical disaggregation. First, we consider the 10
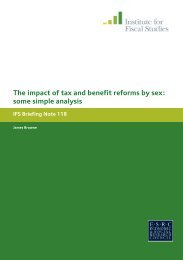
Figure 1: Administrative regions, 1992 Figure 2: Postcode areas, 1992ScotlandSkill premium above averageSkill premium at averageSkill premium below averageSkill premium above averageSkill premium at averageSkill premium below averageNorthYorkshire & HumbersideNorth WestEast MidlandsWest Midlands East AngliaWalesSouth WestSouth Eastadministrative regions of Great Britain. Secondly, we examinevariation across the more than 100 postcode areas. At bothlevels, we find strong evidence against relative factor priceequality.The results can be used to derive implied quality-adjustedrelative skilled wages. Using results <strong>for</strong> the manufacturingsector <strong>for</strong> 1992, Figures 1 and 2 show administrative regionsand postcode areas where the skill premium differs from theBritish average. Figure 1 shows that the south-east of Englandis the only administrative region where the skill premium issignificantly lower than the British average (23% below),compared with Wales and Scotland, where the skill premiumis around 20% above the national average. Figure 2 shows thespatial pattern <strong>for</strong> postcode areas. The postcode areas ofSutton, St Albans, Cambridge, Redhill, Kingston, HemelHempstead, Swindon, Twickenham and Slough are the darkshaded areas where the skill premium is below the nationalaverage. These are concentrated exclusively in the South-Eastclose to the M25, the M4 corridor and the area aroundCambridge, which is consistent with the recent developmentof clusters of skill-intensive in<strong>for</strong>mation technology andbiotechnology industries in these areas.One explanation <strong>for</strong> the findings is that regions havesufficiently different numbers of the two types of workers, sothat they specialise in distinct industries, and if at least onetype of worker displays a degree of geographical immobility,then quality-adjusted regional relative factor prices (e.g.relative wages ofhigh- to low-skilled workers) will vary. Immobility <strong>for</strong> onetype of worker prevents regional wages (and endowments ofworkers) from converging towards a common value across thecountry (and a substantial body of empirical evidence suggeststhat labour mobility across British regions is relatively low). Acentral prediction that follows is that the skill premium acrossregions will be inversely proportional to skill endowments. Inline with this, we find that the skill premium is lower inregions around London, where high-skilled labour is relativelymore abundant, and higher in outlying areas, where highskilledlabour is relatively scarce.An additional implication of this story is that regions withdifferent skill premiums exhibit systematic differences inproduction structure, with high-skilled-labour-abundantregions producing a set of goods that is more skilled-labourintensive.We examine the similarity of industrial structureacross regions and, as predicted, find that the greater thedifference in relative wages across regions, the greater thedifference in industrial structure.Taken together, our findings suggest that spatial variation inrelative factor prices plays an important role in shaping firms’location decisions within Great Britain. Evidence of systematicdifferences in industrial structure linked to relative factorprices implies that external shocks may affect British regionsasymmetrically. The results also contribute to understandingregional variation in economic outcomes within Great Britain,an issue of increasing policy interest in the context of ongoingpolitical devolution.This article is based on ‘Factor price equalization inthe UK?’, NBER Working Paper 9052 and IFS WorkingPaper 02/11 (by Andrew Bernard, Stephen Redding, PeterSchott and Helen Simpson. The research received financialsupport from the ESRC (grant RES000220103).Andrew Bernard is an Associate Professor at the TuckSchool of Business at Dartmouth and an InternationalResearch Fellow at IFS. Stephen Redding is a SeniorLecturer in the Economics Department of LSE and aResearch Fellow at IFS. Peter Schott is an AssistantProfessor at the Yale School of Management and anInternational Research Fellow at IFS. Helen Simpson is aProgramme Co-ordinator at IFS.11
Who does what?If you have any questions about our work, you can look on our website. (www.ifs.org.uk) or contact us at IFS on 020 7291 4800 or by. email to mailbox@ifs.org.uk. Members of staff are always. happy to discuss their research with members.General enquiriesChantal Crevel-RobinsonRobert MarklessBusiness investmentAlex KlemmChild supportMike BrewerChild Trust FundMatthew WakefieldConferencesJean HaddockConsumer demandLaura BlowIan Craw<strong>for</strong>dAndrew LeicesterZoë SmithCorporate taxAlex KlemmEducation and trainingLorraine DeardenChris FrayneAlissa GoodmanHoward ReedHealthCarl EmmersonChris FrayneFrank WindmeijerIndirect taxesLaura BlowIan Craw<strong>for</strong>dZoë SmithInequality and standards oflivingMike BrewerIan Craw<strong>for</strong>dAlissa GoodmanAndrew ShephardInnovation and R&DRachel GriffithHelen SimpsonLabour marketLorraine DeardenHoward ReedLocal governmentCarl EmmersonLocation decisions andmultinational firmsRachel GriffithHelen SimpsonPensions and retirementCarl EmmersonMatthew WakefieldPovertyMike BrewerAlissa GoodmanPress enquiriesEmma HymanPrice indicesLaura BlowIan Craw<strong>for</strong>dProductivityRachel GriffithHelen SimpsonPublication ordersChantal Crevel-RobinsonPublic finances and spendingCarl EmmersonChris FrayneSavingCarl EmmersonMatthew WakefieldTax and benefit modelHoward ReedTax credits <strong>for</strong> individualsMike BrewerTaxes, benefits and socialsecurityStuart AdamMike BrewerAndrew LeicesterHoward ReedAndrew ShephardTax Law Review CommitteeMalcolm GammieWebsiteEmma Hyman