Director's report for 2010 - TTS Group ASA
Director's report for 2010 - TTS Group ASA
Director's report for 2010 - TTS Group ASA

You also want an ePaper? Increase the reach of your titles
YUMPU automatically turns print PDFs into web optimized ePapers that Google loves.
a n n u a l r e p o r t<br />
<strong>2010</strong><br />
ttS <strong>Group</strong> aSa
ttS <strong>Group</strong><br />
Historical development 6<br />
Financial highlights 8<br />
Key events <strong>2010</strong> 10<br />
Report from the CEO 12<br />
BuSineSS areaS<br />
Marine Division 16<br />
Energy Division 20<br />
Port and Logistics Division 24<br />
Chinese venture 28<br />
Momentum 30<br />
Extensive upgrading of ports 32<br />
corporate covernance<br />
in<strong>for</strong>mation<br />
Shareholder in<strong>for</strong>mation 35<br />
Corporate governance 36<br />
Senior management 40<br />
Board of Directors 42<br />
director’S <strong>report</strong> and<br />
accountS<br />
Director’s <strong>report</strong> 45<br />
PROFit anD LOSS aCCOunt anD nOtES<br />
- <strong>Group</strong> 51<br />
- ttS <strong>Group</strong> aSa 95<br />
auditor’s <strong>report</strong> 114<br />
Responsibility statement 116<br />
orGaniSation<br />
this is ttS 118<br />
Companies in the ttS <strong>Group</strong> 122<br />
financial calendar 2011<br />
- 4. quarter <strong>2010</strong>/preliminary<br />
annual result <strong>2010</strong> 24 February<br />
- 1. quarter 2011 12 May<br />
- 2. quarter 2011 17 august<br />
- 3. quarter 2011 10 november<br />
- annual general meeting 19 May
3<br />
”<br />
ttS – continuously<br />
generating profits by<br />
being the preferred<br />
global supplier <strong>for</strong><br />
handling equipment<br />
to the maritime and<br />
oil & gas industry<br />
Canada<br />
Edmonton<br />
USA<br />
Fort Lauderdale<br />
Houston<br />
Brazil<br />
Macaé
Germany<br />
Bremen<br />
Lübeck<br />
Norway<br />
Bergen<br />
Nodeland<br />
Kristiansand<br />
Drøbak<br />
Sweden<br />
Gothenburg<br />
Czech Rebublic<br />
Ostrava-Hrabová<br />
Italy<br />
Genoa<br />
Finland<br />
Tampere<br />
Greece<br />
Piraeus<br />
<strong>TTS</strong> has a worldwide network of branch offices,<br />
service stations and agents, and provides after sales service<br />
in the major shipping regions in the world.<br />
Companies in the <strong>TTS</strong> <strong>Group</strong><br />
Sales and service network<br />
Singapore<br />
Singapore<br />
Vietnam<br />
Haiphong City<br />
China<br />
Dalian<br />
Nantong<br />
Shanghai<br />
Korea<br />
Busan
<strong>TTS</strong> <strong>Group</strong> <strong>ASA</strong><br />
Bergen-headquartered <strong>TTS</strong> is a global enterprise<br />
that designs, develops and supplies equipment<br />
<strong>for</strong> marine industry and the oil & gas industry.<br />
The operations are split into three separate<br />
divisions: Marine, Energy and Port and Logistics.<br />
<strong>TTS</strong> is one of the top three largest suppliers<br />
in its market segments.<br />
<strong>TTS</strong> is listed on the Oslo Stock Exchange and<br />
the group’s annual turnover is in the region<br />
of NOK 3 200 million. With a worldwide<br />
work<strong>for</strong>ce of around 1 100, <strong>TTS</strong> has over<br />
40 years of experience in the marine industry.<br />
The group has subsidiaries in Norway, Sweden,<br />
Germany, USA, China, Finland, Korea, Czech<br />
Republic, Vietnam, Canada, Singapore, Italy,<br />
Greece and Brazil.<br />
Marine<br />
• Cruise vessel equipment<br />
• Mooring winches<br />
• Hatch covers<br />
• Anchor handling winches<br />
• Marine cranes<br />
• Davits<br />
• Mega yacht equipment<br />
• Roro equipment<br />
• Sideloading systems<br />
Energy<br />
• Drilling equipment<br />
• Drilling packages<br />
• Land rigs<br />
• Mud systems<br />
• Offshore cranes<br />
• Offshore ships equipment<br />
• Offshore winches<br />
• Roll compensated systems<br />
<strong>TTS</strong> GROUP 3-15<br />
BUSINESS AREAS 16-33<br />
CORPORATE GOVERNANCE 35-43<br />
DIRECTOR’S REPORT AND ACCOUNTS 45-116<br />
ORGANISATION 118-123<br />
Port and Logistics<br />
• Block and heavy load handling<br />
• Cargo handling<br />
• Consulting<br />
• Container terminals<br />
• Port equipment<br />
• Shiplift and transfer systems<br />
• Shipyard production lines<br />
5
3-15 <strong>TTS</strong> GROUP<br />
16-33 BUSINESS AREAS<br />
35-43 CORPORATE GOVERNANCE<br />
45-116 DIRECTOR’S REPORT AND ACCOUNTS<br />
118-123 ORGANISATION<br />
When the company was founded in 1966<br />
<strong>TTS</strong> stood <strong>for</strong> Total Transportation Systems<br />
6<br />
Today, <strong>TTS</strong> is better represented as<br />
Total Technology<br />
Solutions<br />
ESTAbLiShMEnTS<br />
1966 <strong>TTS</strong> is established.<br />
1995 <strong>TTS</strong> is listed on Oslo Stock Exchange.<br />
2002 <strong>TTS</strong> establishes joint venture in Shanghai, China.<br />
2002 <strong>TTS</strong> establishes Rep. Office in Pusan, Korea.<br />
2005 <strong>TTS</strong> establishes <strong>TTS</strong> Bohai in Dalian, China.<br />
2005 <strong>TTS</strong> establishes <strong>TTS</strong> Port Equipment AB, Gothenburg, Sweden.<br />
2005 <strong>TTS</strong> establishes <strong>TTS</strong> Marine Inc. in Florida, USA.<br />
2006 <strong>TTS</strong> establishes <strong>TTS</strong> Marine s.r.l. in Genova, Italy.<br />
2006 <strong>TTS</strong> establishes <strong>TTS</strong> Vietnam, Haiphong, Vietnam.<br />
2007 <strong>TTS</strong> establishes Sense Drill Fab AS, Norway.<br />
2007 <strong>TTS</strong> establishes Sense EDM Pte. Ltd., Singapore.<br />
2008 <strong>TTS</strong> establishes Jiangnan <strong>TTS</strong>, Nantong, China.<br />
2008 <strong>TTS</strong> establishes <strong>TTS</strong> Marine Equipment (Dalian), China.<br />
2009 <strong>TTS</strong> establishes <strong>TTS</strong> Greece Ltd., Greece.<br />
2009 <strong>TTS</strong> establishes <strong>TTS</strong> Singapore Pte. Ltd., Singapore.<br />
2009 <strong>TTS</strong> establishes <strong>TTS</strong> Marine AS, Kristiansand, Norway.<br />
<strong>2010</strong> <strong>TTS</strong> establishes <strong>TTS</strong> Brazil, Brazil.<br />
AcqUiSiTiOnS/SALES<br />
1996 <strong>TTS</strong> acquires Mongstad Engineering AS, Bergen, Norway.<br />
1997 <strong>TTS</strong> acquires Norlift AS, Bergen, Norway.<br />
2000 <strong>TTS</strong> acquires Aktro AS, Molde, Norway.<br />
2001 <strong>TTS</strong> sells <strong>TTS</strong> Construction AS, Bergen, Norway.<br />
2001 <strong>TTS</strong> acquires Hamworthy KSE AB, Dry Cargo Division.<br />
2001 <strong>TTS</strong> acquires Hydralift Marine, and sell <strong>TTS</strong>-Aktro AS.<br />
2004 <strong>TTS</strong> acquires 100 % of joint venture in Shanghai, China.<br />
2004 <strong>TTS</strong> acquires LMG, Lübeck, Germany.<br />
2004 <strong>TTS</strong> acquires Liftec Oy, Tampere, Finland.<br />
2005 <strong>TTS</strong> acquires NavCiv Engineering AB, Gothenburg, Sweden.<br />
2005 <strong>TTS</strong> acquires Kocks GmbH, Bremen, Germany.<br />
2007 <strong>TTS</strong> acquires ICD Projects AS, Ålesund, Norway.<br />
2007 <strong>TTS</strong> acquires 100 % of joint venture in Pusan, Korea.<br />
2007 <strong>TTS</strong> acquires 50 % of <strong>TTS</strong> Keyon Marine, Zhang Jia Gang, China.<br />
2007 <strong>TTS</strong> acquires Sense EDM AS, Kristiansand, Norway.<br />
2007 <strong>TTS</strong> acquires 100 % Sense MUD AS, Kristiansand, Norway.<br />
2008 <strong>TTS</strong> acquires Wellquip Holding AS, Kristiansand, Norway.<br />
<strong>2010</strong> <strong>TTS</strong> sells <strong>TTS</strong> Keyon Marine, Zhang Jia Gang, China.
AnnUAL TURnOvER<br />
The <strong>TTS</strong> <strong>Group</strong>’s turnover showed<br />
a steady growth up to and including<br />
2008, in line with the company’s<br />
entry into new markets and its<br />
strengthening of activities in<br />
established business areas. In 2009<br />
and <strong>2010</strong>, the turnover fell as<br />
a result of the financial crisis and<br />
the subsequent economic downturn.<br />
<strong>TTS</strong>’ total turnover in <strong>2010</strong> was<br />
15 percent lower than in the year<br />
be<strong>for</strong>e. For 2011, it is the group’s<br />
objective again to grow turnover.<br />
MNOK<br />
4500<br />
4000<br />
3500<br />
3000<br />
2500<br />
2000<br />
1500<br />
1000<br />
500<br />
0<br />
OMSETninG<br />
MNOK<br />
96 97 98 99 00 01 02 03 04 05 06 07 08 09 10<br />
Port and Logistics<br />
Marine<br />
Energy<br />
7
3-15 <strong>TTS</strong> GROUP<br />
16-33 BUSINESS AREAS<br />
35-43 CORPORATE GOVERNANCE<br />
45-116 DIRECTOR’S REPORT AND ACCOUNTS<br />
118-123 ORGANISATION<br />
Financial highlights<br />
MARinE DiviSiOn<br />
NOK Million <strong>2010</strong> 2009<br />
Turnover 2 230.0 2 326.0<br />
EBITDA 158.7 93.7<br />
Order backlog per 31.12. 3 204.0 3 414.0<br />
EnERGY DiviSiOn<br />
NOK Million <strong>2010</strong> 2009<br />
Turnover 712.0 1 180.0<br />
EBITDA -168.6 -192.0<br />
Order backlog per 31.12. 690.0 854.0<br />
PORT AnD LOGiSTicS DiviSiOn<br />
NOK Million <strong>2010</strong> 2009<br />
Turnover 299.0 331.0<br />
EBITDA 20.6 19.6<br />
Order backlog per 31.12. 102.0 242.0<br />
8<br />
TURnOvER<br />
<strong>2010</strong><br />
Marine<br />
68.8 %<br />
2009<br />
Marine<br />
60.7 %<br />
ORDER bAckLOG<br />
<strong>2010</strong><br />
Marine<br />
80.2 %<br />
2009<br />
Marine<br />
75.7 %<br />
Energy<br />
22.0 %<br />
P&L<br />
9.2 %<br />
Energy<br />
30.7 %<br />
P&L<br />
8.6 %<br />
Energy<br />
17.3 %<br />
Energy<br />
18.9 %<br />
P&L<br />
2.6 %<br />
P&L<br />
5.4 %<br />
cOnSOLiDATED TURnOvER<br />
NOK Million<br />
1604<br />
cOnSOLiDATED EbiTDA<br />
NOK Million<br />
cOnSOLiDATED<br />
ORDER bAckLOG<br />
NOK Million<br />
2460<br />
4196<br />
3825<br />
3241<br />
2006 2007 2008 2009 <strong>2010</strong><br />
107<br />
168<br />
145<br />
2006 2007 2008 2009 <strong>2010</strong><br />
2273<br />
6949<br />
8159<br />
-84.3<br />
4510<br />
3.7<br />
3996<br />
2006 2007 2008 2009 <strong>2010</strong>
MAin FiGURES<br />
PROFIT AND LOSS ACCOUNT (NOK 1 000)<br />
<strong>2010</strong> 2009 2008 2007 2006<br />
Operating income 3 240 809 3 825 317 4 196 482 2 459 964 1 604 030<br />
Operating profit/loss be<strong>for</strong>e depresiation (EBITDA) 3 712 -84 265 145 459 167 767 107 061<br />
Operating profit/loss (EBIT) -48 267 -230 800 114 616 134 636 98 145<br />
Pre-tax profit/loss -156 103 -311 942 36 819 97 568 84 492<br />
Net profit/loss -196 656 -248 482 36 392 79 041 60 481<br />
BALANCE SHEET (NOK 1 000)<br />
Fixed assets 1 528 039 1 550 755 1 508 802 1 215 577 460 996<br />
Current assets 1 923 959 2 138 720 2 871 919 1 886 377 1 172 135<br />
Total assets 3 451 998 3 689 475 4 380 721 3 101 954 1 633 130<br />
Equity 802 734 935 883 989 056 933 596 598 061<br />
Long-term liabilities 534 638 452 876 532 297 588 878 196 635<br />
Current liabilities 2 114 626 2 300 715 2 825 808 1 579 479 838 434<br />
Total equity and liabilities 3 451 998 3 689 475 4 380 721 3 101 954 1 633 130<br />
kEY RATiOS<br />
FINANCIAL STRENGTH<br />
Equity to assets ratio (as a percentage of total capital) 23.3 % 25.4 % 22.6 % 30.1 % 36.6 %<br />
PROFITABILITy<br />
EBITDA margin 0.1 % -2.2 % 3.5 % 6.8 % 6.7 %<br />
EBIT margin -1.5 % -6.0 % 2.7 % 5.5 % 6.1 %<br />
Profit margin (pre-tax) -4.8 % -8.2 % 0.9 % 4.0 % 5.3 %<br />
Profit margin (after tax) -6.1 % -6.5 % 0.9 % 3.2 % 3.8 %<br />
RATE OF RETURN<br />
Return on equity -18.0 % -33.3 % 3.7 % 10.5 % 14.1 %<br />
Return on total capital -4.4 % -6.3 % 2.6 % 4.3 % 5.5 %<br />
SHARES<br />
Equity per share 10.75 13.78 38.18 36.20 26.59<br />
Earnings per share (NOK) -2.76 -5.72 1.41 3,40 2.92<br />
Number of shares, end of year 74 631 67 908 25 908 25 738 22 493<br />
Average number of shares 71 269 43 408 25 840 23 250 20 832<br />
Nominal value, end of year 0.50 0.50 0.50 0.50 0.50<br />
Defininitions<br />
Earnings per share: Profit after taxes divided on total number of shares at the end of the fiscal year.<br />
Profitability, equity: Profit be<strong>for</strong>e tax as a percentage of average equity.<br />
Profitability, total capital: Operating profit as a percentage of average total capital.<br />
9
3-15 <strong>TTS</strong> GROUP<br />
16-33 BUSINESS AREAS<br />
35-43 CORPORATE GOVERNANCE<br />
45-116 DIRECTOR’S REPORT AND ACCOUNTS<br />
118-123 ORGANISATION<br />
key events <strong>2010</strong><br />
<strong>TTS</strong> <strong>report</strong>ed earnings<br />
be<strong>for</strong>e depreciation<br />
of NOK 4 million, based<br />
on a turnover of NOK<br />
3 241 million. The group<br />
<strong>report</strong>ed a pre-tax loss<br />
of NOK 156.1 million.<br />
10<br />
At the start of 2011,<br />
<strong>TTS</strong> had an order backlog<br />
of NOK 3 996 million.<br />
The order intake in <strong>2010</strong><br />
was NOK 3 291 million,<br />
of which NOK 1 467<br />
million in the fourth<br />
quarter.<br />
In <strong>2010</strong>, <strong>TTS</strong> adjusted its<br />
manning in relation to<br />
the weak demand in vital<br />
markets. At the start<br />
of 2011, the number of<br />
employees in wholly<br />
owned companies<br />
was 1 057, compared to<br />
1 137 the year be<strong>for</strong>e.<br />
<strong>TTS</strong> achieved a satisfactory<br />
level of profitability in<br />
the markets <strong>for</strong> handling<br />
equipment <strong>for</strong> ships and<br />
ports, while earnings<br />
and results from activities<br />
relating to the oil and gas<br />
industry were weak.
<strong>TTS</strong> entered into an agreement<br />
with the Chinese ship building<br />
group, Dalian Shipbuilding Industry<br />
Corporation (DSIC) regarding<br />
strategic cooperation on deliveries<br />
to the offshore industry. Whenever<br />
DSIC enters into new contracts,<br />
<strong>TTS</strong> will contribute with expertise<br />
in design, marketing and delivery<br />
of drilling packages. <strong>TTS</strong> will<br />
furthermore supply equipment <strong>for</strong><br />
four jack-up rigs built by DSIC.<br />
<strong>TTS</strong> established<br />
a sales office in<br />
Macae in Brazil,<br />
to market its<br />
products and<br />
services to the<br />
offshore industry.<br />
<strong>TTS</strong> strengthened the<br />
group’s balance sheet by<br />
carrying out a private<br />
placement that provided<br />
the company with NOK<br />
42 million. Additionally,<br />
<strong>TTS</strong> has taken up a<br />
subordinated convertible<br />
loan of NOK 200 million.<br />
PHOTO: A. MARESCA<br />
<strong>TTS</strong> made an out-of-court<br />
settlement subsequent<br />
to the bankruptcy of<br />
Ability Drilling. <strong>TTS</strong><br />
purchased a land rig<br />
from the bankruptcy<br />
estate <strong>for</strong> NOK 75 million<br />
with sellers credit of up<br />
to two years. All other<br />
claims between the<br />
parties were waived.<br />
11
3-15 <strong>TTS</strong> GROUP<br />
16-33 BUSINESS AREAS<br />
35-43 CORPORATE GOVERNANCE<br />
45-116 DIRECTOR’S REPORT AND ACCOUNTS<br />
118-123 ORGANISATION<br />
PHOTO: HELGE SKODVIN<br />
12<br />
We can conclude that the many challenges affecting<br />
<strong>TTS</strong> as a result of the financial crisis are being resolved,<br />
which in turn means that the organisation may once<br />
again direct its ef<strong>for</strong>ts toward creating growth and<br />
healthy economic results.<br />
jOhAnnES nETELAnD<br />
PRESIDENT & CEO<br />
<strong>TTS</strong> GROUP <strong>ASA</strong>
We are coming back!<br />
T<br />
TS iS An inTERnATiOnAL GROUP that designs and supplies handling<br />
equipment <strong>for</strong> use onboard vessels, in ports and on installations <strong>for</strong> production<br />
of oil and gas. With activities spanning most continents, we are far more<br />
exposed to risk than had we limited our geographical field of activities. At the<br />
same time, a global presence provides us with opportunities that we may not otherwise<br />
have. The market <strong>for</strong> our products is global, and accordingly we must be present<br />
in close proximity to our customers’ operations – providing products and solutions at<br />
a competitive price and quality.<br />
Over the past two years, <strong>TTS</strong>’ owners and employees alike have experienced how<br />
tough it can be to create results. The financial crisis and the subsequent economic<br />
downturn had significant consequences and taught us valuable lessons. When<br />
summing up 2009, we used the expression “annus horribilis”, and our expectations <strong>for</strong><br />
<strong>2010</strong> were level-headed. The financial figures have now been presented, and although<br />
results have taken a positive direction, we must admit that the past year is not one<br />
to be joyously recalled with regard to <strong>TTS</strong>’ bottom line. Still, we have succeeded in<br />
maintaining the expertise in <strong>TTS</strong>, and as such we are well-equipped <strong>for</strong> the return of<br />
the markets <strong>for</strong> our products and services within all three of our business areas.<br />
<strong>2010</strong> was a good year <strong>for</strong> the Marine division, our largest division. Although<br />
the total turnover was somewhat lower than in 2009, there was a high level of activity<br />
throughout most of the year, and the operating margin showed positive development.<br />
The potential <strong>for</strong> further improvement of profitability is predominantly related to an<br />
increase in the sale of services and products in the after sales and service market.<br />
For the Port and Logistics division, <strong>2010</strong> was a year of improved results and<br />
operational margins, despite a lower turnover than the year be<strong>for</strong>e. The Energy division,<br />
however, was marked by a year of little activity and weak margins on orders in<br />
progress, and consequently its operational result were very poor.<br />
When we in spite of an unsatisfactory result <strong>for</strong> the year, we choose to assess<br />
our current situation to be far better than the one we were in at the end of 2009, this<br />
is mainly due to a solid order intake towards the end of <strong>2010</strong>. The order intake close<br />
to NOK 1.5 billion in the fourth quarter was the largest order intake since the third<br />
quarter of 2008, and one of the largest order intakes during one single quarter in the<br />
history of <strong>TTS</strong>.<br />
13
When, in conclusion, we sum up the situation <strong>for</strong> <strong>TTS</strong> as far better than twelve months<br />
ago, this relates to the fact that several factors hampering the group’s operation have<br />
either been removed or are in the process of being solved:<br />
- <strong>TTS</strong>’ dispute with the bankruptcy estate following the bankruptcy of Ability Drilling<br />
was settled out-of-court last autumn. Instead of a presumably prolonged legal<br />
process, the dispute was settled by an agreement in which <strong>TTS</strong> purchased a land<br />
rig from the bankruptcy estate <strong>for</strong> NOK 75 million with a seller’s credit of up to<br />
two years. All other claims between the parties were waived.<br />
- The ef<strong>for</strong>t to dispose of the three land rigs that <strong>TTS</strong> was left with following the<br />
bankruptcy of Ability Drilling is progressing favourably. Selling these rigs is an<br />
important step in order to reduce the group’s balance sheet. In February this year,<br />
one of these rigs was hired out on commercial terms <strong>for</strong> a period of twelve months.<br />
- The group’s capital situation has been strengthened. In July, <strong>TTS</strong> carried out a<br />
14<br />
private placing that provided the company with NOK 42 million. In January 2011,<br />
a subordinated convertible loan of NOK 200 million was issued.<br />
- Ef<strong>for</strong>ts to bring the Energy division into a position <strong>for</strong> new contracts <strong>for</strong> drilling<br />
equipment packages and cranes <strong>for</strong> offshore vessels has proven successful. In<br />
November, <strong>TTS</strong> entered into an agreement with the Chinese ship building group,<br />
Dalian Shipbuilding Industry Corporation (DSIC) – a company that <strong>TTS</strong> is familiar<br />
with through many years’ cooperation in the joint venture <strong>TTS</strong> Bohai Machinery<br />
– regarding strategic cooperation on deliveries to the offshore industry. When<br />
DSIC enters into new contracts, <strong>TTS</strong> will contribute with expertise in design,<br />
marketing, and delivery of drilling packages. Parallell to this, an agreement was<br />
made <strong>for</strong> <strong>TTS</strong> to deliver equipment <strong>for</strong> two jack-up rigs which DSIC will deliver, at<br />
a total value of NOK 460 million. In April 2011 the number of rigs was increased<br />
to four, at a total value of NOK 900 million. At the end of last year, further<br />
contracts were signed regarding deliveries of cranes to the offshore segment at a<br />
total value of NOK 50 million.
With this, we can conclude that the many challenges affecting <strong>TTS</strong> as a result of the<br />
financial crisis are being resolved, which in turn means that the organisation may<br />
once again direct its ef<strong>for</strong>ts toward creating growth and healthy economic results.<br />
The strong growth in order intake at the end of last year has continued into 2011.<br />
Furthermore, we believe that our long-term focus on developing operations in<br />
China continues to be important, and overall we expect about 40 percent of <strong>TTS</strong>’ total<br />
value creation to take place in our Chinese companies. Our expectations of the<br />
cooperation with DSIC in the energy segment are high. We are further convinced that<br />
the experiences which our customers of our first drilling packages will gain when<br />
this equipment is put to use in the coming year will provide us with a marketing<br />
advantage.<br />
As a major player within our markets, <strong>TTS</strong> has had a tradition of playing a role in<br />
restructuring the industry. We will continue to vigilantly seek solutions that will create<br />
value <strong>for</strong> our share holders.<br />
Although there is still uncertainty related to the development of <strong>TTS</strong>’ markets,<br />
2011 promises to be a year of progress within all of <strong>TTS</strong>’ business areas. We will<br />
none theless have to fight <strong>for</strong> each contract in a market with surplus capacity following<br />
several years of ‘drought’. The demand <strong>for</strong> our products and services will depend on<br />
the economic and political development in the world. If the surge of unrest in several<br />
states in the Middle East and North Africa has such consequences as a limiting in the<br />
supply of oil and gas, this will negatively affect the world economy and may reduce<br />
the willingness to invest in new equipment and purchase service and after sales<br />
support.<br />
We must there<strong>for</strong>e be prepared <strong>for</strong> setbacks, and on the whole have level-headed<br />
expectations to our turnover and results in 2011. Having said this, the potential <strong>for</strong><br />
the activities that <strong>TTS</strong> engage in are considerable, and we have a clear ambition of<br />
returning to the levels seen prior to the financial crisis. We are coming back!<br />
Johannes D. Neteland<br />
President & CEO<br />
<strong>TTS</strong> GROUP 3-15<br />
BUSINESS AREAS 16-33<br />
CORPORATE GOVERNANCE 35-43<br />
DIRECTOR’S REPORT AND ACCOUNTS 45-116<br />
ORGANISATION 118-123<br />
15
ivAR k. hAnSOn<br />
DIRECTOR<br />
MARINE DIVISION<br />
Ivar K. Hanson, Director and<br />
head of the Marine division. Until<br />
the new organisation became<br />
operative on 1 January <strong>2010</strong>,<br />
he headed the Marine Cranes<br />
division <strong>for</strong> six years. Hanson<br />
holds a Master of Science in<br />
Business Administration, as<br />
well as a degree in Mechanical<br />
Engineering, and he has worked<br />
with <strong>TTS</strong> <strong>for</strong> a total of 16 years.<br />
16<br />
Marine division<br />
For the Marine division of <strong>TTS</strong>, <strong>2010</strong> was<br />
a prosperous year. The market <strong>for</strong> marine<br />
handling equipment has been brisk, and<br />
by concentrating the group’s activities<br />
in the maritime sector into one division,<br />
<strong>TTS</strong> has been able to achieve synergies<br />
and strengthen its competitive edge.<br />
The activities in the maritime sector make up the largest part<br />
of <strong>TTS</strong>’ operations. At the start of <strong>2010</strong>, it was expected<br />
that the market would recover following a period affected by<br />
the financial crisis and economic downturn. This expectation was<br />
by a long way fulfilled. At the same time, the competitive situation<br />
intensified, owing to a considerable build up of capacity in the<br />
maritime equipment industry over the past years.<br />
– Our response to this challenge has been to concentrate all our<br />
resources within this business area, both to achieve cost synergies<br />
and to appear more uni<strong>for</strong>m and with a higher degree of power<br />
with all our products and solutions, says Ivar K. Hanson, Director<br />
and head of the Marine division.<br />
In <strong>2010</strong>, operation and results within the business area of cargo<br />
access were excellent. Furthermore, the activities related to deck<br />
equipment yielded satisfactory results. The joint venture companies<br />
in China made a particularly positive contribution. In all, the<br />
Chinese companies contributed close to a third of the division’s<br />
added value. Results from the division’s activities within service<br />
and maintenance were somewhat weaker than anticipated. Lower<br />
day rates resulted in reduced demand <strong>for</strong> maintenance.<br />
Operations<br />
Operations in the Marine division are headed from Bergen, Norway,<br />
and have been divided into four business areas: Deck equipment,<br />
comprising deck machinery, hatch covers, cargo cranes and yacht<br />
equipment; Cargo access, comprising RoRo equipment, side loading<br />
systems and equipment <strong>for</strong> cruise ships and mega yachts; Services,<br />
including repairs, maintenance, training and sale of spare parts; and<br />
finally, the joint venture companies in China constitute the division’s<br />
fourth business area.<br />
At the start of 2011, the Marine division had 667 employees,<br />
compared to 681 the year be<strong>for</strong>e, and most of these employees have<br />
an emphasis on engineering skills. The employees are distributed<br />
Turnover<br />
2326<br />
2230<br />
2009 <strong>2010</strong><br />
Order backlog<br />
3414<br />
3204<br />
2009 <strong>2010</strong><br />
EbiDTA<br />
93.7<br />
158.7<br />
2009 <strong>2010</strong>
quarter ramp supplied by <strong>TTS</strong> to the<br />
world´s largest RoRo vessel, Mv Tönsberg,<br />
built at Mitsubishi heavy industries<br />
in nagasaki <strong>for</strong> Wilh. Wilhelmsen.<br />
Delivered in March 2011.<br />
<strong>TTS</strong> GROUP 3-15<br />
bUSinESS AREAS 16-33<br />
CORPORATE GOVERNANCE 35-43<br />
DIRECTOR’S REPORT AND ACCOUNTS 45-116<br />
ORGANISATION 118-123<br />
PHOTO: A. MARESCA<br />
17
18<br />
hatch covers<br />
Stern ramp and<br />
stern door<br />
Wire luffing cranes<br />
geographically, with 118 employees in Norway, 86 in Sweden, 159<br />
in Germany, 37 in the Czech Republic, 6 in Italy, 6 in Greece, 12 in<br />
the USA, 168 in China, 56 in South Korea, 8 in Singapore and 7 in<br />
Vietnam.<br />
In addition to this, the joint venture companies in China have a<br />
total of 153 employees, with 83 employees in <strong>TTS</strong> Bohai Machinery<br />
in Dalian and 70 in <strong>TTS</strong> Hua Hai in Shanghai. <strong>TTS</strong> Hua Hai owns<br />
40 percent of the manufacturing company Jiangnan <strong>TTS</strong> Ships<br />
Equipment, in Nantong, with 720 employees.<br />
In Germany, <strong>TTS</strong> Kocks and <strong>TTS</strong> Ships Equipment in Bremen<br />
merged in <strong>2010</strong>. In the first half of 2011, <strong>TTS</strong> LMG in Lübeck will<br />
<strong>for</strong>mally be incorporated into one German company with employees<br />
in Bremen and Lübeck.<br />
– Through our entire organisation we have a strong focus on<br />
achieving synergies; cost-wise by improving our purchasing routines,<br />
and income-wise by further streamlining the way in which we<br />
market and sell our products and services, says Ivar K. Hanson.<br />
In the autumn of <strong>2010</strong>, the Marine division initiated a cultural<br />
project in collaboration with the Norwegian embassy in Beijing. The<br />
aim of this project is to strengthen and improve cooperation and<br />
interaction between the division’s employees in Europe, primarily<br />
in Sweden, Norway and Germany, and the enterprises in China. The<br />
project is organised as a series of seminars with assistance from<br />
external advisors, with the aim of increasing knowledge and understanding<br />
of each other’s approaches and work methods, including<br />
relevant differences between the various European countries and<br />
different parts of China.<br />
Products<br />
The Marine division supplies design and engineering of equipment<br />
<strong>for</strong> cargo handling and cargo access on vessels, with related functions<br />
within service and maintenance. Product development is<br />
carried out internally in each business unit and across these units.<br />
<strong>TTS</strong> is among the world’s leading suppliers of cargo handling<br />
systems <strong>for</strong> vessels; including side loading systems, RoRo equipment,<br />
hatch covers and specialist equipment <strong>for</strong> yachts and<br />
cruise ships. <strong>TTS</strong> is also one of the world’s major suppliers of hose<br />
handling systems, and holds a strong position in the market <strong>for</strong><br />
provision cranes and cargo cranes. <strong>TTS</strong> is furthermore a significant<br />
supplier of winches and deck machinery.<br />
Our portfolio of products is continuously improved and<br />
re newed, in line with the technological development and customers’<br />
requirements to efficient and functional solutions. Our focus is<br />
pre dominantly on developing our programs in service and after<br />
sales. Historically, this is an area in which <strong>TTS</strong> has had limited<br />
focus, but we are building a service function to meet our customers’
Weather and tween<br />
hatch cover<br />
Deck winches<br />
Ramp cover<br />
<strong>TTS</strong> GROUP 3-15<br />
bUSinESS AREAS 16-33<br />
CORPORATE GOVERNANCE 35-43<br />
DIRECTOR’S REPORT AND ACCOUNTS 45-116<br />
ORGANISATION 118-123<br />
requirements <strong>for</strong> standby guarantees relating to un<strong>for</strong>eseen events<br />
and regular maintenance. Our aim is to provide a solid service<br />
function <strong>for</strong> our customers throughout our products’ service life,<br />
says Ivar K. Hanson.<br />
Market outlook<br />
At the start of 2011, the order backlog of the Marine division was<br />
NOK 3 204 million, compared to NOK 3 414 million the year<br />
be<strong>for</strong>e. These figures include 50 percent of the order backlog of<br />
the joint venture companies <strong>TTS</strong> Hua Hai Ships Equipment Co. Ltd.<br />
and <strong>TTS</strong> Bohai Machinery Co. Ltd. in China.<br />
The weakened order intake is a result of the pronounced decline<br />
in the shipbuilding market until <strong>2010</strong>, and the fact that there is<br />
normally a degree of staging between the date of contracting of new<br />
vessels and orders of new equipment.<br />
– In the first half of <strong>2010</strong>, a large number of bulk carriers and<br />
tankers were contracted at shipyards in South Korea, which together<br />
with a renewed activity in the car carrier market present improved<br />
opportunities <strong>for</strong> <strong>TTS</strong>, says Hanson.<br />
In addition to equipment deliveries <strong>for</strong> RoRo vessels, the market<br />
<strong>for</strong> cruise liners appears to hold opportunities <strong>for</strong> <strong>TTS</strong>. Furthermore,<br />
there is an increase in activity in the niche market <strong>for</strong> mega<br />
yachts, and the same applies to reefers. – We are looking at the<br />
possibility of deliveries to the naval <strong>for</strong>ces of several countries in<br />
connection with the refurbishment of vessels. The tanker and bulk<br />
market, however, remain slow, Hanson maintains.<br />
He adds that the Marine division also supplies specialist equipment<br />
<strong>for</strong> offshore vessels, including deck machinery, special purpose<br />
hatches as well as rescue and emergency equipment.<br />
Strategy<br />
The Marine division has an order situation that ensures full capacity<br />
utilization in 2011, and the main challenge is to sell new projects<br />
with satisfactory margins <strong>for</strong> implementation in 2012 and following<br />
years.<br />
– We must continue our ef<strong>for</strong>ts to develop and market our<br />
expertise as supplier of services. Due to the strong increase in our<br />
volume delivered in recent years, the basis <strong>for</strong> products requiring<br />
service and maintenance will continue to grow. Hence, our opportunities<br />
in this business area are significant, even if the service<br />
market in general remains weak, Hanson points out.<br />
The Marine division will continue its ef<strong>for</strong>ts to achieve cost<br />
synergies on the basis of the Momentum Project (ref. separate article<br />
on page 30-31).<br />
19
inGE GAbRiELSEn<br />
DIRECTOR<br />
ENERGy DIVISION<br />
Inge Gabrielsen is head of<br />
the Energy division, and is<br />
furthermore Director of<br />
<strong>TTS</strong> Energy AS. Gabrielsen<br />
holds a Master of Science<br />
from NTNU, the Norwegian<br />
University of Science and<br />
Technology, and was head<br />
of operations in <strong>for</strong>mer<br />
<strong>TTS</strong> Sense until 2009. He<br />
has previous experience<br />
from Subsea 7 and several<br />
Aker companies.<br />
20<br />
Energy division<br />
The Energy division concluded <strong>2010</strong> by entering<br />
into two major contracts <strong>for</strong> delivery<br />
of complete drilling packages. As a consequence<br />
of strategic co operation agreements<br />
in China, additional two contracts were<br />
signed in April 2011. The demand <strong>for</strong> land<br />
rigs and offshore cranes is expected to rise<br />
in the course of this year.<br />
At the start of <strong>2010</strong>, <strong>TTS</strong> concentrated most of the group’s<br />
activities in the oil and gas industry into the Energy<br />
division. The scope of activities is primarily development<br />
and production of advanced drilling equipment, cranes, winches and<br />
other handling equipment. Following the acquisition of Sense EDM<br />
in 2007, equipment <strong>for</strong> onshore and offshore rigs was incorporated<br />
into <strong>TTS</strong>’ product portfolio. In the same year, <strong>TTS</strong> resumed<br />
supplying offshore cranes. In <strong>2010</strong> <strong>TTS</strong> merged all Energy companies<br />
in Norway into one single company; <strong>TTS</strong> Energy AS, and<br />
by doing so achieved a more defined and efficient operational<br />
structure. Ef<strong>for</strong>ts are focused on achieving both administrative and<br />
operative synergies.<br />
As expected, the market <strong>for</strong> the Energy division’s products<br />
remained weak <strong>for</strong> most of last year. <strong>TTS</strong> has succeeded in maintaining<br />
a high level of expertise in the area, and is well-equipped to<br />
service the market with high-quality products and solutions. In<br />
<strong>2010</strong>, <strong>TTS</strong> delivered a complete drilling equipment package to<br />
Keppel FELS in Singapore. The equipment package constitutes part<br />
of a highly advanced jack-up rig <strong>for</strong> the drilling and production<br />
of oil and gas. Testing of the drilling package is expected to be<br />
completed during the second quarter of this year. In 2009, similar<br />
drilling packages were delivered to a CJ70 jack-up rig currently<br />
under construction at the Jurong Shipyard in Singapore. Testing<br />
of this drilling package will also be completed in the second quarter<br />
of this year. Both rigs have been acquired by rig operators that<br />
have been awarded drilling assignments <strong>for</strong> operating companies in<br />
the North Sea, thus providing <strong>TTS</strong> with valuable references.<br />
In <strong>2010</strong>, <strong>TTS</strong> entered into a contract with PetroVietnam Marine<br />
Shipyard Company regarding a drilling equipment package <strong>for</strong> a<br />
jack-up rig currently under construction at the Vung-Tau shipyard.<br />
The equipment is scheduled <strong>for</strong> delivery in 2011.<br />
In <strong>2010</strong>, <strong>TTS</strong> further signed a strategic cooperation agreement<br />
Turnover<br />
1180<br />
712<br />
2009 <strong>2010</strong><br />
Order backlog<br />
854<br />
690<br />
2009 <strong>2010</strong><br />
EbiDTA<br />
2009 <strong>2010</strong><br />
-192<br />
-169
<strong>TTS</strong> Energy delivers land<br />
rigs based on our internationally<br />
patented rack<br />
& pinion technology.<br />
These rigs are unique<br />
in term of mobilization,<br />
operational weight, speed<br />
of operation as well as<br />
level of automation.<br />
<strong>TTS</strong> GROUP 3-15<br />
bUSinESS AREAS 16-33<br />
CORPORATE GOVERNANCE 35-43<br />
DIRECTOR’S REPORT AND ACCOUNTS 45-116<br />
ORGANISATION 118-123<br />
21
4-11 <strong>TTS</strong> GROUP<br />
12-31 bUSinESS AREAS<br />
32-41 CORPORATE GOVERNANCE<br />
42-111 DIRECTOR’S REPORT AND ACCOUNTS<br />
112-119 ORGANISATION<br />
Offshore Modular Rig where<br />
the rack & pinion principle<br />
results in a more compact<br />
and lighter rig compared<br />
with traditional solutions.<br />
22<br />
with the Chinese shipbuilding group Dalian Shipbuilding Industry<br />
Corporation (DSIC) regarding delivery of drilling equipment to the<br />
offshore industry. Through its Energy division, <strong>TTS</strong> will contribute<br />
with expertise in design, marketing and delivery of drilling packages,<br />
whenever DSIC enters into new contracts <strong>for</strong> the delivery of such<br />
equipment. The collaboration on equipment deliveries to customers<br />
in the offshore market is organised through the joint venture<br />
company that <strong>TTS</strong> owns together with DSIC; <strong>TTS</strong> Bohai Machinery.<br />
<strong>TTS</strong> entered into an agreement with DSIC <strong>for</strong> the delivery of two<br />
drilling equipment packages <strong>for</strong> jack-up rigs, ordered by Prospector<br />
Offshore Drilling. These are scheduled <strong>for</strong> delivery in the fourth<br />
quarter of 2012. Two additional contracts <strong>for</strong> drilling equipment<br />
packages were signed in April 2011. Through its offshore company<br />
DSOC, DSIC holds options <strong>for</strong> the delivery of an additional three<br />
jack-up rigs.<br />
Following its re-entry into the crane market, <strong>TTS</strong> has developed<br />
a range of cranes <strong>for</strong> rigs and offshore vessels, anchor handling<br />
winches and other handling equipment. With its unique technology<br />
<strong>for</strong> active heave compensation, <strong>TTS</strong> has become a significant<br />
supplier of cranes and equipment <strong>for</strong> handling of heavy loads at<br />
great ocean depths. In <strong>2010</strong>, the Energy division delivered its first<br />
250 ton active heave compensated offshore crane.<br />
<strong>2010</strong> was a weak year <strong>for</strong> the Energy division’s company in<br />
Canada. As a result of the low level of activity in the market <strong>for</strong> land<br />
rigs, operations have been focused on the sale of individual components<br />
as well as after sales service.<br />
On the basis of recent years’ deliveries to the oil and gas industry,<br />
<strong>TTS</strong> has obtained a solid foundation <strong>for</strong> providing its service and<br />
after sales. In addition to the sale of spare parts <strong>for</strong> drilling rigs and<br />
cranes, <strong>TTS</strong> has developed a simulator-based training program <strong>for</strong><br />
continuous maintenance. <strong>TTS</strong> has established a 24-hour technical<br />
support <strong>for</strong> service, and the activity in this area is increasing.<br />
In <strong>2010</strong>, <strong>TTS</strong> made an out-of-court settlement with the bankruptcy<br />
estate following the bankruptcy of Ability Drilling. <strong>TTS</strong><br />
committed to purchasing a land rig from the bankruptcy estate<br />
<strong>for</strong> NOK 75 million. Ef<strong>for</strong>ts are focused on disposing of all three<br />
rigs on commercial terms.<br />
Operations<br />
The Energy division comprises all units of the <strong>TTS</strong> <strong>Group</strong> that deliver<br />
equipment to the oil and gas industry. Its main products are drilling<br />
packages, complete land rigs, as well as cranes and winches <strong>for</strong> rigs<br />
and offshore vessels.<br />
The Energy division is managed from Kristiansand in Norway.<br />
Operations are divided into the two business areas Drilling and<br />
Offshore & Subsea, of which the first is managed from Kristiansand<br />
and the latter from Bergen.
At the start of 2011, the Energy division had 316 employees,<br />
compared to 395 the year be<strong>for</strong>e, whereof 264 work in Norway,<br />
38 in Canada, 11 in Singapore, one in China and one in the USA.<br />
Furthermore, a sales office has been established in Macae in Brazil,<br />
with one employee.<br />
Products<br />
The Energy division designs, develops and supplies advanced<br />
equipment <strong>for</strong> onshore and offshore rigs, and <strong>for</strong> vessels serving<br />
the oil and gas industry. The products are divided into the following<br />
main categories; drilling equipment, drilling packages, land rigs, mud<br />
systems, offshore cranes, equipment <strong>for</strong> offshore vessels, offshore<br />
winches and active heave compensated systems. The development<br />
of equipment is carried out in close cooperation with the division’s<br />
customers, based on requirements <strong>for</strong> functionality, productivity,<br />
safety and quality.<br />
– We have developed a virtually complete product portfolio<br />
<strong>for</strong> the high end part of the market <strong>for</strong> drilling equipment. So far,<br />
we have primarily focused on equipment <strong>for</strong> jack-up rigs. However,<br />
we have ambitions of making deliveries to floaters by employing<br />
the heave compensation technology. We have initially developed<br />
concepts <strong>for</strong> semi-floaters, but will eventually be able to provide<br />
solutions <strong>for</strong> drill ships, Inge Gabrielsen says.<br />
Market outlook<br />
At the start of 2011, the order backlog of the Energy division was<br />
NOK 690 million, compared to NOK 854 million the year be<strong>for</strong>e.<br />
Following two years of a low level of activity, the market <strong>for</strong> the<br />
division’s products is once again on an upward trend.<br />
Our challenge is to document our competitive edge as regards<br />
technology and quality in a market marked by two major, well<br />
established suppliers. The development <strong>for</strong> the cooperation in<br />
Gulmar Atlantis is equipped with<br />
a 140 ton Ahc offshore crane from <strong>TTS</strong>.<br />
China will as such be of significant consequence; here <strong>TTS</strong><br />
has an advantage that we will take great care of, emphasises Inge<br />
Gabrielsen.<br />
The market <strong>for</strong> offshore cranes is weak. The demand <strong>for</strong> land rigs<br />
is expected to improve in 2011.<br />
Strategy<br />
For the Energy division, the main focus of 2011 is to capitalise<br />
on the product portfolio which <strong>TTS</strong> has developed; primarily<br />
through more contracts <strong>for</strong> deliveries of offshore cranes and drilling<br />
equipment <strong>for</strong> jack-up rigs.<br />
The basis <strong>for</strong> growth in the drilling equipment market is favourable,<br />
and our ambition is to go from being a small contender to a<br />
major market player in this segment. Our basis <strong>for</strong> this is that,<br />
toward 2015, another 100 jack-up rigs will be constructed worldwide,<br />
providing a favourable potential <strong>for</strong> the sale of our products.<br />
We anticipate that the demand will increase further towards the end<br />
of this year.<br />
In the market <strong>for</strong> offshore cranes, <strong>TTS</strong> will focus on the re-sale of<br />
cranes cancelled during the financial crisis and securing new orders.<br />
– In spite of a weak market <strong>for</strong> land rigs, we are convinced that<br />
the operators will gradually require more rigs. Our strategy will be<br />
to serve the high end market with automated solutions. We will<br />
make use of technology from offshore installations and approach<br />
the segment of the market that requires advanced rigs, Gabrielsen<br />
points out.<br />
The Energy division has established a sales office in Macae in<br />
Brazil, to market the division’s products to shipyards in Brazil and<br />
to offer service functions.<br />
With regard to the service market, the division’s strategy is<br />
to develop the position that <strong>TTS</strong> has built as a supplier with solid<br />
expertise and excellent training programs <strong>for</strong> customers.<br />
23
LEnnART SvEnSSOn<br />
DIRECTOR<br />
PORT AND LOGISTICS DIVISION<br />
Lennart Svensson was appointed<br />
Director of the <strong>for</strong>mer Port and<br />
Material Handling division in 2008,<br />
and continued as head of the<br />
new division, following last year’s<br />
restructuring. Svensson holds a<br />
degree in Mechanical Engineering,<br />
and has <strong>for</strong> most of his career been<br />
involved in marine cargo handling.<br />
He was previously Marketing Director<br />
of <strong>TTS</strong> Ships Equipment AB, and<br />
has been Managing Director of<br />
<strong>TTS</strong> Port Equipment AB since its<br />
establishment in 2005.<br />
24<br />
Port and Logistics division<br />
The Port and Logistics division is wellequipped<br />
to handle a growing market <strong>for</strong><br />
equipment <strong>for</strong> ports, and as an example is<br />
prequalified to participate in competitive<br />
tendering <strong>for</strong> deliveries to Rotterdam’s new<br />
container terminal. The market <strong>for</strong> lifting<br />
and transport equipment to the industry<br />
is recovering. Accordingly, the division has<br />
high expectations to operation and results<br />
in 2011.<br />
Since 2005, <strong>TTS</strong> has developed products and services <strong>for</strong> the<br />
handling of cargo in ports. Together with the traditional<br />
activities within material handling, this has become a significant<br />
business area <strong>for</strong> the group. The Port and Logistics organisation<br />
has in <strong>2010</strong> been strengthened to enhance interaction between<br />
the units in Sweden, Norway and Finland. The division has its<br />
own function <strong>for</strong> marketing and administrative services, ensuring<br />
efficient operation and proximity to customers at all stages.<br />
The Port and Logistics division products and customers make<br />
its operations less exposed to fluctuations in the market than<br />
<strong>TTS</strong>’ other divisions. Thus, turnover and results in 2009 and <strong>2010</strong><br />
have on the whole been acceptable, even though profitability<br />
between the three units of the division has varied. In <strong>2010</strong>, the<br />
division’s most prosperous operations were the ones involving<br />
development and manufacturing of port equipment.<br />
The division is managed from Gothenburg. As a result of the<br />
restructuring of <strong>TTS</strong> at the start of <strong>2010</strong>, several joint administrative<br />
functions were established to make the division less dependent on<br />
resources from other divisions and from the group administration.<br />
Operations<br />
At the start of 2011, the Port and Logistics division had 67 employees,<br />
compared to 61 the year be<strong>for</strong>e. The employees are distributed<br />
geographically; with 22 employees based in Sweden, 17 in Norway<br />
and 28 in Finland. In Sweden, the staff was increased by five<br />
employees in <strong>2010</strong>, while minor adjustments were made elsewhere.<br />
Most of the division’s employees have an emphasis on engineering<br />
skills. In Sweden, the expertise is focused on developing equipment<br />
<strong>for</strong> efficient cargo handling in ports, while in Norway it is<br />
Turnover<br />
331<br />
299<br />
2009 <strong>2010</strong><br />
Order backlog<br />
242<br />
102<br />
2009 <strong>2010</strong><br />
EbiDTA<br />
19.6<br />
20.6<br />
2009 <strong>2010</strong>
Upper deck Linkspan,<br />
Port of Gothenburg.<br />
<strong>TTS</strong> GROUP 3-15<br />
bUSinESS AREAS 16-33<br />
CORPORATE GOVERNANCE 35-43<br />
DIRECTOR’S REPORT AND ACCOUNTS 45-116<br />
ORGANISATION 118-123<br />
25
26<br />
Two tier Linkspan in<br />
hoek van holland.<br />
Transfer system from<br />
<strong>TTS</strong> handling System.<br />
Upper deck Linkspan <strong>for</strong><br />
harwich international<br />
Port, England, Uk.<br />
focused on production lines and equipment <strong>for</strong> heavy load handling<br />
in shipyards and other industries. In Finland, specialisation is on<br />
systems and vehicles <strong>for</strong> the transport of containers and loading<br />
cassettes.<br />
– A review of <strong>2010</strong> indicates that this is probably the most hectic<br />
year since <strong>TTS</strong> made equipment <strong>for</strong> cargo handling an area of focus.<br />
The level of activity was particularly high in the Gothenburg-based<br />
company per<strong>for</strong>ming the installation of a number of linkspans<br />
(special ramps linking ship to shore), passenger gangways and other<br />
terminal equipment, says Lennart Svensson.<br />
In <strong>2010</strong>, <strong>TTS</strong> delivered port equipment to Stena Line and to ports<br />
in Germany, England, Denmark and Sweden. Last year, <strong>TTS</strong> Port<br />
Equipment was approved as one of three potential suppliers <strong>for</strong> a<br />
fully automated transport system <strong>for</strong> Rotterdam’s new container<br />
terminal. An announcement on the choice of system and supplier<br />
is expected during the autumn of 2011.<br />
–We have made considerable investments in the development of<br />
a system <strong>for</strong> automatic container handling, and should <strong>TTS</strong> be<br />
chosen as preferred supplier, this would constitute a major project<br />
<strong>for</strong> the division over the next few years. There will be two-three<br />
other major port terminal projects, with a focus on automation of<br />
manual systems, maintains Svensson.<br />
Not all areas within the division kept up the same level of activity<br />
in <strong>2010</strong>. As a consequence of the financial crisis, the market <strong>for</strong><br />
our operations in Finland has been weak <strong>for</strong> the past two years. A<br />
weak order intake resulted in a temporary reduction in manning in<br />
the first half of <strong>2010</strong>. After the summer holidays, there has been an<br />
increase in the demand <strong>for</strong> cassette loadings systems and translifters<br />
<strong>for</strong> customers in shipping and other industries.<br />
The market <strong>for</strong> equipment <strong>for</strong> heavy load handling and production<br />
lines to the industry was expected to be weak in <strong>2010</strong>. In Norway,<br />
the focus was there<strong>for</strong>e on deliveries of lifting equipment to repair<br />
yards. <strong>TTS</strong> collaborates with another technology company relating<br />
to the development of a separate system <strong>for</strong> the lifting of ships, and<br />
has commenced marketing of this system. In collaboration with<br />
wind power producers, a considerable ef<strong>for</strong>t has been made to<br />
develop heavy lift and logistics solutions <strong>for</strong> the transport and<br />
installations of offshore wind turbines and wind power plants.<br />
Products<br />
<strong>TTS</strong> has an extensive product portfolio <strong>for</strong> cargo handling in ports.<br />
In addition to linkspan and passenger gangways, this further comprises<br />
automatic mooring devices and systems <strong>for</strong> handling containers<br />
and cassettes. The cassettes are further suited <strong>for</strong> special<br />
transport requirements related to production, e.g. in the steel and<br />
paper industries. Additionally, <strong>TTS</strong> has developed a complete AGV<br />
system (Automated Guided Vehicles) <strong>for</strong> the handling of containers<br />
in container terminals.<br />
Through is activities in Norway, <strong>TTS</strong> has <strong>for</strong> a number of years<br />
been a supplier of production lines to shipyards and of systems and<br />
solutions dealing with heavy load handling, both in shipyards and<br />
other industries.<br />
In recent years, <strong>TTS</strong> has invested development resources on<br />
heavy lift and logistics solutions in connection with establishment<br />
and installation of onshore and offshore wind power plants. The
demand <strong>for</strong> such systems is growing as a result of the steadily<br />
increasing size of the wind turbines. <strong>TTS</strong> has considerable knowhow<br />
with regard to heavy lifts, and uses this to develop solutions<br />
that ensure a safe and efficient transport of installations with a<br />
height up to 90 meters.<br />
Market outlook<br />
At the start of 2011, the order backlog of the Port and Logistics<br />
division was NOK 102 million, compared to NOK 242 million the<br />
year be<strong>for</strong>e.<br />
– We have prepared <strong>for</strong> a slight growth in turnover and results<br />
in 2011 compared to last year, despite the fact that parts of our<br />
markets are experiencing surplus capacity and price pressure,<br />
maintains Svensson.<br />
The Port and Logistics division delivers the majority of its<br />
products and services to customers in Europe, but it also has<br />
deliveries to countries in Asia. In <strong>2010</strong>, the division entered into<br />
contracts <strong>for</strong> linkspans to Australia and New Zealand.<br />
The division will continue to focus on the marketing of linkspan<br />
and passenger gangways towards port authorities and commercial<br />
players in Northern Europe and Great Britain. The market <strong>for</strong><br />
heavy lift equipment to repair yards in Europe and Asia is considered<br />
to be significant. Furthermore, the Port and Logistics division<br />
considers Brazil to be an interesting market <strong>for</strong> heavy lift equip-<br />
ment and production lines, provided that plans <strong>for</strong> the establishment<br />
of new shipyards in Brazil are carried through.<br />
Strategy<br />
In 2011, the Port and Logistics division will focus on achieving even<br />
more synergies between its units with regard to marketing of<br />
products and services. The organising of <strong>TTS</strong> entails that each<br />
division is fully responsible <strong>for</strong> operation and economy, which Port<br />
and Logistics as the smallest division has adjusted to.<br />
– At a higher level, we are concerned with the fact that we,<br />
through our deliveries, contribute to ensuring the requirement <strong>for</strong><br />
efficiency through the greatest possible use of automated systems,<br />
and that environmental considerations are safeguarded through the<br />
use of electricity as a principal energy source, says Svensson.<br />
He maintains that the division to a higher degree wishes to be<br />
seen as a system supplier rather than a product supplier. – We will<br />
focus intensely on developing and strengthening our position as<br />
supplier of systems <strong>for</strong> cargo handling in container terminals.<br />
The division bases itself on the fact that the increase in world<br />
trade over time will compel new and automated solutions <strong>for</strong> cargo<br />
handling in ports. – In this perspective, our challenge is to maintain<br />
and develop our expertise through participation in specific projects.<br />
Hence, we must continue to focus on product development and<br />
sales, emphasises Lennart Svensson.<br />
27
3-15 <strong>TTS</strong> GROUP<br />
16-33 bUSinESS AREAS<br />
35-43 CORPORATE GOVERNANCE<br />
45-116 DIRECTOR’S REPORT AND ACCOUNTS<br />
118-123 ORGANISATION<br />
New phase in our Chinese venture<br />
<strong>TTS</strong> has a long tradition of collaboration and operations in China. Presently, we are about to<br />
initiate a new phase in our Chinese venture. We hope that it will be as eventful and promising<br />
as the cooperation on development and production of maritime equipment.<br />
Last autumn, <strong>TTS</strong> entered into an agreement with the<br />
Chinese shipbuilding group Dalian Shipbuilding Industry<br />
Corporation (DSIC) regarding strategic cooperation on<br />
delivery of drilling equipment to the rig market. When DSIC enters<br />
into new contracts, <strong>TTS</strong> will contribute with expertise in design,<br />
marketing and delivery of drilling packages through its Energy<br />
division.<br />
28<br />
– Chinese shipyards aim to become leading suppliers to the<br />
offshore industry and this agreement offers <strong>TTS</strong> a great oppor tunity<br />
to strengthen our position in this market, says Johannes D.<br />
Neteland, President and CEO of the <strong>TTS</strong> <strong>Group</strong>.<br />
Two-dimensional cooperation<br />
Cooperation in China within the field of energy has two dimen sions.<br />
With respect to DSIC, the agreements entails that <strong>TTS</strong> is to be DSIC’s<br />
preferred partner and supplier of drilling equipment when ever<br />
the shipbuilding group takes on assignments <strong>for</strong> customers in the<br />
rig market. With regard to <strong>TTS</strong> Bohai Machinery, the cooperation<br />
means that the joint venture company establishes a separate<br />
offshore organisation <strong>for</strong> production of drilling equipment and<br />
offshore cranes to sell these to Chinese yards.<br />
Making the most of each others advantages<br />
<strong>TTS</strong> Bohai Machinery is well established in Dalian, with 83 employees<br />
and operations within engineering, production and sale of marine<br />
cranes to shipyards in China. Within this niche, the company has<br />
taken a market share of just under 25 percent. Now that <strong>TTS</strong> Bohai<br />
Machinery is entering the rig market, the company will enter into<br />
agreements with subcontractors regarding the construction of<br />
drilling equipment, and will handle its own production and assembly.<br />
A steering committee with representatives from <strong>TTS</strong> Energy and<br />
<strong>TTS</strong> Bohai Machinery shall be responsible <strong>for</strong> further developing<br />
this cooperation.<br />
– The basis <strong>for</strong> this cooperation is that <strong>TTS</strong> Energy in Norway<br />
develops products and solutions, while production and assembly<br />
takes place in China. Thus, the parties competitive advantages are<br />
utilised <strong>for</strong> our common good, says Inge Gabrielsen, Director of<br />
<strong>TTS</strong>’ Energy division.<br />
<strong>TTS</strong> Bohai Machinery already supplies cranes to the offshore<br />
market, and further plans to offer winches and other lifting equip-<br />
ment to AHTS vessels and subsea vessels. Adding drilling equipment<br />
to the productrange will strengthen the company’s profile as offshore<br />
supplier.<br />
conducive to quality control<br />
DSIC has set aside large areas <strong>for</strong> use as premises and facilities <strong>for</strong><br />
the production of equipment to this market. The Energy division<br />
will be represented by two-three engineers to ensure quality control<br />
and documentation in connection with the establishment of an<br />
organisation and the construction of premises. The Chinese must<br />
follow international standards of quality, and our main task is to<br />
continuously revise developments and projects according to these<br />
standards.<br />
DSIC has already constructed 11 jack-up rigs and has contracts<br />
<strong>for</strong> the delivery of six more rigs. Four of these will be delivered to<br />
Prospector Offshore Drilling in the fourth quarter of 2012 and in<br />
2013, with advanced drilling equipment packages from <strong>TTS</strong> Energy.<br />
Taking a firm position<br />
– These contracts entail the recognition that <strong>TTS</strong> as a supplier is<br />
considered equal to the two major players in the industry and to other<br />
makers of drilling equipment. Provided that we maintain our competitive<br />
edge with regard to price and quality, this cooperation<br />
provides us plenty of opportunity to build up a portfolio that will<br />
make <strong>TTS</strong> the third alternative in this segment, emphasises Gabrielsen.<br />
He points out that <strong>TTS</strong>’ history as a supplier of complete drilling<br />
packages is short. The initial contract <strong>for</strong> such a delivery was<br />
entered into with Jurong Shipyard in Singapore in June 2007.<br />
– It has been an demanding journey, however, we are about to<br />
take up a position which in both technical terms and business terms<br />
entails great opportunities.<br />
Strengthening our service function<br />
Gabrielsen maintains that by building a portfolio of rigs with <strong>TTS</strong><br />
drilling equipment, one opens a market <strong>for</strong> service and after sales<br />
support. – In order to service rigs operating in Asian waters, we are<br />
currently establishing a service hub consisting of our employees in<br />
Singapore and our new representative in Shanghai. There are further<br />
plans of a service station in Dubai. Thus, <strong>TTS</strong> will be seen to have a<br />
competitive edge as regards both expertise and availability.
DSic has already constructed 11 jack-up rigs and has contracts <strong>for</strong><br />
the delivery of six more rigs. Four of these will be delivered to<br />
Prospector Offshore Drilling in the fourth quarter of 2012 and in<br />
2013, with advanced drilling equipment packages from <strong>TTS</strong> Energy.<br />
29
3-15 <strong>TTS</strong> GROUP<br />
16-33 bUSinESS AREAS<br />
35-43 CORPORATE GOVERNANCE<br />
45-116 DIRECTOR’S REPORT AND ACCOUNTS<br />
118-123 ORGANISATION<br />
Progress to continue<br />
with “Momentum”<br />
The Marine division is enjoying helthy growth. However, no matter how good something<br />
is it can always be improved. Hence, internal processes and routines are under critical<br />
scrutiny in order to improve <strong>TTS</strong>’ competitive edge and profitability. As a project,<br />
“Momentum” will contribute to our continued improvement.<br />
” Momentum” is the name of a project to cover three<br />
business-critical areas; work processes, product<br />
development and strategic purchasing. The Business<br />
Process Reengineering Project deals with professionalising the<br />
way in which work is per<strong>for</strong>med, in order to make our organi sation<br />
more efficient and increase productivity.<br />
improved work processes<br />
The most important parameters of any enterprise are its human<br />
capital and the business processes. We have technically skilled<br />
employees in the Marine division, yet we know that the organisation<br />
of and execution of projects can be carried out in a more<br />
efficient manner. As an example, we should have systems <strong>for</strong><br />
a common database, enabling engineers in various countries to<br />
work on the same project more ef<strong>for</strong>tlessly. The same applies<br />
to the way in which we present our tenders. It is essential that<br />
we set certain standards and are disciplined in applying these,<br />
says Ivar K. Hanson, Director and head of the Marine division.<br />
Our approach to these challenges has been to bring out<br />
examples of best practise in our organisation, and <strong>for</strong>m strategies<br />
<strong>for</strong> putting this practice into effect throughout the rest of<br />
the organisation.<br />
– We have identified best practice in the Marine division at<br />
the business unit Cargo Access in Gothenburg, and we have<br />
agreed to define and introduce these processes as work procedures<br />
<strong>for</strong> the entire division in the present year. Parallel to this,<br />
we are introducing the Balanced Scorecard to measure key<br />
per<strong>for</strong>mance indicators, continues Hanson.<br />
Offering improved products<br />
The main aim of the product development project is to further<br />
develop and optimise the product portfolio <strong>for</strong> cargo cranes, deck<br />
machinery and hatch covers.<br />
– During the spring of 2011, we will have in place a product<br />
30<br />
portfolio in these areas that will improve our competitive edge<br />
significantly. Product development is also about improving the<br />
purchasing of components.<br />
– Removing two out of three suppliers leaves us with a choice<br />
of suppliers that will reduce the overall cost in the supply chain.<br />
By grouping our purchases in component families, it is easier<br />
to obtain favourable prices, the director of the Marine division<br />
points out.<br />
Trimming suppliers<br />
The project <strong>for</strong> strategic purchasing involves both the standardisation<br />
of technical components in products and the improvement<br />
of processes by purchasing such components. The project group<br />
is assisted by external consultants.<br />
– In the course of 2011, we will arrive at cross-divisional<br />
standard solutions involving a reduction in the number of com-<br />
ponent and choice of supplier. In principle, our purchases shall<br />
be made as close to the customer as possible, as long as this<br />
does not compromise our high standard of quality. At the same<br />
time, purchases shall be improved through routines that group<br />
volumes at the lowest possible prices.<br />
Ivar K. Hanson emphasises that all units in the division are<br />
taking part in “Momentum”, including the joint ventures in<br />
China. These companies are, to an increasingly greater degree,<br />
becoming integrated in operations and development.<br />
– The “Momentum” project will enable us to guard market<br />
shares and provide the foundation <strong>for</strong> even better earnings once<br />
the market starts to gain momentum, concludes the divisional<br />
director.
Ahc kran under testing på<br />
<strong>TTS</strong> Marine Shanghai<br />
PHOTO: HELGE SKODVIN<br />
The business Process Reengineering Project deals<br />
with professionalising the way in which work is<br />
per<strong>for</strong>med, in order to make our organi sation more<br />
efficient and increase productivity<br />
31
3-15 <strong>TTS</strong> GROUP<br />
16-33 bUSinESS AREAS<br />
35-43 CORPORATE GOVERNANCE<br />
45-116 DIRECTOR’S REPORT AND ACCOUNTS<br />
118-123 ORGANISATION<br />
Extensive upgrading of port<br />
using <strong>TTS</strong> equipment<br />
Through its Port and Logistics division, <strong>TTS</strong> is involved in a large-scale modernisation<br />
of port facilities in a number of ports in Northern Europe. Stena Line’s new Superferries<br />
underlines the demand <strong>for</strong> more efficient and com<strong>for</strong>table flow of traffic.<br />
in recent years, Stena Line has invested large sums in new<br />
ships <strong>for</strong> the ferry service in the Baltic Sea and the North Sea.<br />
The shipping company has built two Superferries; Hollandica<br />
and Britannica, which at 240 meters in length are the largest<br />
Superferries in the world able to carry both passengers and freight.<br />
The investments have been based on a clear strategy <strong>for</strong> efficient<br />
cargo handling and expansion of Stena Line’s ferry terminals in<br />
Harwich and Hoek van Holland. Furthermore, substantial upgrades<br />
have been completed in the port facilities that Stena Line makes<br />
use of in Loch Ryan in Scotland, in Belfast, Gothenburg, Karlskrona,<br />
Gdynia and Kiel.<br />
– Stena Line has chosen <strong>TTS</strong> as business partner <strong>for</strong> these<br />
assignments, based on our expertise and experience with similar<br />
projects. We have been responsible <strong>for</strong> conducting exploratory<br />
analysis and concept development in each individual case, says<br />
Lennart Svensson, Director of the Port and Logistics division. The<br />
final deliveries <strong>for</strong> Stena Line were completed last autumn.<br />
improving traffic flow<br />
<strong>TTS</strong> has delivered double-tier linkspans, which are bridges linking<br />
ship and shore, with two transport corridors in and out of the<br />
vessel from the upper and lower deck. This ensures an optimum<br />
flow of traffic in and out of the ferries. Installations have been<br />
carried out with minimal disruption to the regular ferry schedule.<br />
32<br />
– Our transport of goods and passengers has continued without<br />
delays. The installations and the work executed on the quayside<br />
were carried out in a very satisfactory manner, says Pim de Lange,<br />
Area Director in Stena Line.<br />
Automatic mooring system<br />
Furthermore, <strong>TTS</strong> has delivered a new automatic mooring system<br />
and passenger gangway to Stena Line’s ferry terminal in Gothenburg.<br />
At the same terminal, <strong>TTS</strong> has designed an advanced gangway,<br />
connecting the vessel to a new floor on top of the existing terminal<br />
building.<br />
In Karlskrona, <strong>TTS</strong> has upgraded an existing linkspan <strong>for</strong> the<br />
ferries servicing the Karlskrona-Gdynia route, and installed a new<br />
passenger gangway. An analysis has been made of the need <strong>for</strong><br />
adjustments to the equipment in the ferry terminal in Gdynia.<br />
Large linkspans in major port<br />
Stena Line has established a route in the Irish Sea between the<br />
Port of Belfast in Northern Ireland and the Port of Stranraer in<br />
Scotland. Stena Line’s terminals in these ports have undergone a<br />
reconstruction according to <strong>TTS</strong> engineering, and both ports have<br />
taken delivery of new passenger gangways.<br />
In addition, the Port and Logistics division are responsible <strong>for</strong><br />
a new automatic mooring system to the contracting firm Skanska<br />
in the Copenhagen-Malmø Port. <strong>TTS</strong> has delivered four large linkspans<br />
with upper and lower decks, and final tests were completed<br />
in January this year with highly satisfactory results.<br />
continued focus on major market<br />
On the basis of the group’s many years of presence in China, <strong>TTS</strong><br />
has entered into collaboration with suppliers that manufacture<br />
port equipment.<br />
The market <strong>for</strong> efficient and environmentally sound solutions<br />
<strong>for</strong> the infrastructure in ports is substantial. In just a few years,<br />
<strong>TTS</strong> has built up a considerable portfolio of terminal projects,<br />
giving us a solid foundation <strong>for</strong> the sale of new and profitable<br />
assignments, emphasises Lennart Svensson.
PHOTO: MIKE LOUAGIE<br />
Belfast<br />
Loch Ryan<br />
Harwich<br />
Hoek van Holland<br />
Kiel<br />
CMPort<br />
Göteborg<br />
Karlskrona<br />
Upper deck Linkspan in harwich <strong>for</strong> the world’s<br />
largest RoPax ferries, Stena Superferries.<br />
33<br />
Gdynia
Shareholder in<strong>for</strong>mation<br />
ShARE PRicE PERFORMAncE<br />
In March 1995, <strong>TTS</strong> Marine <strong>ASA</strong> completed a public<br />
share issue, and 3 May 1995, the company was<br />
listed on the SMB list of the Oslo Stock Exchange.<br />
Date<br />
Subscription price<br />
Price<br />
at time of offering NOK 23.00<br />
Opening price 03.05.95 NOK 26.50<br />
31.12.95 NOK 25.24<br />
31.12.96 NOK 29.26<br />
31.12.97 NOK 29.26<br />
31.12.98 NOK 10.97<br />
31.12.99 NOK 10.24<br />
31.12.00 NOK 17.92<br />
31.12.01 NOK 12.44<br />
31.12.02 NOK 5.67<br />
31.12.03 NOK 7.56<br />
31.12.04 NOK 14.13<br />
31.12.05 NOK 23.43<br />
31.12.06 NOK 52.9<br />
31.12.07 NOK 73.32<br />
31.12.08 NOK 12.47<br />
31.12.09 NOK 5.70<br />
31.12.10 NOK 7,60<br />
The share price has been adjusted to reflect<br />
the 1:2 share split in April 1996.<br />
TRADE in <strong>TTS</strong> ShARE<br />
01.01.10 30.03.11<br />
Number of shareholders 1 806 1 589<br />
Foreign holdings 12,97 % 18,17 %<br />
01.01.10 – Average per<br />
30.03.11 trading day<br />
Number of trades 6 423 21<br />
Value (NOK 1000) 185 249 59<br />
Number of shares (1000) 28 189 90,4<br />
Average price 6,57<br />
inFORMATiOn<br />
<strong>TTS</strong> emphasizes the importance of giving the shareholders,<br />
the stock market and the general public the<br />
best possible knowledge of the <strong>Group</strong>’s operations<br />
and per<strong>for</strong>mance. Relevant in<strong>for</strong>mation will be<br />
made available through stock market <strong>report</strong>s and<br />
press releases. Regular financial <strong>report</strong>s are issued<br />
in the <strong>for</strong>m of annual <strong>report</strong>s and quarterly interim<br />
<strong>report</strong>s. The company is also in constant contact<br />
with financial analysts.<br />
The company’s financial calendar is as follows:<br />
4. quarter <strong>2010</strong>/preliminary<br />
annual result <strong>2010</strong> 24 february<br />
1. quarter 2011 12 May<br />
2. quarter 2011 17 August<br />
3. quarter 2011 10 November<br />
Annual general meeting 19 May<br />
1000<br />
800<br />
600<br />
400<br />
200<br />
0<br />
30.03.10<br />
MOvEMEnT in ShARE cAPiTAL, RiSk ADjUSTMEnT<br />
<strong>TTS</strong> GROUP 3-15<br />
BUSINESS AREAS 16-33<br />
cORPORATE GOvERnAncE 35-43<br />
DIRECTOR’S REPORT AND ACCOUNTS 45-116<br />
ORGANISATION 118-123<br />
Date Type of Share capital Number Nominal<br />
value transaction after transaction shares in NOK<br />
03.05.95 Public offering 1 911 000 1 911 000 1.00<br />
19.04.96 Share split 1 911 000 3 822 000 0.50<br />
20.05.96 Privat placing 2 101 000 4 202 000 0.50<br />
10.12.96 Privat placing 2 146 130 4 292 260 0.50<br />
10.01.97 Privat placing 2 223 879 4 447 758 0.50<br />
16.01.97 Privat placing 2 348 149 4 696 298 0.50<br />
23.04.97 Privat placing 2 578 149 5 146 298 0.50<br />
26.05.98 Privat placing 2 680 649 5 361 298 0.50<br />
04.10.99 Privat placing 2 930 649 5 861 298 0.50<br />
17.04 00 Privat placing 3 220 649 6 441 298 0.50<br />
26.04.00 Privat placing 3 436 681 6 873 362 0.50<br />
10.05.01 Privat placing 3 494 181 6 988 362 0.50<br />
18.01.02 Privat placing 3 851 323.5 7 702 647 0.50<br />
28.02.02 Privat placing 7 422 752 14 845 504 0.50<br />
15.10.04 Privat placing 8 157 552 16 315 104 0.50<br />
14.02.05 Privat placing 8 857 552 17 715 104 0.50<br />
22.02.05 Privat placing 8 970 552 17 941 104 0.50<br />
31.03.05 Privat placing 9 026 802 18 053 604 0.50<br />
04.07.05 Privat placing 9 101 802 18 203 604 0.50<br />
12.09.05 Privat placing 10 001 802 20 003 604 0.50<br />
30.09.05 Privat placing 10 058 052 20 116 104 0.50<br />
30.05.06 Privat placing 10 133 052 20 266 104 0.50<br />
11.09.06 Privat placing 10 226 802 20 453 604 0.50<br />
12.12.06 Privat placing 11 246 452 22 492 904 0.50<br />
25.05.07 Privat placing 11 624 838.5 23 249 677 0.50<br />
29.05.07 Privat placing 11 681 088.5 23 362 177 0.50<br />
19.11.07 Privat placing 12 781 088.5 25 562 177 0.50<br />
21.12.07 Privat placing 12 869 139.5 25 738 279 0.50<br />
28.05.08 Privat placing 12 954 139.5 25 908 279 0.50<br />
30.07.09 Rights issue 33 954 139.5 67 908 279 0.50<br />
13.07.10 Privat placing 37 315 599.5 74 631 199 0,50<br />
<strong>TTS</strong> ShARE vALUE <strong>2010</strong>-2011<br />
30.04.10<br />
30.05.10<br />
30.06.10<br />
30.07.10<br />
30.08.10<br />
30.09.10<br />
30.10.10<br />
30.11.10<br />
30.12.10<br />
30.01.11<br />
30.02.11<br />
30.03.11<br />
NOK<br />
10<br />
8<br />
6<br />
4<br />
2<br />
0<br />
35
corporate governance<br />
<strong>TTS</strong> <strong>Group</strong> <strong>ASA</strong> (<strong>TTS</strong>) applies the Norwegian code of practice <strong>for</strong><br />
corporate governance, dated 21 October <strong>2010</strong>, as guidelines <strong>for</strong> its<br />
work. The following principles <strong>for</strong> corporate governance have been<br />
adopted by the Board of <strong>TTS</strong> <strong>Group</strong> <strong>ASA</strong>.<br />
1. Review of corporate governance<br />
The intent of <strong>TTS</strong>’ principles of corporate governance is to clarify the<br />
roles of the shareholders, the Board of Directors and management<br />
beyond what follows from legislation. These principles constitute part<br />
of the company’s annual <strong>report</strong>. “The Spirit of <strong>TTS</strong>” is available on the<br />
company’s website, www.ttsgroup.com and describes 1) Vision and<br />
Strategy 2) Corporate Culture and Core Values 3) Management and<br />
4) Ethical Guidelines.<br />
As a global group with companies in 14 countries, there is a continuous<br />
focus on our core values and corporate culture. Through a<br />
process involving all companies and divisions, we have evaluated and<br />
established our core values; which are integrity, openness, loyalty and<br />
initiative. Our core values shall influence <strong>TTS</strong>’ activities, in order that<br />
they contribute to cooperation and progress <strong>for</strong> each and everyone in<br />
the group.<br />
Through clearly defined core values <strong>TTS</strong> wishes to contribute to<br />
develop ment of the societies in countries where it is present. Much<br />
of <strong>TTS</strong> operations is based on trade across borders and culture. <strong>TTS</strong><br />
takes s ocial responsibility through developing increased understanding<br />
of cultural differences and in this way increased tolerance. <strong>TTS</strong> has<br />
in cooperation with external expertise held seminars to enhance<br />
under standing of cultural differences. <strong>TTS</strong> has also sponsored Chinese<br />
cultural activities in Norway.<br />
2. business<br />
<strong>TTS</strong> <strong>Group</strong> <strong>ASA</strong>’s Articles of Association are available on the company’s<br />
website.<br />
Article 3 defines the company’s purpose: The company’s purpose is<br />
to engage in industrial activities related to ship building, oil and gas<br />
production, and port activities, including any related activities, as well<br />
as participation in or acquisition of other enterprises.<br />
The group’s goals and main strategies are described on the group’s<br />
website; www.ttsgroup.com.<br />
3. Equity and dividends<br />
EQUITy<br />
Total balance at 31 December <strong>2010</strong> was 3 452 MNOK, with an equity<br />
capital of NOK 803 million, giving an equity-to-assets ratio of 23.3 %.<br />
The company’s solidity requirement is continuously assessed on the<br />
basis of the company’s goals, strategies and risk profile. In January<br />
2011 the company issued a subordinated convertible bond loan of<br />
200 MNOK. In addition the company renegotiated terms on bank and<br />
bond loan to include the convertible loan as part of the covenants<br />
from 31. December <strong>2010</strong>.<br />
<strong>TTS</strong> covenants on bank loans are minimum equity of 800 MNOK<br />
and more than 25 % equity ratio. <strong>TTS</strong> also has an unsecured bond<br />
loan where the covenants’ requirement is 550 MNOK in equity and<br />
more than 22.5 % equity ratio, where equity ratio is normative<br />
<strong>for</strong> minimum equity.<br />
36<br />
SHAREHOLDER POLICy<br />
<strong>TTS</strong> aims to give our shareholders a competitive long-term return that<br />
reflects the risk inherent to the company’s operations. Based on <strong>TTS</strong>’<br />
growth strategy, the shareholders’ return should be realised through<br />
an increase in the value of their shares, together with dividends when<br />
circumstances so permit. Growth by means of acquisitions will be<br />
implemented through balanced financing of equity and debt.<br />
The Annual General Meeting determines the annual dividend, based<br />
on the Board’s proposal.<br />
The Board of <strong>TTS</strong> <strong>Group</strong> <strong>ASA</strong> will propose to the Annual General<br />
Meeting, on 19 May 2011 that no dividend is paid out <strong>for</strong> the accounting<br />
year <strong>2010</strong>.<br />
STRATEGy FOR FURTHER GROWTH<br />
<strong>TTS</strong> has, since 1996, completed fourteen successful acquisitions,<br />
establishing a leading position in its segments of the market <strong>for</strong> handling<br />
equipment. This has entailed a considerable growth, and turnover has<br />
increased from about 260 MNOK in 1997 to about 4 200 MNOK in<br />
2008. In the last 2 years the turnover has been reduced and in <strong>2010</strong><br />
the turnover was 3 241 MNOK.<br />
The international offshore and shipbuilding industry has been affected<br />
by the financial crisis in the last part of 2008 and this has also affected<br />
<strong>TTS</strong>. The market conditions have become more demanding <strong>for</strong> <strong>TTS</strong>’ core<br />
businesses offshore and ships equipment, but have also affected port<br />
equipment. Accordingly, <strong>TTS</strong> significantly reduced its order backlog from<br />
the end of 2008 to the end of <strong>2010</strong>. In the last quarter of <strong>2010</strong> <strong>TTS</strong><br />
strenghtened its order backlog <strong>for</strong> the first time since 3rd quarter 2008<br />
as a consequence of a stronger market within drilling. In general the<br />
market <strong>for</strong> the Energy division has improved during the year while the<br />
markets <strong>for</strong> shipbuilding and port have been stable.<br />
In the coming years, <strong>TTS</strong> will continue to expand the group’s activities<br />
within its segments <strong>for</strong> handling equipment <strong>for</strong> ships, ports and offshore<br />
installations, in addition to advanced drilling equipment <strong>for</strong> offshore<br />
and land-based units.<br />
AUTHORISATIONS TO THE BOARD<br />
• On 15 June 2009, the Annual General Meeting adopted a resolution<br />
to give the Board authority to issue a maximum of 420 000 shares<br />
against cash redemption <strong>for</strong> the benefit of the company’s executive<br />
management. This authorisation is valid until 15 June <strong>2010</strong>. 240 000<br />
shares have been issued in the <strong>for</strong>m of options, with a possible<br />
first time exercise of options following the presentation of the first<br />
quarterly results <strong>for</strong> <strong>2010</strong>, equivalent to a maximum of 50 % of<br />
the allocated options. The number of shares <strong>for</strong> further exercise of<br />
options constitutes 12.5 % following the presentation of the results<br />
<strong>for</strong> the second, third and fourth quarter of <strong>2010</strong> and the first quarter<br />
of 2011, in addition to options not previously exercised.<br />
• On the 3 June <strong>2010</strong>, the Annual General Meeting adopted a resolution<br />
to give the board authority to issue a maximum of 7 000 000 shares<br />
against cash or non-monetary redemption including merger. The<br />
authority is valid to the Annual General Meeting 19 May 2011. On<br />
13 July <strong>2010</strong> the authority was utilized to issue 6 722 920 shares<br />
to Scana Industrier <strong>ASA</strong> in a right issue at NOK 6.30 per share.<br />
• On 3 June <strong>2010</strong>, the Annual General Meeting adopted a resolution<br />
to give the board authority to issue 420 000 shares against cash
edemption <strong>for</strong> the benefit of the company’s executive management.<br />
This authorisation is valid to 19 May 2011. 360 000 shares have<br />
been issued in the <strong>for</strong>m of options, with a possible first time exercise<br />
of options following the presentation of the first quarterly results<br />
<strong>for</strong> 2011, equivalent to a maximum of 50 % of the allocated options.<br />
The number of shares <strong>for</strong> further exercise of options constitutes<br />
12.5 % following the presentation of the results <strong>for</strong> the second,<br />
third and fourth quarter of 2011 and the first quarter of 2012, in<br />
addition to options not previously exercised.<br />
• On 3 June <strong>2010</strong>, the Annual General Meeting adopted a resolution<br />
to give the board authoritiy to issue 420 000 shares against cash<br />
redemption <strong>for</strong> the benefit of the company’s employees. This authorisation<br />
is valid to 19 May 2011. No shares has been issued on the<br />
basis of this authorisation as of 31 March 2011.<br />
4. Equal treatment of shareholders and transactions<br />
with closely related parties<br />
SHARE CAPITAL AND SHAREHOLDERS<br />
The share capital at 31 December <strong>2010</strong> was 37 315 599.50 NOK divided<br />
into 74 631 199 shares at a nominal value of 0.50 NOK each. The<br />
company has only one class of freely negotiable shares, which are listed<br />
on the Oslo Stock Exchange’s Match List under the ticker symbol <strong>TTS</strong>.<br />
Each share is allocated one vote.<br />
A list of the <strong>TTS</strong>’ 20 major shareholders is available on the company’s<br />
website.<br />
OWN SHARES<br />
Own shares are purchased on the Oslo Stock Exchange. At 31 March<br />
2011, the company’s own shareholding was 35 210.<br />
THE BOARD OF DIRECTORS AND GROUP MANAGEMENT<br />
<strong>TTS</strong> <strong>Group</strong> <strong>ASA</strong>’s Board of Directors and group management are viewed<br />
as closely related parties of <strong>TTS</strong>, using the Oslo Stock Exchange <strong>for</strong><br />
the transaction of <strong>TTS</strong> shares.<br />
There have been no closely related transactions between the Board<br />
of Directors or the group management and <strong>TTS</strong>. According to the<br />
Norwegian code of practice <strong>for</strong> corporate governance, a company<br />
is advised to implement guidelines assuring that closely related parties<br />
give notice of closely related transactions. Based on the current Board<br />
of Directors and <strong>Group</strong> Management, the company has deemed such<br />
guidelines to be unnecessary.<br />
According to the Norwegian code of practice <strong>for</strong> corporate governance,<br />
a company should list reasons <strong>for</strong> deviation from existing shareholders<br />
preferential status when making a right issue. <strong>TTS</strong> aim to follow the<br />
Norwegian code when and if applicable.<br />
RELATED COMPANIES<br />
The joint venture companies in the <strong>TTS</strong> group are treated as related<br />
companies with transactions as shown in Note 19.<br />
5. Freely negotiable shares<br />
As transpires from the Articles of Association posted on the company’s<br />
website, no <strong>for</strong>m of transfer restriction has been effectuated.<br />
<strong>TTS</strong> GROUP 3-15<br />
BUSINESS AREAS 16-33<br />
cORPORATE GOvERnAncE 35-43<br />
DIRECTOR’S REPORT AND ACCOUNTS 45-116<br />
ORGANISATION 118-123<br />
6. Annual General Meeting<br />
The Annual General Meeting is usually held at the end of May/beginning<br />
of June. The Annual General Meeting <strong>for</strong> <strong>2010</strong> will be held on 19 May<br />
2011, in accordance with the financial calendar <strong>for</strong> 2011.<br />
Agenda papers <strong>for</strong> the Annual General Meeting, including the nominating<br />
committee’s recommendations, are distributed to the shareholders<br />
at the latest three weeks prior to the Annual General Meeting,<br />
and are available on the company’s website at the latest three weeks<br />
prior to the Annual General Meeting. The agenda papers are detailed<br />
enough to permit the shareholders to make a decision on all items up<br />
<strong>for</strong> consideration.<br />
Shareholders unable to attend may vote by proxy. Proxy <strong>for</strong>ms will be<br />
sent out <strong>for</strong> each shareholder to fill in and return to the admini stration.<br />
On the proxy <strong>for</strong>m, the shareholder may vote on each individual item.<br />
The registration deadline is normally set to the day be<strong>for</strong>e the Annual<br />
General Meeting.<br />
The Chairman of the Board, chairman of the nominating committee,<br />
auditor and CEO are present at the Annual General Meeting, in addition<br />
to other board members when appropriate. The Annual General Meeting<br />
elects its own chair; usually this is the Chairman of the Board.<br />
On account of a low turnout <strong>for</strong> the general assemblies, <strong>TTS</strong> does not<br />
deem it necessary <strong>for</strong> the full Board of Directors to be present. We have,<br />
<strong>for</strong> the same reason, found it unnecessary to establish routines to secure<br />
independent chairing of the Annual General Meeting. Should there be<br />
particular items on the agenda requiring need <strong>for</strong> such measures, this<br />
will be individually considered <strong>for</strong> each individual general assembly.<br />
The Annual General Meeting will be given the opportunity to vote<br />
<strong>for</strong> each of the candidates up <strong>for</strong> positions in the company’s bodies.<br />
7. nominating committee<br />
In <strong>TTS</strong>, a nominating committee is statutory according to the Articles<br />
of Association. In accordance with the Annual General Meeting<br />
on 3 June <strong>2010</strong>, a nomination committee was appointed with the<br />
following members:<br />
NAME POSITION<br />
Johan Aasen Trustee, Skagenfondene<br />
Bjørn Sjaastad Consultant<br />
Bjørn Olafsson Managing Director, Frende Liv AS<br />
The nominating committee appoints its own chairman of the committee.<br />
Bjørn Olafsson was elected to chair the committee.<br />
No one in the nominating committee is a member of the Board of<br />
<strong>TTS</strong> <strong>Group</strong> <strong>ASA</strong> or part of the management of <strong>TTS</strong>, as such ensuring<br />
independence. The nominating committee has knowledge of <strong>TTS</strong> and its<br />
shareholders, so that the interests of the shareholders are protected.<br />
The nominating committee recommends candidates to the Board and<br />
related remuneration, where the nominating committee’s recommendation<br />
is substantiated.<br />
According to the Norwegian code of practice <strong>for</strong> corporate governance,<br />
the chairman of the nominating committee should be elected<br />
at the Annual General Meeting and guidelines <strong>for</strong> its work should<br />
be established. In the opinion of <strong>TTS</strong>, it is more appropriate that the<br />
committee decides on the distribution of tasks, including the election<br />
of a chairperson. The Annual General Meeting determines the<br />
nominating committee’s remuneration.<br />
37
The members of the committee including practical in<strong>for</strong>mation as<br />
deadlines <strong>for</strong> nominations and contact in<strong>for</strong>mation is listed on the<br />
company’s website.<br />
8. corporate Assembly and board of Directors,<br />
composition and independence<br />
As <strong>TTS</strong> <strong>Group</strong> <strong>ASA</strong> have fewer than 200 employees, the management<br />
model does not include a corporate assembly. There are two employees<br />
representatives on the Board of <strong>TTS</strong> <strong>Group</strong> <strong>ASA</strong>.<br />
In accordance with the Annual General Meeting on 3 June <strong>2010</strong>,<br />
the shareholders elected the following members to the Board:<br />
NAME STATUS POSITION<br />
Trym Skeie Re-elected Chairman,<br />
Skagerak Venture Capital AS<br />
Anne Breive Re-elected CFO, Løvenskiold Vækerø AS<br />
Kjerstin Fyllingen Not <strong>for</strong> election <strong>Group</strong> Director, Tryg AS<br />
Bjarne Skeie Re-elected Skeie Technology AS<br />
Rune Selmar Elected Consultant<br />
In December <strong>2010</strong> Rune Selmar resigned as a director from the board<br />
of <strong>TTS</strong> <strong>Group</strong> <strong>ASA</strong>. The board made the decision to elect his successor<br />
at the Annual General Meeting on the 19 May 2011.<br />
In accordance with ordinary election of two employee representatives<br />
to the Board of <strong>TTS</strong> <strong>Group</strong> <strong>ASA</strong>, the following were appointed to the<br />
Board in September of <strong>2010</strong>:<br />
NAME COMPANy POSITION<br />
Karen T. Mørkestøl <strong>TTS</strong> Energy AS Director<br />
Jarle Dyrdal <strong>TTS</strong> Energy AS Director<br />
Morten Heiseldal <strong>TTS</strong> Energy AS 1st Deputy Director<br />
Anne Karin Bedringås <strong>TTS</strong> Energy AS 2nd Deputy Director<br />
<strong>TTS</strong>’ Board members are elected <strong>for</strong> a two-year period. Each Board<br />
member’s CV is available in the Annual Report.<br />
Trym Skeie and Bjarne Skeie are both directly and indirectly major<br />
shareholders in the company. The other shareholder-elected Board<br />
members are independent of management, the company’s major shareholders<br />
and primary business connections. Furthermore, the composition<br />
of the Board upholds shareholder interests, and the company’s<br />
requirements <strong>for</strong> expertise, capacity and diversity in a fine collegiate<br />
body. The complementary expertise of the Board ensures the Board<br />
member’s ability to assess matters from different perspectives be<strong>for</strong>e<br />
reaching a final conclusion.<br />
At 31 March 2011, Trym Skeie, Chairman of the Board, had 2 160 735<br />
shares in <strong>TTS</strong> <strong>Group</strong> <strong>ASA</strong>, through Tamafe Holding AS, in which he<br />
owns all of the voting shares. Bjarne Skeie, Director <strong>for</strong> the Board, had<br />
9 882 912 shares in <strong>TTS</strong> <strong>Group</strong> <strong>ASA</strong>, through Skeie Technology and<br />
Skeie Consultants, in which he owns all of the voting shares. The<br />
other Directors of the Board do not hold any shares in <strong>TTS</strong> <strong>Group</strong> <strong>ASA</strong>.<br />
None of the Board Directors hold any options. In <strong>2010</strong>, the turnout <strong>for</strong><br />
Board meetings was good.<br />
According to the Norwegian code of practice <strong>for</strong> corporate governance,<br />
the Chairman of the Board should be elected by the Annual<br />
General Meeting. In <strong>TTS</strong>, the Board appoints the chairman.<br />
38<br />
9. The work of the board<br />
The Board has eight scheduled meetings annually, and an annual meeting<br />
plan is set up. Further meetings are held as required. A total of 13 board<br />
meetings were held in <strong>2010</strong>.<br />
The work of the Board has been intensified as a result of the financial<br />
challenges that <strong>TTS</strong> was up against in <strong>2010</strong>. Owing to this situation,<br />
the Board’s primary focus in the past quarterly periods has been risk<br />
analyses and risk management. Procedures <strong>for</strong> the Board and management<br />
have been established, focusing on distribution of tasks and<br />
responsibilities. The Board complies with the rules regarding disqualification<br />
pursuant to the Joint Stock Public Companies Act, Section 6-27.<br />
The group’s use of nominating committee has been made statutory<br />
in its Articles of Association. In addition, the Board of <strong>TTS</strong> <strong>Group</strong> <strong>ASA</strong><br />
has appointed an audit committee:<br />
AUDIT COMMITTEE<br />
Anne Breive (Chairman)<br />
Kjerstin Fyllingen<br />
Rune Selmar (up to December <strong>2010</strong>)<br />
At present, the Board does not have a compensation committee. This<br />
is assessed on an annual basis. <strong>TTS</strong> previously had a compensation<br />
committee. There are no other committees in the Board. At present,<br />
<strong>TTS</strong> does not have a deputy chairman. This is assessed on an annual<br />
basis. <strong>TTS</strong> previously had a deputy chairman.<br />
The board conducts an self-assessment annually.<br />
10. Risk management and internal control<br />
The <strong>TTS</strong> <strong>Group</strong> has a decentralized structure with operative boards in<br />
each company holding an average of six to eight board meetings a<br />
year. The largest company in each division <strong>report</strong>s on all the companies<br />
in its own division. The President and CEO is Chairman of the Board in<br />
all of the division’s Board of Directors. The head of division is Chairman<br />
of the Board of the companies within the division. In addition to this,<br />
the boards consist of personnel from various companies in different<br />
divisions, as well as external board members as required. An authority<br />
matrix has been established detailing which matters may be dealt with<br />
at the various levels.<br />
Procedures and systems upholding uni<strong>for</strong>m <strong>report</strong>ing have been<br />
prepared. The administration prepares monthly <strong>report</strong>s on results, which<br />
are submitted to and reviewed by the members of the Board. In<br />
addition, more comprehensive quarterly financial <strong>report</strong>s are prepared,<br />
which are reviewed at the quarterly period board meetings. Included<br />
in the <strong>report</strong>ing are any variances or measures <strong>for</strong> the most significant<br />
projects. In addition to continuous risk management, the Board and<br />
administration undertake specific risk analyses in connection with<br />
major investments and contract signing, as well as a continuous risk<br />
analysis of projects. Risk management is part of the Board’s work, and<br />
in addition to a continuous review, this is moreover a part of budget<br />
and strategy related work.<br />
The Board of Directors undertakes a thorough review of the company’s<br />
financial status in the Directors’ Report. This review includes a further<br />
description of the main elements of HSE and risk aspects.
11. Remuneration of the board of Directors<br />
Based on the recommendation of the nominating committee, the<br />
Annual General Meeting determines the remuneration of the Board<br />
of Directors. Remuneration is not linked to the company’s result.<br />
There is no share option program <strong>for</strong> the Board of Directors.<br />
Members of the Board of Directors, or companies with whom they<br />
are associated, are not usually given separate tasks by <strong>TTS</strong> in addition<br />
to their function as members of the Board. Still, should such tasks be<br />
assigned, this will be based on the approval of the Board of Directors.<br />
There were no such assignments in <strong>2010</strong>.<br />
The nominating committee’s proposal <strong>for</strong> remuneration of the Board<br />
of Directors is presented in the call <strong>for</strong> the Annual General Meeting on<br />
19 May 2011.<br />
12. Remuneration of executive management<br />
The Board has issued guidelines <strong>for</strong> stipulation of salaries and other<br />
remunerations to executive management. The President and CEO’s<br />
terms are stipulated by the Board.<br />
The Board’s attitude to management salaries is that these should be<br />
competitive and motivating, but not ahead of the market with regard<br />
to their level. Bonus is calculated on the basis of measured results.<br />
Guidelines are presented in Note 4. According to the note, share<br />
options constitute part of the remuneration. Share options <strong>for</strong> executive<br />
management (see Item 3 – Authorisations to the Board) include group<br />
management. Exercise of share options is dependent on the share price<br />
listed on the Oslo Stock Exchange. At the end of <strong>2010</strong> and at 31 March<br />
<strong>2010</strong>, in all 600 000 authorised share options had been issued to group<br />
management. 240 000 options may be exercised up to 15 June 2011 at<br />
a price of 7.55 NOK and 360 000 options that may be exercised up to<br />
3 June 2012 at a price of 5.91 NOK.<br />
DISTRIBUTION OF OPTIONS AND SHARES AT 31 MARCH 2011<br />
Number of Number of<br />
Name Position options of shares<br />
Johannes D. Neteland CEO 240 000 185 000<br />
Arild Apelthun CFO 60 000 0<br />
Ivar K. Hanson Head of division 120 000 52 422<br />
Lennart Svensson Head of division 120 000 200<br />
Inge Gabrielsen Head of division 60 000 450<br />
Total 600 000 238 172<br />
<strong>TTS</strong> GROUP 3-15<br />
BUSINESS AREAS 16-33<br />
cORPORATE GOvERnAncE 35-43<br />
DIRECTOR’S REPORT AND ACCOUNTS 45-116<br />
ORGANISATION 118-123<br />
13. in<strong>for</strong>mation and communication<br />
The company has established guidelines <strong>for</strong> the handling of in<strong>for</strong>mation<br />
and communication. These guidelines also address contact with the<br />
owners separate from the general assembly. The <strong>report</strong>ing by <strong>TTS</strong> of<br />
financial and other in<strong>for</strong>mation is based on transparency, respecting<br />
the principles of equal treatment of stock market participants.<br />
A financial calendar is available on the company’s website. Any<br />
dividend proposal is presented in the fourth quarterly <strong>report</strong> and in<br />
the call <strong>for</strong> an annual general meeting.<br />
In<strong>for</strong>mation <strong>for</strong> the shareholders of the company is posted on the<br />
company’s website at the same time as it is distributed to the shareholders<br />
(with the exception of the call <strong>for</strong> an annual general meeting,<br />
see Item 6).<br />
14. company takeover<br />
The company’s Articles of Association do not include mechanisms<br />
aimed at preventing takeover, nor are other hindrances in effect to<br />
reduce transfer of the company’s shares.<br />
No main principles have been established <strong>for</strong> <strong>TTS</strong>’ response to<br />
a prospective takeover bid, other than that the Norwegian code of<br />
practice <strong>for</strong> corporate governance will have a normative function.<br />
15. Auditor<br />
The auditor conducts a minimum of two meetings a year with the<br />
audit committee, part of the meeting without management present.<br />
One of the meetings is conducted in connection with the review of the<br />
annual accounts, and one of the meetings deals with the company’s<br />
internal control. The audit committee meets with the auditors to go<br />
through the audit plan <strong>for</strong> the year where any specific areas are being<br />
discussed. The auditor is present at board meetings as required.<br />
Remuneration payable to the auditor, specifying the division between<br />
auditing and other services, is shown in Note 4.<br />
The extent of services other than audit services is addressed in the<br />
meeting between the auditor and the audit committee. It has not been<br />
deemed necessary by the Board to implement additional guidelines<br />
with regard to the management’s access to making use of the auditor<br />
<strong>for</strong> services other than auditing.<br />
39
Senior Management<br />
johannes D. neteland<br />
PRESiDEnT & cEO<br />
Neteland (53) is President & CEO of<br />
<strong>TTS</strong> <strong>Group</strong> <strong>ASA</strong>. He holds a Master<br />
of Science in Business degree from<br />
the Norwegian School of Economics<br />
and Business Administration (NHH).<br />
Neteland worked <strong>for</strong> Statoil from<br />
1981-1988, was the deputy managing<br />
director of Block Watne Boliger from<br />
1988-1989 and the marketing director<br />
of the Ekornes <strong>Group</strong> from 1989-1991.<br />
He was the division director of Vital<br />
Forsikring from 1991-1998 until he<br />
assumed his current position.<br />
40<br />
ivar k. hanson<br />
ExEcUTivE vicE PRESiDEnT<br />
Hanson (46) is division Director of<br />
Marine and President of <strong>TTS</strong> Marine AS.<br />
He holds a Master of Science in Business<br />
degree from the Norwegian School of<br />
Economics and Business Administration<br />
(NHH) and is a mechanical engineer.<br />
Hanson has worked as a contract co -<br />
ordinator and bid manager. He started<br />
at <strong>TTS</strong> as a shipyard consultant in 1994<br />
and was appointed managing director<br />
of <strong>TTS</strong> Automation AS in 1999 and<br />
<strong>TTS</strong> Handling Systems AS in 2000.<br />
From 1 January 2003 to 30 May 2004,<br />
Hanson was director in Prosafe Drilling<br />
Services AS <strong>for</strong> Technology and Projects<br />
in the engineering division. He took up<br />
his current position with <strong>TTS</strong> in 2008.<br />
Lennart Svensson<br />
ExEcUTivE vicE PRESiDEnT<br />
Svensson (54) is Director of the Port<br />
and Logistics division. Svensson is a<br />
Naval Architect and Mechanical Engineer.<br />
He has eight years of experience from<br />
various enter prises that are currently<br />
part of the MacGregor <strong>Group</strong> and two<br />
years as Marketing Director at Daros<br />
Piston Rings AB. Svensson has worked<br />
<strong>for</strong> <strong>TTS</strong> since 1996 and as President<br />
in <strong>TTS</strong> Port Equipment AB since the<br />
company was established in 2005.<br />
He took up his current position in<br />
the autumn of 2008.
inge Gabrielsen<br />
ExEcUTivE vicE PRESiDEnT<br />
Gabrielsen (58) is Executive Vice President<br />
of the <strong>TTS</strong> Energy division and President<br />
of <strong>TTS</strong> Energy AS. Gabrielsen holds a degree<br />
as M.Sc. Naval Architect and Marine<br />
Engineering from the Norwegian Institute<br />
of Technology (NTH) in Trondheim.<br />
Gabrielsen started in <strong>TTS</strong> Sense in 2007<br />
and came from the position as Vice<br />
President <strong>for</strong> Vessel Mangement and<br />
Equipment <strong>Group</strong> in Subsea 7 <strong>ASA</strong>. Prior<br />
to this he worked <strong>for</strong> different companies<br />
in Aker Maritime <strong>for</strong> 10 years. Until he<br />
took up his current position in <strong>TTS</strong> in the<br />
autumn of 2009, Mr Gabrielsen was Vice<br />
President Operations in <strong>TTS</strong> Sense AS.<br />
Arild Apelthun<br />
cFO<br />
Apelthun (39) Apelthun is CFO in the<br />
<strong>TTS</strong> <strong>Group</strong> <strong>ASA</strong>. Apelthun comes from<br />
the position as CFO of Aker Process,<br />
based in the Netherlands. Apelthun<br />
has been holding various positions in<br />
subsidiaries of Aker Solutions in the<br />
USA and Europe over the last 7 years.<br />
Prior to that he has been working with<br />
ABB, Aker Maritime and Ementor in<br />
Norway. Arild Apelthun holds a degree<br />
as Master of Science in Business from<br />
Bodø Graduate School of Business.<br />
Apelthun took up his current position<br />
with <strong>TTS</strong> in <strong>2010</strong>.<br />
<strong>TTS</strong> GROUP 3-15<br />
BUSINESS AREAS 16-33<br />
cORPORATE GOvERnAncE 35-43<br />
DIRECTOR’S REPORT AND ACCOUNTS 45-116<br />
ORGANISATION 118-123<br />
41
The board of Directors <strong>TTS</strong> <strong>Group</strong> <strong>ASA</strong><br />
Trym Skeie<br />
chAiRMAn OF ThE bOARD<br />
Skeie (42) is one of the main founders of<br />
Skagerak Venture Capital AS (SVC), where<br />
he currently is a partner and holds the<br />
Chairman seat. Be<strong>for</strong>e establishing SVC<br />
in 2006, Trym was with Kistefos Venture<br />
Capital as an Investment Manager within<br />
the IT/Telecom area. He also has an offshore<br />
industry background through active<br />
involvement and Board seats in companies<br />
such as Sinvest <strong>ASA</strong>, Premium Drilling AS,<br />
Venture Drilling AS and Wellquip AS.<br />
Earlier he has worked as a Vice President at<br />
Silicon Capital Ltd., Manager in Accenture<br />
and structural design engineer in Hydralift<br />
<strong>ASA</strong>. Skeie`s current Chairman/directorships<br />
in SVC portfolio includes: UFIS Airport<br />
Solutions AS, Presens AS, Mobile Nordic AS<br />
and Nordic Energy Services. Skeie holds<br />
the equivalent of a Masters degree from<br />
the Norwegian School of Economics and<br />
Business Administration (NHH), and a<br />
MSc. from the Norwegian University of<br />
Science and Technology (NTH). Skeie<br />
has been chairman of the board since<br />
November 2009. He has 2 160 735 shares<br />
and no options in <strong>TTS</strong> <strong>Group</strong> <strong>ASA</strong>. Skeie<br />
is a Norwegian citizen.<br />
42<br />
kjerstin Fyllingen<br />
DiREcTOR OF ThE bOARD<br />
Fyllingen (53) is corporate director of<br />
Tryg, Private & Commercial Norway.<br />
She holds a Diploma in Economics and<br />
an MSc in Leader ship, both from the<br />
Norwegian School of Management BI.<br />
Fyllingen previously worked <strong>for</strong> Vital<br />
Forsikring, where she held various<br />
managerial positions in charge of the<br />
business segments Public Sector, as well<br />
as Customer Service Private & Commercial.<br />
Fyllingen has furthermore held various<br />
managerial positions in DnB within the<br />
areas of IT and Economics. She has been<br />
head of Infodoc International and held<br />
various positions within Economics in DnV.<br />
Fyllingen has been a member of the<br />
board since 2008. She has no shares or<br />
options in <strong>TTS</strong> <strong>Group</strong> <strong>ASA</strong>. Fyllingen is<br />
a Norwegian citizen.<br />
Anne breive<br />
DiREcTOR OF ThE bOARD<br />
Breive (45) is CFO of Løvenskiold-Vækerø AS.<br />
She has a Bachelor of Commerce degree<br />
from the Norwegian School of Management<br />
(BI) and an MBA degree from Glasgow<br />
University. During the period 1994-2005,<br />
she held various managerial positions in<br />
the Norske Skog <strong>Group</strong>, including that<br />
of Vice President Corporate Funding and<br />
Vice President Corporate Controlling.<br />
Breive was CFO of Statnett from 2005-<br />
2008. Breive has been a member of the<br />
<strong>TTS</strong> <strong>Group</strong> <strong>ASA</strong> board since 2005. She<br />
has no shares or options in the company.<br />
Breive is a Norwegian citizen.
jarne Skeie<br />
DiREcTOR OF ThE bOARD<br />
Skeie (65) has an engineering background<br />
and is known as an entre preneur, industrial<br />
developer and investor in the rig, offshore<br />
and equipment industries. This includes the<br />
founding of Maritime Hydraulics AS (1970),<br />
as well as acquisitions and restructuring of<br />
a number of companies that were merged<br />
and listed on the Oslo Stock Exchange<br />
as Skeie <strong>Group</strong> (1986/87). He undertook<br />
further establishments and acquisitions of<br />
new companies, one of which was Hydralift<br />
(1990), a company that saw tremendous<br />
organic growth through acquisitions.<br />
Hydralift was sold to National Oilwell in<br />
the autumn of 2002, at the time the major<br />
shareholder of <strong>TTS</strong> <strong>Group</strong> <strong>ASA</strong> (39.1 percent).<br />
He founded Sinvest in 2002, which was<br />
sold in 2006. In 2006, Skeie Drilling &<br />
Productions was established, and in 2007,<br />
Skeie energy was established. Per March<br />
2011 Bjarne Skeie owns 9 882 912 shares in<br />
<strong>TTS</strong> <strong>Group</strong> <strong>ASA</strong>, through Skeie Technology<br />
and Skeie Consultants, in which he owns all<br />
of the voting shares. He holds no options<br />
in <strong>TTS</strong> <strong>Group</strong> <strong>ASA</strong>. Skeie was Chairman of<br />
the Board of <strong>TTS</strong> <strong>Group</strong> <strong>ASA</strong> in the period<br />
2002-2003 and has been a member of<br />
the board since 2008. Skeie is a Norwegian<br />
citizen.<br />
karen T. Mørkestøl<br />
DiREcTOR OF ThE bOARD<br />
Mørkestøl (58) has completed upper secondary<br />
school with emphasis on English language<br />
and music, and has further completed a<br />
one-year course at a college of commerce.<br />
Mørkstøl worked <strong>for</strong> ship chandler Oskar<br />
Pedersen AS from 1972 to 1980 as a secretary/purchaser<br />
of equipment <strong>for</strong> deck and<br />
machinery. Following a period of temporary<br />
positions with various companies, she was<br />
employed by Maritime Hydraulics/Aker<br />
Solution as salary administrator in charge<br />
of wages, travel and timesheets. Mørkestøl<br />
has held a position with Sense Technology/<br />
<strong>TTS</strong> Energy since 2000. Her responsibilities<br />
have included accounting, wages, secretarial<br />
duties, administration and human resources.<br />
In 2006, Mørkestøl was appointed Manager<br />
HR & Administration. She was appointed<br />
employee representative of the Board of<br />
<strong>TTS</strong> <strong>Group</strong> <strong>ASA</strong> in <strong>2010</strong>. Mørkestøl holds<br />
3 217 shares in <strong>TTS</strong> <strong>Group</strong> <strong>ASA</strong>, and has<br />
no share options. Mørkestøl is a Norwegian<br />
citizen.<br />
<strong>TTS</strong> GROUP 3-15<br />
BUSINESS AREAS 16-33<br />
cORPORATE GOvERnAncE 35-43<br />
DIRECTOR’S REPORT AND ACCOUNTS 45-116<br />
ORGANISATION 118-123<br />
jarle Dyrdal<br />
DiREcTOR OF ThE bOARD<br />
Dyrdal (39) holds a Bachelor’s degree in<br />
Industrial Electronics from the University of<br />
Agder. He has worked <strong>for</strong> Sense Technology,<br />
now <strong>TTS</strong>, since 2001. For the duration of this<br />
period he worked on design and development<br />
of drilling equipment, and he currently<br />
holds the position of Vice President Products<br />
& Technology in the <strong>TTS</strong> Energy division in<br />
Kristiansand. From 1996 to 2001, he worked<br />
<strong>for</strong> Aker Solution MH in Kristiansand, in<br />
charge of design and development of drilling<br />
equipment. Dyrdal was a member of the<br />
Board of Directors of <strong>TTS</strong> Offshore Handling<br />
Equipment from 2008 to <strong>2010</strong>, and was<br />
appointed employee representative on the<br />
Board of <strong>TTS</strong> <strong>Group</strong> <strong>ASA</strong> in <strong>2010</strong>. He holds<br />
30 227 shares in the company, and has no<br />
share options. Dyrdal is a Norwegian citizen.<br />
43
Director’s <strong>report</strong> <strong>for</strong> <strong>2010</strong><br />
introduction<br />
For the <strong>TTS</strong> <strong>Group</strong> (<strong>TTS</strong>), <strong>2010</strong> was an eventful year. The markets<br />
are recovering or stabilising in most of the business areas in which<br />
the group operates, and the group has taken a number of actions<br />
that have positively affected the results and financial strength.<br />
In <strong>2010</strong>, <strong>TTS</strong>’ turnover was 3 241 MNOK, compared to 3 825<br />
MNOK in 2009. This decrease in turnover is primarily a result of<br />
lower level of activity in the Energy division. The group <strong>report</strong>ed<br />
an EBITDA of 4 MNOK, an improvement of 88 MNOK from<br />
2009. The group <strong>report</strong>s a net loss of 197 MNOK, an improvement<br />
of 51 MNOK compared to 2009.<br />
Despite an unsatisfactory annual result, it represents a considerable<br />
improvement compared to 2009. The Marine division and<br />
the Port and Logistics division deliver satisfactory results, the<br />
Energy division’s results has been influenced by a weak market<br />
throughout <strong>2010</strong>, in addition to the write-downs and cost overruns<br />
on projects.<br />
The market <strong>for</strong> marine equipment has shown a steady development<br />
throughout the year, and has stabilised. The same applies to<br />
the Port and Logistics division where especially the market <strong>for</strong> port<br />
equipment has improved. Within the business area of transport<br />
solutions <strong>for</strong> industry, the market has gradually improved.<br />
Furthermore, the market <strong>for</strong> drilling equipment and other offshore<br />
rig equipment showed a distinct improvement in the final quarter<br />
of <strong>2010</strong>. In fourth quarter <strong>TTS</strong> signed a contract <strong>for</strong> delivery of<br />
two jack-up drilling packages <strong>for</strong> approximately 460 MNOK. In<br />
April 2011 <strong>TTS</strong> signed contracts <strong>for</strong> delivery of two additional<br />
drilling packages. The market <strong>for</strong> offshore handling equipment and<br />
land rigs remains weak.<br />
In September, <strong>TTS</strong> reached an agreement with the bankruptcy<br />
estate of Ability Drilling by means of court-administered mediation.<br />
The agreement entailed that <strong>TTS</strong> purchased a land rig with seller’s<br />
credit over two years <strong>for</strong> 75 MNOK. All other claims between<br />
the parties were waived. The claim from the bankruptcy estate was<br />
580 MNOK.<br />
In January 2011, <strong>TTS</strong> issued a subordinated convertible bond<br />
loan of 200 MNOK to strengthen the group’s financial flexibility.<br />
This, in conjunction with adjustments in the loan agreements with<br />
banking partners and bondholders, ensure that the company is in<br />
compliance with its loan covenants as of 31 December <strong>2010</strong>.<br />
Targets and strategy<br />
<strong>TTS</strong>’ goal is to develop and supply equipment <strong>for</strong> the maritime<br />
industry and <strong>for</strong> the oil and gas industry, with products and of a<br />
quality that strengthens our customers’ productivity and value<br />
generation. The group’s expertise and resources are aimed at sales,<br />
<strong>TTS</strong> GROUP 3-15<br />
BUSINESS AREAS 16-33<br />
CORPORATE GOVERNANCE 35-43<br />
DiREcTOR’S REPORT AnD AccOUnTS 45 -116<br />
ORGANISATION 118-123<br />
design and engineering, assembly and testing of products, as well as<br />
the priority area service and after sales.<br />
<strong>TTS</strong>’ strategy is to build up and maintain a relationship of trust<br />
with our customers, through development and delivery of products<br />
that are competitive with regard to price and quality.<br />
<strong>TTS</strong> has based its growth and development on a combination<br />
of organic growth and acquisition of new business areas to create<br />
positive synergies product wise/market wise and/or cost wise. This<br />
strategy will be continued within the parameters of the group’s<br />
three defined areas of operation.<br />
Operations<br />
<strong>TTS</strong> is an international group that develops and supplies handling<br />
equipment to the maritime industry and to the oil and gas industry.<br />
As of <strong>2010</strong>, operations were reorganised into three divisions;<br />
Marine, Energy and Port and Logistics.<br />
In <strong>2010</strong>, <strong>TTS</strong> established a new branch office in Brazil in order to<br />
increase its global presence with regard to the sale of new projects<br />
and as part of a strategy to build up a network of service and after<br />
sales. In all, the group comprises 26 operative units in 14 countries.<br />
<strong>TTS</strong> is aiming to simplify its legal structure and several mergers<br />
have been done in <strong>2010</strong>.<br />
In China, <strong>TTS</strong> holds a 50 % ownership interest in the two joint<br />
venture companies, <strong>TTS</strong> Hua Hai Ships Equipment Co. Ltd. and<br />
<strong>TTS</strong> Bohai Machinery Co. Ltd., together with partners China State<br />
Shipbuilding Corporation (CSSC) and Dalian Shipbuilding Industry<br />
Co. (DSIC) respectively. Furthermore, the joint venture company<br />
<strong>TTS</strong> Hua Hai Ships Equipment participates with an 40 % ownership<br />
in the company Jiangnan <strong>TTS</strong> (Nantong) Ships Equipment Co. Ltd,.<br />
which manufactures hatch covers.<br />
Divisions and markets<br />
The Marine division, which delivers a broad range of products and<br />
services to the maritime industry, is experiencing a stable market<br />
with a steady level of contracting of new-buildings and demand <strong>for</strong><br />
service and maintenance. The market in China and South-Korea has<br />
shown a healthy development through the year.<br />
The Port and Logistics division delivers production lines and<br />
systems <strong>for</strong> cargo handling in shipyards and other industries, as well<br />
as cargo systems and transport systems <strong>for</strong> ports. In general, the<br />
markets <strong>for</strong> this division remained stable in <strong>2010</strong>, with an increase<br />
in the level of activity toward the end of the year in individual<br />
segments.<br />
The Energy division, which delivers drilling equipment to offshore<br />
rigs, handling systems to offshore vessels, as well as complete land<br />
45
igs, has remained slow <strong>for</strong> most of <strong>2010</strong>. In the fourth quarter,<br />
however, the market <strong>for</strong> drilling equipment recovered, particularly<br />
with regard to the jack-up segment. The market <strong>for</strong> offshore handling<br />
and <strong>for</strong> land rigs within our segment remains weak.<br />
The <strong>TTS</strong> <strong>Group</strong><br />
The parent company, <strong>TTS</strong> <strong>Group</strong> <strong>ASA</strong>, has its head office in Bergen,<br />
in Norway, and is listed on the Oslo Stock Exchange.<br />
At the end of <strong>2010</strong>, the group had 1 168 employees, of which<br />
1 057 with regular employment. Geographically, they are distributed<br />
as follows:<br />
COUNTRy EMPLOyEES<br />
Norway 458<br />
Germany 169<br />
China 168<br />
Sweden 158<br />
Other countries 215<br />
Review of the annual accounts<br />
AccOUnTinG PRinciPLES<br />
<strong>TTS</strong> <strong>Group</strong> <strong>ASA</strong> presents its annual accounts pursuant to the<br />
Norwegian Accounting Act’s Section 3-9 annual accounts, in<br />
accordance with IFRS, International Financial Reporting Standards.<br />
<strong>TTS</strong> <strong>Group</strong> <strong>ASA</strong>’s group accounts are presented according to<br />
generally accepted accounting principles. The accounting principles<br />
are the same as <strong>for</strong> the annual accounts <strong>for</strong> 2009.<br />
AnnUAL RESULT FOR <strong>2010</strong><br />
MNOK <strong>2010</strong> 2009<br />
Turnover 3 241 3 825<br />
EBITDA 4 -84<br />
Operating profit -48 -231<br />
Net financial items -108 -81<br />
Profit/loss be<strong>for</strong>e tax -156 -312<br />
Net profit/loss -197 -248<br />
Turnover <strong>for</strong> <strong>2010</strong> was 3 241 MNOK and is down from 2009<br />
mainly due to lower activity in the Energy division. EBITDA of<br />
4 MNOK is an improvement from 2009 and is the result of<br />
satis factory profit in Marine and Port and Logistics divisions while<br />
there were significant operational losses in the Energy division. The<br />
increase in net financial items is partly due to unrealised losses on<br />
<strong>for</strong>eign exchange. The tax expense <strong>for</strong> the year is influenced by<br />
adjustments in capitalized deferred tax assets and taxes in <strong>for</strong>eign<br />
subsidiaries.<br />
46<br />
bALAncE ShEET<br />
Total assets at 31 December <strong>2010</strong> were 3 452 MNOK compared<br />
to 3 689 MNOK in 2009. Equity at the end of the year was 803<br />
MNOK, equivalent to an equity ratio of 23.3 % compared to<br />
25.4 % at the end of the last year.<br />
In connection with the issue of a subordinated convertible bond<br />
loan of 200 MNOK in January 2011, <strong>TTS</strong> renegotiated terms<br />
with the bank syndicate Nordea/Sparebanken Vest and the bond<br />
loan. The agreement entails that the convertible loan is to be<br />
included in the equity capital ratio upon the testing of covenant<br />
from 31 December <strong>2010</strong>. The requirement is an equity capital ratio<br />
of 25 %/800 MNOK on the loans from the bank syndicate and<br />
22.5 %/550 MNOK on the bond loan. At the end of <strong>2010</strong> <strong>TTS</strong> is<br />
in compliance with the covenants on the loans shown above.<br />
In July <strong>2010</strong>, a private placement of 9.9 % of the outstanding<br />
shares <strong>for</strong> 42 MNOK.<br />
At the end of <strong>2010</strong>, <strong>TTS</strong> had a net interest-bearing debt of 799<br />
MNOK compared to 839 MNOK at the end of 2009. During <strong>2010</strong>,<br />
<strong>TTS</strong> has repaid 100 MNOK in loans. 50 MNOK was related to<br />
the facility from the bank syndicate Nordea/Sparebanken Vest and<br />
50 MNOK was related to the bond loan. The establishment of debt<br />
relates to the purchase of land rigs from Ability Drilling’s bankruptcy<br />
estate by means of an interest-bearing seller’s credit of 75 MNOK.<br />
Financial fixed assets at the end of the year were 128 MNOK, up<br />
from 111 MNOK at the end of 2009. Of this, the ownership interests<br />
in the two joint venture companies in China represents 121 MNOK<br />
compared to 94 MNOK in 2009.<br />
Based on an evaluation of future earnings and expected timing<br />
of utilisation of deferred tax, the company reduced the deferred tax<br />
assets with 88 MNOK. Compared to 2009 the deferred tax asset<br />
has been reduced with 25 MNOK at year end.<br />
<strong>TTS</strong> significantly improved its working capital in <strong>2010</strong>. The<br />
reduction of stock and other finished products, along with an<br />
increased order intake resulting in advance payment from customers,<br />
are the main reasons <strong>for</strong> the reduction in working capital.<br />
However, there are still 200 MNOK worth of finished products,<br />
primarily related to land rigs. <strong>TTS</strong> is actively focusing on reducing<br />
its working capital requirements.<br />
The <strong>TTS</strong> <strong>Group</strong> has income and expenses in <strong>for</strong>eign currencies,<br />
where the financial risk has been reduced by the use of hedging<br />
instruments, described in Accounting Principles.<br />
The annual accounts have been prepared in accordance with the<br />
International Financial Reporting Standard (IFRS). The accounts<br />
provide a true picture of the company’s financial position at<br />
31 December <strong>2010</strong>. The Board and management are not aware of<br />
any events that have occurred subsequent to the balance sheet date
of 31 December <strong>2010</strong> that may be of material significance to<br />
<strong>TTS</strong> and the annual accounts <strong>for</strong> <strong>2010</strong>.<br />
At the end of <strong>2010</strong>, <strong>TTS</strong> <strong>Group</strong> <strong>ASA</strong> had a share capital<br />
of 37 315 599.50 MNOK divided into 74 631 199 shares at 0.50<br />
MNOK each. The company holds 35 210 own shares.<br />
cASh FLOW<br />
Net cash flow <strong>for</strong> the group in <strong>2010</strong> was 80 MNOK. Cash flow from<br />
operations where positive 132 MNOK mainly due improved working<br />
capital. The group made investments <strong>for</strong> approx. 27 MNOK during<br />
<strong>2010</strong>. Other elements influencing the cash flow was instalments<br />
on bond and bank loan, seller’s credit as a consequence of the<br />
agreement with the bankruptcy estate of Ability Drilling and a<br />
share issue in July and financial expenses.<br />
R&D<br />
During <strong>2010</strong> a total of 11 MNOK has been capitalized relating to<br />
research and development.<br />
ORDER bAckLOG<br />
The order backlog at 31 December <strong>2010</strong> was 3 966 MNOK compared<br />
to 4 510 MNOK last year. These figures include 50 % of the order<br />
backlog of the joint venture companies in China.<br />
The order backlog has been adjusted according to confirmed and<br />
anticipated cancellations as a result of the economic development<br />
in markets significant to <strong>TTS</strong>.<br />
cOnTinUED OPERATiOn<br />
The requirement <strong>for</strong> continued operation pursuant to Section 3-3<br />
of the Norwegian Accounting Act has been fulfilled, and the annual<br />
accounts have been prepared according to this. At 31 December<br />
<strong>2010</strong>, the equity ratio was 23.3 % of a total balance of 3 452 MNOK,<br />
with a net interest-bearing debt of 799 MNOK.<br />
business areas<br />
<strong>TTS</strong> develops and supplies and delivers handling equipment to the<br />
maritime industry and to the oil and gas industry. In <strong>2010</strong>, operations<br />
were organised into three divisions.<br />
MARinE DiviSiOn<br />
MNOK <strong>2010</strong> 2009<br />
Turnover 2 230 2 326<br />
EBITDA 158.7 93.7<br />
EBITDA margin (%) 7.1 4.0<br />
The Marine division <strong>report</strong>ed a turnover that was somewhat lower<br />
than in 2009, however, income increased notably since the result<br />
<strong>for</strong> 2009 was affected by appropriations and write-downs. In <strong>2010</strong><br />
the Marine division has initiated a number of improvement ef<strong>for</strong>ts,<br />
among other things relating to procurement and delivery model.<br />
These ef<strong>for</strong>ts are described in more detail in the annual <strong>report</strong>.<br />
At the end of the year, the order backlog was 3 204 MNOK<br />
compared to 3 723 MNOK in 2009. The Order backlog includes<br />
50 % of the joint ventures.<br />
EnERGY DiviSiOn<br />
MNOK <strong>2010</strong> 2009<br />
Turnover 712 1 180<br />
EBITDA -168.6 -192.0<br />
EBITDA margin (%) -23.7 -16.3<br />
The level of activity within drilling and offshore equipment has<br />
remained low in <strong>2010</strong>, and together with low margins on existing<br />
contracts, as well as cost overruns, it resulted in the weak results<br />
seen in <strong>2010</strong>. In <strong>2010</strong> a number of initiatives have been taken to<br />
improve profitability, mainly relating to consolidation and efficiency<br />
improvement. Toward the end of <strong>2010</strong>, the Energy division<br />
strengthened its order backlog significantly, with two drilling<br />
equipment packages to the Prospector rigs, currently under<br />
construction in China, at a total value of approximately 460 MNOK.<br />
In April 2011 the division signed contracts <strong>for</strong> delivery of two<br />
additional drilling packages to the same client.<br />
At the end of <strong>2010</strong>, the division’s order backlog was 690 MNOK<br />
compared to 545 MNOK in 2009.<br />
PORT AnD LOGiSTicS DiviSiOn<br />
MNOK <strong>2010</strong> 2009<br />
Turnover 299 331<br />
EBITDA 20.6 19.6<br />
EBITDA margin (%) 6.9 5.9<br />
<strong>TTS</strong> GROUP 3-15<br />
BUSINESS AREAS 16-33<br />
CORPORATE GOVERNANCE 35-43<br />
DiREcTOR’S REPORT AnD AccOUnTS 45 -116<br />
ORGANISATION 118-123<br />
The division <strong>report</strong>ed a somewhat lower turnover compared to<br />
2009, but increased its profitability. The division has had a high<br />
level of activity as regards port equipment, and has improved its<br />
margins compared to 2009. The market <strong>for</strong> lifting equipment<br />
was fairly weak in <strong>2010</strong>. During <strong>2010</strong> there have been a number of<br />
adjustments to trim the cost level.<br />
At the end of <strong>2010</strong>, the order backlog was 102 MNOK compared<br />
to 242 MNOK at the end of 2009.<br />
47
Risk factors and risk management<br />
The group is exposed to various types of risks, such as market risk<br />
relating to the development relevant markets, financial risk relating<br />
to credit, liquidity and <strong>for</strong>eign currency, as well as operational risk<br />
relating, among other factors, to the execution of projects.<br />
On a monthly basis, the Board reviews operating <strong>report</strong>s from<br />
the administration. In addition to the continuous risk management,<br />
the Board and administration carry out specific risk analyses in<br />
connection with major investments, contract signing, as well as<br />
continuous risk analyses of projects.<br />
MARkET RiSk<br />
There are risks related to the market development of all the<br />
markets in which <strong>TTS</strong> is represented. <strong>TTS</strong> closely monitors market<br />
indicators such as contracting of vessels, rig utilisation and rate<br />
level.<br />
Contracting of newbuild <strong>for</strong> both vessels and drilling rigs are a<br />
risk factor <strong>for</strong> the group as it represents a significant part of the<br />
group’s market. Risk relating to aftersales and service is somewhat<br />
lower, but also here the demand is influenced by rate levels <strong>for</strong><br />
drilling rigs and transportation.<br />
At the start of 2011, <strong>TTS</strong> has a significant order backlog. As the<br />
delivery time from most of the equipment <strong>for</strong> <strong>TTS</strong> is between<br />
6 months to 2 years, <strong>TTS</strong> is exposed to market risk. Uncertainty in<br />
the global economy, entails an uncertainty in relation to the order<br />
backlog with regard to cancellations or postponements of orders.<br />
FinAnciAL RiSk<br />
<strong>TTS</strong> is exposed to financial risk which comprises credit risk, liquidity<br />
risk and currency risk.<br />
Credit risk is the potential financial losses should a contractual<br />
partner fail to fulfil his obligations. The customer base is differentiated,<br />
and with the exception of the past two years, the group has<br />
seen only a modest loss on accounts receivable. The development of<br />
the global economy in general, and of the ship building industry and<br />
offshore industry in particular, has resulted in an increased credit<br />
risk. On this basis, the group has implemented actions to limit<br />
risk exposure, by, among other factors, evaluating all our business<br />
partners.<br />
In September <strong>2010</strong>, <strong>TTS</strong> reached a settlement with Ability<br />
Drilling’s bankruptcy estate by means of court-administered<br />
mediation. The settlement entailed that <strong>TTS</strong> purchased a land rig<br />
from the bankruptcy estate <strong>for</strong> 75 MNOK with an interest-bearing<br />
seller’s credit <strong>for</strong> the entire amount over two years, while all other<br />
claims between the parties are waived.<br />
Liquidity risk is the risk of <strong>TTS</strong> being unable to fulfil its financial<br />
48<br />
obligations as they fall due. At 31 December <strong>2010</strong>, <strong>TTS</strong> has an<br />
unused bank overdraft of 249 MNOK. <strong>TTS</strong> further strengthened<br />
the group’s liquidity in January 2011, by issuing a subordinated<br />
convertible loan of 200 MNOK.<br />
The group has implemented measures to reduce its working<br />
capital.The group is actively working to sell three land rigs, which<br />
at 31 December are booked as trading stock. <strong>TTS</strong> expects a large<br />
portion of the sales proceeds from these rigs to be used <strong>for</strong> down<br />
payment of loans. Furthermore, <strong>TTS</strong> has initiated a project to<br />
optimise the company’s routines and processes in order to reduce<br />
the working capital requirement.<br />
The group has considerable liquidity located outside of Norway.<br />
<strong>TTS</strong> is working toward the most efficient liquidity flow between<br />
the parent company and the various subsidiaries located abroad,<br />
such as by including more companies in the group’s group account<br />
system.<br />
Covenant requirements on the company’s bond loan are equity<br />
of a minimum of 550 MNOK and an equity ratio of 22.5 %. <strong>TTS</strong><br />
fulfils the covenants requirement at the end of <strong>2010</strong>. The bond<br />
loan falls due 24 May 2012.<br />
The group’s agreement with the bank syndicate headed by<br />
Nordea, is renegotiated annually, and the agreement falls due<br />
31 December 2011.<br />
According to the agreement, proceeds from the sale of property<br />
shall be used to pay off a supplementary facility of 150 MNOK<br />
during the course of the year, and at the latest by 31 December<br />
2011.<br />
The group is exposed to a considerable currency risk as a result<br />
of its high degree of export trade. The group’s primary trading<br />
currencies are EUR and USD. The group’s policy is to limit currency<br />
risk through hedging all contractual income.<br />
OPERATiOnAL RiSk<br />
The group’s deliveries are primarily organised in the <strong>for</strong>m of<br />
projects. Operational risks in projects are mainly related to project<br />
management and technical execution of projects.<br />
The group is continuously working to improve its work processes,<br />
develop competence and project management tools. The company<br />
has carried out considerable development work on new products in<br />
the past year and expects this to contribute to a reduction of future<br />
operational risk related to sale and implementation of new projects.
Organisation<br />
ORGAniSATiOn AnD EnviROnMEnT<br />
At the end of <strong>2010</strong>, the number of employees in the <strong>TTS</strong> <strong>Group</strong><br />
was 1 057.<br />
Absence due to illness was 3.1 % in <strong>2010</strong>, compared to 2.8 % in<br />
2009. 23 minor personal injuries were <strong>report</strong>ed during the year,<br />
compared to 12 in 2009. The number of days of absence due to<br />
personal injuries was 115 days compared to 60 days last year. <strong>TTS</strong><br />
is systematically and continuously striving to achieve improvements<br />
with respect to Health, Safety and Environment (HSE).<strong>TTS</strong> has<br />
prepared its own HSE Handbook, which has been translated into<br />
most of the languages native to the group’s employees.<br />
<strong>TTS</strong> has committed considerable resources in establishing a<br />
cross-border connection between the managers and employees. In<br />
all of the group’s companies and divisions, work is done to establish<br />
and maintain a joint corporate culture based on the core values<br />
integrity, openness, loyalty and initiative. These core values shall<br />
influence <strong>TTS</strong>’s activities, so that they contribute to cooperation<br />
and progress <strong>for</strong> each and everyone in the <strong>TTS</strong> <strong>Group</strong>.<br />
<strong>TTS</strong>’ activities are primarily related to sale, design and engineering,<br />
as well as assembly and testing of equipment. Assembly<br />
and testing are based on a limited use of chemicals that may be<br />
harmful to human health or to the environment.<br />
The products supplied by <strong>TTS</strong> are primarily electro-hydrauli cally<br />
powered, and there is little risk of environmental pollution. The<br />
<strong>TTS</strong> <strong>Group</strong>’s operations are not regulated by licenses or regulatory<br />
orders.<br />
EqUAL OPPORTUniTiES<br />
<strong>TTS</strong> aims to ensure equal working conditions, equal opportunities<br />
and equal treatment regardless of gender, religion or ethnic background.<br />
The aim is equal treatment of all with regard to professional<br />
and personal development.<br />
Among <strong>TTS</strong>’ employees, most of them have engineering expertise.<br />
Women are typically underrepresented in this field; of the total<br />
work<strong>for</strong>ce of 1 057 employees, 215 of these are women, constituting<br />
20.4 % (19.6 % in Norway). 87 of the female in <strong>TTS</strong> hold positions<br />
within administration, finance or sales and marketing, giving a<br />
43.9 % of women within these functions.<br />
Three of the six board members of <strong>TTS</strong> <strong>Group</strong> <strong>ASA</strong> are women;<br />
two of these were elected by the shareholders and one was elected<br />
by the employees.<br />
Pursuant to the act prohibiting discrimination based on disability<br />
(the Norwegian Anti-Discrimination and Accessibility Act), <strong>TTS</strong><br />
has striven to locate its operations with an accessibility and office<br />
<strong>TTS</strong> GROUP 3-15<br />
BUSINESS AREAS 16-33<br />
CORPORATE GOVERNANCE 35-43<br />
DiREcTOR’S REPORT AnD AccOUnTS 45 -116<br />
ORGANISATION 118-123<br />
layout that does not hinder access <strong>for</strong> employees who depend upon<br />
wheelchairs. It is furthermore the company’s policy to adapt the<br />
workplace <strong>for</strong> employees with hearing of sight impairments.<br />
bOARD OF DiREcTORS<br />
<strong>TTS</strong> <strong>Group</strong> <strong>ASA</strong>’s Chairman of the Board of Directors is Trym Skeie.<br />
At the annual shareholders <strong>2010</strong> meeting Nils Aardal announced<br />
that he should not be considered <strong>for</strong> election and Rune Selmar was<br />
elected to the board of directors. In December <strong>2010</strong>, Rune Selmar<br />
resigned from the Board as a consequence of accepting a new<br />
position with Norfund.<br />
In September, the employee representatives Jarle Dyrdal and Karen<br />
Mørkestøl were elected to the Board, both from <strong>TTS</strong> Energy AS in<br />
Kristiansand.<br />
AUDiTOR<br />
KPMG AS was chosen to be the company’s auditor <strong>for</strong> <strong>2010</strong>.<br />
corporate governance<br />
inTRODUcTiOn<br />
A more detailed account of the applicable principles <strong>for</strong> corporate<br />
governance is provided in this Annual Report. The same applies to<br />
election of a new Board of Directors and nominating committee<br />
at the Annual General Meeting on 3 June <strong>2010</strong>, as well as the<br />
employee’s election of members to the Board.<br />
cAPiTAL STRUcTURE<br />
At the start of <strong>2010</strong>, the company’s share capital was 33 954 139.50<br />
NOK divided into 67 908 279 shares at a value of 0.50 NOK each.<br />
In July a private placement was done <strong>for</strong> a total of 6 722 920<br />
shares at a share price of 6.30 NOK.<br />
At the end of <strong>2010</strong>, the company’s share capital was 37 315 599.50<br />
NOK divided into 74 631 199 shares at a nominal value of 0.50 NOK<br />
each. The company holds 35 210 own shares.<br />
49
3-15 <strong>TTS</strong> GROUP<br />
16-33 BUSINESS AREAS<br />
35-43 CORPORATE GOVERNANCE<br />
45 -116 DiREcTOR’S REPORT AnD AccOUnTS<br />
118-123 ORGANISATION<br />
Future prospects<br />
The financial crisis and subsequent crisis in the market economy,<br />
has placed particular demands on management and risk control of<br />
operations in <strong>TTS</strong>. The Board is satisfied that the company in <strong>2010</strong><br />
succeeded in strengthening the financial basis <strong>for</strong> it operations<br />
through increasing its capital, establishing a new loan and renegotiating<br />
the company’s bond loan at market terms.<br />
The Board evaluates the short-term market situation to be stable.<br />
For the Energy division demand <strong>for</strong> rigs and rig equipment has<br />
improved. In the Port and Logistic division the market has improved<br />
somewhat while the market <strong>for</strong> the Marine is expected to be<br />
unchanged in the short term.<br />
50<br />
Bergen, 13 April 2011<br />
THE BOARD OF <strong>TTS</strong> GROUP <strong>ASA</strong><br />
Allocation of annual profit <strong>for</strong> <strong>TTS</strong> <strong>Group</strong> <strong>ASA</strong><br />
In <strong>2010</strong>, the group’s net loss was 197 MNOK. The equity at<br />
31 December <strong>2010</strong> was 803 MNOK.<br />
<strong>TTS</strong> <strong>Group</strong> <strong>ASA</strong> <strong>report</strong>ed a net loss in <strong>2010</strong> of -253 MNOK, and<br />
the equity at 31 December <strong>2010</strong> was 622 MNOK.<br />
The Board proposes that <strong>TTS</strong> <strong>Group</strong> <strong>ASA</strong>’s negative result <strong>for</strong><br />
<strong>2010</strong> is covered by Other Equity Capital. The Board proposes that<br />
there shall be no payment of dividend to the shareholders.<br />
Trym Skeie Bjarne Skeie Anne Breive<br />
CHAIRMAN BOARD MEMBER BOARD MEMBER<br />
Kjerstin Fyllingen Jarle Dyrdal Karen T. Mørkestøl<br />
BOARD MEMBER BOARD MEMBER BOARD MEMBER<br />
Johannes D. Neteland<br />
PRESIDENT & CEO
consolidated statement<br />
of comprehensive income<br />
<strong>TTS</strong> GROUP<br />
1 jAnUARY - 31 DEcEMbER<br />
(AMOUNTS IN NOK 1000) IFRS IFRS<br />
NOTES <strong>2010</strong> 2009<br />
OPERATING REVENUE<br />
Project revenue 1 3 225 819 3 784 087<br />
Other income 14 990 41 232<br />
Total revenue and income 3 240 809 3 825 319<br />
OPERATING ExPENSES<br />
Cost of sales 2 396 428 2 900 892<br />
Personnel costs 4, 5 617 148 663 467<br />
Depreciation of fixed assets 6, 7 51 979 47 306<br />
Other depreciations/amortisation 8 0 99 229<br />
Other operating expenses 18 233 609 277 917<br />
Losses on accounts receivable 20 848 88 949<br />
Income from investments in joint ventures 10 -30 936 -21 641<br />
Total operating expenses 3 289 076 4 056 118<br />
Operating profit/loss -48 267 -230 800<br />
FINANCIAL INCOME AND ExPENSES<br />
Other interest income 22 17 994 24 459<br />
Other financial income 22 26 898 37 581<br />
Other interest expenses 22 -146 426 -97 337<br />
Other financial expenses 22 -6 302 -45 844<br />
Net financial items -107 836 -81 142<br />
Profit be<strong>for</strong>e income tax -156 103 -311 942<br />
Income tax expenses 14 40 553 -63 460<br />
Profit <strong>for</strong> the period 1 -196 656 -248 482<br />
STATEMENT OF COMPREHENSIVE INCOME FOR THE PERIOD 1 JANUARy TO 31 DECEMBER<br />
Foreign currency differences 25 21 998 -41 337<br />
Total comprehensive income <strong>for</strong> the period 1 -174 658 -289 819<br />
Earnings per share (NOK) 23 -2.76 -5,72<br />
Diluted earnings per share (NOK) 23 -2.74 -5,63<br />
1) Profit <strong>for</strong> the period and total comprehensive income have been allocated to the owners of the parent company.<br />
<strong>TTS</strong> GROUP 3-15<br />
BUSINESS AREAS 16-33<br />
CORPORATE GOVERNANCE 35-43<br />
DiREcTOR’S REPORT AnD AccOUnTS 45 -116<br />
ORGANISATION 118-123<br />
51
consolidated statement of financial position<br />
<strong>TTS</strong> GROUP<br />
ASSETS<br />
(AMOUNTS IN NOK 1000) IFRS IFRS<br />
NOTES <strong>2010</strong> 2009<br />
non-current assets<br />
INTANGIBLE ASSETS<br />
Deferred tax assets 14 162 460 187 630<br />
Research and development 7 270 659 279 818<br />
Licences and patents 7 14 568 10 708<br />
Other intangible assets 7 3 706 3 575<br />
Goodwill 7 827 184 828 083<br />
Total intangible assets 1 278 577 1 309 814<br />
FIxED ASSETS<br />
Property 6 14 569 13 489<br />
Buildings 6 20 584 27 040<br />
Machinery and vehicles 6 14 490 24 111<br />
Furniture, office-, and computer equipment 6 71 059 65 143<br />
Total fixed assets 120 702 129 783<br />
FINANCIAL FIxED ASSETS<br />
Investments in joint ventures 10, 19 120 730 93 960<br />
Investments in shares 8 222 1 945<br />
Other receivables 11 0 5 584<br />
Pensions 5 7 808 9 668<br />
Total financial fixed assets 128 760 111 157<br />
Total assets 1 528 039 1 550 755<br />
current assets<br />
Inventories 3 422 587 420 495<br />
Work in progress 3 0 41 693<br />
Total inventories 422 587 462 188<br />
ACCOUNTS RECEIVABLE<br />
Trade receivables 11 488 799 565 141<br />
Other receivables 11 192 717 192 348<br />
Acquired, non-invoiced production 2 368 057 456 185<br />
Derivative financial instruments 20 48 777 53 210<br />
Prepayments to suppliers 2 130 690 217 741<br />
Total receivables 1 229 040 1 484 625<br />
Bank deposits, cash in hand, etc. 15 272 331 191 907<br />
Total current assets 1 923 959 2 138 720<br />
Total assets 3 451 998 3 689 474<br />
52
EqUiTY AnD LiAbiLiTiES<br />
(AMOUNTS IN NOK 1000) IFRS IFRS<br />
NOTES <strong>2010</strong> 2009<br />
Equity<br />
Issued share capital 16 37 316 33 954<br />
Treasury shares 16 -18 -18<br />
Share premium reserve 16 376 057 337 911<br />
Other equity 16 389 380 564 036<br />
Total equity 802 734 935 883<br />
Liabilities<br />
PROVISIONS FOR LIABILITES<br />
Deferred tax 14 25 559 22 339<br />
Total provisions <strong>for</strong> liabilites 25 559 22 339<br />
OTHER LONG-TERM LIABILITIES<br />
Bond loan 12, 13 400 000 400 000<br />
Debt to financial institutions 45 132 30 537<br />
Other long-term liabilities 75 000 0<br />
Total other long-term liabilities 520 132 430 537<br />
CURRENT LIABILITIES<br />
Debt to credit institutions 13, 15 550 758 600 005<br />
Payables to suppliers 332 513 339 466<br />
Income tax payable 14 5 680 19 308<br />
Other taxes payable 33 667 37 706<br />
Prepayments from customers 2 447 214 639 938<br />
Non-invoiced production costs, suppliers 2 336 732 149 791<br />
Derivative financial instruments 20 69 666 91 876<br />
Other current liabilities 17, 21 327 342 422 624<br />
Total current liabilities 2 103 572 2 300 715<br />
Total liabilities 2 649 264 2 753 591<br />
Total equity and liabilities 3 451 998 3 689 474<br />
Bergen, 13 April 2011<br />
Board of Directors of <strong>TTS</strong> <strong>Group</strong> <strong>ASA</strong><br />
Trym Skeie Kjerstin Fyllingen Anne Breive Bjarne Skeie<br />
CHAIRMAN OF THE BOARD BOARD MEMBER BOARD MEMBER BOARD MEMBER<br />
Karen T. Mørkestøl Jarle Dyrdal Johannes D. Neteland<br />
BOARD MEMBER BOARD MEMBER CHIEF ExECUTIVE OFFICER<br />
<strong>TTS</strong> GROUP 3-15<br />
BUSINESS AREAS 16-33<br />
CORPORATE GOVERNANCE 35-43<br />
DiREcTOR’S REPORT AnD AccOUnTS 45 -116<br />
ORGANISATION 118-123<br />
53
consolidated statement of changes in equity<br />
<strong>TTS</strong> GROUP<br />
(iFRS)<br />
Treasury Share premium<br />
(AMOUNTS IN NOK 1000) NOTE Share capital shares reserve Other equity Total<br />
Equity as of 31.12.2008 12 954 -67 122 892 853 277 989 056<br />
Treasury shares 0 49 0 576 625<br />
New issue 16 21 000 0 231 000 0 252 000<br />
New issues expenses 16 0 0 -21 417 0 -21 417<br />
Option plans 16 0 0 5 437 0 5 437<br />
Net profit <strong>for</strong> the year 0 0 0 -289 818 -289 818<br />
Equity as of 31.12.2009 33 954 -18 337 912 564 035 935 883<br />
Treasury shares 0 0 0 0 0<br />
New issue 16 3 361 0 38 993 0 42 354<br />
New issues expenses 16 0 0 -847 0 -847<br />
Net profit <strong>for</strong> the year 0 0 0 -174 658 -174 658<br />
Equity as of 31.12.<strong>2010</strong> 37 316 -18 376 057 389 379 802 734<br />
54
consolidated cash flow statement<br />
<strong>TTS</strong> GROUP<br />
1 jAnUARY - 31 DEcEMbER<br />
(AMOUNTS IN NOK 1000)<br />
<strong>TTS</strong> GROUP 3-15<br />
BUSINESS AREAS 16-33<br />
CORPORATE GOVERNANCE 35-43<br />
DiREcTOR’S REPORT AnD AccOUnTS 45 -116<br />
ORGANISATION 118-123<br />
<strong>2010</strong> 2009<br />
cash flow from operating activities<br />
Profit/loss be<strong>for</strong>e tax -156 103 -311 942<br />
Income tax paid -19 308 -13 903<br />
Amortisation 51 979 47 305<br />
Depreciation shares 2 800 0<br />
Depreciation non-current assets/goodwill 0 99 229<br />
Net change in project accruals 169 395 283 209<br />
Interest cost 107 836 77 737<br />
Profit/loss from joint ventures -30 936 -21 641<br />
Difference between pension charges and payments to/from pension schemes 1 860 1 694<br />
Inventories, customers and suppliers 108 990 -371 704<br />
Other receivables and other short term liabilities -104 226 -148 813<br />
Net cash flow from operating activities 132 287 -358 829<br />
cash flow from investment activities<br />
Acquisition of subsidiaries, net of cash acquired 0 0<br />
Proceeds from sale of fixed assets 6 000 4 531<br />
Disbursements from acquisition of fixed assets -20 404 -44 674<br />
Disbursements on own developement -12 904 -68 218<br />
Payments on other liabilities 0 -2 185<br />
Foreign currency gains/loss related to investments 0 604<br />
Net cash flow from investment activities -27 308 -109 942<br />
cash flow from financing activities<br />
Proceeds from issuance of short-term/long-term debt 75 000 0<br />
Disbursement on short-term/long-term debt -114 710 -98 092<br />
Net change in bank overdraft facility 81 482 351 703<br />
Interest paid -107 836 -77 737<br />
Proceeds from issued new share capital 41 509 231 208<br />
Net cash flow from financing activities -24 555 407 082<br />
Net change in cash and cash equivalents 80 424 -61 689<br />
Cash and cash equivalents at the start of the period 191 907 267 2318<br />
Foreign currency gains/loss on cash and cash equivalents 0 -13 635<br />
Cash and cash equivalents at the end of the period 272 331 191 907<br />
This consists of:<br />
Bank deposits etc. 272 331 191 907<br />
55
Accounting principles<br />
<strong>TTS</strong> GROUP<br />
1. General in<strong>for</strong>mation<br />
<strong>TTS</strong> is a global company that creates and supplies handling equipment<br />
<strong>for</strong> ships, ports and offshore installations. Up to and including 2009,<br />
operations were organised into the five divisions; Dry Cargo Handling,<br />
Marine Cranes, Port and Material Handling, Deck Machinery and<br />
Drilling Equipment. As of 01.01.10, <strong>TTS</strong> will <strong>report</strong> on three divisions;<br />
Marine, Energy and Port and Logistics. The <strong>TTS</strong> group is among the<br />
leading suppliers in its market segments. For these notes, comparative<br />
figures <strong>for</strong> 2009 are converted to correspond to <strong>report</strong>ing on three<br />
divisions.<br />
<strong>TTS</strong> <strong>Group</strong> <strong>ASA</strong> is registered and domiciled in Norway, and its head<br />
office is located in Bergen. The group has companies in Sweden,<br />
Germany, Finland, China, USA, the Czech Republic, Italy, Canada,<br />
Singapore, Korea, Greece, Brazil and Mexico, as well as a branch office<br />
in Vietnam. The company is listed on the Oslo Stock Exchange.<br />
The consolidated accounts were approved by the Board on 13 April 2011.<br />
2. Summary of the most central accounting principles<br />
The most central accounting principles applied in the preparation of<br />
the consolidated accounts are described below. These principles have<br />
been applied identically to all the periods presented, unless otherwise<br />
stated in the description.<br />
2.1 basic principles<br />
The consolidated accounts <strong>for</strong> <strong>TTS</strong> <strong>Group</strong> <strong>ASA</strong> have been prepared<br />
in accordance with International Financial Reporting Standards (IFRS),<br />
as adopted by the European Union. Discretionary standards and<br />
interpretations as of 31.12.10 have not been implemented.<br />
The consolidated accounts have been prepared on the basis of the<br />
principle of historic cost, with the following modifications: Shares held<br />
available <strong>for</strong> sale, and financial derivatives, are obligations estimated<br />
to fair value in the profit and loss accounts.<br />
Preparation of the accounts according to IFRS requires the use of estimates.<br />
Furthermore, application of the company’s accounts principles<br />
requires that management per<strong>for</strong>ms evaluations. Areas that to a great<br />
extent involve such evaluations or high degree of complexity, or areas<br />
where assumptions and estimated are material to the consolidated<br />
accounts, are described in Item 4.<br />
NEW ACCOUNTING STANDARDS<br />
In January <strong>2010</strong>, the group has implemented the following new<br />
standards and interpretations:<br />
• IFRS 3 Business combinations (2008)<br />
• IAS 27 Consolidated and Separate Financial Statements (2008)<br />
• IFRIC 17 Distributions of non-cash assets to owner of the Company<br />
• IFRIC 18 Transfers of assets from customers<br />
None of these presently have any effect on the Financial statements.<br />
<strong>TTS</strong> GROUP 3-15<br />
BUSINESS AREAS 16-33<br />
CORPORATE GOVERNANCE 35-43<br />
DiREcTOR’S REPORT AnD AccOUnTS 45 -116<br />
ORGANISATION 118-123<br />
The following standards, changes and interpretations of existing<br />
standards are publicised and will be mandatory <strong>for</strong> the group to adhere<br />
to in the consolidated the Financial statements beginning 1 January<br />
2011 or later, but without the group having chosen early implementation.<br />
The effect of the implementation of standards, changes and interpretations,<br />
beyond what is stated below, is being assessed within the group.<br />
CHANGES TO IFRS 7 FINANCIAL INSTRUMENTS - DETAILS<br />
The change concerns a requirement of notes <strong>for</strong> transfers of financial<br />
assets in which the company remains involved. The changes are aimed<br />
to give users a better understanding of the exposure of the company<br />
transferring the financial assets. The implementation time <strong>for</strong> IFRS 7<br />
is set to 1 July 2011; however, the standard is still not approved by<br />
the EU. The group expects to implement the modified standard from<br />
1 January 2012.<br />
IFRS 9 FINANCIAL INSTRUMENTS<br />
IFRS 9 will replace the classification and measurement rules in IAS 39<br />
Financial Instruments: Recognition and Measurement <strong>for</strong> financial<br />
instruments. According to IFRS 9, financial assets with standard terms<br />
and conditions <strong>for</strong> debt shall be accounted as amortised costs, unless<br />
one chooses to recognise them at fair value, while other financial<br />
assets shall be accounted at fair value. The classification and measurement<br />
rules <strong>for</strong> financial obligations designated as fair value through<br />
profit and loss (fair value option), in which changes in value connected<br />
to own credit risk are distinguished and accounted over comprehensive<br />
income. The time of implementation <strong>for</strong> IFRS 9 is set to 1 January<br />
2013; however, the standard is still not approved by the EU.<br />
CHANGE TO IAS 32 FINANCIAL INSTRUMENTS - PRESENTATION-<br />
CLASSIFICATION OF RIGHTS ISSUES<br />
The change to IAS 32 implies that subscription rights issued in a<br />
currency other than the functional currency of the company shall be<br />
classifiable as equity. Time of implementation is set to 1 February <strong>2010</strong>.<br />
The group expects to apply the altered standard from 1 January 2011.<br />
IAS 24 (revised) In<strong>for</strong>mation about related parties. In relation to the<br />
applicable IAS 24, the revised standard includes a clarification and<br />
simplification of the definition of related parties. The revised standard<br />
also provides some relief in requirements of additional in<strong>for</strong>mation <strong>for</strong><br />
public enterprises. The time of implemen tation is set to 1 January 2011.<br />
The group expects to apply the revised IAS 24 from 1 January 2011.<br />
IFRIC 19 ExTINGUISHING FINANCIAL LIABILITIES WITH EQUITy<br />
INSTRUMENTS<br />
The interpretation provides guidance <strong>for</strong> accounting of transactions<br />
when a company reconciles the whole or parts of its financial<br />
obligations by issuing equity instruments, and applies when the debt<br />
conversion is done as a result of a renegotiation of the loan agreement.<br />
The issuing of equity instruments shall be measured to fair value and<br />
is seen as remuneration <strong>for</strong> settlement of the debt. The difference<br />
between book value of debt and fair value of equity instruments.<br />
57
shall be recognised through profit and loss. The interpretation has<br />
an implementation date of 1 July <strong>2010</strong>. The group expects to apply<br />
IFRIC 19 from 1 January 2011.<br />
IASB’S ANNUAL IMPROVEMENT PROJECT <strong>2010</strong><br />
Through its annual improvement project, IASB has resolved to change<br />
to a number of standards. These changes will be implemented with<br />
effect on 1 July <strong>2010</strong> and thereafter. The group expects to implement<br />
the changes from 1 January 2011. Furthermore, changes are approved<br />
in the following standards and interpretations, which are not expected<br />
to have any effect on the group:<br />
• IAS 12 Income Taxes<br />
• IFRC 14 IAS 19 – The Limit on a Defined Benefit Asset, Minimum<br />
Funding Requirements and their Interaction – Prepayments of a<br />
Minimum Funding Requirement<br />
2.2 consolidation principles<br />
A) SUBSIDIARIES<br />
Subsidiaries are all the units where the group has a controlling influence<br />
over the unit’s financial and operating strategy, normally through<br />
ownership of more than half of the voting capital. When determining<br />
whether controlling influence exists, the effect of potential voting<br />
rights that may be exercised or converted on the balance sheet date<br />
is included. Subsidiaries are consolidated from the point in time when<br />
control is transferred to the group and eliminated from consolidation<br />
when such control ends.<br />
The purchase method of accounting is applied <strong>for</strong> the acquisition of<br />
subsidiaries with operations. The historical acquisition cost is measured<br />
as the fair value of: assets rendered as compensation upon acquisition,<br />
equity instruments issued and liabilities incurred by the transfer of<br />
control. Identifiable assets acquired and liabilities assumed are recorded<br />
in the accounts at the date of acquisition at their fair value, independent<br />
of any non-controlling ownership interests. Goodwill is calculated as<br />
the sum of the compensation and the carrying value of non-controlling<br />
interests and the fair value of previously owned shares, with allowance<br />
<strong>for</strong> the net value of identifiable assets and liabilities calculated at<br />
the time of acquisition. Goodwill is not amortised but tested at least<br />
annually <strong>for</strong> impairment. In connection with an impairment assessment,<br />
goodwill is allocated to those cash-generating units or groups of<br />
cash-generating units that are expected to get synergy effects from<br />
the business acquisition.<br />
The part of the fair value of equity that exceeds the compensation<br />
(negative goodwill) is recognised in the profit and loss account at the<br />
time of acquisition; see Item 2.6.<br />
All intra-group transactions, outstanding accounts and unrealised<br />
gains between group companies are eliminated. Unrealised losses are<br />
eliminated, but considered an impairment indicator in relation to<br />
58<br />
write-down of the asset transferred. The accounting principles in<br />
subsidiaries are revised as required, in order to achieve compliance<br />
with the group’s accounting principles.<br />
B) JOINT VENTURES<br />
Joint ventures are units where the group by agreement has a controlling<br />
influence together with other parties, but not alone. Investments in<br />
joint ventures are recorded in the accounts according to the equity<br />
method. Investments in joint ventures are recorded in the accounts<br />
at the historical cost at the time of acquisition, and include goodwill<br />
(which is reduced by any subsequent write-downs) (ref. Item 2.6).<br />
The group’s share of the profit or loss in joint ventures is recognised in<br />
the profit and loss account and added to the value of the investments<br />
recognised in the balance sheet, together with other income and costs<br />
along with the share of equity changes not recognised in the profit and<br />
loss account. The group does not recognise its share of the losses in the<br />
profit and loss account if this entails that the value of the investment<br />
recognised in the balance sheet becomes negative (including unsecured<br />
claims against the unit), unless the group has assumed liabilities or<br />
granted guarantees <strong>for</strong> the joint venture company’s liabilities.<br />
The group’s share of unrealised gains on transactions between the<br />
group and the joint ventures are eliminated against the investment.<br />
The same applies to unrealised losses unless the transaction indicates a<br />
write-down of the asset transferred. The accounting principles in joint<br />
ventures have been revised as required, in order to achieve compliance<br />
with the group’s accounting principles.<br />
2.3 Segment in<strong>for</strong>mation<br />
The group presents the operating segments based on in<strong>for</strong>mation<br />
provided to the CEO, who is the group’s supreme decision-maker.<br />
An operating segment is a component of a company doing business<br />
which allows the company to receive revenues and incur expenses,<br />
including revenues and expenses related to transactions with other<br />
components of the same company.<br />
The earnings of the operating segment are reviewed regularly by the<br />
segment manager and the central executive management to consider<br />
the need <strong>for</strong> allocating resources and assess the achievements of the<br />
operating segment. Separate financial in<strong>for</strong>mation is obtainable about<br />
the operating segment.<br />
Profit from operating segments that are <strong>report</strong>ed to the segment<br />
manager include items that are directly attributable to the segment,<br />
as well as posts which can be reasonably allocated to the segment.<br />
Items which cannot be distributed include expenses <strong>for</strong> the main office,<br />
as well as assets and liabilities related to tax. Investment costs consist<br />
of costs related to acquisition of property, facilities and equipment, as<br />
well as intangible assets with the exception of goodwill.
For <strong>2010</strong>, the company has three segments. These are Marine, Energy<br />
and Port and Logistics. This has been changed from 2009 when the<br />
segments were: Dry Cargo Handling, Marine Cranes, Port and Material<br />
Handling, Deck Machinery and Drilling Equipment. The change in the<br />
segment divisions follows the group’s consolidation of its activities<br />
and corporate structure. Comparable segment in<strong>for</strong>mation has been<br />
prepared.<br />
2.4 Foreign currency<br />
A) FUNCTIONAL AND PRESENTATION CURRENCIES<br />
The accounts of the individual units in the group are measured in the<br />
currency primarily used in the economic area where the unit operates<br />
(functional currency). The consolidated accounts are presented in<br />
Norwegian kroner (NOK), which is both the functional and presentation<br />
currency of the parent company.<br />
B) TRANSACTIONS AND BALANCE SHEET ITEMS<br />
Transactions involving <strong>for</strong>eign currencies are translated into the functional<br />
currency using the exchange rates that are in effect at the time of<br />
the transactions. Foreign currency gains and losses that arise from the<br />
payment of such transactions, and the translation of monetary items<br />
(assets and liabilities) in <strong>for</strong>eign currencies at the rates in effect at<br />
the end of the balance sheet date, are recognised in the profit and<br />
loss account. Non-monetary items measured at historical cost in<br />
<strong>for</strong>eign currency are translated into functional currency at the time<br />
of transaction.<br />
C) GROUP COMPANIES<br />
The profit and loss account and balance sheet <strong>for</strong> group units with<br />
a functional currency that differs from the presentation currency are<br />
translated as follows:<br />
i. the balance sheet is translated to the closing rate on the date<br />
of the balance sheet<br />
ii. profit and loss account is translated to the average rate during<br />
the year<br />
iii. translation differences are entered directly against equity and<br />
specified separately<br />
Goodwill associated with the acquisition of a <strong>for</strong>eign unit is allocated<br />
to the acquired unit, and translated at the rate in effect on the date<br />
of the balance sheet. This is <strong>for</strong> acquisitions from 2004 and later.<br />
2.5 Tangible fixed assets<br />
Tangible fixed assets are recorded in the accounts at historical cost less<br />
accumulated depreciation and accumulated writedowns. Historical cost<br />
includes the costs directly related to the acquisition of the fixed asset.<br />
Subsequent expenses are added to the value of the fixed asset on the<br />
balance sheet or recorded separately on the balance sheet, where it<br />
is likely that the future economic benefits associated with the expense<br />
will accrue to the group, and the expense can be measured reliably.<br />
Other repair and maintenance costs are carried to the profit and loss<br />
account in the period when the expenses are incurred.<br />
Land is not depreciated. Other fixed assets are depreciated based on<br />
the straight-line method, so that the historical cost of the fixed asset<br />
is depreciated to the residual value over expected useful life, which is:<br />
Buildings 50 years<br />
Machinery and vehicles 3-5 years<br />
Fixtures/office equipment 5 years<br />
Computer equipment 3 years<br />
<strong>TTS</strong> GROUP 3-15<br />
BUSINESS AREAS 16-33<br />
CORPORATE GOVERNANCE 35-43<br />
DiREcTOR’S REPORT AnD AccOUnTS 45 -116<br />
ORGANISATION 118-123<br />
Depreciation on tangible fixed assets is recognised on a separate line<br />
in the profit and loss account.<br />
The assessment of indicators related to possible revaluation requirements<br />
is monitored continously. When the book value of the fixed asset is<br />
higher than the estimated recoverable amount, the value is written<br />
down to the recoverable amount.<br />
Gains and losses on disposals are recognised in the profit and loss<br />
account and represent the difference between the sales price and book<br />
value.<br />
Depreciation methods, useful lives and residual values are assessed at<br />
each balance sheet date and adjusted if necessary.<br />
2.6 intangible assets<br />
A) GOODWILL<br />
Goodwill is the difference between the historical cost of the acquisition of<br />
a business and the fair value of the group’s share of the net identifiable<br />
assets in the business at the time of the acquisition. Goodwill from<br />
the acquisition of subsidiaries is classified as an intangible fixed asset,<br />
according to per<strong>for</strong>med analysis of acquisition showing the distribution<br />
of added values between goodwill and other assets. Goodwill associated<br />
with the acquisition of an interest in joint ventures is included in the<br />
investments in joint ventures according to equity method. Goodwill is<br />
tested annually <strong>for</strong> impairment in value and recognised in the balance<br />
sheet at historical cost less write-downs. The write-down of goodwill<br />
is not reversible.<br />
B) PATENTS, TECHNOLOGy AND DEVELOPMENT<br />
Patents and technology have limited useful life, and are recorded at<br />
historical cost in the balance sheet less depreciation. Patents and<br />
technology are depreciated by the straight-line method over their<br />
expected useful life (2 to 15 years).<br />
Development costs associated with market surveys, market development<br />
and the development of new products are normally charged against<br />
operating income as they are incurred. Development related to orders<br />
is charged directly to the individual projects. For certain extraordinary<br />
59
projects, the development costs are recorded in the balance sheet, ref.<br />
Note 7. In such cases the development costs are depreciated over their<br />
expected useful life (2 to 15 years).<br />
Depreciation of intangible fixed assets is recognised on a separate line<br />
in the profit and loss account.<br />
C) RESEARCH AND DEVELOPMENT<br />
Expenses <strong>for</strong> research activities, to acquire new scientific or technical<br />
knowledge, are recognized in the profit and loss as incurred.<br />
Development activities include design or planning of production of<br />
new or significantly improved products and processes.<br />
Development costs are capitalized only to the extent that they can be<br />
reliably measured, the product or process is technically or commercially<br />
feasible, future financial benefits are likely, and the group intends and<br />
has sufficient resources to complete the development, and to sell or<br />
use the asset. Capitalized development expenses include materials,<br />
direct labour, directly attributable overheads and capitalized borrowing<br />
costs. Other development expenditure is recognised in the profit and<br />
loss when incurred.<br />
Capitalised development expenses are recognised at cost less accumulated<br />
amortisation and accumulated impairment losses.<br />
2.7 Financial assets<br />
The group classifies financial assets into the following categories:<br />
a) loans and receivables<br />
b) assets available <strong>for</strong> sale (investments in shares)<br />
c) assets at fair value in the profit and loss account (derivatives)<br />
A) LOANS AND OTHER RECEIVABLES<br />
Loans and receivables are non-derivative financial assets with payments<br />
that are fixed or fixable and that are not realised in an active market.<br />
They are classified as current assets, unless they mature later than<br />
12 months after the date of the balance sheet. In this case they are<br />
classified as fixed assets. Loans and receivables are initially recognised<br />
at fair value plus directly attributable transaction costs. After initial<br />
recognition, loans and receivables are measured at amortised cost using<br />
the effective interest method, less any impairment losses.<br />
Loans and receivables consist of accounts receivable and other outstanding<br />
claims.<br />
B) ASSETS AVAILABLE FOR SALE (INVESTMENTS IN SHARES)<br />
Financial assets available <strong>for</strong> sale are non-derivative financial assets<br />
publicly communicated as being available <strong>for</strong> sale, and which are<br />
not classified in any of the other categories. Investments in shares<br />
are included in fixed assets unless management intends to sell the<br />
investment within 12 months from the date of the balance sheet.<br />
60<br />
Investments are assessed at fair value on the balance sheet date.<br />
Any changes in fair value are charged directly against comprehensive<br />
income and presented as revaluation reserve in the equity. However,<br />
this does not apply to impairment losses and exchange rate differences<br />
on equity instruments available <strong>for</strong> sale. When an investment is<br />
derecognised, the cumulative gain or loss from comprehensive income<br />
is transferred to the result.<br />
C) ASSETS TO FAIR VALUE OVER PROFIT AND LOSS<br />
Ref. Item 2.9.<br />
2.8 Leases<br />
Leases of property, plant and equipment at terms that in all material<br />
aspects transfer the risks and rewards of ownership to the group<br />
are classified as finance leases. Finance leases are capitalized at the<br />
commencement of the lease at the lower of the fair value of the leased<br />
property or the present value of the minimum lease payments.<br />
Lease payments are apportioned between finance charges and reduction<br />
of lease liabilities.<br />
Leases where a significant portion of the risks and rewards of ownership<br />
are retained by the lessor are classified as operating leases.<br />
Payments made under operating leases are posted to the profit and<br />
loss account on a straight-line basis over the period of the lease.<br />
2.9 Derivatives and hedging<br />
In accordance with adopted guidelines and the group’s strategy, the<br />
group utilises hedging of contractual income in a <strong>for</strong>eign currency at<br />
the date of signature of the contract. The same may apply to individual<br />
larger sub-contracts in <strong>for</strong>eign currencies.<br />
FAIR VALUE HEDGING<br />
The group has financial derivatives to hedge currency risk. In the initial<br />
calculation, derivatives are measured at fair value. Attributable transaction<br />
costs are recognised in the profit and loss as they are incurred.<br />
The group only enters into <strong>for</strong>ward currency contracts that qualify <strong>for</strong><br />
fair value hedging.<br />
At the establishment of a hedging transaction, the group undertakes<br />
documentation of the relation between hedging instruments and hedge<br />
objects. Furthermore, the group documents whether the derivatives<br />
used are efficient in balancing changes to the fair value related to<br />
the hedge objects. Such evaluations are documented both at the start<br />
of the hedge and continuously throughout the hedging period.<br />
Fair value of the derivatives used <strong>for</strong> hedging are set out in Note 20.<br />
Fair value of the derivatives is classified as current assets or short-term<br />
liabilities, as the hedges and derivatives essentially fall due within<br />
12 months.
Changes to fair value of the derivatives are recognised in the profit<br />
and loss account along with the change in fair value associated with<br />
the corresponding hedge asset or liability. Profit or loss attributable<br />
to the hedged risk is recognised as project revenue if it is associated<br />
with hedging of contract revenue and under operational expenses if it<br />
is associated with hedging of contract costs.<br />
The ineffective portion of the value hedge is recognised as change in<br />
value of derivatives in revenues and operating expenses.<br />
In the event that the hedge no longer fulfils the criteria <strong>for</strong> hedge<br />
accounting, the derivative is carried at fair value to the profit and<br />
loss account. This applies to derivatives where the underlying delivery<br />
contract has been cancelled.<br />
DERIVATIVES AT FAIR VALUE CARRIED TO PROFIT AND LOSS<br />
Derivatives that do not fulfil the criteria <strong>for</strong> hedge accounting are<br />
carried at fair value to the profit and loss account. Changes to the fair<br />
value of the derivatives are recognised in the profit and loss statement<br />
as financial expenses and financial income.<br />
2.10 inventories<br />
Inventories are valued at the lower of their historical cost or net<br />
realisable value. The historical cost is calculated by means of the<br />
first-in, first-out principle (FIFO). For finished goods and work in<br />
progress, the historical cost consists of product design expenses,<br />
consumption of materials, direct wage costs, other direct costs, and<br />
indirect production costs (based on a normal capacity level).<br />
Inventories established as a result of a project being cancelled are<br />
recognised as inventory.<br />
2.11 Accounts receivable<br />
Accounts receivable are measured upon initial recognition in the<br />
balance sheet at fair value. For subsequent measurements, accounts<br />
receivables are assessed at amortised cost determined using the<br />
effective interest method, and less provision <strong>for</strong> impairment. Provisions<br />
<strong>for</strong> losses are recognised when there are objective indicators that the<br />
group will not receive settlement in accordance with the original terms.<br />
Considerable financial difficulties on part of the customer, likelihood of<br />
bankruptcy on part of the customer and significant delays of payment,<br />
are all deemed to be indicators of the need to write down accounts<br />
receivables. Changes in the provisions are recognised in the profit and<br />
loss account as losses on accounts receivable. Receivables in <strong>for</strong>eign<br />
currencies are converted to NOK at the exchange rate on the balance<br />
sheet date.<br />
2.12 cash and cash equivalents<br />
Cash and cash equivalents consist of cash and bank deposits. Bank<br />
deposits in <strong>for</strong>eign currencies are assessed to the exchange rate on the<br />
balance sheet date. Withdrawals from the bank overdraft constitute<br />
part of current liabilities.<br />
2.13 Share capital and premium<br />
Ordinary shares are classified as equity.<br />
<strong>TTS</strong> GROUP 3-15<br />
BUSINESS AREAS 16-33<br />
CORPORATE GOVERNANCE 35-43<br />
DiREcTOR’S REPORT AnD AccOUnTS 45 -116<br />
ORGANISATION 118-123<br />
Expenses that are directly attributable to the issuance of new shares or<br />
options less taxes are entered against equity as a reduction in proceeds.<br />
When the company’s own shares are purchased, the consideration,<br />
including any transaction costs less tax, is entered as a reduction of the<br />
equity (attributable to the company’s shareholders). If the company’s<br />
own shares are subsequently sold or reissued, the proceeds are entered<br />
as an increase in the equity attributable to the company’s shareholders.<br />
2.14 Loans<br />
The group initially recognises the bond debt on the issue date. All other<br />
financial liabilities are initially recognised on the agreement date, when<br />
the group becomes a party to the instrument’s contractual provisions.<br />
The group derecognises a financial liability when the contractual obligations<br />
are satisfied or cancelled.<br />
The group has the following non-derivative financial liabilities: loans,<br />
overdrafts, accounts payable and other liabilities.<br />
Non-derivative financial liabilities are initially recognised at fair value<br />
plus directly attributable transaction costs. After initial recognition,<br />
liabilities are measured at amortised costs using the effective interest<br />
method.<br />
Loans are classified as current liabilities unless there is an unconditional<br />
right to postpone payment of the debt by more than 12 months from<br />
the date of the balance sheet. The following year’s payment is classified<br />
as short-term debt.<br />
2.15 Accounts payable<br />
Accounts payable are measured at fair value upon initial recognition in<br />
the balance sheet. Upon subsequent measurement, accounts payable<br />
are valued at amortised cost using the effective interest rate method.<br />
2.16 Taxes<br />
Tax in the profit and loss account comprises both tax payable <strong>for</strong> the<br />
period and change in deferred tax. Period tax and deferred tax are<br />
recognised in the profit and loss, with the exception of tax on items<br />
related to business mergers or taxes recognised directly in equity or<br />
comprehensive income.<br />
Periodic tax is payable tax or tax receivables on taxable income or loss<br />
<strong>for</strong> the year, based on tax rates adopted or principally adopted on the<br />
balance sheet date. Revision of the estimated periodic tax <strong>for</strong> previous<br />
years is included in the figures.<br />
Deferred tax is calculated on all temporary differences between the tax<br />
and accounting values of assets and liabilities.<br />
61
For the following temporary differences, no deferred tax is recognised:<br />
• initial recognition of assets or liabilities in a transaction that is not<br />
a business combination and that does not affect accounting or taxbased<br />
results upon inclusion<br />
• differences related to investments in subsidiaries to the extent<br />
that it is likely that these differences will not be reversed in the<br />
<strong>for</strong>eseeable future<br />
• tax-increasing differences upon initial recognition of goodwill<br />
Temporary differences are only offset between the Norwegian companies<br />
in the group. Deferred tax is stipulated using tax rates and tax laws<br />
adopted or in all material aspects adopted on the balance sheet<br />
date, and which presumably may be utilised when the deferred tax<br />
advantage is realised or when the deferred tax is settled.<br />
Deferred tax assets are recognised on the balance sheet provided future<br />
taxable income is probable and the temporary differences can be offset<br />
against this income.<br />
2.17 Pension obligations, bonus schemes and other<br />
compensation schemes <strong>for</strong> employees<br />
A) PENSION OBLIGATIONS<br />
The companies in the group have different pension schemes. The pension<br />
schemes are financed in general by payments to insurance companies<br />
or pension funds, as determined by periodic actuarial calculations. The<br />
group has both defined contribution plans and defined benefit plans.<br />
A contribution plan is a pension scheme in which the group pays fixed<br />
contributions to a separate legal entity. The group has no legal or other<br />
obligation to pay further contributions if the insurance company does<br />
not have sufficient assets to pay all employee benefits relating to<br />
employee service in current and prior periods.<br />
For defined contribution plans, the group pays contributions to publicly<br />
or privately administered pension insurance plans on a mandatory,<br />
contractual or voluntary basis. The group does not have any further<br />
payment obligations after the contributions have been paid. Contributions<br />
are recorded as a payroll expense in the accounts as they fall<br />
due. Contributions paid in advance are recognised as an asset in the<br />
accounts if the contribution can be refunded or can reduce future<br />
payments.<br />
A defined benefit plan is a pension scheme that is not a defined<br />
contribution plan. A defined benefit plan is typically a pension scheme<br />
defining the pension payments which employees will receive upon<br />
retirement. Pension payments are normally dependent on one or more<br />
factors such as age, years of service <strong>for</strong> the company and salary level.<br />
Net liability <strong>for</strong> defined benefit pension plans is calculated <strong>for</strong> each<br />
plan by estimating the future benefits employees have earned <strong>for</strong><br />
services rendered in the current or prior periods. The benefits are<br />
discounted to calculate present value, and the cost of pension earning<br />
<strong>for</strong> prior periods not yet recognised, along with the fair value of plan<br />
62<br />
assets, are deducted. The discount rate <strong>for</strong> Norwegian schemes is based<br />
on the interest rate on 10-year Norwegian government bonds at the<br />
balance sheet date, adjusted to reflect the maturity of pension liabilities.<br />
For <strong>for</strong>eign plans, the discount rate is based on the interest rate on<br />
a bond issued by a company with a high credit rating in the same<br />
currency as the benefits will be paid and with a maturity that is<br />
approximately equal to the maturity of the related pension liability.<br />
The pension obligation is calculated annually by independent actuaries<br />
using the projected unit credit method.<br />
Estimate deviations due to new in<strong>for</strong>mation or changes in the actuarial<br />
assumptions in excess of 10 % of the value of the pension resources<br />
or 10 % of the pension obligations will be recorded in the profit and<br />
loss account over a period that corresponds to the employees’ expected<br />
average remaining period of service.<br />
Changes in the pension plan’s benefits are entered as an expense or<br />
income on a current basis in the profit and loss account, unless the<br />
rights in accordance with the new pension plan are contingent on<br />
the employee remaining in service <strong>for</strong> a specified period of time<br />
(accrual period). In this case the cost related to the change in benefits<br />
is amortised linearly over the accrual period.<br />
The employer’s share of National Insurance contributions are charged<br />
against income based on the pension premiums paid, as well as the<br />
accrued change in the net pension obligation.<br />
Gains and losses on the curtailment or settlement of a defined<br />
contribution plan are recognised at the time that the curtailment<br />
or settlement occurs. A curtailment occurs when the group adopts<br />
a significant reduction in the number of employees covered by the<br />
plan or changes the terms of a defined contribution plan such that<br />
a significant proportion if current employees’ future earnings will no<br />
longer qualify <strong>for</strong> benefits, or qualify only <strong>for</strong> reduced benefits.<br />
B) EMPLOyEE OPTIONS<br />
In accordance with authorities granted by the Annual General<br />
Meeting, the management of the company has been granted options<br />
to purchase shares in the parent company. The fair value of allotted<br />
options is calculated as part of the salary cost with a corresponding<br />
increase in equity. The fair value is measured on the date of allotment<br />
and distributed over the terms until the employee has worked up an<br />
unconditional right to exercise the options. Fair value of allotted<br />
options is estimated on the date of allotment using the Black & Sholes<br />
option pricing model. Ref. Note 16.<br />
C) GROUP BONUSES<br />
The group records a liability and a cost <strong>for</strong> any group bonuses. Whether<br />
the bonus shall be calculated and paid and the size of the bonus is<br />
dependent on the profit <strong>for</strong> the year. The bonus is paid to all of the<br />
employees in the following year.
2.18 Provisions<br />
The group recognises provisions <strong>for</strong> restructuring, legal requirements,<br />
etc., when: There is a legal or self-imposed obligation to do so as a<br />
result of earlier events, there is a preponderance of evidence that the<br />
obligation will be settled by a transfer of economic resources, and<br />
the size of the obligation can be estimated with an adequate degree<br />
of reliability.<br />
The group recognises provisions <strong>for</strong> expected guarantee liabilities based<br />
on experience and contract. Guarantee liabilities are recognised when<br />
the underlying products or services are sold. Additionally, the group<br />
recognises provisions <strong>for</strong> remaining work or claims from the customer<br />
regarding long-term construction contracts.<br />
Appropriations are measured at current value of expected payments<br />
in order to fulfil the obligation. A pre-tax discount rate is utilised,<br />
reflecting the present market situation and risk specific to that<br />
obligation. An increase in the obligation due to altered time frame is<br />
recognised on the balance sheet as a financial cost.<br />
2.19 Recognition of income<br />
The group’s revenue relates to long-term construction contracts, service<br />
contracts and after-sales.<br />
Income from the sale of goods and services is assessed at net fair value<br />
after the deduction of value added tax, returns, discounts and rebates.<br />
Revenue from the sale of goods is recognised when there is persuasive<br />
evidence, usually in the <strong>for</strong>m of signed sales agreement, that the most<br />
significant risks and benefits of owning the goods are transferred to<br />
the buyer, it is likely that the payment will be recovered, associated<br />
costs and possible return of goods can be estimated reliably, there is<br />
no involvement in the goods normally associated with owning, and<br />
the revenue can be reliably measured. The date of transfer of risks<br />
and benefits varies depending on the conditions of the individual sales<br />
contract.<br />
Revenue from delivery of services is recognised according to percentage<br />
of completion on the balance sheet date.<br />
Income from long-term production contracts are recognised in the<br />
balance sheet in accordance with guidelines in IAS 11, using the<br />
method of current settlement, ref. Item 2.20 <strong>for</strong> more detail. The<br />
group’s products are frequently sold with a warranty period of +/- two<br />
years. As <strong>for</strong> other matters, reference is made to in<strong>for</strong>mation regarding<br />
guarantee liabilities in paragraph 4 and Note 21.<br />
Intragroup revenue is eliminated.<br />
Interest is recognised in the profit and loss account over time in<br />
accordance with the effective interest method. If receivables are<br />
written down, the book value of the receivables are reduced to the<br />
recoverable amount.<br />
<strong>TTS</strong> GROUP 3-15<br />
BUSINESS AREAS 16-33<br />
CORPORATE GOVERNANCE 35-43<br />
DiREcTOR’S REPORT AnD AccOUnTS 45 -116<br />
ORGANISATION 118-123<br />
2.20 construction contracts<br />
Revenue from contracts includes original contract amount, as well as<br />
variation orders, disputed amounts and incentive bonuses to the extent<br />
that it is likely that the income is realised and reliable estimates are<br />
available.<br />
Revenue from long-term manufacturing projects is allocated in step<br />
with the degree of progress of the project, if the outcome of the<br />
transaction can be estimated in a reliable manner, according to IAS 11.<br />
Several methods are used to calculate the progress of projects,<br />
dependent on the method which each individual company considers<br />
to best demonstrate progress. The group’s and companies’ primary<br />
valuation method assumes that if there is no other reliable in<strong>for</strong>mation<br />
to measure, progress assessment shall be based on the measured cost<br />
divided by the expected cost. In some companies, progress is measured<br />
as accrued hours compared to the total estimated hours, while others<br />
measure progress according to time (weeks, months) spent compared<br />
to the estimated time it would take to manufacture the product.<br />
Finally, in some companies technical progress is measured, where<br />
the project is split into various activities and progress is measured<br />
against specific milestones <strong>for</strong> each activity, and where each activity<br />
is weighed in relation to how much of the total project it comprises.<br />
When the outcome of the transaction cannot be reliably estimated,<br />
only the revenue corresponding to accrued project costs will be entered<br />
as income. In the period where it is identified that a project will give<br />
a negative outcome, the estimated deficit on the contract will be fully<br />
allocated.<br />
Costs relating to manufacturing projects are allocated in step with<br />
the degree of progress on a level with the revenue.<br />
Upon establishing accrued costs <strong>for</strong> manufacturing contracts, purchasing<br />
relating to future activities of a contract will not be taken into account.<br />
The purchases/costs are posted as goods, advance payments or other<br />
liquid assets depending of type of costs.<br />
Incurred costs and profits received relating to all construction contracts<br />
in progress, where the incurred costs and profit received (less recognised<br />
losses) exceed the payments on-account invoiced, will be recorded<br />
on the balance sheet as an asset. The asset is classified as accrued,<br />
non-invoiced production. If on-account billings exceed costs incurred<br />
and recognised profits (less losses), this is recorded as received advance<br />
payments from customers as presented as current liabilities. The<br />
assessment is made <strong>for</strong> each contract at company level. There will be<br />
no other net allocation at corporate level.<br />
For terminated contracts, the loss is accounted as an expense. In<br />
assessing financial loss, the value of the inventory of which <strong>TTS</strong> <strong>Group</strong><br />
takes ownership is taken into account. The inventory is valued at the<br />
lowest of acquisition cost and fair value. Any payments received that<br />
the group has a contractual right to retain at termination are included<br />
in the calculation of the acquisition cost.<br />
63
2.21 impairment<br />
FINANCIAL ASSETS<br />
On the balance sheet date (<strong>report</strong>ing date), financial assets that are<br />
not measured at fair value through profit and loss, are measured with<br />
regard to whether there is objective indications of impairment. A financial<br />
asset is considered to be impaired if there are objective indications<br />
of one or more events having had a negative effect on the estimated<br />
future cash flow <strong>for</strong> the asset, and this can be reliably measured.<br />
Objective evidence that financial assets are impaired may be customer<br />
breach, change of outstanding claims on terms that the group would<br />
otherwise not have accepted, indications that a borrower or issuer<br />
will enter bankruptcy or closure of an active market <strong>for</strong> the security.<br />
For equity instruments, there will be objective evidence of impairment<br />
by significant or prolonged decline to below cost price.<br />
Impairment losses relating to a financial asset measured at amortised<br />
cost is the difference between the carrying value and the present value<br />
of estimated future cash flows discounted at the original effective<br />
interest rate. An impairment loss is recognised in the profit and loss<br />
account and the asset’s carrying value is reduced by the use of an<br />
allowance account.<br />
NON-FINANCIAL ASSETS<br />
On the balance sheet date (<strong>report</strong>ing date), assessment is made as to<br />
whether there are indications of depreciation relating to recognised<br />
value of non-financial assets, with the exception of stock and assets in<br />
relation to deferred tax. If such indications exist, the asset’s recoverable<br />
sum is estimated. For goodwill and intangible assets not yet available<br />
<strong>for</strong> use, or with an indeterminable useful life, the recoverable sum is<br />
estimated at the same time each year.<br />
The recoverable amount <strong>for</strong> an asset or cash-generating unit is the<br />
higher of value in use and disposal value less sales expenses. In the<br />
assessment of value in use, the estimated future cash flow is discounted<br />
to net present value, with a pretax market-based discount rate. The<br />
rate takes into consideration the time value of money and asset-specific<br />
risk. With the purpose of testing <strong>for</strong> impairment, assets that have not<br />
been tested individually are grouped in the smallest identifiable group<br />
of assets that generate incoming cash flow which in all material<br />
aspects is independent of incoming cash flows from other assets or<br />
group of assets (cash generating units or CGU). On implementation of<br />
a test <strong>for</strong> the upper limit <strong>for</strong> operational segment in the assessment<br />
of impairment of goodwill, the CGUs to which goodwill has been allocated,<br />
are gathered so that the level of impairment being tested reflect<br />
the lowest level at which goodwill is monitored <strong>for</strong> internal <strong>report</strong>ing<br />
purposes. Goodwill is allocated to the cash-generating unit expected<br />
to gain advantages from the synergies associated with a merger.<br />
Impairment is recognised in the profit and loss if the carrying value<br />
of an asset or cash-generating unit exceeds the calculated recoverable<br />
amount. Upon recognition of impairment related to cash generating<br />
64<br />
units, the recorded value of any goodwill is first reduced. Subsequently,<br />
the remaining sum is distributed on remaining assets in the unit (group<br />
of units).<br />
Impairment relating to goodwill is not reversed. For other assets, it is<br />
assessed on the balance sheet date whether there are indications that<br />
the impairment no longer exists or is reduced. Impairment is reversed if<br />
the estimates in the calculation of the recoverable amount is changed.<br />
Reversals are made only until the carrying value equals the value that<br />
would have been recognised, net of amortisation, if the depreciation<br />
was not previously recognised.<br />
2.22 cash flow statement<br />
The cash flow statement has been prepared based on the indirect<br />
method.<br />
2.23 Earnings per share<br />
The basic earnings per share and diluted earnings per share are presented<br />
<strong>for</strong> ordinary shares. The basic earnings per share is calculated by dividing<br />
the period’s earnings attributable to owners of the ordinary shares,<br />
with a weighted average number of ordinary shares in the period,<br />
adjusted <strong>for</strong> the number of own shares.<br />
Diluted earnings per share are calculated by adjusting the earnings and<br />
the weighted average number of ordinary outstanding shares, adjusted<br />
<strong>for</strong> the number of own shares, <strong>for</strong> potential dilution effects. Dilution<br />
effects are a result of employee share options.<br />
2.24 Financial income and cost<br />
Financial income consists of capital gains on financial investments and<br />
changes to fair value of financial assets to fair value in the profit and<br />
loss account. Capital gains are recognised in the profit and loss account<br />
using the effective interest rate method.<br />
Financial costs comprises interest costs on loans, the effect of interest<br />
in discounted appropriation, changes to fair value of financial assets to<br />
fair value in the profit and loss account, and depreciation of financial<br />
assets in the profit and loss account. Borrowing costs not directly<br />
attributable to acquisition, processing or production of the qualifying<br />
asset, are included in the profit and loss account using the effective<br />
interest rate method.<br />
Foreign currency gains and losses are <strong>report</strong>ed as a net sum.<br />
3. Financial risk management<br />
3.1 Financial risk factors<br />
The group’s activities entail various types of financial risk; market risk<br />
(including currency risk and floating rate of interest risk), credit risk,<br />
liquidity risk and operational risk.<br />
The Board has primary responsibility <strong>for</strong> the establishment and supervision<br />
of the group’s framework <strong>for</strong> risk management. The principles of<br />
risk management have been established in order to identify and analyse
the risk to which the group is exposed. Principles and systems <strong>for</strong> risk<br />
management are regularly reviewed to reflect any changes in activities<br />
and market conditions.<br />
The auditing committee implements follow-up of managements’ supervision<br />
of the group’s principles and procedures <strong>for</strong> risk management.<br />
The group’s main risk management plan focuses on the unpredictability<br />
of the capital market, and attempts to minimise its potentially negative<br />
effects on the group’s financial results.<br />
The group engages in international operations and is especially exposed<br />
to currency risk. The group makes use of hedging to reduce the risk of<br />
currency exposure.<br />
The group has a decentralised structure with operational supervision<br />
of the various business units, where the main management of financial<br />
risk is determined by the Board. This applies to areas such as currency<br />
risk, interest rate risk, credit risk and use of financial derivatives.<br />
For the classification of financial assets and liabilities, reference is<br />
made to Note 28.<br />
MARkET RiSk<br />
Market risk is the risk of changes to market prices, such as <strong>for</strong>eign<br />
exchange rates, interest and stock-exchange values, affecting the<br />
income or value of financial instruments. Management of market risk<br />
intends to supervise that risk exposure lies within a set framework.<br />
The group is particularly vulnerable to fluctuations in the price of steel.<br />
The group monitors the development of steel prices on a continuous<br />
basis.<br />
The companies of the group buy and sell derivatives, and incur financial<br />
obligations to control market risk. Transactions are carried out within<br />
the guidelines issued by the group. To control result volatility, hedge<br />
accounting is used whenever possible.<br />
A) CURRENCy RISK<br />
The group operates internationally and is exposed to currency risk in<br />
a number of <strong>for</strong>eign currencies. The consolidated accounts are to a<br />
great extent affected by the exchange rate of NOK against SEK, USD,<br />
EUR and RMB. The group endeavours to reduce the risk of exposure to<br />
exchange rate fluctuations by obtaining an optimal balance between<br />
incoming and outgoing payments in the same currency, in addition<br />
to <strong>for</strong>ward exchange transactions at an acceptable exchange rate.<br />
Currency risk is to a large extent related to contracts <strong>for</strong> delivery that<br />
involve income and expenses in <strong>for</strong>eign currencies. Following contract<br />
signing, the guidelines are to sell and purchase <strong>for</strong>eign currencies on<br />
a <strong>for</strong>ward exchange contract, to reduce the currency risk in cash flows<br />
designated in <strong>for</strong>eign currencies. With a production process based on<br />
the use of an international network of sub-suppliers, purchases may<br />
further be optimised with regard to currency.<br />
In order to manage the currency risk of future trade transactions and<br />
assets and liabilities recognised in the balance sheet, the <strong>TTS</strong> <strong>Group</strong>’s<br />
units use <strong>for</strong>ward exchange contracts. When necessary, <strong>for</strong>ward<br />
exchange contracts are continued as they mature. These hedging<br />
activities meet the requirements of hedge accounting.<br />
Interest on loans is in the currency corresponding with cash flows<br />
generated by the underlying operations, primarily in Euro. This ensures<br />
financial hedging without the use of derivatives, and accordingly does<br />
not necessitate hedging.<br />
For other monetary assets and obligations in <strong>for</strong>eign currency, net<br />
exposure is kept at an acceptable level by purchasing and selling<br />
<strong>for</strong>eign currency at spot prices whenever necessary.<br />
The company has investments in <strong>for</strong>eign subsidiaries where net assets<br />
are exposed to currency risk at conversion of currency.<br />
A more detailed description of conversion differences is presented in<br />
Note 25.<br />
SIGNIFICANT CURRENCIES THROUGHOUT THE yEAR:<br />
<strong>TTS</strong> GROUP 3-15<br />
BUSINESS AREAS 16-33<br />
CORPORATE GOVERNANCE 35-43<br />
DiREcTOR’S REPORT AnD AccOUnTS 45 -116<br />
ORGANISATION 118-123<br />
Average Exchange Rates Spot rate<br />
Q1 Q2 Q3 Q4 31.12.10<br />
SEK 0.8173 0.8308 0.8543 0.8712 0.8707<br />
EUR 8.1720 8.0008 7.9703 7.8903 7.8125<br />
USD 5.8797 6.2398 6.1676 5.8474 5.8565<br />
RMB 0.8614 0.9173 0.9153 0.8807 0.8889<br />
SENSITIVITy ANALySIS<br />
A 10 % strengthening of EUR against NOK at year-end would have<br />
increased equity and result with the figures given below. The analysis<br />
is subject to other variables being constant.<br />
Result<br />
Equity after tax<br />
31 Desember <strong>2010</strong> 7.426 27<br />
31 Desember 2009 18.716 -1.938<br />
A 10 % weakening of EUR against NOK would have the same effect<br />
as regards to amount, only with the opposite sign, subject to other<br />
variables being constant.<br />
A 10 % strengthening of SEK against NOK at year-end would have<br />
increased equity and result with the figures given below. The analysis<br />
is subject to other variables being constant.<br />
Result<br />
Equity after tax<br />
31 Desember <strong>2010</strong> 43.118 10.210<br />
31 Desember 2009 25.294 6.202<br />
A 10 % weakening of SEK against NOK would have the same effect<br />
as regards to amount, only with the opposite sign, subject to other<br />
variables being constant.<br />
65
B) INTEREST RATE RISK<br />
The group’s interest-bearing debt is based on a floating rate of interest.<br />
This involves an interest rate risk <strong>for</strong> the group’s cash flow. The group’s<br />
surplus liquidity is in the <strong>for</strong>m of bank deposits. Any divergence from<br />
the use of a floating rate of interest and placement of surplus liquidity<br />
shall be determined by the Board.<br />
Entries exposed to interest rate risk are bank deposits and long-term<br />
liabilities.<br />
SENSITIVITy ANALySIS OF CASH FLOW FOR INSTRUMENTS OF<br />
VARIABLE INTEREST<br />
Calculations take into account all interest-bearing entries. All effects<br />
will be carried to the profit and loss account, as the company has no<br />
hedging instruments related to interest that will be directly charged<br />
against equity.<br />
The analysis is subject to other variables being constant.<br />
Fluctuations Effect on<br />
in interest net result Effect on<br />
rate after taxes equity<br />
<strong>2010</strong> +/- 1 %-points 8 560 0<br />
2009 +/- 1 %-points 8 831 0<br />
Calculations are made on the basis of an average net interest-bearing<br />
debt. A more detailed account of interest-bearing debt is presented<br />
in Note 12.<br />
cREDiT RiSk<br />
Credit risk is the risk of financial losses should a customer or counterparty<br />
to a financial instrument become unable to fulfil his obligations<br />
according to contract. Credit risk is dealt with at a corporate level.<br />
Credit risk arises in transactions with derivatives, bank deposits and<br />
financial institutions, in addition to transactions with customers.<br />
The credit risks are reduced through distribution over several counterparties.<br />
Requirements to credit ratings have been established toward<br />
counterparties, and new customers are subject to credit rating.<br />
Furthermore, the group makes a comprehensive use of Letters of<br />
Credit toward its customers, in order to minimise the risk of losses.<br />
The group’s customers are mainly located in Europe, including<br />
Scandinavia, and Asia, particularly China. The group carries out<br />
assessment of credit risk to the political structure depending on the<br />
economic importance of the agreements based on assessments from<br />
the OECD and other equivalent factors.<br />
Maximum risk exposure is represented by the extent of financial assets<br />
recognised in the balance sheet. In a hypothetical situation where no<br />
outstanding claims where met, this would be the equivalent to the<br />
following:<br />
66<br />
(All figures in NOK 1000) <strong>2010</strong> 2009<br />
Accounts receivable 488 799 565 141<br />
Cash reserves 272 331 191 907<br />
Project-related outstanding amounts 368 057 673 926<br />
Derivatives 48 777 53 210<br />
Other outstanding amounts 192 717 192 348<br />
Total 1 501 371 1 676 532<br />
The counterparty <strong>for</strong> pension resources is a Norwegian insurance<br />
company, and the risk related to this is considered to be minimal.<br />
The counterparties <strong>for</strong> derivatives are banks, and the credit risk related<br />
to these is considered to be insignificant. The same applies to bank<br />
deposits.<br />
Volatility in the financial markets in 2008 and 2009, with continued<br />
significant volatility in <strong>2010</strong> resulted in significantly increased credit<br />
risk. As a response, the group implemented actions against increased<br />
risk through close follow-up of customers and suppliers. Customers<br />
with bad debt or delayed instalment payments were particularly<br />
scrutinised. Historically, the group has had no substantial losses<br />
on accounts receivable, but in 2009 the group recorded a loss that<br />
exceeded 100 MNOK relating to bankruptcies. For <strong>2010</strong>, an expected<br />
and confirmed loss of 20.9 MNOK is recorded. This relates to customers<br />
who are no longer able to settle contractual liabilities. Though this is<br />
a significant reduction compared with 2009 high level of customer<br />
monitoring is still required.<br />
The bankruptcy in Ability Drilling in 2009, with its following claim<br />
against <strong>TTS</strong> Energy AS (<strong>for</strong>merly <strong>TTS</strong> Sense AS) was concluded in<br />
September <strong>2010</strong> by the establishment of a settlement between<br />
<strong>TTS</strong> <strong>Group</strong>/<strong>TTS</strong> Energy and the bankruptcy estate. For further details,<br />
ref. Note 26.<br />
As of 31.12, the group had the following maturity distribution on its<br />
external customers (including a claim on the joint venture companies):<br />
Not 0–3 3-6 > 6<br />
Total due months months months<br />
31.12.<strong>2010</strong> 488 799 238 531 168 246 24 607 57 415<br />
31.12.2009 565 141 256 839 150 497 38 317 119 488<br />
For accounts receivable that are not yet due, the assessment is, based<br />
on previous experience, that there is no need to write down the value.<br />
These relate to independent customers who have no previous history<br />
of failing to fulfill their obligations to the group. Invoicing is to a large<br />
extent carried out in accordance with milestone-based progress in each<br />
project. Due to delay in delivery, a considerable gap between due date<br />
and payment date may arise.<br />
As of 31.12.10, the provision <strong>for</strong> loss on accounts receivable is 83.5<br />
MNOK, compared to 139.5 MNOK in 2009. Accounts receivable are<br />
discussed in further detail in Note 11. The main part of the amount<br />
relates to appropriations in connection with four major risk exposures<br />
in the Energy segment.
LiqUiDiTY RiSk<br />
Liquidity risk is the risk of the group being unable to fulfil its financial<br />
obligations as they fall due. Liquidity management shall, to the extent<br />
possible, ensure that available liquidity is sufficient to meet obligations<br />
as they mature <strong>for</strong> payment, without this resulting in unacceptable<br />
loss or risk of damage to the group’s reputation. The availability of<br />
sufficient liquidity to meet expected operating cost, as well as resources<br />
to service financial obligations in the future, shall be secured.<br />
During the autumn of 2009, the group implemented actions to reduce<br />
working capital. These actions are continued in <strong>2010</strong>. The actions<br />
include active promotion to dispose of partially manufactured rigs that<br />
were commissioned by Ability Drilling prior to the bankruptcy in 2009.<br />
Relevant rigs are as of 31.12. assessed in accordance with the expected<br />
market value, adjusted <strong>for</strong> completion costs. The rigs are recognised<br />
as inventory. Furthermore, a project has been initiated to optimise the<br />
company’s procedures and processes in order to reduce the need <strong>for</strong><br />
working capital.<br />
<strong>TTS</strong> has established a joint cash pool arrangement that includes<br />
most of its subsidiaries. The joint cash pool arrangement improves<br />
accessibility and flexibility in the management of liquidity. Work is<br />
being done to include several of the <strong>for</strong>eign subsidiaries in the group<br />
accounting system within national legal frameworks.<br />
The group’s loan commitment with a bank syndicate led by Nordea is<br />
renegotiated annually. The commitment has its mature at 31.12.2011.<br />
The table below gives an overview of the structure of maturity of the group’s financial obligations:<br />
<strong>TTS</strong> GROUP 3-15<br />
BUSINESS AREAS 16-33<br />
CORPORATE GOVERNANCE 35-43<br />
DiREcTOR’S REPORT AnD AccOUnTS 45 -116<br />
ORGANISATION 118-123<br />
As a result of the financial crisis, in the winter of <strong>2010</strong> the group instigated<br />
measures to increase its financial action capacity and liquidity.<br />
In parts of <strong>2010</strong>, the group’s liquidity has not been satisfactory, and has<br />
also delayed the reduction of the credit facility of 200 MNOK that had<br />
maturity in March <strong>2010</strong>. As part of the delay, 50 MNOK was repaid at<br />
the end of September <strong>2010</strong>. The remaining facility, 150 MNOK are to<br />
be settled within 31.12.2011.<br />
Through the issuance of convertible subordinated loan, the group has<br />
improved its liquidity in 2011. The facility of 200 MNOK was fully<br />
subscribed in December <strong>2010</strong> and paid to the group in January 2011.<br />
In assessing equity-based loan terms with Nordea and bond owners,<br />
the responsible convertible loan shall be considered part of the equity.<br />
The group’s liquidity developments are monitored continuously based<br />
on regular liquidity <strong>for</strong>ecasts from all the units in the group.<br />
As of 31 December <strong>2010</strong>, <strong>TTS</strong> has an undrawn overdraft facility of<br />
246 MNOK. Furthermore, the group has available liquidity in the <strong>for</strong>m<br />
of bank deposits amounting to 272 MNOK.<br />
The group’s strategy is to have sufficient cash reserves or credit options<br />
to be able to, at any time, finance operations and investments throughout<br />
the year, in accordance with the group’s strategy plan. The group<br />
regards it as most likely that it will be able to renew loan agreements or<br />
negotiate alternative financing agreements upon expiry of the current<br />
agreements.<br />
Surplus liquidity is placed as deposits in bank on market terms.<br />
REMAINING PERIOD: More than<br />
<strong>2010</strong><br />
Long-term financial obligations:<br />
< 6 months 6-12 months 1-5 years 5 years Total<br />
Interest-bearing non-current liabilities 0 0 507 688 12 444 520 132<br />
Current financial obligations:<br />
First year’s instalment on non-current liabilities 15 254 15 300 0 0 30 554<br />
Interest-bearing current liabilities 25 758 525 000 0 0 550 758<br />
Derivatives 8 392 7 885 4 613 0 20 890<br />
Accounts payable and other current liabilities 699 202 783 946 0 0 1 483 148<br />
Total financial obligations 748 606 1 332 131 512 301 12 444 2 605 482<br />
2009<br />
Long-term financial obligations:<br />
< 6 months 6-12 months 1-5 years<br />
More than<br />
5 years Total<br />
Interest-bearing non-current liabilities 0 0 431 205 3 000 434 205<br />
Current financial obligations:<br />
First year’s instalment on non-current liabilities 56 287 6 286 0 0 62 573<br />
Interest-bearing current liabilities 475 000 58 764 0 0 533 764<br />
Derivatives 45 000 46 876 0 0 91 876<br />
Accounts payable and other current liabilities 400 000 362 090 0 0 762 090<br />
Total financial obligations 976 287 474 016 431 205 3 000 1 884 508<br />
67
The syndicated loan from Nordea constitutes part of short-term loans,<br />
and will be renewed by 31 December 2011. Reference is made to Notes<br />
13 and 24 <strong>for</strong> a further discussion on the syndicated loan.<br />
For further in<strong>for</strong>mation on financial obligations, see Notes 12, 13, 15,<br />
17, 20, and 28. In addition to this is advance payment from customers<br />
and cost related to facilities under construction. These entries are items<br />
of accrual and ordinarily fall due within a year. The items are further<br />
detailed in Note 2.<br />
OPERATIONAL RISK<br />
Operational risk is the risk of direct or indirect losses as a result of<br />
a whole range of causes related to the group’s processes, personnel,<br />
technology and infrastructure, as well as external factors besides of<br />
credit risk, market risk and liquidity risk that follow from laws, rules<br />
and generally accepted principles <strong>for</strong> business conduct. Operational<br />
risk arises in all of the group’s business areas.<br />
The group’s deliveries are primarily organised in the <strong>for</strong>m of projects.<br />
The group is continuously striving to improve operations and projects<br />
implementation. This further includes credit rating of major sub-suppliers<br />
in order to ensure implementation of the projects.<br />
The group’s aim is to deal with operational risk, so that a balance is<br />
reached between avoiding economic loss or damage to the group’s<br />
reputation, and general cost effectiveness, and to avoid control routines<br />
that limit initiative and creativity.<br />
The main responsibility <strong>for</strong> development and implementation of controls<br />
designed to handle operational risk is allocated to the top management<br />
within each business area. This responsibility is supported by developing<br />
the overall group standard <strong>for</strong> management of operational risk in<br />
various areas.<br />
3.2 Risk related to investment management<br />
The group’s aim with regard to investment management is to secure<br />
continued operations in order to ensure a return <strong>for</strong> the owners and<br />
other partners, and maintain an optimum capital structure, so as to<br />
reduce capital costs. To improve the capital structure, the group may<br />
adjust the level of dividend payment to shareholders, issue new shares<br />
or sell assets to repay loans.<br />
The company’s gearing as of 31.12.<strong>2010</strong> and 31.12.2009 is illustrated<br />
below:<br />
<strong>2010</strong> 2009<br />
Total loan 1 070 890 1 030 542<br />
- cash and cash equivalents 272 331 191 907<br />
Net interest bearing debt 798 559 838 635<br />
Equity 802 734 935 883<br />
Total 1 601 293 1 774 518<br />
Gearing 49.9 % 47.3 %<br />
68<br />
3.3 Estimation of fair market value<br />
Fair value of financial instruments traded in an active market is based<br />
on the market value on the balance sheet date. Examples of this are<br />
<strong>for</strong>ward contracts in <strong>for</strong>eign currencies where fair value is calculated<br />
by using a market-to-market rate on the balance sheet date.<br />
Fair value of financial instruments not traded in an active market is<br />
stipulated by the use of valuation techniques (primarily discounted<br />
future prospective cash flows) or other relevant in<strong>for</strong>mation <strong>for</strong> giving<br />
a best estimate of fair value on the balance sheet date. An example of<br />
this is shares held available <strong>for</strong> sale that have been estimated based<br />
on in<strong>for</strong>mation regarding transactions involving said shares.<br />
Accounts receivable and accounts payable are assessed at face value,<br />
less deductions <strong>for</strong> occurred or estimated losses on the balance sheet<br />
date, an amount presumed to be equal to the actual value of the entry.<br />
Fair value of employee share options is measured using the Black &<br />
Sholes <strong>for</strong>mula. The data <strong>for</strong>ming the basis <strong>for</strong> measurement includes<br />
the share price at the time of measurement, the option’s exercise<br />
price, expected volatility, weighted average expected economic life<br />
<strong>for</strong> the instruments, expected return, as well as risk free interest rate.<br />
Service terms and non-market based terms are not considered in the<br />
calculation of fair value.<br />
4. Risk related to key accounting estimates and<br />
evaluations<br />
Accounting estimates and evaluations are based on a best estimate.<br />
Estimates are evaluated on the basis of available in<strong>for</strong>mation on the<br />
balance sheet date, as well as management’s experience and expectation<br />
of future events deemed likely to occur. When considering the best<br />
estimate, allowance is made <strong>for</strong> relevant events that have occurred<br />
subsequent to the balance sheet date and up until the Board’s approval<br />
of the accounts, to the extent that such events are presumed to<br />
significantly alter the estimates. Estimates are always associated<br />
with uncertainty and consequently the recorded balance sheet and<br />
result variables. These days’ unrest in the financial market significantly<br />
increases the uncertainty of the premises <strong>for</strong> estimates and assessments<br />
of likely future events. Below follows a discussion of the key<br />
balance sheet items and appropriate profit and loss items where<br />
estimates are considered to be associated with major risk which<br />
<strong>for</strong>ms the basis of the accounts.<br />
A) RISK RELATED TO SIGNIFICANT LOSS OF VALUE OF GOODWILL AND OTHER INTANGIBLE ASSETS<br />
Book value of goodwill and other intangible assets are evaluated on<br />
an annual basis, and <strong>for</strong> each balance sheet date when there is external<br />
or internal depreciation indicators. The assessment is based on implemented<br />
tests of any depreciation per<strong>for</strong>med in accordance with requirements<br />
and guidelines given in IAS 36. As will appear from section 2.6,<br />
depreciation tests have been carried through indicating that there is
no need <strong>for</strong> depreciation as of 31.12.<strong>2010</strong>. The premises that <strong>for</strong>m<br />
the basis of this assessment may be significantly affected by future<br />
alterations to market conditions or events. Reference is made to a<br />
more detailed discussion of these balance sheet items in section 2.6<br />
and accounting values in Note 7.<br />
B) RISK RELATED TO ASSESSMENT OF CAPITAL CONTRACTS<br />
ACCORDING TO THE METHOD OF CONTINUOUS SETTLEMENT<br />
Entering of income and appropriate commodity costs from capital<br />
contracts is done according to the method of current settlement<br />
pursuant to requirements and guidelines given in IAS 11. The method<br />
demands of the group that it prepares reliable estimates (prognosis)<br />
<strong>for</strong> future income and costs <strong>for</strong> each project as well as degree of<br />
completion on the balance sheet date. Accounting values related to<br />
capital contracts have been further discussed in section 2.19 and<br />
Note 11. Income <strong>for</strong>ecasts are based on contractual values where future<br />
income in <strong>for</strong>eign currencies is secured by <strong>for</strong>ward contracts. Forward<br />
contracts and hedging accounting is discussed in section 2.9 and the<br />
accounting value of hedging instruments in Note 20. Commodity cost<br />
<strong>for</strong>ecast is based on evaluation of calculated volume and evaluation of<br />
future price levels. The price of steel, in particular, could significantly<br />
alter commodity cost. In today’s market, there is particular risk related<br />
to delays and cancellations of firm contracts. The group assesses the<br />
likelihood of cancellations and delays on a continuous basis. Delays<br />
and cancellation entail the risk of reduced income, increased costs, and<br />
that any previously estimated margins must be charged as an expense.<br />
In the event of cancellations, the foundation <strong>for</strong> hedging accounting<br />
ceased to exist according to IAS 39. This entails a risk of unrealised<br />
loss on <strong>for</strong>ward contracts associated with cancelled projects.<br />
C) RISK RELATED TO ASSESSMENT OF FINANCIAL ASSETS<br />
AND OBLIGATIONS<br />
The group’s financial assets and obligation are further discussed<br />
in sections 2.7, 2.8, 2.9, 2.11, 2.12, 2.14 and 2.15. Risk related to<br />
currency, interest, credit and liquidity, as well as asset management<br />
is discussed in section 3. These days’ unrest in the financial market<br />
could significantly affect the premises <strong>for</strong> valuation, estimated cash<br />
flow and liquidity in the course of the next accounting year. For<br />
further discussion of this, reference is made to section 3 and, <strong>for</strong><br />
accounting values see Note 11, 12, 15, 20, 22, and 28.<br />
D) RISK RELATED TO GUARANTEE LIABILITy<br />
The group customarily offers a warranty period of +/- two years on<br />
its deliveries. Management estimates appropriation <strong>for</strong> future guaranty<br />
commitments based on in<strong>for</strong>mation of historical guarantee claims,<br />
together with in<strong>for</strong>mation indicating that in<strong>for</strong>mation regarding<br />
previous expenses may differ from future obligations. Factors that<br />
may affect estimated obligations include the outcome of productivity<br />
and quality initiatives, as well as reference prices and labour costs.<br />
Guarantee costs are further discussed in section 2.17, and accounting<br />
values in Note 21.<br />
<strong>TTS</strong> GROUP 3-15<br />
BUSINESS AREAS 16-33<br />
CORPORATE GOVERNANCE 35-43<br />
DiREcTOR’S REPORT AnD AccOUnTS 45 -116<br />
ORGANISATION 118-123<br />
E) RISK RELATED TO PENSION OBLIGATIONS<br />
Net pension obligations are stipulated according to invoice calcu lations<br />
based on the premises related to discount rate, future salary developments,<br />
pension adjustment, expected returns on funds, r esignation rate<br />
as well as demographic considerations such as disability and mortality.<br />
The premises are stipulated based on observable market prices and<br />
historic development of the group and society. Changes to these premises<br />
could significantly affect the estimated pension obligation and pension<br />
cost. Pension cost and other compensation payments to employees are<br />
further discussed in section 2.17, and accounting values in Note 5.<br />
F) RISK RELATED TO FAIR VALUE ON SHARES<br />
Fair value on shares not traded in an active market is stipulated by<br />
the use of valuation techniques. The group evaluates and chooses the<br />
methods and premises that are primarily based on market conditions<br />
on the balance sheet date. Changes to the market conditions may<br />
significantly affect the fair value of shares. The accounting value of<br />
shares is further discussed in Note 8.<br />
G) DEFERRED TAx ASSETS<br />
The group has recognised deferred tax assets primarily related to the<br />
Norwegian and German companies. The following criteria have been<br />
employed to estimate that it is probable that future taxable profit will<br />
be available against which unused tax losses can be utilised:<br />
• The group has sufficient temporary differences<br />
• Tax losses as a result of specific identifiable causes<br />
In <strong>2010</strong> the group has made a reduction of value related to tax losses<br />
in the Norwegian companies. It is expected that taxable income over the<br />
next five years will be able to offset the tax losses, and the balance of<br />
deferred tax assets will be utilised. Impairment of 88.5 MNOK has been<br />
recognised as a tax expense in <strong>2010</strong>.<br />
69
notes <strong>for</strong> consolidated accounts<br />
<strong>TTS</strong> GROUP<br />
note 1 Operating segments<br />
(Amounts in NOK 1000)<br />
PRIMARy REPORTING FORMAT – BUSINESS SEGMENTS<br />
From 01.01.<strong>2010</strong> <strong>TTS</strong> <strong>Group</strong> is divided into three strategic business entities, organised and managed separately. Corresponding figures <strong>for</strong> 2009<br />
is revised to be comparable with the new organisation. The different business segments sell different products and have different risk profiles.<br />
In<strong>for</strong>mation about the result of each of the <strong>report</strong>ed segments are included below. Earnings are measured based on segment income be<strong>for</strong>e<br />
tax, as evidenced by internal management <strong>report</strong>s reviewed by the CEO. Transaction pricing between segments are determined by arm’s length<br />
principle. Intercompany transactions are eliminated within the individual segments. Transactions and transfers between different segments<br />
take place at standard terms that are equal to those of independent parties. These are not recognised on a separate line, as the amounts are<br />
immaterial.<br />
The <strong>Group</strong> is divided into the following business segments:<br />
Marine: Marine Division Port: Port and Logistics Division Energy: Energy Division Other: Corporate and others<br />
KEy PROFIT FIGURES<br />
<strong>2010</strong><br />
Marine Port Energy Other Total<br />
Turnover 2 229 520 299 180 712 109 0 3 240 809<br />
Income from associated companies 30 936 0 0 0 30 936<br />
Earnings be<strong>for</strong>e depreciation (EBITDA) 158 689 20 585 -168 586 -6 976 3 712<br />
Depreciation/amortisation -19 339 -2 764 -37 570 7 693 -51 979<br />
Operating profit/loss 139 351 17 821 -206 156 717 -48 267<br />
Financial income 24 995 6 126 7 196 20 400 58 718<br />
Financial cost -65 510 -6 973 -67 528 -26 544 -166 553<br />
Segment profit/loss be<strong>for</strong>e tax 98 837 16 975 -266 488 -5 426 -156 103<br />
2009<br />
Marine Port Energy Other Total<br />
Turnover 2 325 684 331 048 1 180 403 -11 818 3 825 319<br />
Income <strong>for</strong>m joint ventures 21 641 0 0 0 21 641<br />
Earnings be<strong>for</strong>e depreciation (EBITDA) 93 657 19 615 -192 040 -5 497 -84 265<br />
Other depreciations/amortisations -12 636 -2 345 -129 330 -2 224 -146 535<br />
Operating profit/loss 81 021 17 270 -321 370 -7 721 -230 800<br />
Financial income 52 718 9 102 13 089 -12 871 62 040<br />
Financial cost -75 369 -6 982 -37 864 -22 967 -143 182<br />
Segment profit/loss be<strong>for</strong>e tax 58 370 19 390 -346 145 -43 558 -311 942<br />
SEGMENT ASSETS AND LIABILITIES AS OF 31.12 AND CAPITAL ExPENDITURE<br />
<strong>2010</strong><br />
<strong>TTS</strong> GROUP 3-15<br />
BUSINESS AREAS 16-33<br />
CORPORATE GOVERNANCE 35-43<br />
DiREcTOR’S REPORT AnD AccOUnTS 45 -116<br />
ORGANISATION 118-123<br />
Marine Port Energy Other Total<br />
Assets 2 111 648 277 291 1 213 912 -271 581 3 331 269<br />
Joint ventures 116 815 0 3 914 0 120 729<br />
Total segment assets 2 228 463 277 291 1 217 826 -271 581 3 451 998<br />
Liabilities 1 665 403 204 744 1 115 692 -336 575 2 649 264<br />
This year’s capital expenditures 19 793 2 681 13 773 1 328 37 578<br />
2009<br />
Marine Port Energy Other Total<br />
Assets 2 068 454 240 573 1 581 189 -294 702 3 595 514<br />
Joint ventures 77 468 0 3 913 12 579 93 960<br />
Total segment assets 2 145 922 240 573 1 585 102 -282 123 3 689 474<br />
Liabilities 1 739 275 145 931 1 664 788 -796 403 2 753 591<br />
This year’s capital expenditures 276 721 3 137 97 196 1 505 378 558<br />
71
71-93 nOTES TO ThE AccOUnTS <strong>TTS</strong> GROUP<br />
note 1 cont.<br />
SECONDARy REPORTING FORMAT – GEOGRAPHICAL SEGMENTS<br />
The <strong>Group</strong>’s activities are primarily distributed in the following regions:<br />
Scandinavia<br />
Rest of Europe<br />
Asia<br />
USA/Canada<br />
Rest of the world<br />
Sales revenue <strong>2010</strong> 2009<br />
Scandinavia 514 022 592 671<br />
Rest of Europe 756 666 925 056<br />
Asia 1 760 523 1 917 244<br />
USA/Canada 113 512 361 357<br />
Rest of the world 96 086 28 988<br />
Sales are allocated based on the customer’s home country.<br />
3 240 809 3 825 316<br />
Segment assets <strong>2010</strong> 2009<br />
Scandinavia 2 550 251 2 339 353<br />
Rest of Europe 492 454 860 793<br />
Asia 299 139 331 690<br />
USA/Canada 102 921 157 639<br />
Rest of the world 7 232 0<br />
Assets are based on their location.<br />
3 451 998 3 689 474<br />
Capital expenditures <strong>2010</strong> 2009<br />
Scandinavia 26 106 100 919<br />
Rest of Europe 6 537 252 810<br />
Asia 3 874 19 828<br />
USA/Canada 1 061 5 001<br />
Rest of the world 0 0<br />
Capital expenditures are based on where the assets are located.<br />
37 578 378 558<br />
note 2 construction contracts<br />
(Amounts in NOK 1000)<br />
<strong>2010</strong> 2009<br />
Revenue from projects 3 225 819 3 784 087<br />
BALANCE SHEET ITEMS RELATED TO CONSTRUCTION CONTRACTS<br />
Current Assets<br />
Completed production 2 273 287 1 093 058<br />
Invoiced production 1 957 090 636 873<br />
Accrued, non-invoiced production 368 057 456 185<br />
Prepayments to suppliers 130 690 217 741<br />
Total current assets 498 748 673 926<br />
Current liabilities<br />
Completed production 1 974 126 1 135 276<br />
Invoiced production 2 421 340 1 775 214<br />
Prepayments from customers -447 214 -639 938<br />
Non-invoiced production cost, suppliers -336 732 -149 790<br />
Total current liabilities -783 946 -789 729<br />
Risks related to the estimation of the posted values are further discussed under accounting principles, in sections 2.20 and 4.<br />
72
note 3 inventories<br />
(Amounts in NOK 1000)<br />
<strong>2010</strong> 2009<br />
Inventories, incl. non-current 430 612 438 103<br />
Obsolescence -8 025 -17 608<br />
Total inventories 422 587 420 495<br />
Work in progress 0 41 693<br />
Book value of inventories pledged as security <strong>for</strong> liabilities 321 200 305 436<br />
Raw materials removed from storage <strong>for</strong> use in ongoing production in <strong>2010</strong> is presented along with accrued,<br />
non-invoiced production. Consumption of raw materials, supplies, changes in finished goods and changes<br />
in work in progress are included under the item cost of sales, and amounts to 2 396 428 TNOK in <strong>2010</strong><br />
(2009: 2 900 892 TNOK)<br />
note 4 Payroll expenses and employee in<strong>for</strong>mation<br />
(Amounts in NOK 1000)<br />
Payroll expenses <strong>2010</strong> 2009<br />
Salaries 480 538 516 296<br />
Employer’s social security contribution 69 415 68 738<br />
Defined benefit pension costs 13 952 16 124<br />
Defined contribution pension costs 27 928 28 156<br />
Other benefits 25 314 34 154<br />
Total payroll expenses 1) 617 148 663 467<br />
Number of employees at the end of the year 1 057 1 136<br />
1) The 2009 annual <strong>report</strong> lists the total wage cost at 483 127 TNOK. The corresponding figures <strong>for</strong> 2009<br />
has been revised <strong>for</strong> illustration purposes only. The alteration <strong>for</strong> 2009 amounts to 180 340 TNOK.<br />
The number of employees in the <strong>Group</strong> decreased by 79 from 2009 to <strong>2010</strong>.<br />
Board remunerations* <strong>2010</strong> 2009<br />
Trym Skeie (Chairman of the board from 11.09) 160 46<br />
Birger Skeie - deceased estate (Chairman of the board until 08.09) 69 183<br />
Nils O. Ardal (until 06.10) 262 262<br />
Bjarne Skeie 175 175<br />
Rune Selmar (07.10 - 12.10) 0 0<br />
Anne Breive 205 205<br />
Kjerstin Fyllingen 205 205<br />
Karen Torine Mørkestøl (from 10.10) 0 0<br />
Jarle Dyrdal (from 10.10) 0 0<br />
Olav Smeland (until 10.10) 88 88<br />
Anne Karin Bedringås (until 10.10) 88 88<br />
Total 1 251 1 153<br />
*) The Annual General Meeting determines the remuneration to the Board from one general meeting<br />
to the next. For the accounting year <strong>2010</strong>, the same remuneration was stipulated as was determined by<br />
the Board at the Annual General Meeting <strong>for</strong> <strong>2010</strong>. Proposed remuneration from the General Meeting<br />
in <strong>2010</strong> until the General Meeting in 2011, is stipulated in the notice of the General Meeting 03.06.10.<br />
The same applies to the nomination committee.<br />
71-93 nOTES TO ThE AccOUnTS <strong>TTS</strong> GROUP<br />
73
71-93 nOTES TO ThE AccOUnTS <strong>TTS</strong> GROUP<br />
note 4 cont.<br />
NOMINATION COMMITTEE REMUNERATION<br />
The <strong>TTS</strong> nomination committee is comprised of the following members: Bjørn Olafsson (Chairman), Bjørn Sjaastad og Johan Aasen.<br />
The nomination committee remuneration <strong>for</strong> <strong>2010</strong> was 40 TNOK <strong>for</strong> the chairman and 25 TNOK <strong>for</strong> each of the members, a total of 90 TNOK.<br />
STATEMENT REGARDING THE STIPULATION OF REMUNERATION AND OTHER BENEFITS FOR THE PRESIDENT & CEO AND OTHER ExECUTIVES<br />
Regarding group management, <strong>TTS</strong> <strong>Group</strong> <strong>ASA</strong>’s remuneration policy is based on offering competitive terms. Remunerations should reflect that<br />
<strong>TTS</strong> is a listed company with an international focus. The annual remuneration is based on group managements part-taking in the results generated<br />
by the company and the added value <strong>for</strong> shareholders through increased company value.<br />
Remuneration consists of three main components; Base salary, bonus and a share option programme.<br />
Bonus is determined on the basis of target results. In certain circumstances where change and development are of decisive nature, the bonus is<br />
further based on specific developmental targets. Bonus targets are revised annually. The maximum bonus is one year’s base salary <strong>for</strong> the President<br />
& CEO, and up to 50 % <strong>for</strong> other executives.<br />
Since 1998, a share option program has been active <strong>for</strong> the group management of <strong>TTS</strong>; the goal being that the group management shall have<br />
the same incentive as the shareholders in respect of increasing company value over time. The Annual General Meeting has each year given the<br />
Board authority to establish share option programmes with a two year term. Redemption price equals market price on allotment. First exercise<br />
is 50 % after one year. Next 12,5 % per quarter, in addition to options not previously utilised. Each option program expires after 2 years.<br />
The group pension scheme in Norway is based on about 65 % of base salary at the age of 67, limited to 12G, with the exeption of <strong>TTS</strong> Sense AS<br />
which has a defined contribution scheme. For employees abroad, the prevailing schemes in the respective companies apply.<br />
The period of notice is 6 months with a severance pay of 24 months, including period of notice <strong>for</strong> the President & CEO and from 6 to 24 months<br />
<strong>for</strong> the other memers in the senior executive group.<br />
The share option program is contingent on the Annual General Meeting’s approval, based on the Board being granted authority to make such<br />
allotments. The President & CEO’s remuneration is determined by the Board of <strong>TTS</strong> <strong>Group</strong> <strong>ASA</strong>. Remuneration to other executives is determined<br />
by the President & CEO.<br />
REMUNERATION AND OTHER BENEFITS FOR THE PRESIDENT & CEO AND OTHER ExECUTIVES<br />
Other Bonus Share Total Pension<br />
Name Position Base salary benefits paid options remuneration cost<br />
Johannes D. Neteland President & CEO 1 762 163 0 0 1 925 953<br />
Arild Apelthun CFO (from 04.10) 909 12 0 0 921 61<br />
Mette Henriksen Acting CFO (until 03.10) 281 4 0 0 285 10<br />
Ivar K. Hanson EVP, Marine 1 288 15 75 0 1 378 88<br />
Lennart Svensson EVP, Port and Logistics 1 175 28 0 0 1 175 335<br />
Inge Gabrielsen EVP, Energy 1 323 43 0 0 1 366 46<br />
Remunerations Taxable remuneration<br />
Other benefits Car sheme, group life insurance, taxable pension schemes, telephone, newspapers, etc.<br />
Bonus paid Bonus paid in current year<br />
Share options Difference in market price and exercise price<br />
Total Total taxable remuneration<br />
Taxable pension scheme is early retirement and top-hat pension (CEO) which used to be a annuity-based solution. In accordance with the new tax<br />
regulations per 01.01.07, these are considered taxable benefits. The early retirement scheme applies to the President & CEO from the age of 60.<br />
REMUNERATION OF AUDITOR<br />
<strong>2010</strong> 2009<br />
Statutory audit 4 699 4 370<br />
Other attestation services 277 24<br />
Other services including tax service 1 106 1 726<br />
Total 6 082 6 121<br />
74
note 5 Pension<br />
(Amounts in NOK 1000)<br />
71-93 nOTES TO ThE AccOUnTS <strong>TTS</strong> GROUP<br />
The Norwegian companies in the group, with the exception of <strong>TTS</strong> Energy, has defined benefit pension plans that give employees the right to future<br />
pension benefits depending on length of service, salary levels, retirement age and the National Insurance benefits received. As of 31.12.10 the pension<br />
scheme includes 247 persons, including 10 active retirees. The <strong>Group</strong>’s obligation are covered primarily by an insurance company. The parent company<br />
has unfunded pension liabilities <strong>for</strong> which provisions have been made. <strong>Group</strong> companies outside Norway have defined benefit plans in accordance<br />
with local practice and regulations, which are of defined contribution nature. <strong>TTS</strong> Energy AS also has a defined contribution pension plan.<br />
The net pension obligations <strong>for</strong> companies affiliated with the benefit plans are based on the assumptions as of 31.12.10 and are determined as follows:<br />
<strong>2010</strong> 2009<br />
Insured Uninsured Total Insured Uninsured Total<br />
Market value of pension funds 80 443 0 80 443 72 070 0 72 070<br />
- Net present value of accrued pension obligations -117 863 -1337 -119 200 -89 958 -1892 -91 850<br />
+ Unrecognised estimate changes and deviations 49 863 34 49 897 32 635 -271 32 363<br />
- Accrued payroll tax -3 144 -188 -3 332 2 650 267 2916<br />
= Net pension obligations after payroll taxes 9 299 -1 457 7 808 12 098 -2 430 9 668<br />
Net pension costs are determined as follows: <strong>2010</strong> 2009<br />
Insured Uninsured Total Insured Uninsured Total<br />
Net present value of current year’s pension benefits 10 877 247 11 124 10 565 275 10 839<br />
+ Interest payable on pension obligations 3 933 75 4 008 3 313 60 3 373<br />
- Expected return on pension funds -3 541 0 -3 541 -3 295 0 -3 295<br />
+ Recognised estimate changes and deviations 2 585 -1 477 1 108 3 719 -52 3 667<br />
+ Change in payroll tax 1 590 46 1 636 1 492 48 1 540<br />
+ Costs in relation to accrued pension<br />
from prior periods 0 262 262 0 0 0<br />
= Total costs, included in wage costs 15 444 -847 14 597 15 794 330 16 124<br />
Change in recognised funds: <strong>2010</strong> 2009<br />
Book value as of 01.01. 9 668 11 362<br />
- Cost recognised during the year (see above) 14 597 16 124<br />
+/- Pension payments and payment of pension premiums 16 457 14 429<br />
= Book value as of 31.12 7 808 9 668<br />
The following economic assumptions have been made<br />
<strong>for</strong> calculation of the pension obligations: <strong>2010</strong> 2009<br />
31.12. 1.1. 31.12. 1.1.<br />
Return on pension funds 3.20 % 5.60 % 5.60 % 6.10 %<br />
Discount rate 4.60 % 4.40 % 4.40 % 5.10 %<br />
Annual wage growth 4.00 % 4.25 % 4.25 % 4.50 %<br />
Annual adjustment of National pension index (G) 3.75 % 4.00 % 4.00 % 4.25 %<br />
Annual adjustment of pensions in payment 3.75 % 4.00 % 4.00 % 2.35 %<br />
Voluntary retirement 10.00 % 10.00 % 10.00 % 10.00 %<br />
Withdrawal propensity <strong>for</strong> early retirement (AFP) 45.00 % 45.00 % 45.00 % 45.00 %<br />
Payroll tax 14.10 % 14.10 % 14.10 % 14.10 %<br />
Risk related to the estimates that <strong>for</strong>m the basis <strong>for</strong> the book values are further described in Accounting principles, under sections 2.17 and 4.<br />
<strong>TTS</strong> Handling Systems AS, <strong>TTS</strong> Energy Bergen AS and <strong>TTS</strong> Marine AS partially participates in a LO/NHO-pension plan that enables all employees to<br />
choose early retirement from the age of 62 years. This plan was motioned terminated in February <strong>2010</strong> and early retirement according to this arrangement<br />
was only available <strong>for</strong> the company’s employees until 31.12.<strong>2010</strong>. The effect of the termination have been recognised in <strong>2010</strong>. The remaining appropriation<br />
regards the company’s own risk <strong>for</strong> persons that are early retirees of this pension plan. At the termination of the the old AFP-plan there proved to<br />
be a significant undercoverage in the old pension plan. This undercoverage will have to be covered by the participating companies through continued<br />
payment of premiums <strong>for</strong> the coming five years. The company’s share of this undercoverage has been estimated and made provisions <strong>for</strong>.<br />
As replacement of the old AFP-pension plan a new AFP-plan has been established. The new AFP-plan is, unlike the old, not an early retirement plan<br />
but a plan that gives a lifelong addition to the ordinary pension. The employees can choose to realise the new AFP-plan from the age of 62 years<br />
while continuing working, as the plan gives additional earnings <strong>for</strong> continued work until the age of 67 years. The new AFP-plan is a defined benefit<br />
multi-company pension scheme and is financed through premiums determined as a percent of salary. At the time there are no reliable rating and<br />
allotment of liabilities and assets in the pension plan. In accounting the plan is considered as a defined contribution plan of which the premium<br />
payments are current costs, and no provisions are made in the financial statement. No premium is expected to be paid to this new pension plan until<br />
2012, at which time the premium is set to 1,4 % of total payments between 1G and 7,1G to the company’s employees. There is no accumulation<br />
of capital in the scheme and it is not expected that the premium level will increase the coming years.<br />
75
71-93 nOTES TO ThE AccOUnTS <strong>TTS</strong> GROUP<br />
note 6 Fixed assets<br />
(Amounts in NOK 1000)<br />
76<br />
Furniture,<br />
office-,<br />
Machinery and computer<br />
Property Buildings and vehicles equipment Total<br />
AS OF 1 JANUARy 2009<br />
Acquisition cost 01.01. 15 273 34 092 50 430 120 389 219 584<br />
Accumulated depreciation as of 01.01. -600 -4 803 -25 645 -64 439 -94 887<br />
Book value as of 01.01. 14 673 29 288 24 785 55 950 124 696<br />
2009 FISCAL yEAR<br />
Book value as of 01.01. 14 673 29 288 24 785 55 950 124 696<br />
Foreign currency differences -1 184 -1 624 -1 535 -1 684 -6 027<br />
Acquisitions 0 0 0 0 0<br />
Additions 0 791 7 595 36 288 44 674<br />
Disposals 0 0 -3 089 -1 443 -4 531<br />
Amortisation <strong>for</strong> the year 0 -1 415 -3 645 -23 969 -29 028<br />
Book value as of 31.12. 13 489 27 040 24 111 65 143 129 783<br />
AS OF 31 DECEMBER 2009<br />
Aqcuisition cost 31.12. 14 089 33 259 53 401 153 551 253 699<br />
Accumulated depreciation as of 31.12. -600 -6 218 -29 290 -88 409 -123 916<br />
Book value as of 31.12. 13 489 27 041 24 111 65 143 129 783<br />
<strong>2010</strong> FISCAL yEAR<br />
Book value as of 01.01. 13 489 27 041 24 111 65 143 129 783<br />
Foreign currency differences 467 -3 798 -6 803 21 564 11 435<br />
Acquisitions 0 0 0 0 0<br />
Additions 812 1 106 608 17 878 20 404<br />
Disposals 0 -267 -447 -13 344 -14 058<br />
Amortisation <strong>for</strong> the year -199 -3 498 -11 249 -20 182 -35 132<br />
Book value as of 31.12. 14 569 20 584 14 490 71 059 120 702<br />
AS OF 31 DECEMBER <strong>2010</strong><br />
Acquisition cost 31.12. 15 382 30 300 55 029 179 649 254 272<br />
Accumulated depreciation as of 31.12. -813 -9 716 -40 539 -108 591 -133 570<br />
Book value as of 31.12. 14 569 20 584 14 490 71 059 120 702<br />
Property in the Norwegian companies has been pledged as security <strong>for</strong> long-term and short-term debt to credit institutions, see Note 13.<br />
LEASED FIxED ASSETS:<br />
Machinery Computer<br />
and vehicles equipment<br />
<strong>2010</strong> FISCAL yEAR<br />
Book value as of 01.01. 0 0<br />
Additions 0 0<br />
Disposals 0 0<br />
Amortisation <strong>for</strong> the year 0 0<br />
Book value as of 31.12. 0 0<br />
2009 FISCAL yEAR<br />
Book value as of 01.01. 909 1 832<br />
Foreign currency differences 0 0<br />
Additions 0 0<br />
Disposals -909 -1 832<br />
Amortisation <strong>for</strong> the year 0 0<br />
Book value as of 31.12. 0 0
note 7 intangible assets<br />
(Amounts in NOK 1000)<br />
Customer Patents,<br />
portfolio licences etc. 1) R&D Goodwill 2) Total<br />
AS OF 1 JANUARy 2009<br />
Acquisition cost 01.01. 5 219 19 729 242 114 976 695 1 243 777<br />
Accumulated depreciation as of 01.01. -1 122 -9 952 -5 399 -22 081 -38 554<br />
Book value as of 01.01. 4 097 9 654 236 838 954 614 1 205 203<br />
2009 FISCAL yEAR<br />
Book value as of 01.01 4 097 9 654 236 838 954 614 1 205 203<br />
Foreign currency differences 0 0 -183 -21 210 -21 393<br />
Additions 0 2 412 62 621 0 65 033<br />
Acquisitions 0 0 0 3 185 3 185<br />
Disposals 0 0 -3 016 0 -3 016<br />
Depreciation 0 0 0 -108 506 -108 506<br />
Amortisation <strong>for</strong> the year -522 -1 358 -16 442 0 -18 322<br />
Book value 31.12. 3 575 10 708 279 818 828 083 1 122 184<br />
PER 31 DECEMBER 2009<br />
Acquisition cost 31.12. 5 219 22 141 301 536 958 670 1 287 586<br />
Accumulated depreciation as of 31.12. -1 644 -11 310 -21 841 -130 587 -165 382<br />
Book value 31.12. 3 575 10 708 279 818 828 083 1 122 184<br />
<strong>2010</strong> FISCAL yEAR<br />
Book value 1.1. 3 575 10 708 279 818 828 083 1 122 184<br />
Foreign currency differences 522 4 354 -298 -899 3 679<br />
Additions 0 2 398 10 506 0 12 904<br />
Acquisitions 0 0 0 0 0<br />
Disposals 0 -1 656 -4 270 0 -5 926<br />
Depreciation 0 0 0 0 0<br />
Amortisation <strong>for</strong> the year -391 -1 358 -15 098 0 -16 847<br />
Book value 31.12. 3 706 14 568 270 659 827 184 1 116 117<br />
PER 31 DECEMBER <strong>2010</strong><br />
Acquisition cost 31.12. 5 741 27 689 309 386 960 115 1 302 931<br />
Accumulated depreciation as of 31.12. -2 035 -13 121 -38 727 -132 931 -186 814<br />
Book value 31.12. 3 706 14 568 270 659 827 184 1 116 117<br />
BOOK VALUE R&D, PATENTS AND LICENCES PER 31.12. CONSISTS OF:<br />
EU project ”Terminal System” 8 996<br />
Development - Drilling equipment 199 202<br />
Development - Heave compensated VME 8 212<br />
Development - Offshore cranes 34 230<br />
Others 20 019<br />
Total 270 659<br />
71-93 nOTES TO ThE AccOUnTS <strong>TTS</strong> GROUP<br />
For proprietary products a continuous assessment is carried out to ensure the criteria <strong>for</strong> recognition of development costs have been met.<br />
1) THE ITEM CONSISTS OF:<br />
<strong>TTS</strong> Port Equipment AB has activated own development relating to the development of terminal systems.<br />
<strong>TTS</strong> Energy AS - Drilling unit has activated Rack & Pinion (R&P) rig solution, other drilling solutions, joint integrated machine (JIM)<br />
and mud mixing plant.<br />
<strong>TTS</strong> Energy AS - Offshore unit has activated own development of automatic handling winches with high pressure hydraulics.<br />
<strong>TTS</strong> Energy AS - Offshore unit has activated own development of a range of concepts <strong>for</strong> subsea offshore cranes with secondary<br />
controlled active heave compensation (AHC).<br />
77
71-93 nOTES TO ThE AccOUnTS <strong>TTS</strong> GROUP<br />
note 7 cont.<br />
2) SUMMARy OF THE ALLOCATION OF GOODWILL AT SEGMENT LEVEL IS AS FOLLOWS:<br />
78<br />
<strong>2010</strong> Port Marine Energy Other Total<br />
Scandinavia 37 821 208 863 481 065 0 727 749<br />
Rest of Europe 0 97 382 0 0 97 382<br />
Asia 0 2 053 0 0 2 053<br />
Rest of world 0 0 0 0 0<br />
Total 37 821 308 298 481 065 0 827 184<br />
2009 Port Marine Energy Other Total<br />
Scandinavia 39 769 207 814 481 065 0 728 648<br />
Rest of Europe 0 97 382 0 0 97 383<br />
Asia 0 2 053 0 0 2 053<br />
Rest of world 0 0 0 0 0<br />
Total 39 769 45 566 478 061 0 828 083<br />
Risk related to the estimates that <strong>for</strong>m the basis <strong>for</strong> the book values are further described in Accounting principles, under sections 2.6 and 4.<br />
GOODWILL IMPAIRMENT ASSESSMENT<br />
There are external indicators of the need to test <strong>for</strong> impairment of the carryvalue of the three assessments cash generating units (CGU) in accordance<br />
with the IAS 36-structure. The <strong>TTS</strong> <strong>Group</strong> has defined three CGUS in the group, consistent with the three divisions below. The value of goodwill in the<br />
balance sheet and important assumptions <strong>for</strong> the test is shown below:<br />
Goodwill Revenue EBITDA Margin<br />
31.12.10 <strong>2010</strong><br />
(MNOK) (MNOK) 2009 <strong>2010</strong> 2011-2014 2015 WACC<br />
DIVISION (CGU)<br />
Marine 308 2 230 4.0 % 7.1 % 6.4 % - 8.0 % 8.9 % 9.5 %<br />
Port and Logistic 38 299 5.9 % 6.9 % 5.2 % - 8.3 % 8.3 % 9.5 %<br />
Energy 481 712 -16.3 % -23.7 % 5.3 % - 8.6 % 9.5 % 9.5 %<br />
Total 827 3 241<br />
Test <strong>for</strong> write down is implemented by estimating a utility value in<br />
use <strong>for</strong> each of the divisions, which is compared to the booked value.<br />
Estimated utility value is based on discounted future cash flows, and<br />
is subject to the following premises:<br />
• Expected cash flows are set to EBITDA with deductions made <strong>for</strong> investments<br />
and requirement <strong>for</strong> working capital, and is based on an actual<br />
board-approved business plan <strong>for</strong> each division over the next five years.<br />
The basis <strong>for</strong> this is a growth in turnover up until 2015. From 2016,<br />
growth is assumed to be equal to inflation, and on this basis calculation<br />
has been made of a terminal value at the end of the sixth year (2016).<br />
• Sales income is based on thorough market analyses and evaluations<br />
of the different markets in which the various companies and divisions<br />
compete. There is a varying development between the divisions, particularly<br />
<strong>for</strong> 2011, <strong>for</strong> which allowance has been made <strong>for</strong> the Energy<br />
division with regard to the demanding market in the years mentioned.<br />
After 2011, the basis <strong>for</strong> these divisions is growth in turnover.<br />
• Expected future earnings (EBITDA) is estimated at a level with competing<br />
and comparable companies in the marketplace. The positive<br />
development in EBITDA margin is in part the result of increased<br />
volume and in part the expectation of generally higher margins<br />
when the markets recover. The estimates are further based, in<br />
particular <strong>for</strong> the Energy division, on that the major development<br />
projects implemented will yield future returns and lowered costs.<br />
• Inflation is presumed at 2.5 % per year, and all values in the<br />
estimations are based on real value (less inflation). The presumption<br />
of inflation is according to estimates from Norges Bank.<br />
• Weighted average cost of capital (WACC) is calculated on the basis<br />
of the capital asset pricing model. The WACC from the total capital<br />
is pre-tax and less inflation. All divisions are stipulated at the same<br />
WACC (9.5 %). Beta values are calculated by comparison with other<br />
similar listed companies. The basis <strong>for</strong> all divisions is a risk-adjustment<br />
of 5 % relating to equity.<br />
• The investment requirements of each division are based on an investment<br />
plan approved by the Board. On the basis of the major investments<br />
in recent years, it is budgeted <strong>for</strong> a lower level of investment than the<br />
previous years.<br />
• Change to the working capital is estimated on the basis of the working<br />
capital constituting 8 % of the division’s operating income. Beyond<br />
this, it has been assumed that the group will be able to reduce working<br />
capital in 2011. With regard to the Energy division, it is anticipated the<br />
sale of three rigs in stock during 2011.<br />
Based on the above presumptions, the estimated value in use exceeds<br />
the carrying value <strong>for</strong> each CGU indicating that there is no need to<br />
impair in any of the divisions. Please note, however, that there is a high<br />
degree of uncertainty related to the presumptions, and that changes<br />
to theses could entail future write downs. The group has conducted<br />
sensitivity analyses that show no need <strong>for</strong> write downs given the<br />
following premises:<br />
- 10 % decline in sales revenues<br />
- 1 %- point increase in the WACC<br />
- 1 %- point decrease in EBITDA margin<br />
Sensitivity analysis does show that the risk of the utility value falling<br />
below the book value is greatest in the Energy division. A decrease<br />
of 1 percentage point in the EBITDA, together with an increase in<br />
WACC of 1.8 percentage points, will represent a need <strong>for</strong> write down<br />
of approximately 4 MNOK. A decrease of 2.0 % in the EBITDA together<br />
with an increase in WACC of 1 % will represent a need <strong>for</strong> write down<br />
of approximately 44 MNOK. Furthermore, the sensitivity analysis does<br />
show that a decrese of 10 % in revenue, together with an decrease in<br />
EBITDA of 1,0 % does not represent a write down scenario. A decrease<br />
of 20 % in revenue, combined with a 2.0 % decrease in EBITDA will<br />
represent a write down requirement of approximately 21 MNOK.
note 8 investments in other companies<br />
(Amounts in NOK 1000)<br />
Ownership (percent) Acquisition cost <strong>2010</strong><br />
Book value<br />
2009<br />
FIxED ASSETS<br />
Shin young Heavy Industry 13.4 % 222 222 222<br />
FastShip Inc.* 6.7 % 13 326 0 1 723<br />
Other 2 0 0<br />
Total investment in other enterprises 13 550 222 1 945<br />
Other investments in shares are wholly defined as available <strong>for</strong> sale.<br />
*) In the balance sheet per 31.12. the company has recorded 615 156 shares in FastShip Inc (FSI) with a total book value of 1 NOK.<br />
There are currently no ongoing activity in the project and the company’s certificates have expired. The company is per 31.12.<strong>2010</strong> still active<br />
<strong>for</strong> judicial clarifications of a sertificate dispute in the US. Since the project is terminated <strong>TTS</strong> has recorded the whole investment<br />
of 19.0 MNOK as a loss. Shares have been written off by 1.7 MNOK, and convertible loan with 1.1 MNOK in <strong>2010</strong>.<br />
Risk related to the estimates that <strong>for</strong>m the basis <strong>for</strong> the book values are further described in Accounting principles, under sections 2.7 and 4.<br />
note 9 Subsidiaries<br />
(Amounts in NOK 1000)<br />
The following subsidiaries are included in the consolidated accounts:<br />
<strong>TTS</strong> GROUP <strong>ASA</strong><br />
Subsidiary Registered office Aqcuisition date Ownership (percent) Voting share<br />
<strong>TTS</strong> Handling Systems AS Drøbak, Norway 1994 100 % 100 %<br />
<strong>TTS</strong> Ships Equipment AS Bergen, Norway 1996 100 % 100 %<br />
Norlift AS Bergen, Norway 1994 100 % 100 %<br />
Hydralift Marine AS Kristiansand, Norway 2003 100 % 100 %<br />
<strong>TTS</strong> Marine AB (<strong>for</strong>mer <strong>TTS</strong> Ships Equipment AB) Gothenburg, Sweden 2002 100 % 100 %<br />
<strong>TTS</strong> Marine Shanghai Co Ltd Shanghai, China 2002 100 % 100 %<br />
<strong>TTS</strong> Energy Bergen AS (<strong>for</strong>mer <strong>TTS</strong> Marine Cranes AS) Bergen, Norway 2006 100 % 100 %<br />
<strong>TTS</strong> Cranes Norway AS Bergen, Norway 2007 100 % 100 %<br />
<strong>TTS</strong> Energy Ålesund AS (<strong>for</strong>mer <strong>TTS</strong> Offshore Handling) Ålesund, Norway 2007 100 % 100 %<br />
<strong>TTS</strong> Energy AS (<strong>for</strong>mer <strong>TTS</strong> Sense AS) Kristiansand, Norway 2007 100 % 100 %<br />
<strong>TTS</strong> Marine AS Bergen, Norway 2009 100 % 100 %<br />
<strong>TTS</strong> Singapore Pte. Ltd. Singapore 2009 100 % 100 %<br />
<strong>TTS</strong> Greece Ltd. Pireus, Greece 2009 100 % 100 %<br />
Joint venture<br />
<strong>TTS</strong> BoHai Machinery Co. Ltd. Dalian, China 2005 50 % 50 %<br />
With accounting effect from January <strong>2010</strong>, the companies <strong>TTS</strong> Energy AS (surviving), <strong>TTS</strong> Energy Bergen AS and <strong>TTS</strong> Energy Ålesund AS<br />
were merged. Final closing date, including fiscal merger date is January 2011.<br />
<strong>TTS</strong> MARINE AB HAS THE FOLLOWING INVESTMENTS:<br />
Subsidiary Registered office Aqcuisition date Ownership (percent) Voting share<br />
<strong>TTS</strong> Marine GmbH (<strong>for</strong>mer <strong>TTS</strong> Ships Equipment GmbH) Bremen, Germany 1997 100 % 100 %<br />
<strong>TTS</strong> Marine Inc. Virginia, USA 1994 100 % 100 %<br />
<strong>TTS</strong> Hua Hai AB Gotheburg, Sweden 2002 100 % 100 %<br />
<strong>TTS</strong> Liftec Oy Tampere, Finland 2004 100 % 100 %<br />
<strong>TTS</strong> Port Equipment AB Gotheburg, Sweden 2005 100 % 100 %<br />
<strong>TTS</strong> Marine S.r.l Genoa, Italy 2006 100 % 100 %<br />
Joint venture<br />
<strong>TTS</strong> Hua Hai Ships Equipment Co. Ltd. Shanghai, China 2002 50 % 50 %<br />
<strong>TTS</strong> JV Jiangsu Shanghai, China 2007 50 % 50 %<br />
<strong>TTS</strong> Keyon Marine Equipment Co. Ltd. was sold during <strong>2010</strong>.<br />
71-93 nOTES TO ThE AccOUnTS <strong>TTS</strong> GROUP<br />
79
71-93 nOTES TO ThE AccOUnTS <strong>TTS</strong> GROUP<br />
note 9 cont.<br />
<strong>TTS</strong> MARINE GMBH HAS THE FOLLOWING INVESTMENTS:<br />
Subsidiary Registered office Aqcuisition date Ownership (percent) Voting share<br />
<strong>TTS</strong>-LMG Marine Cranes GmbH Lübeck, Germany 2004 100 % 100 %<br />
<strong>TTS</strong> Kocks Ostrava s.r.o Ostrava, Czech Republic 2005 100 % 100 %<br />
<strong>TTS</strong> Kocks GmbH Korea Co. Ltd Korea 2007 100 % 100 %<br />
<strong>TTS</strong> Marine Equipment Dalian, China 2008 100 % 100 %<br />
In <strong>2010</strong> <strong>TTS</strong> Kocks GmbH was merged with <strong>for</strong>mer <strong>TTS</strong> Ships Equipment GmbH. The company name was changed to <strong>TTS</strong> Marine GmbH in relations<br />
with the merger.<br />
<strong>TTS</strong> ENERGy AS HAS THE FOLLOWING INVESTMENTS:<br />
Subsidiary Registered office Aqcuisition date Ownership (percent) Voting share<br />
<strong>TTS</strong> Sense (Canada) Ltd. Edmonton, Canada 2007 100 % 100 %<br />
<strong>TTS</strong> Sense MUD AS Kristiansand, Norway 2007 100 % 100 %<br />
<strong>TTS</strong> Sense Pte Ltd Singapore Singapore 2007 100 % 100 %<br />
<strong>TTS</strong> EDM Inc USA 2007 100 % 100 %<br />
<strong>TTS</strong> Mexico S.A de C.V Mexico 2009 100 % 100 %<br />
<strong>TTS</strong> Drillrig AS Kristiansand, Norway <strong>2010</strong> 100 % 100 %<br />
Joint venture<br />
<strong>TTS</strong> Sense Drillfab AS Kristiansand, Norway 2007 50,0 % 50,0 %<br />
Maskinering og Sveiseservice AS Kristiansand, Norway 2007 34 % 34 %<br />
With accounting effect from January <strong>2010</strong>, the companies <strong>TTS</strong> Energy AS (surviving) and <strong>TTS</strong> Sense MUD AS was merged.<br />
Final closing date, including fiscal merger date is January 2011. Joint ventures are accounted <strong>for</strong> in accordance with the equity method.<br />
note 10 investments in joint ventures<br />
(Amounts in NOK 1000)<br />
Joint ventures are accounted <strong>for</strong> in accordance with the equity method.<br />
PER 31 DECEMBER THE GROUP HAS THE FOLLOWING INVESTMENTS IN JOINT VENTURES<br />
Company Registered office Aqcuisition date Ownership Voting share<br />
<strong>TTS</strong> Hua Hai Ships Equipment Co. Ltd. Shanghai, China 2002 50 % 50 %<br />
<strong>TTS</strong> Jiangsu Shanghai, China 2007 50 % 50 %<br />
<strong>TTS</strong> Bohai Machinery Co. Ltd. Dalian, China 2005 50 % 50 %<br />
Sense Drillfab AS Kristiansand, Norway 2007 50 % 50 %<br />
Maskinering og Sveiseservice AS Kristiansand, Norway 2007 34 % 34 %<br />
INTERESTS IN <strong>TTS</strong> Bohai <strong>TTS</strong> Hua Hai <strong>TTS</strong> Keyon<br />
JOINTLy CONTROLLED<br />
OPERATIONS<br />
Machinery<br />
Co. Ltd.<br />
Ships Equipment<br />
inkl. Jiangsu<br />
Marine Equipment<br />
Co. Ltd.<br />
Sense<br />
Drillfab Total<br />
Opening balance 01.01.<strong>2010</strong> 12 579 66 794 10 675 3 913 93 960<br />
Aqcuisitions/establishments 0 0 0 0 0<br />
Share of profit/loss 891 30 045 0 0 30 936<br />
Currency effect 935 5 225 -10 329 1 -4 168<br />
Closing balance 31.12.<strong>2010</strong> 14 405 102 064 346 3 914 120 730<br />
There are no contingent liabilities relating to the <strong>Group</strong>’s interests in the joint ventures and no contingent liabilities of the joint ventures themselves.<br />
GROUP’S SHARE OF PROFIT/LOSS, Long term Current Long term Current<br />
ASSETS AND LIABILITIES PER 31.12.10 assets assets liabilities liabilities Income Profit/loss<br />
<strong>TTS</strong> Hua Hai Ships Equipment Co., Ltd incl. Jiangsu 23 476 131 061 0 66 599 271 030 30 045<br />
<strong>TTS</strong> Bohai Machinery Co., Ltd 1 683 56 996 0 45 594 155 891 891<br />
<strong>TTS</strong> Keyon Marine Equipment Co., Ltd 0 0 0 0 0 0<br />
Sense Drillfab 239 4 114 0 2 303 7 547 0<br />
Total 25 398 192 171 0 114 496 434 468 30 936<br />
GROUP’S SHARE OF PROFIT/LOSS, Long term Current Long term Current<br />
ASSETS AND LIABILITIES PER 31.12.09 assets assets liabilities liabilities Income Profit/loss<br />
<strong>TTS</strong> Hua Hai Ships Equipment Co. Ltd. incl. Jiangsu 21 050 137 191 0 91 447 251 819 17 566<br />
<strong>TTS</strong> Bohai Machinery Co. Ltd. 1 956 75 076 0 64 453 127 271 935<br />
<strong>TTS</strong> Keyon Marine Equipment Co. Ltd. 4 500 45 000 0 38 825 0 3 140<br />
Sense Drillfab 0 3 913 0 0 0 0<br />
Total 27 506 261 180 0 194 725 379 090 21 641<br />
80
note 11 Trade and other receivables<br />
(Amounts in NOK 1000)<br />
<strong>2010</strong> 2009<br />
Trade receivables 572 278 704 684<br />
Loss provisions -83 479 -139 542<br />
Net trade receivables 488 799 565 141<br />
Recognised value of <strong>Group</strong> receivables per currency:<br />
Euro 162 425 178 375<br />
USD 80 097 211 856<br />
NOK 208 047 139 239<br />
Other currencies 38 231 35 671<br />
Total 488 799 565 141<br />
Additional in<strong>for</strong>mation on accounts receivables and associated risks, see 24 and sections 2.11, 3.1 and 4.0 under Accounting Principles.<br />
Other receivables under financial fixed assets:<br />
Loan capital Fast Ship 1 0 1 143<br />
Deposit 0 259<br />
Loan 0 1 998<br />
Other receivables 0 3 400<br />
Other receivables under short-term receivables:<br />
Foreign currency contracts 69 666 89 864<br />
Other receivables 123 051 102 484<br />
Other short-term receivables 192 717 192 348<br />
1) <strong>TTS</strong> <strong>Group</strong> <strong>ASA</strong> has given a convertible loan of 5 830 TNOK to FastShip Inc. Ref. Note 8.<br />
The loan was written down by 4 549 TNOK in 2007, 138 TNOK in 2008 an additionally 1 143 TNOK in <strong>2010</strong>.<br />
All are long-term receivables without fixed maturity.<br />
71-93 nOTES TO ThE AccOUnTS <strong>TTS</strong> GROUP<br />
81
71-93 nOTES TO ThE AccOUnTS <strong>TTS</strong> GROUP<br />
note 12 Long-term liabilities<br />
(Amounts in NOK 1000)<br />
PERiOD OF REPAYMEnT AnD MATURiTY DATES<br />
Balance 2016<br />
31.12.10 2011 2012 2013 2014 2015 and later<br />
Bond loan 400 000 0 400 000 0 0 0 0<br />
Long-term liabilities 150 685 30 554 81 063 4 500 3 575 18 550 12 444<br />
Total long-term debt incl. first year instalments 550 685<br />
- first year installment of long-term debt -30 554 0 0 0 0 0 0<br />
Total long-term debt 520 132 30 554 481 063 4 500 3 575 18 550 12 444<br />
Expected interest payments 31 700 17 000 2 000 2 000 2 000 1 000<br />
SPEciFicATiOn OF LOAnS<br />
82<br />
Loan Nominal Installment Book value Book value<br />
type Currency interest rate Maturity terms <strong>2010</strong> 2009<br />
<strong>TTS</strong> GROUP <strong>ASA</strong><br />
Nordea <strong>ASA</strong> Mortgage loan NOK Nibor+2.75 % 2011 quarterly 3 590 10 730<br />
Norsk Tillitsmann <strong>ASA</strong> Bond Issue NOK Nibor +3.375 %* 2012 none 400 000 450 000<br />
Innovasjon Norge Mortgage loan NOK 5.75 % 2015 bi-annually 15 000 15 000<br />
DRILLRIG AS<br />
Ability Drilling, bankruptcy estate Mortgage loan NOK 6.00 % 2012 none 75 000 0<br />
<strong>TTS</strong> MARINE GMBH<br />
Nordea Mortgage loan EUR Euribor +1.15 % 2011 quarterly 5 276 11 226<br />
<strong>TTS</strong> KOCKS OSTRAVA<br />
Unicredit Bank Mortgage loan EUR Euribor +1.275 % 2012 quarterly 3 125 3 304<br />
<strong>TTS</strong> KOCKS KOREA LTD.<br />
Pusan Bank Mortgage loan KRW 4.40 % 2014 quarterly 5 075 6 695<br />
<strong>TTS</strong> MARINE SHANGHAI<br />
DnB NOR Bank AS Shanghai Branch Mortgage loan EUR market rate + 1.5 % 2011 none 15 625 0<br />
DnB NOR Bank AS Shanghai Branch Mortgage loan EUR market rate + 1.5 % 2015 none 15 625 0<br />
DnB NOR Bank AS Shanghai Branch Mortgage loan RMB market rate 2016 none 12 444 0<br />
Total 550 685 496 880<br />
*) In addition comes approximately 0.3 % in capitalization costs. The bond matures 27.05.2012.<br />
Fair value is estimated to approximately equal to carrying value as the loans are based on market terms and no fixed-rate terms exists.<br />
Recognised value of the <strong>Group</strong>’s long-term liabilities in various currencies are as follows:<br />
<strong>2010</strong> 2009<br />
NOK 493 515 475 655<br />
EUR 39 651 11 226<br />
RMB 12 444 0<br />
CZK 0 3 304<br />
KRW 5 075 6 695<br />
Total 550 685 496 880<br />
See Note 13 <strong>for</strong> security on long-term debt.<br />
Risk related to the estimates that <strong>for</strong>m the basis <strong>for</strong> the book values are<br />
further described in Accounting principles, under sections 2.7, 2.14, 3 and 4.
note 13 Assets pledged as security and guarantees<br />
(Amounts in NOK 1000)<br />
The credit facility of <strong>TTS</strong> <strong>Group</strong> <strong>ASA</strong> in Norway is established with Nordea Norge <strong>ASA</strong> (Nordea) and Sparebanken Vest,<br />
with Nordea as agent. <strong>TTS</strong> <strong>Group</strong> <strong>ASA</strong> has the following credit facilities:<br />
<strong>2010</strong> 2009<br />
Limit Drawn Limit Drawn<br />
<strong>Group</strong> account/bank overdraft facility 327 000 -81 332 330 000 -152<br />
Drawing facility, operations 425 000 425 000 475 000 475 000<br />
Guarantee limit <strong>for</strong> <strong>Group</strong> (including Energy division) 425 000 401 431 425 000 427 598<br />
Per 31.12.10 the Norwegian companies, as well as <strong>TTS</strong> Sense Canada, <strong>TTS</strong> Marine AB, <strong>TTS</strong> Port Equipment AB and <strong>TTS</strong> Marine GmbH are included<br />
in the <strong>Group</strong> account. The same applies <strong>for</strong> the <strong>Group</strong>’s guarantee limit. The guarantee limits covers payment guarantee, per<strong>for</strong>mance bonds,<br />
advance payment bonds and tax guarantees.<br />
For the above mentioned facilities the following assets (from <strong>TTS</strong> <strong>Group</strong> <strong>ASA</strong>, <strong>TTS</strong> Energy AS, <strong>TTS</strong> Handling Systems AS, <strong>TTS</strong> Ships Equipment AS<br />
and Norlift AS, which also holds responsibility) have been pledged as collateral to Nordea:<br />
Assets pledged as collateral <strong>for</strong> secured debt: <strong>2010</strong> 2009<br />
Shares in <strong>TTS</strong> Marine AB 519 827 519 827<br />
Account/<strong>Group</strong> receivables 645 920 300 148<br />
Non-invoiced production 91 100 226 954<br />
Inventory/Work in progress 321 200 305 437<br />
Prepayments to suppliers 65 951 145 010<br />
Property 3 050 3 155<br />
Total assets pledged as collateral 1 647 048 1 500 530<br />
In addition the following has been pledged with leasing right with additional equipment.<br />
<strong>TTS</strong> GROUP <strong>ASA</strong><br />
<strong>TTS</strong> <strong>Group</strong> <strong>ASA</strong> has a loan in Innovasjon Norge <strong>for</strong> establishment<br />
of <strong>TTS</strong> Marine Equipment (Dalian, Kina) Co. Ltd. The loan of 15 MNOK<br />
has security in the shares of <strong>TTS</strong> Marine Equipment Co. Ltd.<br />
<strong>TTS</strong>-LMG MARINE CRANES GMBH<br />
As of 31.12.<strong>2010</strong> 6,2 MNOK (0,8 MEUR) was drawn in guarantees.<br />
This amount is included in the total guarantee drawn with Nordea<br />
of 401 MNOK in the above table.<br />
MARINE GMBH<br />
As of 31.12.<strong>2010</strong> 38.2 MNOK (4.9 MEUR) was drawn in guarantees.<br />
This amount is included in the total guarantee drawn with Nordea<br />
of 401 MNOK in the above table.<br />
<strong>TTS</strong> LIFTEC Oy<br />
<strong>TTS</strong> Liftec Oy has a bank guarantee limit of 25 MNOK (3.0 MEUR)<br />
with Sampo Pankki Oyi (Sampo Bank) in Finland. As of 31.12.10 this<br />
was drawn with 2.3 MNOK (285 000 EUR). The bank has a parent<br />
company guarantee from <strong>TTS</strong> <strong>Group</strong> <strong>ASA</strong> of 27,5 MNOK (3.3 MEUR).<br />
<strong>TTS</strong> MARINE SHANGHAI CO. LTD.<br />
<strong>TTS</strong> Marine Shanghai Co. Ltd. has established a credit facility<br />
with DnB Bank <strong>ASA</strong>, Shanghai Branch with a credit limit of<br />
31.25 MNOK (4 MEUR) which was drawn with 31,25 MNOK<br />
(4 MEUR) as of 31.12.10. A credit limit has also been established<br />
in RMB of 26.7 MNOK (30 MRMB) which was drawn with<br />
12,4 MNOK (14 MRMB) as of 31.12.10. The bank has a parent<br />
company guarantee from <strong>TTS</strong> <strong>Group</strong> <strong>ASA</strong> of 7,8 MNOK (1 MEUR).<br />
<strong>TTS</strong> MARINE AB<br />
<strong>TTS</strong> Marine AB has established several bank guarantee agreements<br />
with Bohus Banken (part of Den danske Bank). As per 31.12.10 total<br />
guarantees were 122.8 MNOK (141.0 MSEK). The bank has a parent<br />
company guarantee from <strong>TTS</strong> <strong>Group</strong> <strong>ASA</strong> of 150 MNOK.<br />
71-93 nOTES TO ThE AccOUnTS <strong>TTS</strong> GROUP<br />
<strong>TTS</strong> KOCKS OSTRAVA S.R.O<br />
TSS Kocks Ostrava s.r.o has established a loan of 3.1 MNOK (0.4 MEUR)<br />
with UniCredit Bank Czech Republic a.s in the Czech Republic. The<br />
company also has a credit limit of 1.5 MNOK (5 MCZK), with a draw<br />
of 1.4 MNOK (4.5 MCZK) as of 31.12.10. The bank has security in the<br />
company’s assets, in addition <strong>TTS</strong> <strong>Group</strong> <strong>ASA</strong> is co-debtor. The assets<br />
are recorded to 15,3 MNOK (49 MCZK).<br />
<strong>TTS</strong> PORT EQUIPMENT AB<br />
<strong>TTS</strong> Port Equipment AB has established several bank guarantee agreements<br />
with Bohus Banken (part of Den danske Bank). As per 31.12.10<br />
total guarantees were 45.2 MNOK (51.9 MSEK). The bank has a parent<br />
company guarantee from <strong>TTS</strong> <strong>Group</strong> <strong>ASA</strong> of 50 MNOK.<br />
<strong>TTS</strong> KOCKS KOREA<br />
<strong>TTS</strong> Kocks Korea s.r.o has established a loan of 7,1 MNOK (1 366,4 MKRW)<br />
with Pusan Bank in Korea. The company also has a credit limit of<br />
12.3 MNOK (2 500 MKRW), of which 10.9 MNOK (2 102 MKRW) was<br />
drawn. The bank has security in the company’s building, in addition<br />
<strong>TTS</strong> <strong>Group</strong> <strong>ASA</strong> is co-debtor. The building is recorded to 18.23 MNOK<br />
(3 506.7 MKRW).<br />
DRILLRIG AS<br />
Drillrig AS has established a loan of MNOK 75.0 with the bankruptcy<br />
estate of Ability Drilling in connection with the purchase of a land<br />
rig from the estate. The Ability Drilling estate has security <strong>for</strong> unpaid<br />
purchase in the rig. The rig value equal MNOK 75.0. As of 31.12.<strong>2010</strong>,<br />
the rig is recognized as inventory.<br />
83
71-93 nOTES TO ThE AccOUnTS <strong>TTS</strong> GROUP<br />
note 13 cont.<br />
COVENANTS<br />
The <strong>Group</strong> has undertaken to meet the following financial strength requirements <strong>for</strong> Nordea:<br />
There is a requirement that the group equity shall be greater than 800 MNOK at all time. In addition, the equity ratio must be greater than 25 %.<br />
Nordea has accepted that the subordinated con vertible bond loan of 200 MNOK are to be considered as equity as per 31.12.<strong>2010</strong>. With an equity<br />
of 802 MNOK together with the subordinated convertible bond loan of 200 MNOK, the equity rate as per 31.12.<strong>2010</strong> is 29.0 %, thus <strong>TTS</strong> <strong>Group</strong> meet<br />
the financial covenant requirement as per 31.12.<strong>2010</strong>. Part of the syndicate facility (150 MNOK) must be repaid latest within 31.12.2011, or sooner<br />
if proceeds from sales of assets or material inventory sale are material. Please find maturity description <strong>for</strong> the <strong>Group</strong>’s financial liabilities<br />
in section 3.1 under Accounting principles.<br />
The <strong>Group</strong> has undertaken to meet the following financial strength requirements <strong>for</strong> Norsk Tillitsmann <strong>ASA</strong>:<br />
There is a requirement that the equity shall be greater than 550 MNOK at any time. Norsk Tillitsmann <strong>ASA</strong> has accepted that the subordinated<br />
convertible bond loan of 200 MNOK are to be considered as equity as per 31.12.<strong>2010</strong>. With an equity of 802 MNOK together with the subordinated<br />
convertible bond loan of 200 MNOK, the equity rate as per 31.12.<strong>2010</strong> is 29.0 %, thus <strong>TTS</strong> <strong>Group</strong> meet the financial covenant requirement as per<br />
31.12.<strong>2010</strong>. Regarding the bond loan there is in addition to the covenant requirement of equity ratio at 22,5 % and nominal equity of 550 MNOK,<br />
a multiple of other standard default clauses related to the bond loan inclusive cross default clauses.<br />
note 14 Tax<br />
(Amounts in NOK 1000)<br />
Deferred tax and deferred tax assets are netted if the <strong>Group</strong> has a legal right to offset deferred tax assets against defferd taxes in the balance<br />
sheet, and if the deferred taxes are owed to the same tax authorities<br />
<strong>2010</strong> 2009<br />
DEFERRED TAx ASSETS<br />
Gross deferred tax assets -273 927 -230 579<br />
- Write down of deferred tax assets 88 500 0<br />
- Offset deferred taxes 22 967 42 949<br />
- Deferred tax assets to be recovered after 12 months<br />
- Deferred tax assets to be recovered within 12 months<br />
-162 460 -187 630<br />
Total recognised deferred tax assets -162 460 -187 630<br />
DEFERRED TAxES<br />
Gross deferred tax 48 526 65 288<br />
- Netted deferred taxes against deferred tax assets -22 967 -42 949<br />
- Deferred tax to be recovered after 12 months 25 559 22 339<br />
- Deferred tax to be settled within 12 months<br />
Total recognised deferred taxes 25 559 22 339<br />
Net deferred taxes in <strong>Group</strong> -136 901 -165 291<br />
Change in recognised deferred taxes<br />
Recognised value 1.1. -165 291 -41 233<br />
Recognised in period (see specification under) -71 586 -115 349<br />
Deferred tax related to the acquisition of <strong>TTS</strong> Sense 0 -6 426<br />
Depreciation of deferred tax assets 88 500 0<br />
Prior period adjustment of deferred taxes 11 476 -2 283<br />
Recognised value 31.12. -136 901 -165 291<br />
Change in deferred taxes and deferred tax assets (excluding netting within the same tax regime):<br />
1.1.2009 Changes 2009 31.12.2009 Changes <strong>2010</strong> 31.12.<strong>2010</strong><br />
DEFERRED TAxES/DEFERRED TAx ASSETS<br />
Fixed assets 7 044 4 665 11 709 310 12 020<br />
Current assets 92 354 -19 166 73 188 -82 688 -9 500<br />
Other temporary differences/provisions 16 047 12 798 28 845 -12 324 16 521<br />
Deferred tax credit -6 182 0 -6 182 0 -6 182<br />
Deferred tax benefits -1 260 0 -1 260 0 -1 260<br />
Impairment deferred tax assets 0 0 0 88 500 88 500<br />
Tax deductable losses -160 800 -113 646 -274 446 34 591 -239 855<br />
Change in deferred taxes related to business combinations 6 426 -6 426 0 0 0<br />
Prior period adjustment 3 879 -2 283 1 596 0 1 596<br />
Deferred tax assets not recognised 1 260 0 1 260 0 1 260<br />
Net deferred tax assets -41 232 -124 058 -165 291 28 389 -136 901<br />
84
note 14 cont.<br />
Deferred tax assets related to tax deficit carried <strong>for</strong>ward have been recognised as deferred tax assets. This as an effect of the positive future<br />
prospects to offset the tax deficit against expected taxable profit in the years to come.<br />
<strong>TTS</strong> <strong>Group</strong> and particularly the Norwegian entities allocated to the Energy division have in 2008, 2009 and <strong>2010</strong> had considerable tax losses.<br />
This is mainly due to the loss of contracts caused by cancellations, recorded tax-related development costs and tax-related losses on accounts<br />
receivables. These tax losses is considered economic fluctuations and are not expected to be a recurring theme in the coming years.<br />
As a result of the losses there has been a considerable build-up of tax-related losses in Norway and Germany.<br />
The <strong>Group</strong> has received and is expecting orders to yield taxable profit in the years to come. Taxable income may be counterbalanced against<br />
the carried deficit, enabling utilisation of the tax advantage. An assesment has been made based on IFRS requirements regarding reversion<br />
of the tax losses in light of the expected tax profit.<br />
The following criteria has been applied to assess the likelihood of taxable income against which unused tax losses may be utilised:<br />
- the <strong>Group</strong> has sufficient temporary differences<br />
- tax losses is induced by specific identifiable causes<br />
71-93 nOTES TO ThE AccOUnTS <strong>TTS</strong> GROUP<br />
Specification of differences between the financial profit<br />
be<strong>for</strong>e tax and the tax basis <strong>for</strong> the year: <strong>2010</strong> 2009<br />
Pre-tax profit/loss -156 103 -311 942<br />
Permanent differences -37 965 40 307<br />
Changes in temporary differences 226 440 -411 960<br />
Utilisation of tax deductable losses 36 670 -361<br />
Tax basis <strong>for</strong> the year 69 042 -683 956<br />
Decomposition of tax cost:<br />
Payable tax 1) 23 639 51 889<br />
Impairment deferred tax assets 88 500 0<br />
Change in tax deductable losses -71 586 -115 349<br />
Tax cost in the P&L statement 40 553 -63 460<br />
1 ) Tax payable is related to the <strong>for</strong>eign subsidiaries’ taxable profit that cannot be offset against tax losses carry<strong>for</strong>ward in Norway.<br />
Tax payable in the balance sheet: <strong>2010</strong> 2009<br />
Tax payable 23 639 51 889<br />
Prepaid tax in <strong>for</strong>eign subsidiaries -17 959 -32 581<br />
Total tax payable 5 680 19 308<br />
Average tax rate <strong>for</strong> <strong>Group</strong> 22.0 % 22.0 %<br />
Tax calculated at nominal tax rate -34 343 -68 627<br />
Prior period adjustment deferred taxes -14 937 1 060<br />
Impairment deferred tax assets 88 500 0<br />
Profit JV -8 136 -4 761<br />
Permanent differences 9 469 8 868<br />
Tax cost in the P&L statement 40 553 -63 460<br />
The <strong>Group</strong> has received and are expecting orders to yield a positive taxable profit the coming years. Taxable income may be offset against<br />
the carried deficit, enabling utilisation of the tax advantage over time. In accordance with IFRS requirements, impairment testing of<br />
the value of deffered tax assets have been carried out in light of the expected reversal date <strong>for</strong> the tax losses. Given the current market<br />
situation, the <strong>Group</strong>’s business structure and expected earnings, the <strong>Group</strong> assesses that the accrued tax losses in Norway cannot be fully<br />
utilised within the recommended assessment horizon.<br />
Losses carried <strong>for</strong>ward - Norwegian entities - 31.12.10 205 734<br />
Present value adjustment of expected earnings 2011-2016 - Norwegian entities 1) 117 234<br />
Impairment deferred tax assets 88 500<br />
1) Expected earnings are based on the budget <strong>for</strong> 2011 and established strategy plans <strong>for</strong> the period up to 2016.<br />
The required rate of return (WACC) is calculated on the basis of the capital asset pricing model (CAPM) and set at 9.5 %. The required return<br />
on the total capital is be<strong>for</strong>e tax and deducted of inflation. All divisions are given the same rate of return (9.5 %). The beta values<br />
are calculated by comparison with similar listed companies. An assuption of a risk premium of 5 % <strong>for</strong> equity applies <strong>for</strong> all divisions.<br />
Various structural alternatives are continuously assessed to ensure the utilization of tax positions in Norway.<br />
85
71-93 nOTES TO ThE AccOUnTS <strong>TTS</strong> GROUP<br />
note 15 Liquid assets/interest-bearing debt<br />
(Amounts in NOK 1000)<br />
<strong>2010</strong> 2009<br />
Bank deposits, cash etc. as of 31.12. 272 331 191 907<br />
Deposits (+)/Withdrawals (-) in the cash pool agreement as of 31.12. -81 330 152<br />
Other short term interest bearing debt -989 560 -1 030 694<br />
Net interest-bearing debt - /deposits + -798 559 -838 635<br />
Drawing facilities, security and covenants are described in Note 13.<br />
note 16 Share capital and shareholder in<strong>for</strong>mation<br />
(Amounts in NOK)<br />
Number of shares as of 31 December Nominal value Book value of share capital<br />
74 631 199 0.50 37 315 600<br />
THE FOLLOWING COMPANIES ARE INCLUDED IN <strong>TTS</strong> GROUP:<br />
Ownership Share Number<br />
Company Owner interest Currency capital of shares<br />
Norlift AS <strong>TTS</strong> <strong>Group</strong> <strong>ASA</strong> 100 % NOK 500 000 500<br />
<strong>TTS</strong> Handling Systems AS <strong>TTS</strong> <strong>Group</strong> <strong>ASA</strong> 100 % NOK 950 000 95 000<br />
<strong>TTS</strong> Ships Equipment AS <strong>TTS</strong> <strong>Group</strong> <strong>ASA</strong> 100 % NOK 2 500 000 2 500<br />
Hydralift Marine AS <strong>TTS</strong> <strong>Group</strong> <strong>ASA</strong> 100 % NOK 100 000 1 000<br />
<strong>TTS</strong> Marine AB (<strong>for</strong>mer <strong>TTS</strong> Ships Equipment AB) <strong>TTS</strong> <strong>Group</strong> <strong>ASA</strong> 100 % SEK 2 000 000 2 000<br />
<strong>TTS</strong> Marine Shanghai Co Ltd <strong>TTS</strong> <strong>Group</strong> <strong>ASA</strong> 100 % USD 200 000 3 500<br />
<strong>TTS</strong> Marine AS <strong>TTS</strong> <strong>Group</strong> <strong>ASA</strong> 100 % NOK 1 000 000 1 000<br />
<strong>TTS</strong> Singapore <strong>TTS</strong> <strong>Group</strong> <strong>ASA</strong> 100 % SGD 1 141 813 1 141 813<br />
<strong>TTS</strong> Greece <strong>TTS</strong> <strong>Group</strong> <strong>ASA</strong> 100 % EUR 200 000 2 000<br />
<strong>TTS</strong> Marine GmbH (<strong>for</strong>mer <strong>TTS</strong> Ships Equipment GmbH) <strong>TTS</strong> Marine AB 100 % EUR 255 646 5 000<br />
<strong>TTS</strong> Marine Inc. <strong>TTS</strong> Marine AB 100 % USD 190 000 1 900<br />
<strong>TTS</strong>-LMG Marine Cranes GmbH <strong>TTS</strong> Marine GmbH 100 % EUR 25 000 1<br />
<strong>TTS</strong> Liftec Oy <strong>TTS</strong> Marine AB 100 % EUR 76 500 1 020<br />
<strong>TTS</strong> Port Equipment AB <strong>TTS</strong> Marine AB 100 % SEK 100 000 1 000<br />
<strong>TTS</strong> Kocks Ostrava s.r.o. <strong>TTS</strong> Marine GmbH 100 % EUR 310 291 1 000<br />
<strong>TTS</strong> Marine Equipment <strong>TTS</strong> Marine GmbH 100 % RMB 15 728 611 1 000<br />
<strong>TTS</strong> Marine S.r.l <strong>TTS</strong> Marine AB 100 % EUR 10 400 1 000<br />
<strong>TTS</strong> Energy Bergen AS (<strong>for</strong>mer <strong>TTS</strong> Marine Cranes AS) 1 <strong>TTS</strong> <strong>Group</strong> <strong>ASA</strong> 100 % NOK 1 000 000 1 000<br />
<strong>TTS</strong> Cranes Norway<br />
<strong>TTS</strong> Energy Ålesund AS<br />
<strong>TTS</strong> <strong>Group</strong> <strong>ASA</strong> 100 % NOK 500 000 1 000<br />
(<strong>for</strong>mer <strong>TTS</strong> Offshore Handling Equipment AS) 1 <strong>TTS</strong> <strong>Group</strong> <strong>ASA</strong> 100 % NOK 100 000 100 000<br />
<strong>TTS</strong> Energy AS (<strong>for</strong>mer <strong>TTS</strong> Sense AS) 1 <strong>TTS</strong> <strong>Group</strong> <strong>ASA</strong> 100 % NOK 1 200 288 400 076<br />
<strong>TTS</strong> Kocks Korea <strong>TTS</strong> Marine GmbH 100 % KRW 1 513 390 000 1 000<br />
<strong>TTS</strong> Hua Hai AB <strong>TTS</strong> Marine AB 100 % SEK 100 000 1 000<br />
<strong>TTS</strong> Sense (Canada) Ltd <strong>TTS</strong> Energy AS 100 % CAD 100 10<br />
<strong>TTS</strong> Sense MUD AS1 <strong>TTS</strong> Energy AS 100 % NOK 1 000 000 1 000<br />
<strong>TTS</strong> Sense Pte Ltd Singapore <strong>TTS</strong> Energy AS 100 % SGD 100 000 100 000<br />
<strong>TTS</strong> Sense Drillfab <strong>TTS</strong> Energy AS 50 % NOK 1 000 000 100 000<br />
<strong>TTS</strong> EDM Inc <strong>TTS</strong> Energy AS 100 % USD 100 000 1 000<br />
<strong>TTS</strong> Mexico <strong>TTS</strong> Energy AS 100 % MxN 50 000 50 000<br />
Drillrig AS <strong>TTS</strong> Energy AS 100 % NOK 100 000 100 000<br />
1) <strong>TTS</strong> Energy Ålesund (<strong>for</strong>merly <strong>TTS</strong> Offshore Handling Equipment AS), <strong>TTS</strong> Energy Bergen (<strong>for</strong>merly <strong>TTS</strong> Marine Cranes),<br />
<strong>TTS</strong> Energy AS (<strong>for</strong>merly <strong>TTS</strong> Sense AS) and <strong>TTS</strong> Sense MUD AS were merged in January 2011.<br />
86
note 16 cont.<br />
PRINCIPAL SHAREHOLDERS OF <strong>TTS</strong> GROUP <strong>ASA</strong> AS OF 31.12.10<br />
Shareholder Number of shares Ownership Voting share<br />
Rasmussengruppen AS 10 650 800 14.27 % 14.27 %<br />
Skeie Technology AS 8 929 879 11.97 % 11.97 %<br />
Skandinaviska Enskilda Banken 5 732 552 7.68 % 7.68 %<br />
Lesk AS 5 306 058 7.11 % 7.11 %<br />
Stisk AS 5 306 058 7.11 % 7.11 %<br />
Odin Maritim 2 164 000 2.90 % 2.90 %<br />
Tamafe Holding AS 2 160 735 2.90 % 2.90 %<br />
Barrus Capital AS (Ii) 2 000 000 2.68 % 2.68 %<br />
Holberg Norge 1 918 589 2.57 % 2.57 %<br />
Statoil Pensjon 1 543 937 2.07 % 2.07 %<br />
Itlution AS 1 475 261 1.98 % 1.98 %<br />
Shb Stockholm Clients Account 1 416 768 1.90 % 1.90 %<br />
Holberg Norden 1 201 329 1.61 % 1.61 %<br />
Skagen Vekst 1 176 000 1.58 % 1.58 %<br />
Sal Oppenheim Jr & Cie 1 100 000 1.47 % 1.47 %<br />
Rbc Dexia Investor Services Bank 962 000 1.29 % 1.29 %<br />
Skeie Consultants AS 953 033 1.28 % 1.28 %<br />
Odin Europa SMB 848 619 1.14 % 1.14 %<br />
Sundt AS 656 000 0.88 % 0.88 %<br />
Statoil Forsikring A.S 416 987 0.56 % 0.56 %<br />
Total, 20 largest shareholders 55 918 605 74.93 % 74.93 %<br />
Total other 18 712 594 25.07 % 25.07 %<br />
Total 74 631 199 100.00 % 100.00 %<br />
SHARES OWNED By BOARD MEMBERS, GROUP ExECUTIVES AND THEIR RELATIVES:<br />
Board Per 31.12.10 Per 31.03.11<br />
Trym Skeie 1 2 160 735 2 160 735<br />
Bjarne Skeie 2 20 495 028 20 495 028<br />
Karen T. Mørkestøl 3 217 3 217<br />
Jarle Dyrdal 30 227 30 227<br />
<strong>Group</strong> executives<br />
Johannes D. Neteland 185 000 185 000<br />
Related daugther Anna S. Neteland 100 100<br />
Ivar K. Hanson 52 422 52 422<br />
Lennart Svensson 200 200<br />
Inge Gabrielsen 450 450<br />
1) Owns 100 % of the shares in Tamafe Holding.<br />
2) Bjarne Skeie owns 20 % of the shares and 100 % of the voting shares in Skeie Technology AS and Skeie Consultants AS.<br />
Lesk AS is owned by related daugther Lena Skeie. Stisk AS is owned by related daugther Stina Skeie.<br />
On 03.06. <strong>2010</strong> it was decided at the ordinary general meeting to give the Board authority to issue up to<br />
7 000 000 shares in the event of acquisitions or mergers. The authority is valid until the ordinary general<br />
meeting <strong>for</strong> <strong>2010</strong>, at 30.06. 2011 at the latest. In relation to this authority 6 722 920 shares were issued<br />
through private placing in July of <strong>2010</strong>.<br />
As of 31.12. <strong>2010</strong>, 240 000 options were allotted that can be exercised until 15.06.11 at a price of 7,55 NOK.<br />
(from an authorisation <strong>for</strong> a total of 420 000 options granted at the ordindary general meeting of 15.06.09).<br />
In addition there has been issued 360 000 options, of which can be exercised until 03.06. 2012 with a strike<br />
price of 5,91 NOK. (from an authorisation <strong>for</strong> a total of 420 000 options granted at the ordindary general<br />
meeting of 03.06.10).<br />
71-93 nOTES TO ThE AccOUnTS <strong>TTS</strong> GROUP<br />
87
71-93 nOTES TO ThE AccOUnTS <strong>TTS</strong> GROUP<br />
note 16 cont.<br />
ALLOCATION OF OPTIONS:<br />
Number Number<br />
of options of options<br />
exercisable Strike exercisable Strike<br />
Name Position Company until 15.06.11 price until 03.06.12 price Total<br />
Johannes D. Neteland CEO <strong>TTS</strong> <strong>Group</strong> <strong>ASA</strong> 120 000 7.55 120 000 5.91 240 000<br />
Arild Apelthun CFO <strong>TTS</strong> <strong>Group</strong> <strong>ASA</strong> 0 60 000 5.91 60 000<br />
Lennart Svensson COO <strong>TTS</strong> Port Equipment AB 60 000 7.55 60 000 5.91 120 000<br />
Ivar K. Hanson COO <strong>TTS</strong> Marine AS 60 000 7.55 60 000 5.91 120 000<br />
Inge Gabrielsen COO <strong>TTS</strong> Energy AS 0 60 000 5.91 60 000<br />
Total number of options to senior executives 240 000 360 000 600 000<br />
No share options has been exercised in <strong>2010</strong>.<br />
In accordance with authorities granted by the annual general meeting in 2008, 2009 and <strong>2010</strong>, <strong>TTS</strong> has issued share option programmes to senior<br />
executives. Through these programmes, Senior Executivent in the <strong>TTS</strong> <strong>Group</strong> have a future right to purchase a number of shares at an exercise price<br />
equal to the marked rate on the date that the share option programme was initiated. The option premium is estimated on the date of allotment using<br />
the Black & Scholes option pricing model (BS).<br />
The options have a maximum term of two years, with a possible first exercise after one year (50 %), then (12.5 %) per quarter, giving a weighted<br />
averaged of 15 months maturity which is employed in BS. The option premium is distributed over the option’s two-year term.<br />
Implied volatility is based on a combination of historic data and assumptions.<br />
For options issued in 2008, 42 % volatility is used, 74 % volatility <strong>for</strong> 2009, and 81 % volatility <strong>for</strong> <strong>2010</strong>.<br />
For 2008 a risk-free interest rate of 5.0 % is used, 2.95 % <strong>for</strong> 2009 and 2.23% <strong>for</strong> <strong>2010</strong>. For <strong>2010</strong>, 2 395 TNOK in option premium has been charged<br />
as expenses classified as salary in the profit and loss statement.<br />
Comparable numbers in 2009 were 5 437 TNOK. Payroll taxes are charged when share options are realised.<br />
OWN SHARES<br />
A resolution was adopted at the Annual General Meeting not to grant 15.06.09 the Board authorisation to purchase the company’s own shares.<br />
This resolution was upheld in <strong>2010</strong>. In the period from 15.06. 2009 to 31.12. <strong>2010</strong> <strong>TTS</strong> has owned a maximum of 133 100 shares. Treasury shares as<br />
of 31.12.10 was 35 210.<br />
SUBORDINATED CONVERTIBLE LOAN<br />
10 January 2011 the extraordinary general meeting approved the issuance of a convertible bond loan of 200 MNOK. The loan has been given an 8 %<br />
coupon rate and reaches maturity 18.01.2016. On specific terms the <strong>Group</strong> has a call option that expires on 08.02.2014. Bondholders have continuous<br />
conversion rights with an exercise price of 9.2839 NOK. The maximum number of shares to be issued at full conversion is 21 542 671, equivalent to<br />
a dilution effect of 28.87 %.<br />
note 17 Other short-term liabilities<br />
(Amounts in NOK 1000)<br />
<strong>2010</strong> 2009<br />
Provisions <strong>for</strong> project (see Note 21) 139 774 140 451<br />
Other liability provisions (see Note 21) 101 161 87 058<br />
Foreign currency contracts 48 777 55 675<br />
Other current liabilities 37 630 139 440<br />
Total Other short-term liabilities 327 342 422 624<br />
The best estimate <strong>for</strong> maturity date <strong>for</strong> completed projects are within 12 months from balance-sheet date.<br />
note 18 Other operating cost<br />
(Amounts in NOK 1000)<br />
<strong>2010</strong> 2009<br />
Premises and office expenses 51 743 58 325<br />
Computer expences 15 876 18 866<br />
Marketing and travel expences 59 575 80 543<br />
Other expences 106 415 120 183<br />
Total other operating expenses 233 609 277 917<br />
88
note 19 Related parties<br />
(Amounts in NOK 1000)<br />
The subsidiaries (Note 9), Investments in joint ventures (Note 10), members of the Board (Note 4)<br />
and members of the Senior Executive <strong>Group</strong> are considered as related parties.<br />
The group has carried out various transactions with underlying companies and joint ventures.<br />
All the transactions have been carried out as part of the ordinary operations and at arm’s length prices.<br />
Sales: <strong>2010</strong> 2009<br />
Joint ventures 227 453 50 658<br />
Cost of sales:<br />
Joint ventures 284 301 193 738<br />
BALANCE SHEET ITEMS RELATED TO PURCHASE AND SALE OF GOODS AND SERVICES<br />
Receivables<br />
Joint ventures 2 311 124 080<br />
Liabilities<br />
Joint ventures 58 483 10 266<br />
In<strong>for</strong>mation on the Board and <strong>Group</strong> management’s shares and options are stated in Note 16.<br />
There are no further transactions with related parties.<br />
note 20 Derivatives<br />
(Amounts in NOK 1000)<br />
<strong>2010</strong> 2009<br />
Assets Liabilities Assets Liabilities<br />
Forward currency contracts – fair value hedging 47 505 68 867 52 795 88 911<br />
Forward currency contracts to fair value of the result 1 272 799 415 2 965<br />
Forward currency contracts Total 48 777 69 666 53 210 91 876<br />
Fair value of hedging instruments are classified as current assets or short-term liabilities. Fair value of derivatives are classified<br />
as current assets or short-term liabilites, as the hedging items and derivatives mainly falls due within 12 months.<br />
Matured<br />
Q1 2011 -9 839<br />
Q2 2011 1 447<br />
Q3 2011 -5 691<br />
Q4 2011 -2 194<br />
2012 -4 507<br />
2013 -106<br />
Total -20 890<br />
FORWARD CURRENCy CONTRACTS<br />
The nominal value of the outstanding <strong>for</strong>ward currency contracts at 31.12.<strong>2010</strong> is 2.355 MNOK compared to 2.271 MNOK in 2009.<br />
Derivatives are on principal recognised at fair value on the date of contract signing. The value is adjusted to fair value in later periods.<br />
The value is set to observable market price.<br />
<strong>TTS</strong> enters into hedging contracts that qualify as, and are considered accounting wise to be, actual value hedges. In addition to this,<br />
the <strong>Group</strong> has hedging contracts that no longer meet the criteria <strong>for</strong> hedging accounting as the underlying delivery contract has been<br />
cancelled. These are recognised at fair value in the financial statement.<br />
Changes to fair value that meets the criteria of an effective hedge is recognised in the financial statement with the change in fair value<br />
of the assets or liabilities that are being hedged.<br />
The ineffective portion of the recognised hedge value amounts to 473 TNOK and is posted together with the changes in value of derivatives.<br />
The asset or liability being hedged is contractual income or cost related to production cost. Hedged assets or liabilities are recognised<br />
in the balance sheet at actual value. The hedged asset or liability represents, among other things, the part of the contractual income<br />
or cost that has not been invoiced on the balance sheet date, or where invoices have not been received from the supplier. The asset and<br />
liability is included in Other Short-term Assets and Other Short-term Liabilities respectively. Additionally the hedged assets or liability<br />
<strong>for</strong> each contract is represented through bank, client or supplier.<br />
For additional in<strong>for</strong>mation on <strong>for</strong>eign currency and appurtenant risks, see Accounting principles, section 2.9 og 3.1.<br />
71-93 nOTES TO ThE AccOUnTS <strong>TTS</strong> GROUP<br />
89
71-93 nOTES TO ThE AccOUnTS <strong>TTS</strong> GROUP<br />
note 21 Provisions <strong>for</strong> liabilities<br />
(Amounts in NOK 1000)<br />
Completed<br />
projects* Guarantees Other Total<br />
1 January <strong>2010</strong> 140 451 40 026 47 032 227 509<br />
Provisions <strong>for</strong> the year 16 958 39 663 17 899 74 520<br />
Utilised during the year -17 635 -16 540 -26 919 -61 094<br />
31 December <strong>2010</strong> 139 774 63 149 38 012 240 935<br />
90<br />
Completed<br />
projects* Guarantees Other Total<br />
1 January 2009 144 419 33 375 35 736 213 530<br />
Provisions 49 237 13 494 21 752 84 483<br />
Utilised during the year -53 205 -6 843 -10 456 -70 504<br />
31 December 2009 140 451 40 026 47 032 227 509<br />
Classification in the balance <strong>2010</strong> 2009<br />
Presented as other current liabilities 240 935 227 509<br />
*) Liabilities related to supplementary work and other demands from clients.<br />
Risk related to the estimates that <strong>for</strong>m the basis <strong>for</strong> the book values are further described in Accounting principles,<br />
under sections 2.17 and 4.<br />
note 22 Financial items and <strong>for</strong>eign currency gains/losses<br />
(Amounts in NOK 1000)<br />
<strong>2010</strong> 2009<br />
Other interest income 17 994 24 459<br />
Interest on debt to financial institutions -146 426 -97 337<br />
Net other financial expenses 20 596 -8 264<br />
Total -107 836 -81 143<br />
Net other financial expenses primarily consists of <strong>for</strong>eign currency gains and losses as well as transaction costs from banks.
note 23 Earnings per share<br />
(Amounts in NOK 1000)<br />
Earnings per share is calculated by dividing the profit attributable to shareholders by the weigthed<br />
average of the number of ordinary issued shares through the year excluding treasury shares.<br />
<strong>2010</strong> 2009<br />
Profit attributable to shareholders -196 656 -248 482<br />
Weigthed average of issued shares excluding own shares 71 235 43 408<br />
Earnings per share (NOK per share) (2.76) (5.72)<br />
DILUTED EARNINGS PER SHARE<br />
When calculating the diluted result per share, the weigthed average of the number of ordinary issued shares<br />
in circulation is regulated <strong>for</strong> the convertion effect of all potential shares that can cause dilution.<br />
The company has share options where a calculation is made to determine the number of shares which could have<br />
been acquired at market rate (calculated to an average share price of the company’s shares through the year)<br />
based on the money value of the subscription rights of the outstanding share options. The number of shares<br />
calculated is compared to the number of shares that would have been issued if all share options were exercised.<br />
The difference is attributed to the denominator in the fraction that issued the shares without compensation.<br />
<strong>2010</strong> 2009<br />
Profit used to calculate diluted earnings per share -196 656 -248 482<br />
Average of ordinary issued shares excluding own shares 71 235 43 408<br />
Adjustment <strong>for</strong> share options 660 720<br />
Average number of ordinary shares <strong>for</strong> calculation of diluted earning per share 71 895 44 128<br />
Diluted earnings per share (NOK per share) (2.74) (5.63)<br />
Share structure <strong>2010</strong> 2009<br />
Issued shares 74 631 199 67 908 279<br />
Own shares 35 210 35 210<br />
Unused share options that can be settled by issue 600 000 720 000<br />
SUBORDINATED CONVERTIBLE BOND ISSUE<br />
At the 10 January 2011 the extraordinary general meeting approved the drawdown of a subordinated convertible<br />
bond loan of 200 MNOK. The bondholders have a continuous conversion right at a call price of 9,2839 NOK.<br />
The maximum amount of shares that can be issued at full conversion is 21 542 671. Loan and conversion rights<br />
are established after end of year and are there<strong>for</strong>e not included in the calculation of earnings per share in <strong>2010</strong>.<br />
note 24 Subsequent events<br />
No dividend <strong>for</strong> shareholders have been proposed <strong>for</strong> <strong>2010</strong>.<br />
10 January 2011 the extraordinary general meeting approved the issuance of a convertible bond loan of 200 MNOK.<br />
The loan has been given an 8 % coupon rate and reaches maturity 18.01.2016. On specific terms the <strong>Group</strong> has<br />
a call option that expires on 08.02.2014. Bondholders have continuous conversion rights with an exercise price of<br />
NOK 9.2839. The maximum number of shares to be issued at full conversion is 21 542 671, equivalent to a dilution<br />
effect of 28.87 %.<br />
In February 2011 the companies of the Norwegian Energy division was merged to simplify the internal structure<br />
and streamline internal processes. The companies included in the merger are <strong>TTS</strong> Energy AS (acquiring company),<br />
<strong>TTS</strong> Energy Bergen AS, <strong>TTS</strong> Energy Ålesund AS and <strong>TTS</strong> Sense MUD AS. After the merger all of the companies are<br />
included in <strong>TTS</strong> Energy AS. Accounting date <strong>for</strong> the merger was 01.01.<strong>2010</strong>.<br />
We also refer to announcements published on the Oslo Stock Exchange of new material contracts entered into<br />
in 2011. Material contracts disclosed to Oslo Stock Exchange that are concluded after year-end amounts to<br />
approximately 91 MNOK <strong>for</strong> Marine, approx. 55 MNOK <strong>for</strong> Port and Logistics and approx. 505 MNOK <strong>for</strong> Energy.<br />
There has been no significant cancellations in the period after year end.<br />
71-93 nOTES TO ThE AccOUnTS <strong>TTS</strong> GROUP<br />
91
71-93 nOTES TO ThE AccOUnTS <strong>TTS</strong> GROUP<br />
note 25 Foreign currency differences<br />
(Amounts in NOK 1000)<br />
Foreign currency differences consists of all currency differences that arises from translation of the financial<br />
statements of the <strong>for</strong>eign entities that are not an integrated part of the operation of the company.<br />
Per 01.01.2009 32 183<br />
Exchange differences 2009<br />
<strong>Group</strong> company -25 488<br />
Joint ventures -15 849<br />
Per 31.12.2009 -41 337<br />
Exchange differences <strong>2010</strong><br />
<strong>Group</strong> company 26 166<br />
Joint ventures -4 168<br />
Per 31.12.<strong>2010</strong> 21 998<br />
note 26 contingencies<br />
Provisions <strong>for</strong> contingent liabilities have been made (Ref. Note 21). No significant provisions<br />
are expected beyond what has already been earmarked.<br />
note 27 Government grants<br />
<strong>TTS</strong> has not received government grants from public institutions <strong>for</strong> research and development<br />
activites through its subsidiaries in <strong>2010</strong>. Government grants are recorded at fair value when<br />
there is reasonable certainty that the reiceiving company fulfils the conditions of the grant.<br />
92
note 28 Financial risk management<br />
(Amounts in NOK 1000)<br />
71-93 nOTES TO ThE AccOUnTS <strong>TTS</strong> GROUP<br />
Financial assets and liabilities are described in Accounting principles, sections 2.7, 2.9, 2.11, 2.12, 2.14 and 2.15.<br />
Risk associated with the underlying estimates of the recognised values and financial risk management are described in Accounting principles, section 3.<br />
CLASSIFICATION OF FINANCIAL ASSETS<br />
<strong>2010</strong> 2009<br />
Derivatives Derivatives<br />
related Assets related Assets<br />
to hedging Loans and available to hedging Loans and available<br />
purposes receivables <strong>for</strong> sale Total purposes receivables <strong>for</strong> sale Total<br />
Financial assets<br />
Shares 0 0 222 222 0 0 1 945 1 945<br />
Other receivables 0 0 0 0 0 5 584 0 5 584<br />
Financial current assets<br />
Trade receivables 0 488 799 0 488 799 0 565 141 0 565 141<br />
Other current receivables 0 192 717 0 192 717 0 192 348 0 192 348<br />
Acquired, non-invoiced production 0 368 057 0 368 057 0 456 185 0 456 185<br />
Derivatives 48 777 0 0 48 777 53 210 0 0 53 210<br />
Prepayment to suppliers 0 130 690 0 130 690 0 217 741 0 217 741<br />
Cash and cash equivalents 0 272 331 0 272 331 0 191 907 0 191 907<br />
Total financial assets 48 777 1 452 594 222 1 501 593 53 210 1 628 905 1 945 1 684 060<br />
The <strong>Group</strong> has no financial assets classified under hold to maturity or available <strong>for</strong> sale on the date 31.12.09 or 31.12.10.<br />
CLASSIFICATION OF FINANCIAL LIABILITIES<br />
<strong>2010</strong> 2009<br />
Derivatives Derivatives<br />
related to Other related to Other<br />
hedging financial hedging financial<br />
purposes liabilities Total purposes liabilities Total<br />
Long-term financial liabilities<br />
Interest-bearing long-term debt 0 509 079 509 079 0 430 615 430 615<br />
Current financial liabilites<br />
First year installment of long-term debt 0 30 554 30 554 0 66 343 66 343<br />
Interest-bearing current liabilities 0 561 811 561 811 0 599 927 533 584<br />
Prepayments from customers 0 447 214 447 214 0 639 938 639 938<br />
Cost related to facilities under construction 0 336 732 336 732 0 149 791 149 791<br />
Derivatives 1) 69 666 0 69 666 91 876 0 91 876<br />
Accounts payable and other long-term debt 0 668 649 668 649 0 695 826 762 091<br />
Total financial liabilities 69 666 2 554 039 2 623 705 91 876 2 582 362 2 674 238<br />
Fair value of financial liabilities:<br />
1) The <strong>Group</strong>’s derivatives consists of <strong>for</strong>ward currency contracts. Fair value of <strong>for</strong>ward currency contracts is determined by utilising market-to-market<br />
rate on the balance-sheet date as stated by the <strong>Group</strong>’s bank. Fair Value related to long-term debt is considered approximately equal to carrying<br />
value, as loans are given at market terms and with a floating rate.<br />
93
Profit and loss account<br />
<strong>TTS</strong> GROUP <strong>ASA</strong><br />
1 jAnUARY - 31 DEcEMbER<br />
(AMOUNTS IN NOK 1000) NGAAP NGAAP<br />
NOTES <strong>2010</strong> 2009<br />
OPERATING INCOME<br />
Intra-<strong>Group</strong> operating income 0 3 515<br />
Other operating income 0 25<br />
<strong>Group</strong> service fee from <strong>TTS</strong> subsidiaries 24 349 32 580<br />
Total operating income 24 349 36 120<br />
OPERATING COSTS<br />
Cost of stock -168 203<br />
Personnel costs etc. 1, 2 15 911 19 853<br />
Depreciation on tangible fixed assets 3, 4 134 669<br />
Other operating costs 1, 13 18 132 21 793<br />
Total operating costs 34 009 42 518<br />
Operating profit -9 660 -6 398<br />
FINANCIAL INCOME AND ExPENSES<br />
<strong>TTS</strong> GROUP 3-15<br />
BUSINESS AREAS 16-33<br />
CORPORATE GOVERNANCE 35-43<br />
DiREcTOR’S REPORT AnD AccOUnTS 45 -116<br />
ORGANISATION 118-123<br />
Income from investments in subsidiaries 5, 15 -232 083 -242 917<br />
Income from investments in joint ventures 5, 15 891 935<br />
Interest received from group companies 15 63 852 4 958<br />
Other interest income 15 912 19 776<br />
Other financial income 15 0 577<br />
Interest expenses to group companies 15 -16 552 0<br />
Other interest expenses 15 -61 794 -40 871<br />
Other financial expenses 15 -6 674 -10 279<br />
Net financial items -251 448 -267 821<br />
Profit be<strong>for</strong>e tax -261 108 -274 219<br />
Tax 9 -8 356 -8 977<br />
Profit <strong>for</strong> the year -252 752 -265 242<br />
Transferred from other equity 252 752 265 242<br />
95
96<br />
balance sheet<br />
<strong>TTS</strong> GROUP <strong>ASA</strong><br />
ASSETS<br />
(AMOUNT IN NOK 1000) NGAAP NGAAP<br />
NOTES <strong>2010</strong> 2009<br />
Fixed assets<br />
Deferred tax assets 9 48 676 65 722<br />
Total intangible fixed assets 48 676 65 722<br />
TANGIBLE FIxED ASSETS<br />
Machinery and vehicles 3 100 443<br />
Furniture, office and computer equipment 3 4 116 1 466<br />
Total tangible fixed assets 4 216 1 909<br />
FINANCIAL FIxED ASSETS<br />
Shares in subsidiaries 5, 8 1 035 424 852 748<br />
Investments in joint ventures 5 14 059 12 925<br />
Loans to companies in same group 6, 8 221 056 180 602<br />
Investments in shares and other financial instruments 4 222 1 945<br />
Other receivables 6 0 1 143<br />
Pensions 2 1 218 1 107<br />
Total financial fixed assets 1 271 979 1 050 471<br />
Total assets 1 324 871 1 118 102<br />
current assets<br />
ACCOUNTS RECEIVABLE<br />
Trade debtors 6 0 0<br />
Intra-group accounts receivable 6, 8 40 370 51 805<br />
Other receivables 2 580 6 980<br />
Other intra-group receivables 6, 8 108 574 848<br />
Total receivables 151 524 59 633<br />
Bank deposits, cash in hand etc. 10 5 239 508 094<br />
Total current assets 156 763 567 727<br />
Total assets 1 481 634 1 685 829
EqUiTY cAPiTAL AnD LiAbiLiTiES<br />
(AMOUNT IN NOK 1000) NGAAP NGAAP<br />
NOTES <strong>2010</strong> 2009<br />
Equity capital<br />
PAID UP EQUITy CAPITAL<br />
Share capital 11, 16 37 316 33 954<br />
Treasury shares 11 -18 -18<br />
Premium account 376 057 337 911<br />
Total paid up equity capital 413 355 371 847<br />
RETAINED EARNINGS<br />
Valuation variable fund 0 0<br />
Other equity capital 208 221 425 565<br />
Total retained earnings 208 221 425 565<br />
Total equity capital 14, 16 621 576 797 412<br />
Liabilities<br />
OTHER LONG-TERM LIABILITIES<br />
Bond loan 7, 8 400 000 450 000<br />
Liabilities to financial institutions 7, 8 12 000 25 155<br />
Total other long-term liabilities 412 000 475 155<br />
CURRENT LIABILITIES<br />
Liabilities to financial institutions 7, 8 356 590 400 000<br />
Overdraft 8, 10 81 330 0<br />
Trade payables 4 490 802<br />
Intra-group trade payables 2 130 4 001<br />
Taxes due 1 494 1 933<br />
Provision <strong>for</strong> dividends 0 0<br />
Other intra-group liabilities 8 11<br />
Other current liabilities 12 2 014 6 515<br />
Total current liabilities 448 058 413 262<br />
Total liabilities 860 058 888 417<br />
Total equity capital and liabilities 1 481 634 1 685 829<br />
Bergen, 13 April 2011<br />
Board of Directors of <strong>TTS</strong> <strong>Group</strong> <strong>ASA</strong><br />
Trym Skeie Kjerstin Fyllingen Anne Breive Bjarne Skeie<br />
CHAIRMAN OF THE BOARD BOARD MEMBER BOARD MEMBER BOARD MEMBER<br />
Karen T. Mørkestøl Jarle Dyrdal Johannes D. Neteland<br />
BOARD MEMBER BOARD MEMBER CHIEF ExECUTIVE OFFICER<br />
<strong>TTS</strong> GROUP 3-15<br />
BUSINESS AREAS 16-33<br />
CORPORATE GOVERNANCE 35-43<br />
DiREcTOR’S REPORT AnD AccOUnTS 45 -116<br />
ORGANISATION 118-123<br />
97
Equity statement<br />
<strong>TTS</strong> GROUP <strong>ASA</strong><br />
Share<br />
Share Treasury premium Other<br />
(AMOUNTS IN NOK 1000) capital shares account equity Total<br />
Equity as of 31.12.09 33 954 -18 337 912 425 564 797 412<br />
Issue 3 361 0 38 993 0 42 354<br />
Issue costs 0 0 -847 0 -847<br />
Option schemes 0 0 0 2 395 2 395<br />
Currency difference concerning equity method 0 0 0 32 898 32 898<br />
Net profit <strong>for</strong> the year 0 0 0 -252 752 -252 752<br />
Equity as of 31.12.<strong>2010</strong> 37 316 -18 376 057 208 221 621 576<br />
98
cashflow statement<br />
<strong>TTS</strong> GROUP <strong>ASA</strong><br />
1 jAnUARY - 31 DEcEMbER<br />
<strong>TTS</strong> GROUP 3-15<br />
BUSINESS AREAS 16-33<br />
CORPORATE GOVERNANCE 35-43<br />
DiREcTOR’S REPORT AnD AccOUnTS 45 -116<br />
ORGANISATION 118-123<br />
(AMOUNTS IN NOK 1000) <strong>2010</strong> 2009<br />
Net profit be<strong>for</strong>e tax -261 108 -274 219<br />
Income from investments in subsidiaries 232 083 242 917<br />
Depreciation 134 669<br />
Writedowns on shares and receivables 2 864 0<br />
Pro rata income from joint ventures -891 -935<br />
Foreign currency gains/losses on intra-group loans 4 764 5 309<br />
Difference between pension charges and payments to/from pension scheme -59 796<br />
Trade and other receivables -64 194 -25 668<br />
Trade payables and other short-term liabilities -3 323 -8 770<br />
Net cashflow from operations -89 729 -59 901<br />
cashflow from investments<br />
Acquisition of subsidiaries (less cash balances at subsidiaries) 0 -11 503<br />
Disbursements injecting equity into subsidiaries -381 936 0<br />
Income from sales of tangible fixed assets 0 54<br />
Disbursements on acquisitions of tangible fixed assets -2 442 -1 505<br />
Income from long-term intra-group loans 108 478 0<br />
Disbursements on long-term intra-group loan receivables -153 500 -30 820<br />
Net cashflow from investments -429 400 -43 774<br />
cashflow from financing<br />
Income from taking up new short-term/long-term liabilities 81 330 300 000<br />
Disbursements on repayment of short-term/long-term liabilities -106 565 -47 477<br />
Paid up equity capital 41 509 231 208<br />
Net cashflow from financing 16 274 483 731<br />
Effects of exchange-rate fluctuations on cash and cash equivalents<br />
Net change in cash and cash equivalents -502 855 380 055<br />
Cash and cash equivalents (opening balance) 508 094 128 039<br />
Cash and cash equivalents (closing balance) 5 239 508 094<br />
This consists of:<br />
Bank deposits etc. 5 239 508 094<br />
99
100
Accounting principles<br />
<strong>TTS</strong> GROUP <strong>ASA</strong><br />
The financial statements have been prepared in accordance with The<br />
Norwegian Accounting Act of 1998 and generally accepted accounting<br />
principles.<br />
Subsidiaries, associated companies<br />
Subsidiaries are valuated according to the equity method in the annual<br />
accounts. The parent company’s share of the result is based on the<br />
invested companies’ post-tax result after allowing <strong>for</strong> internal gains<br />
and possible depreciation of any additional value arising because the<br />
cost price of the shares was higher than the acquired share of the book<br />
equity. In the profit and loss account, the share of the profit is posted<br />
under financial items, while the assets in the balance sheet are posted<br />
under financial assets.<br />
Also associated companies (joint ventures) are included in the accounts<br />
in accordance with the cost method. This means that the result is<br />
included as financial income and portion of equity is included under<br />
financial assets.<br />
Operating income<br />
Operating income includes income on delivered products and services<br />
granted over the year. The income is booked when the services are<br />
delivered.<br />
classification and valuation of balance sheet items<br />
Current assets and short term liabilities include items which fall due<br />
within one year of the end of the financial year, as well as items<br />
related to the operating cycle. Other items are classified as fixed<br />
assets/long-term liabilities.<br />
Current assets are valued at the lowest of cost and market value.<br />
Short-term liabilities are posted in the balance sheet at the nominal<br />
value at the time of initial establishment.<br />
Fixed assets are recorded at cost, but are written down to net realizable<br />
value if the diminution in value is not expected to be temporary.<br />
Long-term liabilities are posted in the balance sheet at the nominal<br />
value at the time of the initial establishment.<br />
Accounts receivables<br />
Trade debtors and other accounts receivables are recorded in the balance<br />
sheet at their nominal value reduced by a provision <strong>for</strong> bad debts. The<br />
provisions are made on the basis of an individual assessment of each<br />
balance. In addition, an unspecified provision is made to cover expected<br />
losses.<br />
Fixed assets<br />
Fixed assets are booked on the balance sheet and depreciated over<br />
the asset’s life span if the expected life span exceeds 3 years and has<br />
a cost price higher than NOK 15 000. Direct maintenance of assets<br />
<strong>TTS</strong> GROUP 3-15<br />
BUSINESS AREAS 16-33<br />
CORPORATE GOVERNANCE 35-43<br />
DiREcTOR’S REPORT AnD AccOUnTS 45 -116<br />
ORGANISATION 118-123<br />
is expensed as incurred under operating expenses, while renovation or<br />
upgrading is added to the asset’s cost price and is depreciated in line<br />
with the asset.<br />
Pensions<br />
The company has a defined-benefit pension. The pension expenses and<br />
pension commitments are calculated on a straight-line earning profile<br />
basis, based on assumptions relating to discount rates, projected salaries,<br />
the amount of benefits from the National Insurance Scheme, future<br />
return on pension funds, and actuarial calculations relating to mortality<br />
rate, voluntary retirement, etc. Pension funds are valued at net realizable<br />
value and deducted in the net pension commitment in the balance<br />
sheet. Changes in the commitment due to changes in the pension plans<br />
are written down over the expected remaining service period. The same<br />
applies to estimated differences if they exceed 10 % of the largest of<br />
the pension commitment and pension funds (corridor).<br />
Social security fees are expensed on basis of pension premiums paid <strong>for</strong><br />
pension schemes and accrued changes in net pension commitment.<br />
Taxes<br />
The tax expense in the profit and loss account includes both the current<br />
tax payable and change in deferred tax. Deferred tax is estimated to<br />
28 % based on the temporary changes between taxation and accounting<br />
values, as well as tax losses carried <strong>for</strong>ward to the end of the fiscal<br />
year. Tax-increasing and tax-reducing temporary differences which<br />
are reversed, or could be reversed, during the same period are offset<br />
against each other and recorded as a net sum. Temporary changes are<br />
only assessed <strong>for</strong> the Norwegian companies.<br />
Foreign currency<br />
Items in <strong>for</strong>eign currency are converted to NOK at the exchange rate<br />
on the balance sheet date. For future contracts, <strong>for</strong>ward rates are used.<br />
Future contracts ensuring trade debtors, accrued operating income<br />
and/or trade creditors are converted to an average rate of exchange<br />
<strong>for</strong> all future contracts in connection with each individual long-term<br />
project.<br />
cash flow statement<br />
The cash flow statement has been prepared according to the indirect<br />
method. Cash and cash equivalents include cash, bank deposits, and<br />
other short term investments which immediately and with minimal<br />
exchange risk can be converted into known cash amounts, with due<br />
date less than three months from purchase date.<br />
cash and cash equivalents<br />
Cash and cash equivalents consist of cash and bank deposits. Bank<br />
deposits in <strong>for</strong>eign currencies are assessed to the exchange rate of the<br />
balance sheet date. Withdrawals from the bank overdraft constitute<br />
part of current liabilities.<br />
101
notes<br />
<strong>TTS</strong> GROUP <strong>ASA</strong><br />
note 1 Personnel costs, number of employees, remunerations, loans to employees etc.<br />
(Amounts in NOK 1000)<br />
Payroll expenses <strong>2010</strong> 2009<br />
Salaries, options etc. 10 972 15 355<br />
Employer’s contributions 2 178 2 511<br />
Pension costs 2 445 1 675<br />
Other benefits 404 312<br />
Total personnel costs 15 911 19 853<br />
Number of employees per 31.12. 8 8<br />
Remuneration to Board members* <strong>2010</strong> 2009<br />
Trym Skeie (Chairman from 11.09) 160 46<br />
Birger Skeie - estate 69 183<br />
Nils O. Ardal (to 06.10) 262 262<br />
Bjarne Skeie 175 175<br />
Rune Selmar (07.10 - 12.10) 0 0<br />
Anne Breive 205 205<br />
Kjerstin Fyllingen 205 205<br />
Karen Torine Mørkestøl (from 10.10) 0 0<br />
Jarle Dyrdal (from 10.10) 0 0<br />
Olav Smeland (to 10.10) 88 88<br />
Anne Karin Bedringås (to 10.10) 88 88<br />
Total 1 252 1 251<br />
*) The Annual General Meeting determines the remuneration to the Board from one general meeting to the next.<br />
For the financial year <strong>2010</strong>, the same remuneration was used as resolved at the Annual General Meeting in <strong>2010</strong>.<br />
The remuneration proposed from the Annual General Meeting in <strong>2010</strong> until the general meeting in 2011 is shown<br />
in the notice of general meeting 03.06.10. The same applies to the nomination committee.<br />
REMUNERATION TO NOMINATION COMMITTEE<br />
The members of <strong>TTS</strong>’s nomination committee are as follows: Bjørn Olafsson (chairman), Bjørn Sjaastad and Johan Aasen.<br />
Remuneration paid in <strong>2010</strong> was 40 TNOK to the chairman and 25 TNOK to the members, total 90 TNOK.<br />
PRINCIPLES ON SETTING SALARIES AND OTHER BENEFITS FOR THE MANAGING STAFF OF THE COMPANy<br />
<strong>TTS</strong> <strong>Group</strong> <strong>ASA</strong>’s remuneration policy is based on offering group executive competitive terms. Remuneration levels reflect<br />
the fact that the company is listed and focused internationally.<br />
Annual remuneration assumes the group executive shares in the company’s results and creates shareholder value through<br />
increasing the value of the company.<br />
Remuneration consists of three main components: base salary, bonuses and option scheme.<br />
Bonuses are based on target results. In certain circumstances where change and development are decisive, bonuses are<br />
also based on specific growth targets. Bonus targets are reviewed annually. The maximum bonus is one year’s base salary<br />
<strong>for</strong> the President and CEO and up to 50 % <strong>for</strong> other executive staff.<br />
102
note 1 cont.<br />
<strong>TTS</strong> has had an option scheme <strong>for</strong> the group executive since 1998, aimed at giving the group executive the same incentive as shareholders<br />
to increase the value of the company over time. The general meeting has authorised the Board to issue two-year option schemes each year,<br />
which can be exercised <strong>for</strong> the first time as to 50 % after one year, followed by a further 12.5 % per quarter in addition to any options not<br />
exercised previously. Options must be exercised within two years.<br />
The group pension scheme in Norway is based on approx. 65 % of base salary at age 67, subject to a maximum of 12 G.<br />
Six months’ notice of termination is required, with severance pay of from six to 24 months, period of notice included.<br />
Option schemes have to be approved by the general meeting, subject to the Board being granted authority to decide allocations.<br />
The President and CEO’s remuneration is determined by the Board of <strong>TTS</strong> <strong>Group</strong> <strong>ASA</strong>. For other executive staff, remuneration is determined<br />
by the Boards of the subsidiaries concerned or President and CEO.<br />
REMUNERATION TO PRESIDENT & CEO AND GROUP ExECUTIVES<br />
Other Bonus Option Total Pension<br />
Name Position Base pay benefits paid profits income costs<br />
Johannes D. Neteland President & CEO 1 762 163 0 0 1 925 953<br />
Arild Apelthun CFO (from 04.10) 909 12 0 0 921 61<br />
Mette Henriksen Acting CFO (until 03.10) 281 4 0 0 285 10<br />
Ivar K. Hanson Head of division, Marine 1 288 15 75 0 1 378 88<br />
Lennart Svensson Head of division, Port and Logistics 1 175 28 0 0 1 175 335<br />
Inge Gabrielsen Head of division, Energy 1 323 43 0 0 1 366 46<br />
Base pay Taxable base pay<br />
Other benefits Car scheme, group life insurance, taxable pension schemes, telephone, newspapers etc.<br />
Bonus paid Bonus paid <strong>for</strong> year concerned<br />
Option profits Difference between market price and redemption price when exercising options<br />
Total income Total taxable income<br />
The taxable pension schemes are an early retirement pension and top-hat pension which were <strong>for</strong>merly based on a pension <strong>for</strong> life solution.<br />
The amendments to the tax rules per 01.01.07 mean these must be accounted <strong>for</strong> as taxable benefits. The premature retirement scheme<br />
applies once the President & CEO reaches 60.<br />
Six months’ notice of termination is required with severance pay of 24 months, notice period included, and from six to 24 months<br />
<strong>for</strong> other group executives<br />
AUDITORS’ FEES (ExCL. VAT)<br />
<strong>2010</strong> 2009<br />
Statutory audit 975 502<br />
Other certifications 61 14<br />
Other assistance including tax advice 335 593<br />
Total 1 371 1 109<br />
<strong>TTS</strong> GROUP 3-15<br />
BUSINESS AREAS 16-33<br />
CORPORATE GOVERNANCE 35-43<br />
DiREcTOR’S REPORT AnD AccOUnTS 45 -116<br />
ORGANISATION 118-123<br />
103
102-113 nOTES TO ThE AccOUnTS <strong>TTS</strong> GROUP <strong>ASA</strong><br />
note 2 Pension<br />
(Amounts in NOK 1000)<br />
The company is required to have a company pension scheme under the law on mandatory company pensions. The company has a pension scheme<br />
that meets the requirements under this law. The Norwegian companies in the group have defined benefit pension schemes that entitle employees<br />
to defined future pension benefits depending on length of service, salary level, retirement age and social security pensions received.<br />
The pension scheme included 19 persons per 31.12.10, including eight retired persons.<br />
Reported net pension liabilities are as follows:<br />
<strong>2010</strong> 2009<br />
Insured Uninsured Total Insured Uninsured Total<br />
Market value of pension funds 19 110 0 19 110 13 940 0 13 940<br />
- Net present value of accrued pension liabilities -18 971 -54 -19 025 -17 091 -80 -17 171<br />
+ Unrecognised estimate changes and deviations 1 121 0 1 121 5 064 -303 4 761<br />
+ Unrecognised costs in respect of<br />
past period pension earnings 0 0 0 0 0 0<br />
- Periodised employer’s contributions 20 -8 12 -412 -11 -423<br />
= Employer’s contributions 1 280 -62 1 218 1 501 -394 1 107<br />
Net pension costs are determined as follows:<br />
<strong>2010</strong> 2009<br />
Insured Uninsured Total Insured Uninsured Total<br />
Net present value of current year’s<br />
pension benefits accrued 1 749 1 1 750 1 220 10 1 229<br />
+ Interest payable on pension liabilities 740 3 743 626 3 629<br />
- Expected return on pension funds -650 0 -650 -647 0 -647<br />
+ Recognised estimate changes and deviations 587 -332 255 535 -52 482<br />
+ Changes to employer’s contributions 259 1 260 169 2 171<br />
+ Costs relating to past period pension earnings 0 0 0 0 0 0<br />
+ Loss on reduction of pension scheme 0 0 0 0 0 0<br />
= Total costs included in salary costs 2 685 -327 2 358 1 902 -38 1 865<br />
Changes to book value of funds: <strong>2010</strong> 2009<br />
Book value as at 1 January 1 107 1 663<br />
Costs recognised during year (see above) -2 358 -1 865<br />
+/- Pension payments and payment of pension contributions 2 469 1 309<br />
= Book value per 31 December 1 218 1 107<br />
Financial assumptions used in calculating pension liabilities:<br />
<strong>2010</strong> 2009<br />
31.12. 1.1 31.12. 1.1<br />
Return on pension funds 4.60 % 5.60 % 5.60 % 5.80 %<br />
Discount rate 3.20 % 4.40 % 4.40 % 3.80 %<br />
Annual wage inflation 4.00 % 4.25 % 4.25 % 4.80 %<br />
Annual adjustment of G [basic social security unit] 3.75 % 4.00 % 4.00 % 3.80 %<br />
Annual adjustment of pensions being paid 3.75 % 4.00 % 4.00 % 3.80 %<br />
Voluntary retirement 10.00 % 10.00 % 10.00 % 10.00 %<br />
Withdrawal tendency <strong>for</strong> early retirement (AFP) 45.00 % 45.00 % 45.00 % 45.00 %<br />
Employer’s contributions 14.10 % 14.10 % 14.10 % 14.10 %<br />
104
note 3 Tangible fixed assets<br />
(Amounts in NOK 1000)<br />
Furniture<br />
Machinery and office<br />
and vehicles equipment Total<br />
PER 1 JANUARy 2009<br />
Acquisition cost as at 31 December 1 368 742 2 110<br />
Cumulative depreciation as at 31 December -681 -303 -984<br />
Book value per 31 December 687 439 1 126<br />
FINANCIAL yEAR 2009<br />
Book value as at 1 January 687 439 1 126<br />
Acquisitions during the year 0 1 505 1 505<br />
Disposals during the year -54 0 -54<br />
Depreciation <strong>for</strong> the year -189 -480 -669<br />
Book value per 31 December 445 1 464 1 909<br />
PER 31 DECEMBER 2009<br />
Acquisition cost as at 31 December 1 314 2 248 3 562<br />
Cumulative depreciation as at 31 December -870 -783 -1 653<br />
Book value per 31 December 444 1 464 1 908<br />
FINANCIAL yEAR <strong>2010</strong><br />
Book value as at 1 January 444 1 465 1 909<br />
Acquisitions during the year 0 2 442 2 442<br />
Disposals during the year -204 204 0<br />
Depreciation <strong>for</strong> the year -140 6 -134<br />
Book value per 31 December 100 4 116 4 216<br />
PER 31 DECEMBER <strong>2010</strong><br />
Acquisition cost as at 31 December 1 110 4 894 6 004<br />
Cumulative depreciation as at 31 December -1 010 -777 -1 787<br />
Book value per 31 December 100 4 116 4 216<br />
Depreciation plan Linear Linear<br />
Depreciation period 5 year 3-10 year<br />
note 4 Shares in other companies<br />
(Amounts in NOK 1000)<br />
Holding Acquisition cost Book value<br />
<strong>2010</strong> 2009<br />
Fixed assets<br />
Shin young Heavy Industry 13.4 % 222 222 222<br />
FastShip Inc.* 6.7 % 13 326 0 1 723<br />
Total shares in other companies 13 548 222 1 945<br />
*) In the balance sheet per 31.12. the company has recorded 615 156 shares in FastShip Inc (FSI)<br />
with a total book value of 1 NOK.<br />
There are currently no ongoing activity in the project and the company’s certificates have expired.<br />
The company is per 31.12.<strong>2010</strong> still active <strong>for</strong> judicial clarifications of a sertificate dispute in the US.<br />
Since the project is terminated <strong>TTS</strong> has recorded the whole investment of 19,0 MNOK as a loss.<br />
Shares have been written off by 1,7 MNOK, and convertible loan with 1,1 MNOK in <strong>2010</strong>.<br />
102-113 nOTES TO ThE AccOUnTS <strong>TTS</strong> GROUP <strong>ASA</strong><br />
105
102-113 nOTES TO ThE AccOUnTS <strong>TTS</strong> GROUP <strong>ASA</strong><br />
note 5 Subsidiaries and joint ventures<br />
(Amounts in NOK 1000)<br />
Subsidiaries Registered office Acquired Ownership Votes<br />
<strong>TTS</strong> Handling Systems AS Drøbak, Norway 1994 100 % 100 %<br />
<strong>TTS</strong> Ships Equipment AS Bergen, Norway 1996 100 % 100 %<br />
Norlift AS Bergen, Norway 1994 100 % 100 %<br />
Hydralift Marine AS Kristiansand, Norway 2003 100 % 100 %<br />
<strong>TTS</strong> Marine AB (<strong>for</strong>mer <strong>TTS</strong> Ships Equipment AB) Gothenburg, Sweden 2002 100 % 100 %<br />
<strong>TTS</strong> Marine Shanghai Co Ltd Shanghai, China 2002 100 % 100 %<br />
<strong>TTS</strong> Energy Bergen AS (<strong>for</strong>mer <strong>TTS</strong> Marine Cranes AS) Bergen, Norway 2006 100 % 100 %<br />
<strong>TTS</strong> Cranes Norway AS<br />
<strong>TTS</strong> Energy Ålesund AS<br />
Bergen, Norway 2007 100 % 100 %<br />
(<strong>for</strong>mer <strong>TTS</strong> Offshore Handling Equipment AS) Ålesund, Norway 2007 100 % 100 %<br />
<strong>TTS</strong> Energy AS (<strong>for</strong>mer <strong>TTS</strong> Sense AS) Kristiansand, Norway 2007 100 % 100 %<br />
<strong>TTS</strong> Marine AS Bergen, Norway 2009 100 % 100 %<br />
<strong>TTS</strong> Singapore Pte. Ltd. Singapore 2009 100 % 100 %<br />
<strong>TTS</strong> Greece Ltd. Pireus, Greece 2009 100 % 100 %<br />
Joint venture<br />
<strong>TTS</strong> BoHai Machinery Co., Ltd Dalian, China 2005 50 % 50 %<br />
Companies are accounted <strong>for</strong> using the equity method.<br />
<strong>TTS</strong> Norlift <strong>TTS</strong> <strong>TTS</strong> <strong>TTS</strong> Marine <strong>TTS</strong> Cranes <strong>TTS</strong> <strong>TTS</strong> Hydralift <strong>TTS</strong> <strong>TTS</strong><br />
HS AS AS SE AS Marine AB Shanghai Norway AS Energy AS Marine AS Marine AS Singap. Greece Total<br />
Acquisition cost when acq. 9 589 500 14 232 303 180 1 386 500 684 253 1 020 115 5 064 1 812 1 014 775<br />
Of which goodwill 7 129 255 163 2 053 529 884 794 229<br />
Of which added value -453 19 950 19 497<br />
Unamortised added value/<br />
goodwill 31 December<br />
Goodwill 0 3 737 193 240 1 693 364 433 563 103<br />
Amortisation of GW -150 -424 -13 524 -103 -24 541 -38 742<br />
Unamortised GW 31.12. -150 0 3 313 179 716 1 590 0 339 892 0 524 361<br />
Calculating profit <strong>for</strong> the year<br />
Share of profit <strong>for</strong> the year 7 040 74 6 004 71 190 2 960 2 823 -280 574 -2 905 0 -776 824 -193 341<br />
Amortisation on goodwill -150 -424 -13 524 -103 -24 542 0 -38 742<br />
Income from inv. in subsid. 6 890 74 5 580 57 666 2 857 2 823 -305 116 -2 905 0 -776 824 -232 082<br />
SHARES IN SUBSIDIARIES<br />
Opening balance 01.01. 31 184 441 35 095 422 381 13 902 3 821 340 926 1 020 115 2 879 1 101 852 865<br />
Associated comp/subs. acq. 0 0 0 0 0 0 0 0 0 0<br />
Liabilities conv. to shares 0 0 0 0 0 0 0 0 0 0<br />
Capital injected 0 0 0 81 936 0 0 300 000 0 0 381 936<br />
Income from investm. in sub. 6 890 74 5 580 57 666 2 857 2 823 -305 116 -2 905 0 -776 824 -232 082<br />
<strong>Group</strong> contribution/dividends 54 0 -1 0 0 53<br />
Foreign currency effects 0 0 0 31 709 702 311 -66 32 656<br />
Closing balance 31.12. 38 128 515 40 674 593 692 17 461 6 644 335 810 -1 885 115 2 414 1 859 1 035 424<br />
The <strong>for</strong>mer <strong>TTS</strong> Sense AS (acquirer), <strong>TTS</strong> Marine Cranes AS (acquire) and <strong>TTS</strong> Offshore Handling AS (acquire) merged <strong>for</strong> accounts purposes<br />
as of 1 January <strong>2010</strong>. The merged company is named <strong>TTS</strong> Energy AS.<br />
SHARES IN JOINT VENTURES<br />
<strong>TTS</strong> Bohai<br />
Machinery Co. Ltd.<br />
Opening balance per 1 January 12 925<br />
Companies acquired or started 0<br />
Share of profits 891<br />
Dividends 0<br />
Forgiveness of debt 0<br />
Foreign currency effects 243<br />
Disposals of shares in associated companies 0<br />
Closing balance per 31 December 14 059<br />
106
note 6 Trade and other receivables<br />
(Amounts in NOK 1000)<br />
<strong>2010</strong> 2009<br />
Trade receivables 0 0<br />
Trade receivables within group 40 370 51 805<br />
Other receivables within group (group cont./overdraft) 108 574 848<br />
Short-term receivables 148 944 52 653<br />
RECEIVABLES MATURING LATER THAN ONE yEAR<br />
Other receivables 0 1 143<br />
Loans to group companies 221 056 180 602<br />
Total 221 056 181 745<br />
There are no credit risk concentrations within customer receivables. Steps have been taken to avoid delays in settling internal receivables.<br />
note 7 Long-term liabilities<br />
(Amounts in NOK 1000)<br />
REPAyMENT PROFILE AND MATURITy<br />
Balance as at<br />
31 December <strong>2010</strong> 2011 2012 2013 2014 2015 2016 and beyond<br />
Bond liabilities 400 000 0 400 000 0 0 0 0<br />
Other long-term liabilities 15 000 3 000 3 000 3 000 3 000 3 000 0<br />
Total long-term liabilities 415 000<br />
- First year repayment LTD -3 000<br />
Total long-term liabilities 412 000<br />
BREAKDOWN OF LOANS<br />
<strong>TTS</strong> <strong>Group</strong> <strong>ASA</strong><br />
Instalment Book value Book value<br />
Long-term loans Type of loan Currency Nominal rate Matures terms <strong>2010</strong> 2009<br />
Nordea <strong>ASA</strong> Mortgage loan NOK NIBOR +2.75 % 2011 Four per year 0 10 730<br />
Norsk Tillitsmann <strong>ASA</strong> Bond loan NOK NIBOR +3.375 %* 2012 None 400 000 450 000<br />
Innovasjon Norge Mortgage loan NOK 5.75 % 2015 Two per year 12 000 14 425<br />
412 000 475 155<br />
*) Plus approx. 0.3 % deferred costs. Bond loan matures at 27.05.2012.<br />
Book value Book value<br />
Short-term loans Type of loan Currency Nominal rate Matures Instalment terms <strong>2010</strong> 2009<br />
Nordea <strong>ASA</strong> Mortgage loan NOK NIBOR +2.75 % 2011 Four per year 3 590 0<br />
Nordea <strong>ASA</strong> Mortgage loan NOK NIBOR +2.75 % 2011 Renegotiated annually 350 000 400 000<br />
Innovasjon Norge Mortgage loan NOK 5.75 % 2015 Short-term component LTD 3 000 0<br />
356 590 400 000<br />
See Note 8 <strong>for</strong> security <strong>for</strong> long-term debt.<br />
102-113 nOTES TO ThE AccOUnTS <strong>TTS</strong> GROUP <strong>ASA</strong><br />
107
102-113 nOTES TO ThE AccOUnTS <strong>TTS</strong> GROUP <strong>ASA</strong><br />
note 8 Assets pledged as security and guarantees<br />
(Amounts in NOK 1000)<br />
The credit agreement <strong>for</strong> <strong>TTS</strong> <strong>Group</strong> <strong>ASA</strong> in Norway was established (50/50) with Nordea Norge <strong>ASA</strong> (Nordea) and Sparebanken Vest,<br />
with Nordea as agent.<br />
<strong>TTS</strong> <strong>Group</strong> <strong>ASA</strong> has agreements as follows:<br />
<strong>2010</strong> 2009<br />
Limit Drawing Limit Drawing<br />
<strong>Group</strong> account 327 000 81 332 330 000 -152<br />
Drawing facility, operations 350 000 350 000 475 000 475 000<br />
Guarantee limit <strong>for</strong> <strong>Group</strong> 425 000 401 431 425 000 427 598<br />
Per 31 December <strong>2010</strong>, the companies in Norway, and <strong>TTS</strong> Sense Canada, <strong>TTS</strong> Marine AB, <strong>TTS</strong> Port Equipment AB and <strong>TTS</strong> Marine GmbH<br />
are all involved in the group cash pool facility. The same applies to the guarantee limit <strong>for</strong> the group. Guarantee limits cover payment,<br />
contract, prepayment and tax guarantees.<br />
<strong>TTS</strong> <strong>Group</strong> <strong>ASA</strong> also has long-term loans (see Note 7).<br />
For the agreements above, the assets below (from <strong>TTS</strong> <strong>Group</strong> <strong>ASA</strong>, <strong>TTS</strong> Energy AS, <strong>TTS</strong> Handling Systems AS, <strong>TTS</strong> Ships Equipment AS<br />
and Norlift AS, which are also jointly and severally liable) have been pledged as collateral to Nordea:<br />
<strong>2010</strong> 2009<br />
Secured debt 449 920 410 730<br />
Assets at book value<br />
Customer/intra-group receivables 370 000 227 280<br />
Shares in <strong>TTS</strong> Marine AB 593 692 422 381<br />
Total assets pledged as security 963 692 649 661<br />
Leases in Norway with plant and equipment are also pledged.<br />
The mortgage bond has a nominal value of 200 MNOK.<br />
COVENANTS<br />
The <strong>Group</strong>’s has undertaken to meet the following financial strength requirements <strong>for</strong> Nordea:<br />
There is a requirement that the group equity shall be greater than 800 MNOK at all time. In addition, the equity ratio must be greater<br />
than 25 %. Nordea has accepted that the subordinated convertible bond loan of 200 MNOK are to be considered as equity as per 31.12.<strong>2010</strong>.<br />
With an equity of 802 MNOK together with the subordinated convertible bond loan of 200 MNOK, the equity rate as per 31.12.<strong>2010</strong> is 29,0 %,<br />
thus <strong>TTS</strong> <strong>Group</strong> meet the financial covenant requirement as per 31.12. <strong>2010</strong>. Part of the syndicate facility (150 MNOK) must be repaid latest<br />
within 31.12. 2011, or sooner if proceeds from sales of assets or material inventory sale are material. Please find maturity description <strong>for</strong><br />
the <strong>Group</strong>’s financial liabilities in section 3.1 under Accounting principles.<br />
The <strong>Group</strong>’s has undertaken to meet the following financial strength requirements <strong>for</strong> Norsk Tillitsmann <strong>ASA</strong><br />
There is a requirement that the equity shall be greater than 550 MNOK at any time. Norsk Tillitsmann <strong>ASA</strong> has accepted that the subordinated<br />
convertible bond loan of 200 MNOK are to be considered as equity as per 31.12. <strong>2010</strong>. With an equity of 802 MNOK together with the<br />
subordinated convertible bond loan of 200 MNOK, the equity rate as per 31.12. <strong>2010</strong> is 29.0 %, thus <strong>TTS</strong> <strong>Group</strong> meet the financial covenant<br />
requirement as per 31.12. <strong>2010</strong>.<br />
Regarding the bond loan there is in addition to the covenant requirement of equity ratio at 22.5 % and nominal equity of 550 MNOK,<br />
a multiple of other standard default clauses related to the bond loan inclusive cross default clauses.<br />
108
note 9 Tax<br />
(Amounts in NOK 1000)<br />
102-113 nOTES TO ThE AccOUnTS <strong>TTS</strong> GROUP <strong>ASA</strong><br />
Changes to deferred tax assets and deferred tax<br />
DEFERRED TAx<br />
1.1.2009 Change 2009 31.12.2009 Change <strong>2010</strong> 31.12.<strong>2010</strong><br />
Fixed assets 96 -311 -215 774 639<br />
Receivables 0 0 0 0 0<br />
Construction contracts 0 0 0 0 0<br />
Pension funds 466 -156 310 31 341<br />
Other temporary differences 0 0 0 0 0<br />
Total deferred tax 562 -467 96 805 980<br />
DEFERRED TAx ASSETS<br />
Fixed assets 0 0 0 0 0<br />
Receivables 0 0 0 0 0<br />
Inventories 0 0 0 0 0<br />
Pension funds 0 0 0 0 0<br />
Other provisions <strong>for</strong> liabilities 0 0 0 0 0<br />
Total deferred tax assets 0 0 0 0 0<br />
Net deferred tax assets 467 -467 96 805 980<br />
Credit deduction carried <strong>for</strong>ward -6 182 0 -6 182 0 -6 182<br />
Allowance carried <strong>for</strong>ward -1 260 0 -1 260 0 -1 260<br />
Loss carried <strong>for</strong>ward -54 583 -8 852 -63 435 16 244 -47 191<br />
Net deferred tax assets -61 558 -9 319 -70 781 17 047 -53 653<br />
Unrecognised deferred tax assets related<br />
to other temporary differences 3 457 341 3 798 0 3 798<br />
Unrecognised deferred tax assets related to allowance 1 260 0 1 260 0 1 260<br />
Net deferred tax assets <strong>report</strong>ed -56 841 -8 977 -65 722 17 047 -48 676<br />
Deferred tax assets related to losses which can be carried <strong>for</strong>ward <strong>for</strong> tax purposes are <strong>report</strong>ed if the management believes it is likely<br />
that the company can use these against future taxable income.<br />
Breakdown of differences between profit be<strong>for</strong>e tax as per the accounts and tax basis <strong>for</strong> year <strong>2010</strong> 2009<br />
Result be<strong>for</strong>e tax -261 108 -274 219<br />
Permanent differences 186 176<br />
Change to assessment in relation to previous years’ accounts 0 0<br />
Change to temporary profit/loss differences 805 447<br />
Reversed share of profits/losses in subsidiaries and joint ventures 231 192 241 982<br />
<strong>Group</strong> contribution with tax 90 795 0<br />
Application of loss to be carried <strong>for</strong>ward -61 870 0<br />
Tax basis <strong>for</strong> year 0 -31 613<br />
Breakdown of tax costs:<br />
Tax payable 0 0<br />
Withholding tax from activities outside Norway 20 0<br />
Effect of group contribution on deferred tax -25 423 0<br />
Effect of tax on issue costs netted directly with deferred tax assets 0 0<br />
Changes to deferred tax 17 047 -8 977<br />
Tax cost -8 356 -8 977<br />
Tax payable on balance sheet:<br />
Tax payable 0 0<br />
Tax effects of group contribution 0 0<br />
Tax payable on balance sheet 0 0<br />
Explanation as to why this year’s tax costs are not 28% of profit be<strong>for</strong>e tax:<br />
28 % of profit be<strong>for</strong>e tax -73 110 -76 782<br />
Permanent differences 20 49<br />
Results from subsidiaries and joint ventures 64 734 67 755<br />
Tax on issue costs not recognised 0 0<br />
Estimated tax costs -8 356 -8 977<br />
109
102-113 nOTES TO ThE AccOUnTS <strong>TTS</strong> GROUP <strong>ASA</strong><br />
note 10 Liquid funds<br />
(Amounts in NOK 1000)<br />
<strong>2010</strong> 2009<br />
Bank deposits, cash etc. as at 31 December. 5 239 508 094<br />
Deposits (+)/withdrawals (-) from cash pool account system as at 31 December -81 330 1529<br />
1) Restricted bank deposits per 31 December were 5.239 TNOK. Of these 239 TNOK were deposits on tax withdrawal accounts,<br />
and 5 000 TNOK werer deposits as morgage <strong>for</strong> a loan from Innovasjon Norge.<br />
<strong>TTS</strong> <strong>Group</strong> <strong>ASA</strong> operates a cash pool account system. The group has been granted a credit facility of 327 MNOK.<br />
<strong>TTS</strong> <strong>Group</strong> <strong>ASA</strong> also has a drawing facility of 350 MNOK.<br />
note 11 Share capital and shareholder in<strong>for</strong>mation<br />
Number of shares Nominal Book value of<br />
as at 31 December value share capital<br />
74 631 199 0.50 37 315 600<br />
THE COMPANIES IN THE <strong>TTS</strong> GROUP ARE AS FOLLOWS:<br />
(Amounts in NOK 1000)<br />
Company Owner Holding Share capital No. of shares<br />
Norlift AS <strong>TTS</strong> <strong>Group</strong> <strong>ASA</strong> 100 % NOK 500 000 500<br />
<strong>TTS</strong> Handling Systems AS <strong>TTS</strong> <strong>Group</strong> <strong>ASA</strong> 100 % NOK 950 000 95 000<br />
<strong>TTS</strong> Ships Equipment AS <strong>TTS</strong> <strong>Group</strong> <strong>ASA</strong> 100 % NOK 2 500 000 2 500<br />
Hydralift Marine AS <strong>TTS</strong> <strong>Group</strong> <strong>ASA</strong> 100 % NOK 100 000 1 000<br />
<strong>TTS</strong> Marine AB (<strong>for</strong>mer <strong>TTS</strong> Ships Equipment AB) <strong>TTS</strong> <strong>Group</strong> <strong>ASA</strong> 100 % SEK 2 000 000 2 000<br />
<strong>TTS</strong> Marine Shanghai Co. Ltd. <strong>TTS</strong> <strong>Group</strong> <strong>ASA</strong> 100 % USD 200 000 3 500<br />
<strong>TTS</strong> Marine AS <strong>TTS</strong> <strong>Group</strong> <strong>ASA</strong> 100 % NOK 1 000 000 1 000<br />
<strong>TTS</strong> Singapore <strong>TTS</strong> <strong>Group</strong> <strong>ASA</strong> 100 % SGD 1 141 813 1 141 813<br />
<strong>TTS</strong> Greece <strong>TTS</strong> <strong>Group</strong> <strong>ASA</strong> 100 % EUR 200 000 2 000<br />
<strong>TTS</strong> Marine GmbH (<strong>for</strong>mer <strong>TTS</strong> Ships Equipment GmbH) <strong>TTS</strong> Marine AB 100 % EUR 255 646 5 000<br />
<strong>TTS</strong> Marine Inc. <strong>TTS</strong> Marine AB 100 % USD 190 000 1 900<br />
<strong>TTS</strong>-LMG Marine Cranes GmbH <strong>TTS</strong> Marine GmbH 100 % EUR 25 000 1<br />
<strong>TTS</strong> Liftec Oy <strong>TTS</strong> Marine AB 100 % EUR 76 500 1 020<br />
<strong>TTS</strong> Port Equipment AB <strong>TTS</strong> Marine AB 100 % SEK 100 000 1 000<br />
<strong>TTS</strong> Kocks Ostrava s.r.o. <strong>TTS</strong> Marine GmbH 100 % EUR 310 291 1 000<br />
<strong>TTS</strong> Marine Equipment Co. Ltd. <strong>TTS</strong> Marine GmbH 100 % RMB 15 728 611 1 000<br />
<strong>TTS</strong> Marine S.r.l <strong>TTS</strong> Marine AB 100 % EUR 10 400 1 000<br />
<strong>TTS</strong> Energy Bergen AS (<strong>for</strong>mer <strong>TTS</strong> Marine Cranes AS) 1 <strong>TTS</strong> <strong>Group</strong> <strong>ASA</strong> 100 % NOK 1 000 000 1 000<br />
<strong>TTS</strong> Cranes Norway AS <strong>TTS</strong> <strong>Group</strong> <strong>ASA</strong> 100 % NOK 500 000 1 000<br />
<strong>TTS</strong> Energy Ålesund AS (<strong>for</strong>mer <strong>TTS</strong> Offshore Handling Equipment AS) 1 <strong>TTS</strong> <strong>Group</strong> <strong>ASA</strong> 100 % NOK 100 000 100 000<br />
<strong>TTS</strong> Energy AS (<strong>for</strong>mer <strong>TTS</strong> Sense AS) 1 <strong>TTS</strong> <strong>Group</strong> <strong>ASA</strong> 100 % NOK 1 200 288 400 076<br />
<strong>TTS</strong> Kocks Korea <strong>TTS</strong> Marine GmbH 100 % KRW 1 513 390 000 1 000<br />
<strong>TTS</strong> Hua Hai AB <strong>TTS</strong> Marine AB 100 % SEK 100 000 1 000<br />
<strong>TTS</strong> Sense (Canada) Ltd. <strong>TTS</strong> Energy AS 100 % CAD 100 10<br />
<strong>TTS</strong> Sense MUD AS1 <strong>TTS</strong> Energy AS 100 % NOK 1 000 000 1 000<br />
<strong>TTS</strong> Sense Pte Ltd Singapore <strong>TTS</strong> Energy AS 100 % SGD 100 000 100 000<br />
<strong>TTS</strong> EDM Inc. <strong>TTS</strong> Energy AS 100 % USD 100 000 1 000<br />
<strong>TTS</strong> Mexico <strong>TTS</strong> Energy AS 100 % MxN 50 000 50 000<br />
Drillrig AS <strong>TTS</strong> Energy AS 100 % NOK 100 000 100 000<br />
1) <strong>TTS</strong> Energy Ålesund (<strong>for</strong>merly <strong>TTS</strong> Offshore Handling Systems), <strong>TTS</strong> Energy Bergen (<strong>for</strong>merly <strong>TTS</strong> Marine Cranes), <strong>TTS</strong> Energy AS (<strong>for</strong>merly <strong>TTS</strong> Sense AS)<br />
and <strong>TTS</strong> Sense MUD AS were merged in January 2011.<br />
110
note 11 cont.<br />
THE LARGEST SHAREHOLDERS IN <strong>TTS</strong> GROUP <strong>ASA</strong> PER 31 DECEMBER <strong>2010</strong> WERE AS FOLLOWS:<br />
(All figures in NOK)<br />
Shareholder Number of shares Holding Voting share<br />
Rasmussengruppen AS 10 650 800 14.27 % 14.27 %<br />
Skeie Technology AS 8 929 879 11.97 % 11.97 %<br />
Skandinaviska Enskilda Banken 5 732 552 7.68 % 7.68 %<br />
Lesk AS 5 306 058 7.11 % 7.11 %<br />
Stisk AS 5 306 058 7.11 % 7.11 %<br />
Odin Maritim 2 164 000 2.90 % 2.90 %<br />
Tamafe Holding AS 2 160 735 2.90 % 2.90 %<br />
Barrus Capital AS (Ii) 2 000 000 2.68 % 2.68 %<br />
Holberg Norge 1 918 589 2.57 % 2.57 %<br />
Statoil Pensjon 1 543 937 2.07 % 2.07 %<br />
Itlution AS 1 475 261 1.98 % 1.98 %<br />
SHB Stockholm Clients Account 1 416 768 1.90 % 1.90 %<br />
Holberg Norden 1 201 329 1.61 % 1.61 %<br />
Skagen Vekst 1 176 000 1.58 % 1.58 %<br />
Sal Oppenheim Jr & Cie 1 100 000 1.47 % 1.47 %<br />
Rbc Dexia Investor Services Bank 962 000 1.29 % 1.29 %<br />
Skeie Consultants AS 953 033 1.28 % 1.28 %<br />
Odin Europa Smb 848 619 1.14 % 1.14 %<br />
Sundt AS 656 000 0.88 % 0.88 %<br />
Statoil Forsikring A.S 416 987 0.56 % 0.56 %<br />
Total 20 largest shareholders 55 918 605 74.93 % 74.93 %<br />
Total others 18 712 594 25.07 % 25.07 %<br />
Total 74 631 199 100.00 % 100.00 %<br />
SHARES OWNED By BOARD MEMBERS AND GROUP MANAGEMENT AND RELATED PARTIES<br />
Board Per 31.12.10 Per 31.03.11<br />
Trym Skeie1 2 160 735 2 160 735<br />
Bjarne Skeie2 20 495 028 20 495 028<br />
Karen T. Mørkestøl 3 217 3 217<br />
Jarle Dyrdal 30 227 30 227<br />
<strong>Group</strong> management<br />
Johannes D. Neteland 185 000 185 000<br />
Related daugther Anna S. Neteland 100 100<br />
Ivar K. Hanson 52 422 52 422<br />
Lennart Svensson 200 200<br />
Inge Gabrielsen 450 450<br />
1) Owns Tamafe Holding (100 %)<br />
2) Bjarne Skeie owns (20 % of the shares and 100 % of the voting shares) in Skeie Technology AS<br />
and Skeie Consultants AS. Lesk AS is owned by his daughter Lena Skeie. S<br />
tisk AS is owned by his daughter Stina Skeie.<br />
On 3 June <strong>2010</strong>, the Annual General Meeting resolved to authorise the Board to issue up to 7,000,000<br />
shares in the event of an acquisition or merger. This authority is valid until the ordinary general<br />
meeting <strong>2010</strong>, or until 30 June 2011, whichever is the earlier. The directed issue in July <strong>2010</strong> issued<br />
6 722 920 shares under this authority.<br />
As at 31 December <strong>2010</strong>, 240 000 options had been allotted that can be exercised until 15 June 2011<br />
at the price of 7.55 NOK (under an authority <strong>for</strong> a total of 420 000 options granted at the ordinary<br />
general meeting on 15 June 2009). A further 360 000 options were issued that can be exercised until<br />
3 June 2012 at the price of 5.91 NOK (under an authority <strong>for</strong> a total of 420 000 options granted at<br />
the ordinary general meeting on 3 June <strong>2010</strong>).<br />
102-113 nOTES TO ThE AccOUnTS <strong>TTS</strong> GROUP <strong>ASA</strong><br />
111
102-113 nOTES TO ThE AccOUnTS <strong>TTS</strong> GROUP <strong>ASA</strong><br />
note 11 cont.<br />
THESE OPTIONS ARE DISTRIBUTED AS FOLLOWS:<br />
Number of Number of<br />
options that can options that can<br />
be exercised Exercise be exercised Exercise<br />
Name Position Company until 15.06.11 price until 03.06.12 price Totalt<br />
Johannes D. Neteland President & CEO <strong>TTS</strong> <strong>Group</strong> <strong>ASA</strong> 120 000 7.55 120 000 5.91 240 000<br />
Arild Apelthun CFO <strong>TTS</strong> <strong>Group</strong> <strong>ASA</strong> 0 60 000 5.91 60 000<br />
Lennart Svensson Divisional Director <strong>TTS</strong> Port Equipment AB 60 000 7.55 60 000 5.91 120 000<br />
Ivar K. Hanson Divisional Director <strong>TTS</strong> Marine AS 60 000 7.55 60 000 5.91 120 000<br />
Inge Gabrielsen Divisional Director <strong>TTS</strong> Energy AS 0 60 000 5.91 60 000<br />
Total number of options to management staff 240 000 360 000 600 000<br />
No options were exercised in <strong>2010</strong>.<br />
Option schemes were granted to group management under authorities granted by the ordinary general meeting in 2008, 2009 and <strong>2010</strong>.<br />
These schemes allow group management to buy a number of shares in future <strong>for</strong> a previously agreed purchase price equal to the fair market<br />
price at the time share options are granted.<br />
Option premiums will be exercised when options are awarded using the Black & Scholes (BS) option pricing model.<br />
The options run <strong>for</strong> up to two years, with the first exercise to option being after one year (50 %) and then (12.5 %) per quarter, giving<br />
a weighted average 15 month period as used in BS. Option premiums are spread over the option period of two years.<br />
Forecast volatility is based on a combination of historic data and estimates.<br />
Volatilities used <strong>for</strong> options awarded are 42 % <strong>for</strong> 2008, 74 % <strong>for</strong> 2009 and 81 % <strong>for</strong> <strong>2010</strong>.<br />
Risk-free interest rates used are 5.0 % <strong>for</strong> 2008, 2.95 % <strong>for</strong> 2009 and 2.23 % <strong>for</strong> <strong>2010</strong>. Option costs <strong>for</strong> <strong>2010</strong> are charged to costs at 2.395 TNOK.<br />
The corresponding figure <strong>for</strong> 2009 was 5.437 TNOK. Option costs are classified as pay in the profit and loss account.<br />
Employer’s contributions are charged to costs when options are realised.<br />
TREASURy SHARES<br />
The ordinary general meeting on 15 June 2009 resolved not to authorise the Board to buy treasury shares. This resolution was upheld in <strong>2010</strong>.<br />
<strong>TTS</strong> had up to 133.100 shares between 15 June 2009 and 31 December <strong>2010</strong>, holding 35.210 treasury shares as at 31 December <strong>2010</strong>.<br />
SUBORDINATED CONVERTIBLE LOAN<br />
At an extraordinary general meeting on 10 January 2011, the company agreed to take up a subordinated convertible loan of 200 MNOK. Bond holders<br />
may convert at the price of 9.2839 NOK at any time. The maximum number of shares which can be created by converting in full is 21 542 671.<br />
The loan and conversion rights were established after the year end, and hence are not included when calculating the profit per share in <strong>2010</strong>.<br />
note 12 Other short-term liabilities<br />
(Amounts in NOK 1000)<br />
112<br />
<strong>2010</strong> 2009<br />
Provision <strong>for</strong> holiday pay 1 004 1 121<br />
Other provisions <strong>for</strong> costs 1 010 5 394<br />
Total other short-term liabilities 2 014 6 515<br />
note 13 Other operating costs<br />
(Amounts in NOK 1000)<br />
<strong>2010</strong> 2009<br />
Building lease, cost of premises 1 374 1 951<br />
IT costs 1 027 2 473<br />
Marketing, travel 4 643 5 914<br />
Other 11 089 11 454<br />
Total other operating costs 18 132 21 793
note 14 Related parties<br />
All subsidiaries (Note 6), joint ventures (note 6), members of the Board and top management are to be regarded<br />
as related parties. The group has engaged in many different transactions with subsidiaries and joint ventures.<br />
All transactions were made in the normal course of business at arm’s length prices.<br />
note 15 Financial items and exchange rate gains/losses<br />
(Amounts in NOK 1000)<br />
<strong>2010</strong> 2009<br />
Income from investments in subsidiaries -232 083 -242 917<br />
Income from investments in associated companies 891 935<br />
Interest income from companies in same group 63 852 4 958<br />
Other interest income 912 19 776<br />
Dividends 0 0<br />
Interest income to companies in same group -16 552 0<br />
Interest costs on liabilities to financial institutions -61 794 -40 871<br />
Other financial costs -5 912 -6 500<br />
Net exchange rate gains (losses) -762 -3 202<br />
Total -251 448 -267 821<br />
ExCHANGE RATE GAINS/LOSSES<br />
Currency differences booked to income and costs in the profit and loss account are as follows:<br />
<strong>2010</strong> 2009<br />
Fx income 35 872 30 089<br />
Fx costs -36 634 -33 291<br />
Total -762 -3 202<br />
Fx income and costs are net and shown as other financial costs.<br />
note 16 Events since year end<br />
No dividends have been proposed to shareholders <strong>for</strong> <strong>2010</strong>.<br />
The extraordinary general meeting on 10 January, 2011 resolved to take up a subordinated convertible bond loan of<br />
a nominal 200 MNOK. The loan carries 8 % coupon interest and matures on 18 January 2016. The group has a call<br />
option on the stated terms which expires on August 2 2014. Bondholders may convert at a price of 9.2839 NOK<br />
at any time. The maximum number of shares which can be issued if the loan is converted in full is 21 542 671,<br />
e quivalent to a dilution effect of 28.87 %.<br />
The Norwegian entities in the Energy division were merged in February 2011 to simplify internal structures and<br />
streamline internal processes. The companies involved in the merger were <strong>TTS</strong> Energy AS (acquiring company),<br />
<strong>TTS</strong> Energy Bergen AS, <strong>TTS</strong> Energy Ålesund AS and <strong>TTS</strong> Sense MUD AS. Since the merger, all companies are now<br />
part of <strong>TTS</strong> Energy AS. The merger date <strong>for</strong> accounting purposes was 1 January <strong>2010</strong>.<br />
We would also refer to announcements published on the Oslo Stock Exchange of major new contracts concluded<br />
in 2011. The main individual contracts announced to the Oslo Exchange and concluded since the year end a worth<br />
a total of approx. 91 MNOK <strong>for</strong> Marine, approx. 55 MNOK <strong>for</strong> Port and Logistics and approx. 505 MNOK <strong>for</strong> Energy.<br />
There have not been any cancellations of significance since the year end.<br />
102-113 nOTES TO ThE AccOUnTS <strong>TTS</strong> GROUP <strong>ASA</strong><br />
113
Auditor’s <strong>report</strong><br />
<strong>2010</strong><br />
114<br />
To the Annual Shareholders’ Meeting of <strong>TTS</strong> <strong>Group</strong> <strong>ASA</strong><br />
INDEPENDENT AUDITOR’S REPORT<br />
KPMG AS Telephone +47 04063<br />
Postboks 4 Nygårdstangen Fax +47 55 32 71 20<br />
St. Jakobs plass 9 Internet www.kpmg.no<br />
N-5838 Bergen Enterprise 935 174 627 MVA<br />
Report on the Financial Statements<br />
We have audited the accompanying financial statements of <strong>TTS</strong> <strong>Group</strong> <strong>ASA</strong>, which comprise the<br />
financial statements of the parent company <strong>TTS</strong> <strong>Group</strong> <strong>ASA</strong> and the consolidated financial<br />
statements of <strong>TTS</strong> <strong>Group</strong> <strong>ASA</strong> and its subsidiaries. The parent company’s financial statements<br />
comprise the balance sheet as at 31 December <strong>2010</strong>, the income statement and cash flow<br />
statement <strong>for</strong> the year then ended, and a summary of significant accounting policies and other<br />
explanatory in<strong>for</strong>mation. The consolidated financial statements comprise the statement of<br />
financial position and the statement of comprehensive income, statement of changes in equity and<br />
cash flow statement <strong>for</strong> the year then ended, and a summary of significant accounting policies<br />
and other explanatory in<strong>for</strong>mation.<br />
The Board of Directors and the Managing Director’s Responsibility <strong>for</strong> the Financial Statements<br />
The Board of Directors and the Managing Director are responsible <strong>for</strong> the preparation and fair<br />
presentation of the parent company financial statements in accordance with the Norwegian<br />
Accounting Act and generally accepted accounting standards and practices in Norway and <strong>for</strong><br />
the consolidated financial statements in accordance with International Financial Reporting<br />
Standards as adopted by the EU, and <strong>for</strong> such internal control as the Board of Directors and the<br />
Managing Director determine is necessary to enable the preparation of financial statements that<br />
are free from material misstatement, whether due to fraud or error.<br />
Auditor’s Responsibility<br />
Our responsibility is to express an opinion on these financial statements based on our audit. We<br />
conducted our audit in accordance with laws, regulations, and auditing standards and practices<br />
generally accepted in Norway, including International Standards on Auditing. Those standards<br />
require that we comply with ethical requirements and plan and per<strong>for</strong>m the audit to obtain<br />
reasonable assurance about whether the financial statements are free from material misstatement.<br />
An audit involves per<strong>for</strong>ming procedures to obtain audit evidence about the amounts and<br />
disclosures in the financial statements. The procedures selected depend on the auditor’s<br />
judgment, including the assessment of the risks of material misstatement of the financial<br />
statements, whether due to fraud or error. In making those risk assessments, the auditor considers<br />
internal control relevant to the entity’s preparation and fair presentation of the financial<br />
statements in order to design audit procedures that are appropriate in the circumstances, but not<br />
<strong>for</strong> the purpose of expressing an opinion on the effectiveness of the entity’s internal control. An<br />
audit also includes evaluating the appropriateness of accounting policies used and the<br />
reasonableness of accounting estimates made by management, as well as evaluating the overall<br />
presentation of the financial statements.<br />
We believe that the audit evidence we have obtained is sufficient and appropriate to provide a<br />
basis <strong>for</strong> our audit opinion.<br />
KPMG AS, a Norwegian member firm of the KPMG network of independent<br />
member firms affiliated with KPMG International Cooperative (“KPMG<br />
International”), a Swiss entity.<br />
Statsautoriserte revisorer - medlemmer av Den norske Revisor<strong>for</strong>ening<br />
Offices in:<br />
Oslo<br />
Alta<br />
Arendal<br />
Bergen<br />
Bodø<br />
Elverum<br />
Finnsnes<br />
Grimstad<br />
Hamar<br />
Haugesund<br />
Kristiansand<br />
Larvik<br />
Mo i Rana<br />
Molde<br />
Narvik<br />
Røros<br />
Sandefjord<br />
Sandnessjøen<br />
Stavanger<br />
Stord<br />
Tromsø<br />
Trondheim<br />
Tønsberg<br />
Ålesund
Independent auditor's <strong>report</strong><br />
<strong>TTS</strong> <strong>Group</strong> <strong>ASA</strong><br />
Opinion on the separate financial statement<br />
In our opinion, the parent company’s financial statements give a true and fair view of the<br />
financial position of <strong>TTS</strong> <strong>Group</strong> <strong>ASA</strong> as at 31 December, <strong>2010</strong>, and of its financial per<strong>for</strong>mance<br />
and its cash flows <strong>for</strong> the year then ended in accordance with the Norwegian Accounting Act and<br />
accounting standards and practices generally accepted in Norway.<br />
Opinion on the consolidated financial statements<br />
In our opinion, the consolidated financial statements give a true and fair view of the financial<br />
position of <strong>TTS</strong> <strong>Group</strong> <strong>ASA</strong> and its subsidiaries as at 31 December, <strong>2010</strong>, and of its financial<br />
per<strong>for</strong>mance and its cash flows <strong>for</strong> the year then ended in accordance with International Financial<br />
Reporting Standards as adopted by the EU.<br />
Report on Other Legal and Regulatory Requirements<br />
Opinion on the Board of Directors’ <strong>report</strong><br />
Based on our audit of the financial statements as described above, it is our opinion that the<br />
in<strong>for</strong>mation presented in the Board of Directors’ <strong>report</strong> concerning the financial statements, the<br />
going concern assumption, and coverage of the loss is consistent with the financial statements<br />
and complies with the law and regulations.<br />
Opinion on Accounting Registration and Documentation<br />
Based on our audit of the financial statements as described above, and control procedures we<br />
have considered necessary in accordance with the International Standard on Assurance<br />
Engagements (ISAE) 3000, «Assurance Engagements Other than Audits or Reviews of Historical<br />
Financial In<strong>for</strong>mation», it is our opinion that the company’s management has fulfilled its duty to<br />
produce a proper and clearly set out registration and documentation of the company’s accounting<br />
in<strong>for</strong>mation in accordance with the law and bookkeeping standards and practices generally<br />
accepted in Norway.<br />
Bergen, 27 April 2011<br />
KPMG AS<br />
Knut Olav Karlsen<br />
State Authorised Public Accountant<br />
[Translation has been made <strong>for</strong> in<strong>for</strong>mation purposes only]<br />
p. 2 / 2<br />
115
3-15 <strong>TTS</strong> GROUP<br />
16-33 BUSINESS AREAS<br />
35-43 CORPORATE GOVERNANCE<br />
45 -116 DiREcTOR’S REPORT AnD AccOUnTS<br />
118-123 ORGANISATION<br />
116<br />
confirmation from the board of Directors and chief Executive Officer<br />
We confirm, to the best of our knowledge, that the consolidated annual accounts <strong>for</strong><br />
the period 1 January to 31 December <strong>2010</strong> have been prepared in accordance with current accounting<br />
standards/IFRS and that the in<strong>for</strong>mation herein gives a true and fair view of the company’s and<br />
group’s assets, liabilities, financial position and profit as a whole, and that the annual <strong>report</strong> gives<br />
a fair view of the development, result and position of the company and of the group, together<br />
with a description of the principal risks and uncertainties facing the enterprise.<br />
Bergen, 13. april 2011<br />
THE BOARD OF <strong>TTS</strong> GROUP <strong>ASA</strong><br />
Trym Skeie Bjarne Skeie Anne Breive<br />
CHAIRMAN DIRECTOR DIRECTOR<br />
Kjerstin Fyllingen Jarle Dyrdal Karen T. Mørkestøl<br />
DIRECTOR DIRECTOR DIRECTOR<br />
Johannes D. Neteland<br />
PRESIDENT & CEO
117
3-15 <strong>TTS</strong> GROUP<br />
16-33 BUSINESS AREAS<br />
35-43 CORPORATE GOVERNANCE<br />
45-116 DIRECTOR’S REPORT AND ACCOUNTS<br />
118-123 ORGAniSATiOn<br />
118<br />
DEck<br />
EqUiPMEnT<br />
Edgar Bethmann<br />
<strong>TTS</strong>-LMG Marine<br />
cranes Gmbh<br />
Jens Meldal<br />
<strong>TTS</strong> Marine Gmbh<br />
Edgar Bethmann<br />
<strong>TTS</strong> Marine<br />
Shanghai co. Ltd.<br />
Ketil Skjeggedal<br />
<strong>TTS</strong> kocks<br />
Ostrava s.r.o.<br />
Thomas Fojtik<br />
<strong>TTS</strong> Marine<br />
korea co. Ltd.<br />
Marcus Bergmann<br />
<strong>TTS</strong> Marine Equipment<br />
(Dalian) co. Ltd.<br />
Göran Bertilson<br />
MARinE<br />
Ivar K. Hanson<br />
ExECUTIVE VICE PRESIDENT<br />
cARGO AccESS<br />
Per Croner<br />
<strong>TTS</strong> Marine Ab<br />
Per Croner<br />
<strong>TTS</strong> Ships<br />
Equipment AS<br />
Jan-Magnar Grøtte<br />
<strong>TTS</strong> Marine s.r.l.<br />
Alessio Quargnenti<br />
SERvicES<br />
Arne Knudsen<br />
<strong>TTS</strong> Marine AS<br />
Ivar K. Hanson<br />
<strong>TTS</strong> Marine inc.<br />
Torsten Paas<br />
<strong>TTS</strong> vietnam<br />
Dan Magnusson<br />
<strong>TTS</strong> korea<br />
Kyung-Hwan Kim<br />
<strong>TTS</strong> Singapore Pte. Ltd.<br />
Jan Ove Hovdenak<br />
<strong>TTS</strong> Greece Ltd.<br />
Dimitris Manolias<br />
jv/MGMT<br />
Ivar K. Hanson<br />
<strong>TTS</strong> GROUP<br />
Johannes D. Neteland<br />
<strong>TTS</strong> hui hai Ships<br />
Equipment co. Ltd.<br />
Madame He Pu<br />
<strong>TTS</strong> bohai<br />
Machinery co. Ltd.<br />
Li Dali<br />
PRESIDENT & CEO
EnERGY<br />
Inge Gabrielsen<br />
ExECUTIVE VICE PRESIDENT<br />
<strong>TTS</strong> Energy AS<br />
Inge Gabrielsen<br />
<strong>TTS</strong> Sense canada Ltd.<br />
Mark Skawronski<br />
<strong>TTS</strong> Sense<br />
Singapore Pte. Ltd.<br />
Bergtor Haugaa<br />
Sense DrillFab AS<br />
Jan Ove Aasen<br />
<strong>TTS</strong> do brazil<br />
Joao Manoel<br />
de Souza Araujo<br />
PORT AnD LOGiSTicS<br />
Lennart Svensson<br />
ExECUTIVE VICE PRESIDENT<br />
<strong>TTS</strong> Liftec Oy<br />
Tatu Miikkulainen<br />
<strong>TTS</strong> Port<br />
Equipment Ab<br />
Lennart Svennson<br />
<strong>TTS</strong> handling<br />
Systems AS<br />
Rolf-Atle Tomassen<br />
119
3-15 <strong>TTS</strong> GROUP<br />
16-33 BUSINESS AREAS<br />
35-43 CORPORATE GOVERNANCE<br />
45-116 DIRECTOR’S REPORT AND ACCOUNTS<br />
118-123 ORGAniSATiOn<br />
Marine<br />
Division<br />
Edgar bethmann<br />
Madame he Pu<br />
Alessio quargnenti jan Ove hovdenak Göran bertilson<br />
Thomas Fojtik<br />
Marcus bergmann<br />
120<br />
Per croner<br />
jan-Magnar Grøtte<br />
Dan Magnusson<br />
FOTO: OLOF HOLDAR<br />
Arne knudsen<br />
Dimitris Manolias Li Dali<br />
kyung-hwan kim<br />
ivar k. hanson<br />
jens Meldal<br />
ketil Skjeggedal<br />
Torsten Paas
Energy<br />
Division<br />
inge Gabrielsen<br />
bergtor haugaa<br />
Pål Larsen<br />
Mark Skawronski<br />
jan Ove Aasen<br />
joao Manoel<br />
de Souza Araujo<br />
Port and Logistics<br />
Division<br />
Tatu Miikkulainen<br />
Lennart Svensson<br />
Rolf-Atle Tomassen<br />
121
3-15 <strong>TTS</strong> GROUP<br />
16-33 BUSINESS AREAS<br />
35-43 CORPORATE GOVERNANCE<br />
45-116 DIRECTOR’S REPORT AND ACCOUNTS<br />
118-123 ORGAniSATiOn<br />
companies in the <strong>TTS</strong> <strong>Group</strong><br />
bRAziL<br />
<strong>TTS</strong> do brazil<br />
Av. Elias Agostinho 340<br />
Suite 807 - Petro Office<br />
Imbetiba Macaé-RJ, 27913-350<br />
Tel: +55 22 3311 6647<br />
Fax: +55 22 3311 6647<br />
cAnADA<br />
<strong>TTS</strong> Sense canada Ltd<br />
6708–75th Street<br />
Edmonton, Alberta<br />
Canada T6E 6T9<br />
Tel: +1 780 430-1833<br />
Fax: +1 780 430-1834<br />
canada@tts-sense.com<br />
chinA<br />
<strong>TTS</strong> hua hai Ships<br />
Equipment co Ltd<br />
18th floor, 3255 Zhou Jia Zui Road<br />
CN-200093 Shanghai<br />
Tel: +86 21 6539 8257<br />
Fax: +86 21 6539 7400<br />
info@tts-huahai.com<br />
<strong>TTS</strong> bohai Machinery<br />
(Dalian) co Ltd<br />
Beihai Industrial Park<br />
Sujia, Dalianwan Street<br />
Ganjingzi District<br />
CN-Dalian<br />
Tel: +86 411 8711 2670<br />
Fax: +86 411 8711 2702<br />
info@tts-bohai.com<br />
<strong>TTS</strong> Marine<br />
(Shanghai) co Ltd<br />
No.389 GaoDong No 2 Rd<br />
GaoDong Industrial Park<br />
Pudong<br />
CN-Shanghai 200137<br />
Tel: +86 21 5848 5300<br />
Fax: +86 21 5848 5311<br />
office@tts-marine.cn<br />
122<br />
<strong>TTS</strong> Marine Equipment<br />
(Dalian) co Ltd<br />
Tuchengzi Cun<br />
Dalianwan Street<br />
Ganjingzi District<br />
CN-Dalian 116034<br />
Tel: +86 411 8711 9663<br />
Fax: +86 411 8711 9678<br />
info@tts-me.cn<br />
czEch REPUbLic<br />
<strong>TTS</strong> kocks Ostrava s.r.o.<br />
U Reky 808<br />
CZ-720 00 Ostrava-Hrabová<br />
Tel: +420 596 782 708<br />
Fax: +420 596 782 707<br />
info@tts-kocks.cz<br />
FinLAnD<br />
<strong>TTS</strong> Liftec Oy<br />
Sorkkalantie 394<br />
33980 Pirkkala<br />
Tel: +358 3 3140 1400<br />
Fax: +358 3 3140 1444<br />
sales@tts-liftec.fi<br />
GERMAnY<br />
<strong>TTS</strong> Marine Gmbh<br />
Wachtstrasse 17–24<br />
DE-28195 Bremen<br />
P.O. Box 104080<br />
DE-28040 Bremen<br />
Tel: +49 421 52008-0<br />
Fax: +49 421 52008-20<br />
info@tts-marine.de<br />
<strong>TTS</strong>-LMG<br />
Marine cranes Gmbh<br />
Gutenbergstrasse 1<br />
DE-23611 Bad Schwartau<br />
Tel: +49 451 4501 0<br />
Fax: +49 451 4501 392<br />
info@tts-lmg.de<br />
GREEcE<br />
<strong>TTS</strong> Greece Ltd<br />
Skouze 1<br />
18535 Piraeus<br />
Tel: +30 210 42 94 480<br />
Fax: +30 210 42 93 933<br />
info@ttsgreece.gr<br />
iTALY<br />
<strong>TTS</strong> Marine s.r.l.<br />
Ponte Colombo<br />
IT-16126 Genova<br />
Tel: +39 010 24 81 205<br />
Fax: +39 010 25 43 191<br />
info@tts-marine.it<br />
kOREA<br />
<strong>TTS</strong> Marine korea co Ltd<br />
#1664–10, Songjeong-Dong<br />
Gangseo-Gu<br />
Busan 618-819 Korea<br />
Tel: +82 51 831 8401<br />
Fax: +82 51 979 5610<br />
mail@tts-marine.co.kr<br />
nORWAY<br />
<strong>TTS</strong> <strong>Group</strong> <strong>ASA</strong><br />
Folke Bernadottes vei 38<br />
Postboks 3577 Fyllingsdalen<br />
NO-5845 Bergen<br />
Tel: +47 55 94 74 00<br />
Fax: +47 55 94 74 01<br />
info@tts-group.no<br />
<strong>TTS</strong> Energy AS<br />
Andøyfaret 3<br />
NO-4623 Kristiansand<br />
Tel: +47 380 000 570<br />
Fax: +47 380 000 572<br />
sales@tts-energy.com<br />
Folke Bernadottesvei 38<br />
Postboks 3566 Fyllingsdalen<br />
NO-5845 Bergen<br />
Tel: +47 55 34 84 00<br />
Fax: +47 55 34 84 01<br />
sales@tts-energy.com
<strong>TTS</strong> handling Systems AS<br />
Holterkollveien 6<br />
P.O. Box 49<br />
NO-1441 Drøbak<br />
Tel: +47 64 90 79 10<br />
Fax: +47 64 93 16 63<br />
info@tts-hs.no<br />
Sense Drillfab AS<br />
Spjotneset<br />
Postboks 13<br />
NO-4685 Nodeland<br />
Tel: +47 48 03 05 00<br />
Fax: +47 38 18 90 01<br />
jan.ove.aasen@sensedrillfab.no<br />
<strong>TTS</strong> Ships Equipment AS<br />
Folke Bernadottesvei 38<br />
P.O. Box 3517, Fyllingsdalen<br />
NO-5845 Bergen<br />
Tel: +47 55 11 30 50<br />
Fax: +47 55 11 30 60<br />
info@tts-se.no<br />
<strong>TTS</strong> Marine AS<br />
Barstølveien 26<br />
Servicebox 602<br />
NO-4606 Kristiansand<br />
Tel: +47 38 04 95 00<br />
Fax: +47 38 04 93 41<br />
service.krs@tts-marine.no<br />
SinGAPORE<br />
<strong>TTS</strong> Sense<br />
Singapore Pte Ltd<br />
16 Enterprise Road<br />
Enterprise 10<br />
Singapore 627699<br />
Tel: +65 68 67 90 65<br />
Fax: +65 62 64 40 11<br />
mailsg@tts-sense.com<br />
<strong>TTS</strong> Singapore Pte Ltd<br />
16 Enterprise Road<br />
Enterprise 10<br />
Singapore 627699<br />
Tel: +65 68 67 90 70<br />
Fax: +65 62 64 47 30<br />
service@tts-singapore.com<br />
SWEDEn<br />
<strong>TTS</strong> Marine Ab<br />
Kämpegatan 3<br />
SE-411 04 Göteborg<br />
Tel: +46 31 725 79 00<br />
Fax: +46 31 725 78 00<br />
info@tts-se.se<br />
<strong>TTS</strong> Port Equipment Ab<br />
Kämpegatan 3<br />
SE-411 04 Göteborg<br />
Tel: +46 31 725 79 00<br />
Fax: +46 31 725 78 04<br />
info@tts-port.se<br />
USA<br />
<strong>TTS</strong> Marine inc<br />
6555 North Powerline Road,<br />
Suite #410<br />
Fort Lauderdale, FL 33309<br />
Tel: +1 954 493 6405<br />
Fax: +1 954 493 6409<br />
info@tts-se.us<br />
viETnAM<br />
<strong>TTS</strong> vietnam<br />
4th Floor, Harbour View Building<br />
No 4, Tran Phu Street<br />
Haiphong City, Vietnam<br />
Tel: +84 31 36 86 518<br />
Fax: +84 31 36 86 516<br />
info@tts-se.vn<br />
123
<strong>TTS</strong> <strong>Group</strong> <strong>ASA</strong><br />
Folke Bernadottesvei 38<br />
PO Box 3577 Fyllingsdalen<br />
N-5845 Bergen, Norway<br />
Tel: +47 55 94 74 00<br />
Fax: +47 55 94 74 01<br />
E-mail: info.bgo@tts-group.no<br />
www.ttsgroup.com


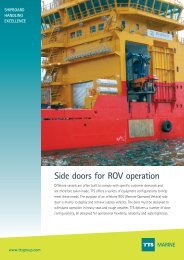

![2012.MasterPresentation_final [Compatibility Mode] - TTS Group ASA](https://img.yumpu.com/4612021/1/190x146/2012masterpresentation-final-compatibility-mode-tts-group-asa.jpg?quality=85)