Create successful ePaper yourself
Turn your PDF publications into a flip-book with our unique Google optimized e-Paper software.
A N N U A L R E P O R T 2 0 0 6
<strong>TTS</strong> GROUP<br />
Financial highlights 4<br />
Vision, business idea and strategy 6<br />
This is <strong>TTS</strong> 8<br />
Key events <strong>2006</strong> 10<br />
REPORT FROM THE CEO<br />
Growth – and further progress 11<br />
BUSINESS AREAS<br />
Dry Cargo Handling Division 14<br />
Marine Cranes Division 16<br />
Port and Material Handling Division 18<br />
Deck Machinery Division 20<br />
<strong>TTS</strong> expects growth in Vietnam<br />
Crane division prepared for<br />
22<br />
new chall<strong>eng</strong>es<br />
Continued strong market for<br />
24<br />
ships equipment until 2015? 26<br />
CORPORATE GOVERNANCE<br />
INFORMATION<br />
Shareholder information 28<br />
Corporate Governance 30<br />
Board of Directors <strong>TTS</strong> Marine <strong>ASA</strong> 32<br />
Senior management 34<br />
DIRECTOR’S REPORT AND<br />
ACCOUNTS<br />
Director’s report 36<br />
Profit and loss account and notes<br />
- <strong>Group</strong> 43<br />
- <strong>TTS</strong> Marine <strong>ASA</strong> 71<br />
Auditor’s report 87<br />
<strong>TTS</strong><br />
Companies in the <strong>TTS</strong>-group 88<br />
Organisation 90<br />
2
11 14 Dry<br />
President & CEO<br />
Cargo Handling Division<br />
16 18<br />
Marine Cranes Division<br />
Port and Material Handling Division<br />
20<br />
Deck Machinery Division
4-11 <strong>TTS</strong> GROUP 11-13 REPORT FROM THE CEO 14-27 BUSINESS AREAS 28-35 CORPORATE GOVERNANCE 36-87 DIRECTOR’S REPORT AND ACCOUNTS<br />
Financial highlights <strong>2006</strong><br />
4<br />
IFRS IFRS IFRS NGAAP NGAAP<br />
<strong>2006</strong> 2005 2004 2003 2002<br />
PROFIT AND LOSS ACCOUNT (NOK 1.000)<br />
Operating income 1 604 030 1 149 831 786 174 621 505 744 169<br />
Operating profit/loss before depresiation (EBITDA) 98 613 67 199 42 122 13 705 31 662<br />
Operating profit/loss (EBIT) 89 697 59 635 36 056 -2 657 13 936<br />
Pre-tax profit/loss 84 492 56 297 31 251 -1 225 9 509<br />
Net profit/loss 60 481 40 239 21 630 655 11 336<br />
BALANCE SHEET (NOK 1.000)<br />
Fixed assets 460 996 429 629 335 374 268 849 263 264<br />
Current assets 1 172 135 753 157 465 029 454 738 418 701<br />
Total assets 1 633 130 1 182 786 800 402 723 587 681 965<br />
Equity 598 062 394 932 260 909 223 669 213 053<br />
Long-term liabilities 196 635 77 279 76 294 41 695 65 190<br />
Current liabilities 838 434 710 574 463 199 458 222 403 723<br />
Total equity and liabilities 1 633 130 1 182 786 800 402 723 587 681 965<br />
KEY RATIOS<br />
FINANCIAL STRENGTH<br />
Equity to assets ratio (as a percentage of total capital) 36.6 % 33.4 % 32.6 % 30.9 % 31.2 %<br />
PROFITABILITY<br />
EBITDA margin 6.1 % 5.8 % 5.4 % 2.2 % 4.3 %<br />
EBIT margin 5.6 % 5.2 % 4.6 % -0.4 % 1.9 %<br />
Profit margin (pre-tax) 5.3 % 4.9 % 4.0 % -0.2 % 1.3 %<br />
Profit margin (after tax) 3.8 % 3.5 % 2.8 % 0.1 % 1.5 %<br />
RATE OF RETURN<br />
Return on equity 14.1 % 14.3 % 12.0 % -0.5 % 4.5 %<br />
Return on total capital 5.5 % 5.0 % 4.5 % -0.4 % 2.0 %<br />
SHARES<br />
Equity per share 26.59 21.39 17.36 15.07 15.64<br />
Earnings per share (NOK) 2.92 2.19 1.44 0.04 0.83<br />
Number of shares, end of year 22 493 20 116 16 315 14 845 14 845<br />
Average number of shares 20 832 18 460 15 029 14 845 13 625<br />
Nominal value, end of year 0.50 0.50 0.50 0.50 0.50<br />
DEFINITIONS<br />
Earnings per share: Profit after taxes divided on total number of shares at the end of the fiscal year.<br />
Profitability, equity: Profit before tax as a percentage of equity.<br />
Profitability, total capital: Operating profit as a percentage of total capital.
TURNOVER<br />
NOK million<br />
744<br />
622<br />
2002 2003 2004 2005 <strong>2006</strong><br />
EBITDA<br />
NOK million<br />
32<br />
14<br />
786<br />
42<br />
1150<br />
1604<br />
2002 2003 2004 2005 <strong>2006</strong><br />
ORDER BACKLOG<br />
NOK million<br />
418<br />
502<br />
922<br />
67<br />
1653<br />
99<br />
2019<br />
2002 2003 2004 2005 <strong>2006</strong><br />
TURNOVER <strong>2006</strong><br />
DM<br />
16 %<br />
PMH<br />
11 %<br />
MC<br />
28 %<br />
DCH<br />
45 %<br />
ORDER BACKLOG <strong>2006</strong><br />
DM<br />
23 %<br />
PMH<br />
7 %<br />
MC<br />
30 %<br />
DCH<br />
40 %<br />
TURNOVER 2005<br />
PMH<br />
DM 12 %<br />
4 %<br />
MC<br />
27 %<br />
DCH<br />
57 %<br />
ORDER BACKLOG 2005<br />
DM<br />
22 %<br />
MC<br />
24 %<br />
PMH<br />
4 %<br />
DCH<br />
50 %<br />
DRY CARGO HANDLING<br />
MNOK <strong>2006</strong> 2005<br />
Turnover 728.2 649.2<br />
EBITDA 80.3 61.3<br />
Order backlog 809.0 825.0<br />
MARINE CRANES<br />
MNOK <strong>2006</strong> 2005<br />
Turnover 439.6 309.0<br />
EBITDA 13.5 0.2<br />
Order backlog 600.0 390.0<br />
DECK MACHINERY*<br />
MNOK <strong>2006</strong> 2005<br />
Turnover 257.4 50.4<br />
EBITDA -4.6 2.5<br />
Order backlog 462.0 366.0<br />
*) With effect from 1 October 2005 <strong>TTS</strong> aquired Kocks GmbH<br />
with one subsidiary and one Joint Venture company.<br />
PORT AND MATERIAL HANDLING<br />
MNOK <strong>2006</strong> 2005<br />
Turnover 178.8 140.7<br />
EBITDA 12.6 7.0<br />
Order backlog 148.0 72.0<br />
5
6<br />
<strong>TTS</strong> – continuously<br />
generating profits<br />
by being the preferred<br />
global supplier for<br />
handling equipment<br />
to the maritime industry.
BUSINESS IDEA<br />
<strong>TTS</strong> is a global company that develops, markets, and supplies complete<br />
handling systems for the maritime industry that meets the markets<br />
requirements and expectations, in a way that the clients are able to<br />
increase their own productivity and profitability. <strong>TTS</strong>’ resources are<br />
focused on design and <strong>eng</strong>ineering in addition to assembly and testing.<br />
Other activities that belong under a turnkey delivery will in principle<br />
be purchased from subcontractors. After sales and service is a business<br />
area of priority.<br />
STRATEGY<br />
<strong>TTS</strong>’ strategy is to build trust amongst its customers whilst also being<br />
price and cost competitive. Trust is built through quality and expertise<br />
to end users, and flexibility and efficiency in deliveries to the shipyards.<br />
Appropriate and professional handling of guarantee matters is essential<br />
in the effort to become preferred supplier. <strong>TTS</strong> has a programme of<br />
specific measures to implement this strategy.<br />
”FIRST AND LAST CALL”<br />
Another way of expressing our vision is that <strong>TTS</strong> wants to be the supplier<br />
which receives “The first and the last call”. This means that <strong>TTS</strong> Marine<br />
<strong>ASA</strong> aims to be the company that the customer calls first when they<br />
are considering new solutions and new projects. <strong>TTS</strong> shall possess the<br />
expertise and capacity to advise customers during this phase. “The last<br />
call” we want from the shipyards at the end of their decision process,<br />
to get the chance to meet the lowest price. This means that <strong>TTS</strong> must<br />
have a globally competitive cost structure in order to compete with<br />
the lowest bidder.<br />
7
4-11 <strong>TTS</strong> GROUP 11-13 REPORT FROM THE CEO 14-27 BUSINESS AREAS 28-35 CORPORATE GOVERNANCE 36-87 DIRECTOR’S REPORT AND ACCOUNTS<br />
This is <strong>TTS</strong><br />
<strong>TTS</strong> is an international group which<br />
develops and supplies maritime<br />
handling equipment. The operations<br />
are divided into the divisions<br />
Marine Cranes, Dry Cargo Handling,<br />
Port and Material Handling, and<br />
Deck Machinery. <strong>TTS</strong> is the second<br />
largest supplier in the world within<br />
its market segments. <strong>TTS</strong> has a<br />
workforce of 650 employees with<br />
main emphasis on <strong>eng</strong>ineering<br />
expertise. The group has subsidiaries<br />
in Norway, Sweden, Finland,<br />
Germany, China, USA, Italy, Czech<br />
Republic, Korea and in Vietnam.<br />
<strong>TTS</strong> Marine <strong>ASA</strong> is headquartered<br />
in Bergen, Norway and listed on<br />
the Oslo Stock Exchange.<br />
8<br />
1966 <strong>TTS</strong> is established.<br />
1995 <strong>TTS</strong> is listed on Oslo Stock Exchange.<br />
1996 <strong>TTS</strong> acquires Mongstad Engineering AS,<br />
Bergen, Norway.<br />
1997 <strong>TTS</strong> acquires Norlift AS Bergen, Norway.<br />
2000 <strong>TTS</strong> acquires Aktro AS, Molde, Norway.<br />
2001 <strong>TTS</strong> establishes joint venture in Shanghai, China.<br />
2001 <strong>TTS</strong> sells <strong>TTS</strong> Construction AS.<br />
2001 <strong>TTS</strong> acquires Hamworthy KSE AB, Dry Cargo.<br />
2001 <strong>TTS</strong> acquires Hydralift Marine and sells <strong>TTS</strong> Aktro.<br />
2002 <strong>TTS</strong> establishes office in Pusan, Korea.<br />
2004 <strong>TTS</strong> acquires 100 % of joint venture in Shanghai, China.<br />
2004 <strong>TTS</strong> acquires LMG Cranes in Lübeck, Germany.<br />
2004 <strong>TTS</strong> acquires Liftec Oy in Tampere, Finland.<br />
2005 <strong>TTS</strong> establishes <strong>TTS</strong> Bohai Machinery in Dalian, China.<br />
2005 <strong>TTS</strong> etablishes <strong>TTS</strong> Inc. in Miami, USA.<br />
2005 <strong>TTS</strong> acquires NavCiv Engineering AB, Sweden.<br />
2005 <strong>TTS</strong> acquires Kocks GmbH in Bremen, Germany.<br />
<strong>2006</strong> <strong>TTS</strong> establishes <strong>TTS</strong> Marine s.r.l., Genoa, Italy.<br />
<strong>2006</strong> <strong>TTS</strong> establishes <strong>TTS</strong> Vietnam, Haiphong, Vietnam.<br />
2007 <strong>TTS</strong> acquires <strong>TTS</strong> Offshore Handling Equipment AS,<br />
Ålesund, Norway.<br />
MILL NOK<br />
2000<br />
1800<br />
1600<br />
1400<br />
1200<br />
1000<br />
800<br />
600<br />
400<br />
200<br />
0<br />
90 91 92 93 94 95 96 97 98 99 00 01 02 03 04<br />
05 06<br />
Port and Material Handling Equipment Marine Equipment
Dry Cargo Handling<br />
RoRo equipment<br />
Hatch covers<br />
Side-loading systems<br />
Cruise and yacht equipment<br />
Companies in the <strong>TTS</strong> <strong>Group</strong><br />
Sales and service network<br />
Port and Material Handling<br />
Shipyard equipment<br />
Heavy load handling<br />
Port and terminal equipment<br />
<strong>TTS</strong> Marine <strong>ASA</strong><br />
Marine Cranes<br />
Hose handling cranes<br />
Cargo cranes<br />
Davits<br />
Offshore cranes<br />
Offshore handling equipment<br />
Deck Machinery<br />
Anchor- and mooring<br />
winches<br />
9
Key events <strong>2006</strong><br />
<strong>TTS</strong> once again reported record high turnover<br />
and results in <strong>2006</strong>, with a turnover of NOK 1 604<br />
million and earnings before depreciation (EBITDA)<br />
of NOK 98.8 million.<br />
At the end of the year, <strong>TTS</strong> had an order backlog<br />
of NOK 2 019 million, the highest level ever<br />
recorded in the history of the company. The rate<br />
of contracts remains excellent within all areas<br />
of operation.<br />
In <strong>2006</strong>, <strong>TTS</strong> achieved an improvement in results<br />
following the past years restructuring of crane<br />
activities. Next in line is an intense targeting<br />
of the market for cranes to offshore vessels.<br />
In <strong>2006</strong>, <strong>TTS</strong> experienced a record high demand<br />
for equipment for RoRo vessels, particularly for<br />
car carriers. In total, <strong>TTS</strong> entered into agreements<br />
for delivery of equipment for 14 car carriers.<br />
In <strong>2006</strong>, <strong>TTS</strong> established itself in Genoa in Italy,<br />
where it focuses on delivery of equipment to<br />
mega yachts; a market in rapid growth both in<br />
Germany and Italy.<br />
10<br />
In <strong>2006</strong>, <strong>TTS</strong> opened a sales and representative<br />
office in Haiphong in Vietnam. Several substantial<br />
contracts have been entered into for delivery of<br />
equipment to the government-owned shipbuilding<br />
group Vinashin.<br />
<strong>TTS</strong> entered into an agreement in <strong>2006</strong> to include<br />
deck machinery as part of the product portfolio<br />
of <strong>TTS</strong> Bohai Machinery in China. Plans are being<br />
made for a new operation in Dalian, to handle<br />
assembly and testing of these products.<br />
In <strong>2006</strong>, <strong>TTS</strong> experienced a breakthrough in the<br />
market for container terminals. The company<br />
will focus on further product development in<br />
this segment.<br />
<strong>TTS</strong>’ share price increased by 133 percent in <strong>2006</strong>,<br />
and the Board proposes a payment of dividend of<br />
NOK 1 per share.
4-11 <strong>TTS</strong> GROUP 11-13 REPORT FROM THE CEO 14-27 BUSINESS AREAS 28-35 CORPORATE GOVERNANCE 36-87 DIRECTOR’S REPORT AND ACCOUNTS<br />
Growth - and further progress<br />
PRESIDENT & CEO<br />
THE PAST THREE YEARS have been a tremendous<br />
success for <strong>TTS</strong>. Last year, <strong>TTS</strong> reported<br />
a turnover of almost NOK 1 billion more than<br />
in 2003, and operating profit before depreciation was<br />
NOK 85 million greater than three years before. In the<br />
period from 2003 till the end of <strong>2006</strong>, the company’s<br />
share price went up from NOK 9.71 to NOK 72.75.<br />
The primary cause of this positive development is<br />
that the market for our products has continued to grow<br />
steadily over the period of these years. Globalisation<br />
has lead to an increased trading between countries<br />
and continents, and with that comes the need for<br />
more transport. Shipbuilders across the globe are<br />
enjoying prosperous times, resulting in a demand for<br />
all types of ships equipment, and <strong>TTS</strong>’ order book<br />
has become four times as thick as it was at the end<br />
of 2003.<br />
The <strong>TTS</strong> <strong>Group</strong> is in a favourable position. At the<br />
same time it is important to emphasise that nothing<br />
comes without effort. In 1999, the Board of <strong>TTS</strong><br />
proposed a growth strategy based on expansion<br />
within existing business segments and acquisition of<br />
companies in associated areas. This has required<br />
an enormous amount of hard work throughout the<br />
entire organisation. During this process, we have had<br />
to carry out difficult readjustments. The company<br />
would therefore like to take the opportunity to thank<br />
each and every one of its employees for their loyalty<br />
and effort in helping us achieve our ambitious goals.<br />
Together, we have built up <strong>TTS</strong> to become a strong<br />
and visible brand within our market segments; visible<br />
in the sense that in most cases where the market<br />
requires systems and products within our product<br />
portfolio, we will be on the maker’s list. We would<br />
therefore also like to thank our customers across<br />
the globe for showing confidence and trust in our<br />
company. Last, but not least, we would like to thank<br />
our owners, who have great belief in the company<br />
and who have given us the opportunity to develop<br />
operations and intensively target new areas. As a<br />
result of <strong>TTS</strong>’ economy having become this robust, the<br />
board has recommended dividend to be paid to <strong>TTS</strong>’<br />
shareholders for the first time in the history of the<br />
company.<br />
We feel quite certain that the good development<br />
will continue. We have orders and capacity to increase<br />
our total turnover this year by 20-25 percent, while<br />
our order books are already filling up for 2008 and<br />
beyond. Activities within all our established areas of<br />
operation will remain at a relatively high level, which<br />
is further confirmed by an extremely satisfying rate of<br />
order intake so far in 2007. The forecast for contracting<br />
of new vessels indicates a positive market as far ahead<br />
as 2015, and as a result of the strong increase in new<br />
sales, the requirements for after-sales and service will<br />
be considerable for years to come.<br />
<strong>TTS</strong> is today an global corporation developing and<br />
delivering maritime equipment. Our four divisions;<br />
Dry Cargo Handling, Marine Cranes, Port and Material<br />
Handling and Deck Machinery, each have their own<br />
11
Our aim is to establish <strong>TTS</strong> in<br />
the market for handling equipment<br />
for fixed and floating offshore<br />
installations.<br />
JOHANNES D. NETELAND, PRESIDENT & CEO<br />
12
4-11 <strong>TTS</strong> GROUP 11-13 REPORT FROM THE CEO 14-27 BUSINESS AREAS 28-35 CORPORATE GOVERNANCE 36-87 DIRECTOR’S REPORT AND ACCOUNTS<br />
product portfolio, but over the past few years, we have<br />
primarily focused on two areas of interest; namely<br />
equipment for marine cargo handling on board ships<br />
and onshore cargo handling, mainly for port terminals<br />
and for shipbuilding. In the ships equipment market,<br />
<strong>TTS</strong> has built up a solid marked position over a number<br />
of years. With regard to port terminal equipment,<br />
we are still at an early stage, however, last year’s<br />
breakthrough in the market for container terminal<br />
systems indicate that our products and expertise are<br />
sought after in this area too.<br />
We are currently taking steps to adding a third<br />
pillar which will become important to <strong>TTS</strong> in the future.<br />
Before 2001 <strong>TTS</strong> was a participant in the offshore<br />
cranes market. In connection with a very important<br />
acquisition which was a crucial move in obtaining the<br />
leading position that we currently hold within the<br />
market for delivery of equipment to RoRo ships, we<br />
agreed to a five-year quarantine period from the<br />
offshore market for <strong>TTS</strong>. Now we are back, and aim<br />
to build up a position, step by step, to supply cranes<br />
and other lifting equipment to the offshoremarket.<br />
We think we have the necessary knowledge and<br />
capacity to develop this activity within our Norwegian<br />
organization, providing we succeed in completing<br />
the process of transferring expertise and other<br />
responsi bilities in the crane sector to our operations<br />
in China. We must make use of available <strong>eng</strong>ineering<br />
resources to our best advantage.<br />
<strong>TTS</strong> acquired ICD Projects AS in 2007, a company<br />
that is providing access to technology crucial to our<br />
targeting of the offshore market. Hence, <strong>TTS</strong> is once<br />
again able to provide all types of cranes for installation<br />
on offshore vessels. Furthermore, we are introducing<br />
equipment for subsea handling operations at great<br />
ocean depths, thereby making offshore handling<br />
equipment a new business segment. Our aim is to<br />
establish <strong>TTS</strong> in the market for handling equipment<br />
for fixed and floating offshore installations, as the<br />
potential of this market is enormous.<br />
We look upon the shareholders’ expectations and<br />
the financial market’s scrutiny as positive and construc-<br />
tive. Assessment of the company’s ability to create<br />
value is closely related to our ability to str<strong>eng</strong>then<br />
operations in established areas, and to develop new<br />
activities in sectors where we have special qualifications.<br />
We will continue to grow, and it is a great pleasure to<br />
note that our offshore products already have received<br />
such positive feedback. We have the str<strong>eng</strong>th, maturity<br />
and not least the courage that takes us to the next<br />
step, so stay with us!<br />
Johannes D. Neteland<br />
PRESIDENT & CEO<br />
13
4-10 <strong>TTS</strong> GROUP 11-13 REPORT FROM THE CEO 14-27 BUSINESS AREAS 28-37 CORPORATE GOVERNANCE 36-87 DIRECTOR’S REPORT AND ACCOUNTS<br />
Dry Cargo Handling Division<br />
The very positive development in turnover and results for the Dry Cargo Handling Division<br />
continued in <strong>2006</strong>. The market outlook remains extraordinary.<br />
D<br />
RY CARGO HANDLING DIVISION is the largest and<br />
most profitable division of <strong>TTS</strong>. In <strong>2006</strong>, the company<br />
confirmed its position as a leading supplier of marine cargo access<br />
systems, largely as a result of great success in the new shipbuilding<br />
markets in Asia. Deliveries include RoRo equipment, hatch<br />
covers, side-loading systems and special equipment for cruise ships,<br />
pass<strong>eng</strong>er ships and mega yachts.<br />
The division is managed from Gothenburg in Sweden and has<br />
operations in China, Germany, Norway, Italy, USA and Vietnam.<br />
In May <strong>2006</strong>, <strong>TTS</strong> established itself in Genoa in Italy, with a focus<br />
on deliveries of equipment to mega yachts, a market in strong<br />
growth, both in Italy and in Germany. In November of <strong>2006</strong>, <strong>TTS</strong><br />
opened a sales and representative office in Haiphong, Vietnam,<br />
and the company has already entered into several major contracts<br />
regarding delivery of ships equipment to the state-owned shipbuilding<br />
group Vinashin. The division also participates in the<br />
expanding Chinese market with 50 percent ownership in a joint<br />
venture company in Shanghai, China. The development in turnover<br />
and results for <strong>2006</strong> for this company was excellent. In addition<br />
to the production and sales units, <strong>TTS</strong> has a global network of<br />
sales agents and service stations.<br />
In <strong>2006</strong>, Stellan Bernsro took over as Divisional Director of<br />
the Dry Cargo Handling Division, while maintaining his position<br />
as Managing Director of <strong>TTS</strong> Ships Equipment AB. Bernsro has<br />
experience as a naval officer and holds a degree in industrial<br />
<strong>eng</strong>ineering and management. He has many years of experience<br />
related to <strong>eng</strong>ineering and sale of the division’s products and systems.<br />
– <strong>TTS</strong> is a preferred business partner due to the company’s<br />
high level of expertise and ability to deliver. We have also demonstrated<br />
an innovative ability in line with the development of new<br />
technology and in the face of changing market requirements. The<br />
Dry Cargo Handling Division is increasingly being asked to provide<br />
complete equipment and system deliveries to shipyards. In order<br />
to increase volume, our principal chall<strong>eng</strong>e over the next few<br />
years is to find business partners with the size and capacity to<br />
deliver equipment previously attended to by the shipyards themselves,<br />
says Bernsro<br />
Operations<br />
The Dry Cargo Handling Division focuses mainly on design and<br />
<strong>eng</strong>ineering, while all manufacturing of equipment is outsourced<br />
to subcontractors. Our products includes bow and stern equipment,<br />
internal doors and ramps, car decks, hatch covers, side<br />
loading systems and equipment for the offshore industry.<br />
In the past few years, the division has had an increasing share<br />
14<br />
of deliveries of equipment to car carriers, so-called Pure Car<br />
Truck Carrier (PCTC). These are purpose built vessels, designed<br />
for the transportation of large number of cars within, as well as<br />
between, continents. <strong>TTS</strong> is the leading company in this niche of<br />
the RoRo market. Corresponding equipment is supplied for other<br />
types of RoRo and RoPax ships.<br />
The Dry Cargo Handling Division also has substantial deliveries<br />
of hatch covers to container vessels, general cargo carriers and bulk<br />
carriers, as well as equipment for cruise ships. Another speciality<br />
is side-loading systems for various ship types, as well as solutions<br />
for baggage and waste management on cruise ships. Furthermore,<br />
<strong>TTS</strong> has established a solid position in the market for special<br />
equipment to offshore vessels.<br />
The joint venture company, <strong>TTS</strong> Hua Hai Ships Equipment Co.<br />
Ltd. in Shanghai in China, designs and manufactures hatch covers<br />
and some RoRo equipment for Chinese shipyards.<br />
Market outlook<br />
At the start of 2007, the Dry Cargo Handling Division had a total<br />
order backlog of NOK 1 316 million, including the order backlog<br />
of the joint venture company <strong>TTS</strong> Hua Hai Ships Equipment. This<br />
is an increase of NOK 71 million compared to the previous year.<br />
The division takes part in bids for all major contracts for RoRo<br />
equipment, hatch covers and other special equipment related to<br />
cargo handling in the world’s leading shipyards. In <strong>2006</strong>, <strong>TTS</strong> once<br />
more entered into agreements regarding deliveries to shipyards<br />
in Japan, a market which traditionally has been difficult to enter.<br />
Other new and important markets are India and Vietnam.<br />
The market for RoRo equipment is, to a large extent driven<br />
by the increase in the manufacturing of private cars and other<br />
activities relying on RoRo vessels for transport. The demand for<br />
RoRo vessels, in particular car carriers, is continously high. The<br />
same applies to cruise ships and mega yachts.<br />
Overall, the demand for cargo access equipment, which constitutes<br />
part of the Dry Cargo Handling Division’s product portfolio,<br />
is expected to remain high in 2007. Prospects for the coming<br />
years are extremely promising.<br />
Strategy<br />
The Dry Cargo Handling Division will continue to focus on developing<br />
the markets in Europe, Asia and USA. The division will<br />
focus on developing new products and solutions to provide more<br />
efficient cargo handling. In this context, <strong>TTS</strong> will put emphasis on<br />
the development of equipment using technologies that maintain<br />
environmental considerations in a satisfactory manner.
- <strong>TTS</strong> is a preferred business partner<br />
due to the company’s high level<br />
of expertise and ability to deliver.<br />
STELLAN BERNSRO, DIRECTOR, DRY CARGO HANDLING DIVISION<br />
15
4-10 <strong>TTS</strong> GROUP 11-13 REPORT FROM THE CEO 14-27 BUSINESS AREAS 28-37 CORPORATE GOVERNANCE 36-87 DIRECTOR’S REPORT AND ACCOUNTS<br />
Marine Cranes Division<br />
In <strong>2006</strong>, the Marine Cranes Division showed considerable progress with regard to both turnover and<br />
results. The growth in the market for marine cranes continues in 2007, and the division has made<br />
a very promising comeback into the offshore market.<br />
T<br />
TS DEVELOPS and delivers marine cranes, and is the world’s<br />
leading supplier of hose handling cranes. <strong>TTS</strong> is a major supplier<br />
of provision cranes, as well as cargo cranes, and resumed marketing<br />
of cranes to the offshore market in 2007. The Marine Cranes Division<br />
is managed from Bergen in Norway, with operations in Norway<br />
(Bergen and Kristiansand), Germany and China. Furthermore, the<br />
division has a sales and service office in Korea. In China, <strong>TTS</strong> is<br />
part of a joint venture, with an ownership interest of 50 percent.<br />
Ivar K. Hanson was appointed Divisional Director in 2004. He<br />
holds a Master of Science degree in business as well as a diploma<br />
in mechanical <strong>eng</strong>ineering, and has worked for <strong>TTS</strong> for a total of<br />
twelve years.<br />
During 2004 and 2005, the Marine Cranes Division carried out<br />
an extensive organisational restructuring of the two branch offices<br />
in Norway. During the same period, the crane division of LMG in<br />
Germany was incorporated into the division, and build-up of the<br />
operations in China was prepared. In <strong>2006</strong>, we saw results from<br />
our efforts, by way of a strong growth in turnover and a distinct<br />
improvement in profitability, says Ivar K. Hanson. He further states<br />
that the division has carried out a recent restructuring of resources<br />
related to the split between the crane activities and service and<br />
after-sales activities, and that it has achieved excellent results in<br />
this area. Hanson points out that the division, despite its progress,<br />
has had problems completing certain projects, owing to delays<br />
in the delivery of steel from its business partners. – We also face<br />
a considerable chall<strong>eng</strong>e, in Norway as well as in Germany, in<br />
recruiting new employees with sufficient expertise.<br />
Operations<br />
The Marine Cranes Division’s product portfolio consists for the<br />
most part of deck cranes, ranging from small service cranes to<br />
large cargo cranes, as well as davits. As of 2007, <strong>TTS</strong> also delivers<br />
purpose-built cranes to offshore vessels.<br />
The division is organised with product development and sales<br />
of cylinder cranes taking place primarily out of Bergen, while product<br />
development and sales of wire cranes take place in Lübeck,<br />
Germany. After-sales, service and industrial products are handled<br />
by the office in Kristiansand. In 2007, <strong>TTS</strong> took over ICD Projects<br />
AS in Ålesund in Norway, a company that develops control systems<br />
and software for lifting equipment to offshore vessels subsea<br />
handling operations at great ocean depths.<br />
The 100 percent owned company in Shanghai carries out<br />
<strong>eng</strong>ineering, project management, assembly and follow-up of<br />
deliveries to ship-owners and shipyards in Asian markets outside<br />
of China. Here, we have achieved a successful build-up of<br />
16<br />
expertise in <strong>eng</strong>ineering, as well as within management and implementation<br />
of projects. A joint purchasing office for the entire <strong>TTS</strong><br />
<strong>Group</strong> is under establishment in Shanghai.<br />
Targeting of the offshore market by the Norwegian branch offices<br />
entails that delivery of standard marine cranes, to an increasing<br />
degree, will be handled by the subsidiary company as well as the<br />
joint venture company in China.<br />
<strong>TTS</strong>’ production of steel and equipment for cranes is based on<br />
subcontractors in low-cost countries. Deliveries in Europe are<br />
assembled and tested in Bergen and Lübeck. Deliveries in China<br />
are assembled and tested by our joint venture company, <strong>TTS</strong> Bohai<br />
Machinery Co. Ltd., and deliveries to the Korean market are<br />
handled by our Korean partners.<br />
Market outlook<br />
At the start of 2007, the Marine Cranes Division’s order backlog<br />
had reached NOK 600 million, including the order backlog of the<br />
joint venture company <strong>TTS</strong> Bohai Machinery. This is an increase of<br />
NOK 210 million, or 54 percent, compared to the previous year.<br />
The cranes market is driven by the activity level of new buildings<br />
and ship upgrading. In the Asian markets, the level of activity has<br />
been on the increase for several years, and is expected to remain high.<br />
The activity level in European shipyards is also rapidly increasing.<br />
The contracting of new tankers has shown a positive development.<br />
In the market for medium-sized and large hose handling cranes, in<br />
which <strong>TTS</strong> holds a dominant position, the order intake in <strong>2006</strong> was<br />
excellent. Efforts to str<strong>eng</strong>then the company’s position in market<br />
segments such as cargo cranes, container cranes and davits, have<br />
also yielded results. Furthermore, the Marine Cranes Division<br />
strives to develop products and solutions for the offshore market.<br />
The overall optimistic market trend has continued in 2007,<br />
and <strong>TTS</strong> has received very positive feedback on their products for<br />
the offshore market.<br />
Strategy<br />
<strong>TTS</strong> will further str<strong>eng</strong>then its efforts in the global markets for<br />
cranes for ships and offshore vessels. Operations in China will be<br />
further developed, among other factors to provide <strong>eng</strong>ineering<br />
capacity in Norway for activities in the offshore market. Special<br />
efforts will be made to maintain a solid position in the cranes<br />
market in Korea. Through the newly acquired company in Ålesund<br />
in Norway, the Marine Cranes Division will focus on development<br />
and delivery of other advanced lifting equipment for offshore<br />
vessels. Finally, the division will further extend its efforts in the<br />
after-sales market.
- <strong>TTS</strong> will further str<strong>eng</strong>then its efforts<br />
in the global markets for cranes for ships and<br />
offshore vessels and for handling equipment<br />
to offshore- and subsea markets.<br />
IVAR K. HANSON, DIRECTOR, MARINE CRANES DIVISION<br />
17
4-10 <strong>TTS</strong> GROUP 11-13 REPORT FROM THE CEO 14-27 BUSINESS AREAS 28-37 CORPORATE GOVERNANCE 36-87 DIRECTOR’S REPORT AND ACCOUNTS<br />
Port and Material Handling Division<br />
<strong>TTS</strong>’ Port and Handling Division supplies shipyard systems and systems for handling containers in ports.<br />
In <strong>2006</strong>, the division experienced a breakthrough in the market for container terminal systems, and<br />
showed excellent progress in its other areas of operation.<br />
I<br />
N 2005, <strong>TTS</strong> CONSOLIDATED its activities relating to shipyard<br />
systems and systems for handling containers in ports to form<br />
the Port and Material Handling Division. This business segment<br />
is in vigorous growth, and is less sensitive to market fluctuations<br />
than other parts of <strong>TTS</strong>’ operations. The Port and Material<br />
Handling Division is managed from Gothenburg in Sweden, and<br />
has operations in Finland and Norway.<br />
Göran Johansson is Divisional Director. He was formerly<br />
Director of the Dry Cargo Handling Division as well as Managing<br />
Director of <strong>TTS</strong> Ships Equipment AB. Johansson is a naval architect<br />
and <strong>eng</strong>ineer, and was head of Hamworthy KSE AB, Dry Cargo<br />
Handling Division, from 1995 up until its incorporation into the<br />
<strong>TTS</strong> <strong>Group</strong>.<br />
– <strong>TTS</strong> has extensive experience as supplier of production lines<br />
to shipyards and various systems for material handling related to<br />
industrial production. Activities within this area saw a dramatic<br />
upswing in <strong>2006</strong>. In the market for material handling in ports, we<br />
landed our first contract for our cassette system for containers<br />
last year, and the system is put into operation in an American port<br />
this year. With the growth expected in cargo volume in container<br />
terminals in Europe, USA and Asia, we are confident that more<br />
companies will choose our solutions and products. The advantage<br />
of these solutions and products, is that they provide increased<br />
utilisation of capacity in available areas in place of costly development<br />
of new port facilities, says Göran Johansson.<br />
Operations<br />
The product portfolio for cargo handling in ports include linkspan,<br />
which act as a bridge between port and ship, automatic mooring<br />
devices and systems for the handling of containers and loading<br />
cassettes with advanced hydraulics and electric control components.<br />
The cassettes have been developed to handle special transport<br />
requirements for industries such as the steel and paper industry.<br />
As regards systems for cassette handling in container terminals,<br />
<strong>TTS</strong> has recently taken on staff with top competence in this area,<br />
to attend to further product development.<br />
Furthermore, the division supplies heavy load handling systems<br />
and various solutions for material handling focusing on efficient<br />
handling and good logistics. Deliveries are primarily aimed at the<br />
18<br />
shipbuilding industry and heavy industry. Systems for material<br />
handing related to industrial production mainly pertain to steelworks<br />
and aluminium works, while systems for heavy loads are primarily<br />
aimed at the shipbuilding industry.<br />
Market outlook<br />
At the end of <strong>2006</strong>, the Port and Material Handling Division had<br />
an order backlog of NOK 148 million, compared to NOK 72<br />
million the year before. Moreover, the division has so far in 2007<br />
been awarded several major contracts.<br />
Accordingly, the market outlook for the division’s products is<br />
excellent.<br />
Competition in the market for linkspan solutions to RoRo<br />
ports is generally strong, but the market potential for <strong>TTS</strong> is<br />
nonetheless considered to be substantial. Prospects for deliveries<br />
of the division’s systems for fully automated container handling<br />
and mooring solutions are promising, with several projects in the<br />
pipeline.<br />
With regard to the systems for heavy lift and material handling,<br />
the market outlook for both 2007 and coming years is considered<br />
to be very good.<br />
Strategy<br />
In 2007, the Port and Material Handling Division will focus on<br />
further developing cooperation between the units in Norway,<br />
Sweden and Finland with regard to both product development as<br />
well as marketing efforts.<br />
The division will focus on the marketing of linkspan to RoRo<br />
ports, in particular in the Baltic countries. With regard to the<br />
system for cassette handling, <strong>TTS</strong> will, in addition to the continued<br />
development of the ports market, further attempt to build up new<br />
markets for this solution, primarily within the heavy industry. In<br />
the marketing of systems for material handling in shipyards, efforts<br />
will mainly be concentrated on China and India.
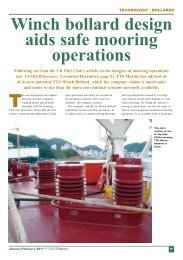
– We landed our first contract for our<br />
cassette system for containers last year.<br />
GÖRAN JOHANSSON, DIRECTOR, PORT AND MATERIAL HANDLING DIVISION<br />
19
4-10 <strong>TTS</strong> GROUP 11-13 REPORT FROM THE CEO 14-27 BUSINESS AREAS 28-37 CORPORATE GOVERNANCE 36-87 DIRECTOR’S REPORT AND ACCOUNTS<br />
Deck Machinery Division<br />
In the Deck Machinery Division, the first half of the calendar year as part of the <strong>TTS</strong> <strong>Group</strong> was spent<br />
undergoing internal restructuring, as well as successfully approaching new markets.<br />
D<br />
URING AUTUMN 2005,following the acquisition of<br />
Kocks GmbH, <strong>TTS</strong> established the Deck Machinery Division.<br />
On the basis of the expertise represented by Kocks, it is <strong>TTS</strong>’<br />
strategy to integrate Deck Machinery in the group’s range of<br />
products, and to market these globally. Upon acquisition of Kocks<br />
GmbH, the company had an unprofitable order backlog, and<br />
results for <strong>2006</strong> were negative. The target for this year is for<br />
operations to yield positive results.<br />
The Deck Machinery Division is managed from Bremen in<br />
Germany, and also has activities in the Czech Republic. In South<br />
Korea, <strong>TTS</strong> has held a 50 percent ownership interest in a joint<br />
venture company producing and delivering to the Korean and<br />
Japanese market, as well as providing after sales and service to<br />
mentioned markets. In March 2007, <strong>TTS</strong> attained sole ownership<br />
of the Korean company.<br />
Edgar Bethmann as Divisional Director and Managing Director<br />
of <strong>TTS</strong> Kocks GmbH holds an <strong>eng</strong>ineering degree in machine<br />
construction, and was Managing Director of <strong>TTS</strong> Ships Equipment<br />
GmbH prior to being appointed head of the Deck Machinery<br />
Division.<br />
Activities<br />
The Deck Machinery Division delivers deck machinery to the<br />
maritime industry; primarily various types of winches for tank<br />
ships, container ships and other freighters. <strong>TTS</strong> holds a particularly<br />
good position in the market supplying winches to LNG-ships.<br />
The division has had a great number of deliveries to the Korean<br />
shipbuilding market, and in <strong>2006</strong> it succeeded in procuring contracts<br />
in China, Taiwan, Vietnam and the USA, as well as increasing<br />
the number of deliveries to shipyards in Japan. Furthermore, with<br />
the Chinese market in mind, the division has developed a new<br />
series of smaller electrical winches in addition to a special purpose<br />
winch for container ships.<br />
– With regard to the future, it was imperative that we, in <strong>2006</strong>,<br />
entered into the first contracts with Chinese shipyards through<br />
our joint venture company <strong>TTS</strong> Bohai in Dalian. It is crucial that<br />
the Deck Machinery Division partake in the tremendous development<br />
in the shipbuilding industry in China, emphasises Edgar<br />
Bethmann.<br />
As a result of the breakthrough in the collaboration with <strong>TTS</strong><br />
Bohai, the Deck Machinery Division has entered into an agreement<br />
with the company incorporating deck machinery into <strong>TTS</strong> Bohai’s<br />
20<br />
range of products. <strong>TTS</strong> Bohai will therefore establish a new facility<br />
in Dalian for assembly and testing of winches which is expected to<br />
be ready by the end of this year.<br />
In Bremen activities in the Deck Machinery Division were<br />
co-localised with <strong>TTS</strong> Ships Equipment GmbH in <strong>2006</strong>. The aim is<br />
to str<strong>eng</strong>then cooperation of sales and service. Further both in<br />
Germany and the Czech Republic organisational changes were<br />
implemented in <strong>2006</strong> to achieve a more efficient operation.<br />
Market outlook<br />
The Deck Machinery Division had an order backlog of NOK 462<br />
million at the start of 2007, compared to NOK 366 million twelve<br />
months previously.<br />
The market outlook for our product series of electric and hydraulic<br />
winches is generally good. Growth is expected in the LNG<br />
market in particular, owing to the increasing demand for transport<br />
of liquid gas on ships.<br />
Thanks to the <strong>TTS</strong> <strong>Group</strong> strong position in the main shipbuilding<br />
markets the Deck Machinery Division will be able to enter new<br />
markets and increase existing ones. Overall the order intake<br />
prospects for 2007 are promissing, in particular for the second<br />
half of the year.<br />
Strategy<br />
During 2007, the Deck Machinery Division will focus on measures<br />
to improve operations and profitability in South Korea as well as<br />
to intensify efforts in China. The advantages of large-scale operations<br />
owing to its association to <strong>TTS</strong> will be utilised in other<br />
markets too. The Deck Machinery Division will be increasing its<br />
manning as well as str<strong>eng</strong>thening its expertise in the after-sales<br />
and service business.
– It is crucial that<br />
the Deck Machinery<br />
Division partake in<br />
the tremendous<br />
development in the<br />
shipbuilding industry<br />
in China.<br />
EDGAR BETHMANN, DIRECTOR,<br />
DECK MACHINERY DIVISION<br />
21
4-10 <strong>TTS</strong> GROUP 11-13 REPORT FROM THE CEO 14-27 BUSINESS AREAS 28-37 CORPORATE GOVERNANCE 36-87 DIRECTOR’S REPORT AND ACCOUNTS<br />
<strong>TTS</strong> expects growth in Vietnam<br />
In the space of only a few months, <strong>TTS</strong> has landed contracts in Vietnam for three of the group’s four<br />
divisions. - We believe the Vietnamese shipbuilding market will develop significantly over the coming years,<br />
which is why we have opened a sales and representative office in Haiphong, says Johannes D. Neteland,<br />
President and CEO.<br />
T<br />
HE SHIPBUILDING INDUSTRY in Vietnam is in rapid<br />
growth. The major cause behind the ship-owners enthusiasm<br />
for Vietnam is that shipyards in Korea, China and Japan have<br />
full order books for years ahead. Moreover, the cost level is<br />
consider ably lower than in other ship building nations in Asia. The<br />
Vietnamese government aims to make their country the fourth<br />
largest producer of ships by 2015, and will compete against the<br />
established maritime nations. Several shipyards are under construction<br />
in Vietnam. The government-owned company Vinashin<br />
owns most of these. This company has grown by 35-45 percent<br />
annually over the past decade.<br />
Office with five employees<br />
The sales and representative office in the port of Haiphong in the<br />
north of Vietnam opened 7 November <strong>2006</strong>, with Tran Duc Hieu<br />
as General Manager. He trained as a naval officer. The office will<br />
be built up with a staff of five to seven employees. Administratively,<br />
the office falls under the Dry Cargo Handling Division, but the<br />
employees will be responsible for marketing all relevant products,<br />
as well as following up production at the shipyards.<br />
– We have signed contracts with Vinashin, worth a total of<br />
NOK 250 million. These include deliveries of hatch covers, cranes<br />
and deck machinery for in all 15 vessels to be delivered from the<br />
Vietnamese shipyards over the next few years, reports Neteland.<br />
The newest contract, entered into in February this year regards<br />
key components for RoRo systems for eight car carriers, including<br />
internal car decks and ramps, as well as stern ramps.<br />
Market of many opportunities<br />
Neteland says that the establishment in Vietnam emphasises the<br />
<strong>TTS</strong> <strong>Group</strong>’s global ambitions. – Activity in the international shipbuilding<br />
market will remain at a very high level for many more<br />
years and, for this reason, <strong>TTS</strong> must be present in all important<br />
markets with a view to securing our share of this growth. Furthermore,<br />
we also view Vietnam as an interesting market with regard<br />
to delivery of offshore cranes and other handling equipment to<br />
fixed and floating offshore installations.<br />
The economic development in Vietnam is strong. After the<br />
war in the country ended in 1975, Norway has contributed with<br />
development aid to sectors in which we are highly qualified. In<br />
2007, Norad and Innovation Norway initiated a three-year program<br />
to increase Norwegian investments in Vietnam and str<strong>eng</strong>then<br />
trade between the two countries. The program prioritises the<br />
maritime sector.<br />
22
4-10 <strong>TTS</strong> GROUP 11-13 REPORT FROM THE CEO 14-27 BUSINESS AREAS 28-37 CORPORATE GOVERNANCE 36-87 DIRECTOR’S REPORT AND ACCOUNTS<br />
Crane division prepared for new chall<strong>eng</strong>es<br />
Over the past three years, <strong>TTS</strong> has undergone a radical restructuring of its operations in the market for<br />
marine cranes, primarily through the transfer of operations from Norway to China. This adjustment<br />
has been essential to enable <strong>TTS</strong> to once again aggressively target the offshore cranes market.<br />
I<br />
N GENERAL, the build-up of operations with <strong>eng</strong>ineering and<br />
production in China has contributed to str<strong>eng</strong>thening the foundation<br />
for our crane activity in Europe, in particular in Norway, says<br />
Ivar K. Hanson, Divisional Director of the Marine Cranes Division.<br />
He says that during the course of 2004 and 2005, manning of<br />
the division’s two branch offices in Norway was reduced by 10<br />
persons. – In order to be competitive in an international market,<br />
we have built up a substantial operation in China over the past few<br />
years. This has been a prerequisite for regaining profitability, he<br />
emphasises. However, as a result of increased demand for new<br />
cranes and services, manning in Norway was increased by 35 new<br />
employees during <strong>2006</strong>.<br />
Freeing up capacity for offshore targeting<br />
– Targeting of the offshore market entails a further increase in<br />
manning, and in today’s labour market this is easier said than done.<br />
However, since we have established ourselves in China, we are able<br />
to free up capacity in Bergen and Kristiansand for offshore assignments<br />
by a further transfer of responsibilities to China. In 2004,<br />
<strong>TTS</strong> attained sole ownership of <strong>TTS</strong> Marine Shanghai Co. Ltd. Up<br />
until 2005, the company focused on sales, service and assembly of<br />
cranes for ships built in China. As a result of the establishment of<br />
the joint venture company <strong>TTS</strong> Bohai Machinery Co. Ltd. in Dalian,<br />
which <strong>TTS</strong> co-own with the government-owned shipbuilding group<br />
DSIC, <strong>TTS</strong>’ company in Shanghai has altered its focus to exporting<br />
from China to other shipbuilding markets in Asia.<br />
– This has entailed a major restructuring, including hiring of<br />
staff and training of <strong>eng</strong>ineers, purchaser and project managers,<br />
in order for the company to handle the entire value chain. This<br />
principle also applies to the joint venture company, Hanson points<br />
out.<br />
Strong growth in China<br />
In <strong>2006</strong>, <strong>TTS</strong> Marine Shanghai Co. Ltd. increased its number of<br />
employees from 39 to 46. The order backlog at the end of the<br />
year was NOK 36 million, compared to NOK 30 million twelve<br />
months previously. For <strong>TTS</strong> Bohai Machinery Co. Ltd., last year<br />
saw an increase of staff from 29 to 40 employees, and the order<br />
backlog for the same period increased from NOK 20 million to<br />
NOK 100 million.<br />
In total, the Marine Cranes Division reported a turnover in<br />
<strong>2006</strong> of NOK 440 million, an increase of 42 percent compared to<br />
the previous year. Operating profit before depreciation was NOK<br />
24<br />
13.5 million, compared to NOK 0.2 million in 2005. Turnover<br />
and profit for the joint venture company in China are not included<br />
in these figures.<br />
– Accordingly, we note that the total added value increased<br />
substantially, with the effect that we will have to str<strong>eng</strong>then the<br />
organisation and manning in both Europe and China. The reason<br />
for this build-up is not only the progress in the Asian market, but<br />
furthermore to enable us to target the growing offshore cranes<br />
market. We are preparing a further increase in manning in the<br />
Marine Crane Division in Norway during 2007, by about 10 to15<br />
new employees.<br />
On account of an agreement entered into in connection with<br />
the acquisition of Hamworthy KSE AB – Division Dry Cargo<br />
Handling in 2001, <strong>TTS</strong> has been unable to market offshore cranes<br />
prior to 11 January this year. Last year, <strong>TTS</strong> announced that it would<br />
yet again deliver offshore cranes, once the standstill period had<br />
come to an end. – There is a great demand for cranes for offshore<br />
vessels, and delivery date of some key components is currently<br />
as much as 24 months. We have, however, already secured the<br />
components needed to ensure that we are capable of delivery, says<br />
Hanson.<br />
Offshore cranes totalling NOK 500 million in 2012<br />
– Since 2002, we have focused exclusively on ships cranes. The<br />
technology for all types of cranes has developed, and we have<br />
maintained our expertise in the construction and production of<br />
offshore cranes. We are therefore very well equipped to meet the<br />
requirements for cranes demanded by offshore customers. Turnover<br />
in this area for 2007 will not be substantial, but as of next<br />
year the offshore cranes market will constitute a considerable part<br />
of our volume. Our aim is that in five years we will have a turnover<br />
in offshore cranes and other lifting equipment for offshore<br />
vessels of approximately NOK 500 million, states Ivar K. Hanson.<br />
During the period 11 January up until 1 March this year, <strong>TTS</strong><br />
entered into contracts worth almost NOK 200 million, for the<br />
delivery of cranes for offshore vessels.<br />
Expanding offshore range<br />
As part of its targeting of the offshore market, <strong>TTS</strong> acquired all<br />
of the shares in ICD Projects AS in Ålesund in Norway in January<br />
this year. The Ålesund-based company develops and delivers software<br />
and control systems for offshore handling equipment. This<br />
is primarily part of an extended effort to provide solutions to
the unique handling requirements within the subsea market, in<br />
particular for subsea handling operations at great ocean depths.<br />
This acquisition secures core technology, making <strong>TTS</strong> a onestop<br />
supplier of lifting equipment for ships built and equipped to<br />
operate in the offshore industry and, in particular, the subsea<br />
industry, says Hanson.<br />
ICD Projects AS was established in 2004 and has six employees.<br />
The company achieved a turnover in <strong>2006</strong> of NOK 8.2 million,<br />
with a pre-tax profit of NOK 1.9 million. The company has focused<br />
on the development of software with active heave compensation,<br />
for the operation of lifting equipment at ocean depths exceeding<br />
3 000 meters.<br />
– This solution is in demand in the offshore market, and fits like a<br />
glove with our other deliveries, Hanson points out. The company is<br />
preparing to recruit 10 to 15 <strong>eng</strong>ineers in 2007, some of which<br />
will be based in Ålesund and some in Bergen. – Delivery of lifting<br />
equipment for offshore vessels will become a new and significant<br />
business area for <strong>TTS</strong>.<br />
– Upon acquisition of ICD Projects in Ålesund, we will be<br />
represented in three of the most important maritime clusters<br />
in Norway. We view this as our str<strong>eng</strong>th, and we will increase<br />
manning in all of these three cities in 2007, says Ivar K. Hanson,<br />
Divisional Director.<br />
25
4-10 <strong>TTS</strong> GROUP 11-13 REPORT FROM THE CEO 14-27 BUSINESS AREAS 28-37 CORPORATE GOVERNANCE 36-87 DIRECTOR’S REPORT AND ACCOUNTS<br />
Continued strong market for ships equipment until 2015?<br />
The market outlook for <strong>TTS</strong>’ products and services related to marine cargo handling is considered to be<br />
excellent for many more years.<br />
T<br />
HE INTERNATIONAL ECONOMIC upswing, which<br />
started in 2003, has continued and intensified over the past<br />
three years. The increase in world trade, and in particular the<br />
tremendous growth in Chinese economy, has contributed to<br />
an increase in freight rates. It is a novel aspect in international<br />
economy that, for several years now, developing countries have<br />
had a stronger growth in economy than the industrialised countries.<br />
Developments in the emerging markets entail a higher degree<br />
consumption of energy and other commodities.<br />
Globalisation continues, and an increasing portion of the manufacturing<br />
of products takes place in developing countries. The trend<br />
of moving high-cost production to a country with lower costs has<br />
increased. A consequence of this is the increase in average transport<br />
distances for many products. As the bulk of international<br />
transport of primary products and manufactured goods is made<br />
by ship, this development entails increased demand for shipping<br />
services.<br />
The overall effect of these trends is a rapid growth over the past<br />
few years in the demand for almost every category of ship transport.<br />
Rates have increased despite the relatively strong growth in<br />
tonnage offered. Both bulk and tank tonnage, which constitute<br />
two of the largest freight segments, has increased tremendously.<br />
Furthermore, in other parts of the shipping industry, such as container<br />
cargo from Asia to Europe, the growth in volume has been<br />
substantial.<br />
Development and supply of equipment for cargo handling on<br />
ships is <strong>TTS</strong>’ core business, and over a number of years we have<br />
built up a solid market position. Demand for shipping services and<br />
contracting of new vessels is therefore of great consequence to<br />
the commercial development of the <strong>TTS</strong> <strong>Group</strong>.<br />
Chart 1 shows contracting of new vessels to the world fleet, as<br />
well as a forecast for contracting of vessels in the coming years,<br />
divided into the various types of vessels. The prognosis has been<br />
prepared by the Institute of Shipping Analysis in Gothenburg,<br />
Sweden.<br />
The prognosis indicates that, though we have experienced an<br />
exceptionally strong market for four years running, there is still<br />
an expectation of a relatively high level of contracting activity over<br />
a historic perspective up until 2015. This applies in particular to<br />
the categories significant to <strong>TTS</strong>; RoRo vessels, container ships<br />
and cruise ships. In total, the forecast estimates a contracting of<br />
26<br />
almost 1 500 new ships in 2008 and each of the following seven<br />
years.<br />
Chart 2 compares contracting, deliveries of new vessels and<br />
also scrapping of old vessels. The chart shows that with the high<br />
level of contracting seen in shipyards over the past four years,<br />
activities and deliveries from the shipyards will reach record high<br />
levels over the next 2-3 years. However, even in the period 2011<br />
till 2015, activity is expected to stabilise around 1 500 vessels per<br />
year.<br />
Orders for side-loading systems, RoRo equipment and hatch<br />
covers are generally made early on in the building process of a new<br />
ship, while contracts for cranes and deck machinery are usually<br />
entered into at a later stage. For <strong>TTS</strong> this means that contracts<br />
relating to the ships equipment market are distributed over a period<br />
of time, which is beneficial to the company with respect to capacity.<br />
During the past few years, <strong>TTS</strong> has built up considerable capacity<br />
and expertise with respect to after-sales and service. The high<br />
level of activity in the market for newbuildings in the coming years<br />
entails a prosperous after-sales market.
Number of vessels<br />
Million DWT<br />
2 500<br />
2 000<br />
1 500<br />
1 000<br />
500<br />
0<br />
140<br />
120<br />
100<br />
80<br />
60<br />
40<br />
20<br />
0<br />
CHART 1 World fleet outlook | NUMBER OF VESSELS BY CATEGORY<br />
Contracting 300 gt+, Jan 2007<br />
1992<br />
1993<br />
1994<br />
1995<br />
1996<br />
1997<br />
1998<br />
1999<br />
2000<br />
2001<br />
CHART 2 World fleet outlook | INCLUDING SCRAPPING<br />
300 gt+, Jan 2007<br />
2002<br />
2003<br />
2004<br />
2005<br />
<strong>2006</strong>*<br />
2007*<br />
2008*<br />
2009*<br />
2010*<br />
2011*<br />
2012*<br />
2013*<br />
2014*<br />
2015*<br />
1992<br />
1993<br />
1994<br />
1995<br />
1996<br />
1997<br />
1998<br />
1999<br />
2000<br />
2001<br />
2002<br />
2003<br />
2004<br />
2005<br />
<strong>2006</strong><br />
2007<br />
2008<br />
2009<br />
2010<br />
2011<br />
2012<br />
2013<br />
2014<br />
2015<br />
* = SAI Prognosis<br />
Historic data: LR Fairplay<br />
Pass<strong>eng</strong>er<br />
Dry Cargo<br />
RoRo<br />
Reefers<br />
Container<br />
Bulker incl comb<br />
Tanker<br />
Deliveries<br />
Del.forecast<br />
Scrapping<br />
Scrap.forecast<br />
Contracting<br />
Cont.forecast<br />
27
4-10 <strong>TTS</strong> GROUP 11-13 REPORT FROM THE CEO 14-27 BUSINESS AREAS 28-37 CORPORATE GOVERNANCE 36-87 DIRECTOR’S REPORT AND ACCOUNTS<br />
Shareholder information<br />
Share price performance<br />
In March 1995, <strong>TTS</strong> Marine <strong>ASA</strong> completed a public share issue, and<br />
3 May 1995, the company was listed on the SMB list of the Oslo Stock<br />
Exchange.<br />
Date Price<br />
Subscription price at time of offering NOK 23.00<br />
Opening price 03.05.95 NOK 26.50<br />
31.12.95 NOK 32.50<br />
31.12.96 NOK 41.00<br />
31.12.97 NOK 40.00<br />
31.12.98 NOK 15.00<br />
31.12.99 NOK 14.00<br />
31.12.00 NOK 23.51<br />
31.12.01 NOK 16.00<br />
31.12.02 NOK 7.51<br />
31.12.03 NOK 9.71<br />
31.12.04 NOK 18.90<br />
31.12.05 NOK 31.20<br />
31.12.06<br />
(The share price has been adjusted to reflect<br />
the 1:2 share split in April 1996.)<br />
NOK 72.75<br />
01.01.<strong>2006</strong> 23.04.2007<br />
Number of shareholders 699 774<br />
Foreign holdings 33.9 % 40.63 %<br />
01.01.06 – 23.04.07 Average per trading day<br />
Number of trades 6 953 21<br />
Value (NOK 1 000) 2 250 003 6 860<br />
Number of shares (1000) 44 322 135<br />
Average price 50.76<br />
Information<br />
<strong>TTS</strong> emphasizes the importance of giving the shareholders, the stock<br />
market and the general public the best possible knowledge of the<br />
<strong>Group</strong>’s operations and performance. Relevant information will be made<br />
available through stock market reports and press releases. Regular<br />
financial reports are issued in the form of annual reports and quarterly<br />
interim reports. The company is also in constant contact with financial<br />
analysts.<br />
The company’s financial calendar is as follows:<br />
4. quarter <strong>2006</strong> / preliminary annual result <strong>2006</strong> 15. February<br />
1. quarter 2007 7. May<br />
2. quarter 2007 22. August<br />
3. quarter 2007 31. October<br />
Annual General Meeting 24. May<br />
Annual General Meeting will be held at the company’s premises in Bergen.<br />
28
7000<br />
Movements in share capital, RISK adjustment<br />
Date Type of Share capital Number Nominal<br />
value transaction after transaction shares in NOK<br />
03.05.95 Public offering 1 911 000 1 911 000 1.00<br />
19.04.96 Share split 1 911 000 3 822 000 0.50<br />
20.05.96 Private placing 2 101 000 4 202 000 0.50<br />
10.12.96 Private placing 2 146 130 4 292 260 0.50<br />
10.01.97 Private placing 2 223 879 4 447 758 0.50<br />
16.01.97 Private placing 2 348 149 4 696 298 0.50<br />
23.04.97 Private placing 2 578 149 5 146 298 0.50<br />
26.05.98 Private placing 2 680 649 5 361 298 0.50<br />
04.10.99 Private placing 2 930 649 5 861 298 0.50<br />
17.04 00 Private placing 3 220 649 6 441 298 0.50<br />
26.04.00 Private placing 3 436 681 6 873 362 0.50<br />
10.05.01 Private placing 3 494 181 6 988 362 0.50<br />
18.01.02 Private placing 3 851 323,5 7 702 647 0.50<br />
28.02.02 Private placing 7 422 752 14 845 504 0.50<br />
15.10.04 Private placing 8 157 552 16 315 104 0.50<br />
14.02.05 Private placing 8 857 552 17 715 104 0.50<br />
22.02.05 Private placing 8 970 552 17 941 104 0.50<br />
31.03.05 Private placing 9 026 802 18 053 604 0.50<br />
04.07.05 Private placing 9 101 802 18 203 604 0.50<br />
12.09.05 Private placing 10 001 802 20.003.604 0.50<br />
30.09.05 Private placing 10 058 052 20 116 104 0.50<br />
30.05.06 Private placing 10 133 052 20 266 104 0.50<br />
11.09.06 Private placing 10 226 802 20 453 604 0.50<br />
12.12.06 Private placing 11 246 452 22 492 904 0.50<br />
<strong>TTS</strong> share value <strong>2006</strong>–2007<br />
24.04.06<br />
28.06.06<br />
29.08.06 09.11.06<br />
08.01.07 27.02.07<br />
90<br />
85<br />
80<br />
75<br />
70<br />
65<br />
55<br />
50<br />
45<br />
23.04.07<br />
RISK adjustments as of<br />
1 January - per share:<br />
1996 NOK –2.28<br />
1997 NOK 0.12<br />
1998 NOK 0.94<br />
1999 NOK 1.30<br />
2000 NOK 0.00<br />
2001 NOK 0.00<br />
2002 NOK 0.02<br />
2003 NOK -0.07<br />
2004 NOK 0.00<br />
2005 NOK 0.00<br />
<strong>2006</strong> NOK 0.00<br />
29
4-10 <strong>TTS</strong> GROUP 11-13 REPORT FROM THE CEO 14-27 BUSINESS AREAS 28-37 CORPORATE GOVERNANCE 36-87 DIRECTOR’S REPORT AND ACCOUNTS<br />
Corporate Governance<br />
Introduction<br />
<strong>TTS</strong> Marine <strong>ASA</strong> applies the Norwegian code of practice for corporate<br />
governance, dated December 2005. Principally, <strong>TTS</strong> Marine <strong>ASA</strong> acts<br />
in accordance with this code of practise, with a few exceptions that<br />
will be reviewed in the following:<br />
- Since <strong>TTS</strong> Marine <strong>ASA</strong> has fewer than 200 employees in Norway,<br />
the company does not have a corporate assembly.<br />
- In accordance with the Norwegian Public Limited Companies Act,<br />
the Chairman of the Board is elected by the Board unless already<br />
elected by the Annual General Meeting.<br />
The <strong>TTS</strong> <strong>Group</strong>’s principles for corporate governance have been adopted<br />
by the Board of <strong>TTS</strong> Marine <strong>ASA</strong>.<br />
<strong>TTS</strong> Marine <strong>ASA</strong>’s Articles of Association are available on the company’s<br />
website. The same applies to ethical guidelines.<br />
Shareholder policy<br />
<strong>TTS</strong> aims to give the shareholders a competitive long-term return that<br />
reflects the risk inherent to the company’s operations. Based on <strong>TTS</strong>’<br />
growth strategy, the shareholders’ return should be realised through<br />
an increase in the value of their shares, together with dividends<br />
when circumstances so permit. Growth through acquisitions will be<br />
implemented through balanced financing of equity and debt.<br />
The Board of <strong>TTS</strong> Marine AS will propose a dividend of NOK 1 per<br />
share to the Annual General Meeting in May 2007.<br />
Strategy for further growth<br />
<strong>TTS</strong> has, since 1997, completed eleven successful acquisitions, establishing<br />
a leading position in handling equipment to the maritime<br />
industry. This has entailed a considerable growth, and turnover has<br />
increased from approximately NOK 260 million in 1997 to NOK 1.6<br />
billion in <strong>2006</strong>. Owing to a brisk market and solid order backlog, <strong>TTS</strong><br />
expects an increase in turnover for 2007 of 20-25 percent. Operational<br />
margins will be further str<strong>eng</strong>thened in 2007.<br />
<strong>TTS</strong> will continue to expand its activities in ships equipment and port<br />
terminal systems, as well as handling equipment within the offshore<br />
industry, in the coming years.<br />
Share capital and shareholders<br />
The company’s share capital as of 31 December <strong>2006</strong> was NOK 11 246 452<br />
divided into 22 492 904 shares at a nominal value of NOK 0.50 per<br />
share. The company has only one class of freely transferable shares,<br />
which are listed on the Oslo Stock Exchange’s match list under the<br />
ticker symbol <strong>TTS</strong>.<br />
The company had 795 shareholders as of 31 December <strong>2006</strong>, compared<br />
to 699 at the beginning of the year. Of the shareholders at the<br />
end of the year, 114 were foreign shareholders holding 40.5 percent of<br />
the total share capital.<br />
30<br />
THE COMPANY’S 20 MAJOR SHAREHOLDERS<br />
AS OF 30 DECEMBER <strong>2006</strong> WERE AS FOLLOWS:<br />
Shareholder Number Ownership Voting<br />
shares interest share<br />
Skeie <strong>Group</strong> 8 280 000 36.81 % 36.81 %<br />
Morgan Stanley and Co.Intl. Ltd 2 575 407 11.45 % 11.45 %<br />
JCE <strong>Group</strong> AB 2 050 000 9.11 % 9.11 %<br />
IF Skadeforsikring AB 1 316 400 5.85 % 5.85 %<br />
Rasmuss<strong>eng</strong>ruppen AS 1 254 000 5.58 % 5.58 %<br />
Bank of New York, Brüssels branch 843 483 3.75 % 3.75 %<br />
Nordea Bank PLC Finland 752 600 3.35 % 3.35 %<br />
Odin Europa SMB 396 400 1.76 % 1.76 %<br />
Verdipapirfond Odin Maritim 370 000 1.64 % 1.64 %<br />
Stiching Shell Pensionfonds 288 256 1.28 % 1.28 %<br />
Stiftelsen Statoils Pensjonskasse 254 600 1.13 % 1.13 %<br />
DnB Nor SMB 222 600 0.99 % 0.99 %<br />
Lectio AS 189 200 0.84 % 0.84 %<br />
JP Morgan Chase Bank 180 000 0.80 % 0.80 %<br />
Vital Forsikring <strong>ASA</strong> 167 343 0.74 % 0.74 %<br />
DFA-Intl. SML CAP VAL PORT 161 700 0.72 % 0.72 %<br />
Arne Kjetil Kyrkjebø 154 400 0.69 % 0.69 %<br />
Statoil Forsikring AS 148 050 0.66 % 0.66 %<br />
Goldman Sachs International 130 900 0.58 % 0.58 %<br />
Alden AS 125 800 0.56 % 0.56 %<br />
20 major shareholders 19 861 139 88.30 % 88.30 %<br />
Other shareholders 2 631 765 11.70 % 11.70 %<br />
Total 22 492 904 100.00 % 100.00 %<br />
New Board of Directors<br />
In accordance with the Annual General Meeting on 30 May <strong>2006</strong>, the<br />
shareholders elected the following members to the Board:<br />
Name Position<br />
Nils O. Aardal (59) Executive Director, J.O. Oddfjell AS<br />
John M. Lunde (63) Managing Director, Risavika Havn AS<br />
Anne Breive (41) Executive Director, Statnett SF<br />
Hilde P. Aarseth Krøgenes (45) Marketing Manager,<br />
Kongsberg Norcontrol IT AS<br />
In accordance with ordinary appointment of two employee representatives<br />
to the Board of <strong>TTS</strong> Marine <strong>ASA</strong>, the following were elected to the Board<br />
in August of <strong>2006</strong>:<br />
Name Company Position<br />
Olav Smeland (32) <strong>TTS</strong> Marine <strong>ASA</strong> Director<br />
Oddmund Hatletun (60) <strong>TTS</strong> Marine <strong>ASA</strong> Director<br />
Mona L. Tellnes Halvorsen (37) <strong>TTS</strong> Marine <strong>ASA</strong> 1st Deputy<br />
Director<br />
Magne Kvamme (46) <strong>TTS</strong> Ships 2nd Deputy<br />
Equipment AS Director<br />
Nils O. Aardal was elected Chairman of the Board.
Nominating committee<br />
In accordance with the Annual General Meeting on 30 May <strong>2006</strong>, a<br />
nomination committee was appointed with the following members:<br />
Name Position<br />
Harald Espedal Managing Director, Skagenfondene<br />
Bjørn Sjaastad Managing Director, Frontline Management<br />
Bjørn Olafsson Self-employed<br />
Bjørn Olafsson was elected to chair the committee<br />
SHARES OWNED BY MEMBERS OF THE BOARD AND NOMINATING<br />
COMMITTEE<br />
As of 31 December <strong>2006</strong>, Director of the Board, Oddmund Hatletun,<br />
owned 1 493 shares, while Director of the Board Olav Smeland owned<br />
800 shares. The other Directors of the Board do not hold any shares<br />
or options in the company. The same applies to the members of the<br />
nominating committee.<br />
Authorisations to the Board<br />
On 30 May <strong>2006</strong>, the Annual General Meeting adopted a resolution to<br />
authorise the Board to issue a maximum of 4 000 000 shares in the<br />
event of an acquisition or merger. This authorisation is valid until the<br />
Annual General Meeting for <strong>2006</strong>, and no later than 30 June 2007. As<br />
of 29 March 2007, 2 039 300 share have been issued.<br />
On 30 May <strong>2006</strong>, the Annual General Meeting adopted a resolution<br />
to give the Board authority to purchase 300 000 of the company’s own<br />
shares. This authorisation is valid until the Annual General Meeting for<br />
<strong>2006</strong>, and no later than 30 June 2007.<br />
As of 29 March 2007, the company held 6 700 of its own shares,<br />
with a maximum shareholding in this period of 70 000 shares.<br />
Share options<br />
At the end of <strong>2006</strong>, a total of 452 500 authorised options had been<br />
issued to the executive management of the <strong>TTS</strong> <strong>Group</strong>. 112 500 options<br />
may be exercised up until 9 June 2007 at a price of NOK 26.50 and<br />
340 000 options may be exercised up until 30 May 2008, at a price of<br />
NOK 35 per share.<br />
AS PER 31 DECEMBER <strong>2006</strong>, THE DISTRIBUTION OF OPTIONS<br />
AND SHARES WAS AS FOLLOWS:<br />
Name Position Number of Number of<br />
options owned shares<br />
Johannes D. Neteland (49) President & CEO 137 500 82 500<br />
Olav Bruåsdal (51) Financial Director 55 000 25 000<br />
Hans-Jan Erstad (63) Chief of Staff 55 000 25 000<br />
Göran K. Johansson (63) Divisional Director 55 000 25 000<br />
Ivar K. Hanson (42) Divisional Director 55 000 25 000<br />
Stellan Bernsro (46) Divisional Director 40 000 0<br />
Edgar Bethmann (50) Divisional Director 40 000 0<br />
Bjørn O. Hansen (61) Project Director 15 000 15 800<br />
Total 452 500 198 300<br />
Hans Jan Erstad sold his 25 000 shares on 16 February 2007.<br />
Guidelines for remuneration of executive management are presented in<br />
Note 4.<br />
The work of the Board<br />
The structure of the Board meets the requirements for independence<br />
from the company’s management, and the complementary expertise<br />
within the Board helps to ensure that the Directors of the Board are<br />
able to assess matters from different perspectives before reaching a<br />
final decision.<br />
The auditor has at least two annual meetings with the audit committee,<br />
where part of the meeting is held without the management<br />
present. One of these meetings is related to the annual accounts. The<br />
auditor is present at board meetings when so required.<br />
The Board of <strong>TTS</strong> Marine <strong>ASA</strong> has an audit committee:<br />
AUDIT COMMITTEE<br />
Nils Olav Aardal (Chairman)<br />
Anne Breive<br />
The board had seven scheduled meetings annually, in addition to extra<br />
meetings as required. A total of 18 board meetings were held in <strong>2006</strong>.<br />
As a result of the tremendous expansion which the company is<br />
undergoing, the work of the board has been intensified, with increased<br />
focus on strategic work and acquisitions. In the coming years, <strong>TTS</strong> will<br />
continue to expand the group’s activities in ships equipment and port<br />
terminal equipment, as well as in offshore handling equipment.<br />
Insider trading in securities<br />
The Board has established a policy for trading in securities issues by the<br />
company. This policy complies with Oslo Stock Exchange’s guidelines<br />
for securities trading, and applies to the Board, President & CEO, as<br />
well as other employees who gain access to non-public information<br />
through their position in the company.<br />
31
4-10 <strong>TTS</strong> GROUP 11-13 REPORT FROM THE CEO 14-27 BUSINESS AREAS 28-37 CORPORATE GOVERNANCE 36-87 DIRECTOR’S REPORT AND ACCOUNTS<br />
Board of Directors <strong>TTS</strong> Marine <strong>ASA</strong><br />
Nils O. Aardal<br />
CHAIRMAN OF THE BOARD<br />
Aardal (59) with a background<br />
in economics studies, Aardal<br />
has over 30 years’ experience<br />
of the shipping and offshore<br />
industry through managerial<br />
and board positions with Jo<br />
Tankers and Odfjell Drilling.<br />
He has also held many posts<br />
as a director within banking,<br />
marine insurance and interest<br />
organisations. Today, Nils O.<br />
Aardal is a working director of<br />
the ship-owning companies<br />
that are used by Jo Tankers,<br />
and he also holds board<br />
positions within the marine<br />
industry. As of March 2007,<br />
Nils O. Aardal has no shares<br />
or options in the company.<br />
Aardal has been a member<br />
of the <strong>TTS</strong> Marine <strong>ASA</strong> board<br />
since 1999. He is a Norwegian<br />
citizen.<br />
32<br />
John M. Lunde<br />
DIRECTOR OF THE BOARD<br />
Lunde (63) has his background<br />
in Norwegian Defence and an<br />
<strong>eng</strong>ineering college education.<br />
John Lunde has approximately<br />
20 years’ experience of various<br />
managerial positions within the<br />
Scana group. Today Lunde is<br />
Managing Director of Risavika<br />
Havn AS. He is also Project<br />
Manager for Innovation<br />
Rogaland and holds various<br />
board positions, including positions<br />
within Scana Industrier,<br />
Stavanger Chamber of<br />
Commerce and Industry and<br />
Maritime Forum Rogaland.<br />
John Lunde has been on the<br />
board since 2005. As of March<br />
2007, he has no shares or<br />
options in the company. John<br />
Lunde is a Norwegian citizen.<br />
Hilde P. Aarseth Krøgenes<br />
DIRECTOR OF THE BOARD<br />
Krøgenes (45) has a Bachelor<br />
of Commerce degree from the<br />
Norwegian School of Management,<br />
and works as Marketing<br />
Manager for Kongsberg<br />
Norcontrol IT AS, where she<br />
has also held the position of<br />
Product Manager. Krøgenes<br />
has previously worked for the<br />
Norwegian Trade Council,<br />
including as regional manager<br />
for Southern Europe and on<br />
overseas postings in Toronto<br />
and New York. Krøgenes has<br />
also worked as Business<br />
Development Manager for<br />
IBA Corp., San Jose and as<br />
a consultant for the Norwegian<br />
Trade Council in San Francisco.<br />
As of March 2007, Krøgenes<br />
has no shares or options in<br />
the company. Hilde P. Aarseth<br />
Krøgenes has been a member<br />
of the board of <strong>TTS</strong> Marine <strong>ASA</strong><br />
since 2005. Krøgenes is a<br />
Norwegian citizen.
Anne Breive<br />
DIRECTOR OF THE BOARD<br />
Breive (41) is CEO and CFO of<br />
Statnett. She has a Bachelor<br />
of Commerce degree from the<br />
Norwegian School of Management<br />
(BI) and an MBA degree<br />
from Glasgow University.<br />
During the period 1994-2005,<br />
she held various managerial<br />
positions in the Norske Skog<br />
group, including that of Vice<br />
President Corporate Funding<br />
and Vice President Corporate<br />
Controlling. Breive has been on<br />
the board since 2005. As of<br />
March 2007, she has no shares<br />
or options in the company.<br />
Breive is a Norwegian citizen.<br />
Oddmund Hatletun<br />
DIRECTOR OF THE BOARD<br />
Hatletun (60) graduated in<br />
mechanical <strong>eng</strong>ineering from<br />
Bergen Technical School in<br />
1968. He has worked as a<br />
designer/project manager for<br />
Norsk Mac Gregor, Hagglunds<br />
MTT and <strong>TTS</strong> Marine. In these<br />
companies, he has worked on<br />
ships’ hatches, ramps, doors,<br />
lifts and cranes and therefore<br />
has an extensive knowledge of<br />
much of <strong>TTS</strong>’ product spectrum.<br />
He also has experience of the<br />
offshore industry as a project<br />
<strong>eng</strong>ineer with CCB-Base and<br />
as an inspector stationed on<br />
diving vessels and platforms.<br />
As of March 2007, Hatletun<br />
owns 1 493 shares in <strong>TTS</strong>.<br />
He has been the employees’<br />
representative on the <strong>TTS</strong><br />
board during the periods<br />
1998-2002 and 2004 to the<br />
present day. Oddmund Hatletun<br />
is a Norwegian citizen.<br />
Olav Smeland<br />
DIRECTOR OF THE BOARD<br />
Smeland (32) holds a degree as<br />
Technical Economic Engineer<br />
(Machinery) at Agder College,<br />
Grimstad division, from 1996.<br />
He has previously been employed<br />
by Hydralift, and has worked<br />
for <strong>TTS</strong> since 1998. He has<br />
worked primarily as purchaser<br />
for parts and accessories<br />
r elated to crane production.<br />
Presently, he is Project Manager<br />
in the Marine Crane Division’<br />
branch office in Kristiansand.<br />
As of March 2007, Smeland<br />
owns 800 shares in <strong>TTS</strong>.<br />
He has acted as employee<br />
r epresentative on the Board of<br />
<strong>TTS</strong> Marine <strong>ASA</strong> since <strong>2006</strong>.<br />
Smeland is a Norwegian citizen.<br />
33
4-10 <strong>TTS</strong> GROUP 11-13 REPORT FROM THE CEO 14-27 BUSINESS AREAS 28-37 CORPORATE GOVERNANCE 36-87 DIRECTOR’S REPORT AND ACCOUNTS<br />
Senior management<br />
Johannes D. Neteland<br />
PRESIDENT & CEO<br />
Neteland (49) is President &<br />
CEO of <strong>TTS</strong> Marine <strong>ASA</strong>. He<br />
has an advanced business<br />
administration degree from<br />
the Norwegian School<br />
of Economics and Business<br />
Administration. Neteland<br />
worked for Statoil from 1981-<br />
1988, was the deputy managing<br />
director of Block Watne<br />
Boliger from 1988-1989 and<br />
the marketing director of the<br />
Ekornes <strong>Group</strong> from 1989-<br />
1991. He was the division<br />
director of Vital Forsikring from<br />
1991-1998 until he assumed<br />
his current position.<br />
34<br />
Olav Bruåsdal<br />
FINANCIAL DIRECTOR<br />
Bruåsdal (51) is Financial<br />
Director of <strong>TTS</strong> Marine <strong>ASA</strong>.<br />
He has an advanced <strong>eng</strong>ineering<br />
degree from the Norwegian<br />
Institute of Technology at the<br />
University of Trondheim and<br />
a higher degree in business<br />
administration from the<br />
Norwegian School of Economics<br />
and Business Administration.<br />
Bruåsdal worked with <strong>eng</strong>ineering,<br />
project and department<br />
management for 12 years before<br />
he started at <strong>TTS</strong> in 1994. He<br />
started out as a project manager<br />
and was subsequently appointed<br />
as the director of projects and<br />
administration. He assumed his<br />
current position in 1997.<br />
Hans-Jan Erstad<br />
HR MANAGER<br />
Erstad (63) is HR Manager with<br />
corporate responsi bility for IT,<br />
personnel and quality assurance<br />
at <strong>TTS</strong>. He is an auto mation<br />
<strong>eng</strong>ineer and has also studied<br />
economics, management and<br />
contract management. Erstad<br />
has among others worked at<br />
Nera and Petrovest. He started<br />
working at <strong>TTS</strong> in 1995 and has<br />
been respon sible for IT, logistics<br />
and industrial development.<br />
He assumed his current position<br />
in 2002.
Stellan Bernsro<br />
DIRECTOR<br />
Bernsro (46) is Director of Dry<br />
Cargo Handling Division and<br />
Managing Director of <strong>TTS</strong> Ships<br />
Equipment AB. Bernsro holds a<br />
Master of Science in Industrial<br />
Engineering and Management,<br />
an Engineering degree in<br />
Mechanics while being graduated<br />
Captain in the Royal Swedish<br />
Navy. Bernsro has experience<br />
from management positions in<br />
marine diesel <strong>eng</strong>ine service,<br />
industrial gas applications and<br />
production automation, prior<br />
to joining <strong>TTS</strong> in 1996. He was<br />
initially assigned as contract<br />
manager and was in 2005<br />
appointed managing director,<br />
while during the spring <strong>2006</strong><br />
assuming current position.<br />
Ivar K. Hanson<br />
DIRECTOR<br />
Hanson (42) is Division Director<br />
for Marine Cranes. He has an<br />
advanced degree in business<br />
admi ni stration from the<br />
Norwegian School of Economics<br />
and Business Admini stration<br />
(NHH) and is a mechanical<br />
<strong>eng</strong>ineer. Hanson has worked as<br />
a contract coordi nator and bid<br />
manager. He started at <strong>TTS</strong> as<br />
a shipyard consultant in 1994<br />
and was appointed managing<br />
director of <strong>TTS</strong> Automation AS<br />
in 1999 and <strong>TTS</strong> Handling<br />
Systems AS in 2000. From<br />
1 January 2003 to 30 May<br />
2004, Hanson was director in<br />
Prosafe Drilling Services AS<br />
for Technology and Projects<br />
in the <strong>eng</strong>ineering division.<br />
Göran K. Johansson<br />
DIRECTOR<br />
Johansson (63) is Director of<br />
the Port and Material Handling<br />
Division. Johansson is a naval<br />
architect and <strong>eng</strong>ineer. He<br />
has 20 years of experience<br />
from various enterprises that<br />
are cur rently part of the<br />
MacGregor <strong>Group</strong>. Johansson<br />
was the managing direc tor<br />
of Ham worthy KSE AB from<br />
1995 until the company was<br />
inte grated into the <strong>TTS</strong> <strong>Group</strong><br />
on 1 January 2002.<br />
Edgar Bethmann<br />
DIRECTOR<br />
Bethmann (50) is the Division<br />
Director for Deck Machinery<br />
and Managing Director of<br />
<strong>TTS</strong> Kocks GmbH. He has a<br />
Bachelor of Commerce degree<br />
from the German Institute of<br />
Technology at the University<br />
of Clausthal-Zellerfeld,<br />
Germany. Bethmann has<br />
16 years’ experience from<br />
the shipbuilding industry in<br />
Germany, partly as a technical<br />
director. Since 2000, he has<br />
been Managing Director of<br />
<strong>TTS</strong> Ships Equipment GmbH<br />
in Bremen. Bethmann took<br />
up his current position with<br />
<strong>TTS</strong> in the autumn of 2005.<br />
35
4-10 <strong>TTS</strong> GROUP 11-13 REPORT FROM THE CEO 14-27 BUSINESS AREAS 28-37 CORPORATE GOVERNANCE 36-87 DIRECTOR’S REPORT AND ACCOUNTS<br />
Directors’ report for <strong>2006</strong><br />
Introduction<br />
In <strong>2006</strong>, the turnover in the <strong>TTS</strong> <strong>Group</strong> (<strong>TTS</strong>) totalled NOK 1 604<br />
million, earnings before depreciation (EBITDA) was NOK 98.6<br />
million and pre-tax profit was NOK 60.5 million. The order backlog<br />
at the end of the year was NOK 2 019 million. These results<br />
represent record achievements for <strong>TTS</strong> at all levels.<br />
The Board of <strong>TTS</strong> proposes dividend payment of NOK 1 per<br />
share.<br />
The positive development has consolidated <strong>TTS</strong>’ position as a<br />
leading international corporation within maritime equipment,<br />
where the group is one of two leading suppliers within its market<br />
segments.<br />
Operations<br />
<strong>TTS</strong>’ activities have been organised into the four divisions; Dry<br />
Cargo Handling, Marine Cranes, Deck Machinery and Port and<br />
Material Handling. Accordingly, <strong>TTS</strong> has three divisions aimed<br />
at the market for ships equipment and one aimed at the market<br />
for shipbuilding systems and systems for container handling in<br />
ports.<br />
The company’s target for <strong>2006</strong> has been to improve its competitive<br />
position and results, while maintaining a profitable growth.<br />
Turnover in <strong>2006</strong> increased by 40 percent, of which organic<br />
growth constituted 22 percent. In the new business segment<br />
Deck Machinery results were negative, but even allowing for this<br />
negative effect, net result increased by 50 percent in <strong>2006</strong>.<br />
In <strong>2006</strong>, <strong>TTS</strong> further developed its strong position in China,<br />
in addition to starting up new business operations in Italy and<br />
Vietnam. The Italian company was established in Genoa in May,<br />
while the sales and representative office in Haiphong in Vietnam<br />
was opened in November of <strong>2006</strong>. Both business operations have<br />
so far shown excellent results.<br />
The Dry Cargo Handling Division is supplying RoRo equipment,<br />
hatch covers, side-loading systems, as well as cruise and yacht<br />
equipment. The background for establishing a new company in<br />
Italy is increased focus on the cruise ships and mega yacht product<br />
segments, which are major product areas within Italian shipbuilding.<br />
The Marine Cranes Division is supplying cargo and hose handling<br />
cranes in addition to davits (rescue boat cranes). Its main focus in<br />
<strong>2006</strong> has been the transfer of the range of standard cranes from<br />
Norway to our operations in Shanghai, China. This has improved<br />
the division’s profitability, while creating available capacity to target<br />
the offshore market in Norway.<br />
As a result of agreements entered into five years ago in connec-<br />
36<br />
tion with the acquisition, <strong>TTS</strong> has not actively participated in the<br />
market for larger offshore cranes. This agreement expired in<br />
January 2007, and <strong>TTS</strong> is currently intensively targeting this<br />
market.<br />
In February 2007, <strong>TTS</strong> acquired all the shares of the Ålesundbased<br />
Company ICD Projects AS, a company that develops and<br />
delivers software and control systems for offshore handling equipment.<br />
As a result, <strong>TTS</strong> is now a one-stop supplier of advanced<br />
offshore handling equipment, which for <strong>TTS</strong> represents a new<br />
business area, in addition to making a comeback as one-stop<br />
supplier of offshore cranes.<br />
The Port and Material Handling Division is supplying shipyard<br />
equipment and port equipment. In <strong>2006</strong>, the division experienced<br />
a breakthrough in the market for port terminal equipment, through<br />
a major contract to a newly established terminal in Virginia in USA.<br />
In March 2007, <strong>TTS</strong> acquired technology for port terminal equipment<br />
that will further str<strong>eng</strong>then <strong>TTS</strong>’ position as leading supplier<br />
within this segment.<br />
The Deck Machinery Division is supplying anchor handling and<br />
mooring winches. At the time of <strong>TTS</strong>’ takeover of Kocks GmbH<br />
at the end of 2005, most of the company’s activities were aimed<br />
at the Korean market. But subsequent to its incorporation in the<br />
<strong>TTS</strong> <strong>Group</strong>, the division has successfully been awarded contracts<br />
in China, as well as in Vietnam. In 2007, <strong>TTS</strong> bought up its partner’s<br />
50 percent share in the manufacturing company in Korea, and<br />
accordingly the division will have greater opportunity of further<br />
developing operations in this highly significant Asian market.<br />
At the end of the year, <strong>TTS</strong> had a workforce of 521 employees,<br />
of which 177 were based in Norway. In addition to this, <strong>TTS</strong> has two<br />
joint venture companies in China with a total of 112 employees. The<br />
joint venture company in Korea, which as of mid-March is owned<br />
100 percent by <strong>TTS</strong>, had 41 employees.<br />
The <strong>TTS</strong> <strong>Group</strong> had 19 units as of March 2007 (including joint<br />
ventures) in 10 countries (Norway, Sweden, Germany, Finland,<br />
China, USA, Korea, Czech Republic, Italy and Vietnam). The<br />
parent company, <strong>TTS</strong> Marine <strong>ASA</strong>, has its head office in Bergen in<br />
Norway, and is listed on the Oslo Stock Exchange.<br />
As a group, <strong>TTS</strong> exploits the operational and marketing synergies<br />
that come from being a major market participant within relevant<br />
niches. At the same time, there is strong focus on what <strong>TTS</strong> has<br />
found to be a strategic advantage; namely the cultivation of a smallcompany<br />
culture within the <strong>TTS</strong> companies. Proximity to operations<br />
and results in each of the 19 units motivates management<br />
and employees to greater effort, and this in turn str<strong>eng</strong>thens the
perception of the individual customer that their needs and requirements<br />
are being met to in a satisfactory manner.<br />
In <strong>TTS</strong>, product development primarily takes place through<br />
projects. Prior to signing of contracts, each project sees considerable<br />
development work in cooperation with the customers.<br />
However, for some of the new product areas, such as within port<br />
terminal equipment, some of the product development will not<br />
be tied to one single project.<br />
Comments on the annual accounts for <strong>2006</strong><br />
RESULTS<br />
Earnings per share in <strong>2006</strong> were NOK 2.92 (NOK 2.19 as of<br />
31 December 2005) based on a turnover of NOK 1 604 million<br />
(NOK 1 149.8 million), earnings before depreciation (EBITDA)<br />
of NOK 98.6 million (NOK 67.2 million) and an operating profit<br />
of NOK 89.7 million (NOK 59.6 million). Pre-tax profit was<br />
NOK 84.5 million (NOK 56.3 million), while net profit was<br />
NOK 60.5 million (NOK 40.2 million).<br />
Turnover increased by 40 percent and EBITDA increased by 46.7<br />
percent compared to the previous year, and represents the highest<br />
turnover and results ever recorded by <strong>TTS</strong>. The results are moreover<br />
in line with the “guiding” of the market presented by <strong>TTS</strong> in<br />
February <strong>2006</strong>.<br />
The Dry Cargo Handling Division saw yet another year of<br />
excellent results, in particular for the companies in Sweden and<br />
Germany. The EBITDA margin in <strong>2006</strong> reached a record high<br />
11 percent, compared to 9.4 percent in 2005.<br />
The Marine Cranes Division’s restructuring process, with the<br />
transfer of expertise from Norway to China, is yielding results,<br />
with an EBITDA margin in <strong>2006</strong> of 3.1 percent compared to zero<br />
percent in 2005 and -4.7 percent in 2004. This positive development<br />
is satisfactory, but there is still room for improvement.<br />
The Port and Material Handling Division’s EBITDA margin in<br />
<strong>2006</strong> was 7.1 percent compared to 5.0 percent in 2005. Operations<br />
within some of the product segments for terminal systems were<br />
good. The division has potential for improvement of margins<br />
within shipyard systems, in addition to the fact that a breakthrough<br />
in the delivery of terminal systems will improve the division’s<br />
results.<br />
The Deck Machinery Division experienced a tough first operational<br />
year in <strong>TTS</strong> with an EBITDA margin of –1.8 percent. However,<br />
this was as expected, given the takeover of an order backlog<br />
with low margins, at the same time as a considerable restructuring<br />
was initiated.<br />
BALANCE SHEET<br />
Total assets as of 31 December <strong>2006</strong> were NOK 1 663.1 million<br />
(NOK 1 182.8 million) with a total equity of NOK 598.1 million<br />
(NOK 394.9 million), equivalent to an equity ratio of NOK 36.6<br />
percent (33.4 percent).<br />
Of the balance sheet total of NOK 1 633.1 million, fixed asset<br />
investments constituted NOK 62.4 million; NOK 42.2 million of<br />
which are assets in the three joint venture companies (including<br />
NOK 5.5 million in loans) and NOK 19.2 million of which are<br />
shares and loans related to the FastShip project.<br />
<strong>TTS</strong> has been involved in the FastShip project since 1996. Subject<br />
to implementation of the project, <strong>TTS</strong> will, through patented<br />
technology, receive contracts with FastShip Inc. for a value of more<br />
than NOK 1 billion. <strong>TTS</strong> also has ownership interest in FastShip<br />
Inc., which are recorded on the balance sheet at a value of NOK<br />
19.2 million.<br />
The project activities have resumed in <strong>2006</strong>/2007, and in all<br />
probability <strong>TTS</strong> will be awarded a smaller contract in the project<br />
as early as spring 2007. As a consequence of the simplification and<br />
redesign of the FastShip project in <strong>2006</strong>, the Board considers the<br />
likelihood of realisation of the project to have increased over the<br />
past twelve months.<br />
However, the project has been in existence for more than 10<br />
years, so unless its progress changes notably in the course of<br />
2007, the Board will consider writing off the asset item at the end<br />
of this year.<br />
Net interest bearing holdings as of 31 December <strong>2006</strong> was<br />
NOK 22.8 million compared to an net interest bearing debt of<br />
NOK 96.1 million a year ago. Cash reserves as of 31 December<br />
<strong>2006</strong> were NOK 236.9 million (NOK 97.8 million).<br />
According to the cash flow statement, NOK 0.9 million was<br />
generated by operating activities in <strong>2006</strong>, NOK 10.9 million was<br />
used for investment activities and NOK 149.1 million was generated<br />
by financing activities. The main cause of the difference between<br />
the operating profit and cash flow from operating activities was<br />
the higher level of project activity, and consequently increased<br />
employment of capital.<br />
The <strong>TTS</strong> <strong>Group</strong> has income and expenses in foreign currencies,<br />
where the financial risk has been reduced through the use of hedging<br />
instruments described in greater detail in Accounting Principles.<br />
The annual accounts have been prepared in accordance with the<br />
International Financial Reporting Standard (IFRS).<br />
The accounts provide a true picture of the company’s financial<br />
position as of 31 December <strong>2006</strong>. The Board and Management<br />
37
are not aware of any events that have occurred subsequent to the<br />
balance sheet date of 31 December <strong>2006</strong> that may be of material<br />
significance to <strong>TTS</strong> and the annual accounts for <strong>2006</strong>.<br />
At the end of <strong>2006</strong>, <strong>TTS</strong> Marine <strong>ASA</strong> had a share capital of<br />
NOK 11 246 452 divided into 22 492 904 shares of NOK 0.50<br />
each.<br />
ORDER BACKLOG<br />
The order backlog as of 31 December <strong>2006</strong> was NOK 2 019 million,<br />
the highest level recorded in the history of the company, compared<br />
to NOK 1 653 million at the same time in 2005.<br />
Business areas<br />
DRY CARGO HANDLING<br />
NOK MILLION <strong>2006</strong> 2005<br />
Turnover 728.2 649.2<br />
EBITDA 80.3 61.3<br />
Order backlog 809.0 825.0<br />
The division’s good earnings bear evidence of the excellent results<br />
from the RoRo operations in Sweden and the hatch cover operations<br />
in Germany. In <strong>2006</strong>, contracts worth NOK 195 million<br />
were signed for the delivery of 14 car carriers. Furthermore, the<br />
product segments for cruise and side-loading systems in Norway<br />
have shown positive development in <strong>2006</strong>.<br />
The division typically signs substantial individual orders that may<br />
occur at somewhat irregular intervals. The marginal reduction in<br />
the order backlog is not representative of the market outlook, and<br />
the division therefore has a solid starting point for 2007.<br />
The joint venture <strong>TTS</strong> Hua Hai Ships Equipment Co. Ltd. in<br />
Shanghai was established in 1998, and focuses on hatch covers for<br />
the Chinese market. The level of activity has continued to increase,<br />
and in <strong>2006</strong> turnover reached NOK 256 million, with an order<br />
backlog of NOK 507 million at the end of the year (this figure is<br />
not included in <strong>TTS</strong> <strong>Group</strong>s order backlog of NOK 2 019 million).<br />
<strong>TTS</strong>’s share of the profit from the joint venture amounted to<br />
NOK 9.7 million, which has been recognised as financial income<br />
in the consolidated accounts.<br />
MARINE CRANES<br />
NOK MILLION <strong>2006</strong> 2005<br />
Turnover 439.6 309.0<br />
EBITDA 13.5 0.2<br />
Order backlog 600.0 390.0<br />
38<br />
The company in Norway, which is supplying cylinder cranes, has<br />
over the past three years carried out a necessary restructuring of<br />
the operations. The restructuring has involved transfer to <strong>TTS</strong>’<br />
company in China, of full responsibility for crane deliveries to<br />
Asian markets outside of China. The restructuring has now entered<br />
a more regular operating phase, with significant improvement in<br />
results for <strong>2006</strong>, in both Norway and China.<br />
<strong>TTS</strong>’s investment in wire cranes, through the acquisition in<br />
Germany in 2004, has yielded excellent results in <strong>2006</strong>. We have<br />
built up the organisation and brought in a new business with good<br />
earnings. The development in <strong>2006</strong> was as expected.<br />
The joint venture company <strong>TTS</strong> Bohai Machinery Co. Ltd. in<br />
Dalian saw its first year of operation in <strong>2006</strong>, following its establishment<br />
in the summer of 2005. The company, which focuses<br />
on deliveries to the Chinese market, had a turnover of NOK 27<br />
million in <strong>2006</strong>, with an order backlog of NOK 100 million at<br />
the end of the year (this figure is included in <strong>TTS</strong> <strong>Group</strong>’s order<br />
backlog). <strong>TTS</strong>’ share of the results of the joint venture company<br />
amounted to NOK –0.5 million, which has been recognised as<br />
financial costs in the consolidated accounts. The results of the<br />
company, currently in a start-up phase, are considerable better<br />
than expected.<br />
The division has a record high order backlog and an excellent<br />
market outlook, which provides a good starting point for 2007.<br />
In addition, there is the effect of <strong>TTS</strong> re-entering the offshore<br />
market.<br />
PORT AND MATERIAL HANDLING<br />
NOK MILLION <strong>2006</strong> 2005<br />
Turnover 178.8 140.7<br />
EBITDA 12.6 7.0<br />
Order backlog 148.0 72.0<br />
<strong>TTS</strong> experienced a breakthrough in the market for cargo handling<br />
equipment to large container terminals in the fourth quarter, with<br />
a contract worth NOK 20 million, as well as an option of a further<br />
NOK 23 million. This is a sizable market, substantially larger than<br />
the market for RoRo terminals in which <strong>TTS</strong> is already established<br />
with excellent earnings.<br />
In <strong>2006</strong>, <strong>TTS</strong> did not succeed in signing contracts for the delivery<br />
of linkspans, which is a purpose-built ramp between port and<br />
RoRo vessels. Linkspans is one of several products in the range for<br />
cargo handling in ports. However, in February this year, <strong>TTS</strong><br />
signed a link-span contract worth approximately NOK 10 million.
4-10 <strong>TTS</strong> GROUP 11-13 REPORT FROM THE CEO 14-27 BUSINESS AREAS 28-37 CORPORATE GOVERNANCE 36-87 DIRECTOR’S REPORT AND ACCOUNTS<br />
For shipyard and heavy lift equipment, the year commenced with<br />
poor results as a consequence of working on low-margin projects.<br />
The development during the course of the year has been positive,<br />
including new projects with higher margins. A solid order backlog<br />
and a sustained brisk market form a promising starting point for<br />
2007.<br />
DECK MACHINERY<br />
NOK MILLION <strong>2006</strong> 2005<br />
Turnover 257.4 50.4<br />
EBITDA -4.6 2.5<br />
Order backlog 462.0 366.0<br />
Effective as of 1 October 2005, <strong>TTS</strong> took over Kocks GmbH.<br />
Results for the fourth quarter of 2005 includes a sales profit<br />
(NOK 1.3 million), as well as what turns out to be incorrect<br />
accured income. Accordingly, the quarterly result was not representative<br />
of the underlying operations.<br />
The results for <strong>2006</strong> bear evidence of <strong>TTS</strong> taking over an order<br />
backlog with low margins. Most of the old order backlog will<br />
be out of our books by summer, and we therefore expect an<br />
improvement of operations during the second half of 2007.<br />
The division had a good order intake in <strong>2006</strong>, and accordingly<br />
an improvement in the order backlog. The market outlook remains<br />
positive, with opportunities for growth, particularly in China.<br />
Organisation<br />
ORGANISATION AND ENVIRONMENT<br />
The number of employees in the <strong>TTS</strong> <strong>Group</strong> increased by 62 to<br />
521 during <strong>2006</strong>.<br />
Absence due to sickness was 3.3 percent in <strong>2006</strong>, compared to<br />
2.8 percent in 2005. 10 minor personal injuries were reported<br />
during the year, compared to two in the previous year. Measures<br />
were taken to improve this negative trend. The working environment<br />
and employee relations are considered to be good and continuous<br />
improvements are being implemented.<br />
As a global group with companies in ten countries, there is a<br />
continuous focus on joining the companies, corporate cultures<br />
and environments together. In this context, “The Spirit of <strong>TTS</strong>”<br />
has played a key role throughout 2005 and <strong>2006</strong>. Through a process<br />
involving all companies and divisions, we have examined and<br />
established our core values, integrity, openness, loyalty and initiative.<br />
Our core values shall influence <strong>TTS</strong>’s activities, so that they<br />
contribute to cooperation and progress for each and every one in<br />
the <strong>TTS</strong> <strong>Group</strong>.<br />
40<br />
A key area for continuous improvement is work within Health<br />
Environment and Safty (HES). In <strong>2006</strong>, <strong>TTS</strong> established a HES<br />
handbook to act as a guideline for all employees of the <strong>TTS</strong> <strong>Group</strong>.<br />
Quality at all levels is fundamental to our ability to deliver products<br />
and services of a quality that builds confidence in <strong>TTS</strong>. A quality<br />
control process is one of the measures used, and our aim is for all<br />
<strong>TTS</strong> companies to be ISO certified in the course of 2007. <strong>TTS</strong><br />
Marine Shanghai Co. Ltd. in China, <strong>TTS</strong> Liftec Oy in Finland and<br />
<strong>TTS</strong> Port Equipment AB in Sweden were certified in <strong>2006</strong>.<br />
The <strong>TTS</strong> <strong>Group</strong>’s activities are primarily related to <strong>eng</strong>ineering,<br />
assembly and testing of equipment. Steel production is carried out<br />
by a network of international subcontractors. The company does<br />
not pollute the external environment. In addition, assembly and<br />
testing of <strong>TTS</strong> products is based on a very limited use of chemicals<br />
harmful to human health or to the environment.<br />
The products supplied by <strong>TTS</strong> are primarily electro-hydraulically<br />
powered, and there is little risk of environmental pollution.<br />
The <strong>TTS</strong> <strong>Group</strong>’s operations are not regulated by licenses or regulatory<br />
orders.<br />
EQUAL OPPORTUNITIES<br />
<strong>TTS</strong> aims to ensure equal working conditions, equal opportunities<br />
and equal treatment regardless of gender, religion or ethnic background.<br />
The aim is equal treatment of all with regard to recruitment,<br />
remuneration and promotion.<br />
<strong>TTS</strong> has 521 employees, with a main emphasis on <strong>eng</strong>ineering<br />
expertise. Women are typically underrepresented in this business;<br />
of the total workforce, 106 (20.3 percent) are women. Of these<br />
women, 60 hold positions within administration, finance or sales<br />
and marketing, giving 43/57 distribution of women and men within<br />
these functions.<br />
There are a total of two women out of the four shareholderelected<br />
board members on the Board of <strong>TTS</strong> Marine <strong>ASA</strong>, in<br />
addition to two employee representatives who are both men.<br />
NEW MANAGERS IN <strong>2006</strong><br />
Stellan Bernsro (46) was appointed Divisional Director for Dry<br />
Cargo Handling Division in <strong>2006</strong>. Bernsro took over as Managing<br />
Director of <strong>TTS</strong> Ships Equipment AB in Gothenburg Sweden on<br />
1 September 2005. He has been employed in the company since<br />
1996.<br />
Tatu Miikkulainen (43) was appointed new Managing Director<br />
of <strong>TTS</strong> Liftec Oy in Tampere in Finland. Miikkulainen has been<br />
employed in the company since April of 2005.
Torsten Paas (44) was appointed new Managing Director of <strong>TTS</strong><br />
Inc. in Miami in USA. Paas comes from <strong>TTS</strong>-LMG Marine Cranes<br />
GmbH, where he was responsible for after-sales.<br />
Tran Duc Hieu (31) was appointed head of the sales and representative<br />
office in Haiphong in Vietnam. The office opened in<br />
November of <strong>2006</strong>.<br />
Corporate governance<br />
INTRODUCTION<br />
A more detailed account of the applicable principles for corporate<br />
governance is provided later in this report.<br />
NEW BOARD OF DIRECTORS<br />
In accordance with the Annual General Meeting on 30 May <strong>2006</strong>,<br />
the shareholders elected the following members to the Board:<br />
NAME POSITION<br />
Nils O. Aardal (59) Executive Director, J.O. Oddfjell AS<br />
John M. Lunde (63) Managing Director, Risavika Havn AS<br />
Anne Breive (41) Executive Director, Statnett SF<br />
Hilde P. Aarseth Marketing Manager,<br />
Krøgenes (45) Kongsberg Norcontrol IT AS<br />
In accordance with ordinary appointment of two employee representatives<br />
to the Board of <strong>TTS</strong> Marine <strong>ASA</strong>, the following were<br />
elected to the Board in August of <strong>2006</strong>:<br />
NAME COMPANY POSITION<br />
Olav Smeland (32) <strong>TTS</strong> Marine <strong>ASA</strong> Director<br />
Oddmund Hatletun (60) <strong>TTS</strong> Marine <strong>ASA</strong> Director<br />
Mona L. Tellnes <strong>TTS</strong> Marine <strong>ASA</strong> 1st Deputy<br />
Halvorsen (37) Director<br />
Magne Kvamme (46) <strong>TTS</strong> Ships 2nd Deputy<br />
Equipment AS Director<br />
Nils O. Aardal was elected Chairman of the Board.<br />
NOMINATING COMMITTEE<br />
In accordance with the Annual General Meeting on 30 May <strong>2006</strong>,<br />
a nominating committee was appointed with the following<br />
members:<br />
NAME POSITION<br />
Harald Espedal Managing Director, Skagenfondene<br />
Bjørn Sjaastad Managing Director, Frontline Management<br />
Bjørn Olafsson Self-employed<br />
Bjørn Olafsson was elected to chair the committee.<br />
INCREASE OF SHARE CAPITAL<br />
The company’s share capital at the start of the year was NOK<br />
10 058 052 divided into 20 116 104 shares at NOK 0.50 each.<br />
In accordance with the Annual General Meeting’s resolution of<br />
27 May 2004, the Board has issued 300 000 share purchase options.<br />
The last 150 000 options were exercised on 16 May <strong>2006</strong>, at<br />
a price of NOK 14 per share. Correspondingly, in accordance<br />
with the Annual General Meeting’s resolution of 30 June 2005,<br />
the Board had issued 300 000 share purchase options, of which<br />
187 500 were exercised on 24 August <strong>2006</strong> at a price of NOK<br />
26.50 per share.<br />
In accordance with authority granted by the Annual General<br />
Meeting on 30 May <strong>2006</strong>, the Board resolved on 7 December<br />
<strong>2006</strong> to increase the share capital of <strong>TTS</strong> Marine <strong>ASA</strong> by NOK<br />
1 019 650 (9.97 percent), by issuing 2 039 300 shares at a nominal<br />
value of NOK 0.50 per share at a subscription price of NOK<br />
64.50. The purpose of this issue for cash is to further develop the<br />
company through new acquisitions.<br />
The company’s share capital subsequent to the issue and as of<br />
31 December <strong>2006</strong>, was NOK 11 246 452 divided into 22 492 904<br />
shares at NOK 0.50 each.<br />
In the fourth quarter of <strong>2006</strong>, <strong>TTS</strong> purchased 20 000 of its own<br />
shares at an average price of NOK 63,585. In addition to these shares,<br />
the company had a previous shareholding of 58 000 shares. <strong>TTS</strong>’ aim<br />
was to sell these own shares to employees at a discounted rate. The<br />
employees have been given an offer to purchase a maximum of 800<br />
shares at a rate of NOK 46, which represents a discount of 20 percent<br />
compared with the average rate in week 48. 104 employees have<br />
purchased a total of 71 300 shares. <strong>TTS</strong>’ holding of own shares subsequent<br />
to the sale and as per 31 December <strong>2006</strong> was 6 700 shares.<br />
Future prospects<br />
The international shipbuilding industry has experienced four good<br />
years. This has entailed excellent market conditions for ships<br />
equipment, which is <strong>TTS</strong>’ core business. Accordingly, <strong>TTS</strong> noted<br />
a record high order backlog at the end of <strong>2006</strong>; 22 percent higher<br />
than the previous year. Moreover, the high volume of new orders<br />
has continued into the first quarter of 2007.<br />
The market for ships equipment and offshore equipment is<br />
expected to remain brisk over the next 2–3 years, with somewhat<br />
stronger competition in the ships equipment market than in the<br />
offshore market. Correspondingly, good market conditions are<br />
also expected for the products in the Port and Material Handling<br />
Division.<br />
41
4-10 <strong>TTS</strong> GROUP 11-13 REPORT FROM THE CEO 14-27 BUSINESS AREAS 28-37 CORPORATE GOVERNANCE 36-87 DIRECTOR’S REPORT AND ACCOUNTS<br />
The brisk market combined with a solid order backlog will yield a<br />
growth in turnover of 20-25 percent in 2007. Operating margins<br />
will also improve in the course of the year.<br />
Allocation of annual profits for <strong>TTS</strong> Marine <strong>ASA</strong><br />
The <strong>TTS</strong> <strong>Group</strong>’s net profit was NOK 60.5 million, and equity<br />
totalled NOK 598.1 million as of 31 December <strong>2006</strong>.<br />
<strong>TTS</strong> Marine <strong>ASA</strong>’s equity as per 31 December <strong>2006</strong> is NOK<br />
543.3 million, with NOK 34.0 million in unrestricted equity after<br />
dividend. The company’s net profit was NOK 50 085 509.<br />
42<br />
Bergen, 29 March 2007<br />
The Board of <strong>TTS</strong> Marine <strong>ASA</strong><br />
The Board proposes the following allocation of <strong>TTS</strong> Marine <strong>ASA</strong>’s<br />
profit for <strong>2006</strong>:<br />
ALLOCATION OF PROFIT:<br />
Dividend NOK 22 492 904<br />
Allocated to other reserves NOK 27 592 605<br />
Total allocations NOK 50 085 509<br />
The Board of <strong>TTS</strong> Marine <strong>ASA</strong> proposes that a dividend of NOK 1<br />
per share is paid for the accounting year <strong>2006</strong>.<br />
Nils Olav Aardal Anne Breive<br />
CHAIRMAN DIRECTOR<br />
Hilde P. Aarseth Krøgenes John M. Lunde<br />
DIRECTOR DIRECTOR<br />
Olav Smeland Oddmund Hatletun<br />
DIRECTOR DIRECTOR<br />
Johannes D. Neteland<br />
PRESIDENT & CEO
Profit and loss account<br />
<strong>TTS</strong> GROUP<br />
1 JANUARY - 31 DECEMBER<br />
(AMOUNTS IN NOK 1000) IFRS IFRS IFRS<br />
<strong>2006</strong> 2005 2004<br />
OPERATING INCOME NOTES<br />
Income from projects 1 1 593 716 1 148 459 785 239<br />
Other operating income 10 314 1 372 935<br />
Total operating income 1 604 030 1 149 831 786 174<br />
OPERATING EXPENSES<br />
Cost of sales 1 111 369 771 519 502 353<br />
Personnel costs 4, 5 254 598 208 858 164 803<br />
Depreciation of tangible fixed assets 6, 7 8 916 7 564 6 066<br />
Other operating costs 18 138 872 101 304 74 989<br />
Losses on accounts receivable 577 952 1 907<br />
Total operating expenses 1 514 333 1 090 196 750 118<br />
Operating profit/loss 89 697 59 635 36 056<br />
FINANCIAL INCOME AND EXPENSES<br />
Income from investments in joint ventures 10 8 448 6 767 2 234<br />
Other interest income 22 3 405 2 314 2 269<br />
Other financial income 22 3 914 1 646 119<br />
Other interest expenses 22 15 391 9 633 7 436<br />
Other financial expenses 22 5 582 4 431 1 992<br />
Net financial items (5 206) (3 338) (4 805)<br />
Profit/loss before tax 84 492 56 297 31 251<br />
Tax 14 24 010 16 059 9 621<br />
Net profit for the year 60 481 40 239 21 630<br />
Earnings per share (NOK) 23 2.92 2.19 1.44<br />
Diluted earnings per share (NOK) 23 2.91 2.18 1.42<br />
43
4-10 <strong>TTS</strong> GROUP 11-13 REPORT FROM THE CEO 14-27 BUSINESS AREAS 28-37 CORPORATE GOVERNANCE 36-87 DIRECTOR’S REPORT AND ACCOUNTS<br />
Balance<br />
<strong>TTS</strong> GROUP<br />
ASSETS<br />
(AMOUNTS IN NOK 1000) IFRS IFRS<br />
31.12.06 31.12.05<br />
Fixed assets NOTES<br />
Deferred tax assets 14 35 538 30 546<br />
INTANGIBLE FIXED ASSETS<br />
Research and development 7 20 084 10 045<br />
Licences, patents, etc. 7 1 119 959<br />
Goodwill 7 307 780 301 956<br />
Total intangible fixed assets 328 983 312 961<br />
TANGIBLE FIXED ASSETS<br />
Land etc. 8 739 693<br />
Buildings 8 11 778 11 583<br />
Machinery and vehicles 8 6 819 7 347<br />
Furniture and office equipment 8 14 705 14 161<br />
Total tangible fixed assets 34 042 33 785<br />
FIXED ASSET INVESTMENTS<br />
Investments in joint ventures 10 36 701 30 999<br />
Loans to associated companies 26 5 456 1 639<br />
Investments in shares and units 8 13 550 13 550<br />
Other receivables 26 6 726 6 149<br />
Total fixed asset investments 62 433 52 337<br />
Total fixed assets 460 996 429 629<br />
Current assets<br />
Inventories 3 77 306 68 706<br />
Work in progress 3 11 844 3 745<br />
ACCOUNTS RECEIVABLE<br />
Receivables from customers 11 241 835 168 004<br />
Other receivables 47 128 46 185<br />
Accrued, non-invoiced production 2 455 225 288 480<br />
Financial derivatives 20 17 305 9 300<br />
Prepayments to suppliers 2 84 559 70 925<br />
Total receivables 846 051 582 894<br />
Bank deposits, cash in hand, etc. 15 236 934 97 811<br />
Total current assets 1 172 135 753 157<br />
Total assets 1 633 130 1 182 786<br />
44
EQUITY AND LIABILITIES<br />
(AMOUNTS IN NOK 1000) IFRS IFRS<br />
31.12.06 31.12.05<br />
EQUITY NOTES<br />
Share capital 16 11 246 10 058<br />
Company’s own shares 16 (3) (4)<br />
Share premium reserve 16 318 550 284 761<br />
Other equity 16 268 268 100 117<br />
Total equity 598 062 394 932<br />
LIABILITIES<br />
PROVISIONS FOR LIABILITIES AND CHARGES<br />
Pension obligations 5 2 171 3 437<br />
Deferred tax 14 19 609 15 276<br />
Total provisions for liabilities and charges 21 780 18 713<br />
OTHER LONG-TERM LIABILITIES<br />
Debt to financial institutions 12, 13 174 855 58 566<br />
Total other long-term liabilities 174 855 58 566<br />
CURRENT LIABILITIES<br />
Debt to credit institutions 13, 15 36 650 138 435<br />
Payables to suppliers 160 486 150 497<br />
Tax payable 14 8 215 10 297<br />
Unpaid government taxes 13 257 13 226<br />
Prepayments from customers 2 220 307 90 509<br />
Non-invoiced production costs, suppliers 2 203 120 140 562<br />
Financial derivatives 20 14 530 9 688<br />
Other current liabilities 17, 21 181 869 157 360<br />
Total current liabilities 838 434 710 574<br />
Total liabilities 1 035 069 787 854<br />
Total equity and liabilities 1 633 130 1 182 786<br />
Bergen, 29 March 2007<br />
The Board of <strong>TTS</strong> Marine <strong>ASA</strong><br />
Nils Olav Aardal Anne Breive Hilde P. Aarseth Krøgenes John M. Lunde<br />
CHAIRMAN DIRECTOR DIRECTOR DIRECTOR<br />
Olav Smedal Oddmund Hatletun Johannes D. Neteland<br />
DIRECTOR DIRECTOR PRESIDENT & CEO<br />
45
4-10 <strong>TTS</strong> GROUP 11-13 REPORT FROM THE CEO 14-27 BUSINESS AREAS 28-37 CORPORATE GOVERNANCE 36-87 DIRECTOR’S REPORT AND ACCOUNTS<br />
Consolidated equity statement<br />
<strong>TTS</strong> GROUP<br />
(IFRS)<br />
Share<br />
Share Own premium- Other<br />
(AMOUNTS IN NOK 1000) NOTES capital shares reserve equity Total<br />
Equity as of 1 January 2005 8 157 -14 193 010 59 755 260 908<br />
Company’s own shares 0 10 0 586 596<br />
New issue 16 1 901 0 94 384 0 96 285<br />
New issue expenses 16 0 0 -2 633 0 -2 633<br />
Currency differences 25 0 0 0 -463 -463<br />
Net profit for the year 0 0 0 40 239 40 239<br />
Equity as of 31 December 2005 10 058 -4 284 761 100 117 394 932<br />
Depreciation of share premium account 0 0 -100 000 100 000 0<br />
Company’s own share 0 1 0 627 628<br />
New issue 16 1 188 0 137 415 0 138 604<br />
New issue expenses 16 0 0 -4 604 0 -4 604<br />
Opsions cost 25 0 0 0 7 043 7 043<br />
Currency differences 16 0 0 978 0 978<br />
Net profit for the year 0 0 0 60 481 60 481<br />
Equity as of 31 December <strong>2006</strong> 11 246 -3 318 550 268 268 598 062<br />
46
Cash flow statement<br />
<strong>TTS</strong> GROUP<br />
1 JANUARY - 31 DECEMBER<br />
(AMOUNTS IN NOK 1000)<br />
<strong>2006</strong> 2005 2004<br />
Cash flow from operations<br />
Net profit for the year 84 492 56 297 31 251<br />
Tax paid during the period -26 751 -13 670 -8 991<br />
Depreciation 8 916 7 564 6 066<br />
Gains/losses on the sale of tangible fixed assets -351 -1 471 0<br />
Net change in project accruals 11 331 -135 344 -43 164<br />
Interest cost 15 391 9 633 7 436<br />
Profit attributable to associated companies -8 448 -6 767 -2 234<br />
Foreign currency gains/losses on loans -7 531 5 264 7 860<br />
Difference between pension charges and payments to/from pension schemes -1 266 -2 263 -1 102<br />
Inventories, customer receivables and payables to suppliers -79 895 83 339 27 468<br />
Other receivables and other short-term liabilities 5 043 -72 337 -17 480<br />
Net cash flow from operations 931 -69 755 7 110<br />
Cash flow from investments<br />
Acquisition of subsidiaries (less cash balances in subsidiaries) -3 109 -44 632 -22 715<br />
Receipts from sale of fixed assets 461 2 656 401<br />
Disbursements for acquisition of tangible fixed assets -7 715 -16 124 -37 719<br />
Acquisition of intangible fixed assets 0 -748 0<br />
Payments on other claims (loans) -577 -191 -81<br />
Dividends received 0 0 0<br />
Net cash flow from investments -10 940 -59 039 -60 114<br />
Cash flow from financing<br />
Receipts from new short-term/long-term debt 146 033 51 522 31 543<br />
Disbursements for repayment of short-term/long-term debt -14 383 -12 708 0<br />
Net change in bank overdraft -117 146 39 962 -10 264<br />
Paid-in equity 134 628 94 855 22 095<br />
Net cash flow from financing 149 132 173 631 43 374<br />
Net change in cash and cash equivalents 139 123 44 837 -9 630<br />
Cash and cash equivalents at the start of the period 97 811 52 974 62 604<br />
Cash and cash equivalents at the end of the period 236 934 97 811 52 974<br />
This consists of:<br />
Bank deposits etc. 236 934 97 811 52 974<br />
47
4-10 <strong>TTS</strong> GROUP 11-13 REPORT FROM THE CEO 14-27 BUSINESS AREAS 28-37 CORPORATE GOVERNANCE 36-87 DIRECTOR’S REPORT AND ACCOUNTS<br />
Consolidated Accounts<br />
<strong>TTS</strong> GROUP<br />
NOTES TO THE ACCOUNTS<br />
1. General information<br />
<strong>TTS</strong> Marine <strong>ASA</strong> (the company) and its subsidiaries (the entire group)<br />
are an international group that develops and delivers marine equipment.<br />
The operations are organised into the following divisions: Dry Cargo<br />
Handling, Marine Cranes, Port and Material Handling and Deck<br />
Machinery. <strong>TTS</strong> is the world’s second largest supplier in its market<br />
segments. <strong>TTS</strong> Marine <strong>ASA</strong> is registered and domiciled in Norway,<br />
and the head office is located in Bergen. The group has companies in<br />
Norway, Sweden, Germany, Finland, China, USA, the Czech Republic<br />
and Italy, as well as offices in Korea. The company is listed on the<br />
Oslo Stock Exchange. This consolidated accounts were approved by<br />
the Board on 29 March 2007.<br />
Structural changes<br />
<strong>TTS</strong> Marine <strong>ASA</strong> acquired 100 per cent of the shares in <strong>TTS</strong> Marine S.r.l<br />
in Genoa, Italy. The comparative figures have not been changed as<br />
a result of the acquistion. The company was acquired at a price of<br />
NOK 4 million, with a turnover in <strong>2006</strong> of NOK 5 million.<br />
2. Accounting principles<br />
The most important accounting principles applied in the preparation<br />
of the consolidated accounts are described below. These principles have<br />
been applied identically to all the periods that are presented unless<br />
otherwise stated in the description.<br />
2.1 Basic principles<br />
The consolidated accounts have been prepared in accordance with the<br />
International Financial Reporting Standard (IFRS) as stipulated by the<br />
EU. Voluntary standards and interpretations as of 31 December <strong>2006</strong><br />
have not been implemented.<br />
The figures for 2004 have been restated to comply with IFRS. This<br />
entails that the formal opening balance sheet in accordance with IFRS<br />
is as of 1 January 2004.<br />
The consolidated accounts have been prepared based on the historical<br />
cost principle, except: financial derivatives and financial assets and<br />
liabilities that are measured at fair value over the profit and loss<br />
account.<br />
The preparation of accounts in accordance with IFRS requires the use<br />
of estimates. In addition, the application of the company’s accounting<br />
principles requires that the management exercise judgement. Areas<br />
that contain a high degree of such discretionary assessments, or a high<br />
degree of complexity, or areas where the assumptions and estimates<br />
are of significance to the consolidated accounts are described in<br />
Article 4.<br />
Additionally other new standards and interpretations of <strong>2006</strong> has been<br />
evaluated but are not relevant for the group. This is changes in IAS 19,<br />
IAS 21, IAS 39, IFRS 6 and IFRIC 5, 6, 7, 8, 9, 10, 11 and 12.<br />
48<br />
2.2 Consolidation principles<br />
(A) SUBSIDIARIES<br />
Subsidiaries are all the units where the group has a controlling influence<br />
over the unit’s financial and operational strategy, normally through ownership<br />
of more than half of the voting capital. Subsidiaries are consolidated<br />
from the point in time when control is transferred to the group and eliminated<br />
from consolidation when such control ends.<br />
The purchase method of accounting is used for the acquisition of subsidiaries.<br />
The historical acquisition cost is measured as the fair value of the<br />
compensation. Identifiable assets acquired and liabilities assumed are<br />
recorded at fair value at the time of the acquisition in the accounts. The<br />
portion of the historical cost that exceeds the fair value of identifiable net<br />
assets in the subsidiary is recognised on the balance sheet as goodwill.<br />
All intragroup transactions, outstanding accounts and unrealised gains<br />
between group companies are eliminated. The accounting principles in<br />
subsidiaries are changed as required to achieve compliance with the<br />
group’s accounting principles.<br />
(B) JOINT VENTURES<br />
Joint ventures are units where the group has a controlling influence<br />
together with other parties, but not alone. Investments in joint ventures<br />
are recorded in the accounts in accordance with the equity method.<br />
Investments in joint ventures companies are recorded in the accounts at<br />
the historical cost at the time of acquisition and include goodwill (which<br />
is reduced by any subsequent write-downs) (see Article 2.6).<br />
The group’s share of the profit or loss in joint ventures is recognised<br />
in the profit and loss account and added to the book value of the<br />
investments together with the share of equity changes not recognised<br />
in the profit and loss account. The group does not recognise its share<br />
of the losses in the profit and loss account if this entails that the book<br />
value of the investment becomes negative (including unsecured claims<br />
against the unit), unless the group has assumed liabilities or granted<br />
guarantees for the associated company’s liabilities.<br />
The group’s share of unrealised gains on transactions between the<br />
group and its associated companies are eliminated. The same applies to<br />
unrealised losses unless the transaction indicates a write-down of the<br />
asset transferred. The accounting principles in subsidiaries have been<br />
changed as required to achieve compliance with the group’s accounting<br />
principles.<br />
2.3 Segment information<br />
A business segment is a portion of the business operations that delivers<br />
products or services that are subject to a risk and return that are distinct<br />
from that of other business areas. The group’s primary reporting<br />
format is business segment. A geographic market (segment) is a portion<br />
of the business operations that delivers products or services within a<br />
limited geographic area that are subject to a risk and return that are
distinct from that of other geographic markets. The secondary reporting<br />
segment is geographical segment.<br />
2.4 Foreign currency translation<br />
(A) FUNCTIONAL AND PRESENTATION CURRENCIES<br />
The accounts of the individual units in the group are measured in the<br />
currency that is used primarily in the economic area where the unit operates<br />
(functional currency). The consolidated accounts are presented in<br />
Norwegian kroner (NOK), which is both the functional and presentation<br />
currency for the parent company.<br />
(B) TRANSACTIONS AND BALANCE SHEET ITEMS<br />
Transactions involving foreign currencies are translated into the functional<br />
currency using the exchange rates that are in effect at the time of<br />
the transactions. Foreign currency gains and losses that arise from the<br />
payment of such transactions and the translation of monetary items<br />
(assets and liabilities) in foreign currencies at the rates in effect on the<br />
date of the balance sheet are recognised in the profit and loss account.<br />
(C) GROUP COMPANIES<br />
The profit and loss account and balance sheet for group units with<br />
a functional currency different than the presentation currency are<br />
translated as follows:<br />
i. balance sheet is translated at the closing rate on the date of<br />
the balance sheet<br />
ii. profit and loss account is translated at the average rate during<br />
the year<br />
iii. translation differences are entered directly against equity and<br />
specified separately<br />
Goodwill associated with the acquisition of a foreign unit are allocated<br />
to the acquired unit and translated at the rate in effect on the date of<br />
the balance sheet. This is for acquisitions from 2004 and later.<br />
2.5 Tangible fixed assets<br />
Tangible fixed assets are recorded in the accounts at historical cost less<br />
depreciation. The historical cost includes the costs directly related to<br />
the acquisition of the fixed asset.<br />
Subsequent expenses are added to the value of the fixed asset on the<br />
balance sheet or recorded separately on the balance sheet, when it is<br />
probable that the future economic benefits associated with the expense<br />
will accrue to the group and the expense can be measured reliably.<br />
Other repair and maintenance costs are recorded in the profit and loss<br />
account in the period when the expenses are incurred.<br />
Land is not depreciated. Other fixed assets are depreciated based on<br />
the straight-line method, so that the historical cost of the fixed asset is<br />
depreciated to the residual value over the expected time of use.<br />
Buildings 50 years<br />
Machinery and vehicles 3-5 years<br />
Fixtures/office equipment 5 years<br />
Computer equipment 3 years<br />
Depreciation is recognised on a separate line in the profit and loss<br />
account.<br />
When the book value of the fixed asset is higher than the estimated<br />
recoverable amount, the value is written down to the recoverable<br />
amount.<br />
Gains and losses on disposals are recognised in the profit and loss account<br />
and represent the difference between the sales price and book value.<br />
The need for deprecication is taken into continious evaluation.<br />
2.6 Intangible fixed assets<br />
(A) GOODWILL<br />
Goodwill is the difference between the historical cost of the acquisition<br />
of a business and the fair value of the group’s share of the net identifiable<br />
assets in the business at the time of the acquisition. Goodwill<br />
from the acquisition of subsidiaries is classified as an intangible fixed<br />
asset. Goodwill associated with the acquisition of an interest in joint<br />
ventures is included in the investments in joint ventures. Goodwill is<br />
tested annually for impairment in value and recorded on the balance<br />
sheet at historical cost less write-downs. The write-down of goodwill is<br />
not reversed.<br />
In assessing whether there is a need to write down goodwill, it is allocated<br />
to the relevant cash-generating units. This allocation is made to<br />
the cash-generating units or groups of cash-generating units that are<br />
expected to benefit from the acquisition.<br />
(B) PATENTS, TECHNOLOGY AND DEVELOPMENT<br />
Patents/technology have a limited useful life and are recorded at historical<br />
cost on the balance sheet less depreciation. Patents/technology are<br />
depreciated by the straight-line method over their expected useful life<br />
(0 to 5 years).<br />
Development costs associated with market surveys, market development<br />
and the development of new products are normally charged against<br />
operating income as they are incurred. Order-related development<br />
is charged directly to the projects. Projects that satisfy the requirements<br />
are recorded on the balance sheet, cf. Note 8. In such cases the development<br />
costs are depreciated over their expected useful life (0 to 5 years).<br />
Depreciation is recognised on a separate line in the profit and loss<br />
account.<br />
2.7 Financial assets<br />
The group classifies financial assets into the following categories:<br />
(a) loans and receivables<br />
(b) investments in shares (assets available for sale)<br />
This classification is dependent on the purpose of the asset. The<br />
management classifies financial assets when they are acquired and<br />
reassesses the classification on each reporting date.<br />
(A) LOANS AND OTHER RECEIVABLES<br />
Loans and receivables are classified as current assets unless they<br />
mature later than 12 months after the date of the balance sheet.<br />
In this case they are classified as fixed assets. Loans and other are<br />
assessed to nominal value reduced by a provision for bad debt.<br />
(B) INVESTMENTS IN SHARES (ASSETS AVAILABLE FOR SALE)<br />
Investments in shares are included in the fixed assets unless the<br />
management intends to sell the investment within 12 months from the<br />
date of the balance sheet.<br />
Investments are assessed at fair value on balance day. Possible changes<br />
in fair value are entered directly against equity.<br />
By possible sale are or written downs the entire value adjustment<br />
entered against equity is recognised in the profit and loss account as<br />
a gain or loss from investments in securities.<br />
49
4-10 <strong>TTS</strong> GROUP 11-13 REPORT FROM THE CEO 14-27 BUSINESS AREAS 28-37 CORPORATE GOVERNANCE 36-87 DIRECTOR’S REPORT AND ACCOUNTS<br />
2.8 Leases<br />
Leases of property, plant and equipment where the <strong>Group</strong> has substantially<br />
all the risks and rewards of ownership, are classified as finance<br />
leases. Finance leases are capitalized at the inception of the lease at<br />
the lower of the fair value of the leased property or the present value<br />
of the minimum lease payments. Lease payments are apportioned<br />
between the finance charges and reduction of the lease liability.<br />
Property, plant and equipment acquired under finance leases are<br />
depreciated over the shorter of the useful life of the asset or the lease<br />
term.<br />
Leases where a significant portion of the risks and rewards of ownership<br />
are retained by the lessor are classified as operating leases.<br />
Payment made under operating leases is charged to the income<br />
statement on a straight-line basis over the period of the lease.<br />
2.9 Derivatives and hedging<br />
According to approved instructions, derivatives are effected for income<br />
from delivery contracts when signing the contract. This is also current<br />
for some larger subcontracts. Derivatives are recorded on the balance<br />
sheet at fair value at the point in time when the derivative contract is<br />
entered into and then at fair value on an ongoing basis.<br />
The group only enters into derivates that qualifies for fair value hedging.<br />
At the start of the hedging transaction the group documents the<br />
relationship between the hedging instruments and hedging objects.<br />
The purpose of the risk management and strategy behind the various<br />
hedging transactions is assessed on an ongoing basis and laid down in<br />
the group’s strategy. The group also documents whether the derivatives<br />
that are used are effective in offsetting changes in the fair value or<br />
cash flows associated with the hedging objects.<br />
The fair value of derivatives used for hedging is specified in Note 22.<br />
Changes in the fair value of the derivatives are entered over the profit<br />
and loss account together with the change in the fair value related<br />
to associate with the respective hedged asset or liability.<br />
The results are booked as operating income when securing income of<br />
contracts, and as operating cost when securing cost of contracts.<br />
2.10 Inventories<br />
Inventories are valued at the lower of historical cost or net realisable<br />
value. The historical cost is calculated by means of the first-in, first-out<br />
principle (FIFO). For finished goods and work in progress, the historical<br />
cost consists of the product design expenses, consumption of materials,<br />
direct wage costs, other direct costs, and indirect production costs<br />
(based on a normal capacity level). Loan costs are not included.<br />
2.11 Receivables from customers<br />
Receivables from customers are recognised initially at fair value on the<br />
balance sheet, that is nominal value. For subsequent measurement<br />
receivables from customers are assessed at nominal value less provisions<br />
for losses that have incurred. Provisions for losses are recognised when<br />
there are objective indicators that the group will not receive settlement<br />
in accordance with the original terms. Changes in the provisions are<br />
recognised in the profit and loss account as losses on accounts receivable.<br />
Receivables in foreign currency are converted to NOK at the exchange<br />
rate on the balance sheet date.<br />
50<br />
2.12 Bank deposit and cash<br />
Bank deposits in foreign currency are converted to NOK at the exchange<br />
rate on the balance sheet date.<br />
2.13 Share capital and premium<br />
Ordinary shares are classified as equity.<br />
Expenses that are directly attributable to the issuance of new shares or<br />
options are entered against the equity as a reduction in the proceeds.<br />
When the company’s own shares are purchased, the consideration, is<br />
entered as a reduction of the equity (attributable to the company’s shareholders).<br />
If the company’s own shares are subsequently sold or reissued,<br />
the proceeds are entered as an increase in the equity attributable to the<br />
company’s shareholders.<br />
2.14 Loans<br />
Loans are recorded at their fair value when they are disbursed, less any<br />
transaction costs. In subsequent periods, loans are recorded at their<br />
amortised cost, as calculated by means of the effective interest rate.<br />
The difference between the loan amount disbursed (less transaction<br />
costs) and the redemption value are recognised in the profit and loss<br />
account over the term of the loan.<br />
Loans are classified as current liabilities unless there is an unconditional<br />
right to postpone payment of the debt by more than 12 months from<br />
the date of the balance sheet. The next years payment is classified as<br />
short term debt.<br />
2.15 Taxes<br />
Tax in the profit and loss account encompasses both the tax payable<br />
for the period and the change in deferred tax.<br />
Deferred tax is calculated for all the temporary differences between the<br />
financial and tax values of assets and liabilities and tax losses carry<br />
forward. Temporary differences are only offset for the Norwegian companies<br />
in the group. Deferred tax is determined by means of the tax<br />
rates and tax laws that have been adopted or essentially adopted on<br />
the date of the balance sheet, which are assumed to apply when the<br />
deferred tax asset is realised or when the deferred tax is settled.<br />
Deferred tax assets are recognised on the balance sheet provided future<br />
taxable income is probable and the temporary differences can be offset<br />
against this income.<br />
Deferred taxes are not calculated based on temporary differences from<br />
investments in subsidiaries and associated companies when the group<br />
controls the timing for the reversal of the temporary differences and it<br />
is probable that they will not be reversed in the foreseeable future.<br />
2.16 Pension obligations, bonus schemes and other<br />
compensation schemes for employees<br />
(C) PENSION OBLIGATIONS<br />
The companies in the group have different pension schemes. The pension<br />
schemes are financed in general by payments to insurance companies<br />
or pension funds, as determined by periodic actuarial calculations.<br />
The group has both defined contribution and defined benefit plans.<br />
A defined contribution plan is a pension scheme in which the group<br />
pays fixed contributions to a separate legal entity. The group does not<br />
have any legal or other obligation to pay additional contributions if this<br />
unit does not have sufficient funds to pay all employees benefits
elating to their service in current and prior periods. A defined benefit<br />
plan is a pension scheme that is not a defined contribution plan.<br />
For defined contribution plans, the group pays contributions to publicly<br />
or privately administered pension insurance plans on a mandatory,<br />
contractual or voluntary basis. The group does not have any further<br />
payment obligations after the contributions have been paid. The contributions<br />
are recorded as a payroll expense in the accounts as they<br />
fall due. Contributions paid in advance are recognised as an asset<br />
in the accounts if the contribution can be refunded or reduce future<br />
payments.<br />
A defined benefit plan is typically a pension scheme that defines the<br />
pension payments employees will receive when they retire. Pension<br />
payments are normally dependent on one or more factors such as age,<br />
years of service for the company and salary level.<br />
The liability recorded on the balance sheet relating to defined benefit<br />
plans is the net present value of the defined benefits on the date of<br />
the balance sheet less the fair value of the pension assets, adjusted for<br />
unrecognised estimate deviations and costs relating to pension benefits<br />
earned from prior periods. The pension obligation is calculated annually<br />
by an independent actuary on the basis of a linear model. The net<br />
present value of the defined benefits is determined by discounting the<br />
estimated future payments at the interest rate for a bond issued by<br />
a company with high creditworthiness in the same currency as the<br />
benefits will be paid with a term that is approximately the same as<br />
the term of the associated pension obligation.<br />
Estimate deviations due to new information or changes in the actuarial<br />
assumptions in excess of 10 per cent of the value of the pension<br />
assets or 10 per cent of the pension obligations will be recorded in<br />
the profit and loss account over a period that corresponds to the<br />
employees’ expected average remaining service lifetime.<br />
Changes in the pension plan’s benefits are entered as an expense or<br />
income on a current basis in the profit and loss account, unless the<br />
rights in accordance with the new pension plan are contingent on the<br />
employee remaining in service for a specified period of time (accrual<br />
period). In this case the cost related to the change in benefits is amortised<br />
linearly over the accrual period.<br />
The employer’s share of National Insurance contributions are charged<br />
against income based on the pension premiums paid, as well as the<br />
accrued change in the net pension obligation.<br />
(D) EMPLOYEE OPTIONS<br />
In accordance with authorities granted by the Annual General Meeting,<br />
the management of the company has been granted options to purchase<br />
shares in the parent company. The fair value of allotted options is<br />
calculated as part of the salary cost with a corresponding increase<br />
in equity. The fair value is measured on the date of allotment and<br />
distributed over the intervals till the employee has worked up an<br />
unconditional right to exercise the options. The option premium is<br />
estimated on the date of allotment using the Black & Sholes option<br />
pricing model. Ref. note 16<br />
(E) GROUP BONUSES<br />
The group records a liability and a cost for any group bonuses. Whether<br />
the bonus shall be calculated and paid and the size of the bonus is<br />
dependent on the profit for the year. The bonus is paid to all of the<br />
employees in the following year.<br />
2.17 Provisions<br />
The group recognises provisions for restructuring, legal requirements,<br />
etc., when there is a legal or self-imposed obligation to do so as a<br />
result of earlier events, there is a preponderance of evidence that the<br />
obligation will be settled by a transfer of economic resources, and the<br />
size of the obligation can be estimated with an adequate degree of<br />
reliability.<br />
The group recognises provisions for expected guarantee liabilities based<br />
on experience. Additionally the group recognises provisions for remaining<br />
work or claims from the customer regarding long-term construction<br />
contracts.<br />
2.18 Recognition of income<br />
Income from the sale of goods and services is assessed at the net fair<br />
value after the deduction of value added tax and possible rebates.<br />
The group’s income is related to long-term construction contracts,<br />
service contracts and after-sales.<br />
Income connected to long-term construction contacts is posted according<br />
to the degree of completion of each project; see further information<br />
under Article 2.19. The group’s products are often sold with a warranty<br />
period +/- 2 years. See also note 14.<br />
Income connected to service contracts and after-sales is recognised in<br />
the period it is accrued, i.e. when the risk and control has passed to the<br />
buyer. Intragroup income is eliminated.<br />
Interest income is recognised in the profit and loss account over time<br />
in accordance with the effective interest method.<br />
If receivables are written down, the book value of the receivables are<br />
reduced to the recoverable amount.<br />
2.19 Construction contracts<br />
Revenue from long-term manufacturing projects is allocated in step with<br />
the degree of progress of the project, if the outcome of the transaction<br />
can be estimated in a reiable manner. Progress is measured as accrued<br />
hours in comparison to total estimated hours, when relable estimates<br />
are available. When the outcome of the transaction cannot be reliably<br />
estimated, only the revenue corresponding to accrued project costs will<br />
be entered as income. In the period where it is identified that a project<br />
will give a negative outcome, the estimated deficit on the contract will<br />
be fully allocated.<br />
Costs relating to manufacturing projects are allocated in step with the<br />
degree of progress on a level with the revenue. In the event that a major<br />
discrepancy between what is considered as actual progress and budgeted<br />
costs based on calculated degree of completion, the degree of competition<br />
will be adjusted so that it to a greater extent will correspond to the<br />
actual progress of the manufacturing project.<br />
Upon establishing accrued costs for manufacturing contracts, purchasing<br />
relating to future activities of a contract will not be taken into account.<br />
The purchases/costs are posted as goods, advance payments or other<br />
liquid assets depending of type of costs.<br />
Incurred costs and income received related to all construction contracts<br />
in progress, where the incurred costs and income recognised (less<br />
recognised losses) exceed the payments on account invoiced, will be<br />
recorded on the balance sheet as an asset. The asset is classified as<br />
accrued, non-invoiced production.<br />
51
4-10 <strong>TTS</strong> GROUP 11-13 REPORT FROM THE CEO 14-27 BUSINESS AREAS 28-37 CORPORATE GOVERNANCE 36-87 DIRECTOR’S REPORT AND ACCOUNTS<br />
If the payments on account invoiced for all the construction contracts in<br />
progress exceed the incurred costs and income recognised (less losses)<br />
this is presented as prepayments received from customers under<br />
Prepayments from customers.<br />
2.20 Cash flow statement<br />
The cash flow statement has been prepared based on the indirect<br />
method.<br />
3. Financial risk management<br />
The group’s activities entail different types of financial risk, market risk<br />
(including foreign currency risk, fair value interest risk and price risk),<br />
credit risk, liquidity risk and floating interest rate risk. The group’s overall<br />
risk management plan focuses on the unpredictability of the capital<br />
markets and attempts to minimise the potential negative effects on the<br />
group’s financial results. The group uses financial derivatives to hedge<br />
against certain risks.<br />
The group has a decentralised structure with operative follow-up in the<br />
various business units, in which the guidelines for overall management<br />
of financial risk are adopted by the Board. This applies to areas such<br />
as foreign currency risk, interest rate risk, credit risk and the use of<br />
financial derivatives.<br />
(A) FOREIGN CURRENCY RISK<br />
The foreign currency risk is related essentially to supply contracts that<br />
entail income and costs in a foreign currency. When a contract is<br />
signed currency shall be sold or purchased forward to reduce the foreign<br />
currency risk in cash flows denominated in foreign currencies in<br />
accordance with the guidelines. In a production process based on<br />
the use of an international network of subcontractors, purchases can<br />
also be optimised with regard to the foreign currency situation.<br />
(B) INTEREST RATE RISK<br />
The group’s interest-bearing debt is based on a floating interest rate.<br />
Any deviation from this shall be approved by the Board. The group’s<br />
financial items are invested in bank deposits and not in liquid papers<br />
unless this has been approved by the Board.<br />
(C) CREDIT RISK<br />
The credit risk due to commercial contracts is managed by the various<br />
business units.<br />
4. Important accounting estimates and discretionary<br />
assessments<br />
Estimates and discretionary assessments are assessed continuously and<br />
based on historical experience and other factors, including expectations<br />
of future events that are regarded as probable under the current circumstances.<br />
The group prepares estimates and makes assumptions concerning the<br />
future. The accounting estimates that are made as a result of this will<br />
rarely coincide in full with the final outcome. Estimates and assumptions/prerequisites<br />
that represent a significant risk of major changes in<br />
the book value of assets and liabilities during the next financial year<br />
are discussed below.<br />
52<br />
(A) ESTIMATED IMPAIRMENT IN VALUE OF GOODWILL<br />
The group performs annual tests to assess whether the value of goodwill<br />
is impaired, cf. Article 2.6. The recoverable amount from cashgenerating<br />
units is determined by calculation of the utility value. These<br />
calculations require the use of estimates (Note 7).<br />
(B) FAIR VALUE OF SHARES<br />
The fair value of shares that are not traded in an active market (such<br />
as unlisted derivatives) is determined by means of various valuation<br />
methods. The group assesses and selects the methods and prerequisites<br />
that are based primarily on the market conditions on the date of the<br />
balance sheet.<br />
(C) CLAIMS AND SUPPLEMENTARY WORK OF CONSTRUCTION<br />
CONTRACTS<br />
The group recognizes provisions regarding claims from customers in<br />
connection with delivery of construction contracts and possible supplementary<br />
work due to proved weakness in the delivery of product. The<br />
management estimates the determination of the value of the allocation.<br />
(D) RECOGNITION OF INCOME<br />
Income from the sale of good/services is recognised in accordance with<br />
the percentage of completion method. This method requires that the<br />
group make discretionary assessments concerning what percentage of<br />
the total goods/services have been delivered on the date of the balance<br />
sheet.<br />
(E) WARRANTY LIABILITY<br />
The group offers a warranty period of +/- 2 years on its deliveries. The<br />
management estimates provisions for future warranty liabilities based<br />
on information on historical warranty claims, together with information<br />
that indicates that the information on earlier expenses may be different<br />
from future liabilities. Factors that can influence the estimated liabilities<br />
include the outcome of productivity and quality initiatives, as well as<br />
the price of spare parts and labour costs.
4-10 <strong>TTS</strong> GROUP 11-13 REPORT FROM THE CEO 14-27 BUSINESS AREAS 28-37 CORPORATE GOVERNANCE 36-87 DIRECTOR’S REPORT AND ACCOUNTS<br />
Notes<br />
<strong>TTS</strong> GROUP<br />
Note 1 Segment information<br />
(AMOUNTS IN NOK 1000)<br />
PRIMARY REPORTING FORMAT – BUSINESS SEGMENTS<br />
The <strong>TTS</strong> Marine <strong>ASA</strong> <strong>Group</strong> is divided into four strategic business units that are organised and<br />
managed separately. The various business segments sell various products aimed at different<br />
customer groups with different risk profiles.<br />
The group is divided into the following business segments:<br />
DCH: Dry Cargo Handling<br />
MC: Marine Cranes<br />
PMH: Port and Material Handling<br />
DM: Deck Machinery<br />
Others: Corporate and others<br />
KEY PROFIT FIGURES<br />
MC DCH PMH DM Others Total<br />
<strong>2006</strong> 2005 <strong>2006</strong> 2005 <strong>2006</strong> 2005 <strong>2006</strong> 2005 <strong>2006</strong> 2005 <strong>2006</strong> 2005<br />
Turnover 439 668 308 792 728 200 649 194 178 760 140 731 257 402 50374 0 559 1 604 030 1 149 831<br />
Earnings before depreciation 13 485 189 80 286 61 437 12 637 7 030 -4 633 2 496 -3 162 -3 953 98 613 67 199<br />
Depreciation -4 438 -4 010 -2 139 -1 968 -709 -860 -1 539 -331 -92 -395 -8 916 -7 564<br />
Operating profit/loss 9 047 -3 821 78 147 59 469 11 928 6 170 -6 172 2 165 -3 254 -4 348 89 697 59 635<br />
Income form joint ventures -458 -772 9 693 7 084 0 0 -787 455 0 0 8 448 6 767<br />
Net financial items -11 338 -8 044 306 1 698 -1 398 -2876 -1092 -590 -131 -293 -13 653 -10 105<br />
Pre-tax profit/loss -2 749 -12 637 88 146 68 251 10 530 3 294 -8 051 2 030 -3 385 -4 641 84 492 56 297<br />
SEGMENT LIABILITIES AND ASSETS AS OF 31 DECEMBER AND INVESTMENT EXPENSES:<br />
MC DCH PMH DM Others Total<br />
<strong>2006</strong> 2005 <strong>2006</strong> 2005 <strong>2006</strong> 2005 <strong>2006</strong> 2005 <strong>2006</strong> 2005 <strong>2006</strong> 2005<br />
Assets 727 373 558 176 580 043 392 522 158 012 104 898 125 652 90 670 5 350 5 520 1 596 429 1 151 787<br />
Associated companies 7 631 8 454 23 910 16 428 0 0 5 160 6 118 0 0 36 701 30 999<br />
Total assets 735 004 566 630 603 953 408 950 158 012 104 898 130 812 96 858 5 350 5 520 1 633 130 1 182 786<br />
Liabilities 329 162 305 816 467 971 318 403 115 032 79 076 117 934 79 399 4 970 5 159 1 035 069 787 854<br />
Investment expenses 5 114 52 574 6 082 3 154 9 190 1 648 2 314 11 421 0 0 22 700 68 797<br />
Intragroup transactions are eliminated within the individual segments.<br />
Transactions and transfers between the various segments are at normal terms that would have been the same between independent parties.<br />
SECONDARY REPORTING FORMAT – GEOGRAPHICAL SEGMENTS<br />
The group’s activities are distributed primarily in the following regions:<br />
Scandinavia<br />
Rest of Europe<br />
Asia<br />
Rest of World<br />
Sales revenues <strong>2006</strong> 2005<br />
Scandinavia 119 030 135 260<br />
Rest of Europe 855 835 576 479<br />
Asia 562 670 370 664<br />
Rest of World 66 496 67 428<br />
1 604 030 1 149 831<br />
Sales are allocated based on the customer’s home country.<br />
Segment assets <strong>2006</strong> 2005<br />
Scandinavia 1 095 556 792 913<br />
Rest of Europe 493 066 357 309<br />
Asia 41 957 31 221<br />
Rest of World 2 552 1 343<br />
1 633 130 1 182 786<br />
Assets are based on where the assets are located.<br />
Investment expenses <strong>2006</strong> 2005<br />
Scandinavia 14 658 55 746<br />
Rest of Europe 7 208 13 041<br />
Asia 827 0<br />
Rest of World 7 10<br />
22 700 68 797<br />
Investment expenses are based on where the assets are located.<br />
53
4-10 <strong>TTS</strong> GROUP 11-13 REPORT FROM THE CEO 14-27 BUSINESS AREAS 28-37 CORPORATE GOVERNANCE 36-87 DIRECTOR’S REPORT AND ACCOUNTS<br />
Note 2 Construction contracts<br />
(AMOUNTS IN NOK 1000)<br />
<strong>2006</strong> 2005<br />
Income based on contracts 1 593 716 1 148 459<br />
Items on the balance sheet related to construction contracts<br />
Current assets<br />
Completed production 775 620 522 899<br />
Invoiced production 320 395 234 420<br />
Accrued, non-invoiced production 455 225 288 479<br />
Prepayments to suppliers 84 559 70 925<br />
Total current assets 539 784 359 404<br />
Current liabilities<br />
Completed production 275 020 181 314<br />
Invoiced production 495 327 271 825<br />
Prepayments from customers -220 307 -90 511<br />
Non-invoiced production cost, suppliers -203 120 -140 562<br />
Total current liabilities -423 426 -231 073<br />
Note 3 Inventories<br />
(AMOUNTS IN NOK 1000)<br />
<strong>2006</strong> 2005<br />
Inventories (gross) 85 743 76 300<br />
Non-current iventories -8 437 -7 595<br />
Total inventories 77 306 68 705<br />
Work in progress 11 844 3 745<br />
Book value of inventories pledged as security for liabilities 26 223 25 870<br />
Note 4 Payroll expenses, number of employees, other remunerations, loans to employees, etc.<br />
(AMOUNTS IN NOK 1000)<br />
Payroll expenses <strong>2006</strong> 2005 2004<br />
Salaries 194 782 156 145 124 108<br />
Employer’s social security contributione 28 615 25 970 21 329<br />
Defined benefit pension costs 5 003 4 354 3 723<br />
Defined contribution pension costs 17 268 10 778 8 704<br />
Other benefits 8 930 11 610 6 939<br />
Total payroll expenses 254 598 208 857 164 803<br />
Number of employees as of 31 December 521 459 347<br />
Number of employees in the group increased by 62 from 2005 to <strong>2006</strong>. The acquisition of new companies increased the number of employees by 1.<br />
Remuneration to board members <strong>2006</strong><br />
Nils Aardal (Board Chairman from 30.05.06) 268<br />
Einar Pedersen (Board Chairman to 30.05.06) 129<br />
Anne Breive 170<br />
Hilde P. AA. Krøgenes 170<br />
John M. Lunde 170<br />
Olav Smeland (from August <strong>2006</strong>) 21<br />
Mona L. Tellnes Halvorsen (to August <strong>2006</strong>) 47<br />
Oddmund Hatletun 50<br />
Nomination committee remuneration<br />
<strong>TTS</strong>’s nominations committee comprises the following members: Bjørn Olafsson (Chairman), Bjørn Sjaastad and Harald Espedal.<br />
Proposed remuneration <strong>2006</strong> is TNOK 30. for the chairman and TNOK 20 to members, a total of TNOK 70.<br />
54
STATEMENT REGARDING THE STIPULATION OF REMUNERATION AND OTHER BENEFITS FOR THE PRESIDENT & CEO AND OTHER EXECUTIVES<br />
The remuneration policy of <strong>TTS</strong> Marina <strong>ASA</strong> is based on offering the group management competitive conditions.<br />
The level of remuneration shall reflect that the company is a listed company focusing internationally.<br />
The annual remuneration is based on the group management taking part in the company’s results, and in the added value for the shareholders<br />
through increased company value.<br />
Remuneration consists of three main components; base salary, bonus and a share option program.<br />
Bonus is determined on the basis of target results. In certain circumstances where change and development are of a decisive nature, the bonus<br />
is further based on specific development targets. Bonus targets are revisited annually.<br />
The maximum bonus is one year’s base salary for the President & CEO, and up to 50 percent for other executives.<br />
Since 1998, a share option program has been active for the group management of <strong>TTS</strong>; the goal being that the group management shall have<br />
the same incentive as the shareholders in respect of increasing company value over time. The Annual General Meeting has each year given<br />
the Board authority to establish share option programs with a two year term. Redemption price equals market price on allotment.<br />
First exercise is 50 percent after one year. Thereafter 12.5 percent per quarter, in addition to share options that have not been previously exercised.<br />
Share options may not be exercised subsequent to the second anniversary.<br />
The group pension scheme in Norway is based on approximately 65 percent of base salary at the age of 67, limited to a maximum of 12G.<br />
For employees abroad, the schemes prevailing in the respective companies where they are employed apply<br />
The period of notice is 6 months with a severance pay from 6 to 24 months, period of notice inclusive.<br />
The share option program is conditional upon the Annual General Meeting’s approval, based on the Board being granted authority to make such<br />
allotments. The President & CEO’s remuneration is determined by the Board of <strong>TTS</strong> Marine <strong>ASA</strong>.<br />
With respect to other executives, their remuneration is determined by the boards of the respective subsidiaries / President & CEO.<br />
REMUNERATION AND OTHER BENEFITS FOR THE PRESIDENT & CEO AND OTHER EXECUTIVES<br />
Name Position Remuneration Other Bonus Share- Pension<br />
benefits paid options Total benefits<br />
Johannes D. Neteland President & CEO 1 456 151 680 2 341 4 627 632<br />
Olav Bruåsdal Financial Director 984 17 191 936 2 128 247<br />
Ivar K. Hanson Man. Director MC 1 095 107 160 936 2 298 62<br />
Hans-Jan Erstad Manager HR-IT-QA 641 102 4 936 1 683 119<br />
Göran K. Johansson Man. Director PMH 1 395 14 581 936 2 927 482<br />
Stellan Bernsro Man. Director DCH 922 15 0 0 937 275<br />
Edgar Bethmann Man. Director DM 1 186 142 0 0 1 328 121<br />
Remuneration Taxable remuneration<br />
Other benefits Free car, life insurance, telephone, newspapers etc.<br />
Bonus paid Bonus paid in current year<br />
Share options Difference between market price and exercise price<br />
Total Total taxable remuneration<br />
The pension premium for the President & CEO is based on pension payments of approximately 65 percent of his base salary from the age of 67,<br />
for the CFO approximately 65 percent of a maximum of 12G. In addition, an early retirement scheme from the age of 60 that pays approximately<br />
60 percent of base salary is established. With effect from 2007, the group pension scheme will be based on approximately 65 percent of base salary<br />
at the age of 67, limited to a maximum of 12G. Additional pension benefits will be adjusted similar to other benefits.<br />
The period of notice for the President & CEO is 6 months, with a severance pay of 24 months, period of notice inclusive, and from 6 to 24 months<br />
for other group executives.<br />
AUDITOR FEES<br />
<strong>2006</strong> 2005<br />
Statutory auditing 1 871 1 778<br />
Other assistance including tax consulting 693 480<br />
Total 2 564 2 258<br />
Other assistance in <strong>2006</strong> includes TNOK 385 to Due Diligence that was interupted.<br />
55
4-10 <strong>TTS</strong> GROUP 11-13 REPORT FROM THE CEO 14-27 BUSINESS AREAS 28-37 CORPORATE GOVERNANCE 36-87 DIRECTOR’S REPORT AND ACCOUNTS<br />
Note 5 Pensions<br />
(AMOUNTS IN NOK 1000)<br />
The Norwegian companies in the group have defined benefit pension schemes that entitle the employees to defined future pension benefits dependent<br />
on the number of years of service, salary level, retirement age and National Insurance benefits received. The pension scheme includes 168 persons as<br />
of 31 December <strong>2006</strong>. The group’s obligations are covered primarily by an insurance company.<br />
The companies outside Norway have pension plans according to local practice and legislation. These are not defined benefits plans, and not entered into<br />
the balance sheet.<br />
The net pension obligations based on the assumptions as of 31 December <strong>2006</strong> recorded on the balance sheet are determined as follows:<br />
<strong>2006</strong> 2005<br />
Insured Uninsured Total Insured Uninsured Total<br />
Market value of pension funds 44 994 0 44 994 43 613 0 43 613<br />
- Net present value of accrued pension obligations -50 872 -1692 -52 564 -50 654 -1 112 -51 765<br />
+ Unrecognised estimate changes and deviations 5 279 222 5 501 5 337 82 5 419<br />
- Accrued employer’s share of NI contributions 0 103 103 558 145 703<br />
= Net pension obligation -599 -1 573 -2 171 -2 262 -1 175 -3 436<br />
Net pension costs are determined as follows: <strong>2006</strong> 2005<br />
Insured Uninsured Total Insured Uninsured Total<br />
Net present value of current year’s<br />
pension benefits accrued 3 861 240 4 101 3 649 218 3 867<br />
+ Interest payable on pension obligations 2 403 56 2 459 2 415 41 2 456<br />
- Expected return on pension funds -2 623 0 -2 623 -2 519 0 -2 519<br />
+ Recognised estimate changes and deviations 963 0 963 450 1 451<br />
+ Change in employer’s share of NI contributions 79 24 103 77 22 99<br />
= Total costs, including payroll expenses 4 683 320 5 003 4 072 282 4 354<br />
Change in book value of funds: <strong>2006</strong> 2005<br />
Book value as of 1 January -3 436 -5 701<br />
- Costs recognised during the year (see above) 5 003 4 354<br />
+/- Pension payments and payment of pension premiums 6 267 6 618<br />
= Book value as of 31 December. -2 171 -3 437<br />
The following economic assumptions have been made for<br />
calculation of the pension obligations: <strong>2006</strong> 2005<br />
31.12. 1.1. 31.12. 1.1.<br />
Return on pension funds 5.40 % 5.50 % 5.50 % 6.00 %<br />
Discount rate 4.35 % 4.50 % 4.50 % 5.00 %<br />
Annual wage inflation 4.50 % 3.00 % 3.00 % 3.00 %<br />
Annual adjustment of the basic National Insurance amount (G) 4.25 % 2.00 % 2.00 % 2.00 %<br />
Annual adjustment of pensions being paid out 1.65 % 2.00 % 2.00 % 2.00 %<br />
Voluntary retirement 10.00 % 10.00 % 10.00 % 10.00 %<br />
Withdrawal tendency for early retirement (AFP) 45.00 % 45.00 % 45.00 % 45.00 %<br />
Employer’s share of National Insurance contributions 14.10 % 14.10 % 14.10 % 14.10 %<br />
56
Note 6 Tangible fixed assets<br />
(AMOUNTS IN NOK 1000)<br />
Machinery<br />
Furniture<br />
and office Computer<br />
Land Buildings and vehicles equipment equipment Total<br />
AS OF 1 JANUARY 2005<br />
Historical cost as of 1 January 180 4 582 19 888 7 086 25 886 57 622<br />
Accumulated depreciation as of 1 January 0 -1 194 -14 981 -5 519 -21 143 -42 837<br />
Book value as of 1 January 180 3 388 4 907 1 567 4 743 14 785<br />
2005 FINANCIAL YEAR<br />
Book value as of 1 January 180 3 388 4 907 1 567 4 743 14 785<br />
Exchange differences 0 0 -674 935 498 759<br />
Additions during the year 513 8 431 4 979 916 12 272 27 111<br />
Disposals during the year 0 0 -544 -500 -857 -1 901<br />
Depreciation for the year 0 -235 -1 321 -786 -4 625 -6 967<br />
Book value as of 31 December 693 11 584 7 347 2 132 12 031 33 787<br />
AS OF 31 DECEMBER 2005<br />
Historical cost as of 31 December 693 13 013 23 649 8 437 37 799 83 591<br />
Accumulated depreciation as of 31 December 0 -1 429 -16 302 -6 305 -25 768 -49 804<br />
Book value as of 31 December 693 11 584 7 347 2 132 12 031 33 787<br />
<strong>2006</strong> FINANCIAL YEAR<br />
Book value as of 1 January 693 11 584 7 347 2 132 12 031 33 787<br />
Exchange differences 46 -594 -431 500 1 580 1 101<br />
Additions during the year 0 1 404 2 623 970 3 043 8 040<br />
Disposals during the year 0 0 -210 0 -263 -473<br />
Depreciation for the year 0 -616 -2 509 -521 -4 768 -8 414<br />
Book value as of 31 December 739 11 778 6 819 3 081 11 624 34 042<br />
AS OF 31 DECEMBER <strong>2006</strong><br />
Historical cost as of 1 January 739 13 823 25 630 9 907 42 160 92 260<br />
Accumulated depreciation as of 1 January 0 -2 045 -18 811 -6 826 -30 536 -58 218<br />
Book value as of 1 January 739 11 778 6 819 3 081 11 624 34 042<br />
Property in the Norwegian companies has been pledged as security for long-term and short-term debt to credit institutions, see Note 13.<br />
PART OF FIXED ASSETS THAT ARE LEASED:<br />
Machinery<br />
Furniture<br />
and office<br />
and vehicles equipment<br />
2005 FINANCIAL YEAR<br />
Book value as of 1 January 900 9 800<br />
Depreciation for the year -100 -2 800<br />
Book value as of 31 December 800 7 000<br />
<strong>2006</strong> FINANCIAL YEAR<br />
Book value as of 1 January 800 7 000<br />
Depreciation for the year -100 -2 800<br />
Book value as of 31 December 700 4 200<br />
57
4-10 <strong>TTS</strong> GROUP 11-13 REPORT FROM THE CEO 14-27 BUSINESS AREAS 28-37 CORPORATE GOVERNANCE 36-87 DIRECTOR’S REPORT AND ACCOUNTS<br />
Note 7 Intangible fixed assets<br />
(AMOUNTS IN NOK 1000)<br />
R&D, Patents,<br />
Licences 1) Goodwill 2) Sum<br />
AS OF 1 JANUARY 2005<br />
Historical cost as of 1 January 13 791 285 133 298 924<br />
Accumulated depreciation as of 1 January -4 390 -22 081 -26 471<br />
Book value as of 1 January 9 401 263 052 272 453<br />
2005 FINANCIAL YEAR<br />
Book value as of 1 January 9 401 263 052 272 453<br />
Exchange differences -548 2 283 1 735<br />
Additions during the year - developed by the companies 2 748 0 2 748<br />
Acquisition of subsidiaries 0 36 621 36 621<br />
Disposals during the year 0 0 0<br />
Depreciation for the year -597 0 -597<br />
Book value as of 31 December 11 004 301 956 312 960<br />
AS OF 31 DECEMBER 2005<br />
Historical cost as of 31 December 15 991 324 037 340 028<br />
Accumulated depreciation as of 31 December -4 987 -22 081 -27 068<br />
Book value as of 31 December 11 004 301 956 312 960<br />
<strong>2006</strong> FINANCIAL YEAR<br />
Book value as of 1 January 11 004 301 956 312 960<br />
Exchange differences -922 2 819 1 897<br />
Additions during the year - developed by the companies 11 623 0 11 623<br />
Acquisition of subsidiaries 3) 0 3 004 3 004<br />
Disposals during the year 0 0 0<br />
Depreciation for the year -503 0 -503<br />
Book value as of 31 December 21 203 307 780 328 983<br />
AS OF 31 DECEMBER <strong>2006</strong><br />
Historical cost as of 1 January 26 692 329 861 356 554<br />
Accumulated depreciation as of 1 January -5 490 -22 081 -27 571<br />
Book value as of 1 January 21 203 307 780 328 983<br />
1) BOOKED VALUTE R&D, PATENTS AND LICENCES AS OF 31 DECEMBER <strong>2006</strong>:<br />
Technology for Container Terminals 5 000<br />
EU project, development of a Terminal System 9 763<br />
Development costs in BoHai, China 4 530<br />
Others 1 910<br />
Total 21 203<br />
58<br />
Item consists of: The development project, Technology for Container Terminals, represents a new business area with a potential for long-term commerical<br />
value. The project costs of NOK 5 000 000 have been capitalised in an amount corresponding to the Norwegian Industrial and Regional Development<br />
Fund (SND) risk loan linked to this project. If the project does not generate any commercially feasible results, the loan can be forgiven, and the profit and<br />
loss account or balance sheet will not be affected as a result of this at the time of the decision. See further information i note 8. <strong>TTS</strong> Ships Equipment AB<br />
has capitalised TNOK 9 763 related to development of a ”Terminal System”. <strong>TTS</strong> Marine <strong>ASA</strong> has capitalised TNOK 4 530 related to development costs<br />
concerning activity in China.<br />
2) A SUMMARY OF THE GOODWILL ALLOCATION AT THE SEGMENT LEVEL IS AS FOLLOWS:<br />
<strong>2006</strong> 2005<br />
MC DCH PMH Others DM Total MC DCH PMH Others DM Total<br />
Scandinavia 24 292 156 424 3 718 0 0 184 434 24 293 156 424 3 470 0 0 184 187<br />
Rest of Europe 28 339 22 819 35 423 34 712 0 121 293 28 340 20 530 33 822 33 646 0 116 338<br />
Asia 2 053 0 0 0 0 2 053 2 053 0 0 0 0 2 053<br />
Rest of world 0 0 0 0 0 0 0 0 0 0 0 0<br />
Sum 54 684 179 243 39 141 34 712 0 307 780 54 686 176 954 37 292 33 646 0 302 578<br />
ASSESSMENT OF WRITE-DOWN REQUIREMENTS:<br />
<strong>TTS</strong> has defined four cash-generating units that are in accordance with the definition of the company’s divisions. The value of various cash-generating<br />
units has been assessed as of 31 December <strong>2006</strong>, and no grounds have been identified for the write-down of goodwill in any of the units.<br />
The testing of value in the divisions is based on the utilitarian value and discounted cash flows based on the budget and forecasts for the years 2007<br />
to 2008. <strong>TTS</strong> has a good level of orders in hand and expected growth in the aforementioned period. The discount rate is 10 per cent before tax.<br />
The terminal value is based on the same discount rate with a growth rate equal to inflation.<br />
3) ACQUISTION OF SUBSIDIARIES<br />
The company was acquired at a price of NOK 4 million, with a turnover in <strong>2006</strong> of NOK 5 million.
Note 8 Shares in other companies<br />
(AMOUNTS IN NOK 1000)<br />
Ownership Historical Book<br />
interest cost value<br />
FIXED ASSETS<br />
Shin Young Heavy industry 13.4 % 222 222<br />
FastShip Inc.* 6.7 % 13 326 13 326<br />
Other 2 2<br />
Total shares in other companies 13 550 13 550<br />
Shares in other companies are defined as available-for-sale.<br />
*) In the balance sheet as of 31 December the company has recorded 615 156 shares in FastShip Inc (FSI) at a book value of NOK 13.3 million.<br />
In addition, three convertible loans have been recorded at NOK 5.8 million, which corresponds to 408 257 shares. Shares and convertible loans<br />
have been recorded at USD 2.8 and USD 2.04 per share, respectively, which corresponds to an average of USD 2.5 per share. <strong>TTS</strong> has been involved<br />
in the FastShip project since 1996. Provided the project is realised, <strong>TTS</strong> will through patented technology get contracts of a total value over<br />
MNOK 1.000. If the FSI project is not realised, and <strong>TTS</strong> must write off NOK 19.2 million, the equity will be reduced with the total amount.<br />
The write off will not affect the liquidity. See also the discussion in the Directors’ Report.<br />
Note 9 Subsidiaries<br />
(AMOUNTS IN NOK 1000)<br />
The following subsidiaries are included in the consolidated accounts:<br />
<strong>TTS</strong> MARINE <strong>ASA</strong><br />
Acquisition Ownership Voting<br />
Subsidiaries Registered office date interest share<br />
<strong>TTS</strong> Handling Systems AS Drøbak, Norway 1994 100 % 100 %<br />
<strong>TTS</strong> Ships Equipment AS Bergen, Norway 1996 100 % 100 %<br />
Norlift AS Bergen, Norway 1994 100 % 100 %<br />
Hydralift Marine AS Kristiansand, Norway 2003 100 % 100 %<br />
<strong>TTS</strong> Ships Equipment AB Gothenburg, Sweden 2002 100 % 100 %<br />
<strong>TTS</strong> Marine Shanghai Co Ltd Shanghai, China 2002 100 % 100 %<br />
<strong>TTS</strong> Marine Cranes AS Bergen, Norway <strong>2006</strong> 100 % 100 %<br />
Associated company<br />
<strong>TTS</strong> BoHai Machinery Co., Ltd Dalian, China 2005 50 % 50 %<br />
<strong>TTS</strong> SHIPS EQUIPMENT AB HAS THE FOLLOWING INVESTMENTS:<br />
<strong>TTS</strong> Ships Equipment GmbH Bremen, Germany 1997 100 % 100 %<br />
<strong>TTS</strong> Marine Inc. Virginia, USA 1994 100 % 100 %<br />
<strong>TTS</strong> Hua Hai AB* Gothenburg, Sweden 2002 100 % 100 %<br />
<strong>TTS</strong> Liftec Oy Tampere, Finland 2004 100 % 100 %<br />
<strong>TTS</strong> Port Equipment AB Gothenburg, Sweden 2005 100 % 100 %<br />
<strong>TTS</strong> Marine S.r.l Genoa, Italy <strong>2006</strong> 100 % 100 %<br />
Associated company<br />
<strong>TTS</strong> Hua Hai Ships Equipment Co Ltd Shanghai, China 2002 50 % 50 %<br />
<strong>TTS</strong> SHIPS EQUIPMENT GMBH HAS THE FOLLOWING INVESTMENTS:<br />
<strong>TTS</strong>-LMG Marine Cranes GmbH Lübeck, Germany 2004 100 % 100 %<br />
<strong>TTS</strong> Kocks GmbH Bremen, Germany 2005 100 % 100 %<br />
<strong>TTS</strong> KOCKS GMBH HAS THE FOLLOWING INVESTMENTS:<br />
<strong>TTS</strong> Kocks Ostrava s.r.o Ostrava, Czech Republic 2005 100 % 100 %<br />
Associated company<br />
<strong>TTS</strong> Kocks GmbH Korea Co. Ltd Korea 2005 50 % 50 %<br />
Companies are accounted for in accordance with the equity method.<br />
*) The subsidiary <strong>TTS</strong> Hua Hai AB is not consolidated while it is an integrated part of joint venture <strong>TTS</strong> Hua Hai.<br />
Profit after taxes is included as income from investments in joint ventures. The profit in <strong>TTS</strong> Hua Hai AB in <strong>2006</strong><br />
was TNOK 1 382 with a turnover of TNOK 118 518.<br />
59
4-10 <strong>TTS</strong> GROUP 11-13 REPORT FROM THE CEO 14-27 BUSINESS AREAS 28-37 CORPORATE GOVERNANCE 36-87 DIRECTOR’S REPORT AND ACCOUNTS<br />
Note 10 Investments in joint ventures<br />
(AMOUNTS IN NOK 1000)<br />
Investments are accounted for in accordance with the equity method<br />
THE GROUP HAS THE FOLLOWING INVESTMENTS IN JOINT VENTURES:<br />
Company Registered office Acquisition date Ownership interest Voting share<br />
<strong>TTS</strong> Hua Hai Ships Equipment Co., Ltd Shanghai, China 2002 50 % 50 %<br />
<strong>TTS</strong> BoHai Machinery Co., Ltd Dalian, China 2005 50 % 50 %<br />
<strong>TTS</strong> Kocks GmbH Korea Co. Ltd Korea 2005 50 % 50 %<br />
INTERESTS IN JOINT VENTURES<br />
<strong>TTS</strong> Kocks Ltd <strong>TTS</strong> Bohai <strong>TTS</strong> Hua Hai<br />
GmbH Korea Co. Machinery Co., Ltd Ships Equipment Total<br />
Opening balance 1 January 6 118 8 454 16 428 30 999<br />
Acquisition/Start-up of the company 0 0 0<br />
Share of profit/loss -787 -458 9 693 8 448<br />
Dividends 0 0 -2 460 -2 460<br />
Forgiveness of debt 0 0 0 0<br />
Effect of foreign currencies -171 -364 250 -286<br />
Disposal of shares in associated companies 0 0 0 0<br />
Closing balance 31 December 5 160 7 631 23 910 36 701<br />
There are no contingent liabilities related to the group’s shares in joint ventures, and no contingent<br />
liabilities in the joint ventures themselves.<br />
GROUP’S SHARE OF THE PROFIT/LOSS, ASSETS AND LIABILITIES AS OF 31 DECEMBER <strong>2006</strong><br />
Assets Liabilities Income Profit/Loss<br />
<strong>TTS</strong> Hua Hai Ships Equipment Co., Ltd 70 006 46 096 155 810 9 693<br />
<strong>TTS</strong> Bohai Machinery Co., Ltd 19 821 12 190 12 851 -458<br />
<strong>TTS</strong> Kocks GmbH Korea Co. Ltd 34 057 28 897 43 296 -787<br />
Total 173 884 87 182 211 957 8 448<br />
Note 11 Customer and other receivables<br />
(AMOUNTS IN NOK 1000)<br />
<strong>2006</strong> 2005<br />
Receivables from customers 244 841 171 554<br />
Write-down for losses incurred on receivables from customers -3 006 -3 550<br />
Net receivables from customers 241 835 168 004<br />
RECEIVABLES THAT MATURE AFTER MORE THAN ONE YEAR<br />
Other receivables 5 997 5 997<br />
Total 5 997 5 997<br />
Among the receivables that mature after more than one year, <strong>TTS</strong> Marine <strong>ASA</strong> has a convertible loan of NOK 5 830 000 related to FastShip Inc.,<br />
see Note 8.<br />
There are no credit risk concentrations within the receivables from customers since the group has many customers distributed throughout<br />
a number of countries.<br />
60
Note 12 Long-term liabilities<br />
(AMOUNTS IN NOK 1000)<br />
REPAYMENT PROFILE AND MATURITY<br />
Balance as of 2012<br />
31 December <strong>2006</strong> 2007 2008 2009 2010 2011 and later<br />
Leasing debt 5 619 2 253 2 253 713 100 100 200<br />
Long-term liabilities 197 269 25 779 21 022 120 764 19 181 10 523 0<br />
first year of long-term debt instalments -28 032 0 0 0 0 0 0<br />
Total debt to credit institutions 174 855 174 855 151 580 30 103 10 822 143 200<br />
SPECIFICATION OF LOANS<br />
Foreign Nominal Instalment Book value Book value<br />
Type of loan currency interest rate Maturity terms <strong>2006</strong> 2005<br />
<strong>TTS</strong> MARINE <strong>ASA</strong><br />
Nordea Mortgage loan NOK Nibor+1.35 % 2011 4 per year 32 150 39 290<br />
Nordea Mortgage loan NOK Nibor+1.35 % <strong>2006</strong> 4 per year 0 450<br />
Nordea Mortgage loan NOK Nibor+1.35 % 2009 4 per year 100 000 0<br />
Elcon Finans Other long-term NOK 5.30 % 2009 12 per year 214 286<br />
Norfund Mortgage loan NOK 5.39 % 2011 4 per year 9 048 10 000<br />
SG Finans Other long-term NOK 5.50 % 2008 12 per year 4 918 7 070<br />
<strong>TTS</strong> SHIPS EQUIPMENT AS<br />
SkandiaBanken Other long-term NOK 4.50 % 2008 12 per year 701 801<br />
<strong>TTS</strong> HANDLING SYSTEMS AS<br />
Innovasjon Norge Mortgage loan NOK 6.50 % 2009 4 per year 4 613 4 613<br />
<strong>TTS</strong> LIFTEC OY<br />
Sampo Bank Mortgage loan EUR 2 % 2008 4 per year 1 915 4 238<br />
<strong>TTS</strong> LMG MARINE CRANES GMBH<br />
HypoVereinsbank Mortgage loan EUR Euribor+1.275 % 2007 4 per year 3 295 6 388<br />
<strong>TTS</strong> SHIPS EQUIPMENT GMBH<br />
Nordea Mortgage loan EUR Euribor+1.275 % 2011 4 per year 35 217 0<br />
<strong>TTS</strong> KOCKS GMBH<br />
HypoVereinsbank Mortgage loan EUR Euribor+1.275 % 2011 4 per year 10 816 0<br />
Total 202 887 73 136<br />
Book value of the group’s long-term loans in different currencies is as follows:<br />
<strong>2006</strong> 2005<br />
NOK 151 643 62 510<br />
EUR 51 244 10 626<br />
Total 202 887 73 136<br />
See Note 13 for security for long-term debt.<br />
61
4-10 <strong>TTS</strong> GROUP 11-13 REPORT FROM THE CEO 14-27 BUSINESS AREAS 28-37 CORPORATE GOVERNANCE 36-87 DIRECTOR’S REPORT AND ACCOUNTS<br />
Note 13 Assets pledged as security and guarantees<br />
(AMOUNTS IN NOK 1000)<br />
The credit agreement for <strong>TTS</strong> Marine <strong>ASA</strong> in Norway was established (50/50) with Nordea Norge <strong>ASA</strong> (Nordea) and Sparebanken Vest<br />
(SparebankenVest), and Nordea is the agent. As security for the company’s participation in the cash pool account system and the group’s guarantee<br />
limit system, the following assets in Norway have been pledged as security to Nordea.<br />
<strong>2006</strong> 2005<br />
Secured debt 211 505 197 001<br />
Assets at book value<br />
Customer/intragroup receivables 101 037 81 257<br />
Non-invoiced production 175 530 116 079<br />
Inventories/work in progress 28 933 25 870<br />
Prepayments to suppliers 56 900 37 265<br />
Property 3 380 3 478<br />
Total assets pledged as security 365 781 263 949<br />
In addiation following assets in the group have been pledged as security for garanties and credit agreements:<br />
Total assests pledged as security (book value) 133 100 48 708<br />
Total 498 781 312 657<br />
In addition, leases in Norway including machinery and plant, as well as shares in <strong>TTS</strong> Ships Equipment AB, have also been pledged as security.<br />
The nominal value of the mortgage bond is NOK 200 000 000.<br />
<strong>TTS</strong> KOCKS GMBH<br />
The loan to <strong>TTS</strong> Kocks GmbH at NOK 10.7 million (EUR 1.3 million) has been established with Bayerische Hypo- und Vereinsbank Akti<strong>eng</strong>esellshaft<br />
(HypoVereinsbank) in Germany. The bank has pledge in the company’s customers receivables and inventories, and additionaly a parent company<br />
guarantee from <strong>TTS</strong> Marine <strong>ASA</strong> of NOK 37.1 million (EUR 4.5 million). The assets of the company has a book value of NOK 19.8 million<br />
(EUR 2.4 million).<br />
<strong>TTS</strong>-LMG MARINE CRANES GMBH<br />
The credit agreement for <strong>TTS</strong>-LMG Marine Cranes GmbH has been established with Bayerische Hypo- und Vereinsbank Akti<strong>eng</strong>esellshaft<br />
(HypoVereinsbank) in Germany with a total credit limit including bank guarantees of NOK 41.2 million (EUR 5.0 million) and a drawdown of<br />
NOK 3.3 million (EUR 2.8 million) as of 31 December <strong>2006</strong>. The bank has security in the company’s assets, in addition to a parent company<br />
guarantee from <strong>TTS</strong> Marine <strong>ASA</strong> with a limit of NOK 39.5 million (EUR 4.8 million). The assets of the company has a book value of NOK 92.3 million<br />
(EUR 11.2 million).<br />
<strong>TTS</strong> LIFTEC OY<br />
The credit agreement for <strong>TTS</strong> Liftec Oy has been established with Sampo Pankki Oyi (Sampo Bank) in Finland with a credit limit of NOK 17.3 million<br />
(2.1 million EUR) and a drawdown of NOK 1.6 million (EUR 0.2 million) as of 31 December <strong>2006</strong>. The bank has a parent company guarantee from<br />
<strong>TTS</strong> Marine <strong>ASA</strong> with a limit of NOK 17.3 million (EUR 2.1 million).<br />
<strong>TTS</strong> MARINE SHANGHAI CO. LTD.<br />
The credit agreement for <strong>TTS</strong> Marine Shanghai Co. Ltd. has been established with DnB Bank <strong>ASA</strong>, Shanghai Branch with a credit limit of NOK<br />
82 million (EUR 1 million) and a drawdown of NOK 0 million (EUR 0 million) as of 31 December <strong>2006</strong>. The bank has a parent company guarantee<br />
from <strong>TTS</strong> Marine <strong>ASA</strong> with a limit of NOK 8.2 million (EUR 1 million).<br />
<strong>TTS</strong> KOCKS OSTRAVA s.r.o<br />
The credit agreement for <strong>TTS</strong> Kocks Ostrava s.r.o has been established with Ceska Sporitelna a.s in Check with a credit limit of NOK 8.9 million<br />
(CZK 30 million) and and drawdown of NOK 5.1 million (CZK 17.2 million) as of 31 December <strong>2006</strong>. The bank has security in the company’s assets,<br />
in addition <strong>TTS</strong> Marine <strong>ASA</strong> is co-debtor. The assets of the company has a book value of NOK 20.9 million (CZK 69.7 million).<br />
The group has also undertaken to meet the following financial str<strong>eng</strong>th requirements for Nordea:<br />
There is a requirement that the equity shall be greater than NOK 350 million at any time. In addition the equity ratio shall be greater than<br />
30 per cent as of 31 December. With equity of NOK 598.1 million and an equity ratio of 36.6 per cent, the group meets these requirements.<br />
GUARANTEE COMMITMENTS, JOINT AND SEVERAL LIABILITY<br />
The companies in Norway, as well as <strong>TTS</strong> Ships Equipment AB and <strong>TTS</strong> Ships Equipment GmbH, participate in a guarantee pool system that covers<br />
payment guarantees, contract guarantees, advance payment guarantees and tax guarantees within a total limit of NOK 100 000 000. As security<br />
for this guarantee pool, the Norwegian companies’ inventories, accounts receivable, leases including machinery and plant and the credit balance on<br />
advance payment accounts have been pledged. The companies in Norway are jointly and severally liable.<br />
Total drawdown in the guarantee pool as of 31 December was NOK 99.270.000 for the group.<br />
62
Note 14 Taxes<br />
(AMOUNTS IN NOK 1000)<br />
Deferred taxes are netted if the group has a legal right to offset deferred tax assets against deferred taxes on the balance sheet and if<br />
the deferred taxes are owed to the same tax authority. The following amounts have been netted:<br />
<strong>2006</strong> 2005<br />
DEFERRED TAX ASSETS:<br />
- Deferred tax assets that reverse after more than 12 months -35 538 -30 546<br />
- Deferred tax assets that reverse within 12 months 0 0<br />
Total recognised deferred tax assets -35 538 -30 546<br />
DEFERRED TAXES:<br />
- Deferred taxes that reverse within 12 months 0 0<br />
Total recognised deferred taxes 19 609 15 276<br />
Net deferred taxes on the balance sheet -15 929 -15 270<br />
Change in recognised deferred taxes: <strong>2006</strong> 2005<br />
Book value as of 1 January -15 270 -6 028<br />
Recognised during the period (see specifications below) -659 -9 242<br />
Tax entered directly against equity 0 0<br />
Book value as of 31 December -15 929 -15 270<br />
Change in deferred tax assets and deferred taxes (without netting within the same tax regime):<br />
1.1.2005 Change 2005 31.12.2005 Change <strong>2006</strong> 31.12.<strong>2006</strong><br />
DEFERRED TAXES<br />
Fixed assets 1 419 689 2 108 -47 2 061<br />
Accounts receivable 161 -161 0 0 0<br />
Construction contracts 32 509 -16 131 16 378 5 494 21 872<br />
Other temporary differences 724 13 759 14 483 2 738 17 221<br />
Total deferred taxes 34 813 -1 844 32 969 8 184 41 153<br />
DEFERRED TAX ASSETS<br />
Accounts receivable 0 -78 -78 -396 -474<br />
Inventories -1 993 -308 -2 301 0 -2 301<br />
Pension funds -655 -307 -962 354 -608<br />
Other provisions for liabilities and charges -1 567 644 -923 -790 -1 713<br />
Total deferred tax assets -4 215 -49 -4 264 -833 -5 097<br />
Net deferred taxes 30 598 -1 893 28 705 7 351 36 056<br />
Tax credit deduction carryforward -6 182 0 -6 182 0 -6 182<br />
Tax allowance carryforward -1 260 0 -1 260 0 -1 260<br />
Tax loss carryforward -30 830 -7 936 -38 766 -8 786 -47 552<br />
Net deferred tax assets -7 674 -9 829 -17 503 -1 435 -18 938<br />
Excess allocation 387 586 973 776 1 749<br />
Unrecognised deferred<br />
tax assets related to allowance 1 260 0 1 260 0 1 260<br />
Net deferred tax assets on the balance sheet -6 027 -9 243 -15 270 -659 -15 929<br />
The deferred tax assets related to tax loss carryforwards are recognised on the balanace sheet when the management believes that<br />
it is probable that the group can apply this against future taxable income.<br />
63
4-10 <strong>TTS</strong> GROUP 11-13 REPORT FROM THE CEO 14-27 BUSINESS AREAS 28-37 CORPORATE GOVERNANCE 36-87 DIRECTOR’S REPORT AND ACCOUNTS<br />
Specification of differences between the financial profit before tax and the tax basis for the year:<br />
<strong>2006</strong> 2005<br />
Pre-tax profit/loss 84 492 56 297<br />
Permanent differences -1 074 -1 424<br />
Change in the assessment in relation to previous year’s accounts 0 0<br />
Change in temporary profit/loss differences -38 455 -1 973<br />
Application of tax loss carryforward -351 -15 356<br />
Tax basis for the year 44 612 37 544<br />
Breakdown of the tax charge:<br />
Tax payable 1) 24 668 25 301<br />
Effect of too little allocated deferred tax assets 0 0<br />
Effect of foreign exchange fluctuations 0 0<br />
Change in deferred taxes -659 -9 242<br />
Tax charge 24 010 16 059<br />
1 ) Tax payable is related to the foreign subsidiaries’ taxable profit that cannot be offset against the tax loss carryforward in Norway.<br />
Tax payable on the balance sheet: <strong>2006</strong> 2005<br />
Tax payable 24 668 25 301<br />
Prepaid tax in foreign subsidiaries -16 453 -15 004<br />
Too little/much allocated in earlier years 0 0<br />
Tax credit deduction related to dividends 0 0<br />
Tax payable on balance sheet 8 215 10 297<br />
Average tax rate for the group is 28.4 %:<br />
28 % of the profit before tax 23 658 15 763<br />
Too little/much allocated deferred taxes 652 586<br />
Permanent differences, including amortisation of goodwill -301 -290<br />
Estimated tax charge 24 010 16 059<br />
Note 15 Liquid assets/short-term interest-bearing liabilities<br />
(AMOUNTS IN NOK 1000)<br />
<strong>2006</strong> 2005<br />
Bank deposits, cash, etc. as of 31 December 236 934 97 811<br />
Deposits(+)/withdrawals(–) in the cash pool account system as of 31 December 85 040 -66 640<br />
Other short-term interest-bearing debt 22 800 -96 100<br />
<strong>TTS</strong> Marine <strong>ASA</strong> administers a cash pool account system. The group has been granted a credit limit for the group of NOK 70 000 000.<br />
The companies that participate in the scheme are jointly and severally liable for the total limit.<br />
Note 16 Share capital and shareholder information<br />
(AMOUNTS IN NOK 1000)<br />
Number of shares as of 31 Dec. Nominal value Book value of share capital<br />
22 492 904 0.50 11 246 452<br />
THE FOLLOWING COMPANIES ARE INCLUDED IN THE <strong>TTS</strong> MARINE GROUP:<br />
Company Owner Ownership interest Share capital Number of shares<br />
Norlift AS (formerly <strong>TTS</strong> Eiendom AS) <strong>TTS</strong> Marine <strong>ASA</strong> 100 % NOK 500 000 500<br />
<strong>TTS</strong> Handling Systems AS <strong>TTS</strong> Marine <strong>ASA</strong> 100 % NOK 950 000 95 000<br />
<strong>TTS</strong> Ships Equipment AS <strong>TTS</strong> Marine <strong>ASA</strong> 100 % NOK 2 500 000 2 500<br />
Hydralift Marine AS <strong>TTS</strong> Marine <strong>ASA</strong> 100 % NOK 100 000 1 000<br />
<strong>TTS</strong> Ships Equipment AB <strong>TTS</strong> Marine <strong>ASA</strong> 100 % SEK 2 000 000 2 000<br />
<strong>TTS</strong> Marine Shanghai Co. Ltd. <strong>TTS</strong> Marine <strong>ASA</strong> 100 % USD 200 000 3 500<br />
<strong>TTS</strong> Ships Equipment GmbH <strong>TTS</strong> Ships Equipment AB 100 % EUR 255 646 5 000<br />
<strong>TTS</strong> Inc. <strong>TTS</strong> Ships Equipment AB 100 % USD 190 000 1 900<br />
<strong>TTS</strong>-LMG Marine Cranes GmbH <strong>TTS</strong> Ships Equipment AB 100 % EUR 25 000 1<br />
<strong>TTS</strong> Liftec Oy <strong>TTS</strong> Ships Equipment AB 100 % EUR 76 500 1 020<br />
<strong>TTS</strong> Port Equipment AB <strong>TTS</strong> Ships Equipment AB 100 % SEK 100 000 1 000<br />
<strong>TTS</strong> Kocks GmbH <strong>TTS</strong> Ships Equipment AB 100 % EUR 1 000 000 1 000<br />
<strong>TTS</strong> Kocks Ostrava s.r.o. <strong>TTS</strong> Ships Equipment AB 100 % EUR 310 291 1 000<br />
<strong>TTS</strong> Marine S.r.l. <strong>TTS</strong> Ships Equipment AB 100 % EUR 10 400 1 000<br />
<strong>TTS</strong> Marine Cranes AS <strong>TTS</strong> Marine <strong>ASA</strong> 100 % NOK 1 000 000 1 000<br />
64
THE LARGEST SHAREHOLDERS IN <strong>TTS</strong> MARINE <strong>ASA</strong> AS OF 31 DECEMBER <strong>2006</strong> WERE:<br />
FIGURES IN NOK 1000<br />
Shareholder Number of shares Ownership interest Voting share<br />
Skeie <strong>Group</strong> 8 280 000 36.81 % 36.81 %<br />
Morgan Stanley and Co. Intl.Limited 2 575 407 11.45 % 11.45 %<br />
JCE <strong>Group</strong> AB 2 050 000 9.11 % 9.11 %<br />
IF Skadeforsakring AB 1 316 400 5.85 % 5.85 %<br />
Rasmuss<strong>eng</strong>ruppen AS 1 254 000 5.58 % 5.58 %<br />
Bank of New York, Brüssels brance 843 483 3.75 % 3.75 %<br />
Nordea Bank PLC Finland 752 600 3.35 % 3.35 %<br />
Odin Europa SMB 396 400 1.76 % 1.76 %<br />
Verdipapirfond Odin Maritim 370 000 1.64 % 1.64 %<br />
Stichting Shell Pensionfonds 288 256 1.28 % 1.28 %<br />
Stiftelsen Statoils Pensjonskasse 254 600 1.13 % 1.13 %<br />
DnB Nor SMB 222 600 0.99 % 0.99 %<br />
Lectio AS 189 200 0.84 % 0.84 %<br />
JPMorgan Chase Bank 180 000 0.80 % 0.80 %<br />
Vital Forsikring <strong>ASA</strong> 167 343 0.74 % 0.74 %<br />
DFA-Intl. SML CAP VAL PORT 161 700 0.72 % 0.72 %<br />
Arne Ketil Kyrkjebø 154 400 0.69 % 0.69 %<br />
Statoil Forsikring AS 148 050 0.66 % 0.66 %<br />
Goldman Sachs International 130 900 0.58 % 0.58 %<br />
Alden AS 125 800 0.56 % 0.56 %<br />
Total 20 largest shareholders 19 861 139 88.30 % 88.30 %<br />
Total others 2 631 765 11.70 % 11.70 %<br />
Total 22 492 904 100.00 % 100.00 %<br />
Board member Oddmund Hatletun had 1 493 shares and Board member Olav Smeland had 800 shares, while President & CEO Johannes D. Neteland had<br />
82 500 shares and options to purchase 137 500 shares. On 30 May <strong>2006</strong> the Annual General Meeting resolved to grant the Board authority to issue a<br />
maximum of 4 000 000 shares in the event of an acquisition or merger. This authorisation is valid until the Annual General Meeting for <strong>2006</strong>, and no<br />
later than 30 June 2007. As a result of acquisitions completed, a total of 2 039 300 shares were issued as of 7 December <strong>2006</strong>, the same as of 29.03.07.<br />
As of 31 December <strong>2006</strong>, 112 500 options were allotted that can be exercised until 9 June 2007 at a price of NOK 26.5 (from an authorisation for a total<br />
of 300 000 options granted at the Ordindary General Meeting of 9 June 2005). In addition to 340 000 options that can be exercised until 30 May 2008<br />
at a price of NOK 35. (from an authoristion for a total of 340 000 options granted at the Annual General Meeting of 30 May <strong>2006</strong>).<br />
THE DISTRIBUTION OF OPTIONS IS AS FOLLOWS:<br />
No. of No. of<br />
options that options that<br />
can be exercised can be exercised<br />
Name Position Company until 6/09/07 Price until 6/09/07 Price Total<br />
Johannes D. Neteland President & CEO <strong>TTS</strong> Marine <strong>ASA</strong> 37 500 26.50 100 000 35.00 137 500<br />
Olav Bruåsdal Financial director <strong>TTS</strong> Marine <strong>ASA</strong> 15 000 26.50 40 000 35.00 55 000<br />
Hans-Jan Erstad Chief of staff <strong>TTS</strong> Marine <strong>ASA</strong> 15 000 26.50 40 000 35.00 55 000<br />
Göran K. Johansson Division Director <strong>TTS</strong> Port Equipment AB 15 000 26.50 40 000 35.00 55 000<br />
Bjørn O. Hansen Proj. director <strong>TTS</strong> Handling Systems AS 15 000 26.50 0 0 15 000<br />
Ivar K. Hanson Division director <strong>TTS</strong> Marine <strong>ASA</strong> 15 000 26.50 40 000 35.00 55 000<br />
Stellan Bernsro Managing Director <strong>TTS</strong> Ships Equipment AB 0 0 40 000 35.00 40 000<br />
Edgar Bethman Division Director <strong>TTS</strong> Kocks GmbH 0 0 40 000 35.00 40 000<br />
Total number of options to leading employees 112 500 340 000 452 500<br />
Share options exercised in <strong>2006</strong> resulted in the issue of a total of 337 500 shares. 150 000 of these shares were issued at NOK 14 per share, with a<br />
weighted average market price on the date of issue of NOK 37.00 per share. 187 500 shares were issued at NOK 26.50 per share, with a weighted<br />
average market price per share of NOK 45.44 on the date of issue. A resolution was adopted at the Annual General Meeting of 30 May <strong>2006</strong> to<br />
authorise the Board to purchase a maximum of 300 000 of the company’s own shares. This authorisation is valid until the Annual General Meeting<br />
for <strong>2006</strong>, and no later than 30 June 2007. In the period <strong>TTS</strong> has owned maximum 70 000 shares. As of 31 December <strong>2006</strong> the company held 6 700<br />
of its own shares.<br />
In accordance with authorities granted by the Annual General Meeting in 2005 and <strong>2006</strong>, <strong>TTS</strong> has issued share option programmes to the group<br />
management. Through these programmes, <strong>TTS</strong>’ group management have a future right to purchase a number of shares at a strike price equal to the<br />
marked rate on the date that the share purchase programme was initiated. The option premium is estimated on the date of allotment using the Black<br />
& Scholes option pricing model (BS). The options have a maximum term of two years, with a possible first exercise after one year (50 percent), then<br />
(12.5 percent) per quarter, giving a weighted averaged of 15 months maturity which is employed in BS. The option premium is distributed over the<br />
option’s two-year term. Implied volatility is based on a combination of historic data and discretion. For options issued in 2005, a 25 percent volatility<br />
is used (historically 23 percent), and for <strong>2006</strong>, a 30 percent volatility (historically 31.2 percent). For 2005, a risk-free interest rate of 3.0 percent is<br />
used, and for <strong>2006</strong> a rate of 3.5 percent. For <strong>2006</strong>, NOK 978 in option premium is charged as an expense classified as salary in the profit and loss<br />
account. Employers’ national insurance contribution is charged as an expense upon exercise of options. For <strong>2006</strong>, NOK 858 million is charged as an<br />
expense classified as salary in the profit and loss account.<br />
65
4-10 <strong>TTS</strong> GROUP 11-13 REPORT FROM THE CEO 14-27 BUSINESS AREAS 28-37 CORPORATE GOVERNANCE 36-87 DIRECTOR’S REPORT AND ACCOUNTS<br />
Note 17 Other short-term liabilities<br />
(AMOUNTS IN NOK 1000)<br />
<strong>2006</strong> 2005<br />
Provisions for projects (see note 21) 76 042 75 003<br />
Other current liabilities 105 827 82 357<br />
Total short-term liabilities 181 869 157 360<br />
Note 18 Other operating expenses<br />
(AMOUNTS IN NOK 1000)<br />
<strong>2006</strong> 2005<br />
Rent, costs for premises 21 163 18 381<br />
EDP costs 5 868 7 957<br />
Marketing, travel 37 218 24 323<br />
Other 74 621 50 643<br />
Total other operating expenses 138 872 101 304<br />
Note 19 Related parties<br />
All the underlying subsidiaries (Note 9), joint ventures (Note 10), members of the Board (Note 4) and senior management are regarded as related<br />
parties.<br />
The group has carried out various transactions with underlying companies and joint ventures. All the transactions have been carried out at part<br />
of the ordinary operations and at arm’s l<strong>eng</strong>th prices.<br />
Sales: <strong>2006</strong> 2005<br />
Joint ventures 6 831 6 646<br />
Cost of sales:<br />
Joint ventures 112 893 915<br />
Items on the balance sheet related to sales and cost of sales to related parties:<br />
Current assets<br />
Joint ventures 4 323 3 058<br />
Current liabilities<br />
Joint ventures 23 521 980<br />
Loan to related parties<br />
Joint ventures 5 456 1 639<br />
Note 20 Derivatives<br />
(AMOUNTS IN NOK 1000)<br />
<strong>2006</strong> 2005<br />
Assets Liabilities Assets Liabilities<br />
Forward currency contracts – fair value hedging 17 305 14 530 9 300 9 688<br />
Derivatives held for trading purposes are classified as current assets or liabilities.<br />
Forward currency contracts<br />
Nominal amount of outstanding forward currency contracts as of 31 December was NOK 900 million.<br />
Derivatives are included in principle at the fair value on the date of entry into the contract. The value is adjusted to fair value in subsequent periods.<br />
<strong>TTS</strong> enters into derivates that qualifies for, and is presented as fair value hedging. Changes in the fair value of the derivates that is identified and<br />
qualifies as fair value hedging, are recognised in the profit and loss account together with changes in the fair value of the asset or liability that<br />
is hedged. The asset or liability that is hedges, is income or cost related to contruction contracts. Hedged asset or liability in balance is booked<br />
as fair value and represent the port of the income or cost that on balance day are not invoiced to the customer or were invoices from suppliers<br />
are not received.<br />
66
Note 21 Other provisions for obligations<br />
(AMOUNTS IN NOK 1000)<br />
Delivered<br />
projects* Guarantees Other Total<br />
1 januar <strong>2006</strong> 75 003 23 655 4 246 102 904<br />
Provisions for the year 14 354 12 810 3 250 30 414<br />
Utilised during the year -13 315 -12 154 -4 246 -29 715<br />
31 desember <strong>2006</strong> 76 042 24 311 3 250 103 603<br />
Classification on the balance sheet <strong>2006</strong> 2005<br />
Current liabilities 103 603 102 904<br />
*) Obligations related to supplementary work and other claims from the customer<br />
Note 22 Financial items and foreign currency gains/losses<br />
(AMOUNTS IN NOK 1000)<br />
<strong>2006</strong> 2005<br />
Income from investments in joint ventures 8 448 6 767<br />
Other interest income 3 405 2 314<br />
Interest on bank loans -15 391 -9 633<br />
Net foreign currency gains/losses -1 668 -2 875<br />
Total -5 206 -3 337<br />
FOREIGN CURRENCY GAINS/LOSSES<br />
The foreign currency gains and losses that are recognised in the profit and loss account are as follow:<br />
<strong>2006</strong> 2005<br />
Foreign currency gains 3 914 1 646<br />
Foreign currency losses -5 582 -4 431<br />
Total -1 668 -2 785<br />
Foreign currency gains are included in other financial income in the profit and loss account, and foreign currency losses<br />
are included in other financial expenses.<br />
Note 23 Earnings per share<br />
(AMOUNTS IN NOK 1000)<br />
The earnings per share are calculated by dividing the portion of the net profit for the year that is attributable to the company’s<br />
shareholders with a weighted average of the number of outstanding ordinary shares throughout the year, less the company’s own shares.<br />
<strong>2006</strong> 2005<br />
Net profit for the year attributable to the company’s shareholders 60 481 40 238<br />
Weighted average number of outstanding shares 20 685 18 342<br />
Earnings per share (NOK per share) 2.92 2.19<br />
DILUTED EARNINGS PER SHARE<br />
In calculating the diluted earnings per share, the weighted average of the number of outstanding ordinary<br />
shares adjusted for the effect of the conversion of all the potential shares that can entail dilution is used.<br />
The company has share options where a calculation is made to determine the number of shares that could have been subscribed<br />
for at the market price (calculated at the average share price for the company’s shares throughout the year) based on the<br />
monetary value of the subscription rights for the outstanding share options. The number of shares calculated as explained above<br />
are compared with the number of shares that would have been issued if all the share options were exercised. The difference<br />
is placed in the denominator in the fraction as shares issued without consideration.<br />
<strong>2006</strong> 2005<br />
Profit used to calculate the diluted earnings per share 60 481 40 238<br />
Average number of shares outstanding, ordinary shares 20 685 18 342<br />
Adjustments for share options 130 153<br />
Average number of ord. shares for calculation of diluted earnings per share 20 815 18 495<br />
Diluted earnings per share (NOK per share) 2.91 2.18<br />
67
4-10 <strong>TTS</strong> GROUP 11-13 REPORT FROM THE CEO 14-27 BUSINESS AREAS 28-37 CORPORATE GOVERNANCE 36-87 DIRECTOR’S REPORT AND ACCOUNTS<br />
Note 24 Events after the balance sheet day<br />
There has not been any events after balance sheet day that are of any influence of the results presented. Proposed note approved<br />
dividend to shareholders is MNOK 22.5, an amount of NOK 1 per share. In February 2007 <strong>TTS</strong> purchased all the shares in ICD Projects AS<br />
with a total of 6 employees. The company develops and delivers software- and steering systems to offshore handling systems.<br />
The company’s turnover in <strong>2006</strong> was TNOK 8 148.<br />
In March 2007, <strong>TTS</strong> bought up its partner’s 50 per cent share in the manufacturing company in Korea. The company’s turnover in <strong>2006</strong><br />
was TNOK 33 006, with a loss of TNOK 2. Half of this loss is presented as finacial loss.<br />
In March 2007, <strong>TTS</strong> Port Equipment AB acquired technology for port terminal equipment that will further str<strong>eng</strong>then <strong>TTS</strong>’ position<br />
as leading supplier within this segment.<br />
Note 25 Exchange differences<br />
(AMOUNTS IN NOK 1000)<br />
Exchange differences includes differences that as a result of translation of the financial reports of the foreign companies into NOK.<br />
At 01.01.2005 (1 678)<br />
Exchange differences 2005<br />
Corporate companies 1 599<br />
Joint ventures (2 062)<br />
At 31.12.<strong>2006</strong> (2 141)<br />
Exchange differences <strong>2006</strong><br />
Corporate companies 7 329<br />
Joint ventures (286)<br />
At 31.12.<strong>2006</strong> 4 902<br />
Note 26 Other fixed asset investment<br />
(AMOUNTS IN NOK 1000)<br />
Other fixed asset investment includes:<br />
<strong>2006</strong> 2005<br />
Loans to joint ventures 5 456 1 639<br />
Loan to Fast Ship 5 830 5 830<br />
Deposit 896 319<br />
Other receivables 6 726 6 149<br />
Note 27 Contingencies<br />
There are not expected to be essential obligations associated with contingencies other than what is reflected in the profit and loss<br />
and balance sheet. Ref. note 21<br />
Note 28 Government grants<br />
<strong>TTS</strong> has through parent company and two subsidiaries received 3 grants from public institutions to research and development<br />
activites that is approved under the public institutions SKATTEFUNN. The companies have received a total of TNOK 793.<br />
68
4-10 <strong>TTS</strong> GROUP 11-13 REPORT FROM THE CEO 14-27 BUSINESS AREAS 28-37 CORPORATE GOVERNANCE 36-87 DIRECTOR’S REPORT AND ACCOUNTS<br />
Profit and loss account<br />
<strong>TTS</strong> MARINE <strong>ASA</strong><br />
1 JANUARY - 31 DECEMBER<br />
(AMOUNTS IN NOK 1000) NGAAP NGAAP<br />
<strong>2006</strong> 2005<br />
OPERATING INCOME NOTES<br />
Income from projects 286 417 243 377<br />
Other operating income 1 427 2 431<br />
<strong>Group</strong> contribution from <strong>TTS</strong> - subsidiaries 9 550 6 428<br />
Total operating income 297 394 252 236<br />
OPERATING EXPENSES<br />
Cost of sales 183 015 162 885<br />
Personell costs 3, 4 80 366 69 076<br />
Depreciation 5, 6 4 915 4 755<br />
Losses on accounts receivable 9 - -<br />
Other operating costs 16 33 489 29 263<br />
Total operating expenses 301 785 265 979<br />
Operating profit/loss (4 391) (13 744)<br />
FINANCIAL INCOME AND EXPENSES<br />
Income from investments in subsidiaries 8 61 748 43 599<br />
Income from investments in joint ventures 8 (458) (772)<br />
Interest received from group companies 18 3 359 1 406<br />
Other interest income 18 - -<br />
Other financial income 18 703 365<br />
Interest paid to group companies 18 - 50<br />
Other interest expenses 18 12 240 7 228<br />
Other financial expenses 18 2 136 1 482<br />
Net financial items 50 977 35 838<br />
Profit/loss before tax 46 587 22 094<br />
Tax 12 (3 499) (4 773)<br />
Net profit for the year 50 086 26 867<br />
71
4-10 <strong>TTS</strong> GROUP 11-13 REPORT FROM THE CEO 14-27 BUSINESS AREAS 28-37 CORPORATE GOVERNANCE 36-87 DIRECTOR’S REPORT AND ACCOUNTS<br />
Balance<br />
<strong>TTS</strong> MARINE <strong>ASA</strong><br />
ASSETS<br />
(AMOUNTS IN NOK 1000) NGAAP NGAAP<br />
31.12.06 31.12.05<br />
Fixed assets NOTES<br />
Deferred tax assets 12 31 648 28 148<br />
INTANGIBLE FIXED ASSETS<br />
Research and development 6 4 530 2 000<br />
Goodwill 6 19 815 21 308<br />
Total intangible fixed assets 24 345 23 308<br />
TANGIBLE FIXED ASSETS<br />
Machinery and vehicles 5 1 447 1 364<br />
Furniture and office equipment 5 6 313 8 190<br />
Total tangible fixed assets 7 760 9 554<br />
FIXED ASSET INVESTMENTS<br />
Investments in associated companies 8 397 039 281 446<br />
Loans to companies in the same group 8 7 631 8 454<br />
Investments in associated companies 22 082 68 280<br />
Investments in shares and units 7 13 548 13 548<br />
Other receivables 31 741 34 487<br />
Total fixed asset investments 472 042 406 214<br />
Total fixed assets 535 795 467 224<br />
Current assets<br />
Inventories 2 26 223 25 016<br />
Work in progress 2 - 534<br />
ACCOUNTS RECEIVABLE<br />
Receivables from customers 9 55 774 45 226<br />
Intragroup accounts receivables 34 386 23 491<br />
Other receivables 9 896 3 810<br />
Other intragroup receivables 7 698 1 263<br />
Accrued, non-invoiced production 1 122 373 92 287<br />
Prepayments to suppliers 54 963 27 782<br />
Total receivables 285 089 193 859<br />
Bank deposits, cash in hand, etc. 13 28 648 2 650<br />
Total current assets 339 961 222 059<br />
Total assets 875 755 689 428<br />
72
EQUITY AND LIABILITIES<br />
(AMOUNTS IN NOK 1000) NGAAP NGAAP<br />
31.12.06 31.12.05<br />
EQUITY<br />
CALLED-UP AND FULLY PAID SHARE CAPITAL NOTES<br />
Share capital 14 11 246 10 058<br />
Company’s own shares 14 (3) (4)<br />
Share premium account 318 550 284 761<br />
Total called-up and fully paid share capital 329 794 294 815<br />
RETAINED EARNINGS<br />
Valuation variance fund 123 497 50 674<br />
Other reserves 90 004 24 444<br />
Total retained earnings 213 500 75 11<br />
Total equity 543 294 369 933<br />
LIABILITIES<br />
PROVISIONS FOR LIABILITIES AND CHARGES<br />
Pension obligations 4 3 854 5 301<br />
Total provisions for liabilities and charges 3 854 5 301<br />
OTHER LONG-TERM LIABILITIES<br />
Debt to financial institutions 10, 11 146 329 57 096<br />
Total other long-term liabilities 146 329 57 096<br />
CURRENT LIABILITIES<br />
Debt to credit institutions 10, 11, 13 0 127 160<br />
Payables to suppliers 23 012 23 354<br />
Unpaid government taxes 6 078 6 075<br />
Prepayments from customers 1 54 131 22 116<br />
Non-invoiced production costs, suppliers 61 751 64 009<br />
Avsatt til utbytte 22 494 0<br />
Other intragroup liabilities 77 190<br />
Other current liabilities 15 14 736 14 195<br />
Total current liabilities 182 279 257 098<br />
Total liabilities 332 462 319 495<br />
Total equity and liabilities 875 755 689 428<br />
Bergen, 29 March 2007<br />
The Board of <strong>TTS</strong> Marine <strong>ASA</strong><br />
Nils Olav Aardal Anne Breive Hilde P. Aarseth Krøgenes John M. Lunde<br />
CHAIRMAN DIRECTOR DIRECTOR DIRECTOR<br />
Olav Smedal Oddmund Hatletun Johannes D. Neteland<br />
DIRECTOR DIRECTOR PRESIDENT & CEO<br />
73
4-10 <strong>TTS</strong> GROUP 11-13 REPORT FROM THE CEO 14-27 BUSINESS AREAS 28-37 CORPORATE GOVERNANCE 36-87 DIRECTOR’S REPORT AND ACCOUNTS<br />
Consolidated equity statement<br />
<strong>TTS</strong> MARINE <strong>ASA</strong><br />
Share Valuation<br />
Share Own premium- variance Other<br />
(AMOUNTS IN NOK 1000) capital shares reserve fond equity Total<br />
Equity as of 1 January <strong>2006</strong> 10 058 -4 284 761 50 674 24 444 369 933<br />
Depreciation of share premium account -100 000 100 000 0<br />
Company’s own shares 0 1 0 0 628 629<br />
New issue 1 189 0 137 415 0 0 138 604<br />
Cost of new issue 0 -4 604 0 0 -4 604<br />
Cost of share option 0 0 978 0 0 978<br />
Currency differences concerning equity method 0 0 0 0 10 162 10 162<br />
Dividends 0 0 0 0 -22 493 -22 493<br />
Net profit for the year 0 0 0 72 823 -22 738 50 086<br />
Equity as of 31 December <strong>2006</strong> 11 246 -3 318 550 123 497 90 004 543 294<br />
74
Cash flow statement<br />
<strong>TTS</strong> MARINE <strong>ASA</strong><br />
1 JANUARY - 31 DECEMBER<br />
(AMOUNTS IN NOK 1000) <strong>2006</strong> 2005<br />
Cash flow from operations<br />
Net profit for the year 46 586 22 094<br />
Income from investments in subsidiaries -61 748 -43 599<br />
Depreciation 4 915 4 755<br />
Gains/losses on the sale of tangible fixed assets 0 -68<br />
Net change in provisions for liabilities and charges 0 -20 164<br />
Profit attributable to associated companies 458 772<br />
Foreign currency gains/losses on loans -3 016 10 705<br />
Difference between pension charges and payments to/from pension schemes -1 447 -682<br />
Inventories -673 1 360<br />
Customer receivables and other receivables 21 467 15 362<br />
Payables to supplies and other short-term liabilities -43 791 -3 751<br />
Net cash flow from operations -37 249 -13 216<br />
Cash flow from investments<br />
Acquisition of subsidiaries (less cash balances in subsidiaries) -40 000 -8 500<br />
Receipts from sale of tangible fixed assets 0 101<br />
Disbursements for acquisition of tangible fixed assets -4 159 -5 208<br />
Receipts on other claims (loans) 49 767 7 219<br />
Increase in long-term receivables -11 768 -76 734<br />
Payments on other claims (loans) -27 181 -3 788<br />
Net cash flow from investments -33 341 -86 910<br />
Cash flow from financing<br />
Receipts from new short-term/long-term debt 100 000 51 522<br />
Disbursements for repayment of short-term/long-term debt -10 767 -12 708<br />
Payment to group company -113 -4 912<br />
Net change in bank overdraft -127 160 -26 191<br />
Paid-in equity 134 628 94 855<br />
Net cash flow from financing 96 588 102 566<br />
Effect of exchange rate fluctuations on cash balances and cash equivalents<br />
Net change in cash and cash equivalents 25 997 2 440<br />
Cash and cash equivalents at the start of the period 2 651 211<br />
Cash and cash equivalents at the end of the period 28 648 2 651<br />
This consists of:<br />
Bank deposits etc. 28 648 2 651<br />
75
4-10 <strong>TTS</strong> GROUP 11-13 REPORT FROM THE CEO 14-27 BUSINESS AREAS 28-37 CORPORATE GOVERNANCE 36-87 DIRECTOR’S REPORT AND ACCOUNTS<br />
Accounting principles<br />
<strong>TTS</strong> MARINE <strong>ASA</strong><br />
The financial statements have been prepared in accordance with The<br />
Norwegian Accounting Act of 1998 and generally accepted accounting<br />
principles.<br />
Subsidiaries, associated companies<br />
Subsidiaries are valuated according to the equity method in the annual<br />
accounts. The parent company’s share of the result is based on the<br />
invested companies’ post-tax result after allowing for internal gains and<br />
possible depreciation of any additional value arising because the cost<br />
price of the shares was higher than the acquired share of the book<br />
equity. In the profit and loss account, the share of the profit is posted<br />
under financial items, while the assets in the balance sheet are posted<br />
under financial assets.<br />
Also associated companies (joint ventures) are included in the accounts<br />
in accordance with the cost method. This means that the result is<br />
included as financial income and portion of equity is included under<br />
financial assets.<br />
Operating income<br />
Operating income includes income on delivered products and services<br />
granted over the year. For long-term contracts with partial invoicing,<br />
parts of expected future profits are entered as current income in correlation<br />
with the progress of the project. All loss on long-term production<br />
contracts is expensed when the loss is demonstrated. In addition,<br />
reference is made to work in progress included as a separate subject.<br />
Classification and valuation of balance sheet items<br />
Current assets and short term liabilities include items which fall due<br />
within one year of the end of the financial year, as well as items related<br />
to the operating cycle. Other items are classified as fixed assets/longterm<br />
liabilities.<br />
Current assets are valued at the lowest of cost and market value.<br />
Short-term liabilities are posted in the balance sheet at the nominal<br />
value at the time of initial establishment.<br />
Fixed assets are recorded at cost, but are written down to net<br />
realiz able value if the diminution in value is not expected to be<br />
tempo rary. Long-term liabilities are posted in the balance sheet at<br />
the nominal value at the time the initial establishment.<br />
Accounts receivables<br />
Trade debtors and other accounts receivables are recorded in the balance<br />
sheet at their nominal value reduced by a provision for bad debts. The<br />
provisions are made on the basis of an individual assessment of each<br />
balance. In addition, an unspecified provision is made to cover expected<br />
losses.<br />
Inventory<br />
Inventory of purchased goods is valued at the lower of acquisition cost<br />
according to the FIFO principle and real value. Depreciation is applied<br />
for foreseeable obsolete inventory.<br />
Fixed assets<br />
Fixed assets are booked on the balance sheet and depreciated over<br />
the asset’s life span if the expected life span exceeds 3 years and has<br />
a cost price higher than NOK 15 000. Direct maintenance of assets is<br />
76<br />
expensed as incurred under operating expenses, while renovation or<br />
upgrading is added to the asset’s cost price and is depreciated in line<br />
with the asset.<br />
Pensions<br />
The company has a defined-benefit pension. The pension expenses and<br />
pension commitments are calculated on a straight-line earning profile<br />
basis, based on assumptions relating to discount rates, projected salaries,<br />
the amount of benefits from the National Insurance Scheme, future<br />
return on pension funds, and actuarial calculations relating to mortality<br />
rate, voluntary retirement, etc. Pension funds are valued at net realizable<br />
value and deducted in the net pension commitment in the balance sheet.<br />
Changes in the commitment due to changes in the pension plans are<br />
written down over the expected remaining service period. The same<br />
applies to estimated differences if they exceed 10 % of the largest of the<br />
pension commitment and pension funds (corridor).<br />
Social security fees are expensed on basis of pension premiums paid<br />
for pension schemes and accrued changes in net pension commitment .<br />
Taxes<br />
The tax expense in the profit and loss account includes both the current<br />
tax payable and change in deferred tax. Deferred tax is estimated to<br />
28 % based on the temporary changes between taxation and accounting<br />
values, as well as tax losses carried forward to the end of the fiscal<br />
year. Tax-increasing and tax-reducing temporary differences which are<br />
reversed, or could be reversed, during the same period are offset against<br />
each other and recorded as a net sum. Temporary changes are only<br />
assessed for the Norwegian companies.<br />
Foreign currency<br />
Items in foreign currency are converted to NOK at the exchange rate on<br />
the balance sheet date. For future contracts, forward rates are used.<br />
Future contracts ensuring trade debtors, accrued operating income<br />
and/or trade creditors are converted to an average rate of exchange for<br />
all future contracts in connection with each individual long-term project.<br />
Work in progress<br />
Profits on work in progress is estimated according to percentage of completion<br />
method. <strong>TTS</strong> uses the Norwegian Accounting Standard for longterm<br />
production contracts, and income is therefore posted according to<br />
the degree of completion for each project. Income on smaller deliveries<br />
with short production lead time and contracts where own added value<br />
is limited is recognized at delivery.<br />
Each project is evaluated individually. Projects with net, completed but<br />
not billed orders are posted as accounts receivables, and projects where<br />
advance payment from clients exceeds the completed order is posted<br />
as a liability. Completed orders are classified as operating income in the<br />
profit and loss account.<br />
Cash flow statement<br />
The cash flow statement has been prepared according to the indirect<br />
method. Cash and cash equivalents include cash, bank deposits, and other<br />
short term investments which immediately and with minimal exchange<br />
risk can be converted into known cash amounts, with due date less than<br />
three months from purchase date.
Notes<br />
<strong>TTS</strong> MARINE <strong>ASA</strong><br />
Note 1 Construction contracts<br />
(AMOUNTS IN NOK 1000)<br />
Current assets <strong>2006</strong> 2005<br />
Completed production 162 333 168 969<br />
Invoiced production 39 960 76 682<br />
Accrued, non-invoiced production 122 373 92 287<br />
Prepayments to suppliers 54 963 27 782<br />
Total current assets related to contruction contracts 177 336 120 069<br />
Current liabilites<br />
Completed production 108 625 95 667<br />
Invoiced production 162 756 117 783<br />
Prepayments from customers -54 131 -22 116<br />
Non- invoiced production cost -61 751 -64 009<br />
Total current liabilities related to construction contracts -115 883 -86 125<br />
Note 2 Inventories<br />
(AMOUNTS IN NOK 1000)<br />
<strong>2006</strong> 2005<br />
Inventories, incl. non-current 33 675 32 635<br />
Non-current inventories -7 452 -7 619<br />
Total inventories 26 223 25 016<br />
Work in progress 0 534<br />
Book value of inventories pledged as security for liabilities 26 223 25 550<br />
Note 3 Personnel expenses, number of employees, other remunerations, loans to employees, etc.<br />
(AMOUNTS IN NOK 1000)<br />
Payroll expenses <strong>2006</strong> 2005<br />
Salaries 62 460 53 308<br />
Employer’s social security contribution 9 661 9 694<br />
Pension costs 3 726 3 242<br />
Other benefits* 4 519 2 832<br />
Total personnel expenses 80 366 69 076<br />
Number of employees as of 31 December 141 118<br />
Remuneration to board members <strong>2006</strong><br />
Nils Aardal (Board Chairman from 30.05.06) 268<br />
Einar Pedersen (Board Chairman to 30.05.06) 129<br />
Anne Breive 170<br />
Hilde P. AA. Krøgenes 170<br />
John M. Lunde 170<br />
Olav Smeland (from August <strong>2006</strong>) 21<br />
Mona L. Tellnes Halvorsen (to August <strong>2006</strong>) 47<br />
Oddmund Hatletun 50<br />
77
4-10 <strong>TTS</strong> GROUP 11-13 REPORT FROM THE CEO 14-27 BUSINESS AREAS 28-37 CORPORATE GOVERNANCE 36-87 DIRECTOR’S REPORT AND ACCOUNTS<br />
Nomination committee remuneration<br />
<strong>TTS</strong>’s nominations committee comprises the following members: Bjørn Olafsson (Chairman), Bjørn Sjaastad and Harald Espedal.<br />
Proposed remuneration <strong>2006</strong> is TNOK 30 to the chairman, and TNOK 20 to members, a total of TNOK 70.<br />
STATEMENT REGARDING THE STIPULATION OF REMUNERATION AND OTHER BENEFITS FOR THE PRESIDENT & CEO AND OTHER EXECUTIVES<br />
The remuneration policy of <strong>TTS</strong> Marine <strong>ASA</strong> is based on offering the group management competitive conditions.<br />
The level of remuneration shall reflect that the company is a listed company focusing internationally.<br />
The annual remuneration is based on the group management taking part in the company’s results, and in the added value for the shareholders<br />
through increased company value.<br />
Remuneration consists of three main components; base salary, bonus and a share option program.<br />
Bonus is determined on the basis of target results. In certain circumstances where change and development are of a decisive nature,<br />
the bonus is further based on specific development targets. Bonus targets are revisited annually.<br />
The maximum bonus is one year’s base salary for the President & CEO, and up to 50 percent for other executives.<br />
Since 1998, a share option program has been active for the group management of <strong>TTS</strong>; the goal being that the group management shall have<br />
the same incentive as the shareholders in respect of increasing company value over time. The Annual General Meeting has each year given<br />
the Board authority to establish share option programs with a two year term. Redemption price equals market price on allotment.<br />
First exercise is 50 percent after one year. Thereafter 12.5 percent per quarter, in addition to share options that have not been previously exercised.<br />
Share options may not be exercised subsequent to the second anniversary.<br />
The group pension scheme in Norway is based on approximately 65 percent of base salary at the age of 67, limited to a maximum of 12G.<br />
For employees abroad, the schemes prevailing in the respective companies where they are employed apply.<br />
The period of notice is 6 months with a severance pay from 6 to 24 months, period of notice inclusive.<br />
The share option program is conditional upon the Annual General Meeting’s approval, based on the Board being granted authority to make such<br />
allotments. The President & CEO’s remuneration is determined by the Board of <strong>TTS</strong> Marine <strong>ASA</strong>.<br />
With respect to other executives, their remuneration is determined by the boards of the respective subsidiaries/President & CEO.<br />
REMUNERATION AND OTHER BENEFITS FOR THE PRESIDENT & CEO AND OTHER EXECUTIVES<br />
Name Position Remuneration Other Bonus Share- Pension<br />
benefits paid options Total benefits<br />
Johannes D. Neteland President & CEO 1 456 151 680 2 341 4 627 632<br />
Olav Bruåsdal Financial Director 984 17 191 936 2 128 247<br />
Ivar K. Hanson Man. Director MC 1 095 107 160 936 2 298 62<br />
Hans-Jan Erstad Manager HR-IT-QA 641 102 4 936 1 683 119<br />
Göran K. Johansson Man. Director PMH 1 395 14 581 936 2 927 482<br />
Stellan Bernsro Man. Director DCH 922 15 0 0 937 275<br />
Edgar Bethmann Man. Director DM 1 186 142 0 0 1 328 121<br />
Remuneration Taxable remuneration<br />
Other benefits Free car, life insurance, telephone, newspapers etc.<br />
Bonus paid Bonus paid in current year<br />
Share options Difference between market price and exercise price<br />
Total Total taxable remuneration<br />
The pension premium for the President & CEO is based on pension payments of approximately 65 percent of his base salary from the age of 67,<br />
for the CFO approximately 65 percent of a maximum of 12G. In addition, an early retirement scheme from the age of 60 that pays approximately<br />
60 percent of base salary is established. With effect from 2007, the group pension scheme will be based on approximately 65 percent of base<br />
salary at the age of 67, limited to a maximum of 12G. Additional pension benefits will be adjusted similar to other benefits.<br />
The period of notice for the President & CEO is 6 months, with a severance pay of 24 months, period of notice inclusive, and from 6 to 24 months<br />
for other group executives.<br />
AUDITOR FEES<br />
<strong>2006</strong> 2005<br />
Statutory auditing 769 705<br />
Other assistance including tax consulting 661 159<br />
Total 1 430 864<br />
78
Note 4 Pension<br />
(AMOUNTS IN NOK 1000)<br />
The Norwegian companies in the group have defined benefit pension schemes that entitle the employees to defined future pension benefits<br />
dependent on the number of years of service, salary level, retirement age and National Insurance benefits received.<br />
The pension scheme includes 120 persons as of 31 December <strong>2006</strong>.<br />
Net pension funds recorded on the balance sheet<br />
are determined as follows: <strong>2006</strong> 2005<br />
Insured Uninsured Total Insured Uninsured Total<br />
Market value of pension funds 25 743 0 25 743 24 181 0 24 181<br />
- Net present value of accrued pension obligations -30 186 -1692 -31 878 -29 614 -1 112 -30 726<br />
+ Unrecognised estimate changes and deviations 2 162 222 2 384 1 865 82 1 947<br />
+ Unrecognised costs related to pension benefits<br />
earned in prior periods 0 0 0 0 0 0<br />
- Accrued employer’s share of NI contributions 0 103 103 558 145 703<br />
= Net pension obligation -2 281 -1 175 -3 854 -4 126 -1 175 -5 301<br />
Net pension costs are determined as follows: 2005 2004<br />
Insured Uninsured Total Insured Uninsured Total<br />
Net present value of current year’s<br />
pension benefits accrued 2 795 240 3 035 2 558 218 2 776<br />
+ Interest payable on pension obligations 1 461 56 1 516 1 411 41 1 452<br />
- Expected return on pension funds -1 541 0 -1 541 -1 405 0 -1 405<br />
+ Recognised estimate changes and deviations 319 0 319 319 1 320<br />
+ Change in employer’s share of NI contributions 79 24 103 77 22 99<br />
+ Tap ved reduksjon av pensjonsordning 0 0 0 0 0 0<br />
= Total costs, including payroll expenses 3 406 320 3 725 2 960 282 3 242<br />
Change in book value of funds: <strong>2006</strong> 2005<br />
Book value as of 1 January -5 301 -5 983<br />
- Costs recognised during the year (see above) -3 725 3 242<br />
+/- Pension payments and payment of pension premiums 5 172 3 924<br />
= Book value as of 31 December -3 854 -5 301<br />
The following economic assumptions have been made for<br />
calculation of the pension obligations: <strong>2006</strong> 2005<br />
31.12. 1.1 31.12. 1.1<br />
Return on pension funds 5.40 % 5.5 % 5.5 % 6.0 %<br />
Discount rate 4.35 % 4.5 % 4.5 % 5.0 %<br />
Annual wage inflation 4.50 % 3.0 % 3.0 % 3.0 %<br />
Annual adjustment of the basic National Insurance amount (G) 4.25 % 2.0 % 2.0 % 2.0 %<br />
Annual adjustment of pensions being paid out 1.65 % 2.0 % 2.0 % 2.0 %<br />
Voluntary retirement 10.00 % 10.0 % 10.0 % 10.0 %<br />
Withdrawal tendency for early retirement (AFP) 45.00 % 45.0 % 45.0 % 45.0 %<br />
Employer’s share of National Insurance contributions 14.10 % 14.1 % 14.1 % 14.1 %<br />
79
4-10 <strong>TTS</strong> GROUP 11-13 REPORT FROM THE CEO 14-27 BUSINESS AREAS 28-37 CORPORATE GOVERNANCE 36-87 DIRECTOR’S REPORT AND ACCOUNTS<br />
Note 5 Tangible fixed assets<br />
(AMOUNTS IN NOK 1000)<br />
Furniture<br />
Machinery and office Computer<br />
and vehicles equipment equipment Total<br />
AS OF 1 JANUARY 2005<br />
Historical cost as of 1 January 6 328 4 502 5 883 16 713<br />
Accumulated depreciation as of 1 January -4 768 -3 435 -5 838 -14 041<br />
Book value as of 1 January 1 560 1 067 45 2 672<br />
2005 FINANCIAL YEAR<br />
Book value as of 1 January 1 560 1 067 45 3 624<br />
Additions during the year 343 430 9 404 10 177<br />
Disposals during the year -33 0 0 -33<br />
Depreciation for the year -506 -435 -2 322 -3 263<br />
Book value as of 31 December 1 364 1 062 7 127 9 553<br />
AS OF 31 DECEMBER 2005<br />
Acquisition cost as of 31 December 6 421 4 932 15 287 26 640<br />
Accumulated depreciation as of 31 Dec. -5 057 -3 870 -8 160 -17 087<br />
Book value as of 31 December 1 364 1 062 7 127 9 553<br />
<strong>2006</strong> FINANCIAL YEAR<br />
Book value as of 1 January 1 364 1 062 7 127 9 553<br />
Additions during the year 589 959 81 1 629<br />
Disposals during the year 0 0 0 0<br />
Depreciation for the year -506 -521 -2 395 -3 422<br />
Book value as of 31 December 1 447 1 501 4 813 7 760<br />
AS OF 31 DECEMBER <strong>2006</strong><br />
Historical cost as of 31 December 7 010 5 891 15 368 28 269<br />
Accumulated depreciation as of 31 Dec. -5 563 -4 391 -10 555 -20 509<br />
Book value as of 31 December 1 447 1 501 4 813 7 760<br />
Property in the Norwegian companies has been pledged as security for long-term and short-term debt to credit institutions, see Note 11.<br />
Note 6 Intangible fixed assets<br />
(AMOUNTS IN NOK 1000)<br />
R&D, patents, licences Goodwill Total<br />
AS OF 1 JANUARY 2005<br />
Historical cost as of 1 January 1 020 26 104 27 124<br />
Accumulated depreciation as of 1 January -1 020 -3 304 -4 324<br />
Book value as of 1 January 0 22 800 22 800<br />
2005 FINANCIAL YEAR<br />
Book value as of 1 January 0 22 800 22 800<br />
Translation differences 0 0 0<br />
Additions during the year 2 000 0 2 000<br />
Disposals during the year 0 0 0<br />
Depreciation for the year 0 -1 493 -1 493<br />
Book value as of 31 December 0 21 307 23 307<br />
AS OF 31 DECEMBER 2005<br />
Acquisition cost as of 31 December 3 020 26 104 29 124<br />
Accumulated depreciation as of 31 December -1 020 -4 797 -5 817<br />
Book value as of 31 December 2 000 22 800 23 307<br />
<strong>2006</strong> FINANCIAL YEAR<br />
Book value as of 1 January 2 000 21 307 23 307<br />
Additions during the year 2 530 0 2 530<br />
Disposals during the year 0 0 0<br />
Depreciation for the year 0 -1 493 -1 493<br />
Book value as of 31 December 4 530 19 814 24 344<br />
AS OF 31 DECEMBER <strong>2006</strong><br />
Historical cost as of 31 December 5 550 26 105 31 655<br />
Accumulated depreciation as of 31 December -1 020 -6 290 -7 310<br />
Book value as of 31 December 4 530 19 815 24 345<br />
80
Note 7 Shares in other companies<br />
(AMOUNTS IN NOK 1000)<br />
Ownership interest Historical cost Book value<br />
Fixed assets<br />
Shin Young Heavy industry 13.4 % 222 222<br />
FastShip Inc. * 6.7 % 13 326 13 326<br />
Total shares in other companies 13 548 13 548<br />
*) In the balance sheet as of 31 December the company has recorded 615 156 shares in FastShip Inc (FSI) at a book value of NOK 13.3 million.<br />
In addition, three convertible loans have been recorded at NOK 5.8 million, which corresponds to 408 257 shares. Shares and convertible loans<br />
have been recorded at USD 2.8 and USD 2.04 per share, respectively, which corresponds to an average of USD 2.5 per share. <strong>TTS</strong> has been involved<br />
in the FastShip project since 1996. Provided the project is realised, <strong>TTS</strong> will through patented technology get contracts of a total value over<br />
NOK 1.000 million. If the FSI project is not realised, and <strong>TTS</strong> must write off NOK 19.2 million, the equity will be reduced with the total amount.<br />
The write off will not affect the liquidity. See also the discussion in the Directors’ Report.<br />
Note 8 Subsidiaries<br />
(AMOUNTS IN NOK 1000)<br />
Acquisition Ownership Voting<br />
Subsidiaries Registered office date interest share<br />
<strong>TTS</strong> Handling Systems AS Drøbak, Norway 1994 100 % 100 %<br />
<strong>TTS</strong> Ships Equipment AS Bergen, Norway 1996 100 % 100 %<br />
Norlift AS Bergen, Norway 1994 100 % 100 %<br />
Hydralift Marine AS Kristiansand, Norway 2003 100 % 100 %<br />
<strong>TTS</strong> Ships Equipment AB Gothenburg, Sweden 2002 100 % 100 %<br />
<strong>TTS</strong> Marine Shanghai Co Ltd Shanghai, China 2002 100 % 100 %<br />
<strong>TTS</strong> Marine Cranes AS Bergen, Norway <strong>2006</strong> 100 % 100 %<br />
Associated companies<br />
<strong>TTS</strong> Bohai Machinery Co., Ltd Dalian, China 2005 50 % 50 %<br />
Companies are accounted for in accordance with the equity method.<br />
<strong>TTS</strong> HS Norlift <strong>TTS</strong> SE AS <strong>TTS</strong> SE AB <strong>TTS</strong> Ma.Sh. <strong>TTS</strong> Cranes Total<br />
Historical cost at time of acquisition 9 589 500 14 232 303 180 1 386 328 887<br />
Of which goodwill 7 129 255 163 2 053 264 345<br />
Of which excess value -453 -453<br />
UNAMORTISED EXCESS VALUE/GOODWILL AS OF 31 DECEMBER<br />
Goodwill 4 585 220 288 1 899 226 772<br />
Amortisation of GW -424 -11 328 -103 -11 855<br />
Unamortised goodwill as of 31 December 0 0 4 161 208 960 1 796 214 918<br />
CALCULATION OF PROFIT FOR THE YEAR<br />
Share of profit/loss for the year -1 317 20 2 514 69 170 3066 73 453<br />
Amortisation of goodwill -424 -11 327 -103 -11 855<br />
Elimination of intragroup transactions 150 0 150<br />
Income from investments in subsidiaries -1 167 20 2 090 57 843 2 963 61 749<br />
SHARES IN SUBSIDIARIES:<br />
Opening balance 1 January 3 580 361 16 865 261 645 -1 006 281 445<br />
Additions associated companies/subsidiaries 0 0 0 0 0 40 000 40 000<br />
Disposals subsidiaries 0 0 0 0 3 319 3 319<br />
Income from investments in subsidiaries -1 676 20 2 090 57 842 2964 61 748<br />
Foreign currency effects 0 0 0 10 500 27 10 526<br />
Closing balance 31 December 2 413 380 18 955 329 987 5 303 40 000 397 039<br />
<strong>TTS</strong> Bohai<br />
SHARES IN JOINT VENTURES Machinery Co., Ltd<br />
Opening balance 1 January 8 454<br />
Acquisition/Start-up of the company 0<br />
Share of profit/loss -458<br />
Dividends 0<br />
Forgiveness of debt 0<br />
Effect of foreign currencies -364<br />
Disposal of shares in associated companies 0<br />
Closing balance 31 December 7 631<br />
81
4-10 <strong>TTS</strong> GROUP 11-13 REPORT FROM THE CEO 14-27 BUSINESS AREAS 28-37 CORPORATE GOVERNANCE 36-87 DIRECTOR’S REPORT AND ACCOUNTS<br />
Note 9 Customer and other receivables<br />
(AMOUNTS IN NOK 1000)<br />
<strong>2006</strong> 2005<br />
Receivables from customers 57 174 46 226<br />
Receivables from internal customers 34 386 23 491<br />
Write-down for losses incurred on receivables from cust. -1 400 -1 000<br />
Net receivables from customers 90 160 68 717<br />
RECEIVABLES THAT MATURE AFTER MORE THAN ONE YEAR<br />
Other receivables 5 830 5 830<br />
Loans to companies in the same group 22 082 68280<br />
Total 27 912 74 110<br />
<strong>TTS</strong> Marine <strong>ASA</strong> has a convertible loan of NOK 5 830 000 related to FastShip Inc., see Note 7.<br />
There are no credit risk concentrations within the receivables from customers since the company has many customers distributed throughout<br />
a number of countries.<br />
Note 10 Long-term liabilities<br />
(AMOUNTS IN NOK 1000)<br />
REPAYMENT PROFILE AND MATURITY<br />
Balance as of 2012<br />
31 December <strong>2006</strong> 2007 2008 2009 2010 2011 and later<br />
Long term liabilities 146 329 11 269 11 270 109 726 9 045 5 019 0<br />
Foreign Interest Instalment Book<br />
Specification of loans<br />
<strong>TTS</strong> MARINE <strong>ASA</strong><br />
Type of loan currency rate Maturity terms value<br />
Nordea Mortgage loan NOK Nibor+1.35 % 2011 4 per year 32 150<br />
Nordea Mortgage loan NOK Nibor+1.35 % 2009 4 per year 100 000<br />
Elcon Finans Other long-term NOK 4.30 % 2009 12 per year 214<br />
Norfund Mortgage loan NOK 4.48 % 2011 4 per year 9 048<br />
SG Finans Other long-term NOK 4.50 % 2008 12 per year 4 918<br />
Total 146 329<br />
See Note 11 for security for long-term debt.<br />
Note 11 Assets pledged as security and guarantees<br />
(AMOUNTS IN NOK 1000)<br />
The credit agreement for <strong>TTS</strong> Marine <strong>ASA</strong> in Norway was established (50/50) with Nordea Norge <strong>ASA</strong> (Nordea) and Sparebanken Vest<br />
(SparebankenVest), and Nordea is the agent. As security for the company’s participation in the cash pool account system and the group’s<br />
guarantee limit system, the following assets in Norway have been pledged as security to Nordea.<br />
<strong>2006</strong> 2005<br />
Secured debt 146 329 184 256<br />
Assets at book value<br />
Customer/intragroup receivables 107 754 73 790<br />
Non-invoiced production 122 373 92 287<br />
Inventories/work in progress 26 223 25 550<br />
Prepayments to suppliers 54 963 27 782<br />
Property 0 -<br />
Total assets pledged as security 311 313 219 409<br />
In addition, leases in Norway including machinery and plant, as well as shares in <strong>TTS</strong> Ships Equipment AB, have also been pledged as security.<br />
The nominal value of the mortgage bond is NOK 200 000 000.<br />
The group has also undertaken to meet the following financial str<strong>eng</strong>th requirements for Nordea: There is a requirement that the equity shall<br />
be greater than NOK 350 million at any time. In addition the equity ratio shall be greater than 30 per cent as of 31 December. With equity of<br />
NOK 598.1 million and an equity ratio of 36.6 per cent, the group meets these requirement.<br />
GUARANTEE COMMITMENTS, JOINT AND SEVERAL LIABILITY<br />
The companies in Norway, as well as <strong>TTS</strong> Ships Equipment AB and <strong>TTS</strong> Ships Equipment GmbH, participate in a guarantee pool system that covers<br />
payment guarantees, contract guarantees, advance payment guarantees and tax guarantees within a total limit of NOK 100 000 000. As security<br />
for this guarantee pool, the Norwegian companies’ inventories, accounts receivable, leases including machinery and plant and the credit balance on<br />
advance payment accounts have been pledged. The companies in Norway are jointly and severally liable.<br />
Total drawdown in the guarantee pool as of 31 December was TNOK 99 270 for the group.<br />
82
Note 12 Taxes<br />
(AMOUNTS IN NOK 1000)<br />
Change in deferred tax assets and deferred taxes:<br />
1.1.2005 Changes 2005 31.12.2005 Changes <strong>2006</strong> 31.12.<strong>2006</strong><br />
DEFERRED TAXES<br />
Fixed assets 1 797 422 2 219 67 2 286<br />
Accounts receivable 209 -195 15 -15 0<br />
Construction contracts 7 077 2 828 9 905 3 427 13 332<br />
Other temporary differences -1 027 339 -688 688 0<br />
Total deferred taxes 8 056 3 394 11 451 4 168 11 763<br />
DEFERRED TAX ASSETS<br />
Accounts receivable 0 0 0 -392 -392<br />
Inventories -1 675 191 -1 484 -649 -2 133<br />
Pension funds -1 853 -280 -2 133 1 054 -1 079<br />
Other provisions for liabilities and charges 0 0 0 -573 -573<br />
Total deferred tax assets -3 528 -89 -3 617 -561 -2 133<br />
Net deferred taxes 4 528 3 305 7 834 3 607 11 441<br />
Tax credit deduction carryforward -6 182 0 -6 182 0 -6 182<br />
Tax allowance carryforward -1 260 0 -1 260 0 -1 260<br />
Tax loss carryforward -22 108 -8 844 -30 952 -7 387 -38 339<br />
Net deferred tax assets -25 022 -8 844 -30 952 -3 779 -34 339<br />
Excess allocation 387 765 1 152 279 1 431<br />
Unrecognised deferred tax assets<br />
related to allowance 1 260 0 1 260 0 1 260<br />
Net deferred tax assets on the balance sheet -23 375 -4 771 -28 146 -3 500 -31 648<br />
The deferred tax assets related to tax loss carryforwards are recognised on the balance sheet when the management believes that it is<br />
probable that the company can apply this against future taxable income.<br />
Specification of differences between the financial profit before tax and the tax basis for the year: <strong>2006</strong> 2005<br />
Pre-tax profit/loss 46 587 22 094<br />
Permanent differences -1 207 -733<br />
Change in the assessment in relation to previous year’s accounts 0 0<br />
Change in temporary profit/loss differences -10 154 -11 807<br />
Reversed share of profit/loss in subsidiaries -61 290 -42 827<br />
Application of tax loss carryforward 0 0<br />
Tax basis for the year -26 064 -33 272<br />
Breakdown of the tax charge:<br />
Tax payable 0 0<br />
Effect of group contribution on deferred taxes 0 0<br />
Effect of too little allocated deferred tax assets 0 0<br />
Effect of foreign exchange fluctuations 0 0<br />
Change in deferred taxes -3 499 -4 773<br />
Tax charge -3 499 -4 773<br />
Tax payable on the balance sheet:<br />
Tax payable 0 0<br />
Tax effect of group contributions 0 0<br />
Tax payable on balance sheet 0 0<br />
Explanation of why the tax for the year is not 28 % of the profit before tax:<br />
28 % of the profit before tax 13 044 6 186<br />
Too little/much allocated deferred taxes 956 1 300<br />
Permanent differences, including amortisation of goodwill -17 499 -12 258<br />
Estimated tax charge -3 499 -4 773<br />
83
4-10 <strong>TTS</strong> GROUP 11-13 REPORT FROM THE CEO 14-27 BUSINESS AREAS 28-37 CORPORATE GOVERNANCE 36-87 DIRECTOR’S REPORT AND ACCOUNTS<br />
Note 13 Liquid assets / short-term interest-bearing liabilities<br />
(AMOUNTS IN NOK 1000)<br />
<strong>2006</strong> 2005<br />
Bank deposits, cash, etc. as of 31 December<br />
Deposits(+)/withdrawals(–) in the cash pool<br />
4 239 2 650<br />
account system as of 31 December 24 409 -127 160<br />
<strong>TTS</strong> Marine <strong>ASA</strong> administers a cash pool account system. The group has been granted a credit limit for the group of NOK 100 000 000.<br />
The companies that participate in the scheme are jointly and severally liable for the total limit.<br />
Note 14 Share capital and shareholder information<br />
Number of shares as of 31 Dec. Nominal value Book value of share capital<br />
22 492 904 0.50 11 246 452<br />
THE FOLLOWING COMPANIES ARE INCLUDED IN THE <strong>TTS</strong> MARINE GROUP:<br />
FIGURES IN NOK 1000<br />
Company Owner Ownership interest Share capital Number of shares<br />
Norlift AS (formerly <strong>TTS</strong> Eiendom AS) <strong>TTS</strong> Marine <strong>ASA</strong> 100 % NOK 500 000 500<br />
<strong>TTS</strong> Handling Systems AS <strong>TTS</strong> Marine <strong>ASA</strong> 100 % NOK 950 000 95 000<br />
<strong>TTS</strong> Ships Equipment AS <strong>TTS</strong> Marine <strong>ASA</strong> 100 % NOK 2 500 000 2 500<br />
Hydralift Marine AS <strong>TTS</strong> Marine <strong>ASA</strong> 100 % NOK 100 000 1 000<br />
<strong>TTS</strong> Ships Equipment AB <strong>TTS</strong> Marine <strong>ASA</strong> 100 % SEK 2 000 000 2 000<br />
<strong>TTS</strong> Marine Shanghai Co. Ltd. <strong>TTS</strong> Marine <strong>ASA</strong> 100 % USD 200 000 3 500<br />
<strong>TTS</strong> Ships Equipment GmbH <strong>TTS</strong> Ships Equipment AB 100 % EUR 255 646 5 000<br />
<strong>TTS</strong> Inc. <strong>TTS</strong> Ships Equipment AB 100 % USD 190 000 1 900<br />
<strong>TTS</strong>-LMG Marine Cranes GmbH <strong>TTS</strong> Ships Equipment AB 100 % EUR 25 000 1<br />
<strong>TTS</strong> Liftec Oy <strong>TTS</strong> Ships Equipment AB 100 % EUR 76 500 1 020<br />
<strong>TTS</strong> Port Equipment AB <strong>TTS</strong> Ships Equipment AB 100 % SEK 100 000 1 000<br />
<strong>TTS</strong> Kocks GmbH <strong>TTS</strong> Ships Equipment AB 100 % EUR 1 000 000 1 000<br />
<strong>TTS</strong> Kocks Ostrava s.r.o. <strong>TTS</strong> Ships Equipment AB 100 % EUR 310 291 1 000<br />
<strong>TTS</strong> Marine S.r.l <strong>TTS</strong> Ships Equipment AB 100 % EUR 10 400 1 000<br />
<strong>TTS</strong> Marine Cranes AS <strong>TTS</strong> Marine <strong>ASA</strong> 100 % NOK 1 000 000 1 000<br />
THE LARGEST SHAREHOLDERS IN <strong>TTS</strong> MARINE <strong>ASA</strong> AS OF 31 DECEMBER <strong>2006</strong> WERE:<br />
FIGURES IN NOK 1000<br />
Shareholder Number of shares Ownership interest Voting share<br />
Skeie <strong>Group</strong> 8 280 000 36.81 % 36.81 %<br />
Morgan Stanley and Co. Intl.Limited 2 575 407 11.45 % 11.45 %<br />
JCE <strong>Group</strong> AB 2 050 000 9.11 % 9.11 %<br />
IF Skadeforsakring AB 1 316 400 5.85 % 5.85 %<br />
Rasmuss<strong>eng</strong>ruppen AS 1 254 000 5.58 % 5.58 %<br />
Bank of New York, Brüssels brance 843 483 3.75 % 3.75 %<br />
Nordea Bank PLC Finland 752 600 3.35 % 3.35 %<br />
Odin Europa SMB 396 400 1.76 % 1.76 %<br />
Verdipapirfond Odin Maritim 370 000 1.64 % 1.64 %<br />
Stichting Shell Pensionfonds 288 256 1.28 % 1.28 %<br />
Stiftelsen Statoils Pensjonskasse 254 600 1.13 % 1.13 %<br />
DnB Nor SMB 222 600 0.99 % 0.99 %<br />
Lectio AS 189 200 0.84 % 0.84 %<br />
JPMorgan Chase Bank 180 000 0.80 % 0.80 %<br />
Vital Forsikring <strong>ASA</strong> 167 343 0.74 % 0.74 %<br />
DFA-Intl. SML CAP VAL PORT 161 700 0.72 % 0.72 %<br />
Arne Ketil Kyrkjebø 154 400 0.69 % 0.69 %<br />
Statoil Forsikring AS 148 050 0.66 % 0.66 %<br />
Goldman Sachs International 130 900 0.58 % 0.58 %<br />
Alden AS 125 800 0.56 % 0.56 %<br />
Total 20 largest shareholders 19 861 139 88.30 % 88.30 %<br />
Total others 2 631 765 11.70 % 11.70 %<br />
Total 22 492 904 100.00 % 100.00 %<br />
84
Board member Oddmund Hatletun had 1 493 shares, Board member Olav Smeland had 800 shares, while President & CEO Johannes D. Neteland<br />
had 82 500 shares and options to purchase 137 500 shares.<br />
On 30 May <strong>2006</strong> the Annual General Meeting resolved to grant the Board authority to issue a maximum of 4 000 000 shares in the event of<br />
an acquisition or merger. This authorisation is valid until the Annual General Meeting for <strong>2006</strong>, and no later than 30 June 2007. As a result of<br />
acquisitions completed, a total of 2 039 300 shares were issued as of 7 December <strong>2006</strong>.<br />
As of 31 December <strong>2006</strong>, 112 500 options were allotted that can be exercised until 9 June 2007 at a price of NOK 26 5 (from an authorisation for<br />
a total of 300 000 options granted at the Ordindary General Meeting of 9 June 2005). In addition to 340 000 options that can be exercised until<br />
30 May 2008 at a price of NOK 35. (from an authoristion for a total of 340 000 options granted at the Ordinary General Meeting of 30 May <strong>2006</strong>).<br />
THE DISTRIBUTION OF OPTIONS IS AS FOLLOWS:<br />
No. of No. of<br />
options that options that<br />
can be exercised can be exercised<br />
Name Position Company until 6/09/07 Price until 6/09/07 Price Total<br />
Johannes D. Neteland President & CEO <strong>TTS</strong> Marine <strong>ASA</strong> 37 500 26.50 100 000 35.00 137 500<br />
Olav Bruåsdal Financial director <strong>TTS</strong> Marine <strong>ASA</strong> 15 000 26.50 40 000 35.00 55 000<br />
Hans-Jan Erstad Chief of staff <strong>TTS</strong> Marine <strong>ASA</strong> 15 000 26.50 40 000 35.00 55 000<br />
Göran K. Johansson Division Director <strong>TTS</strong> Port Equipment AB 15 000 26.50 40 000 35.00 55 000<br />
Bjørn O. Hansen Proj. director <strong>TTS</strong> Handling Systems AS 15 000 26.50 0 0 15 000<br />
Ivar K. Hanson Division director <strong>TTS</strong> Marine <strong>ASA</strong> 15 000 26.50 40 000 35.00 55 000<br />
Stellan Bernsro Managing Director <strong>TTS</strong> Ships Equipment AB 0 0 40 000 35.00 40 000<br />
Edgar Bethman Division Director <strong>TTS</strong> Kocks GmbH 0 0 40 000 35.00 40 000<br />
Total number of options to leading employees 112 500 340 000 452 500<br />
Share options exercised in <strong>2006</strong> resulted in the issue of a total of 337 500 shares. 150 000 of these shares were issued at NOK 14 per share,<br />
with a weighted average market price on the date of issue of NOK 37.00 per share. 187 500 shares were issued at NOK 26.50 per share, with<br />
a weighted average market price per share of NOK 45.44 on the date of issue.<br />
A resolution was adopted at the Annual General Meeting of 30 May <strong>2006</strong> to authorise the Board to purchase a maximum of 300 000 of the<br />
company’s own shares. This authorisation is valid until the Annual General Meeting for <strong>2006</strong>, and no later than 30 June 2007. This authorisation<br />
has not been utilised as of 29 March 2007.<br />
In accordance with earlier authorisations for the purchase of the company’s own shares, <strong>TTS</strong> has purchased 70 000 shares and subsequently sold<br />
shares to the employees at a discounted price. As of 31 December <strong>2006</strong> the company held 6 700 of its own shares.<br />
In accordance with authorities granted by the Annual General Meeting in 2005 and <strong>2006</strong>, <strong>TTS</strong> has issued share option programmes to its employees<br />
Through these programmes, <strong>TTS</strong>’ employees have a future right to purchase a number of shares at a strike price equal to the marked rate on the<br />
date that the share purchase programme was initiated.<br />
The option premium is estimated on the date of allotment using the Black & Scholes option pricing model (BS).<br />
The options have a maximum term of two years, with a possible first exercise after one year (50 percent), then (12.5 percent) per quarter, giving<br />
a weighted averaged of 15 months maturity which is employed in BS. The option premium is distributed over the option’s two-year term.<br />
Implied volatility is based on a combination of historic data and discretion. For options issued in 2005, a 25 percent volatility is used (historically<br />
23 percent), and for <strong>2006</strong>, a 30 percent volatility (historically 31.2 percent).<br />
For 2005, a risk-free interest rate of 3.0 percent is used, and for <strong>2006</strong> a rate of 3.5 percent. For <strong>2006</strong>, NOK 978 in option premium is charged as<br />
an expense classified as salary in the profit and loss account.<br />
Employers’ national insurance contribution is charged as an expense upon exercise of options. For <strong>2006</strong>, NOK 858 million is charged as an expense<br />
classified as salary in the profit and loss account.<br />
Note 15 Other short-term liabilities<br />
(AMOUNTS IN NOK 1000)<br />
<strong>2006</strong> 2005<br />
Provisions for projects 2 747 4 642<br />
Other provisions 11 989 9 553<br />
Total short-term liabilities 14 736 14 195<br />
85
4-10 <strong>TTS</strong> GROUP 11-13 REPORT FROM THE CEO 14-27 BUSINESS AREAS 28-37 CORPORATE GOVERNANCE 36-87 DIRECTOR’S REPORT AND ACCOUNTS<br />
Note 16 Other operating expenses<br />
(AMOUNTS IN NOK 1000)<br />
<strong>2006</strong> 2005<br />
Rent, costs for premises 8 763 7 437<br />
EDP costs 2 615 60<br />
Marketing, travel 11 221 7 678<br />
Other 10 889 14 088<br />
Total other operating expenses 33 489 29 263<br />
Note 17 Related parties<br />
All the underlying subsidiaries (Note 9), joint ventures (Note 10), members of the Board (Note 4) and senior management are regarded<br />
as related parties.<br />
The group has carried out various transactions with underlying companies and joint ventures. All the transactions have been carried out<br />
at part of the ordinary operations and at arm’s l<strong>eng</strong>th prices.<br />
Note 18 Financial items and foreign currency gains/losses<br />
(AMOUNTS IN NOK 1000)<br />
<strong>2006</strong> 2005<br />
Income from investments in subsidiaries 61 748 43 599<br />
Income from investments in associated companies -458 -772<br />
Other interest income 4 062 1 767<br />
Bank loans -12 240 -7 274<br />
Other financial expenses -1 412 -1 220<br />
Net foreign currency gains/losses -724 -261<br />
Total 50 977 35 840<br />
FOREIGN CURRENCY GAINS/LOSSES<br />
The foreign currency differences that are recognised in the profit and loss account are as follow:<br />
<strong>2006</strong> 2005<br />
Foreign currency gains 7 054 5 620<br />
Foreign currency losses -7 778 -5 881<br />
Total -724 -261<br />
Foreign currency gains are included in other financial income in the profit and loss account,<br />
and foreign currency losses<br />
86
Auditor’s report<br />
<strong>2006</strong><br />
To the Annual Shareholders' Meeting of <strong>TTS</strong> Marine <strong>ASA</strong><br />
Auditor’s report for <strong>2006</strong><br />
PricewaterhouseCoopers AS<br />
Postboks 3984 – Dreggen<br />
5835 Bergen<br />
Telephone +47 02316<br />
Telefax +47 23 16 10 00<br />
We have audited the annual financial statements of <strong>TTS</strong> Marine <strong>ASA</strong> as of December 31, <strong>2006</strong>, showing a profit of<br />
NOK 50 085 509 for the parent company and a profit of NOK 60 481 107 for the group. We have also audited the<br />
information in the directors' report concerning the financial statements, the going concern assumption, and the proposal<br />
for the allocation of the profit. The annual financial statements comprise the financial statements of the parent company<br />
and the group. The financial statements of the parent company comprise the balance sheet, the statements of income<br />
and cash flows, the statement of changes in equity and the accompanying notes. The financial statements of the group<br />
comprise the balance sheet, the statement of income and cash flows, the statement of changes in equity and the<br />
accompanying notes. The regulations of the Norwegian accounting act and accounting standards, principles and<br />
practices generally accepted in Norway have been applied in the preparation of the financial statements of the parent<br />
company. IFRSs as adopted by the EU have been applied in the preparation of the financial statements of the group.<br />
These financial statements are the responsibility of the Company’s Board of Directors and Managing Director. Our<br />
responsibility is to express an opinion on these financial statements and on other information according to the<br />
requirements of the Norwegian Act on Auditing and Auditors.<br />
We conducted our audit in accordance with laws, regulations and auditing standards and practices generally accepted<br />
in Norway, including standards on auditing adopted by The Norwegian Institute of Public Accountants. These auditing<br />
standards require that we plan and perform the audit to obtain reasonable assurance about whether the financial<br />
statements are free of material misstatement. An audit includes examining, on a test basis, evidence supporting the<br />
amounts and disclosures in the financial statements. An audit also includes assessing the accounting principles used<br />
and significant estimates made by management, as well as evaluating the overall financial statement presentation.<br />
To the extent required by law and auditing standards an audit also comprises a review of the management of the<br />
Company's financial affairs and its accounting and internal control systems. We believe that our audit provides a<br />
reasonable basis for our opinion.<br />
In our opinion,<br />
• the financial statements of the parent company have been prepared in accordance with the law and regulations and<br />
give a true and fair view of the financial position of the company as of December 31, <strong>2006</strong>, and the results of its<br />
operations and its cash flows and the changes in equity for the year then ended, in accordance with accounting<br />
standards, principles and practices generally accepted in Norway<br />
• the financial statements of the group have been prepared in accordance with the law and regulations and give a true<br />
and fair view of the financial position of the group as of December 31, <strong>2006</strong>, and the results of its operations and<br />
• its cash flows and the changes in equity for the year then ended, in accordance with IFRSs as adopted by the EU<br />
• the company's management has fulfilled its duty to produce a proper and clearly set out registration and<br />
documentation of accounting information in accordance with the law and good bookkeeping practice in Norway<br />
• the information in the directors' report concerning the financial statements, the going concern assumption, and the<br />
proposal for the allocation of the profit are consistent with the financial statements and comply with the law and<br />
regulations<br />
Bergen, March 29, 2007<br />
PricewaterhouseCoopers AS<br />
Geir Inge Lunde<br />
State Authorised Public Accountant (Norway)<br />
Note: This translation from Norwegian has been prepared for information purposes only.<br />
Kontorer: Arendal Bergen Drammen Fredrikstad Førde Hamar Kristiansand Mo i Rana Molde Måløy Narvik Oslo Stavanger Stryn Tromsø Trondheim Tønsberg Ålesund<br />
PricewaterhouseCoopers navnet refererer til individuelle medlemsfirmaer tilknyttet den verdensomspennende PricewaterhouseCoopers organisasjonen<br />
Medlemmer av Den norske Revisorforening | Foretaksregisteret: NO 987 009 713<br />
www pwc no<br />
87
Companies in the <strong>TTS</strong> <strong>Group</strong><br />
<strong>TTS</strong> Marine <strong>ASA</strong><br />
Laksevågneset 12<br />
P.O. Box 32 Laksevåg<br />
NO-5847 Bergen<br />
Norway<br />
Tel: +47 55 94 74 00<br />
Fax: +47 55 94 74 01<br />
E-mail: info@tts-marine.no<br />
<strong>TTS</strong> Marine Cranes AS<br />
Laksevågneset 12<br />
P.O. Box 32 Laksevåg<br />
NO-5847 Bergen<br />
Norway<br />
Tel: +47 55 34 84 00<br />
Fax: +47 55 34 84 01<br />
E-mail: info@tts-mc.no<br />
Barstølveien 26<br />
Servicebox 602<br />
NO-4606 Kristiansand<br />
Norway<br />
Tel: +47 38 04 95 00<br />
Fax: +47 38 04 95 01<br />
E-mail: info@tts-mc.no<br />
<strong>TTS</strong> Marine<br />
Shanghai Co. Ltd.<br />
No. 433 Gao Xiang Huan Road<br />
GaoDong Industrial Park PuDong<br />
Shanghai 200137<br />
P.R.China<br />
Tel: +86 21 5848 5300<br />
Fax: +86 21 5848 5311<br />
E-mail: office@tts-marine.cn<br />
88<br />
<strong>TTS</strong>-LMG<br />
Marine Cranes GmbH<br />
Einsiedelstr. 6<br />
D-23554 Lübeck<br />
Germany<br />
Tel: +49 (0) 451 4501 730<br />
Fax: +49 (0) 451 4501 392<br />
E-mail: info@tts-lmg.de<br />
<strong>TTS</strong> Bohai<br />
Machinery Co. Ltd.<br />
Beihai Industry Park<br />
Sujia, Dalian Wan Street<br />
Dalian<br />
P.R.China<br />
Tel: +86 411 87112670<br />
Fax: +86 411 87112702<br />
E-mail: info@tts-bohai.com<br />
<strong>TTS</strong> Korea<br />
RM 625, Ocean Tower<br />
# 760-3 Woo 1-Dong<br />
Haeundae-Gu<br />
Busan<br />
Korea (612-726)<br />
Tel: +82 51 740 6081-3<br />
Fax: +82 51 740 6084<br />
E-mail: info@ttskorea.co.kr<br />
<strong>TTS</strong> Offshore Handling<br />
Equipment AS<br />
Larsgårdsvn 4<br />
P.O. Box 9 Servicebox<br />
N-6025 Ålesund<br />
Norway<br />
Tel: +47 7032 9260<br />
Fax: +47 7032 9261<br />
E-mail: info@tts-ohe.no<br />
<strong>TTS</strong> Ships Equipment AB<br />
Kämpegatan 3<br />
SE-411 04 Göteborg<br />
Sweden<br />
Tel: +46 31 725 79 00<br />
Fax: +46 31 725 78 00<br />
E-mail: info@tts-se.se<br />
<strong>TTS</strong> Ships<br />
Equipment GmbH<br />
Wachtstrasse 17-24<br />
D-28195 Bremen<br />
P.O. Box 103840<br />
D-28038 Bremen<br />
Germany<br />
Tel: +49 421 3 35 84 0<br />
Fax: +49 421 3 35 84 98<br />
E-mail: info@tts-se.de<br />
<strong>TTS</strong> Ships Equipment AS<br />
Laksevågneset 12<br />
P.O. Box 165 Laksevåg<br />
NO-5847 Bergen<br />
Norway<br />
Tel: +47 55 11 30 50<br />
Fax: +47 55 11 30 60<br />
E-mail: info@tts-se.no<br />
<strong>TTS</strong> Hua Hai Ships<br />
Equipment Co. Ltd.<br />
18th floor<br />
3255 Zhou Jia Zui Road<br />
CN-200093 Shanghai<br />
P.R.China<br />
Tel: +86 21 6539 8257<br />
Fax: +86 21 6539 7400<br />
E-mail: info@tts-huahai.com<br />
<strong>TTS</strong> Marine Inc.<br />
5201 Blue Lagoon Drive<br />
9th Floor<br />
Miami, FL 33126<br />
USA<br />
Tel: +1 305 716 4162<br />
Fax: +1 305 716 4163<br />
E-mail: info@tts-se.us<br />
<strong>TTS</strong> Marine s.r.l.<br />
Ponte Colombo<br />
16126 Genova<br />
Italy<br />
Tel: +39 010 24 81 205<br />
Fax. +39 010 25 43 191<br />
E-mail: info@tts-marine.it<br />
<strong>TTS</strong> Vietnam<br />
7th Floor, Harbour View<br />
Building<br />
No4, Tran Phu Street<br />
Haiphong City<br />
Vietnam<br />
Tel: +84 31 3686519<br />
Fax. +84 31 3686516<br />
Email: tran.duchieu@tts-se.vn
<strong>TTS</strong> Port Equipment AB<br />
Kämpegatan 3<br />
SE-411 04 Göteborg<br />
Sweden<br />
Tel: +46 31 725 79 00<br />
Fax: +46 31 725 78 04<br />
E-mail: info@tts-port.se<br />
<strong>TTS</strong> Handling Systems AS<br />
Holterkollvn 6<br />
P.O. Box 49<br />
NO-1441 Drøbak<br />
Norway<br />
Tel: +47 64 90 79 10<br />
Fax: +47 64 93 16 63<br />
E-mail: info@tts-hs.no<br />
<strong>TTS</strong> Liftec Oy<br />
Tuotekatu 8<br />
FI-33840 Tampere<br />
Finland<br />
Tel: +358 3 31401400<br />
Fax: +358 3 31401444<br />
E-mail: liftec@tts-liftec.fi<br />
<strong>TTS</strong> Kocks GmbH<br />
Wachtstrasse 17/24<br />
D-28195 Bremen<br />
P.O. Box 104080,<br />
D-28040 Bremen<br />
Germany<br />
Tel: +49 421 52008-0<br />
Fax: +49 421 52008-20<br />
E-mail: info@tts-kocks.de<br />
<strong>TTS</strong> Kocks Ostrava s.r.o.<br />
U Řeky 808<br />
720 00 Ostrava-Hrabová<br />
Czech Republic<br />
Tel: +420 596 782 708<br />
Fax: +420 596 782 707<br />
E-mail: info@tts-kocks.cz<br />
<strong>TTS</strong> Kocks GmbH<br />
Korea Co. Ltd.<br />
# 1664-10<br />
Songjeong-Dong<br />
Gangseo-Gu<br />
Busan 618-270<br />
Korea<br />
Tel: +82 51 831 8401<br />
Fax: +82 51 979 5610<br />
E-mail: mail@tts-kocks.co.kr<br />
89
Organisation<br />
90<br />
Dry Cargo Handling<br />
Stellan Bernsro<br />
HEAD OF DIVISION<br />
<strong>TTS</strong> Ships Equipment AB<br />
Stellan Bernsro<br />
MANAGING DIRECTOR<br />
<strong>TTS</strong> Ships Equipment GmbH<br />
Max Kommorowski<br />
MANAGING DIRECTOR<br />
<strong>TTS</strong> Ships Equipment AS<br />
Jan Magnar Grøtte<br />
MANAGING DIRECTOR<br />
<strong>TTS</strong> Hua Hai<br />
Ships Equipment Co. Ltd.<br />
Madame He Pu<br />
DIRECTOR<br />
<strong>TTS</strong> Marine Inc.<br />
Torsten Paas<br />
PRESIDENT<br />
<strong>TTS</strong> Marine s.r.l.<br />
Massimo Triglia<br />
MANAGING DIRECTOR<br />
<strong>TTS</strong> Vietnam<br />
Tran Duc Hieu<br />
MANAGING DIRECTOR<br />
Port and Material Handling<br />
Göran K. Johansson<br />
HEAD OF DIVISION<br />
<strong>TTS</strong> Port Equipment AB<br />
Lennart Svensson<br />
MANAGING DIRECTOR<br />
<strong>TTS</strong> Handling System AS<br />
Rolf-Atle Tomassen<br />
MANAGING DIRECTOR<br />
<strong>TTS</strong> Liftec Oy<br />
Tatu Miikkulainen<br />
MANAGING DIRECTOR<br />
<strong>TTS</strong> Marine <strong>ASA</strong><br />
Johannes D. Neteland<br />
PRESIDENT & CEO<br />
Marine Cranes<br />
Ivar K. Hanson<br />
HEAD OF DIVISION<br />
<strong>TTS</strong> Marine Cranes AS<br />
Ivar K. Hanson<br />
MANAGING DIRECTOR<br />
<strong>TTS</strong> Marine Shanghai Co. Ltd.<br />
Arne Knudsen<br />
MANAGING DIRECTOR<br />
<strong>TTS</strong>-LMG Marine Cranes GmbH<br />
Per Sigurd Aulin<br />
MANAGING DIRECTOR<br />
<strong>TTS</strong> Bohai Machinery Co. Ltd.<br />
Li Dali<br />
GENERAL DIRECTOR<br />
<strong>TTS</strong> Korea<br />
Wanho Kuk<br />
DIRECTOR<br />
<strong>TTS</strong> Offshore Handling<br />
Equipment AS<br />
Stig Espeseth<br />
DIRECTOR<br />
Deck Machinery<br />
Edgar Bethmann<br />
HEAD OF DIVISION<br />
<strong>TTS</strong> Kocks GmbH<br />
Edgar Bethmann<br />
MANAGING DIRECTOR<br />
<strong>TTS</strong> Kocks Ostrava s.r.o.<br />
Edgar Bethmann<br />
MANAGING DIRECTOR<br />
<strong>TTS</strong> Kocks GmbH Korea Co. Ltd.<br />
Y. J. Kim<br />
PRESIDENT
Stellan<br />
Bernsro<br />
Max<br />
Kommorowski<br />
Jan Magnar<br />
Grøtte<br />
Madame<br />
He Pu<br />
Torsten<br />
Paas<br />
Massimo<br />
Triglia<br />
Tran<br />
Duc Hieu<br />
Lennart<br />
Svensson<br />
Rolf-Atle<br />
Tomassen<br />
Tatu<br />
Miikkulainen<br />
Ivar K.<br />
Hanson<br />
Arne<br />
Knudsen<br />
Per Sigurd<br />
Aulin<br />
Li<br />
Dali<br />
Wahno<br />
Kuk<br />
Stig<br />
Espeseth<br />
Edgar<br />
Bethmannn<br />
Y. J.<br />
Kim
<strong>TTS</strong> Marine <strong>ASA</strong><br />
Laksevågneset 12<br />
P.O. Box 32 Laksevåg<br />
N-5847 Bergen, Norway<br />
Tel: +47 55 94 74 00<br />
Fax: +47 55 94 74 01<br />
E-mail: info@tts-marine.no<br />
www.tts-marine.com<br />
• 23633 • Photos: Helge Skodvin • Printed by: Molvik Grafisk AS


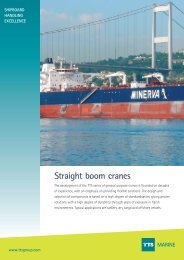
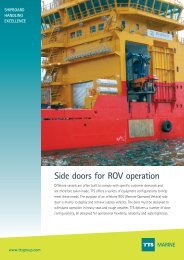
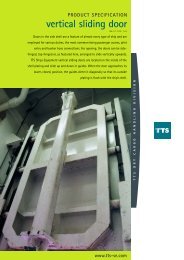
![2012.MasterPresentation_final [Compatibility Mode] - TTS Group ASA](https://img.yumpu.com/4612021/1/190x146/2012masterpresentation-final-compatibility-mode-tts-group-asa.jpg?quality=85)