BIE 2009-2010 Baseline Data Report Kingsbury-NWEA - Bureau of ...
BIE 2009-2010 Baseline Data Report Kingsbury-NWEA - Bureau of ...
BIE 2009-2010 Baseline Data Report Kingsbury-NWEA - Bureau of ...
- No tags were found...

Create successful ePaper yourself
Turn your PDF publications into a flip-book with our unique Google optimized e-Paper software.
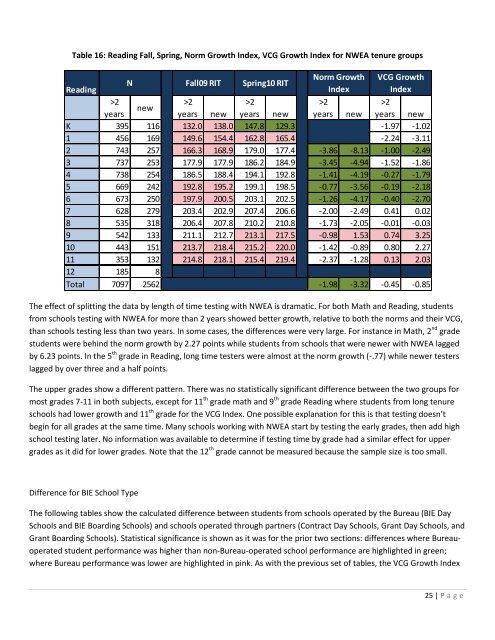
Table 16: Reading Fall, Spring, Norm Growth Index, VCG Growth Index for <strong>NWEA</strong> tenure groupsNorm Growth VCG GrowthN Fall09 RIT Spring10 RITReadingIndex Index>2>2>2>2>2newyearsyears new years new years new years newK 395 116 132.0 138.0 147.8 129.3 -1.97 -1.021 456 169 149.6 154.4 162.8 165.4 -2.24 -3.112 743 257 166.3 168.9 179.0 177.4 -3.86 -8.13 -1.00 -2.493 737 253 177.9 177.9 186.2 184.9 -3.45 -4.94 -1.52 -1.864 738 254 186.5 188.4 194.1 192.8 -1.41 -4.19 -0.27 -1.795 669 242 192.8 195.2 199.1 198.5 -0.77 -3.56 -0.19 -2.186 673 250 197.9 200.5 203.1 202.5 -1.26 -4.17 -0.40 -2.707 628 279 203.4 202.9 207.4 206.6 -2.00 -2.49 0.41 0.028 535 318 206.4 207.8 210.2 210.8 -1.73 -2.05 -0.01 -0.039 542 133 211.1 212.7 213.1 217.5 -0.98 1.53 0.74 3.2510 443 151 213.7 218.4 215.2 220.0 -1.42 -0.89 0.80 2.2711 353 132 214.8 218.1 215.4 219.4 -2.37 -1.28 0.13 2.0312 185 8Total 7097 2562 -1.98 -3.32 -0.45 -0.85The effect <strong>of</strong> splitting the data by length <strong>of</strong> time testing with <strong>NWEA</strong> is dramatic. For both Math and Reading, studentsfrom schools testing with <strong>NWEA</strong> for more than 2 years showed better growth, relative to both the norms and their VCG,than schools testing less than two years. In some cases, the differences were very large. For instance in Math, 2 nd gradestudents were behind the norm growth by 2.27 points while students from schools that were newer with <strong>NWEA</strong> laggedby 6.23 points. In the 5 th grade in Reading, long time testers were almost at the norm growth (-.77) while newer testerslagged by over three and a half points.The upper grades show a different pattern. There was no statistically significant difference between the two groups formost grades 7-11 in both subjects, except for 11 th grade math and 9 th grade Reading where students from long tenureschools had lower growth and 11 th grade for the VCG Index. One possible explanation for this is that testing doesn’tbegin for all grades at the same time. Many schools working with <strong>NWEA</strong> start by testing the early grades, then add highschool testing later. No information was available to determine if testing time by grade had a similar effect for uppergrades as it did for lower grades. Note that the 12 th grade cannot be measured because the sample size is too small.Difference for <strong>BIE</strong> School TypeThe following tables show the calculated difference between students from schools operated by the <strong>Bureau</strong> (<strong>BIE</strong> DaySchools and <strong>BIE</strong> Boarding Schools) and schools operated through partners (Contract Day Schools, Grant Day Schools, andGrant Boarding Schools). Statistical significance is shown as it was for the prior two sections: differences where <strong>Bureau</strong>operatedstudent performance was higher than non-<strong>Bureau</strong>-operated school performance are highlighted in green;where <strong>Bureau</strong> performance was lower are highlighted in pink. As with the previous set <strong>of</strong> tables, the VCG Growth Index25 | P a g e