Natural Gas Consumption. - Energy Policy and Planning Office
Natural Gas Consumption. - Energy Policy and Planning Office
Natural Gas Consumption. - Energy Policy and Planning Office
- No tags were found...

Create successful ePaper yourself
Turn your PDF publications into a flip-book with our unique Google optimized e-Paper software.
<strong>Energy</strong> Statisticsof Thail<strong>and</strong> 2011••Chapter3NATURALGAS••บทที่3ก๊าซธรรมชาติ
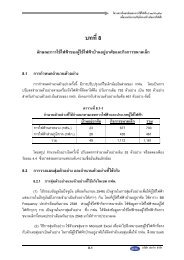
บทที่3ก๊าซธรรมชาติก๊าซธรรมชาติการจัดหาก๊าซธรรมชาติ ประเทศไทยเริ่มผลิตก๊าซธรรมชาติในปี 2524 จากแหล่งเอราวัณแต่ในปัจจุบันมีแหล่งก๊าซธรรมชาติที่สำคัญเพิ่มขึ้น ได้แก่ แหล่งบงกช เจดีเอ อาทิตย์ และไพลิน โดยในปี2553 การผลิตในประเทศอยู่ที่ระดับ 3,511 ล้านลูกบาศก์ฟุตต่อวัน คิดเป็นสัดส่วนร้อยละ 80 ส่วนที่เหลือร้อยละ 20 เป็นการนำเข้าจากพม่า รวมเป็นการจัดหาทั้งสิ้นอยู่ที่ระดับ 4,364 ล้านลูกบาศก์ฟุตต่อวันการใช้ก๊าซธรรมชาติ ในปี 2553 มีปริมาณการใช้ทั้งสิ้น 4,039 ล้านลูกบาศก์ฟุตต่อวันก๊าซธรรมชาติจะถูกนำไปใช้ในการผลิตไฟฟ้ามากที่สุดคือร้อยละ 68 ส่วนที่เหลือเป็นการใช้ในโรงแยกก๊าซร้อยละ 16 อุตสาหกรรมร้อยละ 12 และใช้ในการขนส่ง (CNG) ร้อยละ 464 รายงานสถิติพลังงานของประเทศไทยสำนักงานนโยบายและแผนพลังงาน
Chapter3<strong>Natural</strong><strong>Gas</strong><strong>Natural</strong> <strong>Gas</strong> Supply. <strong>Natural</strong> gas production in Thail<strong>and</strong> began in 1981 fromErawan field; to date, additional major gas fields have been discovered, comprising Bong Kot,JDA (Thail<strong>and</strong>-Malaysia Joint Development Area), Arthit <strong>and</strong> Pailin. In 2010, domestic naturalgas production was at a level of 3,511 million st<strong>and</strong>ard cubic feet per day (MMscfd),accounting for a share of 80%; the remaining 20% was imported from Myanmar, making a totalnatural gas supply of the country at 4,364 MMscfd.<strong>Natural</strong><strong>Gas</strong><strong>Natural</strong> <strong>Gas</strong> <strong>Consumption</strong>. The total volume of natural gas consumption in2010 was 4,039 MMscfd. <strong>Natural</strong> gas was mainly used as fuel in power generation, holding ashare of 68% of the total consumption in the year. The remainder was used in the following:gas separation plants, at a share of 16%; the industrial sector, 12%; <strong>and</strong> the transport (CNG),4%.<strong>Energy</strong> Statistics of Thail<strong>and</strong> 2011 <strong>Energy</strong> <strong>Policy</strong> <strong>and</strong> <strong>Planning</strong> <strong>Office</strong>65
การใช้ก๊าซธรรมชาติรายสาขาก๊าซธรรมชาติ66 รายงานสถิติพลังงานของประเทศไทยสำนักงานนโยบายและแผนพลังงาน
<strong>Natural</strong> <strong>Gas</strong> <strong>Consumption</strong> by Sector<strong>Natural</strong><strong>Gas</strong><strong>Energy</strong> Statistics of Thail<strong>and</strong> 2011 <strong>Energy</strong> <strong>Policy</strong> <strong>and</strong> <strong>Planning</strong> <strong>Office</strong>67
ก๊าซธรรมชาติTable 3.1-1Y Production <strong>and</strong> Import of <strong>Natural</strong> <strong>Gas</strong>Unit : MMSCFDYear Sirikit Benjamas Namphong Erawan Pailin Satun Gomin Phuhorm Funan & Bongkot Arthit Yala JDA Others Yadana Yetakun Total Total Gr<strong>and</strong>Jakrawan Import Domestic Total1986 29 162 89 70 350 350 1987 31 209 170 79 489 489 1988 30 216 197 134 578 578 1989 32 221 196 129 579 579 1990 41 231 201 158 631 631 1991 43 51 284 212 192 782 782 1992 50 57 253 206 128 138 832 832 1993 56 56 290 197 162 70 110 939 939 1994 65 63 267 198 160 202 82 1,038 1,038 1995 68 64 285 195 2 152 237 95 1,099 1,099 1996 60 65 268 203 49 160 336 126 1,267 1,267 1997 61 79 294 219 50 209 344 307 1,564 1,564 1998 55 90 299 211 25 246 437 335 2 2 1,698 1,700 1999 56 27 93 306 61 171 16 253 578 299 2 2 1,860 1,861 2000 59 97 71 278 234 125 24 208 548 304 128 36 164 1,948 2,113 2001 57 118 60 266 212 118 9 199 584 275 377 119 496 1,900 2,396 2002 56 152 59 266 298 114 9 228 566 11 229 418 199 617 1,986 2,603 2003 55 169 50 281 406 96 45 189 516 30 241 410 275 686 2,077 2,763 2004 54 147 35 274 412 104 64 187 597 24 259 439 287 726 2,158 2,884 2005 60 157 33 277 435 118 47 221 605 41 297 431 426 857 2,292 3,149 2006 50 159 31 278 438 90 27 6 263 627 41 343 452 417 869 2,353 3,222 2007 46 172 26 278 457 108 13 93 309 629 65 319 473 433 906 2,515 3,421 2008 41 147 23 275 431 101 14 85 286 604 278 100 126 268 434 394 828 2,778 3,606 2009 54 86 20 244 417 64 24 81 177 540 418 110 441 315 409 394 803 2,990 3,794 2010 63 76 18 256 430 82 85 87 199 596 501 95 649 374 434 419 853 3,511 4,364Remarks : Heat Value of NG from Myanmar = 1,000 BTU/SCFSource : Department of Mineral Fuels (DMF)Compiled by : <strong>Energy</strong> <strong>Policy</strong> <strong>and</strong> <strong>Planning</strong> <strong>Office</strong> (EPPO)68 รายงานสถิติพลังงานของประเทศไทย สำนักงานนโยบายและแผนพลังงาน
Table 3.2-1Y Distribution of NGLYear (Million Litres) (Barrels) (Barrels/Day)Export Refinery Solvent Total Export Refinery Solvent Total Export Refinery Solvent Total1988 131 6 138 826,823 39,455 866,279 2,259 107 2,366 1989 75 4 79 470,285 25,025 495,310 1,288 68 1,357 1990 5 133 2 140 30,442 836,226 11,708 878,376 83 2,291 32 2,406 1991 85 113 12 211 537,469 712,688 74,725 1,324,883 1,472 1,952 204 3,629 1992 152 47 20 219 953,609 295,856 125,815 1,375,281 2,605 808 343 3,757 1993 140 73 31 244 879,449 461,695 195,308 1,536,452 2,409 1,264 535 4,209 1994 67 113 43 223 419,846 711,359 273,465 1,404,672 1,150 1,948 749 3,848 1995 96 94 37 227 602,360 588,716 234,949 1,426,026 1,650 1,612 643 3,906 1996 33 165 57 255 205,600 1,040,130 358,172 1,603,903 561 2,841 978 4,382 1997 153 28 154 335 961,815 175,920 968,882 2,106,618 2,635 481 2,654 5,771 1998 178 18 164 360 1,118,416 113,311 1,031,602 2,263,330 3,064 310 2,826 6,200 1999 199 27 171 396 1,249,394 169,719 1,073,063 2,492,177 3,423 464 2,939 6,827 2000 149 23 331 503 938,176 146,385 2,079,331 3,163,893 2,563 399 5,681 8,644 2001 106 55 395 556 669,375 343,469 2,482,794 3,495,640 1,833 941 6,802 9,577 2002 57 489 546 358,911 3,077,307 3,436,219 983 8,430 9,414 2003 49 107 486 642 310,746 675,638 3,054,569 4,040,954 851 1,851 8,368 11,071 2004 79 116 429 624 499,812 728,529 2,695,422 3,923,764 1,365 1,990 7,364 10,720 2005 176 6 543 724 1,106,817 34,611 3,415,103 4,556,531 3,032 94 9,356 12,483 2006 129 57 547 733 808,290 359,473 3,441,850 4,609,614 2,214 984 9,429 12,629 2007 133 6 650 789 834,411 38,387 4,090,011 4,962,810 2,286 105 11,205 13,596 2008 142 672 814 894,079 4,226,379 5,120,458 2,442 11,547 13,990 2009 114 676 790 717,208 4,253,688 4,970,897 1,964 11,653 13,618 2010 135 675 810 847,872 4,248,358 5,096,231 2,322 11,639 13,962 Source : PTTCompiled by : <strong>Energy</strong> <strong>Policy</strong> <strong>and</strong> <strong>Planning</strong> <strong>Office</strong> (EPPO)<strong>Natural</strong> <strong>Gas</strong><strong>Energy</strong> Statistics of Thail<strong>and</strong> 2011 <strong>Energy</strong> <strong>Policy</strong> <strong>and</strong> <strong>Planning</strong> <strong>Office</strong>69
ก๊าซธรรมชาติTable 3.2-2Y <strong>Consumption</strong> of <strong>Natural</strong> <strong>Gas</strong> by SectorUnit : MMSCFDYear Electricity Industry GSP NGV Gr<strong>and</strong> TotalEGAT IPP SPP Total1986 246 246 10 71 326 1987 379 379 4 69 452 1988 452 452 7 74 532 1989 463 463 10 50 523 1990 452 452 17 97 567 1991 580 580 24 98 702 1992 612 612 34 113 759 1993 693 693 41 128 862 1994 783 783 54 117 954 1995 801 801 73 114 988 1996 888 60 948 78 122 1,148 1997 1,119 83 1,202 96 146 1,444 1998 1,152 140 1,291 92 158 1,542 1999 1,153 2 267 1,423 123 167 1,713 2000 1,244 71 305 1,620 181 175 1,976 2001 1,070 360 349 1,779 177 340 2,296 2002 1,075 486 375 1,936 198 361 2,495 2003 991 662 401 2,054 217 385 2,657 2004 994 723 418 2,134 248 389 3 2,774 2005 1,011 802 428 2,242 258 491 6 2,997 2006 1,016 825 417 2,257 291 527 11 3,086 2007 1,054 847 445 2,346 347 572 24 3,288 2008 1,014 968 441 2,423 361 583 77 3,444 2009 1,101 905 429 2,435 387 599 143 3,564 2010 1,346 943 440 2,728 478 652 181 4,039 Remarks : Heat value of NG = 1,000 BTU/SCFCompiled by : <strong>Energy</strong> <strong>Policy</strong> <strong>and</strong> <strong>Planning</strong> <strong>Office</strong> (EPPO)70 รายงานสถิติพลังงานของประเทศไทย สำนักงานนโยบายและแผนพลังงาน
Table 3.2-3Y <strong>Consumption</strong> Share of <strong>Natural</strong> <strong>Gas</strong> by SectorYear MMSCFD Share (%)Electricity Industry GSP NGV Total Electricity Industry GSP NGV Total1986 246 10 71 326 75.3 3.0 21.8 100.01987 379 4 69 452 83.8 1.0 15.2 100.01988 452 7 74 532 84.9 1.3 13.8 100.01989 463 10 50 523 88.6 1.8 9.6 100.01990 452 17 97 567 79.8 3.1 17.1 100.01991 580 24 98 702 82.5 3.5 14.0 100.01992 612 34 113 759 80.6 4.4 14.9 100.01993 693 41 128 862 80.4 4.7 14.8 100.01994 783 54 117 954 82.1 5.6 12.3 100.01995 801 73 114 988 81.1 7.4 11.6 100.01996 948 78 122 1,148 82.5 6.8 10.7 100.01997 1,202 96 146 1,444 83.2 6.7 10.1 100.01998 1,291 92 158 1,542 83.8 6.0 10.3 100.01999 1,423 123 167 1,713 83.1 7.2 9.8 100.02000 1,620 181 175 1,976 82.0 9.2 8.9 100.02001 1,779 177 340 2,296 77.5 7.7 14.8 100.02002 1,936 198 361 2,495 77.6 8.0 14.4 100.02003 2,054 217 385 2,657 77.3 8.2 14.5 100.02004 2,134 248 389 3 2,774 76.9 8.9 14.0 0.1 100.02005 2,242 258 491 6 2,997 74.8 8.6 16.4 0.2 100.02006 2,257 291 527 11 3,086 73.2 9.4 17.1 0.4 100.02007 2,346 347 572 24 3,288 71.3 10.6 17.4 0.7 100.02008 2,423 361 583 77 3,444 70.4 10.5 16.9 2.2 100.02009 2,435 387 599 143 3,564 68.3 10.9 16.8 4.0 100.02010 2,728 478 652 181 4,039 67.6 11.8 16.1 4.5 100.0<strong>Natural</strong> <strong>Gas</strong>Remarks : Heat value of NG = 1,000 BTU/SCFCompiled by : <strong>Energy</strong> <strong>Policy</strong> <strong>and</strong> <strong>Planning</strong> <strong>Office</strong> (EPPO)<strong>Energy</strong> Statistics of Thail<strong>and</strong> 2011 <strong>Energy</strong> <strong>Policy</strong> <strong>and</strong> <strong>Planning</strong> <strong>Office</strong>71
Table 3.2-4 <strong>Consumption</strong> of Compressed <strong>Natural</strong> <strong>Gas</strong> (CNG)ก๊าซธรรมชาติVehicle (Unit)<strong>Consumption</strong> (MMSCF)Petroleum Equivalent (Million Litres)<strong>Gas</strong>oline Diesel Total <strong>Gas</strong>oline Diesel Total MMSCFD <strong>Gas</strong>oline Diesel Total2006 21,170 2,326 23,496 2,547 1,399 3,946 11 80 38 118Jan 6,755 679 7,434 186 93 279 9 6 3 8Feb 7,362 756 8,118 148 76 224 8 5 2 7Mar 7,806 821 8,627 183 96 279 9 6 3 8Apr 8,436 895 9,331 157 83 240 8 5 2 7May 9,336 1,019 10,355 201 109 310 10 6 3 9Jun 10,663 1,164 11,827 194 106 300 10 6 3 9Jul 12,194 1,340 13,534 200 110 310 10 6 3 9Aug 14,786 1,611 16,397 261 142 403 13 8 4 12Sep 16,975 1,863 18,838 232 128 360 12 7 3 11Oct 18,403 2,068 20,471 278 156 434 14 9 4 13Nov 19,587 2,215 21,802 268 152 420 14 8 4 12Dec 21,170 2,326 23,496 260 143 403 13 8 4 122007 49,335 6,533 55,868 5,166 3,421 8,587 24 168 87 255Jan 24,306 2,679 26,985 280 154 434 14 9 4 13Feb 25,770 2,836 28,606 293 161 454 16 9 4 14Mar 27,788 3,029 30,817 367 200 567 18 11 5 17Apr 28,832 3,180 32,012 365 201 566 19 11 5 17May 29,971 3,344 33,315 388 216 604 19 12 6 18Jun 32,536 3,680 36,216 411 233 644 21 13 6 19Jul 34,437 3,914 38,351 443 252 695 22 14 7 21Aug 37,215 4,293 41,508 484 279 763 25 15 8 23Sep 40,045 4,612 44,657 511 294 805 27 16 8 24Oct 42,769 5,262 48,031 568 350 918 30 18 10 27Nov 46,072 5,846 51,918 616 391 1,007 34 19 11 30Dec 49,335 6,533 55,868 680 450 1,130 36 21 12 332008 104,553 23,182 127,735 13,416 14,873 28,289 77 445 381 826Jan 53,542 6,873 60,415 776 498 1,274 41 24 14 38Feb 57,666 7,603 65,269 815 537 1,352 47 25 15 40Mar 60,272 8,853 69,125 923 678 1,601 52 29 18 47Apr 63,016 9,903 72,919 955 750 1,705 57 30 20 50May 66,245 11,265 77,510 1,052 895 1,947 63 33 24 57Jun 70,914 13,247 84,161 1,115 1,041 2,156 72 35 28 63Jul 78,099 16,233 94,332 1,263 1,312 2,575 83 39 36 75Aug 85,307 18,470 103,777 1,363 1,476 2,839 92 42 40 83Sep 91,999 20,655 112,654 1,384 1,553 2,937 98 43 42 85Oct 96,097 22,031 118,128 1,540 1,765 3,305 107 48 48 96Nov 99,764 22,812 122,576 1,514 1,730 3,244 108 47 47 94Dec 104,553 23,182 127,735 1,591 1,763 3,354 108 50 48 9872 รายงานสถิติพลังงานของประเทศไทย สำนักงานนโยบายและแผนพลังงาน
Table 3.2-4 <strong>Consumption</strong> of Compressed <strong>Natural</strong> <strong>Gas</strong> (CNG) (Cont.)Vehicle (Unit)<strong>Consumption</strong> (MMSCF)Petroleum Equivalent (Million Litres)<strong>Gas</strong>oline Diesel Total <strong>Gas</strong>oline Diesel Total MMSCFD <strong>Gas</strong>oline Diesel Total2009 133,777 28,246 162,023 25,338 26,750 52,088 143 797 721 1,518Jan 107,932 23,503 131,435 1,732 1,885 3,617 117 54 51 105Feb 116,299 23,726 140,025 1,837 1,874 3,711 133 57 51 108Mar 117,348 23,987 141,335 2,112 2,158 4,270 138 66 59 124Apr 118,350 24,142 142,492 1,870 1,908 3,778 126 58 52 110May 119,543 24,324 143,867 2,051 2,087 4,138 133 64 57 121Jun 121,925 24,716 146,641 2,108 2,137 4,245 142 66 58 124Jul 124,252 25,213 149,465 2,194 2,227 4,421 143 68 61 129Aug 126,161 25,777 151,938 2,296 2,345 4,641 150 71 64 135Sep 128,284 26,330 154,614 2,232 2,290 4,522 151 69 62 132Oct 128,924 27,278 156,202 2,322 2,457 4,779 154 72 67 139Nov 132,183 27,835 160,018 2,325 2,449 4,774 159 72 67 139Dec 133,777 28,246 162,023 2,526 2,666 5,192 167 79 73 1512010 191,233 34,435 225,668 34,781 31,315 66,096 181 1,042 888 1,930Jan 136,780 28,687 165,467 2,334 2,447 4,781 154 73 67 139Feb 140,052 29,022 169,074 2,357 2,442 4,799 171 73 67 140Mar 143,944 29,533 173,477 2,693 2,763 5,456 176 84 75 159Apr 147,431 29,921 177,352 2,457 2,493 4,950 165 76 68 144May 151,313 30,384 181,697 2,583 2,594 5,177 167 80 71 151Jun 156,849 30,892 187,741 2,736 2,694 5,430 181 85 73 159Jul 161,866 31,486 193,352 2,813 2,736 5,549 179 88 75 162Aug 166,981 32,135 199,116 2,859 2,752 5,611 181 89 75 164Sep 172,763 32,754 205,517 2,942 2,788 5,730 191 92 76 167Oct 178,055 33,313 211,368 3,091 2,892 5,983 193 96 79 175Nov 185,113 33,877 218,990 3,196 2,924 6,120 204 99 80 179Dec 191,233 34,435 225,668 3,426 3,084 6,510 210 107 84 191<strong>Natural</strong> <strong>Gas</strong><strong>Energy</strong> Statistics of Thail<strong>and</strong> 2011 <strong>Energy</strong> <strong>Policy</strong> <strong>and</strong> <strong>Planning</strong> <strong>Office</strong>73