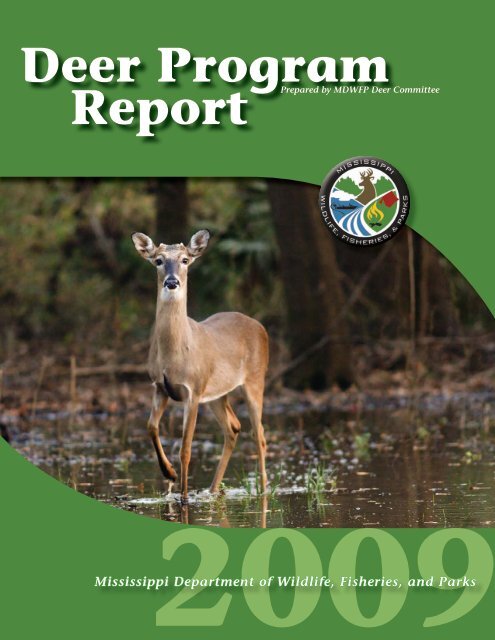
Deer Program Report
Deer Program Report
Deer Program Report
- No tags were found...

Create successful ePaper yourself
Turn your PDF publications into a flip-book with our unique Google optimized e-Paper software.
DedicationThis and all future <strong>Deer</strong> Data Books are dedicated to Bill Lunceford.On September 20, 2007, the Mississippi Department of Wildlife, Fisheries, and Parks and the sportsmen ofMississippi lost a hero. William (Bill) Lunceford passed away as a result of complications due to a previous injury. Billbecame a quadriplegic after a diving accident in 1979. After rehabilitation, he came back to work with the MDWFP as the<strong>Deer</strong> Management Assistance <strong>Program</strong> (DMAP) Coordinator. He filled this role until his retirement on June 30, 2006. Thework he completed in his position is immeasurable. Using a mouthpiece, wooden dowel, and large eraser, he typed fasterthan most of the staff. His knowledge of computer programs combined with deer management experience made the restof the staff’s roles easier. He combined the DMAP data for the entire state annually and produced reports to assist fieldbiologists in making better deer management decisions. The data and reports eventually became the <strong>Deer</strong> <strong>Program</strong> <strong>Report</strong>.His work has impacted millions of acres of deer habitat in the state. He also assisted other states with the implementationof DMAP programs.Bill was a man of Christian values, strong work ethic, and immense knowledge. It was impossible to not make friendswith him. After his accident, he continued his passion of hunting deer. He designed a rifle mounted on a football helmet,with trigger activation by solenoid from a mouthpiece. He was a crack shot with this weapon, bagging several deer, anddesigned several versions in different calibers.Bill traveled the state to give motivational speeches. He proved that adversity can be overcome. You just have towant to. Many lives have been touched, and changed, by Bill’s time on Earth. As a firm believer, Bill can now walkagain.You will be missed.In Memory of Bill Lunceford1945-20072008-2009 Mississippi <strong>Deer</strong> <strong>Program</strong> <strong>Report</strong>iii
2009Governor of Mississippi Haley BarbourLieutenant Governor Phil BryantSenate Wildlife, Fisheries, and Parks CommitteeTommy A. Gollott, Chairman, BiloxiBilly Hudson, Vice-Chairman, PurvisSidney Albritton, PicayuneBob M. Dearing, NatchezMerle Flowers, SouthavenCindy Hyde-Smith, BrookhavenEzell Lee, PicayuneChris McDaniel, EllisvilleEric Powell, CorinthBill Stone, AshlandGray Tollison, OxfordHouse of Representatives Wildlife, Fisheries, and Parks CommitteeBlaine “Bo” Eaton, Chairman, Taylorsville,Deryk R. Parker, Vice-Chairman, LucedaleBrian Aldridge, AshlandTracy Arinder, MortonC. Scott Bounds, PhiladelphiaBryant W. Clark, PickensAngela Cockerham, MagnoliaMark DuVall, MantachiePhilip Gunn, ClintonSteven A. Horne, MeridianBennett Malone, CarthageWarner F. McBride, CourtlandAmerica (Chuck) Middleton, Port GibsonBilly Nicholson, Little RockSteve Palazzo, BiloxiCommission on Wildlife, Fisheries, and ParksBryan Jones, Chairman, Yazoo CityCharles Rigdon, Vice Chairman, ColumbusJerry Munro, BiloxiBilly Deviney, JacksonJohn C Stanley IV, CorinthAdministrationSam Polles, Ph.D., Executive DirectorAl Tuck, Deputy DirectorRobert L. Cook, Deputy AdministratorDon Brazil, Director of Law Enforcement, Wildlife, and Fisheriesiv2008-2009 Mississippi <strong>Deer</strong> <strong>Program</strong> <strong>Report</strong>
Table of ContentsDedication............................................................................................................................................................ iiiGovernor and Legislative Committees...........................................................................................................ivCommission on Wildlife, Fisheries, and Parks.............................................................................................ivTable of Contents..................................................................................................................................................vAcknowledgments...............................................................................................................................................viIntroduction..........................................................................................................................................................1Wildlife Management Areas...........................................................................................................................2-3Wildlife Management Area Harvest Information.......................................................................................4Wildlife Management Area Narratives......................................................................................................5-19Regional Narratives.......................................................................................................................................20-23Road Kill Survey <strong>Report</strong>...................................................................................................................................24Depredation by <strong>Deer</strong>..........................................................................................................................................25Chronic Wasting Disease..............................................................................................................................26-27Hemorrhagic Disease....................................................................................................................................28-29<strong>Deer</strong> Herd Health Evaluations....................................................................................................................30-33Mail Survey Data............................................................................................................................................34-36Mississippi Bowhunter Observations............................................................................................................37Antler Regulations.............................................................................................................................................38High Fenced Enclosures.....................................................................................................................................39<strong>Deer</strong> Tags..........................................................................................................................................................40-41<strong>Deer</strong> Management Assistance <strong>Program</strong>....................................................................................................42-47Statewide DMAP Data..................................................................................................................................48-49Mississippi Soil Resource Areas.......................................................................................................................50Batture Soil Resource Area Summary of DMAP Data...............................................................................51Delta Soil Resource Area Summary of DMAP Data....................................................................................52Upper Thick Loess Soil Resource Area Summary of DMAP Data...........................................................53Lower Thick Loess Soil Resource Area Summary of DMAP Data...........................................................54Upper Thin Loess Soil Resource Area Summary of DMAP Data............................................................ 55Lower Thin Loess Soil Resource Area Summary of DMAP Data.............................................................56Black Prairie Soil Resource Area Summary of DMAP Data.....................................................................57Upper Coastal Plain Soil Resource Area Summary of DMAP Data........................................................58Lower Coastal Plain Soil Resource Area Summary of DMAP Data........................................................59Coastal Flatwoods Soil Resource Area Summary of DMAP Data............................................................60Interior Flatwoods Soil Resource Area Summary of DMAP Data..........................................................61Enforcement of <strong>Deer</strong>-related Citations.........................................................................................................62Citations Summary by County........................................................................................................................63Hunting Incident/Accident Summary..........................................................................................................642008-2009 Research Project Summaries...................................................................................................65-67Magnolia Records <strong>Program</strong>..............................................................................................................................68Pope and Young Records...................................................................................................................................69Boone and Crockett Records.......................................................................................................................70-71In Conclusion..................................................................................................................................................72-732008-2009 Mississippi <strong>Deer</strong> <strong>Program</strong> <strong>Report</strong>v
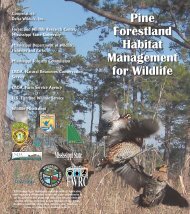
IntroductionWhite-tailed <strong>Deer</strong> <strong>Program</strong> <strong>Report</strong> 2008-2009This buck was harvested by Richard Taylor on a DMAP property in Warren County.The first <strong>Deer</strong> Management Assistance <strong>Program</strong> (DMAP) report was completed in 1982. The DMAP report evolved into theMississippi <strong>Deer</strong> <strong>Program</strong> <strong>Report</strong> in 1993. Since its inception, the purpose of this report was to consolidate all deer-relatedinformation obtained by the Mississippi Department of Wildlife, Fisheries, and Parks (MDWFP) personnel. Compilation of thesedata provides managers the opportunity to analyze trends in deer harvest and physiological condition. In the future, managerswill have a chronicled reference to more effectively critique effects of changes in season framework, hunter success, and climaticconditions on the deer population.Decision makers such as the Mississippi Legislature and the Mississippi Commission on Wildlife, Fisheries, and Parks haveserved the sportsmen of the state well. <strong>Deer</strong> harvest and management opportunities exist today that were considered far-fetchedtwenty-five years ago.Annual mail surveys are used to monitor trends in hunter harvest and effort. There was no mail survey conducted followingthe 2006–2007 hunting season. The survey was conducted following the 2007–2008 hunting season collecting data from thatseason and the 2006–2007 season. Additionally, the survey was conducted following the 2008–2009 season. Caution should beused when reviewing this data due to collection methods and analysis changes.The MDWFP began using a new computer summary program (XtraNet) in 2004–2005. Data from 2001–2009 was analyzedusing XtraNet, while data prior to 2001 was analyzed using <strong>Deer</strong>Trax, the old computer summary program. This may be thecause for drastic differences in some numbers. Once all of the historic data is entered into the XtraNet system, the numbers areexpected to fall along the same trend and eliminate the drastic drop in the graphs and tables.Sample methods were unchanged for the following data sets:• Hunter effort and harvest information collected on state-operated WMAs• Employee observations of deer mortality due to motor vehicle collisions• Enforcement Division monitoring of deer hunting-related citations• <strong>Deer</strong> research projects conducted in cooperation with Mississippi State University Forest and Wildlife ResearchCenterDepartment wildlife biologists continue to inform and educate sportsmen relative to deer management needs andissues. Our goals are to provide insight into current deer management needs while providing the leadership to identify andguide future issues. All known media sources were utilized in this process. In addition, public presentations were madeto hunting, civic, and conservation groups throughout the state. This report captures a portion of the informationaland educational efforts.2008-2009 Mississippi <strong>Deer</strong> <strong>Program</strong> <strong>Report</strong>1
Wildlife Management AreasWMA Data22008-2009 Mississippi <strong>Deer</strong> <strong>Program</strong> <strong>Report</strong>
Wildlife Management Areas 2008-2009summary of Wildlife Management Area (WMA)A deer harvest and hunter activity is presented inFigure 1. The majority of data was collected fromself-service permit stations. Mandatory check-inand harvest reporting is required from all hunterson most WMAs.6,0005,000160,000120,000Throughout the year, conservation officersmonitor compliance of hunters completing andreturning permit cards on WMAs. Differences incompliance rates among WMAs are seen each year.These differences are mainly due to the degree ofhunter acceptance of the check-in system. Someconservation officers assigned to WMAs have moreaggressively informed hunters of the importance ofaccurate check-in than those on other areas. Also,some officers have enforced the mandatory checkinregulation more diligently. The size of a WMAand control of hunter access also affects compliancerates.Some WMAs provide very restrictive hunting opportunities due to size, habitat type, and management objectives. Locationand soil region in which a WMA occurs impacts deer productivity. Because of these factors, as well as other unique differencesamong areas, caution should be exercised in comparing data between WMAs (Table 2).Table 1. Wildlife Management AreaAntler Criteria for the 2008-2009 SeasonWildlifeManagementAreaMinimumAntlerCriteriaBienville 12/15Black Prairie 12/15Calhoun County 12/15Canal/John Bell 12/15Caney Creek 12/15Caston Creek 12/15Charles Ray Nix 15/18Chickasaw 12/15Chickasawhay 12/15Choctaw 12/15Copiah County 12/15Divide Section 12/15Hell Creek 12/15John Starr 12/15Lake George 15/18Leaf River 12/15Leroy Percy 15/18Little Biloxi 12/15Mahannah 16/20Malmaison 15/18Marion County 12/15Mason Creek 12/15*1st number indicates Inside Spread2008-2009 Mississippi <strong>Deer</strong> <strong>Program</strong> <strong>Report</strong>HarvestWildlifeManagementArea4,0003,0002,00088 89 90 91 92 93 94 95 96 97 98 99 00 01 02 03 04 05 06 07 08HarvestMan DaysFigure 1. Wildlife Management Area<strong>Report</strong>ed <strong>Deer</strong> Harvest and Hunter Man-daysMinimumAntlerCriteriaNanih Waiya 12/15Natchez State Park 12/15Okatibbee 12/15O’Keefe 15/18Old River 12/15Pascagoula 12/15Pearl River 12/15Red Creek 12/15Sandy Creek 12/15Hardened AntlerAbove HairlineSardis WaterfowlShipland 15/18Stoneville 15/18Sunflower 15/18Tallahala 12/15Theodore A. Mars, Jr.Tuscumbia 12/15Twin Oaks 15/18Upper Sardis 12/15Ward Bayou 12/15Wolf River 12/15Yockanookany 12/15Hardened AntlerAbove Hairline*2nd number indicates Main Beam Length80,00040,000<strong>Report</strong>ed hunter man-days for the 2008–2009season increased by 2,045 man-days compared tolast year. The 2006–2007 season showed the firstincrease in hunter effort in five seasons. We arenow possibly beginning to recover from the pastseasons’ decrease. Reasons for these decreasesvaried. Hurricane Katrina certainly decreasedhunter activity, as did the increase in fuel pricesthat followed the hurricane in 2005–2006. Hunteropportunity has generally remained stable orincreased on most WMAs; therefore, opportunity isnot likely a causative factor of this decrease.Similar to hunter effort, total reported harvestincreased by 285 deer compared to last season(Figure 1). The 2008–2009 season was thefifth and sixth seasons that many WMAs had aminimum inside spread restriction for legal bucks.Beginning with the 2007–2008 season, all WMAswith a minimum inside spread antler restrictionimplemented a minimum main beam lengthrestriction also. A legal buck must meet either theminimum inside spread or the minimum mainbeam length. See Table 1 to determine the antlercriteria for each WMA. Harvest should continueto increase for a few years before leveling off.However, an increase in harvest can only beexpected if hunter effort remains constant orincreases.Average success rate also increased acrossWMAs. Therefore, the increased harvest maybe partially attributed to increased deerpopulations on the WMA system. Otherbehavioral changes within the deer herd arealso likely culprits in the increased harvest.0Man Days3WMA Data
Table 2. Wildlife Management Area Harvest Informationfor the 2008-2009 SeasonWildlifeManagement AreaAcreageTotalHarvestAcres/<strong>Deer</strong>BuckHarvestAcres/BuckDoeHarvestAcres/DoeTotalMan-daysMan-days/<strong>Deer</strong>Man-days/AcreWMA DataBienville 26,136 88 297 50 523 38 688 1,755 20 0.07Black Prairie 5,673 25 227 8 709 17 334 162 6 0.03Calhoun County 10,900 62 176 40 273 22 495 1,914 31 0.18Canal/John Bell 28,930 116 249 52 556 64 452 3,660 32 0.13Caney Creek 28,000 62 452 33 848 29 966 1,926 31 0.07Caston Creek 27,785 70 397 47 591 23 1,208 4,286 61 0.15Charles Ray Nix 4,000 82 49 32 125 50 80 1,107 14 0.28Chickasaw 27,259 124 220 51 534 73 373 6,864 55 0.25Chickasawhay 29,048 59 492 44 660 15 1,937 2,712 46 0.09Choctaw 24,314 124 196 66 368 58 419 3,121 25 0.13Copiah County 6,583 159 41 64 103 95 69 3,936 25 0.60Divide Section 15,337 54 284 15 1,022 39 393 2,423 45 0.16Hell Creek 2,284 22 104 5 457 17 134 146 7 0.06John Starr 8,244 70 118 29 284 41 201 1,879 27 0.23Lake George 8,383 19 441 11 762 8 1,048 548 29 0.07Leaf River 41,780 135 309 77 543 58 720 9,769 72 0.23Leroy Percy 1,642 10 164 6 274 4 411 382 38 0.23Little Biloxi 6,923 32 216 13 533 19 364 2,619 82 0.38Mahannah 12,675 193 66 73 174 120 106 1,792 9 0.14Malmaison 9,696 120 81 32 303 88 110 2,461 21 0.25Marion County 7,200 88 82 29 248 59 122 2,604 30 0.36Mason Creek 28,000 53 528 33 848 20 1,400 2,771 52 0.10Nanih Waiya 7,295 79 92 29 252 50 146 1,927 24 0.26Natchez State Park 3,425 54 63 21 163 33 104 544 10 0.16Okatibbee 6,883 23 299 7 983 16 430 929 40 0.13O’Keefe 6,239 87 72 37 169 50 125 1,886 22 0.30Old River 14,764 34 434 22 671 12 1,230 1,562 46 0.11Pascagoula River 36,994 122 303 103 359 19 1,947 6,506 53 0.18Pearl River 6,925 19 364 13 533 6 1,154 1,602 84 0.23Red Creek 22,954 14 1,640 6 3,826 8 2,869 1,341 96 0.06Sandy Creek 16,407 99 166 59 278 40 410 4,137 42 0.25Sardis Waterfowl 4,000 19 211 9 444 10 400 146 8 0.04Shipland 3,642 23 158 8 455 15 243 1,079 47 0.30Stoneville 2,500 12 208 6 417 6 417 328 27 0.13Sunflower 58,480 98 597 44 1,329 54 1,083 1,870 19 0.03Tallahala 28,120 119 236 60 469 59 477 2,871 24 0.10Theodore A. Mars, Jr. 900 1 900 1 900 0 34 34 0.04Trim Cane 891 9 99 4 223 5 178 19 2 0.02Tuscumbia 2,436 16 152 5 487 11 221 372 23 0.15Twin Oaks 5,675 83 68 30 189 53 107 1,060 13 0.19Upper Sardis 42,274 136 311 55 769 81 522 8,055 59 0.19Ward Bayou 13,234 16 827 9 1,470 7 1,891 1,893 118 0.14Wolf River 10,194 83 123 43 237 40 255 3,946 48 0.39Yockanookany 2,379 15 159 7 340 8 297 220 15 0.09TOTAL 657,403 2,928 1,388 1,540 101,164AVERAGE 16,034 71 288 34 584 38 617 2,467 37 0.1742008-2009 Mississippi <strong>Deer</strong> <strong>Program</strong> <strong>Report</strong>
2008-2009 WMA <strong>Deer</strong> Harvest NarrativesBienville WMAWritten by: Scott BakerBienville WMA is 26,136 acres within the Bienville National Forest located north of Morton. For the fifth year, bucksmust meet minimum antler requirements to be legal for harvest. For the 2008–2009 season, bucks must have an insidespread of at least 12 inches or one main beam length of at least 15 inches. The 2008–2009 season was the fourth year whereantlerless deer were legal for harvest during gun season.<strong>Deer</strong> harvest numbers consisted of 50 bucks and 38 does. Total harvest decreased 43% from the previous year and huntereffort decreased by 45%. The harvest and man-days for the 2007–2008 season appear to be the exception rather than thenorm.Season Harvest Man-days2006-2007............ 74................. 1,9242007-2008........... 154................ 3,1692008-2009............ 88................. 1,755Habitat conditions on Bienville WMA improved over the years due tomanagement for the Red-cockaded woodpecker, which is an endangered speciesthat resides on the WMA. However, in 2005, Hurricane Katrina damaged muchof the hardwoods along creeks across the area. The MDWFP has proposed newopenings in timber thinning/harvest areas which will provide additional foodsources for wildlife.As deer populations continue to grow in response to habitat improvements on the area, it has become necessary to increaseantlerless hunting opportunities. For the 2009–2010 season, antlerless hunting opportunities on Bienville WMA will includearchery season, Thanksgiving weekend of gun season with dogs, primitive weapon season, gun season without dogs, and Januaryarchery season.WMA NarrativesBlack Prairie WMAWritten by: Jerry HazlewoodBlack Prairie WMA is a 5,673-acre area located in Lowndes County. Black Prairie offers a draw hunt only by special permitthrough a random drawing. This hunt has provided very high success rates during the past several years. Hunter effort andharvest were both significantly lower than the previous year, with a harvest in 2008–2009 of 8 bucks and 17 does. Man-days ofeffort decreased 34% and harvest decreased 41%. There were no significant changes in deer hunting regulations, opportunity, orbag limits to account for the decrease in man-days of effort.Season Harvest Man-days2006-2007............ 29.................... 1032007-2008............ 42.................... 2442008-2009............ 25.................... 162Hunters who desire a quality buck are passing up young bucks and waitingfor an opportunity to harvest a mature buck; therefore, fewer young bucksare being harvested. The result is an increase in buck quality because bucksare allowed to grow older. Habitat quality is maintained by keeping the deerpopulation below carrying capacity, planting supplemental food plots, andplanting summer agricultural crops on approximately 1,600 acres.Calhoun County WMAWritten by: Brad HolderCalhoun County WMA consists of 10,900 acres located near Bruce in Calhoun County. The area is unique because it offersextensive opportunity to those who hunt deer with dogs. Harvest on the WMA continues to be skewed towards bucks. Fortybucks and 22 does were harvested during the 2008–2009 season. Recorded weights of harvested bucks and does were downwhen compared to the past five seasons with the exception of 1.5 and 2.5 year old does. We would like to see more does thanbucks harvested during future seasons. The result would be a smaller, healthier herd in which individual bucks would bebetter able to reach their full potential.Privately managed loblolly pine plantations cover much of Calhoun County WMA. Large clear-cuts and a fewhardwood draws dot the WMA’s landscape. Timber thins, clear-cuts, and hardwood draws provide some seasonal food andcover. However, deer habitats across the WMA are slightly below averageSeason Harvest Man-days2006-2007............ 57................. 1,9902007-2008............ 45................. 1,9502008-2009............ 62................. 1,914because of dense pine stands and canopy closure which reduces sunlightpenetration and browse growth. Old logging decks and logging roadsare managed as wildlife openings and kept in either native vegetationor planted in wheat, oats, or clover in winter.2008-2009 Mississippi <strong>Deer</strong> <strong>Program</strong> <strong>Report</strong>5
2008-2009 WMA <strong>Deer</strong> Harvest NarrativesCanal Section and John Bell Williams WMAsWritten by: Jerry HazlewoodCanal Section WMA (26,000 ac.) and John Bell Williams WMA (2,930 ac.) share common boundaries and harvest datais combined. These areas stretch approximately 54 linear miles along the west side of the Tennessee-Tombigbee Waterwayfrom MS Hwy. 4 at Bay Springs Lake to five miles south of MS Hwy. 45 atSeason Harvest Man-daysAberdeen. These WMAs lie in Tishomingo, Prentiss, Itawamba, and Monroecounties.During the past deer season, a total of 3,660 man-days were recorded fordeer hunting with a harvest of 116 deer, consisting of 52 bucks and 64 does.The majority of usage and harvest occurred during the gun seasons with 1,9612006-2007........... 131................ 3,9122007-2008........... 165................ 4,5122008-2009........... 116................ 3,660man-days and 32 bucks harvested (doe harvest was not allowed during gun season). The man-day usage total decreased 19%and harvest decreased 30%. There were no changes in regulations or habitat to explain these increases. The poor state of theeconomy and high gasoline prices may have been factors causing the decrease in usage of the area.WMA NarrativesApproximately 250 acres of the area are handicapped hunting only, 200 acres are archery only, and 100 acres are primitiveweapon only for deer hunting. The WMAs have 164 winter food plots and 79 summer food plots. The winter food plots didexceptionally well due to the mild weather and adequate rainfall. Acorn production throughout the WMA was very good.Caney Creek WMAWritten by: Scott BakerCaney Creek WMA is 28,000 acres within the Bienville National Forest located near Forest. For the fifth year, bucks mustmeet minimum antler requirements to be legal for harvest. For the 2008–2009Season Harvest Man-daysseason bucks must have an inside spread of at least 12 inches or one main beamlength of at least 15 inches. <strong>Deer</strong> harvest numbers consisted of 33 bucks and 29does. Total harvest decreased by 32% from last year and hunter effort decreasedby 28%.2006-2007............ 63................. 2,3472007-2008............ 92................. 2,6742008-2009............ 62................. 1,926As deer populations continue to grow in response to habitat improvementson the area, it has become necessary to increase antlerless hunting opportunities. For the 2009–2010 season, antlerless huntingopportunities on Caney Creek WMA will include archery season, Thanksgiving weekend of gun season with dogs, primitiveweapon season, the gun season without dogs, and January archery season.Measures are being taken to improve habitat conditions on the area. The U.S. Forest Service conducted timber harvestoperations on Caney Creek WMA and continue spring prescribed burns, which should increase available browse for deer andother wildlife. As a result of the timber harvest operation, the MDWFP will be allowed to maintain several areas as permanentwildlife openings, which will improve habitat conditions on the area for years to come.Caston Creek WMAWritten by: Josh MoreeCaston Creek WMA is a 27,785-acre WMA located within the Homochitto National Forest near Meadville, in Franklin andAmite counties. The fire-maintained pine stands combined with mixed pinehardwoodand hardwood stands provide good deer habitat. Total reporteddeer harvest increased 180% for the 2008–2009 hunting season, with 70 deerharvested, which consisted of 47 bucks and 23 does. Buck harvest increasedby 30 and doe harvest increased by 15 compared to the previous season.<strong>Deer</strong> hunters accounted for 4,286 man-days, an increase from the previousseason by 24%. Annual prescribed burns conducted by the U.S. ForestService will continue to improve deer browse on the WMA.Season Harvest Man-days2006-2007............ 44................. 2,8872007-2008............ 25................. 3,4692008-2009............ 70................. 4,28662008-2009 Mississippi <strong>Deer</strong> <strong>Program</strong> <strong>Report</strong>
2008-2009 WMA <strong>Deer</strong> Harvest NarrativesCharles Ray Nix WMAWritten by: Brad HolderCharles Ray Nix WMA is 4,000 acres located near the town of Sardis in Panola County. This WMA offers extensiveopportunity to those who enjoy bow hunting. There are also primitive weapon hunts and a week-long youth rifle season.Participation in the primitive weapon hunts is allowed only by special permit through a random drawing.Thirty-two bucks and 50 does were harvested during the 2008–2009 season. Colder weather increased deer movementand helped to increase hunter success. Weights and lactation rates from harvested does were generally below average whencompared to averages for the Upper Thick Loess soil region. Weights fromSeason Harvest Man-days harvested bucks continue to be below average when compared to averages2006-2007............ 76................. 1,270 for the Upper Thick Loess soil region. These parameters indicate a deer herdtoo large to be supported at optimum levels of health by existing habitat.2007-2008............ 50................. 1,305MDWFP managers expected a decline in deer health indices after agricultural2008-2009............ 82................. 1,107production of soybeans and wheat was removed from the area two years ago.These large sources of food artificially inflated carrying capacity of the WMAand increased the population. Doe harvest must be increased to bring the herd into balance with available habitat which issteadily improving under current management objectives. WMA personnel will be looking to increase primitive weapon andrifle hunting opportunity during future deer seasons on Charles Ray Nix WMA.Charles Ray Nix WMA has a large amount of open ground and stands of upland hardwoods. Management on the WMA isdirected towards small game (Northern bobwhite, Eastern cottontail, and mourning dove). Habitat management for those speciesbenefits deer tremendously. Prescribed burning is used to a large extent on the WMA and a series of habitat improvement timberthins are currently being implemented in designated upland hardwood stands. These practices will increase browse quantityand quality as well as fawn cover. Designated areas are planted in cowpeas, soybeans, wheat, oats, and/or clovers. Acorns wereslightly less abundant this past fall and winter but provided some additional forage.WMA NarrativesChickasaw WMAWritten by: Brad HolderSeason Harvest Man-days2006-2007............ 98................. 6,2812007-2008........... 124................ 6,3052008-2009........... 124................ 6,864Chickasaw WMA is 27,259 acres located within the Tombigbee NationalForest near Houston in Chickasaw and Pontotoc counties. Chickasaw WMA hasa designated hunting area north of Highway 32 for those who wish to hunt deerwith hounds.A total of 51 bucks and 73 does were harvested this past season. Man-dayscontinue to exhibit an increasing trend on the area, which is good. Hunters experienced decent success but indicated fewer bucksightings, although this season’s buck harvest didn’t represent a significant departure from the 2007–2008 season. Body weightsfor most buck and doe age groups were slightly above average when compared to averages for the Interior Flatwoods soil region.Lactation was slightly above the soil region average.Chickasaw WMA is predominantly forested with stands of hardwoods and loblolly pines. Old logging roads, logging decks,and power line right-of-ways are managed as wildlife openings. Late-winter burning and thinning of designated pine stands,conducted by the U.S. Forest Service in 2007 and 2008, have helped to increase browse and cover. An average acorn crop thispast winter provided additional forage.Chickasawhay WMAWritten by: Josh MoreeChickasawhay WMA is a large U.S. Forest Service area spanning across 29,048 acres in Jones County. The fire-maintainedpine stands combined with scattered creeks and drains on the area attract many outdoor types. Total reported deer harvestincreased 90% for the 2008–2009 hunting season, with 59 deer harvested, which consisted of 44 bucks and 15 does. Buckharvest increased by 27 and doe harvest increased only by one compared to the previous season. <strong>Deer</strong> hunters accountedfor 2,712 man-days, a decrease from the previous season by 16%. Annual prescribed burns conducted by the U.S. ForestService will continue to improve deer browse on the WMA.A deer herd health evaluation was conducted on Chickasawhay WMA on March 25, 2009. A total of 10 does2008-2009 Mississippi <strong>Deer</strong> <strong>Program</strong> <strong>Report</strong>7
2008-2009 WMA <strong>Deer</strong> Harvest Narrativeswere collected. Overall herd health indices on Chickasawhay WMA were greater than historical values for the WMA butless than historical values for the Lower Coastal Plain soil region. TheSeason Harvest Man-dayskidney fat index was 221% of historical value for the WMA and 72% ofthe historical soil region value. Reproductive timing was late with a meanconception date of January 28. The range of conception was January 15to February 9. The reproductive potential was average with 1.7 fetuses perdoe.2006-2007............ 75................. 2,8292007-2008............ 31................. 3,2452008-2009............ 59................. 2,712Choctaw WMAWritten by: Brad HolderChoctaw WMA is 24,314 acres located within the Tombigbee National Forest near Ackerman in Choctaw County.WMA NarrativesThe 2008–2009 season harvest consisted of 66 bucks and 58 does. Buck and doe harvest has exhibited an increasing trendover the past 11 seasons. Increased harvest of does is particularly positive for Choctaw WMA. Buck and doe body weightscontinue to be below average in most age classes when compared to averagesfor the Upper Coastal Plain soil region. These numbers along with a largepercentage (67%) of 3.5+ year old does harvested indicate overpopulation. Anincreased doe harvest is needed to improve herd health parameters.Choctaw WMA is predominantly forested with stands of hardwoods andloblolly pines. Old logging roads, logging decks, and power line right-of-waysare managed as wildlife openings. Extensive late-winter burning and someSeason Harvest Man-days2006-2007........... 111................ 5,6552007-2008........... 106................ 3,5422008-2009........... 124................ 3,121timber thinning were conducted by the U.S. Forest Service in 2007, 2008, and 2009. These activities have helped to improve deerhabitat on the WMA by stimulating the growth of food and cover. Acorns were less abundant this past fall and winter, so deerfocused more on native vegetation and supplemental forages.Copiah County WMAWritten by: Josh MoreeCopiah County WMA is comprised of 6,583 acres owned by the State of Mississippi. The WMA consists of pine stands withmixed pine-hardwood stands along the creeks and drains. Numerous permanentSeason Harvest Man-daysopenings throughout the WMA are maintained with native vegetation andsupplemental plantings. Habitat conditions on the WMA were improved priorto the 2008–2009 hunting season by conducting prescribed burns and creatingadditional permanent openings with funds provided by the National WildTurkey Federation.2006-2007............ 77.................... 7292007-2008........... 136................ 3,3832008-2009........... 159................ 3,936Total reported deer harvest increased 17% to 159 (64 bucks and 95 does) for the 2008–2009 hunting season. Buck harvestdecreased by six and doe harvest increased by 29 compared to the previous season. <strong>Deer</strong> hunting accounted for 3,936 man-days,an increase from the previous season by 16%.Divide Section WMAWritten by: Jerry HazlewoodDivide Section WMA (15,337 ac.) lies along both sides of the Tennessee-Tombigbee Waterway from the northwest side of Bay Springs Lake northwardto MS Hwy. 25 near Pickwick Lake. A small portion of the area is in PrentissCounty and the remainder is in Tishomingo County. This WMA annuallyundergoes intense habitat management in order to increase the value towildlife and provide a quality hunting experience. The WMA has 141Season Harvest Man-days2006-2007............ 60................. 2,9022007-2008............ 64................. 2,7132008-2009............ 54................. 2,423winter food plots and 78 summer food plots. The food plots range in size from one-half acre to two acres. Approximatelyone-third of the WMA is spoil area, which is material excavated during the construction of the Tennessee-TombigbeeWaterway. This acreage has very low soil fertility and is still in early stages of plant succession.Divide Section WMA is a primitive weapon only area for deer with a season bag limit of two antlerless deer and82008-2009 Mississippi <strong>Deer</strong> <strong>Program</strong> <strong>Report</strong>
2008-2009 WMA <strong>Deer</strong> Harvest Narrativesone legal antlered buck. Regulations state that a buck must have a minimum inside spread of 12 inches or one main beamof at least 15 inches to be legal for harvest. Approximately 950 acres of this area is devoted to youth and handicapped onlydeer hunting. Youth and handicapped hunters may use modern firearms.There were 15 bucks harvested during the 2008–2009 season, an increase of one from the previous season. There were39 does harvested, a decrease of 11 from the previous season. Man-days decreased 11% from the previous year. The poorstate of the economy and high gasoline prices may have been factors causing the decrease in usage of the area.The winter food plots on the area did exceptionally well due to mild weather and adequate rainfall.Hell Creek WMAWritten by: Jerry HazlewoodHell Creek WMA is 2,284 acres located near New Albany in Tippah and Union counties. <strong>Deer</strong> hunting opportunity onthis area is allowed only by special permit through a random drawing. There were no significant changes in deer huntingregulations, opportunity, or bag limits. The deer harvest of 22 deer consisted ofSeason Harvest Man-days2006-2007............ 12...................... 992007-2008............ 11...................... 952008-2009............ 22.................... 1465 bucks and 17 does. The total harvest is a 100% increase and man-days of usefor deer increased 54%. The deer population has shown a significant increaseresulting in noticeable crop damage on the area. Hunter use and success shouldcontinue to increase over the next few years.Habitat management efforts to improve 400 acres of mid-rotation pineplantations by drastically thinning the stands should be beneficial to white-tailed deer on Hell Creek WMA for years to come.WMA NarrativesJohn Starr Forest WMAWritten by: Brad HolderJohn Starr Forest WMA is 8,244 acres located near Starkville in Oktibbeha and Winston counties. Total deer harvest hasexhibited a decreasing trend over the past three seasons. This may be partially due to increased ground cover as the forestbecomes thicker as a result of timber thins and wind damage. Twenty-nine bucks and 41 does were harvested during the 2008–2009 season. Harvested buck and doe body weights were slightly above averageSeason Harvest Man-days compared to figures for the Interior Flatwoods soil region.2006-2007............ 81................. 1,9332007-2008............ 78................. 1,7632008-2009............ 70................. 1,879John Starr Forest WMA is predominantly forested with stands of loblollypine and hardwoods. Old logging roads, logging decks, and power line rightof-waysare managed as wildlife openings. Some prescribed burning and timberthinning, conducted by Mississippi State University, has helped to enhance deerhabitat. Hopefully the use of prescribed fire and thinning within pine plantations will be used to a greater extent in the future.<strong>Deer</strong> seemed to focus on supplemental forages early as acorns were much less abundant compared to the 2007–2008 season.Lake George WMAWritten by: Jackie FleemanLake George WMA is an 8,383-acre tract located near Holly Bluff in Yazoo County. This area consists primarily of 17 yearold replanted bottomland hardwood timber. The 2008–2009 season was the second year that area regulations required alegal buck to have an 18-inch main beam or a 15-inch spread. Also, huntersSeason Harvest Man-days2006-2007............ 15.................... 2972007-2008............ 17.................... 3442008-2009............ 19.................... 548could apply for a tag that would allow them to harvest a buck with at leastone unforked antler. Both of these regulations appear to be supported bythe majority of the deer hunters in the area. Twenty of these special bucktags were given out for use on Lake George WMA, and one was reportedas being used. <strong>Deer</strong> hunting man-days increased from 344 during the2007–2008 season to 548 during the 2008–2009 season, continuing thetrend of increased deer hunter man-days on the area. Buck harvest decreased by one to 11, and doe harvest increased to8. Body weights were excellent on bucks and does, and antler indices were outstanding as well.Flooding occurred on the area in the spring and early summer causing some stress on the deer herd and caused2008-2009 Mississippi <strong>Deer</strong> <strong>Program</strong> <strong>Report</strong>9
2008-2009 WMA <strong>Deer</strong> Harvest Narrativespoor lactation rates. Rainfall was consistent until late summer which resulted in good browse availability. This allowedthe deer herd to recover from flood stress and have good body weights and antler production. Mast production was goodwhere available, but most of the trees are not old enough to produce mast. This area has a fairly low deer density, but theherd is growing in numbers and in buck quality because of excellent habitat.Leaf River WMAWritten by: Josh MoreeLeaf River is one of, if not the most, storied WMAs in Mississippi. Therich history and excellent hunting make this area a popular draw for southMississippi hunters. The 41,780-acre WMA, located within the Desoto NationalForest in Perry County, is a mix of fire-maintained pine stands and scatteredcreeks and drains. Annual prescribed burns conducted by the US Forest Servicehas improved deer habitat on the WMA.Season Harvest Man-days2006-2007............ 65................. 5,7942007-2008............ 78................. 7,7062008-2009........... 135................ 9,769WMA NarrativesTotal reported deer harvest increased 73% for the 2008–2009 hunting season, with 135 deer harvested, which consisted of 77bucks and 58 does. Buck harvest increased by 35 and doe harvest increased by 22 compared to the previous season. <strong>Deer</strong> huntingaccounted for 9,769 man-days, an increase from the previous season by 27%.Leroy Percy WMAWritten by: Jackie FleemanLeroy Percy WMA is a 1,642-acre tract located about 5 miles west of Hollandale on MS Hwy 12. Only primitive weaponsand archery equipment are allowed for deer hunting. <strong>Deer</strong> harvest consistedSeason Harvest Man-daysof six bucks and four does, which is down from the 13 deer harvested duringthe 2007–2008 season. This was the second year that area regulations requireda legal buck to have a minimum 18-inch main beam or a 15-inch spread. Also,hunters could apply for a tag that would allow them to harvest a buck with atleast one unforked antler. Nineteen tags were issued and no tags were reportedas being used.2006-2007............ 10.................... 5542007-2008............ 13.................... 5402008-2009............ 10.................... 382Hunting pressure this season was down to 382 man-days compared to 540 man-days last season. All harvested bucks werebetween 3½ and 5½ years old with very good antler development. Average rainfall during the summer resulted in good browseconditions. The amount of browse is diminishing due to shading from canopy closure. Acorn production was good during the2008–2009 season. Timber harvest in the form of thinning is needed.Little Biloxi WMAWritten by: Josh MoreeThe 6,923-acre Little Biloxi WMA, located in Stone and Harrison Counties,is a popular hunting destination for many coastal county residents. TheWMA is located on lands owned by the U.S. Forest Service and WeyerhaeuserCompany. Total reported deer harvest increased 88% for the 2008–2009hunting season, with 32 deer harvested, which consisted of 13 bucks and19 does. Buck harvest increased by five and doe harvest increased by 10compared to the previous season. <strong>Deer</strong> hunting accounted for 2,619 mandays,an increase from the previous season by 33%.Season Harvest Man-days2006-2007............ 19................. 1,9952007-2008............ 17................. 1,9652008-2009............ 32................. 2,619Mahannah WMAWritten by: Jackie FleemanMahannah WMA is 12,675 acres located approximately 12 miles north of Vicksburg. <strong>Deer</strong> hunting is only allowedwith a special permit through a random drawing except for the January archery hunt which is open to the public. Thiswas the second year that area regulations required legal bucks to have a 16-inch minimum inside spread or a 20-inch102008-2009 Mississippi <strong>Deer</strong> <strong>Program</strong> <strong>Report</strong>
2008-2009 WMA <strong>Deer</strong> Harvest Narrativesminimum main beam. Also, hunters could apply for a tag that would allow them to harvest a buck with at leastone unforked antler. Four hundred and seventy of these special buck tags were issued on Mahannah WMA and fortyeight were reported as being used. Both of these regulations appear to be supported by the majority of deer huntersSeason Harvest Man-days2006-2007........... 152................ 1,7552007-2008........... 125................ 1,6462008-2009........... 193................ 1,792on the area. <strong>Deer</strong> man-days increased to 1,792. <strong>Deer</strong> harvest increased to193. Doe harvest increased from 74 to120. Buck harvest increased from 51to 73 due to an increased use of the special buck tags. Extensive floodingoccurred on the area from March through July resulting in stress on thedeer herd. Lactation rates were poor and antler and body indices were downsomewhat. Acorn production was excellent.A deer herd health evaluation was conducted on Mahannah WMA on February 23, 2009. A total of 11 does were collectedconsisting of one 1.5 year old doe and ten 2.5+ year old does. Overall, current herd health indices on Mahannah WMAare better than the expected values for the WMA and the Delta soil region as a whole. Dressed weight, kidney fat index,reproductive potential, and conception date indices are all slightly better than the expected values. Conception dates rangedfrom November 11 until January 15.Selective timber harvest, increased antlerless deer harvest, and good mast crops have brought herd health indices onMahannah above historic figures for the WMA and the soil region. However, high water during early to mid summer causedpoor lactation rates in 2008, but reproductive effort rebounded in the winter of 2009.Malmaison WMAWritten by: Brad HolderWMA NarrativesMalmaison WMA is 9,696 acres located near Grenada in Carroll, Grenada, and Leflore counties. This area is unique becauseit encompasses parts of the loess hills and Mississippi Delta.Total deer harvested increased by 23% compared to the 2007–2008 season, with 32 bucks and 88 does harvested during the2008–2009 season. Weights and lactation for all doe age classes were below average when compared to averages for the UpperThick Loess soil region. Buck weights for all age classes were below average. <strong>Deer</strong> density appears to be high as indicated bysummer browse pressure on vegetation and food plots, and the large percentageSeason Harvest Man-days2006-2007............ 85................. 1,7272007-2008............ 97................. 2,0252008-2009........... 120................ 2,461(48%) of 3.5+ year old does in this past season’s harvest. Increased doe harvestcoupled with continued habitat management is critical to bring the local herdin balance with available forage and improve health indices. Fortunately doeharvest has exhibited an increasing trend over the past five seasons. Hopefullythis increasing trend will continue.Malmaison WMA is predominantly forested with stands of bottomland and upland hardwoods. Many wildlife openingsexist and are maintained in natural vegetation or planted in summer and winter forages such as clovers, wheat, oats, Austrianwinter peas, and iron-clay cowpeas. Adequate rainfall and proper maintenance prompted good forage production. Acornproduction was slightly below average. Habitat improvement in the form of timber thins will be implemented in designatedforest stands on Malmaison WMA. These thins will increase natural browse, fawning cover, acorn production, and promotehardwood regeneration.Marion County WMAWritten by: Josh MoreeSeason Harvest Man-days2006-2007............ 80................. 2,1012007-2008............ 73................. 2,3342008-2009............ 88................. 2,604Marion County WMA, located southeast of Columbia, is comprised of7,200 acres owned by the State of Mississippi. The WMA consists mainlyof fire-maintained longleaf pine stands with mixed pine-hardwood standsalong the creeks and drains. Numerous permanent openings throughoutthe WMA are maintained with native vegetation and supplementalplantings.Total reported deer harvest increased 21% to 88 (29 bucks and 59 does) for the 2008–2009 hunting season. Buckharvest decreased by 11 while doe harvest increased by 26 compared to the previous season. <strong>Deer</strong> hunting accounted for2,604 man-days, an increase from the previous season by 12%.2008-2009 Mississippi <strong>Deer</strong> <strong>Program</strong> <strong>Report</strong>11
2008-2009 WMA <strong>Deer</strong> Harvest NarrativesMason Creek WMAWritten by: Josh MoreeMason Creek WMA consists of over 28,000 acres located within the Desoto National Forest in Greene County. The firemaintainedpine stands combined with scattered creeks and drains on the area attract many visitors to the WMA. While thereis no check-in station on Mason Creek, hunters are still required to recordSeason Harvest Man-daysharvests on the daily permit card. Total reported deer harvest increased 43%for the 2008–2009 hunting season, with 53 deer harvested, which consistedof 33 bucks and 20 does. Buck harvest increased by nine and doe harvestincreased by seven compared to the previous season. <strong>Deer</strong> hunting accountedfor 2,771 man-days, an increase from the previous season by 31%.2006-2007............ 28................. 1,7512007-2008............ 37................. 2,1172008-2009............ 53................. 2,771Habitat management has been very limited on Mason Creek WMA. However, plans are underway to improve wildlifehabitat across the area. Creating additional permanent openings, thinning timber stands, and an improved prescribed fireregime are just some of the activities planned for Mason Creek WMA.WMA NarrativesNanih Waiya WMAWritten by: Jerry HazlewoodNanih Waiya WMA is 7,295 acres located near Philadelphia in Neshoba County. Man-days of deer hunting effort for the2008–2009 season increased 7% from the previous year. Total deer harvest included 29 bucks and 50 does. The increase in usageand harvest over the past few years is most likely due to the development andmaintenance of an extensive road and trail system throughout the bottomland Season Harvest Man-daysallowing hunters unprecedented access. After seven hunting seasons on thisWMA, deer hunting potential remains largely untapped, particularly in themore remote areas throughout the WMA. The early successional habitat, whichcomprises most of the WMA, has provided an abundant food supply for deer.Populations continue to remain at higher levels than when mature hardwood2006-2007............ 61................. 1,4202007-2008........... 100................ 1,7942008-2009............ 79................. 1,927timber dominated the area. This early successional habitat is currently providing abundant deer forage, but will soon be reachinga closed-canopy stage over a large portion of the WMA. The openings created by Hurricane Katrina and smaller isolated stormswill provide a short-term increase in the amount of deer browse available. In an effort to manage deer populations, doe harvestopportunity extends throughout the entire length of the deer season.Natchez State ParkWritten by: Josh MoreeNatchez State Park consists of approximately 3,425 acres located in Adams County near Natchez. The park consists mainlyof upland mixed pine/hardwoods. Approximately 2,200 acres of the park isSeason Harvest Man-daysopen to limited deer hunting. Hunters are allowed only by special permitthrough a random drawing held each fall. Currently, youth gun, handicappedgun, archery, and muzzleloader hunts are available. Hunters will have moreopportunity for deer hunting at Natchez State Park as the hunt dates wereexpanded for the 2009–2010 season.2006-2007............ 27....................N/A2007-2008............ 32....................N/A2008-2009............ 54.................... 544Total reported deer harvest increased 69% for the 2008–2009 hunting season, with 54 deer harvested, which consistedof 21 bucks and 33 does. Buck harvest increased by five and doe harvest increased by 17 compared to the previous huntingseason. <strong>Deer</strong> hunters accounted for 544 man-days. Hunter use and deer harvest are expected to increase for the 2009–2010season because more dates will be available for deer hunting.Okatibbee WMAWritten by: Jerry HazlewoodOkatibbee WMA is 6,883 acres located near Collinsville in Lauderdale County. Man-days decreased slightly from theprevious year. A total of 23 deer were harvested, which included seven bucks and 16 does. The changes in man-days andharvest were only slightly different from the last few years.122008-2009 Mississippi <strong>Deer</strong> <strong>Program</strong> <strong>Report</strong>
2008-2009 WMA <strong>Deer</strong> Harvest NarrativesHurricane Katrina and isolated storm damage has had a lasting impact on the WMA. Timber damage has opened manyof the previously closed canopy stands. This has resulted in an increase in browse for deer. Some of the areas have beenso severely damaged that reforestation in hardwoods was the best optionSeason Harvest Man-days2006-2007............ 29.................... 9832007-2008............ 29................. 1,0572008-2009............ 23.................... 929to reclaim the areas. High winds damaged stands of mature, bottomlandhardwood more than upland stands of mixed pine and hardwood. Downedtimber from the storms is still scattered throughout much of the WMA andhunter access through the woods is limited, but roads and trails have beencleared.Winter food plots did extremely well and there was an exceptional acorn crop. Timber management practices are beingimplemented to increase production of deer browse. Most of the mature, upland pine stands have been thinned and burned.O’Keefe WMAWritten by: Brad HolderO’Keefe WMA is 6,239 acres located near Lambert in Quitman County. This area is unique because it is one of largest tractsof timber in the north Mississippi Delta outside of the Mississippi River levees.Thirty-seven bucks and 50 does were harvested during the 2008–2009 season. This past season’s harvest was the higheston record. Doe harvest increased significantly, presumably because the doe weight regulation was lifted. Seventeen fawns wereharvested with 15 of them being does. Buck fawn harvest did not increase significantly. Cold weather early in the season forceddeer to move more, which helped to increase hunters’ success as well. Buck weights continue to exhibit a slightly increasing trendwhen compared to the past five seasons. Doe weights and lactation rates among all age classes were slightly below soil regionaverages. A lower percentage (27%) of 3.5+ year old does in this past season’sSeason Harvest Man-days2006-2007............ 62................. 1,8252007-2008............ 58................. 1,6522008-2009............ 87................. 1,886harvest suggest a more balanced herd. Weights of bucks harvested during the2008–2009 season were average for the Delta soil region.O’Keefe WMA is predominantly forested with stands of mature bottomlandhardwoods. Open areas on the WMA include farmed fields and CRP or WRPfields. The WMA is surrounded by crop land which provides abundant, highqualitysummer and winter forage in the form of soybeans and wheat. Summer and winter supplemental forages such as oats,wheat, clovers, and iron-clay cowpeas are planted in wildlife openings within the WMA. Supplemental forages did well this seasonwith adequate rainfall. Acorn production was fair during the 2008–2009 season with Nuttall oaks being the better producer.Future timber thins will be implemented in designated forest stands to improve habitat. These thinnings will increase seasonalbrowse, fawning cover, acorn production, and promote hardwood regeneration.WMA NarrativesOld River WMAWritten by: Josh MoreeOld River WMA, located in Pearl River County near Poplarville, is owned by the State of Mississippi. It is a mix ofbottomland hardwoods and few upland areas covering 14,764 acres in the Pearl River Basin. The WMA was in the directpath of Hurricane Katrina as it roared through south Mississippi in AugustSeason Harvest Man-days2006-2007............. 9..................... 3602007-2008............ 42................. 1,0992008-2009............ 34................. 1,5622005. Increased sunlight from downed timber increased browse productionand created dense cover for many wildlife species. Timber salvage operationsconducted after the hurricane improved hunter access to the WMA. Totalreported deer harvest decreased 19% to 34 (22 bucks and 12 does) for the2008–2009 hunting season. Buck harvest decreased by six and doe harvestdecreased by two compared to the previous season. <strong>Deer</strong> hunting accountedfor 1,562 man-days, an increase from the previous season by 42%. Although man-days were up from the previous season,high water at the end of the season prevented many hunters from accessing the WMA.2008-2009 Mississippi <strong>Deer</strong> <strong>Program</strong> <strong>Report</strong>13
2008-2009 WMA <strong>Deer</strong> Harvest NarrativesSardis Waterfowl WMAWritten by: Brad HolderSardis Waterfowl WMA is 4,000 acres located north of Oxford in Lafayette County. This WMA provides deer huntingopportunity to youth only. The WMA’s draw hunts provide youth hunters a unique opportunity to hunt an unpressured,high-density deer herd.Nine bucks and 10 does were harvested during the 2008–2009 season. This was opposite the usual harvest of more bucksthan does. Weights and lactation rates for does this past season remain below average for the Upper Coastal Plain soil region.This coupled with a high percentage of 3.5+ year old does in the harvest suggest overpopulation. Increased participation fromyouth hunters is needed to harvest a greater number of deer so that the health of the remaining deer will improve. MDWFPmanagers intend to provide additional deer hunting opportunity on the WMA to obtain adequate annual harvest.Season Harvest Man-days2006-2007............ 24...................... 962007-2008............ 14.................... 1712008-2009............ 19.................... 146Sardis Waterfowl WMA is predominantly forested with stands of hardwoodsand loblolly pine. Large fields are maintained in a grass and forb communities.Sardis Lake Corps of Engineers personnel assisted MDWFP managers withextensive late-winter, prescribed burning in 2009. This will help to maintainhabitat quality within the large fields. Winter supplemental forages plots ofclover and wheat became moderately established with adequate rain fall andcooler temperatures. A decent acorn crop provided additional forage this past fall and winter. Future timber thinning for habitatimprovement will be coordinated by Sardis Lake Corps of Engineers resource managers and will be implemented in designatedpine and hardwood stands on Sardis Waterfowl WMA. Thinning, coupled with prescribed burning, will increase seasonal browse,fawning cover, acorn production, and promote hardwood regeneration.WMA NarrativesShipland WMAWritten by: Jackie FleemanShipland WMA consists of 3,642 acres and is the only state-owned land in the Batture soil region. The west boundary is theMississippi River. Only primitive weapons and archery equipment are allowed for deer hunting. The WMA consists of bottomlandhardwood and an approximately 100-acre sandfield. Timber thinning in theSeason Harvest Man-days2006-2007............ 28.................... 8402007-2008............ 18.................... 6192008-2009............ 23................. 1,079recent past has greatly increased the browse and escape cover on the WMA. Thiswas the second year that area regulations required a legal buck to have an 18-inch main beam or a 15-inch spread. Also, hunters could apply for a tag thatwould allow them to harvest a buck with at least one unforked antler. Twentyof these special buck tags were issued on Shipland WMA and none were reportedas being used. Hunting pressure increased to 1,079 man-days during the 2008–2009 season. Harvest included eight bucks and 15 does, which was up from 12 bucks and six does last season. Mast productionwas good. Normal rainfall during the summer resulted in adequate browse quality. Spring flooding resulted in a poor fawn crop,reduced body weights, and lower antler development.Stoneville WMAWritten by: Jackie FleemanStoneville WMA (2,500 acres) is located about four miles north of Leland, MS. Most of the timber on the area was cut inthe mid to late 1990s. This WMA has abundant browse and escape cover. Only primitive weapons and archery equipmentare allowed for deer hunting. This was the second year that area regulationsSeason Harvest Man-days2006-2007............ 12.................... 5902007-2008............. 7..................... 6982008-2009............ 12.................... 328required a legal buck to have an 18-inch main beam or a 15-inch spread.Also, hunters could apply for a tag that would allow them to harvest a buckwith at least one unforked antler. Twenty of these special buck tags weregiven out for use on Stoneville WMA and none were reported as beingused. Hunting pressure decreased to 328 man-days during the 2008–2009season. <strong>Deer</strong> harvest increased to 12. This harvest included six bucks andsix does. Limited scientific data was collected because no personnel are assigned to this WMA. Normal rainfall during thesummer resulted in good browse conditions. Acorn production was good.2008-2009 Mississippi <strong>Deer</strong> <strong>Program</strong> <strong>Report</strong>15
2008-2009 WMA <strong>Deer</strong> Harvest NarrativesSunflower WMAWritten by: Jackie FleemanSunflower WMA is a 58,480-acre U.S. Forest Service area in Sharkey County. This was the second year that area regulationsrequired a legal buck to have an 18-inch main beam or a 15-inch spread. Also, hunters could apply for a tag that would allowthem to harvest a buck with at least one unforked antler. Two hundred ofSeason Harvest Man-daysthese special buck tags were issued on Sunflower WMA and six were reportedas being used. Both of these regulations appear to be supported by themajority of deer hunters on the area. Spring and summer flooding causedstress on the deer herd and resulted in poor lactation rates. Body weights andantler development were slightly below last year’s figures. Normal rainfallduring summer and fall resulted in good browse quality. Acorn production2006-2007............ 95................. 3,7712007-2008........... 117................ 3,7522008-2009............ 98................. 1,870was excellent. Buck harvest decreased from 86 in 2007–2008 season to 44 in 2008–2009 season. Doe harvest increased from 31to 54. Man-days decreased to 1,870.WMA NarrativesA deer herd health evaluation was conducted on Sunflower WMA on February 25, 2009. A total of nine does were collectedwith one doe being 1.5 years old and eight does being 2.5 years old or older. Generally, the herd health indices from the herdhealth evaluation were within the expected values for the WMA and the Delta soil region as a whole. The kidney fat index was22% better than the historical Sunflower data and 31% better than the value for the Delta soil region. The mean conception datewas January 4, which was five days later than average. The reproductive rate was about average with 1.9 fetuses per doe. Thereproductive potential was low. The range of breeding was December 24 through February 4, which encompassed 42 days.The herd went through a major stress period during the early to mid summer of 2008 when flood waters covered most of theWMA. The herd health evaluation suggests that harvest on Sunflower WMA has kept the deer population in balance with existinghabit conditions and that the population could be increased.Tallahala WMAWritten by: Scott BakerTallahala WMA is 28,120 acres within the Bienville National Forest locatednear Montrose. For the fifth year bucks must meet minimum antler requirementsto be legal for harvest. For the 2008–2009 season bucks must have an insidespread of 12 inches or one main beam length of at least 15 inches.Season Harvest Man-days2006-2007............ 74................. 1,9242007-2008........... 139................ 2,8442008-2009........... 119................ 2,871<strong>Deer</strong> harvest consisted of 60 bucks and 59 does. Total harvest decreased 14% from last year. <strong>Deer</strong> hunters accounted for2,871 man-days which were up slightly from the previous year.For the 2009–2010 season, antlerless hunting opportunities on Tallahala WMA will include archery season, Thanksgivingweekend of gun season with dogs, primitive weapon season, gun season without dogs, and January archery season.The U.S. Forest Service continues to conduct spring prescribed burns on the WMA. This helps to encourage browseproduction during the spring and fall.Theodore A. Mars Jr. WMAWritten by: Josh MoreeTheodore A. Mars Jr. WMA is a 900-acre WMA located south of Poplarville in Pearl River County. The property wasrecently acquired by MDWFP and public hunting opportunity began in 2007. The property consists of upland pine standswith scattered hardwood bottoms. The property was severely damaged by Hurricane Katrina. Plans are underway to convertthe current loblolly pine stands back to a native longleaf pine ecosystem,which will improve the overall habitat across the WMA. MDWFP beganharvesting timber and replanting longleaf pine seedlings in 2008.Additional habitat improvements include implementing a prescribed fireregime and controlling invasive cogongrass that is frequent across theWMA.Season Harvest Man-days2007-2008...........N/A..................N/A2008-2009............. 1....................... 34<strong>Deer</strong> hunting on Theodore A. Mars Jr. WMA is limited to youth hunters by a special permit draw. <strong>Deer</strong> hunting162008-2009 Mississippi <strong>Deer</strong> <strong>Program</strong> <strong>Report</strong>
2008-2009 WMA <strong>Deer</strong> Harvest Narrativesis allowed on weekends only from opening of youth deer season to the last weekend in December. One buck was reportedas harvested for the 2008–2009 hunting season with 34 reported man-days.Trim Cane WMAWritten by: Jerry HazlewoodTrim Cane is an 891-acre tract located in Oktibbeha County about 4 miles north of Starkville. The area has been developedprimarily for waterfowl hunting. This was the first year this area has been open to deer hunting. Due to the small size of thearea, deer hunting was restricted to wheelchair bound hunters using a randomdrawing for special permits. Three wheelchair accessible shooting houses wereSeason Harvest Man-days constructed and placed on winter food plots. Hunting was limited to Saturday2008-2009............. 9....................... 19 afternoons only. The hunter success rate was extraordinary and could havebeen higher but some of the hunters were very selective. Four bucks and fivedoes were harvested. The handicapped hunters were very appreciative of theunique opportunity and hospitality by the manager. Plans are to expand the number of hunt stations and improve access.Tuscumbia WMAWritten by: Jerry HazelwoodTuscumbia WMA, located in Alcorn County, is a relatively new WMA. The area comprises 2,436 acres and consists primarilyof abandoned agricultural fields and beaver slash. The area is divided geographically into two separate units. Unit 1(1400 ac.)is mainly permanent water and slash, which is not easily accessed and provides little deer habitat. Unit 2 (1200 ac.) has mostlyabandoned agricultural fields and seven newly constructed waterfowl impoundments. Both units experience frequent floodingin the winter months.WMA NarrativesSeason Harvest Man-days2006-2007............. 6..................... 2522007-2008............ 10.................... 2652008-2009............ 16.................... 372Archery hunting on Unit 2 is allowed October1 until just prior to the firstwaterfowl draw hunt. The popularity of this opportunity accounts for most ofthe increasing usage of the area for deer hunting (40% over last year). A total of16 deer were reported harvested (5 bucks, 11 does). Effort and harvest numbersare low due to the small size of the area, limited deer habitat, and low publicaccess.Twin Oaks WMAWritten by: Jackie FleemanTwin Oaks WMA is 5,675 acres of bottomland hardwood five miles southeast of Rolling Fork. <strong>Deer</strong> hunting is allowed usingarchery gear and primitive weapons. Hunters are allowed only by special permit through a random drawing except for theJanuary archery hunt, which is open to the public. This was the second yearSeason Harvest Man-days2006-2007............ 70.................... 9802007-2008............ 78................. 1,2062008-2009............ 83................. 1,060that area regulations required a legal buck to have an 18-inch main beam ora 15-inch spread. Also, hunters could apply for a tag that would allow themto harvest a buck with at least one unforked antler. Six hundred of thesespecial buck tags were issued on Twin Oaks WMA, and 14 were reported asbeing used. Hunter effort decreased to 1,060 man-days during the 2008–2009season. Buck harvest increased slightly from 29 to 30. Doe harvest increasedfrom 49 to 53. Spring flooding on the area caused stress on the deer herd, resulting in poor lactation rates and below averagebody condition and antler development. Normal rainfall during the summer resulted in good browse conditions in latesummer and fall. Acorn production was excellent.A deer herd health evaluation was conducted on Twin Oaks WMA on February 24, 2009. A total of six adult does werecollected. Dressed weight, reproductive effort, and kidney fat indices were all better than expected values for the WMA andthe Delta soil region. The mean conception date was December 26, which was one week earlier than the historical averageand the soil region average. Conception dates ranged from December 18 through January 12, which encompassed 25days. Even on a year with extensive flooding, all indices were either average or slightly above historical averages for TwinOaks and the Delta soil region. Browse quantity and quality was good after flood waters receded. Acorn production wasalso good. Harvest data and herd health evaluation data suggest that harvest on Twin Oaks WMA has kept the deerpopulation in balance with existing habit conditions.2008-2009 Mississippi <strong>Deer</strong> <strong>Program</strong> <strong>Report</strong>17
2008-2009 WMA <strong>Deer</strong> Harvest NarrativesUpper Sardis WMAWritten by: Brad HolderUpper Sardis WMA is 42,274 acres located within the Holly Springs National Forest near Oxford in Lafayette County. UpperSardis WMA also encompasses portions of the Tallahatchie River bottoms owned by the Sardis Lake Corps of Engineers.Total harvest continues to exhibit a decreasing trend when compared to the past three seasons. Fifty-five bucks and 81does were harvested. Doe harvest continues to exhibit an increasing trend, which is positive. Hunters reported slightly higherdeer observations, which may be related to colder conditions early in the 2008–2009 season. Buck weights and percent lactationamong mature does are below average for the Upper Coastal Plain soil region. Declining averages combined with a largepercentage (53%) of 3.5+ year old does in harvest indicate overpopulation. Increased harvest and forest habitat improvementsare needed to improve the local herd’s health.WMA NarrativesUpper Sardis WMA is predominantly forested with stands of hardwoods and loblolly pines. Old logging roads, loggingdecks, and power line right-of-ways are managed as wildlife openings. Latewinterburning, conducted by the U.S. Forest Service, helped to improve deerhabitat on the WMA by stimulating the growth of food and cover. Summersupplemental forage plots of cowpeas and soybeans did not develop well dueto inadequate rainfall. Winter supplemental forage plots of wheat, oats, and/or clovers responded adequately to colder weather and increased rainfall. Anaverage acorn crop provided additional forage. Current plans between theU.S. Forest Service and the Department of Wildlife, Fisheries, and Parks are toSeason Harvest Man-days2006-2007........... 169................ 8,9952007-2008........... 154................ 9,7082008-2009........... 136................ 8,055implement habitat improvement timber thinnings in designated forest stands on Upper Sardis WMA using the new National WildTurkey Federation Stewardship <strong>Program</strong>. These timber thinning will increase seasonal browse, fawning cover, acorn production,and promote hardwood regeneration. Funds generated from timber harvests will be used to improve habitat across Upper SardisWMA.Ward Bayou WMAWritten by: Josh MoreeWard Bayou WMA is a 13,234-acre parcel of bottomland hardwoods and some upland areas nestled within the PascagoulaRiver Basin. Many of the low-lying areas are boat accessible through navigableSeason Harvest Man-dayswaters off the main river channel. Hunting access is often dependent uponrainfall and river levels. Total reported deer harvest increased by four to 16 (9bucks and 7 does) for the 2008–2009 hunting season. Buck harvest increased byone and doe harvest increased by three compared to the previous season. <strong>Deer</strong>hunting accounted for 1,893 man-days, an increase from the previous seasonby 20%.2006-2007............. 2.................. 1,1122007-2008............ 12................. 1,5712008-2009............ 16................. 1,893Wolf River WMAWritten by: Josh MoreeWolf River WMA, located in Lamar and Pearl River counties near Poplarville, is 10,194 acres owned by WeyerhaeuserCompany. The WMA consists of various aged pine plantations interspersedwith minor stream bottoms. Total reported deer harvest increased 66% for the Season Harvest Man-days2008–2009 hunting season, with 83 deer harvested (43 bucks and 40 does). 2006-2007............ 63................. 3,035Buck harvest increased by 12 and doe harvest increased by 21 compared 2007-2008............ 50................. 2,961to the previous season. <strong>Deer</strong> hunting accounted for 3,946 man-days, an2008-2009............ 83................. 3,946increase from the previous season by 33%.Yockanookany WMAWritten by: Brad HolderYockanookany WMA is 2,379 acres located in Attala County along the Yockanookany River approximately 12 mileseast of Kosciusko. Archery and primitive weapon opportunities are by draw only.182008-2009 Mississippi <strong>Deer</strong> <strong>Program</strong> <strong>Report</strong>
2008-2009 WMA <strong>Deer</strong> Harvest NarrativesThe 2008–2009 harvest consisted of seven bucks and eight does. <strong>Deer</strong> harvest was down significantly from last season.There was little hunting during archery season. Weights of harvested bucks and does were generally below average for theUpper Coastal Plain soil region. This indicated a herd to large for the local habitat to support at optimal levels of health.Increased harvest is critical to reduce herd size, and MDWFP managers would like to see an increased harvest during the2009–2010 season.Yockanookany WMA is predominantly forested with stands of bottomland hardwoods. Existing wildlife openings aremaintained in either native vegetation or planted in summer and winterSeason Harvest Man-days2006-2007............. 7..................... 1662007-2008............ 24.................... 1992008-2009............ 15.................... 220supplemental forages such as oats, wheat, clovers, and cowpeas. Summer andwinter supplemental forage plots developed well with adequate rainfall. Acornswere less abundant this past fall and winter. <strong>Deer</strong> seemed to use supplementalforage plots more during the 2008–2009 season. Hunters reported observingand harvesting deer in WMA supplemental forage plots. More wildlife openingsshould be developed in late-summer 2009 and future timber thinning withindesignated hardwood stands will increase browse, cover, acorn production, and hardwood regeneration.WMA NarrativesThis buck was harvested on Leaf River WMA.2008-2009 Mississippi <strong>Deer</strong> <strong>Program</strong> <strong>Report</strong>19
2008-2009 Regional NarrativesNorth RegionWritten by: Lann M. Wilf<strong>Deer</strong> herds in the North Region are expanding at someof the fastest rates in the state. Sentiment against harvestingantlerless deer is still strong in much of the north region, butseems to be changing as management interest spreads.Overall, the herd has appeared relatively healthy over thepast five years. However, site visits within this regionhave revealed grossly overpopulated deer herds onlands that continue to refrain from antlerless harvest.These areas are in desperate need of a change inmanagement. Fortunately, overpopulated deerherds in this region are much easier to controlthan in other areas of the state. Also, the soilfertility is high enough to allow the habitat qualityto be restored after deer numbers are reduced.Therefore, management potential in the NorthRegion is almost as high as any region of the state.Regional NarrativesThe North region DMAP clubs harvested thehighest number of deer per acre in 10 years. Datawas collected from 1,220 deer on 141,665 acresunder the <strong>Deer</strong> Management Assistance <strong>Program</strong>(DMAP). Harvest intensity increased from 1 deer per172 acres to 1 deer per 116 acres. Harvest continuesto be skewed towards females, with over 61% of theharvest being does. Mature buck harvest (4.5+ yearolds) decreased from 22% in the 2007–2008 season to15 % of the 2008–2009 total buck harvest. Harvestpercentages increased on 1.5 and 2.5 year old bucksby 4% and 5% but declined on 3.5 year old bucksby 3%.Adequate moisture during the summerof 2008 resulted in a decent fawn cropthroughout most of the region. Manyareas had lactation percentages in thehigh 80s while other counties hadless than optimal lactation rates thatdropped into the 40s and 50s. Averagelactation rates increased by 5% andbody weights on does increased by 2pounds in the mature age class. Thepercent of 3 ½+ year old does in theharvest decreased to 44%, whichsuggests a stable or slowly expanding herd.Buck harvest is changing due to increasing management interest. Huntersare realizing that age is a major limiting factor in their harvest and are choosingto let some state legal bucks go. The percent of 4 ½+ year old bucks in the harvestis on an increasing trend, but is still lower than most of the state. However, evenwith the increase in management, the percentage of 1 ½ year old bucks in the harvestcontinues to be high at 20%.The frequent summer rains in the summer of 2008 resulted in a great acorn crop last fall. This inhibited the abilityof hunters to see and harvest deer. This also deceived hunters by causing underestimation of actual deer numbers ontheir properties. This trend will probably continue in 2009–2010 because the stage is set for another big mast cropthis fall. In turn, deer visibility will be low, but herd health, productivity, and fawn production should be high.These factors will cause this herd to increase even faster.202008-2009 Mississippi <strong>Deer</strong> <strong>Program</strong> <strong>Report</strong>
2008-2009 Regional NarrativesNorth Central RegionWritten by: William T. McKinleyThe North Central region DMAP clubs harvested the highest number of deer per acre in 11 years. Data were collectedfrom 5,297 deer on 403,272 acres under the <strong>Deer</strong> Management Assistance <strong>Program</strong> (DMAP). Harvest increased from 1 deerper 100 acres to 1 deer per 83 acres, representing a total increase of 264 deer but a decrease of 52,368 acres. Harvest continuesto be skewed towards females, with over 58% of the harvest being does. Mature buck harvest (4.5+ year olds) remained stablefrom the 2007–2008 season at 23% of the total buck harvest. Harvest percentages increased on 1.5 year old bucks by 3%but declined on 2.5 and 3.5 year old bucks by 3% and 1%, respectively. Overall, the herd appears relatively healthy over thepast five years. However, site visits reveal localized areas that are vastly overpopulated and in desperate need of a change inmanagement.A generally wet summer in 2008 produced abundant deer food for much of the North Central Region. Acorn crops weregood, but not as good as 2007. Food plots grew well, and had more deer use than 2007. <strong>Report</strong>s from hunters indicate deermovement was good throughout much of the season. Many DMAP clubs experienced record high deer harvests. The increasedfood supplies did not result in increased lactation in does, as one might have expected. Lactation rates actually fell by 3% in the2.5+ year old does. Doe weights varied by 1 pound from the previous year.<strong>Report</strong>s of hemorrhagic disease (HD), commonly known as blue-tongue, were very low in 2008. Only 4 deer were reportedas suspects of the disease. As it usually occurs in 2-3 year cycles, hunters should not be surprised to see more cases in 2009.Some interesting trends have become apparent when examining the harvest data for the North Central Region over the past15 years. Mature (3.5+) doe body weights are on a slight increasing trend. The percent of mature bucks in the harvest has steadilyincreased from 5% in 1994 to 23% in 2008. Management emphasis has shifted from traditional deer management of harvestingevery legal buck to more quality deer management. Quality deer management includes allowing more bucks to reach older ageclasses and also includes habitat manipulation in favor of wildlife. This habitat manipulation likely explains the increasingtrend in doe body weight. However, this increasing interest in deer management has not been able to stabilize the deer herd’sgrowth in the North Central Region. The percent of 3.5+ year old does in the harvest has shown an increasing trend since 1998.Currently, the percent of 3.5+ year old does is 48%. This indicates an increasing deer herd. This theory is further strengthened byrunning population reconstructions on several clubs throughout the regions. <strong>Deer</strong> herds peaked in the early 90’s but are currentlyexperiencing a second peak, with many clubs having more deer now than then. Increasing the deer harvest is the only way tocombat this burgeoning deer herd.East Central RegionWritten by: Amy C. BlaylockRegional NarrativesThe East Central Region had another relatively successful deer season. However, two years of good acorn crops havedisappointed many food plot hunters. Areas with good acorn crops dispersed deer away from food plots into hardwood bottomsand therefore decreased deer movement.Many areas planted in CRP pines have experienced canopy closure. These stands of pine are just about ready for theirsecond thin. Once these areas have been thinned, the amount of sunlight reaching the ground should increase the amount ofdeer browse available. Therefore, the outlook for future deer habitat is positive.Total deer harvested on DMAP properties decreased by 178 deer from the 2007–2008 deer season; however, it has leveledoff and remained stable over the past 10 years. Acres per deer harvested have remained relatively stable around 1 deer per 100acres. Buck and doe body weights have increased by a few pounds from the 2007–2008 hunting season. This is likely a resultof good acorn crops. We should expect another summer of good fawn production in 2009. Lactation rates for 2.5+ year olddoes have remained between 65%-70% over the past 10 years. The percentage of 3.5+ year old does in the harvest increasedto 49%.Bucks 4.5+ years old decreased from 22% to 19% in 2008. Harvest of 1.5 year old bucks increased to 18%. Harvest of1.5 year old bucks should decrease in 2009–2010 because of the implementation of the new antler criteria for Zone 1 of aminimum 10 inch inside spread or minimum 13 inch main beam.<strong>Report</strong>s of hemorrhagic disease in east-central Mississippi remained about the same as last season. HD/blue-tonguewas found in 5 counties in East Central Mississippi. Samples were taken from hunter harvested and road killed deer forchronic wasting disease testing. No occurrence of CWD was found.2008-2009 Mississippi <strong>Deer</strong> <strong>Program</strong> <strong>Report</strong>21
2008-2009 Regional NarrativesDelta RegionWritten by: Lann M. WilfThe 2008–2009 hunting season tended to be challenging for many hunters in low lying areas of the Delta. Lower thanoptimal fawn recruitment was widespread throughout much of the region last year because of the spring and early summerflood of 2008. Many parcels in the Delta remained underwater until June. This high water caused abnormal concentrationsof deer in higher areas, significant herd displacement in many cases, and in some areas resulted in substantial mortality. Whenthe stress associated with these occurrences is considered, it is logical that this flood caused a reduction in body condition andantler development along with a reduction in fawn recruitment. Therefore, many hunters in the Delta did not see normalnumbers of impressive bucks or the normal number of total deer as a result of this flood. Several quality mature bucks wereharvested, but the 2008–2009 season was nothing like the 2007–2008 season in that regard.Analysis of the harvest data for the past 10 years shows an increasing trend in the total number of deer harvested on DMAPproperties in the Delta region. However, the harvest was down this year by nearly 18%. The highest harvest occurred in the2006–2007 hunting season with 9,436 deer harvested (3,727 bucks and 5,709 does). The harvest decreased significantly this yearto 7,957 deer (3,421 bucks and 4,536 does). The lowest harvest in the last ten years occurred in the 2000–2001 season with 6,594total deer taken. The expansion of deer populations and subsequent harvest is a direct result of the enrollment of approximately500,000 acres of farmland in CRP and WRP, which has increased available deer habitat. The population in the Delta region isexpanding rapidly on average, and continued intense harvest is needed to control the deer density and maintain herd health onnormal weather years.Regional NarrativesFor the past 9 hunting seasons, average body weights for bucks and does has remained stable. However, weights decreasedslightly this year, by two pounds on average. During the 2008–2009 season antler measurements for 4.5+ year old bucks alsodecreased slightly. The harvest percentage of 3.5+ year old bucks remained high at 64%. The percentage of 3.5+ year old does inthe harvest remained stable at 44%.<strong>Report</strong>s of hemorrhagic disease, or blue-tongue, throughout the region were non-existent. Samples were collected onceagain for chronic wasting disease. All samples tested negative for the disease and chronic wasting disease has not been found inMississippi.Some small scale flooding was present again in the spring of 2009, but these floods were not as wide-spread or long-term asthe floods of 2008. Dry conditions have been consistent since the wet spring, which may result in a lower than average mast crop.This spring’s flood water should not have any significant adverse affects on deer herd in this region. However, if dry conditionspersist through summer, antler production and body condition could be reduced going into the 2009–2010 deer season.Southwest RegionWritten by: Chris McDonaldMother Nature teased deer hunters during the 2008–2009 deer hunting season. Opening day of the deer gun season wasone the coldest opening days on record. This led many hunters to believe that the hunting season would be a cold one, unlikeprevious seasons. Hunters did not sleep well the night before due to anticipation of good deer movement during the cold weather.Boy, were hunters disappointed. Hunters reported a disappointing opening day with complaints mainly surrounding limiteddeer movement. Was it too cold for Mississippi deer? Some think deer decided just to bed down and wait out the cold weather,just as many hunters did. Although many deer were harvested on opening day, the number did not meet expectations.Overall, the deer harvest was average for the 2008–2009 hunting season. The acorn crop was good (mainly red oaks) andlasted until early spring. Typical rollercoaster weather was seen throughout the season. Overall warm weather and abundantnatural food limited success on food plots. Hunters hunting natural food sources reported more deer observations than foodplot hunters once again. Several good bucks were harvested in the region, with at least 4 bucks scoring 170+ inches gross.<strong>Deer</strong> herds along the Mississippi River were affected by the 2008 spring flood. Maternal stress associated with theflood led to an increase in fetal/fawn mortality. This was evident by decreased lactation rates and lower fawn observationsreported by hunters. <strong>Deer</strong> harvest on some properties was limited by hunters due to their concern of over-harvest of thedeer herd. However, the flood actually helped over-populated deer herds in the region by removing deer.Analysis of DMAP harvest data indicated that most biological parameters for harvested deer were stable comparedto previous years, with the exception of decreased lactation rates on properties along the Mississippi River. Harvest ofmature bucks remained high with 63% of harvested bucks being 3.5 years old or older.222008-2009 Mississippi <strong>Deer</strong> <strong>Program</strong> <strong>Report</strong>
2008-2009 Regional Narratives<strong>Report</strong>s of hemorrhagic disease were moderate. Samples were collected once again for chronic wasting disease testing.All samples tested negative for the disease and it has not been found in Mississippi.Southeast Region <strong>Deer</strong> NarrativeWritten by: Amy Blaylock and Chris McDonaldThe Southeast Region saw a 10-year low in total deer harvest during the 2005–2006 hunting season due to HurricaneKatrina. However, harvest data now indicates that total deer harvest in the Southeast Region has rebounded to pre-HurricaneKatrina levels. Total deer harvested on DMAP properties decreased by 18 deer from the 2007–2008 deer season. One deer per131 acres was harvested, which is the most deer harvested on a per acre basis in the past 10 years.The combination of antler restrictions and limited hunting opportunity after Katrina has improved the age structure ofharvested bucks. DMAP data indicate that 61% of harvested bucks were 3.5 years old or older for the 2008–2009 season, a 10-year high. Average buck and doe body weights have remained relatively stable for the past 10 years.Hurricane Katrina provided more deer habitat by thinning dense timber and creating more natural openings. With moredeer habitat created, biological parameters of harvested deer should increase, theoretically. However, that is not the case inthe Southeast Region. Most biological parameters have stabilized or slightly decreased compared to pre-Katrina levels. Theexplanation is most likely habitat quality and herd numbers. Although Katrina increased deer habitat, it possibly just createdmore poor quality habitat. Due to low soil fertility, the region is recognized as having poor deer habitat in general. With manydeer protected from harvest post-Katrina, the quality of new habitat may not have been adequate to support extra deer. Thus,habitat and herd numbers just balanced out one another.Randy Hooks harvested this buck onprivate land in Copiah County. The buckscored 165 gross/ 158 1/8 net typical.Regional NarrativesTrail cam photo of the buck harvestedby Randy Hooks in Copiah County.2008-2009 Mississippi <strong>Deer</strong> <strong>Program</strong> <strong>Report</strong>23
Road Kill Survey <strong>Report</strong>2008-2009MDWFP personnel have monitored statewide deer road kill since January 1997. All dead deer observed on or adjacentto roads and highways are recorded during the personnel’s regular course of travel from October 1–January 31. Thecause of death of these animals is assumed to be a vehicle collision. The specific location by county is recorded for everydeer observed. Personnel also record their monthly mileage. In the past the average number of deer observed per 10,000miles was calculated by district. However, with changing district lines and MDWFP personnel routinely traveling outsidetheir home district, we have changed this to a statewide average and not district averages.Graphical monthly statewide summaries of these data are presented in Figure 2. The precise value and accuracy of thismethod of data collection have not been critically evaluated. No evaluation has been made to determine if number of vehicleson the highways has increased, decreased, or remained constant. Therefore, any inferences or interpretation of these datashould be approached cautiously. Every effort has been made to standardize sampling protocol.Road Kill SurveyWhen these data are examinedgraphically, fluctuations over timeare apparent. Certain assumptionsmay be logical. For example, anincrease in observed deer vehicularrelated mortality is a result of anincrease in deer activity. Data arecurrently collected from October–January. Activity peaked duringthe fall and winter around breedingseasons, when deer activity is at itshighest.16141210864Statewide Averages (<strong>Deer</strong> / 10,000 Miles Driven)A second assumption is if deer 2numbers are fluctuating annually 0and the number of deer observedis density dependent, then in lower2003-2004 2004-2005 2005-2006 2006-2007 2007-2008 2008-2009population years, fewer road-killeddeer will be observed. Conversely,during high population years, agreater number of road-killed deerOctober November DecemberFigure 2January Season Averagewill be observed. In addition toincreasing or expanding deer herds, road kill observations may be heavily influenced by weather conditions and mast availability.During the 2008–2009 deer season, observed road kills were substantially higher than that of the previous six years. This year’sobserved road kill season average was 1.2 deer higher than 2007–2008 and was 0.5 deer higher than 2006–2007, which was thehighest year in the past six years. This past winter, observed road kills decreased only during the month of October. Observedroad kills increased slightly in November and December, but significantly increased in January. This is most likely due to increaseddeer numbers because mast availability was high throughout most regions of the state.We also collect road-kill data from State Farm Insurance Company. According to State Farm’s estimates there were 13,954 deervehiclecollisions in Mississippi during 2007–2008 and 13,197 in 2006–2007. These estimates fit the increasing trend from MDWFPpersonnel’s roadkillobservations.Table 3. Statewide Averages (<strong>Deer</strong>/10,000 Miles Driven)Also, Mississippiwas 25th in the Month 2003-2004 2004-2005 2005-2006 2006-2007 2007-2008 2008-2009 Avg. all Yearsnation in total deervehiclecollisions.October 5.9 6.6 6.5 8.4 8.8 7.4 7.3November 8.6 7.3 9.2 11.1 9.3 11.1 9.4Michigan hadthe highest with December 10.4 10.1 13.0 12.8 12.0 13.1 11.9104,676 total deervehiclecollisions,January 8.3 9.5 11.2 11.8 11.2 14.3 11.1Season Avg. 8.3 8.4 10.0 11.0 10.3 11.5and Pennsylvaniafollowed having102,166. The deer-vehicle collisions in these states are a result of exceedingly high deer densities and a high number ofvehicles on the roads.The data from State Farm has been projected for the whole insurance industry, based on State Farm’s known autoinsurance market share within each state. This data is based on actual comprehensive and collision claims, and assuch, would not include deer-vehicle collisions where the policy holder had only liability insurance coverage, which istypically carried on older vehicles in some states.242008-2009 Mississippi <strong>Deer</strong> <strong>Program</strong> <strong>Report</strong>
Depredation by <strong>Deer</strong>Conservation officers annually deal with agricultural depredation by deer. Landowners who experience deer depredationproblems are required to apply for a permit before any action is taken to harass or remove problem animals. The processfor permit issuance includes an on-site evaluation by an MDWFP officer to verify the occurrence of depredation. Permitsare issued primarily for agricultural damage, but ornamental vegetation isincluded. Miscellaneous problems such as deer on airport runways alsooccur and are handled on a case-by-case basis. Property owners shouldknow that permits are not issued in every situation.A total of 141 depredation permits were issued in 42 countiesduring 2008, which was substantially higher than the 81 permitsissued during 2007. The number of counties that had recordeddepredation permits also increased from 32 to 42. Countieswhere depredation permits were issued and the number ofpermits issued by county are shown in Figure 3. Thishigh number of permits can be attributed to rising deerpopulations throughout most of the state. Counties with themost depredation problems are generally counties withthe most rapidly expanding deer populations. Cases ofdeer depredation included damage to soybeans, corn,cotton, peas, sweet potatoes, watermelons, pumpkins,gourds, peanuts, pecans, okra, tomatoes, milo, numerousgarden and truck crops, flowers, ornamental trees, andinterference on airports.The preferred method of controlling deer depredationproblems is adequate hunter harvest. This lowers thedeer population to levels that are in balance with theenvironmental carrying capacity of the habitat. Normallythis involves cooperation with adjoining landowners andhunting clubs.Alternative direct methods used to solve depredationproblems include scare or harassment tactics, assortedchemical applications, electric fencing, and traditionalfencing at a height that eliminates deer access. Highfencing around gardens and small problem areas is costlybut provides assured control on a long-term basis withlittle or no maintenance.In some instances, after other controlmeasures have been exhausted, deer will belethally removed. This process seldom providesa long-term solution but is used in someproblem situations.Depredation problems will continueto occur in Mississippi as long as abundantdeer populations exist. Extensive problemswith agricultural depredation can be controlled with adequateantlerless harvest. Instances of urban depredation are increasingdue to escalating deer numbers and urban sprawl. Urban deerproblems are magnified in cities where bowhunting has beenbanned.Figure 3Depredation2008-2009 Mississippi <strong>Deer</strong> <strong>Program</strong> <strong>Report</strong>25
Chronic Wasting DiseaseDisease DataChronic wasting disease (CWD) is a progressivelydegenerative fatal disease that attacks the centralnervous system of members of the deer family. Todate, it has been diagnosed in elk, mule deer, blacktaileddeer, moose, and white-tailed deer. CWD is oneof a group of diseases known as transmissible spongiformencephalopathies (TSEs). These diseases are characterizedas transmissible because they can be transmitted from oneinfected animal to another. They are further classified asspongiform due to the “spongy-like” areas which form inthe brain of the infected animal, hence the encephalopathyportion of the name.The scientific community generally accepts that theinfectious agents of CWD are prions. Prions are abnormalproteins that seem to have the ability to alter the structure ofnormal proteins found in the body of the animal they enter.Logical natural methods of prion transmission include, butmay not be limited to, secretions and excretions from infectedanimals. A study conducted at Colorado State University foundthat CWD can be transmitted experimentally from saliva andblood. Also, human activity contributes to environmental prioncontamination. Prions are hideously durable and imperviousto most disinfectants and natural conditions, remaining in theenvironment for years.Animals suffering from CWD typically behave abnormallyby separating themselves from their usual social group. Theyoften stand alone, with a drooped posture, and may not respondto human presence. As the disease progresses, they will appearvery skinny on close examination and will salivate, drink, andurinate excessively.The goal for the 2008–2009 monitoring period was to testapproximately 1,500 deer statewide. Routine testing involvedMississippi hunters in this disease monitoring effort. Huntersthroughout the state were asked to voluntarily submit theheads of harvested deer for CWD testing. Additionally, sampleswere obtained from taxidermists and deer processing facilities.Most of these samples came from wildlife management areas,national wildlife refuges, Choctaw Tribal Lands, and <strong>Deer</strong>Management Assistance <strong>Program</strong> (DMAP) cooperators.A total of 1,335 samples were taken from free-rangingwhite-tailed deer in Mississippi during 2008–2009. Sampleswere obtained from hunter harvested animals, springherd health evaluations, target animal surveillance, androad-killed animals. Samples were obtained from 77counties (Figure 4). The samples were submitted to theSoutheastern Cooperative Wildlife Disease Study at theUniversity of Georgia following the 2008–2009 hunting seasonand 1,313 of those samples were tested for evidence of the CWDagent using immunohistochemistry. The remaining 22 sampleswere not tested because the containers did not contain testablespecimens. Evidence of CWD was not detected in all of thetested samples. Additionally, 55 samples were taken from whitetaileddeer within high-fenced enclosures and submitted to theNational Veterinary Services Laboratories for testing. Evidenceof CWD was not detected in any of the enclosure samples. Seepage 39 for more information regarding CWD surveillance forhigh-fenced enclosures.The MDWFP, in cooperation with the Mississippi Boardof Animal Health and the U.S. Department of Agriculture/Veterinary Services will continue target animal surveillance. Atarget profile animal is any adult cervid that is emaciated andshows some neurological disorder. These target animals shouldbe reported to the local county conservation officer, who hasbeen trained to properly handle them and coordinate theirtransport to the appropriate laboratory for CWD testing. Mostdeer exhibiting symptoms of CWD are actually suffering fromother conditions or diseases common to white-tailed deer inMississippi. Malnutrition, hemorrhagic disease, brain abscesses,and other conditions may cause some of the same symptoms.However, due to the seriousness of CWD and the importance ofearly detection and control, it is necessary to test target animalsfor infection. The ability to diagnose disease is dependent onquick reporting because deer carcasses deteriorate rapidly inMississippi’s climate.In 1967, CWD was first recognized at a captive mule deerresearch facility in Colorado. A Wyoming research facilitydocumented the disease in deer and elk in 1978. CWD was thendocumented in free-ranging deer in Colorado and Wyomingin the 1980s. Further testing from 1996 through the end of2001 found additional positive animals (either captive or wildelk or deer) in Kansas, Nebraska, Montana, Oklahoma, SouthDakota, and the Canadian provinces of Saskatchewan andAlberta. Then in February 2002 the first case was confirmedeast of the Mississippi River in Wisconsin, in wild whitetaileddeer. In 2004, CWD was found in New York and WestVirginia. As of July 1, 2008, there are 11 states with CWDinfected wild populations (Colorado, Illinois, Kansas, Nebraska,New Mexico, New York, South Dakota, Utah, Wisconsin, WestVirginia, and Wyoming) and two Canadian provinces (Albertaand Saskatchewan). Additionally, CWD has been found incaptive cervid populations in all of the above states as well asMinnesota, Montana, and Oklahoma.262008-2009 Mississippi <strong>Deer</strong> <strong>Program</strong> <strong>Report</strong>
Chronic Wasting DiseaseAll public health officials maintain that venison is safe for human consumption. However, hunters whowish to take additional steps to avoid potential unnecessary contact with prions or environmental contamination can dothe following:• Avoid shooting, handling, or consuming any animal that appears sick. Contact the MDWFP at 601-432-2199 ifyou see or harvest an animal that appears sick.• Wear latex gloves when field dressing or processing deer.• Avoid eating or contact with brain, spinal cord, spleen, lymph nodes, or eyes.• Cut through the spinal cord only when removing the head. Use a knife designated solely for this purpose.• Bone out meat to avoid cutting into or through bones. Remove all fat and connective tissue to avoid lymph nodes.• Dispose of all carcass material, including the head, in a landfill or pit dug for carcass disposal purposes.• Either process your animal individually or request that it be processed without adding meat from other animals.• Disinfect knives and other processing equipment in a 50% bleach solution for a minimum of one hour.• Discontinue baiting and feeding which unnaturally concentrate deer.Disease DataFigure 4* CWD has not been found in Mississippi.2008-2009 Mississippi <strong>Deer</strong> <strong>Program</strong> <strong>Report</strong>27
Hemorrhagic DiseaseDisease DataHemorrhagic Disease (HD), sometimes referred to as Epizootic Hemorrhagic Disease (EHD) or blue-tongue (BT), isconsidered the most important viral disease of white-tailed deer in the United States. Different subtypes of twoclosely related viruses cause HD: EHD and BT. Technically, there are five subtypes of BT virus and two subtypes of EHDvirus. A distinguishable difference does not visually exist between these diseases, so wildlife managers normally group thesymptoms into one category and refer to the condition as HD.Biting midges of the genus Culicoides transmit HD; therefore the disease is seasonal, based on the abundance of midgevectors. Normal occurrence of HD is late summer through fall (approximately late July–November). <strong>Deer</strong> that becomeinfected with the HD virus may exhibit a variety of outward symptoms. Some mildly infected deer will exhibit few symptoms.Others, which contract a more potent form of the virus, will appear depressed, become feverish, have swollen areas around thehead or neck, and may have trouble breathing. However others, which become infected with a particularly potent form of thevirus, can die within 1 to 3 days. Normal mortality rates from HD are usually less than 25 percent. However, rates greater than50 percent of the population have been documented. On a brighter note, HD has destroyed no free-ranging deer population.HD is first suspected when unexplained deer mortality is observed in late summer or early fall. Typically, archery hunterswho are scouting during late September are the first to observe carcasses in the woods. On some occasions HD deer are founddead during the late summer in or adjacent to water. The fever produced by the disease causes the sick deer to seek water. Thesedeer subsequently succumb to the disease in creeks and ponds.Hunters will most frequently encounter the evidence of HD while observing harvested deer during the winter months.During the high fever produced by HD, an interruption in hoof growth occurs. This growth interruption causes a distinctive ringaround the hoof, which is readily identifiable on close examination. Hoof injury, as well as bacterial or fungal infection can causea “damaged” appearance on a single hoof. HD is not considered unless involvement is noticed on two or more hooves.Fortunately, people are not at risk by HD. Handling infected deer or eating the venison from infected deer is not a publichealth factor. Even being bitten by the biting midge that is a carrier of the virus is not a cause of concern for humans. <strong>Deer</strong>, whichdevelop bacterial infections or abscesses secondary to HD, may not be suitable for consumption.The case is not as clear regarding domestic livestock. A small percentage of BT infected cattle can become lame, havereproductive problems, or develop sore mouths. Variations exist between BT and EHD virus infection in cattle and domesticsheep. Sheep are usually unaffected by EHD but can develop serious disease symptoms with the BT virus.Biting Midge(Culicoides spp.)transmits EHDOccasionally over-population of the deer herd has been blamedfor outbreaks of HD. Abnormally high deer populations are expectedto have greater mortality rates because the deer are in sub-optimalcondition. The spread of the virus would be expected to be greaterin dense deer herds. However, an outbreak of HD cannot be directlyattributed to an overpopulated deer herd.HD can be diagnosed several ways. A reliable tentativediagnosis can be made after necropsy by a trained biologistor veterinarian. A confirmed diagnosis can only be made byisolating one of the viruses from refrigerated whole blood,spleen, lymph node, or lung from a fresh carcass.Mouth Lesionsfrom EHDMDWFP biologists have been monitoring the presence ofHD in Mississippi by several methods: sudden, unexplainedhigh deer mortality during late summer and early fall, necropsydiagnosis, isolation of EHD or BT virus, and observation ofhoof lesions on hunter-harvested deer. HD or previous HDexposure is always present in Mississippi deer herds. PreviousHD exposure is good. Exposure yields antibodies to futureoutbreaks of the disease. Without the antibody presence,significant mortality would occur. See Table 4 for the virusisolation results from the 2008 deer herd health evaluations.Hoof Sloughingfrom EHDThe 2008–2009 hunting season produced a low HDoccurrence. Evidence of HD was reported in 46 deer scatteredacross 19 counties during the 2008–2009 hunting season(Figure 5). Researchers have documented a distinctive 2–3year cycle in HD outbreaks. Assuming that these cyclicoutbreaks occur, we can expect a higher occurrence of HDduring the 2009–2010 hunting season.282008-2009 Mississippi <strong>Deer</strong> <strong>Program</strong> <strong>Report</strong>
Hemorrhagic DiseaseDisease DataFigure 52008-2009 Mississippi <strong>Deer</strong> <strong>Program</strong> <strong>Report</strong>29
2009 <strong>Deer</strong> Herd Health EvaluationsHerd Health<strong>Deer</strong> herd health evaluations are conducted byMDWFP biologists annually. Evaluation sites areselected each year based on a specific need for additionalinformation, which cannot be obtained from hunterharvesteddeer. These sites may be on DMAP cooperatorlands, WMAs, open public lands, or areas with a specialdeer management concern. Some sites are sampledannually, others on a rotational schedule of two–three yearsand some locations on an as-needed basis.Time constraints normally limit the number of locationsbiologists sample each year. <strong>Deer</strong> collections are conductedduring the months of February, March, and April. Collectiontiming must be late enough to insure that all does have beenbred, but early enough to precede the spring green-up whenfoliage density reduces the ability to readily observe andidentify deer. The sampling window is most critical in thesouthern portion of the state where late breeding is a chronicproblem and early green-up of native vegetation occurs.In Table 5, conception date ranges and correspondingfawning dates are given for each collection site. The earliestconception date (8-November) was detected at Black BearPlantation in Issaquena County. The latest conception date(3-March) was detected on Camp McCain in Grenada County.Mean fawning dates based on the conception dates rangedfrom 14-June on Black Bear Plantation in Issaquena Countyto 4-September on Ward Bayou WMA in Jackson County.The statewide average conception date was 1-January and thecorresponding state average fawning date was 17-July.Sample sizes for each collection site are given as N1 or N2.Different groupings by age and sex are mandatory to accuratelyinterpret condition and reproductive data. Total 1½+ yearold fecund (capable of breeding) does are represented as N1.Mature 2½+ year old does are represented as N2. Both N1 andN2 deer are utilized to calculate conception dates, but only N2deer are considered in the sample when reproductive rates andcondition data are compared.Biologists complete an application for approval to conducteach herd health evaluation during a specific time period. TheMDWFP <strong>Deer</strong> Committee reviews these applications and deniesor grants approval. Other agency personnel assist the biologistin charge of the deer collection. When non-agency personnelare participating in the process, specific prior approval isobtained on the application.During a typical herd health evaluation, biological dataregarding reproduction, body condition, and disease arecollected from mature females. A minimum of 10 maturefemales is necessary to obtain an adequate sample size to assessherd parameters. Mature does are collected during the lateafternoon on existing food plots or at night with the aid of alight and truck platform, which has been designed specificallyfor this purpose. Other deer are occasionally taken by mistakeduring the collection process. Data are obtained from all deerbut the purpose of the evaluation is to obtain reproductive,physical condition, and disease data from mature females. Allmeasurements and data are obtained from the deer on site orat a convenient nearby location. All deer are donated to acharitable institution or to an individual determined needyby agency personnel. Neither deer nor portions thereof areutilized by any MDWFP employees. Receipts are obtainedfrom every deer donated. Rarely, instances have occurredwhere deer had to be disposed of in a manner where humanutilization was not possible.ReproductionReproductive data collected during herd healthevaluations include conception dates, fawning dates,number of corpus lutea per doe, and number of fetuses perdoe. Conception dates and fawning dates are determinedusing a fetal aging scale. Fetal length is measured onthe fetal aging scale and the length is used to calculateconception date and fawning date. Breeding date rangesfor Mississippi are presented in Figure 6. Data fromthe 2009 statewide deer herd health evaluations aregiven in Table 5. Data were collected from 242 deeron 25 sites across the state.Data comparing conception ranges and mean conceptiondates are self-explanatory. Average number of corpus lutea (CLs)is determined by examination of the ovaries of each N2 deer inthe sample and counting the number of CLs present at the timeof collection. A CL is a structure in the ovary which forms whenan egg is released. The CL functions to maintain pregnancy bythe release of hormones. As in domestic livestock, healthy deeron a high plane of nutrition will produce more eggs than deerin poor condition. Therefore, CL data provide a quantitativeindex to gauge not only reproductive performance at a specificsite but also provide a general index to overall herd condition.CL data ranged from a low of 1.4 CLs per doe on Natchez StatePark WMA in Adams County to a high of 2.3 CLs per doe onTwin Oaks WMA in Sharkey County.Average number of fetuses are also self-explanatory, butwill, in most instances, be a lower number than average numberof CLs because all CLs do not represent a viable fetus. As theaverage number of CLs provides an index to reproductive ratesand herd condition, the average number of fetuses per doeprovides an additional index to determine site-specific herdhealth. Average number of fetuses per doe ranged from a lowof 1.3 on Natchez State Park WMA in Adams County to a highof 2.1 on Black Bear Plantation in Issaquena County.Body ConditionBody condition data collected during herd healthevaluations include dressed weight and kidney fat index (KFI).Average dressed weight only includes N2 deer. A wide range ofweights are apparent due to soil type, deer herd condition, andhabitat type. In general, dressed weight is a reliable indicator tohelp gauge herd condition but should not be used to comparedifferent sites unless all soil and habitat types are uniform.KFI provides a quantitative index to energy levels withina deer herd. KFI is calculated by expressing the weight of thekidney fat as a percentage of the kidney weight. Substandardkidney fat levels were found at several areas. The highest valueduring 2009 was seen on Oxbow Hunting Club in WarrenCounty.302008-2009 Mississippi <strong>Deer</strong> <strong>Program</strong> <strong>Report</strong>
2009 <strong>Deer</strong> Herd Health EvaluationsDiseaseDuring deer herd health evaluations, blood serum samples are collected from each deer. The serum samples are testedfor antibodies to the various sub-types of hemorrhagic disease (HD). HD can be caused by several different strains of eitherthe epizootic hemorrhagic disease (EHD) virus or the blue-tongue (BT) virus. The presence of antibodies indicates previousexposure, not current infection. Due to time constraints, the serotype information described is for the 2008 <strong>Deer</strong> Herd HealthEvaluations. <strong>Deer</strong> from 16 of the 17 collection sites tested positive for the EHD virus, and deer from 15 of the 17 collectionsites tested positive for the BT virus. The specific serotypes are found in Table 4.Chronic wasting disease (CWD) samples were also taken on most of the deer collected during the 2009 herd healthevaluations. There was no incidence of CWD found in any samples.Herd HealthTable 4. 2008 Serologic Test Results for Antibodiesto EHDV and BTV in Mississippi White-tailed <strong>Deer</strong>Location County Number of Samples Prevalence SerotypesSligo Adams 10 70% E1, E2, B10, B11, B17Cotton Branch Franklin 6 33% E2NASA Stennis Space Center Hancock 8 88% E1, E2, B11Clifton Plantation Holmes 6 67% E1, E2, B10, B11Mahannah WMA Issaquena 11 73% E1, E2, B10Pace HC Jefferson Davis 7 57% E1, E2, B10, B17Cameron Plantation Madison 8 63% E1, E2, B10Horseshoe Lake HC Madison 11 100% E1, E2, B10, B11Marion County WMA Marion 7 86% E1, E2, B10Big O HC Monroe 9 89% E1, E2, B10, B11Sunflower WMA Sharkey 11 36% E1, E2, B10Twin Oaks WMA Sharkey 9 67% E1, E2, B10Jumper Lake HC Tippah 9 67% E1, E2, B10Davis Island Warren 8 63% E1, E2, B10Ashbrook Island Washington 12 0%Smallwood/JA Young Winston 9 67% E1, E2, B10Breakwater HC Yazoo 10 100% E1, E2, B10, B11E1 = EHDV-1, E2 = EHDV-2, B2 = BTV-2, B10 = BTV-10, B11 = BTV-11, B13 = BTV-13, B17 = BTV-17From the Southeastern Cooperative Wildlife Disease Study College of Veterinary Medicine,The University of Georgia, Athens, GA2008-2009 Mississippi <strong>Deer</strong> <strong>Program</strong> <strong>Report</strong>31
2009 <strong>Deer</strong> Herd Health EvaluationsTable 5. <strong>Deer</strong> Herd Health Evaluation SummaryHerd Health#SoilAreaCollection SiteDate of CollectionN1N2Range ofConception1 Batture Ashbrook Island, Washington County 19-Feb 10 8 16-Nov 27-Dec 11-Dec 25-Jun 1.6 1.6 87.1 108.72 LThick Beck’s Bay, Wilkinson County 17-Mar 2 2 31-Dec 7-Jan 4-Jan 19-Jul 2.0 2.0 88.0 116.03 Batture Black Bear Plantation, Issaquena County 2-Feb 14 11 8-Nov 22-Dec 30-Nov 14-Jun 1.9 2.1 98.0 83.94 UThin Box B, Carroll County 10-Mar 8 7 5-Dec 2-Jan 18-Dec 2-Jul 2.0 1.9 83.6 105.85 UThick Bozeman Property, Madison County 10-Mar 12 12 30-Nov 12-Jan 18-Dec 2-Jul 1.9 1.8 90.4 73.96 UCP Camp McCain, Grenada County 3-Mar 12 12 17-Dec 3-Mar 9-Jan 24-Jul 1.7 1.5 74.9 71.77 LCP Camp Shelby, Forrest County 17-Mar 24 20 5-Jan 1-Feb 17-Jan 1-Aug 1.9 1.8 64.8 76.38 UCP Canal Section WMA, Itawamba County 3-Mar 11 10 17-Dec 3-Feb 12-Jan 27-Jul 2.0 1.6 72.9 72.89 LCP Chickasawhay WMA, Jones County 25-Mar 10 10 15-Jan 9-Feb 28-Jan 12-Aug 1.8 1.7 63.9 31.410 BP Circle M Plantation, Noxubee County 11-Mar 11 10 13-Dec 14-Jan 29-Dec 13-Jul 2.2 1.9 94.3 111.211 Delta Cypress Bend, Tallahatchie County 18-Feb 9 7 6-Dec 21-Jan 20-Dec 4-Jul 2.0 1.9 100.7 128.812 UThin Dry Creek Lodge, Madison County 18-Feb 5 5 30-Dec 28-Jan 10-Jan 25-Jul 1.8 1.5 95.6 102.813 UThick Hamer WMA, Panola County 2-Mar 12 11 29-Nov 17-Jan 15-Dec 29-Jun 1.9 1.9 79.5 70.214 UCP Interstate Still Hunting Club, Lauderdale County 24-Mar 16 14 10-Jan 5-Feb 19-Jan 3-Aug 2.0 2.0 80.7 63.015 Delta Mahannah WMA, Issaquena County 23-Feb 11 10 25-Nov 15-Jan 26-Dec 10-Jul 2.1 2.0 99.0 174.416 LThick Natchez Park, Adams County 3-Mar 9 9 11-Dec 2-Jan 23-Dec 7-Jul 1.4 1.3 82.7 153.617 LThick Oxbow, Warren County 4-Mar 2 2 21-Dec 12-Jan 1-Jan 16-Jul 2.0 2.0 116.0 411.018 Delta Panther Swamp NWR, Yazoo County 5-Mar 11 11 25-Nov 12-Jan 23-Dec 7-Jul 2.0 1.9 97.3 80.219 CF Pascagoula WMA, George County 23-Mar 4 4 30-Jan 5-Feb 2-Feb 17-Aug 1.5 2.0 73.5 71.620 Delta Sunflower WMA, Sharkey County 25-Feb 9 8 24-Dec 4-Feb 3-Jan 18-Jul 1.6 1.9 98.5 132.721 Delta Twin Oaks WMA, Sharkey County 24-Feb 5 4 18-Dec 12-Jan 26-Dec 10-Jul 2.3 1.8 111.0 261.322 CF Ward Bayou WMA, Jackson County 23-Mar 1 1 20-Feb 20-Feb 20-Feb 4-Sep 2.0 2.0 80.0 21.023 IF Weyerhaeuser - Kemper Co., Kemper County 3-Mar 16 14 27-Dec 10-Feb 12-Jan 27-Jul 2.0 2.0 81.6 106.424 UThin Wilderness West, Holmes County 9-Mar 7 7 14-Dec 17-Jan 31-Dec 15-Jul 1.7 1.4 85.7 117.925 BP Yates Property, Noxubee County 11-Mar 11 11 17-Dec 28-Jan 4-Jan 19-Jul 1.8 1.9 85.5 97.7Mean Conception DateMean Fawning DateTotal: 242 220 Average: 1-Jan 17-JulAverage # CLsAverage # FetusesAverage Dressed WeightAverage KFIN1=Total 1.5+ year-old fecund (capable of breeding) doesN2=Mature 2.5+ year-old does322008-2009 Mississippi <strong>Deer</strong> <strong>Program</strong> <strong>Report</strong>
2009 <strong>Deer</strong> Herd Health EvaluationsHerd HealthFigure 6Breeding Date Range2008-2009 Mississippi <strong>Deer</strong> <strong>Program</strong> <strong>Report</strong>33
Mail Survey Data 2008-2009Mail Survey DataResident Hunter Survey ResultsSurvey methods changed beginning with the 2003–2004 season. All data collected after this change,which includes the 2008–2009 data, must be looked atcarefully. A survey was not conducted immediately afterthe 2006–2007 season; however, harvest estimates for the2006–2007 season were obtained during the 2008 survey.Table 6 displays the deer harvest results from the 2009Survey of Mississippi Resident and Non-resident Hunters.Changes from the 2008 survey are displayed in Table 7.Total resident deer hunters by user group (gun, archery,and primitive weapons) are shown in Figure 7. Archery andgun hunter numbers increased slightly, while primitive weaponhunter numbers declined by 7%. This decline in primitiveweapons hunters occurred after a 13% increase immediatelyfollowing the implementation of the new primitive weapondefinition in 2005.<strong>Deer</strong> hunting man-days by user group are shown inFigure 8. A long-term evaluation of hunter man-days revealsa declining trend that began in the mid 1980s. For the firsttime since 2004, total hunter numbers increased. The bulkof the increase was in gun hunters, as archery and primitiveweapons hunters have remained relatively constant for thepast six years.Total resident deer harvest for the 2008–2009 seasonis depicted in Figure 9. This graph includes the harvest ofbucks and does from archery, primitive weapon, and gun deerseasons. Total resident deer harvest increased by almost3,000 compared to the 2007–2008 season and the percent ofsuccessful hunters decreased by 5%. However, over 75% of theresident hunters harvested a deer in 2008–2009. Additionally,the average seasonal harvest remained at 2 deer per hunter.Archery and primitive weapon hunters harvested 35% oftotal deer harvest and 42% of total doe harvest. Archery andprimitive weapon hunters harvested more does than bucks.On average it took archery hunters 9.75 man-days, primitiveweapons hunters 9.54 man-days, and gun hunters 10 man-daysto harvest a deer. This is the first year that all three weaponsclasses were even in man-days per deer harvested.Non-Resident Hunter Survey ResultsTotal hunter numbers increased significantly from the2007–2008 season (Figure 10). Both buck and doe harvestincreased (Figure 11). Man-days increased substantially for allweapons (Figure 12). However, success rates for non-residenthunters decreased from the 2007–2008 season.2008–2009 Summary(Resident and Non-Resident Combined)The total number of deer harvested increased by about5,200 from the 2007–2008 season. A total of 132,862 deerhunters spent 2,897,831 man-days deer hunting and harvested132,167 bucks and 148,687 does, for a total of 280,854 deer. Ittook an average of 10.3 man-days per deer harvested. Huntersspent an average of 21.8 man-days hunting during the season.This buck harvested on January 11th in Monroe County and was infull velvet. He weighed 175 pounds, had 14 points, and no testicles.342008-2009 Mississippi <strong>Deer</strong> <strong>Program</strong> <strong>Report</strong>
Mail Survey Data 2008-2009Table 6. Mail Survey Summary for the 2008-2009 SeasonTotalHarvestTotalHuntersAverageSeasonalHarvestTotalMan-daysPercentSuccessfulHuntersResidentNon-ResTotalResidentNon-ResTotalResidentNon-ResResidentNon-ResTotalResidentNon-ResTotal <strong>Deer</strong> 249,993 30,861 280,854 111,487 21,375 132,862 2.24 1.44 2,521,904 375,927 2,897,831 75.2 67.6Buck 117,388 14,779 132,167 1.05 0.69 58.2 46.1Doe 132,605 16,082 148,687 1.19 0.75 57.1 46.7Archery Total 41,148 3,624 44,772 34,471 5,334 39,805 1.19 0.68 401,204 57,805 459,009 58.6 42.8Buck 11,956 1,018 12,974 0.35 0.19 23.9 15.3Doe 29,192 2,606 31,798 0.85 0.49 50.5 35.9Primitive Total 46,272 4,845 51,117 51,396 7,166 58,562 0.90 0.68 441,398 59,401 500,799 58.6 51.1Buck 19,565 1,751 21,316 0.38 0.24 31.7 22.7Doe 26,707 3,094 29,801 0.52 0.43 41.4 34.7Gun Total 162,573 22,393 184,966 104,190 18,851 123,041 1.56 1.19 1,625,793 247,718 1,873,511 71.1 66.3Buck 85,867 12,011 97,878 0.82 0.64 55.1 46.4Doe 76,706 10,382 87,088 0.74 0.55 44.9 39.3Mail Survey DataTable 7. Changes in Mail Survey Data from the 2007-2008 Season to the 2008-2009 SeasonTotalHarvestTotalHuntersAverageSeasonalHarvestTotalMan-daysPercentSuccessfulHuntersResidentNon-ResTotalResidentNon-ResTotalResidentNon-ResResidentNon-ResTotalResidentNon-ResTotal <strong>Deer</strong> 2,969 2,267 5,236 1,394 3,721 5,115 0.00 -0.18 139,193 67,204 206,397 -5.3 -6.8Buck -935 1,132 197 -0.03 -0.08 -4.0 -8.1Doe 3,905 1,135 5,040 0.02 -0.10 -1.7 -2.6Archery Total 6,557 411 6,968 715 893 1,608 0.16 -0.04 10,970 17,643 28,613 3.5 -6.0Buck 2,652 151 2,803 0.07 -0.01 2.7 -4.2Doe 3,905 259 4,164 0.10 -0.04 1.0 -2.3Primitive Total 2,497 -318 2,179 -3,710 595 -3,115 0.11 -0.11 17,785 12,063 29,848 4.5 -5.5Buck 3,701 -596 3,105 0.09 -0.12 6.2 -8.6Doe -1,204 278 -926 0.01 0.00 2.9 0.6Gun Total -6,085 2,175 -3,910 776 2,857 3,633 -0.07 -0.07 96,920 35,771 132,691 -5.0 -4.4Buck -7,289 1,577 -5,712 -0.08 -0.01 -3.6 -4.2Doe 1,203 598 1,801 0.01 -0.06 -1.5 -1.8Positive numbers indicate an increase and negative numbers indicate a decrease from the 2007-2008 Season.2008-2009 Mississippi <strong>Deer</strong> <strong>Program</strong> <strong>Report</strong>35
Mail Survey Data 2008-2009Figure 7. Total <strong>Deer</strong> Hunters--ResidentFigure 8. Total Man-days--ResidentMail Survey DataFigure 9. Total <strong>Deer</strong> Harvest--ResidentFigure 10. Total <strong>Deer</strong> Hunters--Non-residentFigure 11. Total <strong>Deer</strong> Harvest--Non-residentFigure 12. Total Man-days--Non-resident362008-2009 Mississippi <strong>Deer</strong> <strong>Program</strong> <strong>Report</strong>
Mississippi Bowhunter ObservationsThe MDWFP began distributing Bowhunter Observation Books for the 2005–2006 deer archery season. Efforts to increase distribution of the booksincreased during the following years. Five prizes were donated for the 2008–2009 season to increase participation. Southern Outdoor Technologies donateda Sportsman’s Condo, Hunting Solutions donated a Millenium climbingstand, Mississippi Bowhunters Association donated a Millennium hangonstand and stick ladder, Primos donated a Double Bull blind, andMossy Oak donated a suit of Mossy Oak camouflage. Casey Brunning,Trey Gore, Charles K. Smith, Phillip Brown, and Mike Brewer werewinners of the prizes. The prizes were given away in Decemberthrough a random drawing of returned observation books. To beeligible for the drawing, bowhunters must record the deer theyobserve during each bowhunt in Mississippi and return the bookby the deadline.Bowhunter Observation Books were distributed throughsporting goods stores, feed stores, and were available online.Over 2,000 books were distributed during September 2008. Atotal of 155 books were returned by the December 1st deadline.Participating bowhunters observed 7,343 total deer yielding1.14 deer per hour. Bowhunters recorded 6,425.25 hours in 67counties. A description of deer observed is shown in Table 8.Total hours of observation by county are presented in Figure 13.Data collected was not sufficient to estimate sex ratio and fawncrop by county.Bowhunter Observation Books produced very similarstatewide estimates for the past four years (Table 9). Accordingto this data, Mississippi had about 2.5 does for every buck, andabout 1 fawn for every 2 does going into the 2008 huntingseason.We plan to continue distributing BowhunterObservation Books during 2009. If you would like toassist the MDWFP in collecting deer observation dataduring archery season, and automatically enter intothe random drawings, you may download the bookfrom our website, www.mdwfp.com/deer, or you mayemail williamm@mdwfp.state.ms.us or call 601-432-2199 to request a book. If calling or emailing, pleaseprovide a physical address to mail the book. Thanks to allbowhunters who have assisted in collecting this data.Figure 13Bowhunter ObservationsTable 8. Total Hours and <strong>Deer</strong> Observed in 2008Total Hours 2-3 Points 4-7 Points 8+ Points Does Fawns Unknown <strong>Deer</strong>6,425.25 578 503 277 3,394 1,621 970Table 9. Bowhunter Observation Results 2005-2008Year Total <strong>Deer</strong> Observed Sex Ratio Fawn Crop <strong>Deer</strong> Observed Per Hour2005 1,262 1 Buck : 2.4 Does 0.6 Fawns : 1 Doe 1.062006 3,803 1 Buck : 2.69 Does 0.52 Fawns : 1 Doe 1.112007 6,008 1 Buck : 2.92 Does 0.43 Fawns : 1 Doe 1.062008 7,343 1 Buck : 2.5 Does 0.48 Fawns : 1 Doe 1.142008-2009 Mississippi <strong>Deer</strong> <strong>Program</strong> <strong>Report</strong>37
Antler RegulationsThe 2008–2009 hunting season was the fourth season for <strong>Deer</strong> Management Zone 2 in southeast Mississippi. Thiszone includes private and open public lands south ofU.S. Hwy. 84 and east of MS Hwy. 35. Within the zone,deer hunting opportunity is allowed October 15 throughFebruary 15. The objectives of <strong>Deer</strong> Management Zone 2were as follows:1) To protect adult does caring for late born fawnsby opening the season two weeks later (Oct. 15). Thisrecommendation was based on <strong>Deer</strong> Herd HealthEvaluation Data, which illustrates late January–early February breeding;2) To provide more hunting opportunityduring the breeding period (Feb. 1–15). Thisrecommendation was also based on <strong>Deer</strong> HerdHealth Evaluation Data, which illustrates lateJanuary–early February breeding; and3) To improve the age structure ofadult bucks through more restrictive antlerregulations. In 2008–2009, a legal buckin Zone 2 was defined as having at least 4antler points AND a minimum inside spreadof 10 inches OR a minimum main beamlength of 13 inches.Zone 1 includes areas north of U.S. Hwy.84 plus areas south of U.S. Hwy. 84 and westof MS Hwy. 35. In 2008–2009, a legal buckin Zone 1 was defined as having at least 4antler points.Antler RegulationsInside spread antler restrictions placed onmany Wildlife Management Areas (WMAs) arein their fifth year of existence. Antler regulationson most WMAs were amended for the 2007–2008 hunting season to include a minimummain beam length restriction while droppingthe 4 point restriction. Under the newantler regulations, legal bucks must meeteither the minimum inside spread orthe minimum main beam length.Results from studies on the effectsof the “four-point law” andapparent over-harvest of buckson some WMAs support theseantler regulations. See the“Wildlife Management AreaHarvest Information for the2008–2009 Season” tableon page 3 to determinewhich WMAs did not haveinside spread and mainbeam restrictions during the 2008-2009 season. Wildlife Management Areasoffering exclusive youth opportunity were the only areas not required tohave antler restrictions.Beginning in the 2003–2004 season, management buck tags wereissued to WMAs and DMAP properties allowing additional harvest of suboptimalbucks. For more information on management buck tags, see the<strong>Deer</strong> Tags section of this report on pages 40-41.382008-2009 Mississippi <strong>Deer</strong> <strong>Program</strong> <strong>Report</strong>
High Fenced Enclosures 2008-2009 Permit YearPermitsPublic Notice W1-3780 requires owners of enclosurescontaining white-tailed deer to obtain an annual FacilityPermit from the MDWFP. The permit is valid from July 1through June 30. For the 2008–2009 permit year, 78 facilitypermits were issued, 8 permits were denied, and 7 permits arestill pending. Eight permits were denied due to facilities notmeeting the minimum acreage requirements. Additionally, 6breeder permits and 1 deer transport permit were issued.Enclosure Management Assistance<strong>Program</strong>As required by Public Notice W1-3780, all permitted highfencedenclosures containing white-tailed deer must be enrolledin the Enclosure Management Assistance <strong>Program</strong> (EMAP). Theowner of a permitted high-fenced enclosure must work withan MDWFP approved wildlife biologist to manage the whitetaileddeer herd within the enclosure. The wildlife biologistmust submit an annual management plan for the permittedhigh-fenced enclosure, which is incorporated into the AnnualFacility Permit Application.EMAP is a sub-level of DMAP (<strong>Deer</strong> Management Assistance<strong>Program</strong>). The starting point of EMAP is goal/objective settingby the enclosure owner to manage the white-tailed deer herdwithin their enclosure. Once goals and objectives are set,biological data are collected from harvested white-tailed deer,(i.e., weights, antler measurements, lactation data on does, anda jawbone pulled to determine the age of each deer harvested).The enclosure owner is responsible for the collection of biologicaldata. The wildlife biologist is responsible for supplying theenclosure owner with harvest data sheets and jawbone tags.After analyzing the harvest data and evaluating the habitat,the biologist will discuss harvest strategies with the enclosureowner to meet specific goals within limitations of maintaininga healthy herd and habitat. The wildlife biologist must submitEMAP deer harvest data to the MDWFP annually in the samemanner as DMAP data are submitted. However, EMAP andDMAP deer harvest data will be maintained separately by theMDWFP.EMAP cooperators receive a harvest summary report aftereach hunting season. This report contains a detailed analysis ofcurrent and historical harvest as well as graphs and charts thatshow trend directions while facilitating data interpretation.Progress towards the goals and objectives stated in the annualmanagement plan will be continuously evaluated using thisreport.For management of deer herds within high-fencedenclosures and upon the request of the wildlife biologist asoutlined in the annual management plan, the MDWFP mayissue management buck and doe tags to EMAP properties toallow the harvest of does and management bucks in excess ofthe annual and daily bag limits.For the 2008–2009 hunting season, harvest data weresubmitted for 34 enclosures, with 290 bucks and 443 doesharvested. For management purposes, 145 buck tags wereissued to 10 enclosures, and 320 doe tags were issuedto 13 enclosures. Fifty-eight buck tags were reported asused.Chronic Wasting DiseaseSurveillanceRegulations adopted by the Mississippi Commissionon Wildlife, Fisheries, and Parks (Public Notice W1-3780)allow the movement of captive white-tailed deer from onepermitted high-fenced enclosure to another permitted highfencedenclosure within Mississippi only if the high-fenceenclosure from which the deer originate is participating inthe Mississippi White-tailed <strong>Deer</strong> Herd CWD Certification<strong>Program</strong>. No person may import a live white-tailed deer intoMississippi pursuant to Section §49-7-54, Mississippi Code of1972.It is the responsibility of the enclosure/breeding penowner to obtain sampling supplies and collect samples.Retropharyngeal lymph nodes and obex tissue must be collectedfor testing. The MDWFP supplies sampling data sheets to theenclosure/breeding pen owner. Once samples are collected, theMDWFP submits samples to the testing laboratory and suppliestest results back to the enclosure/breeding pen owner. Thecontract laboratory for all captive CWD testing is the NationalVeterinary Services Laboratories. Visit www.mdwfp.com/deerfor more information regarding the Mississippi White-tailed<strong>Deer</strong> Herd CWD Certification <strong>Program</strong>.For the 2008–2009 permit year, 55 samples were takenfrom white-tailed deer within high-fenced enclosures andsubmitted to the National Veterinary Services Laboratories forCWD testing. All samples were tested and evidence of CWDwas not detected in any of the samples.Nicole McClendon with her firstbuck. She harvested the buck onprivate land in Rankin County.High-Fenced Enclosures2008-2009 Mississippi <strong>Deer</strong> <strong>Program</strong> <strong>Report</strong> 39
<strong>Deer</strong> Tags<strong>Deer</strong> TagsManagement Buck TagsDuring the 2003–2004 season sub–4 point bucks werelegal for harvest for the first time since 1995. Sub–4point tags were issued by biologists to DMAP propertieson a limited basis for management purposes. Duringthe 2005–2006 season, tags were expanded to includemanagement bucks. Management buck tags were issuedto DMAP properties allowing additional harvest of suboptimalbucks. Tagged bucks did not count against theannual bag limit. During the 2006–2007 season, taggedbucks did not count against the annual and daily bag limit.The management buck harvest criteria were for an individualproperty and were determined by the DMAP biologist. Awritten management justification issued by the MDWFP mustaccompany any request for such a permit. Management bucksharvested under this permit must be identified with a tagimmediately upon possession.Permits were issued to the following WMAs for the2008–2009 season: Charles Ray Nix, Lake George, Leroy Percy,Mahannah, Malmaison, Pearl River, Shipland, Stoneville,Sunflower, Twin Oaks, and Yockanookany. A total of 1,442permits were issued to these WMAs and 68 of these permitswere used. The number of buck tags issued to WMAs since the2003–2004 season has increased from 164 to a high of 1,819for the 2007–2008 season; however, reported usage of these tagsremains low (Figure 14).Permits were issued to the following 149 DMAP propertiesfor the 2008– 2009 season:11 Shot, 3 Creeks, 6 Mile, Archer Island, Arkabutla COE,Ashbrook, Attala <strong>Deer</strong> Camp, Atwood, Aust, B & J, Barefoot,Bayou Boyz, Beck’s Bay, Beech Ridge, Bellweather, Big BlackWidlife, Big O, Big River Farms, Bighorn Sportsman, Black Bayou,Black Bear, Black River, Bonanza, Box B, Bozeman, Breakwater,Brierfield, Brooksville, Burke, Buzzard Roost, CameronPlantation, Canemount Plantation, Casey Jones, Catfish Point,Cedar Ridge, Chad Bradford, Champion Hill, Chesterfield,Chief, Clifton Plantation, Coahoma County ConservationLeague, Coyote Crik, Cypress Bend, Dancin’ Coyote, DancingRabbit, <strong>Deer</strong> Creek, Deviney Free Range, Donaldson Point,Double Deuce, Duck Lake, DVP Farms, Eastline, Egypt, EllioteLake Farm, Ellislie, Fairview, Floyd Melton, Fort Knox, GaddisFarm Heifer Pasture, Goat Hill, Greasy Bayou, Grimp, Halifax,Hardtimes, Higgs, Hillside NWR, Hoffman Farms, Homewood,Horseshoe, Hunters Chapel, Hutchenson, Independence, InfoLab, Irwin, Itta Bena, Jack Robertson, Jay Powell, Jeff H.C.,Lake Charles, Las Calinas, Lockhart Dalewood, Luckett, LuckyBuck, Mabry, Magna Vista, Magna Vista Section, Merigold,Millbrook, Miller Point, Montgomery Farms, Moore Farms,Morgan Brake NWR, Mt. Ararat Plantation, NAS Meridian,Noxubee NWR, Noxubee-Kemper County Line, Outback,Outpost, Oxbow, P & W Farms, Palmer Farms, Palmyra,Panther Swamp NWR, Paradise, Parker-Gary, Pinecrest,Pinhook, Prewitt, Providence (Hinds Co.), Providence(Holmes Co.), Pushmataha, Red Gate, Refuge, RichardReid,Riverbend (Rankin Co.), Riverland, Riverside,Rosedale, Scotland, Smallwood, Solitude, Stardivant,Strong, Sun Creek, TCP, Thorton, Togo Island, TripleC, Triple Creek, Uncle Henry Farms, Valley Farms,W.F. Anderson, W.W. Miller, Ward Lake, Wasilla Valley, WestHill, Whitetail Reserve, Wilderness West, Wildwood, WilliamsFarms, Willow Break, Willow Oaks 1, Willow Oaks 2, Wolf CreekOutfitters, Wood Burn, Woodstock, Yalabusha Farms, YazooNWR, and Yellow Creek. A total of 2,554 permits were issuedto these properties and 1,011 of these permits were used. Thenumber of DMAP properties receiving tags has increased from13 to 149 since the 2003–2004 season. The number of bucktags issued to DMAP properties since the 2003–2004 season hasincreased from 358 to 2,554, and the number of buck tags usedsince the 2003–2004 season has increased from 262 to over1,000 for the past two hunting seasons (Figure 15).DMAP Antlerless TagsMDWFP issues antlerless tags to DMAP properties. Thisallows the harvest of antlerless deer in excess of the annualand daily bag limits. These tags have been issued since theimplementation of DMAP. When antlerless seasons wereliberalized statewide, the need for antlerless tags was reduced.However, some landowners and managers still have the needfor more antlerless harvest than state bag limits allow.Antlerless tags are issued by DMAP biologists, based on anindividual landowner’s or manager’s need. The tags can onlybe used on antlerless deer on the property to which they wereissued.DMAP biologists issued 4,768 tags to 185 DMAP clubsduring the 2008–2009 season. The increase in tags issued sincethe 2003–2004 season correlates to increased interest in deermanagement in Mississippi (Figure 16).Fee Management Assistance <strong>Program</strong>The Fee Management Assistance <strong>Program</strong> (FMAP) wasimplemented during the 1989–1990 season. It began as a pilotprogram in two north-central counties at the request of localconservation officers to control expanding deer populations.Under this program, doe tags were purchased for $10 each at arate of one per 50 acres. The landowner or club was required toshow proof of ownership or hunting control. FMAP allowed thepermittee to harvest antlerless deer in addition to the state baglimit. This program was accepted and quickly spread statewide.Sportsmen realized they could properly harvest does and stillmaintain a huntable population.Initially, a large number of permits were sold. However,liberalization of antlerless opportunity has occurred throughoutthe state. This has decreased the need for permits in mostareas to the point of considering termination of the program.There were only 51 permits sold during the 2008–2009 huntingseason.Continuation of the program is recommended because itprovides an opportunity to harvest antlerless deer in excess ofthe season bag limit on specific areas that are in excess of theenvironmental carrying capacity.402008-2009 Mississippi <strong>Deer</strong> <strong>Program</strong> <strong>Report</strong>
<strong>Deer</strong> TagsFigure 14. Buck Tags Issued and Used on WMAs<strong>Deer</strong> TagsFigure 15. Buck Tags Issued and Used on DMAP PropertiesFigure 16. Antlerless <strong>Deer</strong> Tags Issued on DMAP Properties2008-2009 Mississippi <strong>Deer</strong> <strong>Program</strong> <strong>Report</strong>41
<strong>Deer</strong> Management Assistance <strong>Program</strong> (DMAP)DMAPThrough a cooperative research program with Mississippi State University in 1976, theMississippi Department of Wildlife, Fisheries and Parks gained information which providedbiologists with the ability to evaluate population density relative to carrying capacity, usingcondition indicators rather than population estimates or browse surveys. This cooperative<strong>Deer</strong> Management Assistance <strong>Program</strong> (DMAP) directly involved hunters in managementthrough the collection of biological data. The interpretation of these data, in consultationwith a biologist, is the guiding principle of DMAP. From a two-county pilot project inits first year, DMAP grew steadily until participation peaked in 1994 at almost 1,200cooperators with over 3.25 million acres under management.SPECIAL NOTE: Beginning with the 2001 data, the MDWFP began using a newcomputer summary program (XtraNet). This may be the cause for drastic differences insome numbers. Once all of the historic data is entered into the XtraNet system the numbers areexpected to fall along the same trend, thus eliminating the drastic drop currently observed in thegraphs and tables. Additionally, the statewide summary table and all graphs include harvest reportsfrom Wildlife Management Areas (WMAs) and National Wildlife Refuges (NWRs) that collect deer harvest data. WMA and NWRdata is not included in the soil region summary tables.Liberalized season structure and bag limits during the mid-1990’s allowed landmanagers the flexibility to meet harvest objectives outside DMAP guidelines, whichresulted in a decline in DMAP participation (Figure 18). This decline reduced bothtotal acreage and number of cooperators in DMAP. Current enrollment includes 648private cooperators on 1,569,858 acres. Total DMAP cooperators have remainedrelatively stable since 2002. Total DMAP harvest has mirrored the changes incooperators and acreage in DMAP over the past few years (Figure 19).Figure 17. DMAP Cooperatorsby CountyThe ability to collect and analyze DMAP data has been exceptional.Hundreds of thousands of deer are now part of the statewide DMAPdatabase. In excess of 10,000 deer have annually been available forcomparative purposes since 1983 (Figure 19). Analysis of these dataover time captured the obvious trends and subtle changes in deer herdcondition and structure. These trends and changes would have goneundocumented and possibly undetected without DMAP. Clubs andlandowners participating in DMAP may or may not be representativeof hunter goals and objectives on a statewide basis. Therefore, deercondition and herd structure on DMAP lands may not reflect herdson un-managed lands. However, a data source representing over 1.5million acres is credible and can be used to examine trend data. Theextensive statewide coverage of private lands DMAP at the county levelcan be seen in Table 10.All DMAP data are evaluated based on soil region. These dataare presented in Tables 15-25. These summaries allow individualDMAP cooperators to compare their data to soil region averages.In these tables are two sets of averages as well. The first is anaverage from 1991–1994 and the second is of the last fiveyears (2004–2008). The 1991–1994 average is the four yearsprior to the 4-point law. Significant differences are obviouswhen comparing these averages.A significant trend in DMAP data is obvious. Theaverage age of all harvested bucks has increased from2.1 years old in 1991 to 2.9 years old in 2008 (Figure21). In addition, these older age class bucks are beingproduced and harvested on a declining acreage base(Figure 22). One possible reason for the drop inacres per 3½ year old bucks over the last couple of422008-2009 Mississippi <strong>Deer</strong> <strong>Program</strong> <strong>Report</strong>
<strong>Deer</strong> Management Assistance <strong>Program</strong> (DMAP)seasons is the more liberalized use of management buck tagswhich allowed DMAP properties to harvest sub-optimal adultbucks. In addition, the average spread, number of points, beamlength, and circumference on all harvested bucks has increasedproportionally.The percentage of harvested bucks in the older age classes(4½+) has increased as well (Figure 23). This increase is theresult of a shift in buck selection by hunters from younger ageclass bucks (1½ year olds) to older animals. Notice in the samegraph, the corresponding decline in the percentage of youngerage class bucks, which occur in the annual harvest. These arevery evident when comparing the past 10 years to the 1991–1994average. The slight increase in 1½ year old bucks since 2005can be attributed to the more wide scale use of managementbuck tags as well.Statewide condition data for harvested deer on WMAs,NWRs, and DMAP properties are presented in Table 14. Thistable presents trend data on various antler parameters such asspread, main beam length, circumference, and points. Otherinformation, such as weight and lactation data are also providedin this table.Soil region condition data for harvested deer on DMAPproperties only are presented in Tables 15-25.These tables also present trend data on various antlerparameters such as spread, length, circumference, andpoints. Other information, such as weight and lactationdata are provided in these tables as well. WMA and NWRharvested deer are not included in the soil region tablesto give a better representation of the deer herd on privatelands participating in DMAP.A comparison of WMAs/NWRs to DMAP propertiesreveals some interesting trends as well. On DMAP propertiesdoe harvest has exceeded buck harvest since the early 1990’s,but on WMAs/NWRs doe harvest has only exceeded buckharvest 4 out of the past 8 years. Since 2004, acres per deerharvested have declined on both DMAP and WMAs/NWRs.Since 2003 on WMAs/NWRs, it is taking fewer acres toproduce 3½+ year old bucks (Table 13). This is most likeydue to the implementation of minimum spread /main beamcriteria on these WMAs/NWRs. Bucks harvested on DMAPproperties on average were ½ a year older, main beams were 2½inches longer, and inside spread was 2 inches wider than bucksharvested on WMAs/NWRs. One thing to remember aboutthe harvest data from WMAs/NWRs is that these are minimumharvest numbers. Compliance with turning in data on someWMAs and NWRs is poor.DMAPMichael Burkley harvested this buck with abow and arrow in Jefferson County. The buckscored 190 5/8 gross / 164 3/8 net typical.Trail cam photo of the buck harvestedby Michael Burkley in Jefferson County.2008-2009 Mississippi <strong>Deer</strong> <strong>Program</strong> <strong>Report</strong> 43
Mississippi DMAP DataFigure 18. DMAP Acreage & CooperatorsFigure 19. DMAP <strong>Deer</strong> HarvestDMAPFigure 20. Acres/<strong>Deer</strong> HarvestedFigure 21. Average Age All BucksFigure 22. Acres/3.5+ Year Old BucksFigure 23. Percentage of Bucks by Age Class442008-2009 Mississippi <strong>Deer</strong> <strong>Program</strong> <strong>Report</strong>
Table 10. DMAP Participation and Harvest by CountyDuring the 2008-2009 SeasonCountyCooperatorsAcresBucksHarvestDoesTotalCountyCooperatorsAcresBucksHarvestDoesTotalAdams 19 57,933 302 510 812Alcorn 0Amite 7 27,227 95 165 260Attala 13 50,144 360 403 763Benton 1 5,000 8 1 9Bolivar 7 37,484 196 275 471Calhoun 1 1,700 1 10 11Carroll 14 24,050 187 344 531Chickasaw 0Choctaw 3 4,481 21 22 43Claiborne 52 90,706 704 1,105 1,809Clarke 5 21,537 57 118 175Clay 6 19,485 120 135 255Coahoma 11 56,475 255 221 476Copiah 10 25,646 111 220 331Covington 0Desoto 1 5,000 15 10 25Forrest 0Franklin 2 3,400 19 38 57George 1 750 1 3 4Greene 4 9,752 38 41 79Grenada 5 16,685 94 244 338Hancock 9 21,131 35 57 92Harrison 1 1,400 0 0 0Hinds 20 33,734 297 410 707Holmes 19 33,422 169 372 541Humphries 4 5,300 16 15 31Issaquena 43 93,479 649 619 1,268Itawamba 3 17,348 109 71 180Jackson 3 7,002 23 30 53Jasper 6 12,218 49 107 156Jefferson 22 60,925 302 531 833Jeff Davis 2 1,242 12 16 28Jones 0Kemper 11 25,548 143 166 309Lafayette 4 10,363 71 102 173Lamar 3 7,988 22 23 45Lauderdale 6 33,600 99 171 270Lawrence 5 13,080 50 89 139Leake 5 13,822 86 102 188Lee 0Leflore 5 9,070 56 68 124Lincoln 1 3,642 21 30 51Lowndes 17 24,989 110 189 299Madison 24 46,827 287 762 1,049Marion 3 9,248 46 48 94Marshall 1 2,190 9 6 15Monroe 16 44,499 175 286 461Montgomery 22 36,021 247 400 647Neshoba 0Newton 3 7,078 48 69 117Noxubee 17 47,171 301 471 772Oktibbeha 3 4,250 12 33 45Panola 4 6,650 30 126 156Pearl River 7 21,417 93 75 168Perry 1 1,778 5 7 12Pike 0Pontotoc 0Prentiss 1 6,000 7 9 16Quitman 1 7,100 0 0 0Rankin 11 24,211 120 187 307Scott 5 15,460 87 107 194Sharkey 2 4,690 34 36 70Simpson 3 14,000 42 54 96Smith 2 9,467 47 30 77Stone 5 8,757 45 36 81Sunflower 1 1,585 5 0 5Tallahatchie 3 4,815 12 35 47Tate 0Tippah 4 16,248 68 160 228Tishomingo 2 5,529 8 8 16Tunica 3 9,264 29 76 105Union 4 17,690 41 48 89Walthall 1 5,600 34 25 59Warren 91 150,864 1,188 1,536 2,724Washington 9 34,634 203 276 479Wayne 0Webster 3 10,227 55 115 170Wilkinson 12 34,887 223 307 530Winston 6 19,837 89 161 250Yalobusha 2 7,350 26 67 93Yazoo 25 47,756 389 649 1,038TOTAL 648 1,569,858 8,908 13,238 22,146DMAP2008-2009 Mississippi <strong>Deer</strong> <strong>Program</strong> <strong>Report</strong>45
Mississippi DMAP DataTable 11. Harvest Summary of Bucks by Age ClassDMAPSeasonSample0.5 Bucks 1.5 Bucks 2.5 Bucks 3.5 Bucks 4.5+ Bucks# % # % # % # % # %Avg. AgeAll BucksTotal3.5+ BucksAcres/3.5+ Buck1991 17,850 1,250 7.0 8,392 47.0 5,280 29.6 2,200 12.3 677 3.8 2.1 2,877 9601992 17,631 1,410 8.0 8,025 45.5 5,154 29.2 2,255 12.8 831 4.7 2.1 3,086 8471993 18,585 1,301 7.0 8,527 45.9 5,488 29.5 2,489 13.4 852 4.6 2.1 3,341 7401994 19,128 1,530 8.0 7,063 36.9 6,529 34.1 3,020 15.8 1,045 5.5 2.2 4,065 685*1995* 14,650 1,172 8.0 3,391 23.1 5,503 37.6 3,367 23.0 1,187 8.1 2.5 4,554 5601996 16,350 1,308 8.0 3,246 19.9 6,489 39.7 3,601 22.0 1,697 10.4 2.3 5,298 5001997 14,405 1,296 9.0 2,737 19.0 5,474 38.0 3,601 25.0 1,585 11.0 2.4 5,186 4561998 13,278 1,062 8.0 2,257 17.0 4,913 37.0 3,452 26.0 1,859 14.0 2.5 5,311 4101999 12,336 740 6.0 1,974 16.0 4,441 36.0 3,454 28.0 1,727 14.0 2.9 5,181 3932000 11,329 566 5.0 1,586 14.0 3,965 35.0 3,399 30.0 1,813 16.0 3.0 5,211 3792001 10,639 404 3.8 1,319 12.4 3,660 34.4 3,192 30.0 2,064 19.4 2.7 5,256 4682002 11,258 394 3.5 1,396 12.4 3,411 30.3 3,580 31.8 2,466 21.9 2.8 6,046 4382003 10,737 374 3.5 1,546 14.4 2,974 27.7 3,328 31.0 2,512 23.4 2.8 5,841 4562004 10,100 362 3.6 1,121 11.1 2,818 27.9 3,373 33.4 2,424 24.0 2.9 5,797 4632005 9,719 452 4.7 1,205 12.4 2,196 22.6 3,285 33.8 2,576 26.5 2.9 5,861 4082006 10,246 460 4.5 1,506 14.7 2,070 20.2 3,125 30.5 3,074 30.0 3.0 6,199 3872007 10,026 426 4.3 1,564 15.6 2,115 21.1 2,938 29.3 2,978 29.7 3.0 5,915 4012008 10,234 438 4.3 1,750 17.1 2,129 20.8 3,142 30.7 2,763 27.0 2.9 5,905 346*1995* Four points or better’ law initiated and bag limit changed from 5 bucks and 3 antlerless to 3 bucks and 5 antlerless with DMAPand FMAP participants exempt from the annual bag limit; 2 additional antlerless deer may be taken with achery equipment.Table 12. Comparison of WMAs and National Wildlife Refugesvs. Private Lands DMAPAcres Total <strong>Deer</strong> Bucks Does Acres/<strong>Deer</strong> Acres/Buck Acres/DoePrivate Public Private Public Private Public Private Public Private Public Private Public Private Public2001 1,651,465 672,467 21,362 2,934 9,162 1,571 12,200 1,363 77 229 180 428 135 4932002 1,784,033 664,467 22,878 2,740 9,779 1,488 13,099 1,252 78 243 182 447 136 5312003 1,819,587 684,967 23,401 2,431 9,442 1,278 13,959 1,153 78 282 193 536 130 5942004 1,858,150 627,746 23,042 1,844 9,152 903 13,890 941 81 340 203 695 134 6672005 1,731,207 691,346 21,552 2,295 8,875 1,140 12,677 1,155 80 301 195 606 137 5992006 1,684,716 628,991 23,766 2,331 9,335 1,124 14,431 1,207 71 270 180 560 117 5212007 1,764,699 691,071 23,198 2,832 9,258 1,582 13,940 1,250 76 244 191 437 127 5532008 1,623,833 741,189 22,533 3,544 9,066 1,735 13,467 1,809 72 209 179 427 121 410462008-2009 Mississippi <strong>Deer</strong> <strong>Program</strong> <strong>Report</strong>
Table 13. Comparison of Bucks Harvested on WMAs andNational Wildlife Refuges vs. Private Lands DMAPAverage Age Average Points Average Length Average Spread Acres/3.5+Private Public Private Public Private Public Private Public Private Public2001 2.7 2.4 7.2 6.8 15.9 14.1 13.0 11.3 359 1,5822002 2.8 2.5 7.3 6.8 16.3 14.2 13.2 11.4 346 1,3592003 2.9 2.1 7.2 5.7 16.5 12.1 13.3 10.1 346 2,4292004 2.9 2.6 7.2 7.1 16.4 15.1 13.4 12.6 361 2,2992005 3.0 2.4 7.2 6.2 16.6 13.6 13.6 11.2 305 2,1812006 3.1 2.4 7.1 6.3 16.5 14.0 13.5 11.6 298 1,6342007 3.0 2.7 7.1 6.6 16.5 14.1 13.6 11.5 324 1,0332008 2.9 2.6 7.0 6.4 16.2 14.2 13.5 11.8 308 1,060DMAPFigure 24. Total <strong>Deer</strong> Harvest--Private vs. PublicFigure 25. Acres/<strong>Deer</strong> Harvested--Private vs. PublicTotal <strong>Deer</strong> Harvest - Private vs. PublicAcres / <strong>Deer</strong> Harvested - Private vs. Public24,0004,0008240023,5003,5008035023,0003,0007830022,5002,5007625022,0002,0007420021,500<strong>Deer</strong> 21,000 Harvest - Private20,5001,5001,00050072<strong>Deer</strong> Harvest - Public Acres/<strong>Deer</strong> 70 - Private6815010050Acres/<strong>Deer</strong> - Pub20,0002001 2002 2003 2004 2005 2006 2007 20080662001 2002 2003 2004 2005 2006 2007 20080Total <strong>Deer</strong> PrivateTotal <strong>Deer</strong> PublicAcres/<strong>Deer</strong> PrivateAcres/<strong>Deer</strong> PublicFigure 26. Acres/3.5+ Year Old Buck Harvested--Private vs. PublicAcres/3.5 Year Old Buck - Private400350300250200150100Acres / 3.5 year old Buck Harvested - Private vs. Public50Acres/3.5 year old Buck - Private02001 2002 2003 2004 2005 2006 2007 2008Acres/3.5+ PrivateAcres/3.5+ Public3,0002,5002,0001,5001,0005000Acres/3.5 Year Old Buck - Private1Average Age - All Bucks1Acres/3.5 year old Buck - Public043322Figure 27. Average Age All Bucks--Private vs. PublicAverage Age All Bucks - Private vs. Public2001 2002 2003 2004 2005 2006 2007 2008Average Age PrivateAverage Age Public2008-2009 Mississippi <strong>Deer</strong> <strong>Program</strong> <strong>Report</strong>47
Table 14. Statewide Compiled Data (DMAP, NWR, WMA)Statewide DMAPSeasonAverage‘08 ‘07 ‘06 ‘05 ‘04 ‘03 ‘02 ‘01 ‘00 ‘99 ‘91-’94 ‘04-’08Acres 2,365,022 2,455,770 2,313,707 2,422,553 2,485,896 2,504,554 2,448,500 2,323,932 2,602,586 2,662,032 3,105,186 2,408,590Total <strong>Deer</strong> 26,077 26,030 26,097 23,847 24,886 25,832 25,618 24,296 26,557 28,624 39,138 25,387Bucks 10,801 10,840 10,459 10,015 10,055 10,720 11,267 10,733 11,329 12,336 19,562 10,434Does 15,276 15,190 15,638 13,832 14,831 15,112 14,351 13,563 15,228 16,288 19,576 14,953Acres/<strong>Deer</strong> 91 94 89 102 100 97 96 96 98 93 79.5 95.2Avg. AgeALL BucksAvg. PointsALL BucksAvg. LengthALL BucksAvg. SpreadALL BucksAcres/3.5+ BucksBucks 219 227 221 242 247 234 217 217 230 216 159 231.2% 0.5 Yr.BucksDoes 155 162 148 175 168 166 171 171 171 163 160 161.62.9 3.0 3.0 2.9 2.9 2.8 2.8 2.7 3.0 2.9 2.2 2.96.9 7.0 7.0 7.1 7.2 7.1 7.3 7.2 6.7 6.6 4.8 7.015.9 16.2 16.3 16.4 16.4 16.0 16.0 15.7 14.6 14.2 10.4 16.213.2 13.3 13.3 13.4 13.4 13.0 13.0 12.8 11.9 11.6 8.7 13.3397 401 383 405 459 452 434 463 379 393 808 4094.3 4.3 4.5 4.7 3.6 3.5 3.5 3.8 5.0 6.0 7.5 4.3Weight 63.8 67 66 73 66 71 75 66 64 63 63 67% 1.5 Yr. 17 16 15 12 11 14 12 12 14 16 44 14Weight 115 113 114 114 112 111 118 115 116 118 115 114Points 3.0 2.7 3.0 3.0 3.4 3.6 4.5 4.1 4.4 4.5 3.2 3.0Circumf. 2.2 2.0 2.2 2.2 2.3 2.3 2.5 2.4 2.5 2.5 2.2 2.2Length 6.5 5.5 6.6 6.6 7.2 7.4 9.0 8.3 8.4 8.7 6.8 6.5Spread 6.2 5.5 6.0 6.2 6.7 6.6 7.5 7.3 7.4 7.4 6.0 6.1% 2.5 Yr. 21 21 20 23 28 28 30 34 35 36 31 23Weight 150 148 148 149 149 148 150 145 147 149 148 149Points 6.9 6.9 6.9 6.8 6.8 6.8 7.0 6.9 6.9 7.0 6.6 6.9Circumf. 3.5 3.4 3.4 3.4 3.4 3.4 3.5 3.3 3.4 3.4 3.3 3.4Length 14.7 14.7 14.7 14.6 14.5 14.4 14.7 14.3 14.4 14.5 14.0 14.6Spread 12.2 12.0 12.0 11.9 12.0 11.7 11.9 11.6 11.7 11.9 11.4 12.0% 3.5 Yr. 31 29 31 34 33 31 32 30 30 28 14 32Weight 169 169 169 170 169 172 169 166 168 170 163 169Points 7.8 7.8 7.8 7.7 7.7 7.8 7.8 7.8 7.9 7.9 7.5 7.8Circumf. 4.0 4.0 4.1 4.0 4.0 4.0 4.0 3.9 4.0 4.0 3.9 4.0Length 17.4 17.5 17.5 17.5 17.3 17.6 17.2 17.1 17.4 17.4 16.7 17.4Spread 14.2 14.1 14.1 14.1 14.0 14.1 13.9 13.8 14.1 14.2 13.5 14.1% 4.5+ Yr. 27 30 30 27 24 23 22 19 16 14 5 27Weight 182 184 185 185 185 186 184 182 182 183 173 184Points 8.3 8.4 8.3 8.3 8.3 8.3 8.3 8.3 8.3 8.5 8.1 8.3Circumf. 4.5 4.5 4.5 4.5 4.5 4.5 4.5 4.4 4.5 4.5 4.3 4.5Length 19.4 19.9 19.7 19.7 19.7 19.7 19.5 19.4 19.6 19.4 18.6 19.7Spread 15.6 15.8 15.8 15.7 15.7 15.6 15.5 15.4 15.6 15.5 14.9 15.7# 4.5 Yr. 1699 1846 1673 1627 1454 1508 1482 1247 1257 1183 589 1660Weight 181 182 183 181 182 184 182 179 181 182 173 182Points 8.2 8.3 8.2 8.3 8.2 8.2 8.3 8.2 8.3 8.4 8.1 8.2Circumf. 4.4 4.4 4.4 4.4 4.4 4.4 4.4 4.3 4.4 4.4 4.2 4.4Length 19 19.6 19.3 19.2 19.4 19.4 19.2 19.0 19.4 19.1 18.6 19.3Spread 15.3 15.6 15.5 15.4 15.6 15.4 15.3 15.1 15.5 15.4 14.8 15.5482008-2009 Mississippi <strong>Deer</strong> <strong>Program</strong> <strong>Report</strong>
Table 14. continuedSeasonAverage‘08 ‘07 ‘06 ‘05 ‘04 ‘03 ‘02 ‘01 ‘00 ‘99 ‘91-’94 ‘04-’08# 5.5 Yr. 721 740 837 648 525 571 579 466 395 372 151 694Weight 182 186 186 189 189 190 186 185 186 185 174 186Points 8.4 8.4 8.4 8.4 8.6 8.4 8.5 8.5 8.4 8.6 7.9 8.4Circumf. 4.6 4.6 4.6 4.6 4.6 4.6 4.6 4.5 4.6 4.6 4.4 4.6Length 19.8 20.1 19.9 20.4 20.2 20.2 20.0 20.1 19.9 20.1 18.9 20.1Spread 15.8 16.0 15.9 16.1 16.0 15.9 15.9 15.9 15.9 15.8 15.1 16.0# 6.5 Yr. 270 351 328 235 193 198 146 159 125 112 44 275Weight 188 188 191 192 192 191 191 187 186 187 176 190Points 8.5 8.5 8.3 8.5 8.1 8.4 8.4 8.3 8.6 8.5 8.3 8.4Circumf. 4.7 4.7 4.7 4.7 4.7 4.7 4.6 4.7 4.7 4.7 4.5 4.7Length 20.3 20.7 21.0 20.7 20.4 20.4 20.6 20.6 20.4 19.9 19.4 20.6Spread 16.3 16.4 16.4 16.4 16.1 15.8 16.4 16.3 16.1 16.0 15.2 16.3# 7.5 Yr. 60 80 98 77 64 70 45 63 39 48 18 76Weight 185 189 192 192 189 190 192 183 187 189 168 189Points 8.1 8.6 8.6 8.3 8.7 8.3 8.6 9.0 8.1 8.6 7.4 8.5Circumf. 4.6 4.7 4.7 4.7 4.7 4.8 4.7 4.7 4.8 4.9 4.4 4.7Length 20.0 21.3 21.0 20.6 20.8 20.6 20.2 20.0 20.6 19.8 18.3 20.7Spread 16.1 16.5 16.3 16.0 16.6 16.6 15.3 15.8 16.2 15.8 15.0 16.3# 8.5+ Yr. 45 63 58 46 27 34 44 36 29 23 11 48Weight 182 189 186 195 183 185 180 190 183 179 171 187Points 7.9 8.3 7.7 7.8 8.0 7.8 8.0 8.4 7.4 9.1 7.5 7.9Circumf. 4.7 4.7 4.6 4.4 4.5 4.7 4.6 4.7 4.5 4.5 4.3 4.6Length 19.6 20.8 20.8 19.8 18.6 19.2 20.1 19.5 19.6 20.4 18.5 19.9Spread 15.9 16.6 16.3 15.5 15.0 15.1 15.7 15.2 16.5 16.4 14.4 15.9Doe Age Classes% 0.5 Yr. 7 7 7 7 7 6 7 5 7 10 13 7% 1.5 Yr. 23 24 20 20 22 23 22 23 23 22 59 22% 2.5 Yr. 22 23 21 22 25 23 23 26 23 24 66 22% 3.5+ Yr. 48 47 52 50 47 48 48 46 47 45 70 49Doe Weights0.5 Yr. 61 67 64 65 64 67 66 64 63 62 11 641.5 Yr. 98 98 98 97 96 96 99 97 96 96 23 972.5 Yr. 110 110 109 111 109 108 110 108 107 108 24 1103.5+ Yr. 115 117 116 117 115 116 116 117 114 115 42 116% Doe Lactation1.5 Yr. 10 11 11 13 11 10 12 10 12 13 60 112.5 Yr. 47 59 59 57 56 56 58 58 61 64 96 562.5+ Yr. 58 68 68 66 63 64 65 66 68 71 108 643.5+ Yr. 63 72 71 70 67 68 69 70 72 75 115 69All Antlerless H’vst% 0.5 Yr. Bk. Fawns 3 3 3 3 2 2 3 3 3 4 7 3% 0.5 Yr. Doe Fawns 7 7 7 7 7 6 6 5 7 9 10 7% 1.5 Yr. Does 22 23 20 20 21 23 21 23 22 21 22 21% 2.5 Yr. Does 22 22 22 22 22 22 22 22 22 23 22 22% 3.5+ Yr. Does 46 46 51 49 46 47 47 44 46 43 39 47Statewide DMAP2008-2009 Mississippi <strong>Deer</strong> <strong>Program</strong> <strong>Report</strong>49
Mississippi Soil Resource AreasFigure 28Soil Resources502008-2009 Mississippi <strong>Deer</strong> <strong>Program</strong> <strong>Report</strong>
Table 15. Batture Soil Resource AreaSummary of DMAP DataSeasonAverage‘08 ‘07 ‘06 ‘05 ‘04 ‘03 ‘02 ‘01 ‘00 ‘99 ‘91-’94 ‘04-’08Acres 262,267 320,090 258,907 264,074 253,078 247,359 251,762 230,792 178,239 171,795 172,527 271,808Total <strong>Deer</strong> 3,712 5,284 4,689 4,524 4,327 4,849 4,835 4,425 3,191 2,950 2,906 4,510Bucks 1,792 2,140 1,909 1,854 1,676 1,963 1,996 1,681 1,300 1,308 1,449 1,876Does 1,920 3,144 2,780 2,670 2,651 2,886 2,839 2,744 1,891 1,642 1,457 2,634Acres/<strong>Deer</strong> 71 61 55 58 58 51 52 52 56 58 60 60Bucks 146 150 136 142 151 126 126 137 137 131 119 1453.5+ Bucks 183 190 165 181 205 174 193 225 232 239 693 185Does 137 102 93 99 95 86 89 84 94 105 120 103Avg. Age ALL Bucks 3.4 3.5 3.6 3.5 3.5 3.4 3.2 3.1 3.3 3.2 2.4 3.5% 0.5 Yr. Bucks 1 4 4 3 3 4 3 4 7 5 6 2.8Weight 67 71 69 68 71 84 73 65 70 70 73 69.4% 1.5 Yr. 8 8 6 6 5 5 5 9 7 6 28 7Weight 118 124 124 115 116 112 119 114 130 129 134 120Points 2.2 2.6 2.5 2.2 2.4 2.5 3.0 2.9 4.4 4.4 3.9 2.4Circumf. 2.1 2.1 2.3 2.2 2.4 2.0 2.3 2.5 2.9 2.8 2.4 2.2Length 5.7 5.7 6.7 5.1 5.7 5.4 5.5 6.9 9.2 9.5 8.2 5.8Spread 6 5.7 6.0 5.4 6.0 5.7 6.1 7.1 8.7 8.6 7.1 5.9% 2.5 Yr. 17 13 11 15 14 14 21 24 27 34 49 14Weight 165 170 166 160 167 167 166 163 168 167 169 165Points 7.3 7.3 7.4 7.3 7.4 7.8 7.7 7.7 7.7 7.8 7.5 7.3Circumf. 3.7 3.6 3.7 3.6 3.7 3.7 3.7 3.7 3.7 3.7 3.5 3.7Length 16.2 16.9 17.0 16.4 17.1 16.8 16.5 16.3 16.7 16.8 15.5 16.7Spread 13.6 13.9 13.9 13.4 14.0 13.8 13.6 13.4 13.7 13.7 13.0 13.8% 3.5 Yr. 34 31 33 35 34 39 38 37 35 36 14 33Weight 185 188 183 184 185 188 185 183 188 189 187 185Points 8.2 8.1 8.0 8.1 8.2 8.3 8.3 8.3 8.5 8.5 8.2 8.1Circumf. 4.2 4.2 4.2 4.3 4.3 4.3 4.2 4.2 4.3 4.3 4.2 4.2Length 19 19.3 19.4 19.7 19.6 19.6 19.1 19.0 19.9 19.9 18.7 19.4Spread 15.6 15.7 15.5 15.7 15.8 15.6 15.3 15.4 16.2 16.1 15.4 15.7% 4.5+ Yr. 40 45 46 42 44 38 33 27 24 19 4 43% Doe LactationDoe Age ClassesWeight 192 197 193 192 193 196 194 192 202 197 198 194Points 8.6 8.5 8.3 8.5 8.5 8.6 8.5 8.4 8.5 8.6 8.5 8.5Circumf. 4.6 4.6 4.6 4.6 4.6 4.6 4.6 4.6 4.7 4.7 4.6 4.6Length 20.4 21.2 20.9 21.1 20.9 20.9 20.6 20.8 21.4 20.9 20.8 20.9Spread 16.5 17.0 16.6 16.6 16.8 16.6 16.3 16.4 17.1 17.0 16.8 16.71.5 Yr. 5 10 11 6 6 11 6 7 10 11 14 82.5 Yr. 31 69 64 52 59 55 47 57 63 70 58 553.5+ Yr. 49 77 77 67 69 65 59 65 77 75 68 68% 0.5 Yr. 3 8 7 6 6 7 6 5 9 11 11 6% 1.5 Yr. 29 27 20 19 21 18 21 24 24 18 20 23% 2.5 Yr. 28 24 23 27 25 27 31 30 25 28 30 25% 3.5+ Yr. 40 41 51 49 48 47 42 41 42 43 39 46Doe Weights0.5 Yr. 64 72 68 68 66 68 69 64 67 68 68 681.5 Yr. 98 104 104 99 98 101 100 98 104 106 108 1012.5 Yr. 113 117 114 114 112 112 114 113 115 114 121 1143.5+ Yr. 122 124 121 121 119 122 123 121 123 124 126 121Soil Resources2008-2009 Mississippi <strong>Deer</strong> <strong>Program</strong> <strong>Report</strong>51
Table 16. Delta Soil Resource AreaSummary of DMAP DataSoil ResourcesSeasonAverage‘08 ‘07 ‘06 ‘05 ‘04 ‘03 ‘02 ‘01 ‘00 ‘99 ‘91-’94 ‘04-’08Acres 326,662 267,536 287,435 287,166 299,682 271,625 264,979 231,185 178,239 269,772 254,153 293,696Total <strong>Deer</strong> 2,412 2,471 2,774 2,625 2,704 2,732 2,772 2,495 3,476 3,503 3,909 2,597Bucks 1,152 1,016 1,056 1,112 1,071 1,135 1,261 1,038 1,360 1,469 1,830 1,081Does 1,260 1,455 1,718 1,513 1,633 1,597 1,511 1,457 2,116 2,034 1,457 1,516Acres/<strong>Deer</strong> 135 108 104 109 111 99 96 93 84 77 66 113Bucks 284 263 272 258 280 239 210 223 215 184 140 2713.5+ Bucks 503 448 462 359 490 419 427 463 243 375 962 452Does 259 184 167 190 184 170 175 159 138 133 124 194Avg. Age ALL Bucks 2.8 2.9 3.0 3.2 3.1 3.0 3.0 2.9 3.1 3.0 2.1 3.0% 0.5 Yr. Bucks 2 4 6 3 4 4 3 6 5 5 8 3.7Weight 79 76 74 76 74 69 75 67 69 73 70 75.7% 1.5 Yr. 22 21 19 8 6 7 6 8 9 12 41 15Weight 127 126 125 124 128 126 133 123 134 135 134 126Points 2.7 2.4 2.3 2.4 3.4 3.4 4.2 3.7 4.1 5.0 3.5 2.6Circumf. 2.2 2.0 2.1 2.2 2.4 2.4 2.6 2.3 2.4 2.7 2.4 2.2Length 6.0 5.0 5.0 5.3 7.1 8.3 8.9 6.4 8.1 9.2 7.3 5.7Spread 6.0 5.0 4.9 5.5 7.0 7.4 8.3 7.8 7.8 7.9 6.4 5.7% 2.5 Yr. 18 16 14 18 26 24 30 30 32 34 36 18Weight 172 169 171 171 174 175 170 165 167 168 169 171Points 7.2 7.4 7.3 7.3 7.5 7.7 7.3 7.4 7.4 7.8 7.3 7.3Circumf. 3.6 3.7 3.7 3.7 3.8 3.8 3.6 3.4 3.5 3.6 3.5 3.7Length 15.8 16.6 16.5 16.5 16.9 16.6 15.7 15.6 15.6 15.8 15.1 16.4Spread 13.4 14.0 13.9 13.5 14.2 13.6 13.0 13.0 13.1 13.2 12.8 13.8% 3.5 Yr. 28 27 31 38 37 38 37 33 36 33 12 32Weight 192 194 191 190 191 191 187 184 191 191 187 191Points 8.2 8.2 8.4 8.1 8.3 8.2 7.9 8.1 8.2 8.2 8.1 8.2Circumf. 4.3 4.3 4.3 4.2 4.3 4.2 4.0 4.0 4.2 4.2 4.1 4.3Length 18.7 19.5 19.3 18.9 19.0 18.8 18.2 18.3 19.0 18.6 18.0 19.1Spread 15.6 16.0 15.9 15.5 15.7 15.2 14.8 14.7 15.6 15.5 14.9 15.7% 4.5+ Yr. 30 32 30 33 28 27 24 24 18 16 4 31Weight 204 205 201 200 199 200 197 199 204 202 197 202Points 8.3 8.4 8.6 8.6 8.5 8.3 8.3 8.3 8.5 8.8 8.4 8.5Circumf. 4.6 4.7 4.5 4.7 4.6 4.6 4.5 4.5 4.6 4.6 4.4 4.6Length 20.2 20.9 20.5 20.5 20.7 20.1 19.8 19.9 21.0 20.8 19.5 20.6Spread 16.4 17.1 16.6 16.6 16.6 15.9 16.2 15.9 17.0 16.6 15.8 16.7% Doe Lactation1.5 Yr. 8 16 16 16 13 11 12 14 20 18 16 142.5 Yr. 41 64 61 59 58 59 60 57 68 70 58 573.5+ Yr. 52 71 71 68 67 68 69 70 76 78 71 66Doe Age Classes% 0.5 Yr. 6 7 10 9 9 8 7 7 8 10 12 8% 1.5 Yr. 27 22 21 20 22 25 21 22 22 20 21 22% 2.5 Yr. 26 26 21 24 27 24 26 26 23 23 27 25% 3.5+ Yr. 41 45 48 48 43 43 46 45 47 47 41 45Doe Weights0.5 Yr. 66 70 70 69 67 72 73 70 70 69 66 681.5 Yr. 106 108 109 105 104 106 107 103 107 107 109 1062.5 Yr. 119 119 119 119 117 120 120 116 117 117 121 1193.5+ Yr. 128 129 127 126 124 127 126 125 124 123 129 127522008-2009 Mississippi <strong>Deer</strong> <strong>Program</strong> <strong>Report</strong>
Table 17. Upper Thick Loess Soil Resource AreaSummary of DMAP DataSeasonAverage‘08 ‘07 ‘06 ‘05 ‘04 ‘03 ‘02 ‘01 ‘00 ‘99 ‘91-’94 ‘04-’08Acres 257,372 265,719 296,625 293,330 254,975 256,886 240,703 240,941 196,733 234,944 210,775 273,604Total <strong>Deer</strong> 5,039 4,486 5,371 4,636 4,172 4,075 3,572 3,739 2,909 3,722 2,732 4,741Bucks 1,718 1,678 1,981 1,794 1,563 1,485 1,398 1,412 1,142 1,509 1,443 1,747Does 3,321 2,808 3,390 2,842 2,609 2,590 2,174 2,327 1,767 2,213 1,457 2,994Acres/<strong>Deer</strong> 51 59 55 63 61 63 67 64 68 63 78 58Bucks 150 158 150 164 163 173 172 171 172 155 146 1573.5+ Bucks 279 287 265 292 287 296 315 347 392 399 1,179 282Does 77 95 88 103 98 99 111 104 111 106 169 91Avg. Age ALL Bucks 2.8 2.8 2.9 2.8 2.8 2.9 2.9 2.8 2.9 3.2 2.4 2.8% 0.5 Yr. Bucks 7 6 6 6 4 5 5 6 6 8 7 5.7Weight 64 66 67 68 69 74 69 70 69 69 72 66.8% 1.5 Yr. 22 21 17 16 15 12 9 11 12 17 53 18Weight 122 115 115 118 114 112 124 120 121 128 132 117Points 2.5 2.3 2.6 2.5 2.6 2.8 4.4 3.5 4.2 4.4 3.9 2.5Circumf. 2.2 2.0 2.0 2.1 2.0 2.2 2.5 2.2 2.6 2.6 2.5 2.1Length 5.8 4.5 5.5 5.7 5.7 5.9 8.4 7.4 8.2 8.8 8.1 5.5Spread 5.8 4.9 5.0 5.5 5.4 5.9 7.4 7.2 7.6 7.7 6.9 5.3% 2.5 Yr. 17 17 19 23 25 23 29 32 38 36 28 20Weight 157 151 155 156 154 154 160 154 156 161 163 155Points 6.9 6.9 7.0 7.0 7.0 7.2 7.4 7.2 7.2 7.3 7.0 6.9Circumf. 3.6 3.5 3.6 3.6 3.5 3.5 3.7 3.5 3.5 3.6 3.5 3.5Length 15.0 14.8 15.1 15.1 14.7 15.0 15.2 14.7 14.8 15.1 14.9 14.9Spread 12.4 12.2 12.4 12.4 12.4 12.6 12.6 12.2 12.2 12.6 12.5 12.4% 3.5 Yr. 29 28 28 33 34 34 34 31 31 28 11 30Weight 175 175 176 178 176 178 176 173 179 186 190 176Points 7.9 7.8 7.9 7.9 7.8 8.0 8.0 7.9 8.2 8.3 8.1 7.9Circumf. 4.1 4.1 4.2 4.3 4.1 4.2 4.1 4.0 4.1 4.3 4.3 4.1Length 17.9 17.9 18.2 18.1 17.9 18.1 17.6 17.4 17.9 18.2 18.6 18.0Spread 14.6 14.6 14.7 14.7 14.4 14.7 14.4 14.2 14.5 14.9 15.3 14.6% 4.5+ Yr. 25 28 29 22 23 26 23 20 13 11 2 26Weight 186 189 190 191 189 192 193 188 193 201 211 189Points 8.3 8.3 8.3 8.5 8.2 8.2 8.3 8.3 8.6 8.8 8.6 8.3Circumf. 4.7 4.6 4.7 4.7 4.6 4.6 4.7 4.5 4.6 4.8 5.0 4.6Length 19.7 20.1 20.1 19.9 19.8 19.9 19.9 19.6 20.3 20.4 21.1 19.9Spread 15.9 15.9 16.0 16.0 15.9 15.8 16.0 15.8 16.1 16.3 17.1 16.0% Doe Lactation1.5 Yr. 13 9 12 13 11 9 13 8 11 13 12 122.5 Yr. 55 56 58 59 57 54 66 61 64 64 60 573.5+ Yr. 67 73 71 73 68 66 70 70 72 77 66 70Doe Age Classes% 0.5 Yr. 7 6 6 7 7 7 7 6 6 10 12 7% 1.5 Yr. 22 23 19 19 20 22 20 21 24 22 23 21% 2.5 Yr. 22 22 21 22 23 20 22 22 22 25 25 22% 3.5+ Yr. 49 50 54 52 50 51 51 51 48 43 41 51Doe Weights0.5 Yr. 62 69 65 65 65 67 65 66 64 66 66 651.5 Yr. 105 101 101 102 100 99 106 102 103 104 107 1022.5 Yr. 115 115 113 115 113 113 115 113 115 117 120 1143.5+ Yr. 122 122 120 122 120 121 122 123 122 125 128 121Soil Resources2008-2009 Mississippi <strong>Deer</strong> <strong>Program</strong> <strong>Report</strong>53
Table 18. Lower Thick Loess Soil Resource AreaSummary of DMAP DataSoil Resources54SeasonAverage‘08 ‘07 ‘06 ‘05 ‘04 ‘03 ‘02 ‘01 ‘00 ‘99 ‘91-’94 ‘04-’08Acres 148,390 146,792 144,025 139,886 146,916 159,976 153,658 148,853 166,906 193,570 233,912 145,202Total <strong>Deer</strong> 2,695 2,730 2,699 2,364 2,608 2,875 2,864 2,731 3,022 3,515 6,077 2,619Bucks 1,033 1,026 1,030 1,054 1,102 1,117 1,218 1,239 1,252 1,407 2,776 1,049Does 1,662 1,704 1,669 1,310 1,506 1,758 1,646 1,492 1,730 2,108 1,457 1,570Acres/<strong>Deer</strong> 55 54 53 59 56 56 54 55 55 55 39 55Bucks 144 143 140 133 133 143 126 120 129 138 84 1383.5+ Bucks 215 239 223 228 206 255 218 244 284 313 417 222Does 89 86 86 107 98 91 93 100 96 92 73 92Avg. Age ALL Bucks 3.2 3.1 3.3 3.2 3.1 3.0 3.0 2.8 3.0 3.2 2.4 3.2% 0.5 Yr. Bucks 3 4 4 6 3 2 3 3 5 7 7 3.7Weight 60 62 61 109 63 64 67 70 66 61 63 71.1% 1.5 Yr. 12 11 9 9 9 10 9 13 14 14 34 10Weight 107 106 113 111 107 112 121 113 111 119 117 109Points 2.7 2.6 2.7 3.1 3.1 3.5 4.4 3.6 3.6 3.8 3.1 2.8Circumf. 2.1 2.1 2.2 2.1 2.2 2.4 2.6 2.4 2.2 2.4 2.2 2.1Length 4.5 4.2 7.0 5.9 6.5 7.3 9.1 7.8 6.0 7.0 6.5 5.6Spread 5.7 5.4 6.6 6.1 6.2 6.8 7.8 7.1 6.3 6.7 6.0 6.0% 2.5 Yr. 17 21 20 19 24 31 28 31 34 35 38 20Weight 144 147 147 148 145 152 149 148 150 149 151 146Points 6.9 7.0 7.0 7.2 6.8 7.2 7.1 7.1 7.1 7.0 6.9 7.0Circumf. 3.5 3.6 3.5 3.5 3.3 3.5 3.5 3.4 3.4 3.5 3.4 3.5Length 14.3 14.7 14.4 14.8 14.0 14.5 14.6 14.1 14.3 14.2 14.3 14.4Spread 11.9 12.2 11.7 12.0 11.8 11.9 11.9 11.2 11.6 11.6 11.8 11.9% 3.5 Yr. 32 31 29 34 35 27 31 30 27 26 16 32Weight 163 164 166 165 165 169 168 164 170 168 169 165Points 7.8 7.8 7.7 7.7 7.8 7.9 8.0 7.7 8.0 7.9 7.9 7.8Circumf. 4.2 4.0 4.3 4.0 3.9 4.0 4.1 4.0 4.0 4.0 4.0 4.1Length 17.1 17.4 17.5 17.2 17.2 17.3 17.1 16.8 17.3 17.2 17.1 17.3Spread 13.9 13.9 14.0 14.0 13.6 13.8 13.7 13.6 14.0 13.7 13.8 13.9% 4.5+ Yr. 36 33 39 32 30 31 29 24 20 18 5 34Weight 175 178 181 181 183 185 184 183 184 186 182 180Points 8.2 8.5 8.4 8.5 8.5 8.5 8.7 8.4 8.6 8.5 8.4 8.4Circumf. 4.4 4.5 4.5 4.5 4.4 4.6 4.7 4.5 4.6 4.5 4.5 4.5Length 18.8 19.6 19.4 19.3 19.3 20.0 19.6 19.2 19.9 19.5 19.5 19.3Spread 14.9 15.3 15.4 15.2 15.3 15.4 15.5 15.4 15.6 15.5 15.4 15.2% Doe Lactation1.5 Yr. 8 9 9 9 7 6 12 9 8 11 9 92.5 Yr. 48 59 55 61 49 59 65 58 62 62 60 553.5+ Yr. 64 73 74 76 65 73 75 74 72 78 72 70Doe Age Classes% 0.5 Yr. 6 6 6 8 7 5 4 4 7 9 10 7% 1.5 Yr. 21 24 21 20 24 26 23 24 24 21 24 22% 2.5 Yr. 21 22 19 21 22 20 20 22 23 19 25 21% 3.5+ Yr. 52 48 54 51 48 50 53 50 48 51 42 51Doe Weights0.5 Yr. 61 63 64 67 61 64 67 66 63 61 60 631.5 Yr. 93 93 98 97 94 96 101 98 96 96 97 952.5 Yr. 108 110 110 110 110 111 110 111 112 110 111 1093.5+ Yr. 114 113 116 118 116 117 116 117 117 116 118 1162008-2009 Mississippi <strong>Deer</strong> <strong>Program</strong> <strong>Report</strong>
Table 19. Upper Thin Loess Soil Resource AreaSummary of DMAP DataSeasonAverage‘08 ‘07 ‘06 ‘05 ‘04 ‘03 ‘02 ‘01 ‘00 ‘99 ‘91-’94 ‘04-’08Acres 118,371 140,064 115,927 99,511 169,948 172,989 182,097 166,790 181,754 187,806 221,531 128,764Total <strong>Deer</strong> 1,961 1,688 1,732 1,382 1,966 1,919 1,921 1,787 2,020 2,459 3,045 1,746Bucks 763 713 659 575 873 836 933 879 999 1,004 1,656 717Does 1,198 975 1,073 807 1,093 1,083 988 908 1,021 1,455 1,457 1,029Acres/<strong>Deer</strong> 60 83 67 72 86 90 95 93 90 76 73 74Bucks 155 196 176 173 195 207 195 190 182 187 134 1793.5+ Bucks 325 411 343 263 435 460 514 417 520 567 1,365 355Does 99 144 108 123 155 160 184 184 178 129 163 125Avg. Age ALL Bucks 2.6 2.7 2.8 2.5 2.5 2.5 2.4 2.6 3.2 3.2 2.4 2.6% 0.5 Yr. Bucks 7 6 5 6 4 4 7 4 4 6 7 5.5Weight 64 66 61 66 62 66 99 66 58 62 63 64.1% 1.5 Yr. 22 21 15 19 15 22 24 16 15 16 52 18Weight 113 107 107 116 115 117 121 117 116 118 112 111Points 3.1 2.6 3.0 3.5 3.8 4.1 4.6 4.1 4.2 4.3 3.2 3.2Circumf. 2.1 1.9 2.2 2.3 2.3 2.4 2.5 2.3 2.5 2.3 2.2 2.2Length 6.6 4.9 6.0 7.3 7.3 8.3 9.2 7.9 8.5 8.3 6.7 6.4Spread 6.3 5.0 6.1 7.0 6.9 7.1 7.7 7.1 7.2 7.1 5.8 6.2% 2.5 Yr. 21 23 25 27 34 27 31 35 47 45 31 26Weight 146 144 141 144 143 147 147 147 142 145 144 144Points 6.6 6.6 7.0 6.5 6.5 6.4 6.7 6.7 6.6 6.8 6.5 6.6Circumf. 3.5 3.4 3.5 3.4 3.3 3.3 3.4 3.4 3.3 3.4 3.3 3.4Length 14.8 14.1 14.3 13.9 13.7 13.9 14.0 14.0 13.8 14.4 13.6 14.1Spread 12.1 11.1 11.6 11.1 11.1 11.4 11.4 11.7 11.3 11.7 11.0 11.4% 3.5 Yr. 30 29 30 33 35 30 24 29 27 26 9 31Weight 166 160 155 158 156 158 159 154 158 166 164 159Points 7.3 7.5 7.4 7.2 7.2 7.3 7.4 7.2 7.8 7.9 7.9 7.3Circumf. 4.1 3.9 3.9 3.8 3.7 3.7 3.9 3.7 4.0 4.1 4.1 3.9Length 16.7 16.2 16.1 15.9 15.7 15.8 16.2 15.5 16.7 17.3 17.3 16.1Spread 13.6 12.9 12.7 13.0 12.7 12.9 13.3 12.5 13.3 14.0 14.0 13.0% 4.5+ Yr. 20 22 25 15 13 17 14 17 8 7 2 19Weight 170 172 168 168 170 172 171 166 171 171 174 170Points 8.3 8.1 8.0 7.8 7.8 7.9 8.1 7.8 8.1 8.4 8.4 8.0Circumf. 4.5 4.4 4.3 4.3 4.3 4.2 4.3 4.2 4.6 4.5 4.5 4.4Length 18.8 18.4 18.0 18.0 18.4 18.0 18.3 17.8 18.7 19.0 19.3 18.3Spread 15.2 14.6 14.5 14.3 14.4 14.3 14.6 14.2 15.0 15.2 15.4 14.6% Doe Lactation1.5 Yr. 15 9 11 23 18 10 18 11 10 13 9 152.5 Yr. 51 57 54 61 54 54 63 52 59 59 54 553.5+ Yr. 65 69 65 61 70 70 71 66 67 70 65 66Doe Age Classes% 0.5 Yr. 9 8 9 8 6 10 11 7 5 11 12 8% 1.5 Yr. 22 23 22 21 23 26 25 25 26 23 24 22% 2.5 Yr. 22 20 17 23 24 19 20 24 26 28 25 21% 3.5+ Yr. 46 49 53 48 48 45 45 44 43 38 39 49Doe Weights0.5 Yr. 59 62 60 62 61 72 74 66 63 63 60 611.5 Yr. 96 92 90 95 92 96 98 96 89 92 93 932.5 Yr. 105 105 103 109 106 104 106 107 102 102 104 1063.5+ Yr. 111 112 110 109 111 112 112 112 109 110 111 111Soil Resources2008-2009 Mississippi <strong>Deer</strong> <strong>Program</strong> <strong>Report</strong>55
Soil Resources56Table 20. Lower Thin Loess Soil Resource AreaSummary of DMAP DataSeasonAverage‘08 ‘07 ‘06 ‘05 ‘04 ‘03 ‘02 ‘01 ‘00 ‘99 ‘91-’94 ‘04-’08Acres 138,086 136,602 103,713 134,023 181,458 174,977 182,708 173,908 223,985 230,662 214,591 138,776Total <strong>Deer</strong> 1,514 1,609 1,552 1,405 2,243 2,515 2,336 2,186 2,776 3,426 3,892 1,665Bucks 536 612 522 531 840 919 925 840 1,043 1,157 1,705 608Does 978 997 1,030 874 1,403 1,596 1,411 1,346 1,733 2,269 1,457 1,056Acres/<strong>Deer</strong> 91 85 67 95 81 70 78 80 81 67 55 83Bucks 258 223 199 252 216 190 198 207 216 199 126 2283.5+ Bucks 486 461 340 303 359 394 380 424 430 391 578 390Does 141 137 101 153 129 110 129 129 130 102 99 131Avg. Age ALL Bucks 2.9 2.9 3.0 3.0 2.9 2.8 2.8 2.8 3.2 3.2 2.4 3.0% 0.5 Yr. Bucks 6 5 5 4 2 2 2 2 4 8 9 4.4Weight 64 66 66 69 69 74 131 71 61 60 62 66.7% 1.5 Yr. 12 14 15 11 10 15 13 12 11 13 39 12Weight 112 107 110 116 109 115 123 121 115 115 110 111Points 2.9 2.6 2.9 3.7 3.0 3.8 4.4 4.0 3.8 4.2 2.8 3.0Circumf. 2.3 1.8 2.1 2.3 1.8 2.4 2.6 2.5 2.2 2.2 2.1 2.0Length 6.2 4.8 5.4 7.6 6.5 7.7 9.0 7.7 7.4 8.0 5.8 6.1Spread 5.7 5.3 5.8 7.0 7.7 7.1 7.7 6.9 6.8 6.8 5.6 6.3% 2.5 Yr. 21 26 19 21 24 28 29 33 35 28 30 22Weight 144 146 150 148 144 149 151 143 144 145 142 147Points 6.6 6.7 7.1 6.6 6.6 6.7 6.7 6.7 6.9 6.8 6.3 6.7Circumf. 3.3 3.3 3.4 3.3 3.2 3.4 3.4 3.3 3.3 3.3 3.3 3.3Length 13.9 14.2 14.7 14.1 13.5 13.8 14.1 13.9 14.1 13.7 13.6 14.1Spread 11.4 11.5 11.6 11.5 11.0 10.9 11.3 10.9 11.3 11.1 10.7 11.4% 3.5 Yr. 32 28 29 38 38 33 31 30 28 27 16 33Weight 165 167 166 164 162 168 167 164 163 163 163 165Points 7.6 7.6 7.3 7.3 7.5 7.6 7.7 7.7 7.5 7.6 7.5 7.4Circumf. 4.0 4.0 4.0 3.9 3.7 4.0 3.9 3.9 3.9 3.8 3.8 3.9Length 17.0 17.2 16.8 16.2 16.3 16.8 17.1 16.5 17.0 16.6 16.7 16.7Spread 13.7 13.6 13.2 12.9 13.3 13.4 13.6 13.3 13.5 13.4 13.3 13.3% 4.5+ Yr. 29 27 33 26 26 23 26 24 22 24 7 28% Doe LactationDoe Age ClassesWeight 177 178 181 177 179 181 182 180 176 177 176 178Points 8.0 8.2 8.1 8.2 8.1 8.3 8.3 8.2 8.2 8.3 8.3 8.1Circumf. 4.4 4.5 4.3 4.5 4.3 4.5 4.5 4.4 4.3 4.5 4.4 4.4Length 19.1 19.8 18.8 18.7 18.7 19.1 19.2 19.4 18.9 18.9 19.2 19.0Spread 15.1 15.3 15.1 14.7 14.8 14.9 14.9 15.1 15.0 14.9 15.0 15.01.5 Yr. 16 13 10 9 11 10 12 14 9 10 11 122.5 Yr. 54 63 66 62 64 61 61 63 60 62 61 623.5+ Yr. 71 75 74 74 72 74 77 74 74 77 75 73% 0.5 Yr. 8 7 7 7 6 4 6 3 7 9 10 7% 1.5 Yr. 21 22 19 21 25 25 25 25 24 22 23 22% 2.5 Yr. 22 23 17 17 19 20 20 23 23 22 24 20% 3.5+ Yr. 49 47 57 55 50 51 50 49 46 47 43 52Doe Weights0.5 Yr. 64 69 65 67 64 64 73 70 61 59 59 661.5 Yr. 98 96 97 99 96 98 101 99 95 95 94 972.5 Yr. 109 110 107 110 107 109 110 108 107 104 107 1093.5+ Yr. 116 116 116 115 115 115 116 116 114 113 115 1152008-2009 Mississippi <strong>Deer</strong> <strong>Program</strong> <strong>Report</strong>
Table 21. Black Prairie Soil Resource AreaSummary of DMAP DataSeasonAverage‘08 ‘07 ‘06 ‘05 ‘04 ‘03 ‘02 ‘01 ‘00 ‘99 ‘91-’94 ‘04-’08Acres 139,874 130,197 144,996 143,406 175,040 164,342 167,715 134,003 142,720 155,976 156,927 146,703Total <strong>Deer</strong> 1,225 1,076 851 907 1,105 1,162 1,261 1,033 1,246 1,328 1,994 1,033Bucks 518 506 361 382 444 518 585 486 540 629 857 442Does 707 570 490 525 661 644 676 547 706 699 1,457 591Acres/<strong>Deer</strong> 114 121 170 158 158 141 133 130 115 117 79 142Bucks 270 257 402 375 394 317 287 276 265 248 186 3313.5+ Bucks 471 428 744 801 858 798 623 486 539 551 913 660Does 198 228 296 273 265 255 248 245 203 223 139 248Avg. Age ALL Bucks 2.9 2.9 2.9 2.9 2.6 2.5 2.5 2.6 3.2 3.2 2.4 2.9% 0.5 Yr. Bucks 5 1 1 3 2 1 2 3 7 4 8 2.6Weight 71 76 64 74 71 58 55 54 62 60 64 71% 1.5 Yr. 9 11 10 9 8 19 19 16 15 17 49 9Weight 119 112 118 123 118 114 116 110 114 116 113 118Points 3.8 3.3 3.7 4.0 4.4 4.7 5.1 4.7 5.1 4.9 3.3 3.8Circumf. 2.5 2.5 2.6 2.7 2.5 2.5 2.7 2.5 2.7 2.6 2.2 2.5Length 8.1 6.7 8.6 8.7 9.7 8.9 9.7 8.5 9.7 9.0 6.9 8.4Spread 7.8 6.6 7.0 8.1 8.1 7.1 7.6 6.7 8.1 7.6 6.3 7.5% 2.5 Yr. 22 23 25 25 40 37 31 33 29 34 23 27Weight 148 146 144 146 148 137 141 129 132 142 143 147Points 7.0 7.0 6.8 6.9 7.0 6.5 6.8 6.5 6.5 6.6 6.1 6.9Circumf. 3.5 3.5 3.5 3.5 3.5 3.5 3.3 3.3 3.2 3.4 3.3 3.5Length 14.6 14.6 14.7 14.6 15.0 13.8 14.0 13.4 13.5 14.0 13.7 14.7Spread 11.9 11.8 12.0 12.0 12.3 11.1 11.0 10.8 10.9 11.3 10.9 12.0% 3.5 Yr. 44 37 39 39 36 28 33 31 28 30 15 39Weight 159 155 158 161 167 158 155 154 154 158 160 160Points 7.8 7.8 7.6 7.5 7.8 7.5 7.5 7.6 7.8 8.0 7.3 7.7Circumf. 3.9 3.8 3.9 4.0 3.9 3.9 3.8 3.8 3.9 3.9 3.7 3.9Length 16.6 16.5 16.3 16.6 17.3 16.7 16.5 16.1 16.6 16.6 16.4 16.6Spread 13.5 13.5 13.1 13.3 14.1 13.0 13.2 13.1 13.1 13.4 13.2 13.5% 4.5+ Yr. 21 28 25 24 15 16 16 17 21 15 6 22Weight 177 165 180 181 181 180 172 170 174 177 173 177Points 8.4 8.6 8.3 8.2 8.1 8.1 8.2 8.5 8.3 8.6 8.0 8.3Circumf. 4.3 4.2 4.4 4.5 4.4 4.6 4.4 4.3 4.5 4.4 4.2 4.4Length 18.8 18.5 18.8 19.0 18.4 18.7 18.8 18.7 18.7 18.5 18.4 18.7Spread 15.1 14.6 14.8 14.9 14.3 14.6 15.1 15.0 14.6 14.8 14.5 14.7% Doe Lactation1.5 Yr. 15 12 17 23 18 11 12 8 12 16 14 172.5 Yr. 50 51 54 65 59 56 65 58 52 58 57 563.5+ Yr. 64 66 73 70 70 63 71 66 66 66 66 69Doe Age Classes% 0.5 Yr. 8 4 3 6 6 3 7 5 8 10 12 6% 1.5 Yr. 21 24 20 26 21 28 20 25 24 23 24 22% 2.5 Yr. 21 23 21 22 32 22 20 20 18 20 19 24% 3.5+ Yr. 50 49 56 46 41 47 54 51 50 47 47 48Doe Weights0.5 Yr. 63 73 64 68 67 58 53 53 55 62 59 671.5 Yr. 99 97 97 96 96 93 96 90 90 95 95 972.5 Yr. 110 107 106 107 106 105 104 100 101 105 105 1073.5+ Yr. 116 115 113 116 113 112 111 110 109 111 113 114Soil Resources2008-2009 Mississippi <strong>Deer</strong> <strong>Program</strong> <strong>Report</strong>57
Soil Resources58Table 22. Upper Coastal Plain Soil Resource AreaSummary of DMAP DataSeasonAverage‘08 ‘07 ‘06 ‘05 ‘04 ‘03 ‘02 ‘01 ‘00 ‘99 ‘91-’94 ‘04-’08Acres 469,389 475,462 472,877 508,673 477,952 541,156 542,090 515,966 557,521 705,830 879,440 480,871Total <strong>Deer</strong> 4,370 3,948 3,992 4,005 3,891 3,760 3,996 3,808 4,786 5,409 8,488 4,041Bucks 1,773 1,728 1,689 1,723 1,660 1,659 1,856 1,905 2,155 2,648 4,677 1,715Does 2,597 2,220 2,303 2,282 2,231 2,101 2,140 1,903 2,631 2,761 1,457 2,327Acres/<strong>Deer</strong> 107 120 118 127 123 144 136 135 116 130 105 119Bucks 265 275 280 295 288 326 292 271 259 267 188 2803.5+ Bucks 630 607 623 686 858 737 707 729 631 762 997 681Does 181 214 205 223 214 258 253 271 212 256 237 207Avg. Age ALL Bucks 2.6 2.7 2.6 2.7 2.4 2.5 2.5 2.5 2.8 3.2 2.4 2.6% 0.5 Yr. Bucks 7 4 3 4 5 2 3 3 4 6 7 4.5Weight 59 64 60 65 65 63 62 59 59 58 58 62.7% 1.5 Yr. 19 18 17 14 16 18 20 16 20 21 51 17Weight 108 107 108 107 109 108 113 112 112 113 108 108Points 3.8 3.5 3.9 3.8 4.1 4.3 4.7 4.6 4.7 4.7 3.2 3.8Circumf. 2.3 2.1 2.3 2.2 2.4 2.4 2.5 2.6 2.5 2.5 2.1 2.3Length 7.6 6.8 8.0 7.6 8.2 8.7 9.2 9.1 9.2 9.3 6.7 7.6Spread 6.9 6.5 6.9 6.8 7.5 7.4 7.5 7.6 7.7 7.5 5.8 6.9% 2.5 Yr. 28 27 30 31 40 33 32 39 35 38 24 31Weight 140 136 137 137 140 137 139 138 137 138 134 138Points 6.8 6.5 6.5 6.5 6.5 6.4 6.9 6.6 6.6 6.7 6.0 6.6Circumf. 3.4 3.3 3.3 3.3 3.3 3.2 3.3 3.3 3.3 3.3 3.2 3.3Length 14.1 13.8 13.8 13.3 13.8 13.4 14.1 13.7 13.7 14.0 13.2 13.7Spread 11.6 11.1 11.1 10.9 11.1 10.8 11.3 11.1 11.1 11.3 10.5 11.1% 3.5 Yr. 26 29 31 31 27 30 28 28 27 25 14 29Weight 151 150 153 151 152 154 152 152 150 156 152 151Points 7.6 7.4 7.3 7.0 7.3 7.1 7.3 7.4 7.5 7.5 7.1 7.3Circumf. 3.9 3.9 3.8 3.7 3.8 3.7 3.7 3.7 3.8 3.9 3.6 3.8Length 16.3 16.2 15.8 15.6 15.8 15.7 15.7 15.9 16.1 16.4 15.6 15.9Spread 13.2 13.0 12.8 12.6 12.6 12.7 12.7 12.7 12.9 13.2 12.7 12.9% 4.5+ Yr. 20 22 19 19 13 16 16 14 14 10 5 19% Doe LactationDoe Age ClassesWeight 164 160 168 164 167 165 165 167 164 171 164 165Points 8.1 8.2 7.9 7.8 8.0 7.9 7.9 8.0 8.1 8.3 7.6 8.0Circumf. 4.3 4.2 4.3 4.1 4.2 4.2 4.2 4.3 4.2 4.3 4.1 4.2Length 18.3 18.1 17.8 17.4 17.8 17.9 18.2 18.4 18.2 18.3 17.7 17.9Spread 14.7 14.4 14.4 14.1 14.5 14.4 14.3 14.4 14.8 14.8 14.1 14.41.5 Yr. 11 11 11 12 13 14 14 11 12 16 13 122.5 Yr. 50 49 53 56 57 51 55 59 57 65 56 533.5+ Yr. 63 68 69 68 67 69 68 71 67 72 65 67% 0.5 Yr. 10 7 7 7 8 5 8 6 8 10 11 8% 1.5 Yr. 21 22 20 22 22 24 23 25 23 24 24 21% 2.5 Yr. 19 21 19 20 25 21 19 24 24 23 20 21% 3.5+ Yr. 50 50 55 51 45 50 50 45 45 43 45 50Doe Weights0.5 Yr. 59 60 59 62 63 63 61 60 58 57 58 611.5 Yr. 88 88 89 89 89 87 90 89 87 89 89 892.5 Yr. 99 98 97 99 100 97 100 100 97 99 99 993.5+ Yr. 105 106 107 107 106 106 105 107 103 104 105 1062008-2009 Mississippi <strong>Deer</strong> <strong>Program</strong> <strong>Report</strong>
Table 23. Lower Coastal Plain Soil Resource AreaSummary of DMAP DataSeasonAverage‘08 ‘07 ‘06 ‘05 ‘04 ‘03 ‘02 ‘01 ‘00 ‘99 ‘91-’94 ‘04-’08Acres 369,675 396,999 332,657 397,543 397,659 402,461 343,592 334,038 202,709 264,521 308,965 378,907Total <strong>Deer</strong> 1,547 1,470 1,376 1,142 1,468 1,500 1,590 1,512 1,506 1,721 2,944 1,401Bucks 773 712 654 541 596 698 838 819 686 812 1,467 655Does 774 758 722 601 872 802 752 693 820 909 1,457 745Acres/<strong>Deer</strong> 239 270 242 348 271 268 216 221 135 154 104 270Bucks 478 558 509 735 667 577 410 408 295 326 210 5783.5+ Bucks 1,097 1,182 1,147 1,636 1,446 2,064 1,108 1,152 672 740 1,098 1,302Does 478 524 461 661 456 502 457 482 247 291 209 508Avg. Age ALL Bucks 2.8 2.8 2.6 2.7 2.6 2.3 2.5 2.4 2.9 3.2 2.4 2.7% 0.5 Yr. Bucks 1 2 2 3 4 3 2 3 3 3 10 2.6Weight 67 60 58 68 71 60 62 61 55 58 56 64.7% 1.5 Yr. 15 11 19 11 16 13 11 12 15 18 47 14Weight 108 104 109 109 104 110 113 111 109 108 102 107Points 3.7 3.2 3.9 4.0 3.7 4.2 4.5 4.6 4.7 4.5 2.7 3.7Circumf. 2.3 2.0 2.4 2.7 2.3 2.4 2.4 2.4 2.3 2.4 1.9 2.3Length 7.5 6.5 8.5 8.9 7.3 8.5 8.9 8.6 8.4 8.5 5.4 7.7Spread 6.7 5.9 7.2 7.5 6.4 7.0 7.2 7.8 7.2 6.9 5.3 6.7% 2.5 Yr. 30 35 29 36 33 56 47 53 38 35 25 33Weight 136 136 132 135 138 136 134 134 132 131 126 135Points 6.6 6.7 6.6 6.8 6.6 6.5 6.7 6.7 6.9 6.4 5.2 6.7Circumf. 3.3 3.2 3.2 3.3 3.3 3.2 3.3 3.2 3.3 3.1 2.8 3.2Length 13.8 13.6 13.6 13.5 13.6 13.6 13.7 13.6 13.6 12.9 11.5 13.6Spread 11.4 11.2 11.0 10.9 11.2 10.9 10.9 10.9 11.2 10.7 9.3 11.1% 3.5 Yr. 32 31 34 31 33 20 27 22 30 28 14 32Weight 147 149 142 148 149 147 142 151 152 145 146 147Points 7.3 7.6 7.6 7.3 7.4 7.2 7.5 7.7 7.5 7.3 7.1 7.4Circumf. 3.7 3.8 3.6 3.7 3.7 3.6 3.6 3.7 3.7 3.5 3.5 3.7Length 15.5 15.6 15.4 15.0 15.5 15.5 15.2 16.2 15.5 15.3 15.0 15.4Spread 12.7 12.7 12.4 12.6 13.0 12.5 12.4 13.0 12.8 12.5 12.1 12.7% 4.5+ Yr. 21 22 16 18 14 9 13 10 14 16 6 18Weight 156 156 157 153 154 156 155 162 158 158 155 155Points 7.9 8.1 8.2 7.9 8.0 8.0 8.2 8.1 8.0 8.2 7.5 8.0Circumf. 4.1 4.1 4.2 4.1 4.1 4.1 4.2 4.2 4.1 4.2 4.0 4.1Length 17.2 17.8 17.8 17.2 17.6 17.7 17.8 18.2 17.7 17.8 17.0 17.5Spread 13.9 14.2 14.4 13.9 14.6 13.9 14.5 14.8 14.5 14.3 13.8 14.2% Doe Lactation1.5 Yr. 10 13 11 15 12 6 19 8 21 17 14 122.5 Yr. 47 54 60 48 52 60 58 61 63 68 58 523.5+ Yr. 64 61 62 68 66 64 66 70 73 70 68 64Doe Age Classes% 0.5 Yr. 5 6 5 4 5 4 3 5 7 6 11 5% 1.5 Yr. 18 19 18 17 19 20 19 20 18 22 23 18% 2.5 Yr. 19 23 23 23 30 38 30 40 25 24 21 24% 3.5+ Yr. 58 53 54 56 46 38 48 35 51 48 45 54Doe Weights0.5 Yr. 56 60 57 62 63 57 55 57 55 57 54 601.5 Yr. 87 89 88 88 88 83 88 86 90 87 86 882.5 Yr. 98 99 99 96 96 96 95 93 95 97 95 983.5+ Yr. 104 103 103 101 102 101 100 99 101 101 100 102Soil Resources2008-2009 Mississippi <strong>Deer</strong> <strong>Program</strong> <strong>Report</strong>59
Table 24. Coastal Flatwoods Soil Resource AreaSummary of DMAP DataSoil Resources60SeasonAverage‘08 ‘07 ‘06 ‘05 ‘04 ‘03 ‘02 ‘01 ‘00 ‘99 ‘91-’94 ‘04-’08Acres 26,283 58,046 49,790 47,790 63,810 55,927 55,650 55,650 55,742 52,850 46,517 49,144Total <strong>Deer</strong> 136 158 110 47 67 148 156 178 161 161 177 104Bucks 54 122 63 23 29 82 89 116 96 93 105 58Does 82 36 47 24 38 66 67 62 65 68 1,457 45Acres/<strong>Deer</strong> 193 367 453 1,017 952 378 357 313 346 328 526 471Bucks 487 476 790 2,078 2,200 682 625 480 579 568 1,332 8333.5+ Bucks 306 691 2,165 2,987 4,908 3,728 2,319 2,140 2,729 1,229 3,445 2,211Does 321 1,612 1,059 1,991 1,679 847 831 898 849 777 3,219 1,064Avg. Age ALL Bucks 2.8 3.0 2.6 3.3 2.5 2.1 2.3 2.2 2.2 2.7 2.0 2.8% 0.5 Yr. Bucks 1 0 2 0 0 3 0 1 1 1 17 0.5Weight 175 0 58 0 0 70 0 48 39 45 36 46.6% 1.5 Yr. 8 15 11 9 10 11 8 6 9 8 31 11Weight 97 101 120 106 94 96 83 106 95 106 96 103Points 2.5 2.6 4.2 2.0 4.5 4.6 4.0 4.1 4.2 3.3 2.5 3.2Circumf. 1.9 2.1 2.4 0.0 2.9 2.3 2.3 2.1 2.3 1.9 1.4 1.8Length 6.3 4.5 7.9 0.0 7.6 9.2 6.9 7.9 8.0 7.4 4.3 5.3Spread 6.7 6.6 7.2 0.0 5.5 7.1 5.6 6.6 6.5 7.6 5.7 5.2% 2.5 Yr. 34 18 46 18 48 68 64 72 68 39 29 33Weight 139 137 143 114 128 130 125 122 126 120 120 132Points 6.3 6.8 7.1 4.8 5.8 5.9 6.2 5.9 6.0 5.8 4.9 6.2Circumf. 2.9 3.5 3.5 2.9 3.3 2.9 2.9 2.9 2.9 2.6 2.4 3.2Length 14.4 13.6 14.3 13.3 12.8 12.1 12.6 12.3 12.3 11.4 10.0 13.7Spread 12.0 11.0 12.6 10.3 11.2 9.7 9.9 9.8 9.8 9.5 7.8 11.4% 3.5 Yr. 34 28 27 32 29 16 19 16 17 35 16 30Weight 148 140 152 146 130 134 132 139 135 136 115 143Points 7.0 7.0 8.0 7.6 7.0 6.5 7.3 7.2 7.0 6.6 5.1 7.3Circumf. 3.5 3.2 4.0 3.9 3.6 3.4 3.5 3.8 3.6 3.2 2.5 3.6Length 15.7 15.1 16.4 16.7 15.5 14.5 15.2 15.6 15.1 13.6 10.7 15.9Spread 12.6 12.0 13.3 13.5 12.3 12.2 13.2 12.3 12.6 10.9 8.9 12.7% 4.5+ Yr. 24 39 15 41 13 3 9 5 6 17 6 26Weight 161 162 145 160 132 141 155 165 154 155 116 152Points 8.0 7.6 7.8 7.9 8.3 6.0 7.9 8.5 7.5 7.5 5.1 7.9Circumf. 4.5 4.1 3.8 4.3 3.9 3.3 4.2 4.1 3.8 3.8 2.8 4.1Length 17.4 16.9 16.3 17.9 16.4 11.9 16.5 18.9 15.8 16.9 11.5 17.0Spread 14.0 14.1 13.2 13.9 12.7 9.1 13.2 14.8 12.4 13.0 9.6 13.6% Doe Lactation1.5 Yr. 15 7 0 0 43 22 7 18 16 0 6 132.5 Yr. 18 38 33 60 33 77 50 50 59 80 65 363.5+ Yr. 50 71 55 56 45 43 65 47 51 56 67 56Doe Age Classes% 0.5 Yr. 3 11 3 14 18 3 8 8 6 5 0 10% 1.5 Yr. 14 34 20 19 21 30 22 22 24 13 10 22% 2.5 Yr. 30 17 10 24 18 38 35 41 38 25 23 20% 3.5+ Yr. 53 38 67 43 44 30 35 30 32 57 67 49Doe Weights0.5 Yr. 70 86 37 44 48 70 68 61 66 57 0 571.5 Yr. 91 87 81 89 81 83 77 84 81 76 41 862.5 Yr. 96 92 78 79 92 92 85 86 88 84 69 873.5+ Yr. 99 94 98 98 92 96 89 90 92 93 90 962008-2009 Mississippi <strong>Deer</strong> <strong>Program</strong> <strong>Report</strong>
Enforcement of <strong>Deer</strong> Hunting-Related Citations2008-2009The Law Enforcement Bureau began monitoring all statewide citations at the district and county levels during the1996–1997 deer season. The eight most common deer hunting citations from October 1–January 31 were extractedfrom the database and summarized. Citation totals by county are shown in Table 27. Yearly trends in various citationsshow some variability.A total of 2,488 citations were written during the 2008–2009 deer hunting season. This is an increase of 112 citationsfrom the previous season. The total number of citationsFigure 29. Total Citationswas at an all time high in 2003–2004. Over the past4 hunting seasons, citations have been significantlylower (Table 26 and Figure 29). The decline incitations can be attributed to a number of occurrences:violations actually decreased, fewer hunters in thewoods, and new or no officers in an area.It is logical to assume that if fewer citations werewritten for a specific violation, then a decreasedincidence of that violation occurred. The total numberof baiting violations was the only group that notablydecreased during the 2008–2009 deer season. This canbe primarily attributed to officer discretion because ofconfusion regarding Public Notice Number W-3796,which took effect during this season. Hopefully,having the parameters for feeding and baiting specifiedwill help officers make stronger cases and deter baitingin future seasons.Many violations are still occurring at dangerously high levels. Failure to wear hunter orange, which decreased slightly thisyear, is a good example. Many hunters still refuse to wear hunter orange. This law is in place to protect hunters. Trespassing alsostill occurs at a high rate, indicating that anyone could be on the land without a hunter’s knowledge. The most common citationin the past deer season was hunting from public roads, which also poses a significant safety threat.The number of licensed hunters continues to decline. This could be another reason for the general decrease in citations.With fewer hunters taking to the field, the number of violations should decrease. However, many hunters are ignoring licenserequirements and taking their chances. This is evident by the increase in citations for no hunting license.With more hunters managing their land for bigger deer, many poachers are trying to take advantage of the results thatmanagers have created. More large-antlered bucks on roadsides equal more temptations. Many would-be hunters are giving inand turning to poaching. This is evidenced by the number of trespassing and headlighting citations written each year.CitationsOur officers are doing a good job across the state, but they need the help of sportsmen. Hunters can assist our officers byreporting wildlife violations by calling 1-800-BE-SMART. Most counties have only 2 officers, but with concerned sportsmen,they have eyes and ears all over the county.Table 26. Statewide Citations Summary by Most Frequent Violations During <strong>Deer</strong> SeasonSeason TotalsHunt FromMotorVehiclePublicRoadNoHunterOrangeResidentNo LicenseNon-ResidentBaiting Trespassing HeadlightingTotalCitations2008-2009 81 748 311 383 130 279 240 316 24882007-2008 33 575 401 356 102 544 207 158 23762006-2007 59 609 363 341 115 554 223 303 25672005-2006 57 528 271 445 68 365 343 179 22562004-2005 104 725 652 391 125 689 283 261 32302003-2004 136 914 700 482 159 724 330 363 38082002-2003 99 867 658 491 184 569 240 282 33902001-2002 120 840 702 491 179 781 275 227 36152000-2001 236 1137 612 505 118 519 297 332 37561999-2000 238 938 415 422 87 449 318 299 31661998-1999 433 1037 409 378 152 356 290 260 33151997-1998 476 1063 403 335 112 313 278 282 3262622008-2009 Mississippi <strong>Deer</strong> <strong>Program</strong> <strong>Report</strong>
Table 27. Citations Summary of Most Frequent ViolationsDuring 2008-2009 <strong>Deer</strong> SeasonCountyHunt fromMotor VehicleHunt fromPublic RoadNo HunterOrangeNo LicenseResidentNo LicenseNon-ResidentBaitingTrespassingHeadlightingTotal CitationsCountyHunt fromMotor VehicleHunt fromPublic RoadNo HunterOrangeNo LicenseResidentNo LicenseNon-ResidentBaitingTrespassingHeadlightingTotal CitationsAdams 0 2 3 5 1 1 1 0 13Alcorn 0 12 3 2 1 1 9 2 30Amite 5 9 6 0 6 6 0 5 37Attala 0 14 3 10 4 27 5 8 71Benton 0 15 5 2 3 4 0 0 29Bolivar 0 2 2 1 2 0 0 0 7Calhoun 0 18 2 5 0 1 0 7 33Carroll 0 1 4 1 0 10 3 3 22Chickasaw 0 16 2 5 0 4 2 2 31Choctaw 0 6 2 4 1 1 0 2 16Claiborne 4 17 5 7 1 0 11 12 57Clarke 0 8 6 5 1 11 2 2 35Clay 0 5 4 6 2 0 1 3 21Coahoma 0 2 3 3 3 0 3 0 14Copiah 0 9 10 11 1 4 1 2 38Covington 0 6 2 1 0 1 1 4 15Desoto 0 4 7 5 2 1 5 1 25Forrest 0 6 4 11 1 3 1 0 26Franklin 1 6 3 4 4 0 3 1 22George 0 19 9 12 5 2 4 7 58Greene 0 6 7 8 1 15 0 0 37Grenada 0 0 0 1 0 1 0 0 2Hancock 2 5 1 3 0 4 2 4 21Harrison 0 10 2 9 0 0 6 0 27Hinds 0 3 5 6 0 1 6 4 25Holmes 0 4 0 7 1 0 0 5 17Humphreys 0 1 5 1 0 7 0 0 14Issaquena 1 0 3 5 2 0 5 1 17Itawamba 0 29 9 14 6 10 12 17 97Jackson 0 16 2 12 2 0 12 6 50Jasper 2 5 12 10 5 16 5 2 57Jeff Davis 3 6 4 1 5 4 3 8 34Jefferson 0 9 2 0 1 2 3 7 24Jones 0 11 5 7 7 11 0 9 50Kemper 0 4 5 6 2 9 1 2 29Lafayette 0 19 2 4 2 4 7 7 45Lamar 0 2 12 2 0 8 4 0 28Lauderdale 0 1 13 6 3 7 4 1 35Lawrence 0 6 0 2 0 0 4 0 12Leake 0 6 1 2 0 1 4 4 18Lee 0 4 4 4 0 0 0 0 12Leflore 0 5 0 1 0 0 3 2 11Lincoln 0 6 0 1 0 0 0 5 12Lowndes 1 3 3 5 0 3 0 1 16Madison 2 9 2 8 0 2 11 2 36Marion 3 11 0 1 0 0 0 12 27Marshall 0 8 8 9 2 9 4 2 42Monroe 0 32 2 16 5 4 8 4 71Montgomery 0 8 0 0 0 2 3 6 19Neshoba 5 3 0 1 0 7 0 7 23Newton 0 6 10 8 1 21 2 4 52Noxubee 0 15 3 0 2 0 4 0 24Oktibbeha 0 2 2 0 0 0 4 0 8Panola 2 22 8 12 3 1 3 15 66Pearl River 39 42 4 2 0 0 2 39 128Perry 0 61 5 11 1 1 0 9 88Pike 0 1 1 0 0 0 0 2 4Pontotoc 0 10 4 3 0 0 7 4 28Prentiss 0 11 1 2 0 1 5 0 20Quitman 0 0 1 0 0 0 0 0 1Rankin 4 6 8 7 1 4 12 5 47Scott 0 7 0 3 1 1 0 0 12Sharkey 0 5 4 8 1 0 2 0 20Simpson 0 8 0 4 0 6 0 7 25Smith 0 14 7 14 1 1 5 8 50Stone 0 9 2 5 0 3 0 0 19Sunflower 0 4 1 2 0 1 0 4 12Tallahatchie 0 0 0 1 0 0 0 0 1Tate 0 15 14 15 3 8 3 7 65Tippah 0 7 1 4 0 3 0 0 15Tishomingo 0 11 2 4 0 0 1 1 19Tunica 2 5 7 0 0 0 5 1 20Union 0 14 0 1 0 0 9 7 31Walthall 0 4 5 3 4 5 1 4 26Warren 0 2 3 6 1 1 0 0 13Washington 1 8 2 0 1 0 0 2 14Wayne 1 18 14 5 18 14 8 6 84Webster 0 13 2 2 0 0 4 4 25Wilkinson 0 2 5 0 7 4 0 0 18Winston 0 9 0 1 2 0 0 3 15Yalobusha 0 5 0 3 0 0 0 0 8Yazoo 3 3 1 5 1 0 4 5 22Citations2008-2009 Mississippi <strong>Deer</strong> <strong>Program</strong> <strong>Report</strong>63
2008-2009 Hunting Incident/Accident Summaryhunting incident/accident is one in which a personA is injured by the discharge of a hunting firearm,bow and arrow, or a fall from a hunting tree stand arisingfrom the activity of hunting.There were 36 total hunting related incident/accidentsinvestigated in Mississippi during the 2008–2009 huntingseason, a substantial increase from last season. Of these,19 were firearm/bow related with 1 fatality and 17 were treestand related with 2 fatalities.The majority of hunting incidents occurred while deerhunting, but there were also incidents reported while dove,duck, goose, hog, rabbit, quail, and squirrel hunting (Figure30).Firearm related accidents increased from last year andtreestand accidents were stable. Hunting accidents declinedfrom 2001 until 2006; however, the total number of accidentsincreased substantially this year to 36 (Figure 31).Sportsmen, Hunter Education Instructors, and ConservationOfficers in Mississippi should be commended for keepinghunting among the safest of sports. Volunteer instructors andConservation Officers certified 10,302 sportsmen in HunterEducation during the 2008–2009 season (Figure 32). Huntingaccidents in Mississippi average about one injury for every13,000 licensed hunters, which is an average of around seveninjuries per 100,000 participants. When compared to othersports such as football, which averages around 3,500 injuriesper 100,000 participants, hunting is a very safe sport.Youths 12–15 years of age must complete a Hunter Educationcourse to hunt unsupervised. Youths 12–15 years of age mayhunt without a Hunter Education certificate if under the directsupervision of a licensed adult 21 years of age or older. Youthsunder 12 years of age must be under adult supervision whilehunting. An apprentice license is available for residents over theage of 15 which do not have the required certificate of huntereducation. This apprentice license may be purchased only onetime by a resident and the apprentice hunting licensee must beaccompanied by a licensed or exempt resident hunter at least21 years of age when hunting. With these hunter educationrequirements, we are confident accident numbers will continueto decline.Figure 30. Hunting Incident by Animal HuntedHunter AccidentsFigure 31. Hunting IncidentsFigure 32. Students Trained by Year642008-2009 Mississippi <strong>Deer</strong> <strong>Program</strong> <strong>Report</strong>
2008-2009 Research Project SummariesEs t i m at i n g An t l e r Si z e f r o m Pi c t u r e s: Co m p u t e r So f t w a r e f o r t h e Hu n t i n g Pu b l i cJeremy Flinn, Steve Demarais, Ken Gee, Bronson Strickland, and Stephen WebbWidespread use of trail cameras has generated immense amounts of buck pictures. Biologists,researchers, and hunters want to estimate antler size using these pictures for educational,management, and entertainment reasons. Mississippi State University, MDWFP, and the NobleFoundation have cooperated to develop a computer program that will estimate antler size fromphotographs. Hunters will be able to access the free program online, upload their photographs, andestimate characteristics such as inside spread, main beam length, and gross score. These characteristicsare becoming increasingly common as antler restrictions and may be difficult to field judge withoutproper training. The program has shown preliminary accuracy within 5% of gross Boone & Crockettscore. Final results will be published soon after this publication becomes available. For access andinformation on the “MSU Antler Scoring Software” visit the deer page on the MSU Extension Service’swebsite at www.msucares.com/wildfish/wildlife/deer.html.Jeremy FlinnResearch ProjectsEf f e c t s o f Ag e a n d Ge n d e r o n Le g Bo n e Gr o w t hEmily Flinn, Bronson Strickland, and Steve DemaraisLeg bones increase in length from a cartilaginous zone near their tip. Growth inthese zones ceases when animals reach sexual maturity. As part of long-termresearch investigating Mississippi’s regional variation in antler and body size, wecompared rates of closure of leg bone growth zones. This project will provide uswith a better understanding of the physiological processes that control body sizeof white-tailed deer. Using x-rays of the leg bones of captive deer, we determinedif growth plates have ossified, signifying that the bones have ceased growth.Ossification varies greatly with age. For example, some growth plates ossify by 6months of age, while others ossify by 3½ years of age. Bones with a later ossificationallow a longer time period for an animal to respond to habitat improvements (i.e.nutrition) and compensate with greater bone growth. Females ceased growth at ayounger age than males. Ossification of the distal radius occurred at 2½ years of agefor females and at 3½ years of age for males. Stopping body growth at a youngerage allows females to put more resources into fawn production.Emily FlinnThis 8 point buck was harvested byBrandon Schwartz on Sunflower WMA.2008-2009 Mississippi <strong>Deer</strong> <strong>Program</strong> <strong>Report</strong>65
Research Projects2008-2009 Research Project SummariesEf f e c t i v e n e s s o f Se l e c t i v e Ha r v e s t i n g f o r In c r e a s i n g An t l e r Si z e in Wh i t e -ta i l e d De e rStephen L. Webb, Steve Demarais, Bronson K. Strickland, Randy W. DeYoung, and Ken L. GeeSelective harvesting in wild deer populations is commonly used to increase antlersize. However, in free-ranging populations, response due to selection is unknownor difficult to quantify because antlers are positively influenced by other managementpractices such as prescribed fire, habitat management, and population control.We used quantitative genetics models to determine how white-tailed deer antlersresponded to selection and what population demographic variables (i.e., populationsize, age structure, and mating ratio) were most influential in improving antler size.We validated our genetics models by comparing our results with a controlled deerbreeding program; modeled antler points and score increased (2.2–4.3 antler points and19.1–38.5 inches, respectively) after 8 years of selection, similar to observed increasesin antler points (3.2) and score (36.3 inches). In modeled free-ranging populations,mating ratio and age structure were more important in influencing antler size thansize of the population. However, response to selection in free-ranging populations waseven after 20 years of selection. These results show that selective harvesting of freerangingwhite-tailed deer is not an efficient way to modify population-level geneticcharacteristics related to antler size. Response in free-ranging deer is lower becauseindividual reproductive success is lower, breeding is done by a large number of bucks, andreproductive and survival rates are lower; all of which reduce the amount of improvementthat can be made to antlers due to selection. Therefore, selective harvesting should bejustified only for controlling population numbers and improving cohort antler size butnot for changing the genetic characteristics of free-ranging populations. Support for thisproject was provided by the Department of Wildlife and Fisheries at Mississippi StateUniversity and the Samuel Roberts Noble Foundation.Stephen L. WebbWh i t e -ta i l e d De e r Bu c k Mo v e m e n t s: Ef f e c t s o f Mo o n Ph a s e a n d Ru tStephen L. Webb, Ken L. Gee, Steve Demarais, Bronson K. Strickland, and Randy W. DeYoungMany hunters get “fired-up” to head into the field in search of a trophy buck during the rut, especially if the moon phase is“right”; whenever “right” may be. We fitted GPS collars on bucks in Oklahoma during the rut to intensively monitor theirmovements relative to the rut and moon phase. Males moved a total of 4.6 miles/day during the rut, compared to 3.9 miles/dayafter the rut, a reduction of almost ¾ of a mile after the breeding season. Previous research at MSU found that deer movementpaths were straighter during the rut. Straighter and longer movement paths may enable bucks to increase encounters withreceptive females during the rut. During the rut, moon phase did not affect buck movement rates. Buck movements appeared tobe primarily related to their search for receptive does. So, the best time to hunt for your trophy buck may be during the rut whenbucks move longer distances regardless of moon phase. Support for this project was provided by the Department of Wildlife andFisheries at Mississippi State University and the Samuel Roberts Noble Foundation.This buck was harvested by Laken Morrowkilled on opening youth weekend November16th on a DMAP property in Panola County.662008-2009 Mississippi <strong>Deer</strong> <strong>Program</strong> <strong>Report</strong>
2008-2009 Research Project SummariesEf f e c t s o f Hu n t e r De n s i t y o n Bu c k Mo v e m e n t sAndy Little, Steve Demarais, Ken Gee, and Stephen WebbHow many times have you wondered what would happen to that young buck you just passed because it didn’t meet yourmanagement criteria? Would he end up being seen and harvested by another hunter? Would having more hunters onyour property cause bucks to become less available for harvest because they would seek heavy cover or become nocturnallyactive? Researchers at Mississippi State University and the Samuel Roberts Noble Foundation are examining these questionson a 5,000 acre property during the 2008 and 2009 two-week rifle hunting seasons in Oklahoma. <strong>Deer</strong> movements will becompared at three hunter densities: 1 hunter per 75 acres, 1 hunter per 250 acres, and no hunters on a sanctuary area.Research ProjectsPreliminary data reveals that during 2008, hunters in the high density area observed 7 collared bucks 20 times whereas5 collared bucks were observed 8 times in the low density area. Despite hunter density being more than double in the highdensity area, hunters observed only 22% of deer in the area compared to a 19% observation rate in the low density area. Averagehourly buck movements were greatest (309 yards/hour) in the high hunter density area compared to the low hunter densityarea (201 yards/hour) while bucks in the sanctuary area moved 283 yards/hour. Final conclusions will be drawn after the 2009hunting season. Financial support for this project is provided by the Samuel Roberts Noble Foundation.Andy Little2008-2009 Mississippi <strong>Deer</strong> <strong>Program</strong> <strong>Report</strong>67
Magnolia Records <strong>Program</strong>By: Rick DillardThe year 2009 marks the 9th year of the Magnolia Records <strong>Program</strong>. Since the beginning, over 5,200 deer have beenscored, with more than 3,300 meeting the minimum requirements (125 inches for typical and 155 inches for nontypical).An analysis of those bucks meeting the minimum requirements indicates that counties in the western region of thestate as well as those in the east-central region have the highest average antler scores (Figure 33). The total number of bucksqualifying for Magnolia Records in each county is depicted in Figure 34.RecordsThe 2008–2009 hunting season was not quite as productive as the previous season with regard to the number of trophybucks harvested. However, some outstanding bucks were still taken. The largest typical buck scored 170 2/8 and was takenby Alton Marler in Adams County. The largest non-typical buck scored 180 and was taken by C.W. Cole in Simpson County.Rick Saucier’s buck from Winston County was the largest taken by muzzleloader and scored 159 1/8 typical. Michael Burkley’s164 3/8 buck from Jefferson County was the largest typical taken by archery. Lastly, the largest non-typical archery buck washarvested by Clifford Welch in Wilkinson County and scored 172 2/8.For many hunters, the true measure of a bonafide trophy is a buck with an inside spread surpassing 20 inches. To date, over580 deer with inside spreads greater than or equal to 20 inches have been entered. The widest deer on record was harvested byRichey Buchanan in Lowndes County in 2007 with an inside spread of 27 inches.Many outstanding bucks, too numerous to list here, are entered in Magnolia Records each year. To view all entries and theirphotos visit www.mdwfp.com and look for Magnolia Records.Figure 33 Figure 34682008-2009 Mississippi <strong>Deer</strong> <strong>Program</strong> <strong>Report</strong>
Pope and Young <strong>Deer</strong> Taken in MississippiTable 28. Top 10 Non-Typical Trophies (Minimum Score 155)Rank Score Status Taken By Season County1** 236 1/8 1 Tracy Laird 2003-04 Adams2 204 1 Denver Eshee 1996-97 Webster3 195 5/8 1 Damon C. Saik 2000-01 Madison4 187 3/8 2 Angus Catchot 2006-07 Washington5 178 3/8 2 Wyn Diggs 2006-07 Holmes6 177 3/8 2 Adam McCurdy 2005-06 Holmes7 173 3/4 1 Jimmy Riley 2000-01 Adams8 172 2/8 2 Clifford Welch 2008-09 Wilkinson9 170 3/8 2 Roger Tankesly 2007-08 Madison10 165 5/8 1 James Goss, Jr. 1987-88 WashingtonRecordsTable 29. Top 10 Typical Trophies (Minimum Score 125)Rank Score Status Taken By Season County1 167 2/8 2 Rob Stockett, III 2007-08 Tallahatchie2 165 6/8 2 Carl Taylor 2004-05 Issaquena3 164 7/8 1 James House 1999-00 Issaquena4 164 3/8 2 Michael Burkley 2008-09 Jefferson5 161 2/8 2 Lance Johnson 2008-09 Bolivar6 160 1/8 1 Odis Hill, Jr. 1989-90 Washington7 159 6/8 1 Steve Nichols 1986-87 Washington8 158 4/8 1 John Harvey 1989-90 Adams9 158 1/8 3 Randy Hooks 2008-09 Copiah10 157 1/8 3 Ryan H. McCarty 2006-07 Clay** OFFICIAL STATE RECORD+ TIES1 - IN BOWHUNTING RECORDS OF NORTH AMERICAN WHITETAIL DEER2 - OFFICIALLY SCORED AND ACCEPTED3 - OFFICIALLY SCORED AND PENDING4 - OFFICIALLY SCORED BUT NOT ENTEREDWilliam North harvested this non-typicalbuck that scored 155 6/8 gross and 146 3/8net on a DMAP property in Holmes County.2008-2009 Mississippi <strong>Deer</strong> <strong>Program</strong> <strong>Report</strong>69
Boone and Crockett <strong>Deer</strong> Taken in MississippiTable 30. Top 25 Non-Typical Trophies (Minimum Score 195)RecordsRank Score Status Taken By Season County1 ** 295 6/8 1 Tony Fulton 1994-95 Winston2 225 1 Richard Herring 1988-89 Lowndes3 221 2/8 1 Milton Parrish 1972-73 Holmes4 220 3/8 1 Dean Jones 1976-77 Oktibbeha5 219 6/8 2 Brian Smith 2006-07 Marshall6 219 2/8 1 Matt Woods 1997-98 Hinds7 217 5/8 1 Mark Hathcock 1977-78 Carroll8 216 5/8 4 (Pick up) Matthew Freeny 1989-99 Winston9 212 5/8 2 Stephen McBrayer 2005-06 Pontotoc10 212 1 Wayne Parker 1999-00 Madison11 210 4 (Pick up) Chip Haynes 2000-01 Madison12 209 6/8 1 Ronnie Strickland 1981-82 Franklin13 207 6/8 2 Shelby Tate 2007-08 Amite14 207 3/8 1 Larry Reece 2001-02 Madison15 205 6/8 1 Joe Shurden 1976-77 Lowndes16 205 5/8 2 Terry Cruse 2007-08 Chickasaw17 205 2/8 2 Jimmy Baker 2007-08 Webster18 205 1 (Pick up) Tommy Yateman 1959 Lowndes19 204 1 Denver Eshee 1996-97 Webster20 202 5/8 1 George Galey 1960’S Carroll21 202 4/8 1 William Westmoreland 2001-02 Pontotoc22 202 3/8 4 Rob Heflin 1998-99 Humphreys23 + 202 1/8 1 Oliver Lindig 1983-84 Oktibbeha23 + 202 1/8 2 Bobby Smith 1992-93 Tate25 201 6/8 1 Jimmy Ashley 1985-86 Wilkinson** OFFICIAL STATE RECORD+ TIES1 - IN RECORDS OF NORTH AMERICAN BIG GAME2 - OFFICIALLY SCORED AND ACCEPTED3 - OFFICIALLY SCORED AND PENDING4 - OFFICIALLY SCORED BUT NOT ENTEREDRickey Stevens harvested thisbuck on Divide Section WMA.702008-2009 Mississippi <strong>Deer</strong> <strong>Program</strong> <strong>Report</strong>
Boone and Crockett <strong>Deer</strong> Taken in MississippiTable 31. Top 25 Typical Trophies (Minimum Score 170)Rank Score Status Taken By Season County1 ** 182 7/8 1 Glen Jourdan 1986-87 Noxubee2 182 2/8 1 R. L. Bobo 1955-56 Claiborne3 181 5/8 1 Ronnie Whitaker 1980-81 Wilkinson4 180 4/8 1 W. F. Smith 1968-69 Leflore5 180 2/8 1 Steve Greer 1995-96 Madison6 179 2/8 1 Marlon Stokes 1988-89 Hinds7 178 5/8 1 Grady Robertson 1951-52 Bolivar8 176 6/8 2 Paul Warrington 2007-08 Bolivar9 176 5/8 1 Sidney Sessions 1952-53 Bolivar10 176 1/8 1 J.D. Hood (Mike Steadman-owner) 1972-73 Monroe11 + 175 2/8 1 Johnnie Leake, Jr. 1977-78 Wilkinson11 + 175 2/8 1 Charlie G. Wilson, II 2001-02 Neshoba13 175 2 Kyle Gordon 2005-06 Madison14 + 174 6/8 1 O. P. Gilbert 1960-61 Coahoma14 + 174 6/8 1 Jeremy Boelte 1997-98 Adams16 + 174 1/8 1 William Ladd 1999-00 Noxubee16 + 174 1/8 4 Unknown (Mike Shell-owner) 1940 Warren16 + 174 1/8 1 Bill Walters 1995-96 Coahoma19 173 5/8 1 Geraline Holliman 1982-83 Lowndes20 173 3/8 1 Richard Powell 1994-95 Coahoma21 173 2/8 4 Allen Hunley 2007-08 Hinds22 173 2 Steve Simmons 2007-08 Tallahatchie23 172 5/8 1 Adrian Stallone 1983-84 Adams24 + 172 1 Barry Barnes 2003-04 Yazoo24 + 172 1 Nan Foster New 1977-78 AdamsRecords** OFFICIAL STATE RECORD+ TIES1 - IN RECORDS OF NORTH AMERICAN BIG GAME2 - OFFICIALLY SCORED AND ACCEPTED3 - OFFICIALLY SCORED AND PENDING4 - OFFICIALLY SCORED BUT NOT ENTEREDThis buck was harvested with a bow and arrow byJerry Caldwell on Yazoo National Wildlife Refuge.The buck scored 172 1/8 gross / 152 6/8 net typical.2008-2009 Mississippi <strong>Deer</strong> <strong>Program</strong> <strong>Report</strong>71
In ConclusionStatusAs in previous reports, data in this report were collected from a wide array of sources. The 2008–2009 season continuedto indicate a diverse statewide deer herd. Unique deer populations continue to exist in all regions of the state.Condition data and field habitat evaluations conducted by biologists continued to document the effects of current andlong-term overpopulation in some areas of the state. Degradation of deer habitat and noticeable substandard conditionindicators such as low reproduction were prevalent. Many locations in the state have experienced on-going damage of nativebrowse by overpopulation of the deer herd since the early 1970s. <strong>Deer</strong> habitat on poorer soils has been damaged at a greaterlevel than habitat on more fertile soils. In addition, habitat damage on lower fertility soils requires a longer recovery time thanhabitats on more fertile soils such as the Mississippi Delta. Reduction of deer populations to levels where habitat can recover isunacceptable to most hunters. The result has been continued over-use of quality browse species by deer.ConclusionDeclines in deer condition and habitat quality have occurred in regions of the state where extensive acreage was convertedfrom agriculture to pine monocultures in the late 1980s. Assorted federal and state incentive programs perpetuated this conditionby providing cost-share opportunities to landowners. The result was increased acreage of densely planted plantations on siteswith a history of agriculture. Incorrect herbicide applications on pine plantations prevented competition and thereby eliminatedbrowse plants. This resulted in decreased body weights and reproduction. Minimal amounts of deer forage were found in thesesites, which allowed only a moderate deer population to cause over-utilization of the browse present. The result was poor herdhealth due to a lack of quality and quantity of native browse plants. However, most of these pine monocultures are at midrotationage (14–20 years old). Timber thinning has begun on some of these sites, resulting in additional browse productionbecause sunlight is finally reaching the forest floor. These thinnings, along with mid-rotation stand improvements (i.e., wildlifefriendly herbicide applications and/or prescribed fire) will drastically improve browse production.For the sixth year, additional buck tags were offered to landowners and hunting clubs which either suffer from extremeoverpopulation and wish to reduce total deer numbers, or to remove lower quality bucks that do not meet their managementobjectives. This tool is effective for the removal of management bucks on above-average habitat. Legislation was passed in 2003allowing the harvest of sub-four point bucks by special permit and was altered to include management bucks in 2005. Landownersor clubs must meet certain requirements, such as cooperating with an approved wildlife biologist and be enrolled in DMAP fora minimum of one year to be eligible for these tags. A written justification from the biologist must be approved by the MDWFP<strong>Deer</strong> Committee before management tags will be issued to a property. The biologist recommendations are used to determine themanagement buck criteria on individual properties.Currently the MDWFP <strong>Deer</strong> Committee consists of a statewide coordinator and four regional deer biologists working withlandowners and hunting clubs across Mississippi. Additionally, the MDWFP <strong>Deer</strong> Committee works hand-in-hand with theMDWFP Wildlife Management Area biologists and other public lands to provide deer management recommendations.RecommendationsStatewide variance in parameters such as breeding dates, condition indices, and changes in habitat quality continue to warrantintelligent site-specific deer management recommendations. Because of the extreme diversity in management needs acrossthe state, landowners can implement these recommendations only if they are provided with a season framework that offersmaximum opportunity or with special permits that allow additional opportunity.A liberal antlerless season framework is mandatory if landowners are to meet management goals. Antlerless opportunityshould be provided to allow landowners in all regions of the state the opportunity to manage deer populations. Decisionmakers will receive an increasing number of negative reports associated with antlerless hunting opportunity, as behavioralchanges in the deer population create changes that make deer less visible to hunters. Continued complaints will arise ashunters incorrectly associate decreasing deer populations to antlerless season opportunity. These complaints will be morefrequent in areas of the state with poor soil quality, previously high deer populations, and/or declining habitat quality.An effective method to monitor statewide harvest on a county basis is needed to take deer management to the next levelin Mississippi. Harvest data, which would include sex, harvest method, and county of harvest would provide informationfrom which detailed analyses of the deer herd could occur. A telephone-based reporting system, which provides this type ofinformation, is currently in use in many states across the Southeast. Harvest data at a county level are instantly availableto wildlife officials in these states. Voluntary implementation of a similar, efficient and cost-effective system, known asTel-Chek, began in 2002, but has been underutilized. A mandatory tagging and reporting system like Tel-Chek wouldprovide biologists with much needed data, and law enforcement officers with a new tool to catch violators.722008-2009 Mississippi <strong>Deer</strong> <strong>Program</strong> <strong>Report</strong>
Current harvest estimates are collected via a statewide mail survey. This mail survey encompasses all huntedspecies in Mississippi. Since the survey includes questions regarding spring turkey harvest, it is not mailed untilafter the turkey season ends. This causes a time-lag in receiving the deer harvest estimates and makes evaluating anyregulation changes extremely difficult. In order to receive more timely deer harvest estimates, a deer-only mail survey isneeded until a mandatory harvest and reporting system is put into place statewide.Evaluation of the Four-Point Law led to a recommendation by the MDWFP <strong>Deer</strong> Committee to eliminate this law.During the 2009 Legislative Session, legislators passed a bill that will allow the harvest of sub-four point bucks statewide.For the 2009–2010 hunting season, the state will be divided into three <strong>Deer</strong> Management Zones, with minimum insidespread or main beam lengthcriteria based on local parameterstaking the place of one statewidepoint based criteria. Additionally,the antlerless bag limit will changefrom 3 antlerless deer with anyweapon and 2 additional antlerlessdeer with archery equipment to 5antlerless deer with any weapon.This will give the hunter moreflexibility to manage the deer herdon their property. For youth hunters15 years-old and younger, one of the3 buck bag limit may be any buckregardless of antler points, spread, ormain beam length.Research funding shouldcontinue. Continued advancement ofthe state <strong>Deer</strong> <strong>Program</strong> hinges on theprofessional association and interactionwith current deer research projects.The MDWFP Wildlife Bureau TechnicalStaff has benefited professionally fromthis relationship with Mississippi StateUniversity for over 20 years. Manyof the advances in management ofMississippi’s deer herd would not haveoccurred without this relationship.The opportunity to find answerswhich address practical managementquestions should continue to receivepriority.ConclusionPhoto Credit: Jason L. PriceExisting data collection procedureson public and private lands mustcontinue if responsible harvestrecommendations for these landsare expected. Extensive data existsfrom which objective evaluationscan be conducted to examinethe effects of changes in habitat,hunting opportunity, and harvestschemes. The annual mail surveywill continue to be a valuable toolto monitor trends in a variety ofimportant categories.Information and education should remain the top priority of the <strong>Deer</strong> <strong>Program</strong> in Mississippi. <strong>Deer</strong> managementneeds are well documented in most regions of the state. Landowner and hunter understanding, acceptance, and supportof sound deer management will continue to determine the success of deer management in Mississippi. <strong>Deer</strong> managementobjectives should be better communicated to the users of this resource. Without landowner and hunter support, success isnot expected. When provided the freedom, sportsmen in Mississippi have proven they can make informed decisions thatbenefit the deer resource if they are provided with the correct management and biological information.2008-2009 Mississippi <strong>Deer</strong> <strong>Program</strong> <strong>Report</strong>73
Notes742008-2009 Mississippi <strong>Deer</strong> <strong>Program</strong> <strong>Report</strong>
Notes2008-2009 Mississippi <strong>Deer</strong> <strong>Program</strong> <strong>Report</strong>75
Notes762008-2009 Mississippi <strong>Deer</strong> <strong>Program</strong> <strong>Report</strong>
The MDWFP is an equal opportunity employer and provider of programs and services. If anyone believes they have beensubjected to discrimination on the basis of political affiliation, race, color, national origin, marital status, sex, religion, creed,age, or disability, they may file a complaint alleging discrimination with either the Mississippi Department of Wildlife,Fisheries and Parks, Office of Administrative Services, P.O. Box 451, Jackson, MS 39205-0451, or the U.S. Equal EmploymentOpportunity Commission, 1801 L. Street, N.W. Washington, D.C. 20507.Mississippi Department of Wildlife, Fisheries, and ParksP.O. Box 451 • Jackson, Mississippi 39205TO:RETURN POSTAGE GUARANTEEDSTANDARD MAILU.S. PostagePAIDJackson, MSPermit 449POSTMASTER: This package may be opened for inspection if necessary.