Bank Ratings Incorporate Expectations For ... - Standard & Poor's
Bank Ratings Incorporate Expectations For ... - Standard & Poor's
Bank Ratings Incorporate Expectations For ... - Standard & Poor's

Create successful ePaper yourself
Turn your PDF publications into a flip-book with our unique Google optimized e-Paper software.
Financial Institutions Research<br />
<strong>Bank</strong> <strong>Ratings</strong> <strong>Incorporate</strong><br />
<strong>Expectations</strong> <strong>For</strong> Improving Capital<br />
Assessments Globally<br />
Primary Credit Analysts:<br />
Elie Heriard Dubreuil, New York (1) 212-438-2949; elie_heriard_dubreuil@standardandpoors.com<br />
Thierry Grunspan, Paris (33) 1-4420-6739; thierry_grunspan@standardandpoors.com<br />
Secondary Contacts:<br />
Mathieu Plait, London (44 ) 207 -176 -7074; mathieu_plait@standardandpoors.com<br />
Simon Outin, Paris 33 1 44 20 7377; simon_outin@standardandpoors.com<br />
Santiago Carniado, Mexico City (52) 55-5081-4413; santiago_carniado@standardandpoors.com<br />
Bernard de Longevialle, Paris (33) 1-4420-7334; bernard_delongevialle@standardandpoors.com<br />
David Harrison, London (44) 20-7176-7064; david_harrison@standardandpoors.com<br />
Ritesh Maheshwari, Singapore (65) 6239-6308; ritesh_maheshwari@standardandpoors.com<br />
Craig Parmelee, CFA, New York (1) 212-438-7850; craig_parmelee@standardandpoors.com<br />
Hans Wright, London (44) 20 7176 7015; hans_wright@standardandpoors.com<br />
Table Of Contents<br />
Our Revised Criteria Clarify The Impact That Capital Has On <strong>Bank</strong><br />
<strong>Ratings</strong><br />
The Risk-Adjusted Capital Ratios Are The Starting Point <strong>For</strong> Our Capital<br />
And Earnings Projections<br />
The RAC Ratios Vary Highly By Region<br />
Our Capital And Earnings Assessments Factor In Global <strong>Bank</strong>s' Expected<br />
Capitalization Improvements<br />
RESEARCH<br />
Estimated RAC Ratios As Of Sept. 30, 2011<br />
Related Research<br />
Appendix: Assumptions<br />
February 29, 2012<br />
www.standardandpoors.com/ratingsdirect 1<br />
948538 | 300076937
<strong>Bank</strong> <strong>Ratings</strong> <strong>Incorporate</strong> <strong>Expectations</strong> <strong>For</strong><br />
Improving Capital Assessments Globally<br />
(Editor's Note: In the original version of this article, the rating on Macquarie Group was misstated in table 2. A<br />
corrected version follows.)<br />
Large banks' capital adequacy generally has improved since the global credit crisis. <strong>Standard</strong> & <strong>Poor's</strong> <strong>Ratings</strong><br />
Services expects this improvement to continue over the next few years based on banks' need to meet the more<br />
stringent Basel III regulatory requirements. (Watch the related CreditMatters TV segment titled, "Why Capital And<br />
Earnings Could Continue To Improve At 100 Of The World’s Largest <strong>Bank</strong>s," dated Feb. 29, 2012.)<br />
In this comparative analysis of large banks' capital, we present the risk-adjusted capital (RAC) ratios for 100 of the<br />
largest banks in the world that we publicly rate, from 29 different countries. This is our third global study of RAC<br />
ratios on the world's leading banks, and the first under our updated criteria, which clarify the impact that capital<br />
has on bank ratings (see "<strong>Bank</strong>s: Rating Methodology And Assumptions," published Nov. 9, 2011). We estimate<br />
the average RAC ratio as of Sept. 30, 2011, was 7.4%, compared with 7% at the end of June 2010 and 6.1% as of<br />
June 30, 2009 (see tables 2 and 3). Excluding the increases in sovereign and banking industry country risks since<br />
June 2010, particularly in Southern Europe, we estimate that the RAC ratios for these 100 banks would have been<br />
about 25 basis points higher.<br />
Our opinion of capital position (which combines our assessments of "capital and earnings" and "risk position") is<br />
currently less of a negative ratings factor than it was a year ago. We base our capital and earnings assessment<br />
primarily on projected RAC ratios, and the risk position assessment on our qualitative assessment of a bank's<br />
unique financial risks and risk management. During the past year, banks have strengthened their capital positions<br />
through increased earnings retention, capital raises, and balance sheet reductions. In addition, we have lowered the<br />
ratings on many of these 100 banks since January 2011.<br />
Overview<br />
• Globally, large banks' RAC ratios have increased since the financial crisis.<br />
• We estimate the average RAC ratio for 100 of the largest banks in the world was 7.4% as of Sept. 30, 2011, compared with 7% at<br />
the end of June 2010 and 6.1% as of June 30, 2009.<br />
• We expect this trend to continue, as we've factored into our forward-looking capital and earnings assessments.<br />
• However, failure to improve capital could result in downgrades, which is one factor in our negative outlooks on 28 of 100 of the<br />
largest banks in the world.<br />
We have negative outlooks on 27 of these 100 banks, which means the likelihood that we would lower our ratings<br />
on these banks is one-in-three. In addition, our ratings on Banco Popular Espanol S.A. are on CreditWatch negative.<br />
One of the reasons for these negative assessments is the risk that capital does not strengthen as much as we expect.<br />
Currently, we expect 25 of these 100 banks, mostly from Europe and the U.S., to increase their RAC ratios such that<br />
their capital and earnings assessments would improve by one category on our six-point scale.<br />
<strong>Standard</strong> & Poors | <strong>Ratings</strong>Direct on the Global Credit Portal | February 29, 2012 2<br />
948538 | 300076937
Our Revised Criteria Clarify The Impact That Capital Has On <strong>Bank</strong> <strong>Ratings</strong><br />
Capital and earnings and risk position are two of the four bank-specific factors that <strong>Standard</strong> & <strong>Poor's</strong> analyzes<br />
when rating banks (see "<strong>Bank</strong>s: Rating Methodology And Assumptions"). We assess both on a six-point scale--very<br />
weak, weak, moderate, adequate, strong, and very strong.<br />
In general, an "adequate" assessment has no impact on the rating. All else being equal, a "moderate" assessment<br />
would result in the rating being one notch lower, a "weak" assessment would lead to the rating being two or three<br />
notches lower, and "very weak," five notches lower. On the other hand, a "strong" assessment would result in the<br />
rating being one notch higher, and a "very strong" assessment, two notches higher. In total, the combined impact of<br />
these two assessments ranges from 10 notches lower to four notches higher.<br />
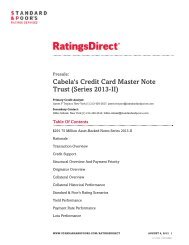
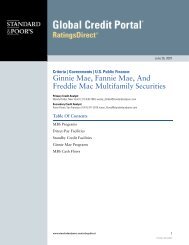
Within this sample of 100 large global institutions, the combined impact of our capital and earnings and risk<br />
position assessments ranges from minus two to positive two notches (see chart 1). <strong>For</strong> example, Regions Financial<br />
Corp. has moderate assessments in both factors, and so our rating on the bank reflects an adjustment of minus two<br />
notches. At the other extreme, Zuercher Kantonalbank has very strong capital and earnings and an adequate risk<br />
position, and so our rating on the bank incorporates an uplift of two notches.<br />
Chart 1<br />
We base our capital and earnings assessment primarily on a bank's projected RAC ratio over one to two years,<br />
provided that the bank exceeds its minimum regulatory capital requirements by at least 100 basis points, as detailed<br />
in our criteria. The RAC ratio is total adjusted capital (TAC) to <strong>Standard</strong> & <strong>Poor's</strong> RAC risk-weighted assets<br />
(RWA). <strong>For</strong> borderline projections, our view of the quality of capital and earnings helps to determine the<br />
assessment.<br />
<strong>Bank</strong> <strong>Ratings</strong> <strong>Incorporate</strong> <strong>Expectations</strong> <strong>For</strong> Improving Capital Assessments Globally<br />
www.standardandpoors.com/ratingsdirect 3<br />
948538 | 300076937
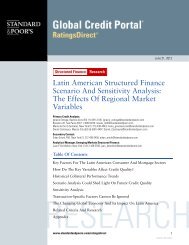
We associate ranges of our projected RAC ratio with different capital and earnings assessments (see chart 2). <strong>For</strong><br />
example, capital and earnings are adequate when the projected RAC ratio is 7%-10%. Consequently, the capital<br />
and earnings assessment provides an indication of how we expect the RAC ratio to develop. If the historical RAC<br />
ratio is much less than 7%, and we view capital and earnings as adequate, one can conclude that we expect the RAC<br />
ratio to strengthen in the future.<br />
<strong>Bank</strong> <strong>Ratings</strong> <strong>Incorporate</strong> <strong>Expectations</strong> <strong>For</strong> Improving Capital Assessments Globally<br />
The more qualitative risk position assessment complements our view of a bank's risks by comparing the<br />
bank-specific risks to the standard risk assumptions that we use to calculate RAC ratios. In other words, a strong or<br />
very strong assessment indicates that our RAC ratio understates a bank's capital position. A moderate or weaker<br />
assessment means our RAC ratio overstates a bank's capital position. Risk concentrations and diversification are an<br />
important factor in the risk position, as is the complexity and changing nature of risks. This section of our analysis<br />
also considers the risks that we don't factor into the RAC ratio, such as potential mark-to-market write-downs on<br />
sovereign exposures, notably to Southern Europe, as well as interest-rate risk in the banking book and funding risk.<br />
(See the RACF criteria, "<strong>Bank</strong> Capital Methodology And Assumptions," published Dec. 6, 2010.)<br />
The Risk-Adjusted Capital Ratios Are The Starting Point <strong>For</strong> Our Capital And<br />
Earnings Projections<br />
The challenge of comparing regulatory capital ratios globally led <strong>Standard</strong> & <strong>Poor's</strong> to develop its risk-adjusted<br />
capital framework (RACF). The main quantitative output of the RACF is the RAC ratio. TAC represents an<br />
enlarged definition of the amount of capital a bank has available to absorb losses. It includes some hybrids subject<br />
to eligibility criteria and limits (see "<strong>Bank</strong> Hybrid Capital Methodology And Assumptions," published Nov. 1,<br />
2011). We derive our RAC RWA from globally consistent risk charges applied to on-balance-sheet and<br />
off-balance-sheet exposures. Our risk charges capture credit, market, insurance, and operational risk losses under a<br />
'A' stress scenario. (<strong>For</strong> detailed examples of <strong>Standard</strong> & <strong>Poor's</strong> stress scenarios, see Appendix IV of "General<br />
Criteria: Understanding <strong>Standard</strong> & <strong>Poor's</strong> Rating Definitions," published June 3, 2009.)<br />
Our capital and earnings assessments for 100 of the largest banks in the world, mostly based on the projected RAC<br />
ratios, correlate highly with the estimated RAC ratios as of September 2011 (see chart 2).<br />
<strong>Standard</strong> & Poors | <strong>Ratings</strong>Direct on the Global Credit Portal | February 29, 2012 4<br />
948538 | 300076937
Chart 2<br />
The RAC Ratios Vary Highly By Region<br />
<strong>Bank</strong> <strong>Ratings</strong> <strong>Incorporate</strong> <strong>Expectations</strong> <strong>For</strong> Improving Capital Assessments Globally<br />
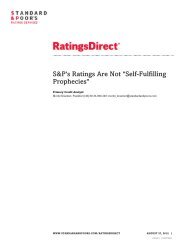
On average, these 100 banks increased their RAC ratios by about 40 basis points during the past five quarters.<br />
However, we note significant regional variations. <strong>Bank</strong>s in Latin America, Germany, Asia (excluding China and<br />
Japan), Australia, the Nordic countries, and the U.S. exhibited stronger regional averages as of Sept. 30, 2011,<br />
whereas banks in the rest of Western Europe, Canada, China, and Japan had generally weaker RAC ratios (see chart<br />
3). Our new hybrid criteria exclude from the TAC calculation most bank hybrid capital instruments that have<br />
coupon step-ups on an optional call date or features equivalent to step-ups. This significantly decreased French and<br />
Canadian banks' TAC, weakening their capital ratios relative to peers'.<br />
www.standardandpoors.com/ratingsdirect 5<br />
948538 | 300076937
Chart 3<br />
We estimated the average RAC ratio for banks in the EU was 6.8% as of Sept. 30, 2011, versus an average of 7.8%<br />
for the rest of the world. This is in line with the results of the quantitative impact study that the Basel Committee on<br />
<strong>Bank</strong>ing Supervision (BCBS) and the European <strong>Bank</strong>ing Authority (EBA) performed at the end of 2010. The studies<br />
found that the average common equity Tier 1 (CET1) ratio for 74 of the largest banks in the world (international<br />
banks with Tier 1 capital of more than €3 billion) was 5.7%, versus 4.9% for banks in the EU, based on end-year<br />
2009 data and on fully phased-in Basel III requirements.<br />
<strong>Bank</strong> <strong>Ratings</strong> <strong>Incorporate</strong> <strong>Expectations</strong> <strong>For</strong> Improving Capital Assessments Globally<br />
<strong>Standard</strong> & Poors | <strong>Ratings</strong>Direct on the Global Credit Portal | February 29, 2012 6<br />
948538 | 300076937
On Dec. 8, 2011, the EBA published a recommendation for European banks to increase their Core Tier 1 ratio to<br />
9% by June 2012, in addition to a buffer to cover mark-to-market losses on sovereign assets. The EBA estimated<br />
this so-called "sovereign buffer" to about €40 billion in December 2011, out of a total shortfall of €115 billion.<br />
This challenging target led many European banks to plan substantial capital raises and a reduction in RWA. On<br />
Feb. 9, 2012, the EBA published a preliminary review of the plans banks submitted to meet this target. The EBA<br />
estimates that the total actions banks planned will lead to a surplus that exceeds the regulators' requirements by<br />
approximately 26%. Direct capital raising (either through retained earnings, conversion of existing hybrids to Core<br />
Tier 1, equity issuance, or issuance of contingent convertible bonds) accounts for about three-quarters of the total<br />
actions, while reductions in RWA (deleveraging and internal model revisions) are responsible for the remainder. (See<br />
"As Europe's <strong>Bank</strong>s Look To Shore Up Capital, Pressure On Hybrid Debt Grows," published Feb. 13, 2012.) The<br />
EBA estimates that internal rating models revisions, which are neutral from a RAC perspective, will represent less<br />
than 10% of the total capital building measures. As a result of the total actions banks plan to take, we believe that<br />
their RAC ratios will strengthen and that the gap between European banks' ratios and non-EU banks' ratios will<br />
narrow.<br />
The EBA and BCBS studies ignore the transition period for Basel III that regulators scheduled to end in 2019, with<br />
some grandfathering of hybrids up to 2023. <strong>For</strong> more details on the Basel Committee study, see "Basel's Global<br />
Quantitative Impact Study Exposes Large <strong>Bank</strong>s’ Regulatory Capital Shortfall," published Dec. 20, 2010.<br />
Our Capital And Earnings Assessments Factor In Global <strong>Bank</strong>s' Expected<br />
Capitalization Improvements<br />
Generally, we expect that banks globally will continue to strengthen their capital ratios in anticipation of the Basel<br />
III capital requirements. We project these banks will continue to retain a significant amount of earnings, reduce<br />
RWA, raise capital, or a combination of the three, and our capital and earnings assessments reflect this. In fact,<br />
almost one-third of the banks that we have assigned adequate assessments have estimated RAC ratios as of Sept. 30,<br />
2011, of 5%-7% (see table 1). This range would correspond with a moderate assessment if the criteria did not factor<br />
in our projections.<br />
Table 1<br />
Distribution By Estimated RAC Ratio Ranges (%)<br />
<strong>Bank</strong> <strong>Ratings</strong> <strong>Incorporate</strong> <strong>Expectations</strong> <strong>For</strong> Improving Capital Assessments Globally<br />
Capital and earnings assessment Less than 5% 5%-7% 7%-10% 10%-15% More than 15%<br />
Weak 100 0 0 0 0<br />
Moderate 12 77 12 0 0<br />
Adequate 0 30 70 0 0<br />
Strong 0 0 36 55 9<br />
Very strong 0 0 0 0 100<br />
Note: Each line splits the banks with a given capital and earnings assessment by their estimated RAC ranges. Estimated RAC ratios as of Sept. 30, 2011.<br />
<strong>For</strong> example, some banks significantly raised capital since the end of September, which is not reflected in our RAC<br />
ratio estimates. Notably, in January 2012, Unicredit completed a €7.5 billion share capital increase, which raises our<br />
RAC ratio by about 105 basis points. We expect Unicredit's RAC ratio to approach 7% in the next 18-24 months,<br />
reflecting strong balance sheet control. In December 2011, National <strong>Bank</strong> of Greece completed the issuance of €1<br />
billion preference shares subscribed by the Greek government and realized about €300 million of capital gains from<br />
www.standardandpoors.com/ratingsdirect 7<br />
948538 | 300076937
the buyback of debt instruments. We estimate that the two measures together would enhance the bank RAC's ratio<br />
by about 65 basis points. In addition, as of Jan. 31, 2012, Zuercher Kantonalbank successfully completed the<br />
issuance of Swiss franc (CHF) 590 million in Tier 1 subordinated debt, which we include in our TAC, and which we<br />
believe would likely enhance the bank's RAC ratio by about 100 basis points.<br />
Another bank that has substantially increased capital since September 2011 is Santander. Based on the bank's<br />
reported figures as of year-end 2011, we believe that its RAC ratio should have improved by at least 50 basis points<br />
in fourth-quarter 2011. The bank took several initiatives in the fourth quarter to comply with the EBA's core capital<br />
requirements in advance of the June 2012 deadline. Some of those, in particular the extension of the scrip dividend<br />
program and a reduction in the amount of goodwill and other intangibles, should have a positive impact on our<br />
year-end 2011 RAC. However, other measures aimed at converting Tier 1 instruments into core capital were neutral<br />
to our RAC because we already gave full credit in our RAC to the hybrids subject to the exchange.<br />
In addition, UBS substantially deleveraged market risk exposures in the fourth quarter of 2011. On a pro forma<br />
basis, we estimate that the RAC ratio was close to or within the 7%-8% range at year-end 2011. <strong>Bank</strong> of America<br />
(BofA) also increased its RAC ratio meaningfully during the fourth quarter as a result of a number of significant<br />
capital actions. We estimate that the RAC ratio should have improved by about 90 basis points. Actions taken<br />
during the quarter included an exchange of preferred and trust preferred securities for common stock and senior<br />
notes. The company also sold its investment in China Construction <strong>Bank</strong> (CCB). Also during the quarter, BofA<br />
reduced its RWA by a reported $75 billion through the sale of noncore assets and other management actions. In<br />
2012, KBC finalized the signed agreements to sell Warta, KBL, and Fidea, which we believe will increase KBC's<br />
RAC ratio by about 50 basis points.<br />
Another example of a bank with a RAC ratio currently lower than its capital and earnings assessment would imply<br />
is VTB <strong>Bank</strong>. VTB's RAC ratio dropped to an estimated 3.8% as of Sept. 30, 2011, from 6.9% at year-end 2010<br />
because of the bank's third-quarter 2011 purchase of <strong>Bank</strong> of Moscow (BOM) under fair value accounting. The<br />
acquisition increased VTB's risk-weighted assets and reduced its tangible equity because of an increase in goodwill.<br />
Just prior to the purchase, the Russian government took the troubled BOM under administration and injected $5<br />
billion, increasing BOM's loss reserves to approximately 50% of loans. VTB <strong>Bank</strong> purchased the BOM loans net of<br />
reserves at 50% of prior book value. We believe that the acquisition at a deep discount limits the risk of further<br />
losses on the BOM portfolio. We did not adjust VTB's pro forma RAC ratio as of Sept. 30, 2011, for this.<br />
On the other hand, a few banks have capital and earnings assessments that are lower than what their estimated<br />
September 2011 RAC ratios would suggest. One of the reasons for this is that our estimates reflect benefits to the<br />
RAC ratio that are temporary and, therefore, not considered in our projections. (<strong>For</strong> example, Banca MPS' RAC<br />
ratio includes Tremonti bonds--hybrid capital subscribed by the Italian government--that we believe should be<br />
reimbursed before year-end 2013.) Another reason is that we believe some of these banks' RAC ratios could<br />
deteriorate based on our expectation for rapid growth.<br />
<strong>Bank</strong> <strong>Ratings</strong> <strong>Incorporate</strong> <strong>Expectations</strong> <strong>For</strong> Improving Capital Assessments Globally<br />
Estimated RAC Ratios As Of Sept. 30, 2011<br />
We made our most recent estimates of RAC ratios at the end of third-quarter 2011, which is Sept. 30 for most<br />
banks (see table 2). Exceptions include Canadian banks, for which it is Oct. 31. The estimated RAC ratios reflect the<br />
sovereign ratings and the banking industry country risk assessments (BICRA), including the economic and industry<br />
risk scores, as of Feb. 28, 2012. The numerator of the estimated RAC ratio is TAC, which <strong>Standard</strong> & <strong>Poor's</strong><br />
<strong>Standard</strong> & Poors | <strong>Ratings</strong>Direct on the Global Credit Portal | February 29, 2012 8<br />
948538 | 300076937
computes under the hybrid criteria. As for the denominator (RAC RWA), whenever comprehensive disclosures were<br />
not available to precisely compute the RAC RWA, we assessed the growth rate (or decline) in regulatory RWA<br />
between the date of calculation with full disclosure (such as December 2010) and Sept. 30, 2011, and applied the<br />
same growth rate (or decline) to our RAC RWA. (See the appendix for details on our assumptions for U.S. banks.)<br />
To make table 2 more comparable, the long-term issuer rating refers to the main operating banks within a particular<br />
group. Holding companies are typically rated one notch lower than operating banks in a group to reflect the<br />
structural subordination of their creditors.<br />
Overall, we observe a strengthening trend in capital for the 100 largest banks globally, and our ratings on about<br />
one-third of these banks reflect our expectation that their RAC ratios will step up a level. Any failure to improve<br />
could result in downgrades.<br />
Table 2<br />
Estimated Capital Ratios <strong>For</strong> 100 Of The Largest <strong>Bank</strong>s<br />
Country Entity name<br />
Australia Australia and New Zealand<br />
<strong>Bank</strong>ing Group Ltd.<br />
Australia Commonwealth <strong>Bank</strong> of<br />
Australia‡<br />
Long-term<br />
issuer<br />
credit<br />
rating Outlook<br />
Estimated RAC<br />
ratio before<br />
diversification<br />
as of Sept. 30,<br />
2011 (%)<br />
Capital and<br />
earnings<br />
assessment<br />
Risk position<br />
assessment<br />
Combined<br />
impact of<br />
capital and<br />
earnings and<br />
risk position<br />
assessments<br />
(number of<br />
notches)<br />
AA- Stable 8.5 Adequate Adequate 0<br />
AA- Stable 7.5 Adequate Adequate 0<br />
Australia Macquarie Group Ltd.¶§ A Stable 8.9 Adequate Moderate (1)<br />
Australia National Australia <strong>Bank</strong> Ltd. AA- Stable 7.8 Adequate Adequate 0<br />
Australia Westpac <strong>Bank</strong>ing Corp. AA- Stable 8.0 Adequate Adequate 0<br />
Austria Erste Group <strong>Bank</strong> AG A Negative 5.7 Moderate Adequate (1)<br />
Austria Raiffeisen <strong>Bank</strong>ing Group<br />
Austria¶†<br />
A Negative 5.1 Moderate Adequate (1)<br />
Belgium KBC Group N.V.¶ A- Stable 4.5 Moderate Adequate (1)<br />
Brazil Banco Bradesco S.A. BBB Stable 5.9 Moderate Adequate (1)<br />
Brazil Banco do Brasil S.A BBB Stable 6.5 Adequate Adequate 0<br />
Brazil Banco Nacional de<br />
Desenvolvimento Economico e<br />
Social<br />
BBB Stable 12.6 Strong Adequate 1<br />
Brazil Banco Santander (Brasil) S.A. BBB Stable 9.7 Adequate Adequate 0<br />
Brazil Itau Unibanco Holding S.A.¶ BBB Stable 5.5 Moderate Adequate (1)<br />
Canada <strong>Bank</strong> of Montreal A+ Stable 6.8 Adequate Adequate 0<br />
Canada Canadian Imperial <strong>Bank</strong> of<br />
Commerce<br />
A+ Stable 7.4 Adequate Adequate 0<br />
Canada Royal <strong>Bank</strong> of Canada AA- Stable 6.7 Moderate Strong 0<br />
Canada The <strong>Bank</strong> of Nova Scotia AA- Stable 6.4 Adequate Strong 1<br />
Canada Toronto-Dominion <strong>Bank</strong> AA- Stable 7.7 Adequate Adequate 0<br />
China <strong>Bank</strong> of China Ltd.* A Stable 6.6 Moderate Moderate (2)<br />
China <strong>Bank</strong> of Communications Co.<br />
Ltd.*<br />
<strong>Bank</strong> <strong>Ratings</strong> <strong>Incorporate</strong> <strong>Expectations</strong> <strong>For</strong> Improving Capital Assessments Globally<br />
A- Stable 6.0 Moderate Adequate (1)<br />
www.standardandpoors.com/ratingsdirect 9<br />
948538 | 300076937
Table 2<br />
Estimated Capital Ratios <strong>For</strong> 100 Of The Largest <strong>Bank</strong>s (cont.)<br />
China China Construction <strong>Bank</strong><br />
Corp.*<br />
China Industrial and Commercial<br />
<strong>Bank</strong> of China Ltd.*<br />
A Stable 7.2 Moderate Moderate (2)<br />
A Stable 6.6 Moderate Adequate (1)<br />
Denmark Danske <strong>Bank</strong> A/S A Negative 6.3 Moderate Adequate (1)<br />
Denmark Nykredit Realkredit A/S A+ Stable 8.3 Adequate Strong 1<br />
Finland OP-Pohjola Group AA- Stable 10.6 Strong Adequate 1<br />
France BNP Paribas AA- Negative 5.6 Moderate Strong 0<br />
France BPCE A Stable 5.9 Moderate Adequate (1)<br />
France Credit Agricole Group A Stable 5.3 Moderate Adequate (1)<br />
France Credit Mutuel Group* A+ Stable 7.1 Adequate Adequate 0<br />
France Societe Generale A Stable 5.8 Moderate Adequate (1)<br />
Germany Commerzbank AG A Negative 7.2 Adequate Moderate (1)<br />
Germany Cooperative <strong>Bank</strong>ing Sector<br />
Germany‡‡<br />
AA- Stable 10.7 Strong Adequate 1<br />
Germany Deutsche <strong>Bank</strong> AG A+ Negative 6.0 Adequate Moderate (1)<br />
Germany S-Finanzgruppe<br />
Hessen-Thueringen†(1)<br />
Greece National <strong>Bank</strong> of Greece S.A.<br />
§§<br />
Hong Kong <strong>Bank</strong> of China (Hong Kong)<br />
Ltd.*<br />
Hong Kong The Hongkong and Shanghai<br />
<strong>Bank</strong>ing Corp. Ltd.*<br />
A Stable 9.3 Strong Adequate 1<br />
CCC Negative 3.0 Weak Weak (2)<br />
A+ Stable 15.8 Strong Moderate 0<br />
AA- Stable 8.0 Adequate Adequate 0<br />
India ICICI <strong>Bank</strong> Ltd. BBB- Stable 9.3 Adequate Adequate 0<br />
India State <strong>Bank</strong> of India§ BBB- Stable 6.2 Moderate Adequate (1)<br />
Italy Banca Monte dei Paschi di<br />
Siena SpA<br />
BBB Negative 6.3 Moderate Adequate (1)<br />
Italy Intesa Sanpaolo SpA BBB+ Negative 6.4 Adequate Strong 1<br />
Italy UniCredit SpA BBB+ Negative 5.7 Adequate Adequate 0<br />
Japan Mitsubishi UFJ Financial<br />
Group Inc.¶<br />
A+ Stable 7.4 Adequate Adequate 0<br />
Japan Mizuho Financial Group Inc.¶ A+ Negative 5.5 Moderate Adequate (1)<br />
Japan Nomura Holdings Inc.¶ A- Stable 7.3 Adequate Moderate (1)<br />
Japan Sumitomo Mitsui Financial<br />
Group Inc.¶<br />
A+ Negative 6.0 Moderate Adequate (1)<br />
Malaysia Malayan <strong>Bank</strong>ing Bhd. A- Stable 6.5 Adequate Adequate 0<br />
Mexico Banco Nacional de Mexico<br />
S.A.<br />
BBB Stable 8.7 Strong Adequate 1<br />
Mexico BBVA Bancomer S.A. BBB Stable 9.6 Strong Adequate 1<br />
Netherlands ABN AMRO <strong>Bank</strong> N.V. A+ Negative 7.6 Adequate Adequate 0<br />
Netherlands Cooperatieve Centrale<br />
Raiffeisen-Boerenleenbank<br />
B.A. (Rabobank Nederland)††<br />
<strong>Bank</strong> <strong>Ratings</strong> <strong>Incorporate</strong> <strong>Expectations</strong> <strong>For</strong> Improving Capital Assessments Globally<br />
AA Negative 7.2 Adequate Strong 1<br />
Netherlands ING <strong>Bank</strong> N.V. A+ Stable 7.7 Adequate Adequate 0<br />
Norway DNB Group¶ A+ Stable 7.6 Adequate Adequate 0<br />
Russia JSC VTB <strong>Bank</strong> (2) BBB Stable 3.8 Moderate Moderate (1)<br />
<strong>Standard</strong> & Poors | <strong>Ratings</strong>Direct on the Global Credit Portal | February 29, 2012 10<br />
948538 | 300076937
Table 2<br />
Estimated Capital Ratios <strong>For</strong> 100 Of The Largest <strong>Bank</strong>s (cont.)<br />
Saudi Arabia The National Commercial <strong>Bank</strong> A+ Stable 10.9 Strong Moderate 0<br />
Singapore DBS <strong>Bank</strong> Ltd. (3) AA- Stable 7.1 Adequate Adequate 0<br />
Singapore Oversea-Chinese <strong>Bank</strong>ing<br />
Corp. Ltd.<br />
AA- Stable 8.2 Adequate Adequate 0<br />
Singapore United Overseas <strong>Bank</strong> Ltd. AA- Stable 8.1 Adequate Adequate 0<br />
South Korea Industrial <strong>Bank</strong> of Korea A Stable 7.0 Adequate Adequate 0<br />
South Korea Kookmin <strong>Bank</strong> A Stable 7.6 Adequate Adequate 0<br />
South Korea Shinhan <strong>Bank</strong> A Stable 7.3 Moderate Adequate (1)<br />
South Korea Woori <strong>Bank</strong> A- Stable 6.6 Moderate Moderate (2)<br />
Spain Banco Bilbao Vizcaya<br />
Argentaria S.A.<br />
Spain Banco Popular Espanol S.A. BBB- Watch<br />
Neg<br />
A Negative 5.9 Adequate Very Strong 2<br />
6.6 Adequate Moderate (1)<br />
Spain Banco Santander S.A. A+ Negative 5.8 Adequate Strong 1<br />
Spain <strong>Bank</strong>ia – BFA Group BBB- Negative 5.3 Moderate Adequate (1)<br />
Spain Caixa <strong>Bank</strong>-Caja de Ahorros y<br />
Pensiones de Barcelona<br />
BBB+ Stable 7.1 Adequate Strong 1<br />
Sweden Nordea <strong>Bank</strong> AB AA- Stable 7.5 Adequate Strong 1<br />
Sweden Skandinaviska Enskilda<br />
<strong>Bank</strong>en AB (publ)<br />
A+ Stable 8.3 Adequate Adequate 0<br />
Sweden Svenska Handelsbanken AA- Stable 7.0 Adequate Strong 1<br />
Sweden Swedbank AB A+ Stable 8.8 Adequate Adequate 0<br />
Switzerland Credit Suisse Group AG¶ A+ Negative 6.2 Adequate Moderate (1)<br />
Switzerland UBS AG A Negative 5.7 Adequate Moderate (1)<br />
Switzerland Zuercher Kantonalbank* AAA Stable 15.2 Very Strong Adequate 2<br />
Turkey Turkiye Garanti <strong>Bank</strong>asi AS BB Positive 7.5 Adequate Adequate 0<br />
U.K. Barclays PLC¶ A+ Stable 7.1 Adequate Adequate 0<br />
U.K. HSBC Holdings PLC¶* AA- Stable 7.5 Adequate Strong 1<br />
U.K. Lloyds <strong>Bank</strong>ing Group PLC¶ A Stable 5.6 Moderate Moderate (2)<br />
U.K. Nationwide Building Society A+ Stable 6.4 Adequate Strong 1<br />
U.K. <strong>Standard</strong> Chartered <strong>Bank</strong>¶* AA- Stable 8.3 Adequate Strong 1<br />
U.K. The Royal <strong>Bank</strong> of Scotland<br />
Group PLC¶**<br />
A Stable 5.8 Adequate Moderate (1)<br />
U.S. <strong>Bank</strong> of America Corp.¶ A Negative 7.2 Adequate Moderate (1)<br />
U.S. <strong>Bank</strong> of New York Mellon<br />
Corp.¶<br />
<strong>Bank</strong> <strong>Ratings</strong> <strong>Incorporate</strong> <strong>Expectations</strong> <strong>For</strong> Improving Capital Assessments Globally<br />
AA- Negative 4.8 Moderate Strong 0<br />
U.S. BB&T Corp.¶ A Stable 8.1 Adequate Strong 1<br />
U.S. Capital One Financial Corp.¶ BBB+ Negative 7.3 Adequate Adequate 0<br />
U.S. Citigroup Inc.¶ A Negative 6.7 Adequate Moderate (1)<br />
U.S. Citizens Financial Group, Inc.¶ A Stable 11.6 Strong Adequate 1<br />
U.S. Comerica Inc.¶ A Stable 9.2 Adequate Strong 1<br />
U.S. Fifth Third Bancorp¶ BBB+ Positive 8.4 Adequate Moderate (1)<br />
U.S. JPMorgan Chase & Co.¶ A+ Stable 6.4 Adequate Adequate 0<br />
U.S. KeyCorp¶ A- Positive 10.3 Strong Adequate 1<br />
U.S. Morgan Stanley¶ A Negative 8.4 Adequate Moderate (1)<br />
www.standardandpoors.com/ratingsdirect 11<br />
948538 | 300076937
Table 2<br />
Estimated Capital Ratios <strong>For</strong> 100 Of The Largest <strong>Bank</strong>s (cont.)<br />
U.S. PNC Financial Services<br />
Group¶<br />
A Stable 8.2 Adequate Strong 1<br />
U.S. Regions Financial Corp.¶ BBB- Stable 7.5 Moderate Moderate (2)<br />
U.S. State Street Corp.¶ AA- Negative 6.3 Adequate Strong 1<br />
U.S. SunTrust <strong>Bank</strong>s Inc.¶ BBB+ Stable 8.1 Adequate Moderate (1)<br />
U.S. The Goldman Sachs Group<br />
Inc.¶<br />
A Negative 7.2 Adequate Moderate (1)<br />
U.S. U.S. Bancorp ¶ A+ Stable 8.2 Adequate Strong 1<br />
U.S. UnionBanCal Corp.¶ A+ Stable 9.6 Strong Strong 2<br />
U.S. Wells Fargo & Co.¶ AA- Negative 7.8 Adequate Strong 1<br />
¶The rating and outlook are those on the main operating company. *Estimated RAC before diversification as of June 2011. §Pro forma RAC before diversification as of<br />
March 2011. †Pro forma RAC before diversification as of December 2010. ‡Pro forma RAC before diversification as of June 2011. **RBS' ratios exclude the effect of the<br />
Asset Protection Scheme. §§NBG successfully completed the issuance of €1 billion in preference shares subscribed by the Greek government, which we believe would<br />
likely enhance the bank’s RAC ratio by about 50 basis points. Additional public funds have also been set apart to recapitalize Greek banks if needed. Nevertheless, we<br />
believe that the magnitude of NBG's exposure to government debt, relative to its capital base, means that a potential government debt restructuring could substantially<br />
impair the bank's capital position. ††Not adjusted for the US$2 billion hybrid issue and sale of its stake in <strong>Bank</strong> Sarasin, both announced in November 2011, and <strong>Standard</strong><br />
& <strong>Poor's</strong> inclusion of the Member Certificates in ACE in December 2011, which together would increase the RAC ratio by 50 basis points-80 basis points. ‡‡We computed<br />
the pro forma RAC ratio (before diversification) as of year-end 2010 by combining public or confidential information provided on regulatory Pillar 3 data of the sectors key<br />
member: Local cooperative banks, DZ <strong>Bank</strong> Group, Deutsche Apotheker- und Aerztebank eG, and WGZ <strong>Bank</strong>. Cross holdings and interbank placements within the group<br />
have been retreated according to our best efforts to compute an estimate for the consolidated entity. (1)We computed our estimated RAC ratio as of end-year 2010 by<br />
combining public or confidential information provided on regulatory Pillar 3 data of the group's key members: Savings banks in the States of Hesse and Thuringia, and<br />
Landesbank Hessen-Thueringen Girozentrale. Cross holdings and interbank placements within the group have been retreated according to our best efforts to compute an<br />
estimate for the consolidated entity. (2)VTB's RAC ratio dropped from 6.9% at year-end 2010 to an estimated 3.8% on Sept. 30, 2011, because of VTB’s third-quarter 2011<br />
purchase of <strong>Bank</strong> of Moscow (BOM) under fair value accounting. VTB purchased the BOM loans net of reserves, at 50% of prior book value. We believe that the<br />
acquisition at a deep discount limits the downside risk for VTB of further losses on the BOM portfolio. We did not adjust VTB's pro forma RAC ratio as of Sept. 30, 2011<br />
for this. (3)<strong>For</strong> the estimated RAC before diversification as of September 2011, the numerator is TAC as of December 2010, because the bank does not disclose interim<br />
financial statements. The growth rate of the holding company's regulatory risk-weighted assets (September 2011 versus December 2010) is incorporated in our estimate<br />
of the denominator.<br />
Related Research<br />
• U.S. <strong>Bank</strong>s: Estimated Basel III Capital Shortfalls Could Limit <strong>Bank</strong> Lending, Dec. 7, 2011<br />
• <strong>Bank</strong>s: Rating Methodology And Assumptions, Nov. 9, 2011<br />
• Most Asia-Pacific <strong>Bank</strong>s Are In Better Shape Than Their Global Peers <strong>For</strong> Basel III, But Some May Need To<br />
Toughen Up Against New Rules, Oct. 20, 2011<br />
• <strong>Standard</strong> & <strong>Poor's</strong> Risk-Adjusted Capital Framework Provides Insight Into Basel III, June 9, 2011<br />
• U.S. Trust <strong>Bank</strong>s' Off-Balance-Sheet Exposures Are Addressed In The Risk-Adjusted Capital Framework, March<br />
4, 2011<br />
• U.S. <strong>Bank</strong>s' Risk-Adjusted Capital Has Improved, But Remains Neutral To Negative <strong>For</strong> <strong>Ratings</strong>, Jan. 18, 2011<br />
• Despite Significant Progress, Capital Is Still A Rating Weakness <strong>For</strong> Large Global <strong>Bank</strong>s, Jan. 18, 2011<br />
• Basel's Global Quantitative Impact Study Exposes Large <strong>Bank</strong>s' Regulatory Capital Shortfall, Dec. 20, 2010<br />
• <strong>Bank</strong> Capital Methodology And Assumptions, Dec. 6, 2010<br />
Appendix: Assumptions<br />
<strong>Bank</strong> <strong>Ratings</strong> <strong>Incorporate</strong> <strong>Expectations</strong> <strong>For</strong> Improving Capital Assessments Globally<br />
Historical risk-adjusted capital ratios<br />
To provide transparency on the figures underlying the roll-out of our criteria in November and December 2011, we<br />
set the sovereign ratings, BICRAs, and economic risk scores as of Nov. 30, 2011, to compute the pro forma RAC<br />
<strong>Standard</strong> & Poors | <strong>Ratings</strong>Direct on the Global Credit Portal | February 29, 2012 12<br />
948538 | 300076937
atios (see table 3). In other words, we used the set of parameters that were in effect when we first published the<br />
ratings under the new bank criteria. Contrary to the set of parameters used for the September 2011 RAC estimates,<br />
this set of parameters does not factor in the eurozone sovereign downgrades that took place in January 2012.<br />
We started by computing pro forma historical RAC ratios based on full disclosure (such as Pillar 3 reports for banks<br />
in Basel II jurisdictions) at the date for which such data are available. This is December 2010 for the majority of<br />
banks. The historical RAC ratios are pro forma in the sense that we adjusted the numerator of the ratio, TAC, in<br />
line with the new hybrid criteria (published in November 2011).<br />
The RACF embeds explicit adjustments for concentration and diversification of credit, market, operational, and<br />
insurance risks. The adjustment aims to capture four components: single-name concentrations in the corporate<br />
portfolio, industry/sector concentration or diversification of the corporate portfolio, geographic concentration or<br />
diversification of credit risk and equity risk-weighted assets, and concentration or diversification of business lines<br />
and risk types. The large banks in this sample benefit, on average, from the concentration and diversification<br />
adjustments. However, the capital and earnings assessment does not incorporate adjustments for diversification,<br />
rather they contribute to our assessment of risk position.<br />
Table 3<br />
Historical RAC Ratios Pro <strong>For</strong>ma <strong>For</strong> New Hybrid Criteria And BICRA Scores<br />
Country Entity name<br />
Australia Australia and New<br />
Zealand <strong>Bank</strong>ing Group<br />
Ltd.<br />
Australia Commonwealth <strong>Bank</strong> of<br />
Australia<br />
Data<br />
as of<br />
date<br />
March<br />
31,<br />
2011<br />
June<br />
30,<br />
2011<br />
Australia Macquarie Group Ltd. March<br />
31,<br />
2011<br />
Australia National Australia <strong>Bank</strong><br />
Ltd.<br />
March<br />
31,<br />
2011<br />
Australia Westpac <strong>Bank</strong>ing Corp. March<br />
31,<br />
2011<br />
Austria Erste Group <strong>Bank</strong> AG Dec.<br />
31,<br />
2010<br />
Austria Raiffeisen <strong>Bank</strong>ing Group<br />
Austria<br />
Dec.<br />
31,<br />
2010<br />
Belgium KBC Group N.V. Dec.<br />
31,<br />
2010<br />
Brazil Banco Bradesco S.A. Dec.<br />
31,<br />
2010<br />
Brazil Banco do Brasil S.A Dec.<br />
31,<br />
2010<br />
<strong>Bank</strong> <strong>Ratings</strong> <strong>Incorporate</strong> <strong>Expectations</strong> <strong>For</strong> Improving Capital Assessments Globally<br />
RAC ratio<br />
before<br />
diversification<br />
(%)<br />
RAC ratio after<br />
diversification<br />
(%) Currency<br />
8.2 9.7 Australian<br />
dollar<br />
7.5 8.5 Australian<br />
dollar<br />
8.9 9.6 Australian<br />
dollar<br />
7.0 8.6 Australian<br />
dollar<br />
7.8 9.0 Australian<br />
dollar<br />
Total<br />
adjusted<br />
capital<br />
RAC RWA<br />
before<br />
diversification<br />
RAC RWA<br />
after<br />
diversification<br />
31,275 383,446 323,202<br />
29,176 391,136 345,003<br />
10,630 119,531 110,183<br />
29,273 416,395 339,073<br />
29,057 370,325 324,059<br />
5.9 6.5 Euro 10,865 183,702 166,682<br />
5.2 5.9 Euro 13,129 254,500 222,435<br />
4.7 5.9 Euro 10,362 218,745 175,188<br />
6.3 7.5 Brazilian<br />
rial<br />
6.5 7.6 Brazilian<br />
rial<br />
45,577 719,751 606,280<br />
42,933 659,600 563,936<br />
www.standardandpoors.com/ratingsdirect 13<br />
948538 | 300076937
Table 3<br />
Historical RAC Ratios Pro <strong>For</strong>ma <strong>For</strong> New Hybrid Criteria And BICRA Scores (cont.)<br />
Brazil Banco Nacional de<br />
Desenvolvimento<br />
Economico e Social<br />
Brazil Banco Santander (Brasil)<br />
S.A.<br />
Dec.<br />
31,<br />
2010<br />
Dec.<br />
31,<br />
2010<br />
Brazil Itau Unibanco Holding S.A. Dec.<br />
31,<br />
2010<br />
Canada <strong>Bank</strong> of Montreal Oct.<br />
31,<br />
2011<br />
Canada Canadian Imperial <strong>Bank</strong> of<br />
Commerce<br />
April<br />
30,<br />
2011<br />
Canada Royal <strong>Bank</strong> of Canada Oct.<br />
31,<br />
2011<br />
Canada The <strong>Bank</strong> of Nova Scotia April<br />
30,<br />
2011<br />
Canada Toronto-Dominion <strong>Bank</strong> April<br />
30,<br />
2011<br />
China <strong>Bank</strong> of China Ltd. Dec.<br />
31,<br />
2010<br />
China <strong>Bank</strong> of Communications<br />
Co. Ltd.<br />
China China Construction <strong>Bank</strong><br />
Corp.<br />
China Industrial and Commercial<br />
<strong>Bank</strong> of China Ltd.<br />
Dec.<br />
31,<br />
2010<br />
Dec.<br />
31,<br />
2010<br />
Dec.<br />
31,<br />
2010<br />
Denmark Danske <strong>Bank</strong> A/S Sept.<br />
30,<br />
2011<br />
Denmark Nykredit Realkredit A/S Dec.<br />
31,<br />
2010<br />
Finland OP-Pohjola Group Dec.<br />
31,<br />
2010<br />
France BNP Paribas Dec.<br />
31,<br />
2010<br />
France BPCE Dec.<br />
31,<br />
2010<br />
France Credit Agricole Group Dec.<br />
31,<br />
2010<br />
<strong>Bank</strong> <strong>Ratings</strong> <strong>Incorporate</strong> <strong>Expectations</strong> <strong>For</strong> Improving Capital Assessments Globally<br />
12.9 12.0 Brazilian<br />
rial<br />
10.9 12.5 Brazilian<br />
rial<br />
5.8 7.1 Brazilian<br />
rial<br />
6.8 8.4 Canada<br />
dollar<br />
7.0 8.3 Canada<br />
dollar<br />
6.7 8.4 Canada<br />
dollar<br />
6.2 7.4 Canada<br />
dollar<br />
7.3 9.1 Canada<br />
dollar<br />
6.7 7.7 Chinese<br />
yuan<br />
renminbi<br />
5.9 6.3 Chinese<br />
yuan<br />
renminbi<br />
6.9 8.0 Chinese<br />
yuan<br />
renminbi<br />
6.5 7.6 Chinese<br />
yuan<br />
renminbi<br />
6.3 7.5 Danisk<br />
krone<br />
7.9 7.3 Danisk<br />
krone<br />
65,899 509,591 547,917<br />
43,344 398,393 346,250<br />
61,513 1,054,770 862,887<br />
20,798 307,012 248,773<br />
13,179 187,449 159,059<br />
33,076 495,541 393,543<br />
22,998 372,959 309,697<br />
25,603 352,549 280,725<br />
627,187 9,411,800 8,191,096<br />
222,271 3,764,956 3,500,360<br />
638,303 9,302,058 7,942,710<br />
740,620 11,346,823 9,759,083<br />
104,402 1,663,286 1,399,834<br />
55,321 699,388 754,080<br />
11.0 11.7 Euro 5,995 54,524 51,346<br />
5.5 7.5 Euro 60,995 1,103,813 816,989<br />
5.5 6.9 Euro 37,677 681,013 549,168<br />
5.1 6.9 Euro 56,105 1,089,621 811,301<br />
<strong>Standard</strong> & Poors | <strong>Ratings</strong>Direct on the Global Credit Portal | February 29, 2012 14<br />
948538 | 300076937
Table 3<br />
Historical RAC Ratios Pro <strong>For</strong>ma <strong>For</strong> New Hybrid Criteria And BICRA Scores (cont.)<br />
France Credit Mutuel Group Dec.<br />
31,<br />
2010<br />
France Societe Generale Dec.<br />
31,<br />
2010<br />
Germany Commerzbank AG Dec.<br />
31,<br />
2010<br />
Germany Cooperative <strong>Bank</strong>ing<br />
Sector Germany §<br />
Dec.<br />
31,<br />
2010<br />
Germany Deutsche <strong>Bank</strong> AG Dec.<br />
31,<br />
2010<br />
Germany S-Finanzgruppe<br />
Hessen-Thueringen †<br />
Greece National <strong>Bank</strong> of Greece<br />
S.A.<br />
Hong Kong <strong>Bank</strong> of China (Hong Kong)<br />
Ltd.<br />
Hong Kong The Hongkong and<br />
Shanghai <strong>Bank</strong>ing Corp.<br />
Ltd.<br />
Dec.<br />
31,<br />
2010<br />
Dec.<br />
31,<br />
2010<br />
Dec.<br />
31,<br />
2010<br />
Dec.<br />
31,<br />
2010<br />
India ICICI <strong>Bank</strong> Ltd. March<br />
31,<br />
2011<br />
India State <strong>Bank</strong> of India March<br />
31,<br />
2011<br />
Italy Banca Monte dei Paschi di<br />
Siena SpA<br />
Dec.<br />
31,<br />
2010<br />
Italy Intesa Sanpaolo SpA Dec.<br />
31,<br />
2010<br />
Italy UniCredit SpA Dec.<br />
31,<br />
2010<br />
Japan Mitsubishi UFJ Financial<br />
Group Inc.<br />
Japan Mizuho Financial Group<br />
Inc.<br />
March<br />
31,<br />
2011<br />
March<br />
31,<br />
2011<br />
Japan Nomura Holdings Inc. March<br />
31,<br />
2011<br />
Japan Sumitomo Mitsui Financial<br />
Group Inc.<br />
<strong>Bank</strong> <strong>Ratings</strong> <strong>Incorporate</strong> <strong>Expectations</strong> <strong>For</strong> Improving Capital Assessments Globally<br />
March<br />
31,<br />
2011<br />
6.9 8.5 Euro 28,228 411,107 332,905<br />
5.3 7.1 Euro 33,823 634,124 474,865<br />
3.5 4.0 Euro 12,554 359,713 314,637<br />
10.7 12.5 Euro 61,069 571,398 489,305<br />
5.2 6.8 Euro 40,089 763,951 592,584<br />
9.3 10.2 Euro 14,505 156,123 142,411<br />
4.0 4.1 Euro 8,819 220,420 214,164<br />
13.7 12.2 Hong Kong<br />
dollar<br />
7.9 8.7 Hong Kong<br />
dollar<br />
9.2 9.6 India<br />
rupees<br />
6.2 6.3 India<br />
rupees<br />
89,338 651,819 729,843<br />
290,081 3,691,263 3,334,938<br />
560,334 6,074,011 5,807,533<br />
849,287 13,653,909 13,405,412<br />
5.4 6.1 Euro 9,214 169,409 150,072<br />
5.6 6.7 Euro 29,031 521,408 433,627<br />
6.1 7.6 Euro 40,006 650,729 529,415<br />
6.3 7.2 Japan yen 8,463,873 135,033,185 117,144,526<br />
5.2 6.0 Japan yen 4,443,619 84,782,029 74,190,352<br />
7.5 8.0 Japan yen 1,961,422 26,235,829 24,515,355<br />
5.7 6.8 Japan yen 5,490,038 96,398,909 80,426,172<br />
www.standardandpoors.com/ratingsdirect 15<br />
948538 | 300076937
Table 3<br />
Historical RAC Ratios Pro <strong>For</strong>ma <strong>For</strong> New Hybrid Criteria And BICRA Scores (cont.)<br />
Malaysia Malayan <strong>Bank</strong>ing Bhd. June<br />
30,<br />
2011<br />
Mexico Banco Nacional de Mexico<br />
S.A.<br />
June<br />
30,<br />
2011<br />
Mexico BBVA Bancomer S.A. June<br />
30,<br />
2011<br />
Netherlands ABN AMRO <strong>Bank</strong> N.V. Dec.<br />
31,<br />
2010<br />
Netherlands Cooperatieve Centrale<br />
Raiffeisen-Boerenleenbank<br />
B.A. (Rabobank Nederland)<br />
Dec.<br />
31,<br />
2010<br />
Netherlands ING <strong>Bank</strong> N.V. Dec.<br />
31,<br />
2010<br />
Norway DNB Group Dec.<br />
31,<br />
2010<br />
Russia JSC VTB <strong>Bank</strong> Sept.<br />
30,<br />
2011<br />
Saudi<br />
Arabia<br />
The National Commercial<br />
<strong>Bank</strong><br />
Dec.<br />
31,<br />
2010<br />
Singapore DBS <strong>Bank</strong> Ltd. Dec.<br />
31,<br />
2010<br />
Singapore Oversea-Chinese <strong>Bank</strong>ing<br />
Corp. Ltd.<br />
Dec.<br />
31,<br />
2010<br />
Singapore United Overseas <strong>Bank</strong> Ltd. Dec.<br />
31,<br />
2010<br />
South Korea Industrial <strong>Bank</strong> of Korea Dec.<br />
31,<br />
2010<br />
South Korea Kookmin <strong>Bank</strong> Dec.<br />
31,<br />
2010<br />
South Korea Shinhan <strong>Bank</strong> Dec.<br />
31,<br />
2010<br />
South Korea Woori <strong>Bank</strong> Dec.<br />
31,<br />
2010<br />
Spain Banco Bilbao Vizcaya<br />
Argentaria S.A.‡<br />
Spain Banco Popular Espanol<br />
S.A.<br />
<strong>Bank</strong> <strong>Ratings</strong> <strong>Incorporate</strong> <strong>Expectations</strong> <strong>For</strong> Improving Capital Assessments Globally<br />
Dec.<br />
31,<br />
2010<br />
Dec.<br />
31,<br />
2010<br />
6.6 6.8 Malaysian<br />
ringgit<br />
9.8 10.0 Mexican<br />
peso<br />
10.0 10.4 Mexican<br />
peso<br />
30,044 453,314 440,078<br />
108,817 1,107,740 1,085,203<br />
99,045 989,730 955,109<br />
7.3 8.3 Euro 13,856 190,114 167,236<br />
7.1 8.6 Euro 28,023 395,253 325,797<br />
7.7 10.0 Euro 37,065 481,095 371,274<br />
7.8 8.7 Norwegian<br />
krone<br />
3.8 4.1 Russian<br />
ruble<br />
96,421 1,236,035 1,109,045<br />
439,600 11,432,958 10,612,743<br />
10.7 10.2 Saudi riyal 28,385 264,960 279,286<br />
8.4 8.1 Singapore<br />
dollar<br />
9.1 9.4 Singapore<br />
dollar<br />
9.0 8.6 Singapore<br />
dollar<br />
6.2 6.0 Korean<br />
won<br />
7.1 7.6 Korean<br />
won<br />
6.4 6.7 Korean<br />
won<br />
5.8 6.0 Korean<br />
won<br />
21,940 262,696 271,752<br />
18,274 200,421 194,732<br />
17,318 193,309 200,619<br />
9,892,352 159,865,471 165,777,226<br />
18,422,865 259,237,538 243,270,381<br />
14,247,776 222,056,846 211,720,595<br />
13,578,028 233,168,223 224,651,004<br />
6.0 7.4 Euro 34,054 572,173 460,596<br />
6.3 6.9 Euro 9,629 153,285 139,028<br />
<strong>Standard</strong> & Poors | <strong>Ratings</strong>Direct on the Global Credit Portal | February 29, 2012 16<br />
948538 | 300076937
Table 3<br />
Historical RAC Ratios Pro <strong>For</strong>ma <strong>For</strong> New Hybrid Criteria And BICRA Scores (cont.)<br />
Spain Banco Santander S.A. Dec.<br />
31,<br />
2010<br />
Spain <strong>Bank</strong>ia – BFA Group Dec.<br />
31,<br />
2010<br />
Spain Caixa <strong>Bank</strong>-Caja de<br />
Ahorros y Pensiones de<br />
Barcelona<br />
Dec.<br />
31,<br />
2010<br />
Sweden Nordea <strong>Bank</strong> AB Dec.<br />
31,<br />
2010<br />
Sweden Skandinaviska Enskilda<br />
<strong>Bank</strong>en AB (publ)<br />
Dec.<br />
31,<br />
2010<br />
Sweden Svenska Handelsbanken Dec.<br />
31,<br />
2010<br />
Sweden Swedbank AB Dec.<br />
31,<br />
2010<br />
Switzerland Credit Suisse Group AG Dec.<br />
31,<br />
2010<br />
Switzerland UBS AG June<br />
30,<br />
2011<br />
Switzerland Zuercher Kantonalbank Dec.<br />
31,<br />
2010<br />
Turkey Turkiye Garanti <strong>Bank</strong>asi<br />
AS<br />
Dec.<br />
31,<br />
2010<br />
U.K. Barclays PLC Dec.<br />
31,<br />
2010<br />
U.K. HSBC Holdings PLC Dec.<br />
31,<br />
2010<br />
U.K. Lloyds <strong>Bank</strong>ing Group PLC June<br />
30,<br />
2011<br />
U.K. Nationwide Building<br />
Society<br />
April<br />
30,<br />
2011<br />
U.K. <strong>Standard</strong> Chartered <strong>Bank</strong> Dec.<br />
31,<br />
2010<br />
U.K. The Royal <strong>Bank</strong> of<br />
Scotland Group PLC*<br />
Dec.<br />
31,<br />
2010<br />
U.S. <strong>Bank</strong> of America Corp. Sept.<br />
30,<br />
2011<br />
<strong>Bank</strong> <strong>Ratings</strong> <strong>Incorporate</strong> <strong>Expectations</strong> <strong>For</strong> Improving Capital Assessments Globally<br />
5.8 8.0 Euro 53,354 924,758 664,277<br />
4.0 4.3 Euro 13,099 328,003 303,591<br />
5.5 5.9 Euro 19,565 352,962 333,782<br />
7.0 8.6 Euro 19,833 283,479 231,547<br />
7.5 8.1 Sweden<br />
krona<br />
6.7 7.3 Sweden<br />
krona<br />
8.5 8.7 Sweden<br />
krona<br />
5.4 6.4 Swiss<br />
franc<br />
5.7 6.8 Swiss<br />
franc<br />
15.9 15.2 Swiss<br />
franc<br />
8.8 8.3 Turkish<br />
Lira<br />
6.8 8.2 British<br />
pound<br />
sterling<br />
82,237 1,093,935 1,016,689<br />
79,247 1,174,625 1,086,476<br />
73,888 867,424 846,869<br />
21,656 403,911 336,885<br />
27,671 486,976 409,401<br />
7,788 48,834 51,369<br />
15,494 176,057 186,673<br />
49,008 724,844 598,696<br />
7.6 10.4 U.S. dollar 132,724 1,750,930 1,280,335<br />
5.3 6.5 British<br />
pound<br />
sterling<br />
6.7 6.5 British<br />
pound<br />
sterling<br />
35,950 684,003 551,971<br />
6,060 90,663 92,841<br />
8.2 10.5 U.S. dollar 31,021 380,198 295,625<br />
5.4 6.6 British<br />
pound<br />
sterling<br />
60,027 1,113,477 903,841<br />
7.2 9.2 U.S. dollar 147,101 2,046,574 1,605,188<br />
www.standardandpoors.com/ratingsdirect 17<br />
948538 | 300076937
Table 3<br />
Historical RAC Ratios Pro <strong>For</strong>ma <strong>For</strong> New Hybrid Criteria And BICRA Scores (cont.)<br />
U.S. <strong>Bank</strong> of New York Mellon<br />
Corp.<br />
Sept.<br />
30,<br />
2011<br />
U.S. BB&T Corp. Sept.<br />
30,<br />
2011<br />
U.S. Capital One Financial Corp. Sept.<br />
30,<br />
2011<br />
U.S. Citigroup Inc. Sept.<br />
30,<br />
2011<br />
U.S. Citizens Financial Group,<br />
Inc.<br />
Sept.<br />
30,<br />
2011<br />
U.S. Comerica Inc. Sept.<br />
30,<br />
2011<br />
U.S. Fifth Third Bancorp Sept.<br />
30,<br />
2011<br />
U.S. JPMorgan Chase & Co. Sept.<br />
30,<br />
2011<br />
U.S. KeyCorp Sept.<br />
30,<br />
2011<br />
U.S. Morgan Stanley Sept.<br />
30,<br />
2011<br />
U.S. PNC Financial Services<br />
Group<br />
Sept.<br />
30,<br />
2011<br />
U.S. Regions Financial Corp. Sept.<br />
30,<br />
2011<br />
U.S. State Street Corp. Sept.<br />
30,<br />
2011<br />
U.S. SunTrust <strong>Bank</strong>s Inc. Sept.<br />
30,<br />
2011<br />
U.S. The Goldman Sachs Group<br />
Inc.<br />
Sept.<br />
30,<br />
2011<br />
U.S. U.S. Bancorp Sept.<br />
30,<br />
2011<br />
U.S. UnionBanCal Corp. Sept.<br />
30,<br />
2011<br />
U.S. Wells Fargo & Co. Sept.<br />
30,<br />
2011<br />
<strong>Bank</strong> <strong>Ratings</strong> <strong>Incorporate</strong> <strong>Expectations</strong> <strong>For</strong> Improving Capital Assessments Globally<br />
4.8 5.8 U.S. dollar 14,240 297,089 245,163<br />
8.1 8.3 U.S. dollar 14,190 175,020 171,176<br />
7.3 8.2 U.S. dollar 18,168 247,377 220,245<br />
6.7 8.3 U.S. dollar 125,873 1,891,330 1,513,764<br />
11.6 12.3 U.S. dollar 13,476 116,130 109,659<br />
9.2 8.1 U.S. dollar 6,129 66,437 76,050<br />
8.4 8.4 U.S. dollar 11,706 138,851 138,564<br />
6.4 8.2 U.S. dollar 146,646 2,299,875 1,794,526<br />
10.3 10.8 U.S. dollar 9,689 94,032 90,124<br />
8.4 9.2 U.S. dollar 57,616 687,274 627,283<br />
8.2 8.9 U.S. dollar 31,046 378,193 347,572<br />
7.5 8.1 U.S. dollar 8,523 112,898 105,512<br />
6.3 7.4 U.S. dollar 12,623 199,972 169,797<br />
8.1 8.2 U.S. dollar 13,554 167,290 165,192<br />
7.2 7.8 U.S. dollar 69,171 967,184 884,611<br />
8.2 10.2 U.S. dollar 27,489 333,815 270,188<br />
9.6 9.5 U.S. dollar 8,467 88,257 88,775<br />
7.8 9.9 U.S. dollar 112,455 1,440,588 1,134,486<br />
<strong>Standard</strong> & Poors | <strong>Ratings</strong>Direct on the Global Credit Portal | February 29, 2012 18<br />
948538 | 300076937
Table 3<br />
Historical RAC Ratios Pro <strong>For</strong>ma <strong>For</strong> New Hybrid Criteria And BICRA Scores (cont.)<br />
Note: All figures are pro forma for the new BICRA and hybrid capital criteria published in November 2011. BICRAs, economic risk scores, and sovereign ratings are as of<br />
Nov. 30, 2011. *RBS' ratios exclude the effect of the Asset Protection Scheme. §We computed our estimated RAC ratio as of year-end 2010 by combining public or<br />
confidential information provided on regulatory Pillar 3 data of the sector's key members: Local cooperative banks, DZ <strong>Bank</strong> Group, Deutsche Apotheker- und Aerztebank<br />
eG, and WGZ <strong>Bank</strong>. Cross holdings and interbank placements within the group have been retreated according to our best efforts to compute an estimate for the<br />
consolidated entity. †We computed our estimated RAC ratio as of end-year 2010 by combining public or confidential information provided on regulatory Pillar 3 data of the<br />
group's key members: Savings banks in the States of Hesse and Thuringia and Landesbank Hessen-Thueringen Girozentrale. Cross holdings and interbank placements<br />
within the group have been retreated according to our best efforts to compute an estimate for the consolidated entity. ‡BBVA pro forma RAC ratio at year-end 2010<br />
includes the consolidation of stake in Turkish bank Garanti.<br />
Risk-weighted assets assumptions for U.S. bank holding companies<br />
To help preserve consistency, comparability, and transparency of our published RWA, we've made the following<br />
assumptions, most of which we've based on publicly and consistently available information for the purpose of<br />
assisting reproducibility of this study. The assumptions are nearly identical to the ones we published in "U.S. <strong>Bank</strong>s'<br />
Risk-Adjusted Capital Has Improved, But Remains Neutral To Negative <strong>For</strong> <strong>Ratings</strong>" on Jan. 18, 2011. We also<br />
took into account confidential information, mainly regarding financial collateral and securitization exposures.<br />
• The exposure data mostly derive from the FR Y-9C disclosures, using our criteria (see appendix A of "<strong>Bank</strong><br />
Capital Methodology And Assumptions," published Dec. 6, 2010).<br />
• We also took into account assets under management and assets under custody from the 10-Q reports.<br />
• When adjusting for tax-loss carry forwards in the numerator of the ACE-to-RWA ratio, we used the U.S.<br />
regulators' disallowed portion of the deferred tax assets number disclosed in schedule HC-R.<br />
• We did not make explicit adjustments for guarantees obtained.<br />
• We used the region "world excluding U.S." to represent U.S. banks' foreign-exposure classes identified in the FR<br />
Y-9C. We assumed other exposures were in the U.S. As of September 2010, this translated into a rating of 'A+'<br />
for foreign sovereign exposures, a BICRA of '4' for foreign financial institutions exposures, and an economic risk<br />
score of '3' for foreign corporate exposures. We assumed all retail exposures were domestic. We assign average<br />
GDP-weighted BICRAs, economic risk scores, and long-term foreign-currency sovereign credit ratings to groups<br />
of countries and regions.<br />
• Equity exposures were split between public and private using FR Y-9C schedules HC-B 7d for public equities and<br />
HC-F4 for private equity. We assumed all equity exposures had risk consistent with the equity market group 1 (to<br />
which the U.S. belongs).<br />
• We did not use any explicit adjustment for latent gains.<br />
• We assumed that banks use the internal-model approach (value at risk) to measure all of the general risk in the<br />
trading book and use the standardized approach to measure specific risk.<br />
• We included information of financial collateral that trust banks provided, recognizing a mitigation of the credit<br />
risk, especially for securities-lending portfolios. We applied haircuts (i.e., value reductions) to the financial<br />
collateral according to table 11 (below paragraph 76) of our criteria published on Dec. 6, 2011.<br />
• We based securitization exposures risk weights on detailed breakdowns of exposures per rating, or on our default<br />
values disclosed in paragraph 70.<br />
<strong>Bank</strong> <strong>Ratings</strong> <strong>Incorporate</strong> <strong>Expectations</strong> <strong>For</strong> Improving Capital Assessments Globally<br />
www.standardandpoors.com/ratingsdirect 19<br />
948538 | 300076937
Copyright © 2012 by <strong>Standard</strong> & <strong>Poor's</strong> Financial Services LLC. All rights reserved.<br />
No content (including ratings, credit-related analyses and data, model, software or other application or output therefrom) or any part thereof (Content) may be modified,<br />
reverse engineered, reproduced or distributed in any form by any means, or stored in a database or retrieval system, without the prior written permission of <strong>Standard</strong> & <strong>Poor's</strong><br />
Financial Services LLC or its affiliates (collectively, S&P). The Content shall not be used for any unlawful or unauthorized purposes. S&P and any third-party providers, as well<br />
as their directors, officers, shareholders, employees or agents (collectively S&P Parties) do not guarantee the accuracy, completeness, timeliness or availability of the<br />
Content. S&P Parties are not responsible for any errors or omissions (negligent or otherwise), regardless of the cause, for the results obtained from the use of the Content, or<br />
for the security or maintenance of any data input by the user. The Content is provided on an "as is" basis. S&P PARTIES DISCLAIM ANY AND ALL EXPRESS OR IMPLIED<br />
WARRANTIES, INCLUDING, BUT NOT LIMITED TO, ANY WARRANTIES OF MERCHANTABILITY OR FITNESS FOR A PARTICULAR PURPOSE OR USE, FREEDOM FROM BUGS,<br />
SOFTWARE ERRORS OR DEFECTS, THAT THE CONTENT'S FUNCTIONING WILL BE UNINTERRUPTED, OR THAT THE CONTENT WILL OPERATE WITH ANY SOFTWARE OR<br />
HARDWARE CONFIGURATION. In no event shall S&P Parties be liable to any party for any direct, indirect, incidental, exemplary, compensatory, punitive, special or<br />
consequential damages, costs, expenses, legal fees, or losses (including, without limitation, lost income or lost profits and opportunity costs or losses caused by negligence)<br />
in connection with any use of the Content even if advised of the possibility of such damages.<br />
Credit-related and other analyses, including ratings, and statements in the Content are statements of opinion as of the date they are expressed and not statements of fact.<br />
S&P's opinions, analyses, and rating acknowledgment decisions (described below) are not recommendations to purchase, hold, or sell any securities or to make any<br />
investment decisions, and do not address the suitability of any security. S&P assumes no obligation to update the Content following publication in any form or format. The<br />
Content should not be relied on and is not a substitute for the skill, judgment and experience of the user, its management, employees, advisors and/or clients when making<br />
investment and other business decisions. S&P does not act as a fiduciary or an investment advisor except where registered as such. While S&P has obtained information from<br />
sources it believes to be reliable, S&P does not perform an audit and undertakes no duty of due diligence or independent verification of any information it receives.<br />
To the extent that regulatory authorities allow a rating agency to acknowledge in one jurisdiction a rating issued in another jurisdiction for certain regulatory purposes, S&P<br />
reserves the right to assign, withdraw, or suspend such acknowledgement at any time and in its sole discretion. S&P Parties disclaim any duty whatsoever arising out of the<br />
assignment, withdrawal, or suspension of an acknowledgment as well as any liability for any damage alleged to have been suffered on account thereof.<br />
S&P keeps certain activities of its business units separate from each other in order to preserve the independence and objectivity of their respective activities. As a result,<br />
certain business units of S&P may have information that is not available to other S&P business units. S&P has established policies and procedures to maintain the<br />
confidentiality of certain nonpublic information received in connection with each analytical process.<br />
S&P may receive compensation for its ratings and certain analyses, normally from issuers or underwriters of securities or from obligors. S&P reserves the right to disseminate<br />
its opinions and analyses. S&P's public ratings and analyses are made available on its Web sites, www.standardandpoors.com (free of charge), and www.ratingsdirect.com<br />
and www.globalcreditportal.com (subscription), and may be distributed through other means, including via S&P publications and third-party redistributors. Additional<br />
information about our ratings fees is available at www.standardandpoors.com/usratingsfees.<br />
<strong>Standard</strong> & Poors | <strong>Ratings</strong>Direct on the Global Credit Portal | February 29, 2012 20<br />
948538 | 300076937