Strategic Planning for Water Loss Reduction with ... - Iwa-waterloss.org
Strategic Planning for Water Loss Reduction with ... - Iwa-waterloss.org
Strategic Planning for Water Loss Reduction with ... - Iwa-waterloss.org
- No tags were found...

Create successful ePaper yourself
Turn your PDF publications into a flip-book with our unique Google optimized e-Paper software.
<strong>Strategic</strong> <strong>Planning</strong> <strong>for</strong> <strong>Water</strong> <strong>Loss</strong> <strong>Reduction</strong> <strong>with</strong> Imprecise DataHarrison E. Mutikanga 1,2 and Saroj K. Sharma 11 UNESCO-IHE Institute <strong>for</strong> <strong>Water</strong> Education, Westvest 7, 2611 AX Delft, The Netherlands,Tel: +31(0)152151772, Fax: +31(0)152122921 h.mutikanga@unesco-ihe.<strong>org</strong>(Corresponding Author)2 National <strong>Water</strong> and Sewerage Corporation, Plot 39 Jinja Road, Kampala, Uganda.Abstract<strong>Water</strong> utilities particularly in the developing countries continue to operate <strong>with</strong>considerable inefficiencies in terms of water and revenue losses. With increasing waterdemand and scarcity, utilities require effective strategies <strong>for</strong> optimum use of availablewater resources. Often the in<strong>for</strong>mation needed <strong>for</strong> strategic planning is inadequate anddecisions have to be made on the basis of limited and uncertain data. Whereas decisionmakersendeavour to obtain accurate and reliable data, they are often hindered orfrustrated by the cost and time needed to collect the data. In this paper, an integratedmulti-criteria decision-aiding framework <strong>for</strong> strategic planning of water loss management ispresented. The PROMETHEE II method was applied <strong>with</strong>in the framework in prioritizingwater loss reduction options <strong>for</strong> Kampala city, Uganda. A strategic plan that combinesselective mains and service lines replacement and pressure management as priorities isthe best compromise based on preferences of the decision makers and seven evaluationcriteria characterized by financial-economic, environmental, public health, technical andsocial impacts. The results show that the most preferred options are those that enhancewater supply reliability, public health and water conservation measures. This studydemonstrates that even <strong>with</strong>out sufficient resources to generate precise data, utilities indeveloping countries can still use appropriate tools to plan and prioritize water lossreduction options.Keywords: Multi-criteria decision analysis; <strong>Strategic</strong> planning; <strong>Water</strong> loss reduction.Introduction<strong>Water</strong> utilities around the world are still facing challenges of high water losses despite thetools and methodologies developed in the last two decades to help reduce the losses.According to the World Bank study, about 48 billion m 3 of water is lost annually from waterdistribution systems (WDSs) costing water utilities about US$ 14 billion per year aroundthe world (Kingdom et al. 2006). In Asian cities, non-revenue water (NRW) expressed as apercentage of total water supply ranges from 4.4% (PUB, Singapore) to 63.8% (Maynilad,Manila) (ADB 2010). In Africa NRW figures ranging from 5% (Saldanha Bay, South Africa)to 70% (LWSC, Liberia) have been reported (WSP 2009). In Latin American water utilities,NRW averages 40% (Corton and Berg 2007). High levels of water losses are indicative ofpoor governance and poor physical conditions of the WDSs (Male et al. 1985; McIntosh2003). <strong>Water</strong> losses not only have economic and environment dimensions but also publichealth and social impacts. Leakage, often leads to service interruption, is costly in terms ofenergy losses and may cause water quality contamination via pathogen intrusion (Cabreraet al. 2010; Karim et al. 2003). With global pressures of climate change, rapidurbanization, increasing water demand and water scarcity, utilities require effectivestrategies to conserve water resources and ensure sustainable delivery of water services.<strong>Strategic</strong> planning (SP) has proven to be a valuable tool <strong>for</strong> sustainable urban watermanagement (Malmqvist et al. 2006). However, water utilities in developing countriesoften lack the necessary capabilities to carryout SP (Mugabi et al. 2007). SP is about1
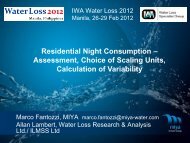
Problem Structuring PhaseSituational Analysis (Internal & External)Problem StatementRequirements & Constraint AnalysisIdentification of ActorsAnalystActorsDesign PhaseEstablish Goals and ObjectivesGenerate Discrete OptionsIdentify CriteriaModel Formulation (Evaluation Matrix)Preference ElicitationSelect Decision-Making Method or ToolAnalystActorsChoice PhaseEvaluation of Options using Selected ToolResults Analysis (Sensitivity & Robustness)RecommendationsAnalystGroup Decision PhaseCompromise SolutionAnalystActorsTesting PhasePilot DMA to Validate Options PotentialData Collection & Results AnalysisCheck Status<strong>Water</strong> Balance/AuditImplementation PhaseScheduling of ActionsBudget AllocationUrgent InterventionsShot-medium plansLong-term policyMonitoring PhaseField MeasurementsData CollectionUtilityOperationalTeam, DMs &ExpertsDMsFigure 1. Multi-criteria Decision-aiding Framework <strong>for</strong> SWLMP3
Application to the KWDS Case StudyThe framework methodology was applied to the NWSC’s Kampala <strong>Water</strong> DistributionSystem (KWDS) in Uganda’s capital city of Kampala. The KWDS service areaencompasses an area of about 350 km 2 <strong>with</strong> an estimated population of 1.5 million and73% water coverage. <strong>Water</strong> supply has not kept pace <strong>with</strong> population growth <strong>with</strong>consequences of irregular supply in most parts of the city. The development of the KWDScommenced in the year 1928 and water production has since been gradually increasingup to the current average level of about 148,000 m 3 /day, serving about 150,000 serviceconnections. The condition of the network has deteriorated over the years, due to pooroperating practices and inadequate strategic asset management (Mutikanga et al. 2009).The major customer complaints are related to supply interruptions and low pressure as aresult of frequent mains bursts and service line leakages. The average number of failuresreported during the year 2010 was 1175 breaks/100 km/year. Pipeline systems having anaverage annual pipe break ratio per 100 km of less than 40 are considered to be in anacceptable state (Pelletier et al. 2003). Apparent losses are also high <strong>with</strong> rampant illegaluse of water, high metering inaccuracies and meter failure. NRW averages about 43% ofsystem input volume or 22 million m 3 per year (NWSC 2009b).Problem <strong>for</strong>mulation <strong>for</strong> the KWDSBased on the case study in<strong>for</strong>mation the agreed upon problem statement wasdocumented as “identify and prioritize strategies to reduce water losses in KWDS”.RequirementsThe problem definition dictated the following key requirements <strong>for</strong> the decision problem:1. Strategy options should address both real and apparent losses.2. Cost of implementing a set of selected strategies should not exceed €3.6 millionper year.3. Strategies should lead to a water loss reduction of at least 12 million m 3 per year.4. Implementation period to achieve water loss reduction target should not exceed 10years.Actors: The actors (DMs, users, and other stakeholders) were proposed by the analystand approved by the General Manger of Kampala <strong>Water</strong> utility. Three actor groups wereidentified to represent utility DMs, water users and environmentalists. In total eight DMswere selected <strong>for</strong> the preference elicitation process. In this study, actors are referred to asthe eight DMs (DM1 to DM8).Establishing goals and objectives: The goals and objectives of the study were derivedfrom the utility’s mission of “providing safe and reliable water services to customers at afair price and in an environmentally friendly manner”. The goal of this study was to reducewater losses in the KWDS. The goals were viewed in the broader national water sectorpolicy of utility financial viability, environmental protection, public health protection,technically acceptable level of service and socio-economic aspects. In light of thea<strong>for</strong>ementioned, the following five main objectives were established: (i) maximizerevenues and minimize costs, (ii) maximize water savings, (iii) maximize good qualitywater, (iv) maximize water supply reliability, and (v) maximize af<strong>for</strong>dability of water.Generating options: In order to generate appropriate water loss reduction strategy options,a water balance was established by the utility water loss department using theIWA/AWWA water balance methodology (AWWA 2009) and the proposed methodology4
<strong>for</strong> assessing the apparent loss component (Mutikanga et al. 2011a). The water balance<strong>for</strong> KWDS is shown in Table 1.Table 1 KWDS <strong>Water</strong> Balance <strong>for</strong> year 2010Parameter <strong>Water</strong> <strong>Loss</strong> Components Unit QuantityError Margin(95% confidence level)System Input Volume m 3 52,499,787 ±7.0%Revenue <strong>Water</strong> m 3 30,891,487Non-Revenue <strong>Water</strong> m 3 21,608,300 ±15.3%<strong>Water</strong> <strong>Loss</strong>es m 3 21,319,631 ±7.9%Real <strong>Loss</strong>es m 3 11,863,566 ±7.5%Apparent <strong>Loss</strong>es m 3 9,456,065 ±2.5%Customer Metering Errors m 3 8,726,065 ±1.0%Unauthorised Consumption m 3 730,000 ±2.3%Based on the KWDS water balance (Table 1), the following seven strategy options wereproposed by the analyst and accepted by the DMs: (i) meter replacement (S1), (ii) illegaluse control (S2), (iii) improved speed and quality of repairs (S3), (iv) selective mains andservice line replacements (S4), (v) network zoning and establishing District Meter Areas(DMAs) (S5), (vi) pressure management (S6), and (vii) active leakage control (S7).The strategy options were selected from a rich menu developed by the International <strong>Water</strong>Association (IWA) and the American <strong>Water</strong> Works Association (AWWA) based on manyyears of research (Alegre et al. 2006; AWWA 2009; Fanner et al. 2007). The optionsaddress both real and apparent losses as they are both significant.Determining evaluation criteriaThe evaluation criteria (EC) are measures of per<strong>for</strong>mance by which the strategy optionsare judged. A brain-storming session <strong>with</strong> actors was arranged to derive the criteriarelevant <strong>for</strong> per<strong>for</strong>mance evaluation. The objectives and criteria decision-making hierarchyis presented in Figure 2. Due to insufficient per<strong>for</strong>mance evaluation data and to avoid“black box” effects, not all criteria (Figure 2) were used in the decision process although itwas important to highlight and discuss all potential EC <strong>with</strong> the stakeholders. Out of the 15criteria (Figure 2), only seven key criteria (Table 2) were selected to assess per<strong>for</strong>manceof the alternative strategy options. These criteria are as follows:1. Revenue generation (EC1).2. Investment cost (EC2).3. Operation and maintenance costs (EC3).4. <strong>Water</strong> saved (EC4).5. <strong>Water</strong> quality (EC5).6. Supply reliability (EC6).7. Af<strong>for</strong>dability (EC7).5
ObjectivesFinancial-economicto maximize revenues&minimize costsCriteriaRevenue waterInvestment costsO & M costsEnvironmentalto maximize water savingsLeakage runtimeLeakage flow rateMain ObjectiveTo prioritizewater lossreductionstrategiesPublic Healthto maximize water qualityTechnicalto maximize supply reliabilityCorroded pipesLow pressure impactsIrregular supply impactsQuality of repairpracticesPipe failure frequencyHydraulic reliabilitySpeed of repairSocio-economicto maximize af<strong>for</strong>dabilityto minimize social costsPrice of waterDamages & disruptionsImpact of water supplyinterruptionsFigure 2. Objective Tree Hierarchy of the MCDA ProblemTable 2. Evaluation criteriaCode Criteria DescriptionEC1The ability of option to improve revenue. The higher theRevenue generationpotential, the most preferable the optionEC2 Investment costThe cost needed to implement the option. The lower thecost, the most preferable the optionEC3Operation & The costs associated <strong>with</strong> adopting the option. The lower themaintenance costs cost, the most preferable the optionEC4 <strong>Water</strong> savedThe ability of option to reduce leakage. The higher thepotential, the most preferable the optionEC5 <strong>Water</strong> qualityThe ability of option to improve water quality. The higher thepotential, the most preferable the optionEC6 Supply reliabilityThe ability of option to minimize supply interruptions. Thefewer the frequency of bursts and leaks, the most preferablethe optionEC7 Af<strong>for</strong>dabilityThe impact of option on water tariff. The lower the impact ontariff, the most preferable the option6
Predicting per<strong>for</strong>mance: The qualitative scores (per<strong>for</strong>mance of each option in relation to acriterion) of the evaluation matrix (EM) were provided by experts from the utility’s <strong>waterloss</strong> control department. However, predicting the per<strong>for</strong>mance of strategy options <strong>with</strong>certainty is not straight<strong>for</strong>ward. A Likert Scale ranging from 1 (poor per<strong>for</strong>mance) to 5(very good per<strong>for</strong>mance) was used to evaluate the qualitative scores and the results areshown in the EM Table 3. This being an interval scale, the intervals between statementsare meaningful but scale scores have no meaning.Selecting the multi-criteria method : The MCDA method used was the PROMETHEE IIand its D-Sight software tool. There is increasing popularity in solving complex decisionproblems using PROMETHEE (Behzadian et al. 2010) and its poweful D-sight software(Bernardini et al. 2010). The method is highly appreciated by end-users because it is easyto use, intuitive, auditable, and transparent <strong>with</strong> several graphical and interactive tools.Preference modeling: The preference elicitation process in the case study comprised of aninterviewer-assisted questionnaire survey to derive preference functions (PFs) andweights <strong>for</strong> the evaluation criteria (EC) and objectives. A survey was conducted on eightDMs and weights were assigned <strong>for</strong> each criterion and objective to reflect their relativeimportance to the decision problem. As the criteria were qualitative, the PF applied in thisstudy was the type I (usual criterion) of the six generalized criteria as defined by theauthors of the PROMETHEE method (Brans and Mareschal 2005) and in line <strong>with</strong>guidelines <strong>for</strong> using the PROMETHEE method (De Keyser and Peeters 1996). Thepreference thresholds can be chosen by means of the D-Sight software. In this way, a lotof flexibility is provided to represent the preferences of DMs.ObjectiveFinacial-economicEnvironmentalPublic HealthTable 3. Evaluation matrixStrategy OptionsCriteria Direction S1 S2 S3 S4 S5 S6 S7EC1 Revenue Maximise 5 3 3 3 1 2 1EC2 Investment Cost Minimise 2 1 1 5 3 3 2EC3 O & M Costs Minimise 1 4 5 1 2 2 4EC4 <strong>Water</strong> Saved Maximise 1 1 4 5 2 4 3EC5 <strong>Water</strong> Quality Maximise 1 1 2 5 2 4 3Technical (Level of Service)EC6 Supply Reliability Maximise 1 1 3 5 2 4 3Socio-economicEC7 Af<strong>for</strong>dability Maximise 5 4 1 2 2 3 2Determining criteria weights: The weights were derived using the “Revised Simos”Procedure (Figueira and Roy 2002) and the criteria weight values are presented in Table5. For the group decision, the median was considered as the representative value since itagrees <strong>with</strong> the majority view of the group. The most important evaluation criterion <strong>for</strong>prioritising water loss reduction option is water supply reliability (EC6) <strong>with</strong> the highestaverage weight of 29%.7
Table 4. Evaluation criteria weights assigned by each DMCriteriaWeight ValuesDM1 DM2 DM3 DM4 DM5 DM6 DM7 DM8 Mean MedianC1 19 12 6 18 0 4 15 11 11 12C2 5 11 7 5 9 0 2 9 6 6C3 10 8 7 10 4 0 9 9 7 9C4 26 25 14 33 7 15 12 14 18 15C5 13 14 16 7 26 15 15 14 15 15C6 19 20 32 20 35 38 40 24 29 28C7 7 10 8 7 19 27 8 19 13 9Results and DiscussionEvaluating optionsThe water loss reduction strategy options were evaluated and prioritized <strong>with</strong> the D-SightSoftware tool, which uses the PROMETHEE algorithm. The PROMETHEE II individualdecision and group decision rankings are shown in Table 5 and Figure 3. The mostpreferred strategy options are S4 and S6 <strong>with</strong> scores of 0.64 and 0.36 respectively.Table 5. PROMETHEE II rankings <strong>for</strong> individual DMs and group scenarioRankIndividual Decision MakerGroup DecisionDM1 DM2 DM3 DM4 DM5 DM6 DM7 DM8Rank1 S4 S4 S4 S4 S4 S4 S4 S4 S4Rank2 S6 S6 S6 S6 S6 S6 S6 S6 S6Rank3 S3 S3 S3 S3 S7 S7 S3 S1 S3Rank4 S1 S7 S7 S1 S3 S3 S7 S3 S7Rank5 S7 S1 S5 S7 S5 S1 S1 S7 S1Rank6 S5 S2 S1 S5 S1 S5 S5 S2 S5Rank7 S2 S5 S2 S2 S2 S2 S2 S5 S2Figure 3. PROMETHEE II rankings based on net preference flow (Φ)8
Although derived scientifically (Figure 3), the strategic water loss reduction framework <strong>for</strong>Kampala is in agreement <strong>with</strong> general guidelines <strong>for</strong> selecting the order of implementingreal loss reduction strategies (Fanner et al. 2007; Trow and Farley 2004).Group decision-making phase: The PROMETHEE and GAIA plane provide bothdescriptive and prescriptive tools and were exploited during a group meeting <strong>org</strong>anized todiscuss the PROMETHEE II ranking of options, sensitivity of weighting criteria and agreeon a compromise solution as no alternative is the best one on each criterion. Reachingconsensus was rather easy as there was no dispute on the first two best options (S4 andS6) and minor disagreements on the third ranked option (S3) and last option (S2) asshown in Table 5. The reasons <strong>for</strong> the prioritised ranking according to the DMs were asfollows:Leaking pipes increase energy costs, erode utility revenue and compromise qualityof service leading to serious operational problems. Mains and service linesreplacement do not only reduce leakage but also improve system hydraulicreliability and water quality.Pressure management (PM) is the only tool that can proactively control leakageonce pipes have been laid. In addition, PM reduces main break frequency andextends useful life of infrastructure among other benefits.Imporved speed and quality of repair is the only strategy that repairs actual failuresand will always be used to supplement other strategies.Active leakage control emerged low due to the fact that there is no sense in puttingtoo much ef<strong>for</strong>t in detecting invisible underground leaks in a city like Kampalawhere the utility is overwhelmed by visible leaks.Network zoning and DMA establishment: this is a complementary strategy to otherstrategies to enable leakage assessment and leak detection.Meter replacements and illegal use control were ranked so low based on theurgument that reliable water supply of good quality and adequate pressure mustfirst be available be<strong>for</strong>e it is stolen and measured accurately.Sensitivity Analysis: The sensitivity of the results was analyzed using the capabilities ofthe D-Sight Software in-built tools. The results are presented in Table 6. The stabilityintervals indicate the range in which the weight of a criterion can be changed <strong>with</strong>outaffecting the ranking. For example, the technical criterion <strong>with</strong> an initial normalized weightof 30.4% may be weighted between 19.7% and 44.7% (stability interval of 25%) <strong>with</strong>outaffecting the ranking provided all other factors remain constant. The sensitivity of theranking can be considered as marginal <strong>with</strong> respect to the criteria weight values assigned.Table 6. Weight sensitivity analysis of group on strategy rankingCriteria Min. Weight Value Max. Weight Stability IntervalFinancial-economic 19.5% 28.3% 35.4% 15.9%Environmental 2.7% 15.8% 33.0% 30.3%Public Health 6.3% 15.8% 27.1% 20.8%Technical 19.7% 30.4% 44.7% 25.0%Social-economic 0.2% 9.8% 15.4% 15.2%ConclusionsThis study presented an integrated MCDA strategic planning framework methodology <strong>for</strong>evaluating and prioritizing water loss reduction options. The framework explicitly considersseven evaluation criteria <strong>with</strong>in five main sustainability dimensions of economic,9
environmental, technical and social objectives. The framework includes the PROMETHEEoutranking method <strong>with</strong> its D-Sight software tool in solving the decision problem. TheMCDA integrated framework allows <strong>for</strong> participatory decision making in which stakeholderpreferences are elicited and explicitly incorporated into the decision process. Resultsindicate that water supply reliability has the highest influence on prioritizing water lossreduction options (29%); followed by water savings (15.8%) and water quality (15.8%).Conversely, the criterion <strong>with</strong> the lowest influence is the investment cost (6%). For KWDS,the prioritized options <strong>for</strong> water loss reduction were mains and service lines replacementfollowed by pressure management and improved speed and quality of repairs. The resultsdemonstrate that the cheapest option is not necessarily the best when multiple-criteria areconsidered in an explicit way. Sensitivity analysis shows the stability of the ranking <strong>with</strong>the least stability interval of 15.2% <strong>for</strong> af<strong>for</strong>dability.It is envisaged that the integrated MCDA framework methodology will be a valuableplanning tool <strong>for</strong> water utility managers particularly in developing countries where theproblem of water loss is more prominent and accurate prediction of the per<strong>for</strong>mance ofstrategy options is constrained by often insufficient and imprecise data. The methodologyis generic and can easily accommodate additional options and criteria, making itsadaptation to other water utilities very easy.AcknowledgementsThis work was funded under the Netherlands Fellowship Program and by National <strong>Water</strong>and Sewerage Corporation (NWSC), Uganda. The authors are grateful to all the NWSCstaff and the GTZ technical adviser to NWSC who participated in the questionnaire surveyand brainstorming sessions.ReferencesADB. (2010). "Every Drop Counts: Learning from Good Practices in Eight Asian Cities."Asian Development Bank, Manila.Alegre, H., Baptista, J. M., Cabrera, E. J., Cubillo, F., Hirner, W., Merkel, W., and Parena,R. (2006). Per<strong>for</strong>mance Indicators <strong>for</strong> <strong>Water</strong> Supply Services, IWA Manual of BestPractice, IWA Publishing.AWWA. (2009). "<strong>Water</strong> Audits and <strong>Loss</strong> Control Programs: AWWA Manual M36."American <strong>Water</strong> Works Association, Denver, USA.Behzadian, M., Kazemzadeh, R. B., Albadvi, A., and Aghdasi, M. (2010). "PROMETHEE:A comprehensive literature review on methodologies and applications." EuropeanJournal of Operational Research, 200, 198-215.Bernardini, A., Hayez, Q., Macharis, C., and De Smet, Y. "Multicriteria analysis of policyoptions scenarios to reduce the aviation climate impact - an application of thePROMETHEE based D-SIGHT software." Proceedings of the OperationalResearch Society, OR52, ISBN 0903440474, London.Bouchard, C., Abi-zeid, I., Beauchamp, N., Lamontagne, L., and Desrosiers, J. (2010)."Multicriteria decision analysis <strong>for</strong> the selection of a small drinking water system."Journal of water supply: Research and Technology-AQUA, 59(4), 230-242.Brans, J. P., and Mareschal, B. (2005). "PROMETHEE Methods." Multiple CriteriaDecision Analysis: State of the Art Surveys, J. Figueira, S. Greco, and M. Ehrgott,eds., Springer, New York, 163-189.Cabrera, E., Pardo, M. A., Cobacho, R., and Cabrera Jr, E. (2010). "Energy Audit of <strong>Water</strong>Networks." Journal of <strong>Water</strong> Resources <strong>Planning</strong> and Management, 136(6), 669-677.Cabrera Jr, E., Cobacho, R., Estruch, V., and Aznar, J. (2011). "Analytical hierarchicalprocess (AHP) as a decision support tool in water resources management."Journal of <strong>Water</strong> Supply: Research and Technology-AQUA, 60(6), 343-351.10
Corton, M. L., and Berg, S. V. (2007). "Benchmarking Central American <strong>Water</strong> Utilities."Public Utility Research Centre, University of Florida, Gainesville, Florida.De Keyser, W., and Peeters, P. (1996). "A note on the use of PROMETHEE multicriteriamethods." European Journal of Operational Research, 89, 457-461.Fanner, P., Thornton, J., Liemberger, R., and Sturm, R. (2007). Evaluating <strong>Water</strong> <strong>Loss</strong>and <strong>Planning</strong> <strong>Loss</strong> <strong>Reduction</strong> Strategies, Awwa Research Foundation, AWWA;,Denver, USA; IWA, London, UKFigueira, J., Greco, S., and Ehrgott, M. (2005). Multicriteria Decision Analysis: State of theArt Surveys, Springer, New York.Figueira, J., and Roy, B. (2002). "Determining weights of criteria in the ELECTRE typemethods <strong>with</strong> a revised Simos' procedure." European Journal of OperationalResearch, 139, 317-326.Karim, M. R., Abbaszadegan, M., and LeChevallier, M. (2003). "Potential <strong>for</strong> PathogenIntrusion During Pressure Transients." Journal American <strong>Water</strong> Works Association,95(5), 134-146.Kingdom, B., Liemberger, R., and Marin, P. (2006). "The Challenge of Reducing Non-Revenue <strong>Water</strong> (NRW) in Developing Countries ", The World Bank, Washington,DC, USA.Male, J. W., Noss, R. R., and Moore, I. C. (1985). Identifying and Reducing <strong>Loss</strong>es in<strong>Water</strong> Distribution Systems, Noyes Publications, New Jersey.Malmqvist, P.-A., Heinicke, G., Karrman, E., Stenstrom, T. A., and Svensson, G. (2006)."Urban water in context." <strong>Strategic</strong> <strong>Planning</strong> of Sustainable Urban <strong>Water</strong>Management, Malmqvist, Heinicke, Karrman, Stenstrom, and Svensson, eds., IWAPublishing, London.McIntosh, A. C. (2003). Asian <strong>Water</strong> Supplies: Reaching the Urban Poor, AsianDevelopment Bank and IWA Publishing.Morais, D. C., and Almeida, A. T. (2007). "Group Decision Making <strong>for</strong> LeakageManagement Strategy of <strong>Water</strong> Network." Resources Conservation and Recycling,52, 441-458.Mugabi, J., Kayaga, S., and Njiru, C. (2007). "<strong>Strategic</strong> planning <strong>for</strong> water utilities indeveloping countries." Utilities Policy, 15, 1-8.Mutikanga, H. E., Sharma, S., and Vairavamoorthy, K. (2009). "<strong>Water</strong> <strong>Loss</strong> Managementin Developing Countries: Challenges and Prospects." Journal AWWA, 101(12), 57-68.Mutikanga, H. E., Sharma, S. K., and Vairavamoorthy, K. (2011a). "Assessment ofApparent <strong>Loss</strong>es in Urban <strong>Water</strong> Systems." <strong>Water</strong> and Environment Journal,25(3), 327-335.Mutikanga, H. E., Sharma, S. K., and Vairavamoorthy, K. (2011b). "Multi-criteria DecisionAnalysis: A strategic planning tool <strong>for</strong> water loss management." <strong>Water</strong> ResourcesManagement, DOI 10.1007/s11269-011-9896-9.NWSC. (2009a). "Corporate Plan (2009-2012): "maximizing the cash operating margin"."National <strong>Water</strong> and Sewerage Corporation, Kampala, Uganda.NWSC. (2009b). "NWSC Annual Per<strong>for</strong>mance Report: Financial Year 2008-2009."Kampala.Pelletier, G., Mailhot, A., and Villeneuve, J. P. (2003). "Modeling water pipe breaks-threecase studies." Journal of <strong>Water</strong> Resources <strong>Planning</strong> and Management, 129(2),115-123.Trow, S., and Farley, M. (2004). "Developing a strategy <strong>for</strong> leakage management in waterdistribution systems." <strong>Water</strong> Science and Technology: <strong>Water</strong> Supply, 4(3), 149-168.WSP. (2009). "<strong>Water</strong> Operators Partnerships: African Utility Per<strong>for</strong>mance Assessment."<strong>Water</strong> and Sanitation Program (WSP) - Africa, The World Bank, Nairobi, Kenya.11