FLORIDA STATEwIDE REGIONAL EVACUATION STUDy PROGRAm
FLORIDA STATEwIDE REGIONAL EVACUATION STUDy PROGRAm
FLORIDA STATEwIDE REGIONAL EVACUATION STUDy PROGRAm

Create successful ePaper yourself
Turn your PDF publications into a flip-book with our unique Google optimized e-Paper software.
Statewide Regional EvacuationStudy ProgramVolume 1-11Technical Data ReportSouth Florida RegionChapter IIRegional Hazards Analysis
Volume 1-11 South FloridaStatewide Regional Evacuation Studies ProgramThis page intentionally left blank.Chapter IIRegional Hazards Analysis
Statewide Regional Evacuation Studies ProgramVolume 1-11 South FloridaTable of ContentsPageA. Hazards Identification and Risk Assessment ..................................................................II-1B. Coastal Storms and Hurricanes .....................................................................................II-51. Coastal Storms / Hurricane Hazard Profile................................................................II-52. Hurricane Hazards..................................................................................................II-73. Storm Surge: The SLOSH Model..............................................................................II-8a. Hypothetical Storm Simulations .........................................................................II-9b. The Grids for SLOSH Models for Biscayne Bay and Florida Bay...........................II-11c. Storm Scenario Determinations........................................................................II-12d. Determining Storm Surge Height and Flooding Depth........................................II-13e. Variations to Consider .....................................................................................II-14(1) Storm Surge and Wave Height ...................................................................II-14(2) Forward Speed..........................................................................................II-15(3) Radius of Maximum Winds .........................................................................II-15(4) Astronomical Tides ....................................................................................II-15f. Storm Tide Atlas .............................................................................................II-15g. Factors Influencing Model Accuracy .................................................................II-154. Hurricane Wind Analysis .......................................................................................II-19a. Wind Risk Assessment: Inland Wind Model.......................................................II-20b. Wind Risk Assessment: Florida Building Code ...................................................II-24c. Wind Risk Assessment: Hazards US Multi-Hazard (HAZUS-MH) ..........................II-255. Tornadoes ...........................................................................................................II-256. Hazardous Materials .............................................................................................II-287. Freshwater Flooding and the Inundation of Evacuation Routes................................II-298. History of Hurricanes in the South Florida Region...................................................II-30a. The 2004 Hurricane Season.............................................................................II-32b. The 2005 Hurricane Season.............................................................................II-34c. The 2006, 2007 and 2008 Seasons ..................................................................II-379. Probability of Future Hurricane Events ...................................................................II-38a. Monthly Zones of Origin and Hurricane Tracks..................................................II-41b. NOAA Historical Analysis for the Region ...........................................................II-44C. Freshwater Flooding: The 100-Year Flood Plain ...........................................................II-611. Inland / Riverine Flooding Profile...........................................................................II-612. Probability of Flooding: Flood Insurance Rate Maps (FIRMs) ...................................II-623. Dam Failure .........................................................................................................II-654. History of Inland Flooding.....................................................................................II-665. Structural Inventories, Economic Vulnerability and Repetitive Loss ..........................II-67D. Wildfires and the Urban Interface ...............................................................................II-701. Wildfire Hazard Profile ..........................................................................................II-702. History of Wildfire in the State of Florida ...............................................................II-713. Wildland – Urban Interface (WUI) .........................................................................II-72E. Hazardous Materials Incidents ....................................................................................II-741. Overview .............................................................................................................II-74Regional Hazards AnalysisChapter II - Table of Contents
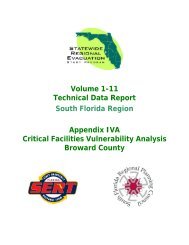
Volume 1-11 South FloridaStatewide Regional Evacuation Studies Program2. History of the Local Emergency Planning Committees (LEPCs) ................................II-743. LEPC Mission Statement .......................................................................................II-754. Hazards Analysis of Hazardous Materials................................................................II-76a. CAMEOfm, MARPLOT and ALOHA Update.........................................................II-77b. South Florida Hazardous Material Emergency Plan ............................................II-78c. Regional Hazardous Materials Commodity Flow.................................................II-80F. Terrorism and Domestic Security ................................................................................II-821. Overview .............................................................................................................II-82a. Explosions ......................................................................................................II-82b. Biological Threats ...........................................................................................II-82c. Chemical Threats ............................................................................................II-83d. Nuclear Blast ..................................................................................................II-83(1) Hazards of Nuclear Devices........................................................................II-83(2) Radioactive Fallout ....................................................................................II-84e. Radiological Dispersion Device (RDD)...............................................................II-842. The Regional Domestic Security Task Forces (RDSTFs)...........................................II-853. History of Events..................................................................................................II-854. Vulnerability Assessments .....................................................................................II-85G. Nuclear Power Plant Incidents ....................................................................................II-861. Description of the Turkey Point Nuclear Power Plant...............................................II-862. Summary of Incidents ..........................................................................................II-88H. Tsunami....................................................................................................................II-89Chapter II - Table of ContentsRegional Hazards Analysis
Statewide Regional Evacuation Studies ProgramVolume 1-11 South FloridaList of TablesTable Title PageII-1 Hazards Identified in Florida ..............................................................................II-2II-2 Saffir-Simpson Hurricane Wind Scale..................................................................II-6II-3a Biscayne Bay Hypothetical Storm Parameters ...................................................II-10II-3b Florida Bay Hypothetical Storm Parameters ......................................................II-10II-4 Potential Tide Height(s) by County (in feet above NAVD88)...............................II-13II-5 Enhanced Fujita-Pearson Tornado Intensity Scale .............................................II-27II-6 U.S. Mainland Hurricane Strikes by State, 1851-2006 ........................................II-39II-7 Major Hurricane Direct Hits on the U.S. Coastline, 1851-2006, by Month ............II-40II-8a Tropical Storms and Hurricanes Passing within 100 NMi of Key West, FL,1870-2007......................................................................................................II-45II-8b Tropical Storms and Hurricanes Passing within 100 NMi of Islamorada,1870-2007......................................................................................................II-47II-8c Tropical Storms and Hurricanes Passing within 100 NMi of Flamingo,1870-2007......................................................................................................II-49II-8d Tropical Storms and Hurricanes Passing within 100 NMi of Miami Beach,1870-2007......................................................................................................II-51II-8e Tropical Storms and Hurricanes Passing within 100 NMi of FortLauderdale, 1870-2007 ...................................................................................II-53II-9a Summary for Hurricanes and Tropical Storms, 1870-2007 .................................II-55II-9b Summary for Hurricanes, 1870-2007................................................................II-55II-10 Definitions of National Flood Insurance Program (NFIP) Zones ..........................II-62II-11 Flood Plain Acreage by County.........................................................................II-65II-12 Dams in the South Florida Region ....................................................................II-66II-13 Repetitive Loss Properties ...............................................................................II-68II-14 District XI Top Ten Section 302 Chemicals, 2007 ..............................................II-77Regional Hazards AnalysisChapter II - Table of Contents
Volume 1-11 South FloridaStatewide Regional Evacuation Studies ProgramList of FiguresFigure Title PageII-1a SLOSH Grid – Biscayne Bay .............................................................................II-11II-1b SLOSH Grid – Florida Bay ................................................................................II-11II-2a SLOSH Grid with Surge Values – Biscayne Bay..................................................II-12II-2a SLOSH Grid with Surge Values – Florida Bay.....................................................II-12II-3a South Florida Region Storm Tide Map – Biscayne Bay .......................................II-17II-3b South Florida Region Storm Tide Map – Florida Bay ..........................................II-18II-4 Inland Wind Decay..........................................................................................II-20II-5 Maximum Inland Extent of Winds for Hurricanes Approaching the GulfCoast .............................................................................................................II-22II-6 Maximum Inland Extent of Winds for Hurricanes Approaching the EastCoast .............................................................................................................II-23II-7 ASCE 7-98 Wind Zones....................................................................................II-24II-8 Wind Risk Assessment Using HAZUS-MH: 50-Year Return Peak Gusts ................II-26II-9 Prevailing Tracks – June..................................................................................II-42II-10 Prevailing Tracks – July ...................................................................................II-42II-11 Prevailing Tracks – August ..............................................................................II-42II-12 Prevailing Tracks – September.........................................................................II-43II-13 Prevailing Tracks – October .............................................................................II-43II-14 Prevailing Tracks – November..........................................................................II-43II-15a Hurricane Return Intervals for the South Florida Region – Key West ..................II-56II-15b Hurricane Return Intervals for the South Florida Region – Islamorada................II-57II-15c Hurricane Return Intervals for the South Florida Region – Flamingo...................II-58II-15d Hurricane Return Intervals for the South Florida Region – Miami Beach .............II-59II-15e Hurricane Return Intervals for the South Florida Region – Fort Lauderdale .........II-60II-16 South Florida Region: FEMA Flood Zones (FIRM Q3) .........................................II-64II-17 South Florida Region Wildfire Levels of Concern................................................II-73II-18 Section 302 Facilities in the South Florida Region..............................................II-81Chapter II - Table of ContentsRegional Hazards Analysis
Statewide Regional Evacuation Studies ProgramVolume 1-11 South FloridaCHAPTER II<strong>REGIONAL</strong> HAZARDSANALYSISA. Hazards Identification and RiskAssessmentThe regional evacuation studies in Florida have traditionally focused specifically on thehurricane hazard. Considering the Region’s vulnerability to tropical storms and hurricanes, andthe complex nature of the evacuation, as well as the emergency response and recovery, thepriority of hurricane planning remains a necessity. However, history has also demonstrated theneed to address other significant hazards which have the potential for initiating majorevacuations.The Statewide Regional Evacuation Study (SRES), utilizing the Statewide Hazard Mitigation Plan(SHMP 2009), identified the major hazards facing the state and further focused on thosehazards which had the potential for initiating a multi-jurisdictional evacuation. A number offactors were considered in assessing the risk of each hazard event, including the frequency ofoccurrence, the severity of the event and the areas vulnerable to its impact.These factors were assigned numerical values in the assessment as follows:1. Frequency of Occurrencea. Annual Eventb. Every 5 years or lessc. Every 6-10 yearsd. Every 11-30 yearse. Greater than 30 years2. Vulnerability Factorsa. Lowb. Moderatec. Highd. Extremee. Catastrophic3. Vulnerability Impact Areasa. Populationb. Propertyc. Environmentd. OperationsTwelve major hazards were identified, including floods, coastal storms and hurricanes; severestorms and tornadoes; wildfire; drought and extreme heat; winter storms and freezes; erosion,sinkholes, landslides and seismic events; tsunamis; technological; terrorism and massmigration.Regional Hazards AnalysisPage II-1
Volume 1-11 South FloridaStatewide Regional Evacuation Studies ProgramTable II-1Hazards Identified in Florida 1Hazard Methodology of Identification Significant ConcernsFloods(includingrelatedpotential fordam failure)• Review of past disasterdeclarations.• Review of federal Flood InsuranceRate Maps (FIRMs).• Input from state floodplainmanager.• Identification of National FloodInsurance Program (NFIP) repetitiveloss properties in the state.• Florida is affected by flooding nearlyevery year.• Floods have caused extensive damageand loss of life in the state in the past.• The most recent federally declareddisaster event (Feb. 8, 2007) in Floridaincluded flooding from severe storms.• There are a number of dams in the statethat could impact the nearby population.Potential to Initiate aRegional EvacuationYes; although moredifficult to determinewhich areas arevulnerable to a particularevent.CoastalStorms &Hurricanes• Review of past disasterdeclarations.• Review of National Climatic DataCenter (NCDC) Severe StormsDatabase.• National Oceanographic andAtmospheric Administration (NOAA)climatology data• Research including new mediaand the Internet• Hurricanes and coastal storms affectFlorida every year.• Hurricanes have caused extensivedamage and loss of life across the statefor the last 50 years.• 8 out of the last 10 federally declareddisaster events in Florida were hurricanes.Yes; this hazard requiresthe evacuation of coastalareas and mobile homeresidents, even in minortropical storm events.Major hurricanes canhave catastrophicimpacts.Severe Storms& TornadoesWildfire• Review of past disasterdeclarations.• Review of National Climatic DataCenter (NCDC) Severe StormsDatabase.• National Weather Service inputand data.• Public input including newspapersand media.• Florida Division of Forestrystatistics and input.• United State Department ofAgriculture (USDA) Forest ServiceFire, Fuel, and WUI mapping.• Input from Florida Division ofEmergency Management (DEM)about wildfires and the EmergencyOperations Center (EOC)activations.• Public input including newspapersand media.• Florida experiences a tornado nearlyevery year.• Tornadoes have caused extensivedamage and loss of life to countyresidents.• The two most recent federally declareddisaster events in Florida (Feb. 8 and Feb.3, 2007) were a severe storm withtornadoes.• Florida experiences wildfires every year.• Development in much of the state isoccurring at the Wildland-Urban Interface(WUI).• Cyclical drought patterns result inincreases of brush and other drymaterials. This increases the overall riskfor significant fires.• Fires in 2007 were significant due to thenumber and magnitude including closuresto the interstate system.No; these events providelittle to no warning andthe specific areas cannotbe determined prior tothe event. Exceptions:Tornado warnings cansend residents to saferooms or mobile homeparks community centers,etc.Yes; while we candetermine areas that maybe more vulnerable andplan accordingly, it isdifficult to predict wherea wildfire may ignite.Drought &Extreme Heat• National Weather Service data.• National Oceanographic andAtmospheric Administration (NOAA)paleoclimatology data.• The US Drought Monitor• Keetch Byram Drought Index(KBDI)• Agricultural communitythroughout the state.• Significant drought trends during the last10 years including moderate and severedrought index conditions in 2007 and2008 for parts of the state.• Drought has a severe economic impacton the state due to the large amounts ofcitrus, agriculture and livestock.No; this event does nottypically initiate anevacuation.1 Statewide Hazard Mitigation Plan (SHMP), 2009Page II-2Regional Hazards Analysis
Statewide Regional Evacuation Studies ProgramVolume 1-11 South FloridaHazard Methodology of Identification Significant ConcernsWinter Stormsand Freezes• Review of past disasterdeclarations.• Review of National Climatic DataCenter (NCDC) Severe StormsDatabase.• National Weather Service inputand data.• Public input including newspapersand media.• Florida is affected by winter stormscyclically• Significant freezes particularly during the1980s that affected the citrus industry• 5 federally declared disasters since 1971• The population is unprepared for coldweather with many having inadequateheating capabilities.Potential to Initiate aRegional EvacuationNo; this event does nottypically initiate anevacuation, although coldweather shelters may beopened for homeless,special needs or thosewith no power.Erosion• Coordination with the FloridaDepartment of EnvironmentalProtection – Bureau of Beaches andCoastal systems.• Statewide Hazard Mitigation Plan -interview and input.• Evaluation of Erosion Hazards, thereport from the Heinz Center thatwas presented to the FederalEmergency Management Agency(FEMA) in April 2000.• Public input including newspapersand media.• Due to the gradual, long-term erosion,as many as one in four houses along thecoast, could fall into the ocean in the next60 years.• Eighty to 90 percent of the nation'ssandy beaches are facing erosionproblems.• Significant economic impact for the statedue to property damages, loss of actualbeach front real estate and effects ontourism.No; this event does nottypically initiate anevacuation, but it mayresult in a retreat fromthe coast over long periodof time or following amajor coastal storm.Sinkholes,Landslides andSeismic Events• Coordination with the FloridaGeographical Survey• The Florida Sinkhole Database• Coordination with the FloridaDepartment of Transportation(FDOT)• Input from the Central UnitedStates Earthquake Consortium• United States Geological Survey(USGS) Landslide Hazard maps• Sinkholes are a common feature ofFlorida's landscape.• 2843 sinkholes have been reported inthe state since the 1970s.• Growing issues as developmentcontinues in high risk areas.• Impact on the roads and physicalinfrastructure of the state.• Earthquake risk is considered extremelylow.Earthquake is consideredvery low risk.Sinkholes, whileprevalent, will not initiatean evacuation at aregional scale.TsunamisTechnological• Input from the National Oceanicand Atmospheric Administration(NOAA) Center for TsunamiResearch• Coordination with the FloridaDivision of Emergency Management• Input from the United StatesGeological Survey (USGS)• Coordination with the StateEmergency Response Commission• Interaction with the LocalEmergency Planning Committees(LEPC)• Coordination with the NuclearRegulatory Commission (NRC)• Communications with the FloridaDepartment of EnvironmentalProtection• Tsunamis are common events that occurin large bodies of water.• Almost all perimeters of Florida'sboundaries are made up of large bodies ofwater.• Recent tsunamis from around the worldhave caused widespread destruction.• Residential and commercial developmentalong Florida’s coastlines are at risk to theeffects of Tsunamis.• Numerous accidental hazardous materialreleases occur every year.• Potential for human and environmentalimpacts• Threat of radiation from a nuclearrelated incidentThis event has anextremely low probabilityof occurrence. If aCumbre Vieja tsunamievent were to occur, itcould have a catastrophicimpact on the east coastof Florida. A maximum of6 hours would beavailable for evacuations.Typically, there is little tono warning.Yes, these incidents mayinitiate evacuations, but itis impossible to predictprecise location, extentand timing.Nuclear power plantevacuation planning isconducted with NRCRegional Hazards AnalysisPage II-3
Volume 1-11 South FloridaStatewide Regional Evacuation Studies ProgramHazard Methodology of Identification Significant ConcernsTerrorism• Coordination with the FederalEmergency Management Agency(FEMA) and US Department ofHomeland Security (DHS)• Coordination with the FloridaDepartment of Law Enforcement(FDLE)• Interaction with local lawenforcement agencies• National priority with federalgovernment requirements• Potential for devastating impacts to lifeand infrastructure• Protection for the citizens of Florida andthe USAPotential to Initiate aRegional EvacuationYes, these incidents mayinitiate evacuations, but itis impossible to predictprecise location, extentand timing.MassMigration• Coordination with the US Citizensand Immigration Service (USCIS)• Data from local law enforcement• Historic precedence for migration toFlorida by boat• Large amounts of unpatrolled coastlinesNo; evacuation is not theproblem.For purposes of the Statewide Regional Evacuation Study, the potential evacuation from (1)Coastal storms and Hurricanes, (2) Inland / Riverine floods (including related potential for damfailure) and (3) Wildfires and the Urban Interface will be analyzed in detail.As indicated above, any evacuation initiated by a tsunami, terrorist event or a hazardousmaterial incident will have little or no warning. In addition, the location, scope and extent ofthe evacuation response therefore, are difficult to predict or model before the incident.Planning for those events, however, is ongoing at the state, regional and local levels. Theidentification of key infrastructure and facilities, vulnerable areas, response capabilities andmitigation strategies will be discussed in the hazards profile of each of these potential hazards.The hazards analysis shall identify the potential hazards to the region and shall includeinvestigations of:• General Information about each hazard (Hazards Profile);• History of activity in the region;• A geo-spatial analysis of the potential effects of the hazard, i.e., inundation areas, windfields, dam locations, urban interface, etc.The vulnerability analysis will then identify the following:• Human and social impacts including the identification of the population-at-risk, potentialshelter and mass care demand, evacuee behavioral assumptions and the vulnerability ofcritical facilities.• The potential for multiple hazard impacts such as the release of hazardous materials in awildfire or flooding event or security risks following a hurricane.Page II-4Regional Hazards Analysis
Statewide Regional Evacuation Studies ProgramVolume 1-11 South FloridaB. Coastal Storms and Hurricanes1. Coastal Storms / Hurricane Hazard ProfileA hurricane is defined as a weather system with a closedcirculation developing around a low pressure center over tropicalwaters. The winds rotate counterclockwise in the NorthernHemisphere (clockwise in the Southern Hemisphere). Tropicalstorms and hurricanes act as safety valves that limit the build up ofheat and energy in the tropical regions by maintaining theatmospheric heat and moisture balance between the tropics and the pole-ward latitudes. 2Tropical cyclones are named when their winds reach tropical storm strength (sustained 39mph).• Tropical Depression: The formative stages of a tropical cyclone in which themaximum sustained (1-minute mean) surface wind is
Volume 1-11 South FloridaStatewide Regional Evacuation Studies ProgramThis storm characteristic will be modeled to determine its impact on the ultimate stormsurge.Table II-2Saffir-Simpson Hurricane Wind ScaleCategoryCentral PressureMillibarsInchesWinds(mph)Damage Potential1 >980 >28.94 74-95 Damage primarily to trees & foliage, signs,unanchored mobile homes; flooding in lowlyingareas; minor pier damage; somesmall craft torn from moorings.2 965-979 28.50-28.913 945-964 27.91-28.4196-110 Considerable damage to foliage & trees;major damage to mobile homes, signs,roofing materials of buildings; windows;coastal roads and low-lying areas cut off byrising water; considerable damage to piersand marinas.111-130 Foliage torn from trees; large treesuprooted; signs down; roofing, windowand door damage; some structural damageto buildings. Mobile homes destroyed.Serious flooding at coast with structuresdamaged by battering waves and floatingdebris.Major Hurricanes4 920-944 27.17-27.88131-155 Shrubs and trees blown down; all signsdown. Extensive damage to roofingmaterials, windows and doors. Completeroof failure on many residences. Completedestruction of mobile homes. Majordestruction of coastal structures anderosion of beaches.5
Statewide Regional Evacuation Studies ProgramVolume 1-11 South Florida2. Hurricane HazardsThe five major hazards produced by a hurricane are the storm surge, high winds,tornadoes, rainfall (freshwater flooding)and the potential for hazardous materialincidents.17 FT. SURGE TIDEThe storm surge is the abnormal rise inwater level caused by the wind andpressure forces of a hurricane or tropicalstorm. Storm surge produces most of15 FT. SURGE 2 FT. NORMAL HIGH TIDEthe flood damage and drownings associated with storms that make landfall or that closelyapproach the coastline. Of the hurricane hazards, the storm surge is considered to be themost dangerous, as nine out of ten hurricane-related deaths are caused by drowning.The high winds also can have a devastating effect on persons outside, in mobile homes, inunsound, substandard structures or in structures with unprotected windows or glassexposures. An earlier study 3 concluded that while a fully-engineered multi-story structurecould withstand the storm surge of a major storm, without protection on the windows andother cladding, occupants within any structure would be at serious risk. This factor heldtrue for all types of structures exposed to sustained winds in excess of 115 mph. The windsof Hurricane Andrew (1992) caused major destruction in South Florida throwing theinsurance industry into a tailspin.Rainfall associated with hurricanes varies with hurricane size, forward speed and othermeteorological factors. The rainfall associated with a hurricane is from 6-12 inches onaverage, with higher amounts common. Freshwater flooding has not historically beenconsidered a life-threatening hazard. Over the past 20 years, however, freshwater floodinghas become the leading cause of death related to hurricanes. This is due in part to thesuccessful evacuation planning efforts in the United States, which significantly reduced thenumber of deaths (in the United States) related to storm surge. Hurricane Katrina tragicallyillustrated the danger of storm surge flooding in both Louisiana and Mississippi. However, itis also recognized that many coastal and inland residents do not recognize the riskassociated with freshwater flooding, especially when driving. In response, a nationalprogram “Turn Around, Don’t Drown” was implemented in 2002. The freshwater floodingassociated with a hurricane may also inundate potential evacuation routes and preventpeople from evacuating areas vulnerable to storm surge. Flooded roads and storm drainsresulted in fatal accidents in the Bay Area in the 1982 No-Name Storm and in flooding inSeptember 1988. Hillsborough County experienced excessive flooding in 1988 when I-4near Plant City was cut off for several days and numerous residences were flooded.Hurricanes can also produce tornadoes that add to the storm's destructive power.Tornadoes are most likely to occur in the right front quadrant of the hurricane, but they arealso often found elsewhere embedded in the rain bands, well away from the center of thehurricane. Some hurricanes seem to produce no tornadoes, while others develop multipleones. Studies have shown that more than half of the landfalling hurricanes produce at least3 Hurricane Shelter Alternative Study, Tampa Bay Regional Planning Council (TBRPC) and United StatesArmy Corps of Engineers (USACOE), 1986Regional Hazards AnalysisPage II-7
Statewide Regional Evacuation Studies ProgramVolume 1-11 South FloridaThe proficiency of the Sea, Lake and Overland Surges from Hurricane (SLOSH) model hasbeen evaluated (Jarvinin and Lawrence, 1985) through a comparative analysis of modeledand observed surges at 523 sites during 10 hurricanes. The mean absolute error in surgeheight calculations by SLOSH was 1.4 feet. Although the error range was from -7.1 feet to+8.8 feet, the standard deviation was only 2.0 feet and 79 percent of the errors lay withinone standard deviation of the mean error, -0.3 feet. On average, modeled values wereslightly less than observed.a. Hypothetical Storm SimulationsSurge height partly depends on the distance between the location of a particular siteand the storm's center. The SLOSH model was used to develop data for variouscombinations of hurricane strength, wind speed, and direction of movement. Stormstrength was modeled using the central pressure (defined as the difference between theambient sea level pressure and the minimum value in the storm's center), the storm eyesize and the radius of maximum winds using the five categories of hurricane intensity asdepicted in the Saffir-Simpson Hurricane Scale (see Table II-2), plus a hypotheticaltropical storm intensity.The modeling for each hurricane category was conducted using the mid-range pressuredifference (p, millibars) for that category. The model also simulates the storm filling(weakening upon landfall) and radius of maximum winds (RMW) increase.SLOSH modeling for South Florida includes two separate basins: Biscayne Bay (forMiami-Dade and Broward) and Florida Bay (for Monroe).Ten storm track headings (E, ENE, NE, NNE, N, NNW, NW, WNW, W, and WSW) wereselected as being representative of storm behavior in the South Florida region, based onobservations by forecasters at the National Hurricane Center. Additional inputs into themodel included depths of water offshore, and the heights of the terrain and barriersonshore (all measurements were made relative to NAVD88). In total, 14,700 runs weremade for Biscayne Bay Basin, and 13,620 runs were made for Florida Bay Basin,consisting of the different parameters shown in Tables II-3a and II-3b.Regional Hazards AnalysisPage II-9
Volume 1-11 South FloridaStatewide Regional Evacuation Studies ProgramTable II-3aBiscayne Bay Basin Hypothetical Storm ParametersDirectionSpeeds (mph)Size (Radius ofMaximum winds) Intensity Tides Tracks RunsE 5, 15, 25 mph 30-mile, 45-mile 1 through 5 Mean/High 28 1,680ENE 5, 15, 25 mph 30-mile, 45-mile 1 through 5 Mean/High 27 1,620NE 5, 15, 25 mph 30-mile, 45-mile 1 through 5 Mean/High 22 1,320NNE 5, 15, 25 mph 30-mile, 45-mile 1 through 5 Mean/High 19 1,140N 5, 15, 25 mph 30-mile, 45-mile 1 through 5 Mean/High 21 1,260NNW 5, 15, 25 mph 30-mile, 45-mile 1 through 5 Mean/High 23 1,380NW 5, 15, 25 mph 30-mile, 45-mile 1 through 5 Mean/High 28 1,680WNW 5, 15, 25 mph 30-mile, 45-mile 1 through 5 Mean/High 25 1,500W 5, 15, 25 mph 30-mile, 45-mile 1 through 5 Mean/High 26 1,560WSW 5, 15, 25 mph 30-mile, 45-mile 1 through 5 Mean/High 26 1,560TOTAL 14,700Table II-3bFlorida Bay Basin Hypothetical Storm ParametersDirectionSpeeds (mph)Size (Radius ofMaximum winds) Intensity Tides Tracks RunsE 5, 15, 25 mph 30-mile, 45-mile 1 through 5 Mean/High 21 1,260ENE 5, 15, 25 mph 30-mile, 45-mile 1 through 5 Mean/High 21 1,260NE 5, 15, 25 mph 30-mile, 45-mile 1 through 5 Mean/High 24 1,440NNE 5, 15, 25 mph 30-mile, 45-mile 1 through 5 Mean/High 27 1,620N 5, 15, 25 mph 30-mile, 45-mile 1 through 5 Mean/High 28 1,680NNW 5, 15, 25 mph 30-mile, 45-mile 1 through 5 Mean/High 24 1,440NW 5, 15, 25 mph 30-mile, 45-mile 1 through 5 Mean/High 22 1,320WNW 5, 15, 25 mph 30-mile, 45-mile 1 through 5 Mean/High 21 1,260W 5, 15, 25 mph 30-mile, 45-mile 1 through 5 Mean/High 21 1,260WSW 5, 15, 25 mph 30-mile, 45-mile 1 through 5 Mean/High 18 1,080TOTAL 13,620Page II-10Regional Hazards Analysis
Statewide Regional Evacuation Studies ProgramVolume 1-11 South Floridab. The Grids for SLOSH Models for Biscayne Bay and Florida BayFigure II-1a illustrates the area coveredby the grid for the Biscayne Bay Sea, Lakeand Overland Surges from Hurricane(SLOSH) Model. To determine the surgevalues the SLOSH model uses atelescoping elliptical grid as its unit ofanalysis with 124 arc lengths (1< I < 124)and 189 radials (1< J < 189). Use of thegrid configuration allows for individualcalculations per grid square, which isbeneficial in two ways: (1) it providesincreased resolution of the storm surge atthe coastline and inside the harbors, baysand rivers, while decreasing the resolutionin the deep water where detail is not asimportant; and (2) it allows economy incomputation. The grid size for theBiscayne Bay Model varies fromapproximately 0.02 square mile or 19acres closest to the pole (i = 1) to thegrids on the outer edges where each gridis approximately 4.83 square miles.Figure II-1aSLOSH Grid – Biscayne BayFigure II-1b illustrates the area covered by the grid for the Florida Bay SLOSH Model.The telescoping elliptical grid for Florida Bay had 169 arc lengths (1< I < 169) and 199radials (1< J < 199). Thegrid size for the Florida BayModel varies fromapproximately 0.03 squaremile or 19 acres closest tothe pole (i = 1) to the gridson the outer edges whereeach grid is approximately2.85 square miles.Figure II-1bSLOSH Grid – Florida BayRegional Hazards AnalysisPage II-11
Volume 1-11 South FloridaStatewide Regional Evacuation Studies Programc. Storm Scenario DeterminationsAs indicated, the SLOSH model is the basisfor the "hazard analysis" portion of coastalhurricane evacuation plans. Thousands ofhypothetical hurricanes are simulated withvarious Saffir-Simpson Wind categories,forward speeds, landfall directions, andlandfall locations. An envelope of high watercontaining the maximum value a grid cellattains is generated at the end of each modelrun. These envelopes are combined by theNHC into various composites which depict thepossible flooding. One useful composite isthe MEOW (Maximum Envelopes of Water),which incorporates all the envelopes for aparticular category, speed and landfalldirection. Once surge heights have beendetermined for the appropriate grids, themaximum surge heights are plotted by stormtrack and tropical storm/hurricane category.These plots of maximum surge heights for agiven storm category and track are referredto as Maximum Envelopes of Water(MEOWs). The MEOWs, or ReferenceHurricanes, can be used in evacuationdecision-making when and if sufficientforecast information is available to projectstorm track or type of storm (differentlandfalling, paralleling or exiting storms).Figure II-2a: Biscayne BaySLOSH Grid with surge valuesThe MEOWs provide information to theemergency managers in evacuation decisionmaking.However, in order to determine ascenario which may confront the county in ahurricane threat 24-48 hours before a stormis expected, a further compositing of theMEOWs into Maximums of the Maximums(MOMs) is usually required.The MOM (Maximum of the MEOWs)combine all the MEOWs of a particularcategory. The MOMs represent the maximumFigure II-2b: Florida BaySLOSH Grid with surge valuessurge expected to occur at any given location, regardless of the specific stormtrack/direction of the hurricane. The only variable is the intensity of the hurricanerepresented by category strength (Category 1-5).Page II-12Regional Hazards Analysis
Statewide Regional Evacuation Studies ProgramVolume 1-11 South FloridaThe MOM surge heights, which were furnished by the National Hurricane Center, havetwo values, mean tide and high tide. Mean tide has 0’ tide correction. High tide has a1’ tide correction added to it. All elevations are now referenced to the NAVD88 datum.These surge heights were provided within the SLOSH grid system as illustrated onFigure II-2a for the Biscayne Bay Basin, and in Figure II-2b for the Florida Bay Basin.The range of maximum surge heights for each county in the region based upon themodel is provided for each category of storm in Table II-4. It should be noted againthat these surge heights represent the maximum surge height recorded in the county,including inland and back bay areas where the surge can be magnified dependent uponstorm parameters.Table II-4Potential Tide Height** by County(in feet above NAVD88)*Storm Strength Broward Miami-Dade MonroeCategory 1 Up to 3.1' Up to 5.0' Up to 7.9'Category 2 Up to 4.7' Up to 8.2' Up to 12.2'Category 3 Up to 6.2' Up to 11.4' Up to 16.4'Category 4 Up to 8.3' Up to 14.2' Up to 20.0'Category 5 Up to 9.5' Up to 16.5' Up to 23.3'*Based on the category of storm on the Saffir-Simpson Hurricane Wind Scale** Surge heights represent the maximum values from SLOSH MOMsd. Determining Storm Surge Height and Flooding DepthSLOSH and SLOSH-related products reference storm surge heights relative to the modelvertical datum, in this case NAVD88. In order to determine the inundation depth ofsurge flooding at a particular location, the ground elevation (relative to NAVD88) at thatlocation must be subtracted from the potential surge height. It is important to note thatone must use a consistent vertical datum when post-processing SLOSH storm surgevalues.Surge elevation, or water height, is the output of the SLOSH model. At each SLOSH gridpoint, the water height is the maximum value that was computed at that point. Withthe new SLOSH Model, water height is calculated relative to mean sea level data inNAVD88.Within the SLOSH model an average elevation is assumed within each grid square.Height of water above terrain was not calculated using the SLOSH average gridelevation because terrain height may vary significantly within a SLOSH grid square. Forexample, the altitude of a 1-mile grid square may be assigned a value of 1.8 meters (6feet), but this value represents an average of land heights that may include valuesranging from 0.9 to 2.7 meters (3 to 9 feet). In this case, a surge value of 2.5 metersRegional Hazards AnalysisPage II-13
Volume 1-11 South FloridaStatewide Regional Evacuation Studies Program(8 feet) in this square would imply a 0.7 meters (2 feet) average depth of water overthe grid’s terrain. However, in reality within the grid area, a portion of the grid would be“dry” and other parts could experience as much as 1.5 meters (5 feet) of inundation.Therefore, in order to determine the storm tide limits, the depth of surge flooding abovethe terrain at a specific site in the grid square is the result of subtracting the terrainheight determined by remote sensing from the model-generated storm surge height inthat grid square. 4As part of the Statewide Regional Evacuation Study Program, all coastal areas, as wellas areas surrounding Lake Okeechobee, were mapped using laser terrain mapping(LIDAR 5 ), providing the most comprehensive, accurate and precise topographic data forthis analysis. As a general rule, the vertical accuracy of the laser mapping is within a 15centimeter tolerance. However, it should be noted that the accuracy of these elevationsis limited to the precision and tolerance in which the horizontal accuracy for any givenpoint is recorded. Other factors such as artifact removal algorithms (that removebuildings and trees) can affect the recorded elevation in a particular location. For thepurposes of this study, the horizontal accuracy cannot be assumed to be greater thanthat of a standard United States Geological Survey (USGS) 7.5-minute quadrangle map,or a scale of 1:24,000.The storm tide limits based on the SLOSH MOMs have been determined using themethodology described above, mapped and published in Volume 7 – Storm Tide Atlas.e. Variations to ConsiderVariations between modeled versus actual measured storm surge elevations are typicalof current technology in coastal storm surge modeling. In interpreting the data,emergency planners should recognize the uncertainties characteristic of mathematicalmodels and severe weather systems such as hurricanes. The storm surge elevationspresented in the Storm Tide Atlas should be used as guideline information for planningpurposes.(1) Storm Surge and Wave HeightRegarding interpretation of the data, it is important to understand that theconfiguration and depth (bathymetry) of the ocean bottom will have a bearing onsurge and wave heights. A narrow shelf, or one that drops steeply from theshoreline and subsequently produces deep water in close proximity to the shoreline,tends to produce a lower surge but a higher and more powerful wave. Other areas,like the Gulf Coast of Florida, that have a gently sloping shelf and shallower normalwater depths, can expect a higher surge but smaller waves. The reason this occursis because a surge in deeper water can be dispersed down and out away from thehurricane. However, once that surge reaches a shallow, gently sloping shelf it canno longer be dispersed away from the hurricane; consequently water “piles up” as itis driven ashore by the wind stresses of the hurricane. Wave height is NOT4 Note: This represents the regional post-processing procedure. When users view SLOSH output withinthe SLOSH Display Program, the system still uses average grid cell height when subtracting land.5 Light Imaging Detection and RangingPage II-14Regional Hazards Analysis
Statewide Regional Evacuation Studies ProgramVolume 1-11 South Floridacalculated by the Sea, Lake and Overland Surges from Hurricane (SLOSH) model andis not reflected within the storm tide delineations.(2) Forward SpeedUnder actual storm conditions, it may be expected that a hurricane moving at aslower speed could have higher coastal storm surges than those depicted frommodel results. At the same time, a fast-moving hurricane would have less time tomove storm surge water up river courses to more inland areas. As an example, aminimal hurricane or a storm further off the coast such as Hurricane Elena (1985),which stalled 90 miles off the Tampa Bay coast for several tidal cycles, could causeextensive beach erosion and move large quantities of water into interior lowlandareas. In the newest version of the SLOSH model, for each set of tracks in a specificdirection, storms were run at forward speeds of 5, 15 and 25 mph.(3) Radius of Maximum WindsAs indicated previously, the size of the storm or radius of maximum winds (RMW)can have a significant impact on storm surge especially in bay areas and along theGulf of Mexico. All of the hypothetical storms were run at two different sizes, 30statute mile radius of maximum winds and 45 statute mile radius of maximum winds.(4) Astronomical TidesSurge heights were provided for both mean tide and high tide. Both tide levels arereferenced to North American Vertical Datum of 1988 (NAVD88).f. Storm Tide AtlasThe surge inundation limits (MOM surge heights minus the ground elevations) areprovided as GIS shape files and graphically displayed on maps in the hurricane StormTide Atlas for the South Florida region. The Atlas was prepared by the South FloridaRegional Planning Council under contract to the State of Florida, Division of EmergencyManagement, as part of this study effort. The maps prepared for the Atlas consist ofbase maps (1:24000) including topographic, hydrographic and highway files (updatedusing 2008 county and state highway data). Detailed shoreline and storm tide limits foreach category of storm were determined using the region's geographic informationsystem (GIS). Figure II-3 presents a compilation of the Storm Tide Atlas for the region.g. Factors Influencing Model AccuracyThe purpose of the maps contained in this Atlas is to reflect a “worst probable” scenarioof the hurricane storm surge inundation and to provide a basis for the hurricaneevacuation zones and study analyses. While the storm tide delineations include theaddition of an astronomical mean high tide and tidal anomaly, it should be noted thatthe data reflects only stillwater saltwater flooding. Local processes such as waves,rainfall and flooding from overflowing rivers, are usually included in observations ofstorm surge height, but are not surge and are not calculated by the SLOSH model. It isRegional Hazards AnalysisPage II-15
Volume 1-11 South FloridaStatewide Regional Evacuation Studies Programincumbent upon local emergency management officials and planners to estimate thedegree and extent of freshwater flooding, as well as to determine the magnitude of thewaves that will accompany the surge.Page II-16Regional Hazards Analysis
Statewide Regional Evacuation Studies ProgramVolume 1-11 South FloridaFigure II-3aSouth Florida Region Storm Tide MapBiscayne Bay BasinRegional Hazards AnalysisPage II-17
Volume 1-11 South FloridaStatewide Regional Evacuation Studies ProgramPage II-18Regional Hazards Analysis
Statewide Regional Evacuation Studies ProgramVolume 1-11 South Florida4. Hurricane Wind AnalysisAs discussed previously, hurricane winds are a devastating elementof the hurricane hazard. Based on the Saffir-Simpson HurricaneWind Scale (see Table II-2), hurricane force winds range fromsustained winds of 74 mph to more than 155 mph.The intensity of a landfalling hurricane is expressed in terms ofcategories that relate wind speeds and potential damage.According to the Saffir-Simpson Hurricane Wind Scale, a category 1hurricane has lighter winds compared to storms in highercategories. A category 4 hurricane would have winds between131 and 155 mph and, on average, would usually be expected tocause 100 times the damage of the category 1 storm. Depending on circumstances,less intense storms may still be strong enough to produce damage, particularly in areas thathave not prepared in advance.Tropical storm force winds are strong enough to be dangerous to those caught in them. Forthis reason emergency managers plan on having their evacuations complete and theirpersonnel sheltered before the onset of tropical storm force winds, not hurricaneforce winds.Hurricane force winds can easily destroy poorly constructed buildings and mobile homes.Debris such as signs, roofing material, and small items left outside become flying missiles inhurricanes. Extensive damage to trees, towers, water and underground utility lines (fromuprooted trees), and fallen poles cause considerable disruption.High-rise buildings are also vulnerable to hurricane force winds, particularly at the higherlevels, since wind speed tends to increase with height. Recent research suggests youshould stay below the tenth floor, but still above any floors at risk for flooding. It is notuncommon for high-rise buildings to suffer a great deal of damage due to windows beingblown out. Consequently, the areas around these buildings can be very dangerous.The strongest winds usually occur in the right side of the eyewall of the hurricane. Windspeed usually decreases significantly within 12 hours after landfall. Nonetheless, windscan stay above hurricane strength well inland. Hurricane Hugo (1989), for example,battered Charlotte, North Carolina (which is 175 miles inland) with gusts to nearly 100 mph.Tropical Storm Fay turned northeastward on August 19, 2008, making landfall early that dayon the southwestern coast of the Florida peninsula at Cape Romano with maximum winds of60 mph. Even after moving inland, Fay strengthened, exhibiting what resembled a classicaleye in radar and satellite imagery, and it reached its peak intensity of about 65 mph as itpassed over the western shores of Lake Okeechobee. During August 20-23 however, Faycontinued interaction with the landmass of northern Florida causing the cyclone to weakenslightly. Fay’s maximum winds remained 50-60 mph during most of that period.Several key factors should be remembered about wind speeds. First, there is evidence thatgusts rather than sustained winds cause the majority of damage associated with severeweather. The methodology described above does not specifically address wind gusts anddoes not address building codes/standards or construction practices.Regional Hazards AnalysisPage II-19
Volume 1-11 South FloridaStatewide Regional Evacuation Studies Programa. Wind Risk Assessment: Inland Wind ModelThe Inland High Wind Model can be used by emergency managers to estimate howfar inland strong winds extend. The inland wind estimates can only be made shortlybefore landfall when the windfield forecast errors are relatively small. This informationis most useful in the decision-making process to decide which people might be mostvulnerable to high winds at inland locations.Onshore winds at the coast will decrease as the storm system moves across the land asa result of friction characteristics. The National Hurricane Center has developedadjustment ratios to account for this effect. In addition, as the wind path continuesaround the storm, further reduction in wind speed occurs until equilibrium is reached orthe wind path again crosses the coast to an open water area. The onshore and offshorewinds are assumed to reach equilibrium after being over any underlying friction surfacea distance of 10 nautical miles.There are four friction categories defined as follows:1. Open water2. Awash – normally dry ground with tree or shrub growth, hills or dunes (noninundatedfrom storm surge)3. Land – relatively flat non-inundated terrain or buildings4. Rough terrain – major urban areas, dense forests, etc.The graph below (Figure II-4) shows how wind speed rapidly decreases once a tropicalcyclone reaches land. Part of the reason for this is that the roughness of the terrainincreases friction, slowing the air. Another reason is that, once the storm is over land, itis usually cut off from the heat and moisture sources that sustain it. However, windgusts (as opposed to the sustained winds shown in the graph) may actually increasebecause the greater turbulence over land mixes faster air to the surface in short bursts.The graph shows that thesustained winds in a hurricane willdecrease at a relatively constantrate (approximately half the windspeed in the first 24 hours).Therefore, the faster the forwardspeed of a landfalling hurricane,the further the inland penetrationof hurricane force winds.Figure II-4: Inland Wind DecaySource:www.nhc.noaa.gov/HAW2/english/wind/wind_decay.shtmlPage II-20Regional Hazards Analysis
Statewide Regional Evacuation Studies ProgramVolume 1-11 South FloridaThe inland wind model was developed by Mark DeMaria (NOAA/NWS/TPC) and JohnKaplan (NOAA/AOML/HRD). 6 The model applies a simple two parameter decay equationto the hurricane wind field at landfall to estimate the maximum sustained surface windas a storm moves inland. This model can be used for operational forecasting of themaximum winds of landfalling tropical cyclones. It can also be used to estimate themaximum inland penetration of hurricane force winds (or any wind threshold) for agiven initial storm intensity and forward storm motion.A model wind field, which illustrates the combined wind profiles from hurricanes strikingthe coast at different locations, has been developed for each category of hurricane andforward speed of the storm system. It demonstrates the potential wind speeds atdifferent locations based upon a “maximum of wind” analysis. 7 Figures II-8 and II-9illustrate the Maximum Inland Extent of Winds for Hurricanes Approaching theGulf and East Coasts, respectively, from any direction. Looking at the resultsdown the table by hurricane category, the increase in winds is highlighted.By reviewing the results across the table, the dramatic impact of the forwardspeed on the wind is apparent. (Map source:www.nhc.noaa.gov/aboutmeow.shtml.)6 Kaplan, J., DeMaria, M., 1995: A Simple Empirical Model for Predicting the Decay of Tropical CycloneWinds After Landfall. J. App. Meteor., 34, No. 11, 2499-2512.7 One storm alone will not produce the following inland winds. This is the combination of multiplestorm tracks and is for planning purposes.Regional Hazards AnalysisPage II-21
Volume 1-11 South FloridaStatewide Regional Evacuation Studies ProgramC Figure II-5: Maximum Inland Extent of Winds for Hurricanes Approaching the Gulf Coastat Forward Speed – 8 kts Forward Speed – 12 kts Forward Speed – 24 kts12345Page II-22Regional Hazards Analysis
Statewide Regional Evacuation Studies ProgramVolume 1-11 South FloridaC Figure II-6: Maximum Inland Extent of Winds for Hurricanes Approaching the East Coastat Forward Speed – 8 kts Forward Speed – 12 kts Forward Speed – 24 kts12345Regional Hazards AnalysisPage II-23
Volume 1-11 South FloridaStatewide Regional Evacuation Studies Programb. Wind Risk Assessment: Florida Building CodeIn March of 2002, a Statewide Building Code was fully adopted and implemented inFlorida. A critical element of that new building code was the adoption of stricter buildingstandards based on wind hazard associated with hurricanes. To establish variablebuilding standards for locales throughout Florida, the American Society of CivilEngineer’s Standard 7 for 1998 (ASCE 7-98) was adopted. The ASCE 7-98 provideswind risk assessments for areas throughout Florida, along with associated buildingstandards (see Figure II-7).Figure II-7 ASCE 7-98 Wind ZonesSource:FBC: Florida Building Code 2001, Chapters 2, 16, 17, & 22ASCE 7-98: “Minimum Design Loads for Buildings and Other Structures”, by American Society of CivilEngineers.Page II-24Regional Hazards Analysis
Statewide Regional Evacuation Studies ProgramVolume 1-11 South Floridac. Wind Risk Assessment: Hazards US Multi-Hazard (HAZUS-MH)HAZUS-MH also includes a vulnerability analysis incorporating other factors such ashousing stock, vegetation and friction coefficients based on land cover. Figure II-8provides a Level 1 wind risk assessment using this tool.5. TornadoesIn general, tornadoes associated with hurricanes are less intense than those that occur inthe Great Plains (see the Enhanced Fujita-Pearson Intensity Scale below).Nonetheless, the effects of tornadoes, added to storm surge and inland flooding and thelarger area of hurricane force winds, can produce substantial damage.Sixty-nine percent of all tornadoes are weak tornadoes, EF0-EF2 sizes. Twenty-nine percentof all tornadoes are strong and can last 20 minutes or longer. Two percent of all tornadoesfall into the EF-4 and EF-5 categories. The most powerful tornadoes are spawned by whatare called supercell thunderstorms. These are storms that, under the right conditions, areaffected by horizontal wind shears (winds moving in different directions at differentaltitudes.) These wind shears cause horizontal columns of air to begin to rotate the storm.This horizontal rotation can be tilted vertically by violent updrafts, and the rotation radiuscan shrink, forming a vertical column of very quickly swirling air. This rotating air caneventually reach the ground, forming a tornado. We have no way at present to predictexactly which storms will spawn tornadoes or where they will touch down. The Dopplerradar systems have greatly improved the forecaster's warning capability, but the technologyusually provides lead times from only a few minutes up to about 30 minutes. Consequently,early warning systems and preparedness actions are critical.Regional Hazards AnalysisPage II-25
Volume 1-11 South FloridaStatewide Regional Evacuation Studies ProgramPage II-26Regional Hazards Analysis
Statewide Regional Evacuation Studies ProgramVolume 1-11 South FloridaTable II-5Enhanced Fujita-Pearson Tornado Intensity ScaleThe Enhanced F-scale is a set of wind estimates (not measurements) based on damage. It usesthree-second gusts estimated at the point of damage based on a judgment of 8 levels of damage(listed at www.spc.noaa.gov/faq/tornado/efscale.html). These estimates vary with height andexposure. Important: The 3-second gust is not the same wind as in standard surface observations.Standard measurements are taken by weather stations in open exposures, using a directly measured,"one minute mile" speed.• EF0 Gale Tornado 65-85 mphSome damage to chimneys. Tree branches broken off. Shallow rooted trees uprooted.• EF1 Moderate Tornado 86-110 mphPeels surface off roofs. Mobile homes overturned. Moving autos pushed off roads.• EF2 Significant Tornado 111-135 mphConsiderable damage. Roofs torn off frame houses. Large trees snapped or uprooted.Light-object missiles generated.• EF3 Severe Tornado 126-165 mphSevere damage. Roofs and some walls torn off well-constructed homes. Trainsoverturned. Most trees in forests uprooted. Heavy cars lifted off ground.• EF4 Devastating Tornado 166-200 mphWell-constructed houses leveled. Structures with weak foundations blown off somedistance. Cars thrown and large missiles generated.• EF5 Incredible Tornado over 200 mphStrong frame houses lifted off foundations and disintegrated. Automobile-sized missilesfly through the air in excess of 100 mph. Trees debarked.Regional Hazards AnalysisPage II-27
Volume 1-11 South FloridaStatewide Regional Evacuation Studies Program6. Hazardous MaterialsLike Murphy’s Law, sometimes one emergency event can trigger another. Facilities thatgenerate or store quantities of potentially hazardous materials, propane storage facilities,natural gas pipeline terminals, fuel storage facilities and tank farms all pose an additionalpotential threat in a hurricane. Identifying the location of these facilities is important to (1)provide additional information to facility managers to secure their operation and protect theemployees, facility and inventory before the storm, and (2) assist emergency responders insafe re-entry into areas after the storm has passed. It may also serve to identify wheremitigation strategies should be implemented to reduce the risk to resident and theenvironment.The Hazard Materials Information System (HMIS) database was accessed to identify thecurrent Extremely Hazardous Substances (EHS) facilities – also known as Section 302facilities – in the South Florida Region. The geo-coded inventory of the Section 302 facilitiesis included in the Critical Facility Inventory Data Base. A regional Map that illustratesthe vulnerability of all Section 302 facilities is included on Figure II-18. The inventory andvulnerability assessments are considered For Official Use Only (FOUO) and are not availableto the public for security reasons.Evacuation for Hazardous Material incidents will be discussed later in the chapter.Page II-28Regional Hazards Analysis
Statewide Regional Evacuation Studies ProgramVolume 1-11 South Florida7. Freshwater Flooding and the Inundation of Evacuation RoutesInland riverine and freshwater flooding often becomes a significant factor as a result oftropical storms and hurricanes. Typically the rainfall associated with, and in advance of, ahurricane does not in itself necessitate the emergency evacuation of residents during thepassage of a hurricane, unlike storm surge. Following a storm however, the coastal floodingand rainfall – particularly from slow-moving storms – necessitates an evacuation of floodedinland residents days after, as swollen rivers and streams breach their bank or levees.As noted previously, due to Tropical Storm Fay’s very slow motion, total storm rainfallamounts in some areas were staggering, including a few locations in east-central Floridathat received more than two feet of rain. Fay's rain-induced floods caused significantdamage and were directly responsible for numerous deaths in the Dominican Republic, Haitiand Florida (www.nhc.noaa.gov).Inland flooding will be discussed later in the chapter as a separate hazard. For hurricaneevacuation, however, rainfall may cause the early inundation of roadways used asevacuation routes by vehicles attempting to escape from areas vulnerable to theapproaching storm surge. In addition, given Florida climatology and the normal summerweather, flooding may occur as a disassociated event prior to the hurricane, floodingevacuation routes and saturating the ground.Those roadways known historically to be vulnerable from freshwater flooding have beenidentified by the county and municipal emergency management, law enforcement andemergency response personnel. In South Florida, US 41, connecting Miami-Dade County toCollier County, and Card Sound Road, one of two routes connecting the Florida Keys to themainland, are both subject to flooding during storm events. These routes, including thosewhich were inundated or forced to close during recent flooding events, are presented onmaps in Appendices IV-A, IV-B and IV-C.Contingency plans including rerouting, sandbagging and pumping will be coordinated withlocal and state law enforcement and the Florida Department of Transportation. The impactsof road closures, rain and ambient conditions on evacuation times are addressed in thetransportation analysis.Rainwater inundation of evacuation routes must be addressed in an evacuation plan. Theplanning strategy to address this problem is to plan for the passage of all vehicles over suchroadways before substantial rainfall from the hurricane was expected to arrive. Hourlyrecords of rainfall rates and accumulation for past hurricanes indicate that rates highenough to surpass drainage capabilities normally parallel in time the arrival of sustainedtropical storm force winds. Using this as an assumption of the timing of freshwater roadwayinundation, the pre-landfall hazards time quantification for sustained tropical storm forcewinds will also compensate for early rainfall inundation of evacuation routes.Regional Hazards AnalysisPage II-29
Volume 1-11 South FloridaStatewide Regional Evacuation Studies Program8. History of Hurricanes in the South Florida RegionHurricanes are a natural yet very dangerous phenomenon, one for which the South FloridaRegion must always be prepared. Packing 74-200 mph winds and a storm surge that canexceed 23 feet in the South Florida Region, hurricanes represent a serious threat to thesafety of residents and visitors and the economic health of this metropolitan region.Emergency management and atmospheric scientists agree that global weather patternshave moved back into a period of increased tropical storm activity and of increasedfrequency of major hurricanes, a category 3 or higher on the Saffir-Simpson Hurricane Scale(see Table II-2), particularly in the state of Florida. An analysis of hurricane activity sincethe 1920s demonstrates that hurricane activity appears cyclical and that, after a period ofrelative inactivity since the early 1960's, the state of Florida and the South Florida Regionare in a more active period.Until the 1840s, Florida hurricanes were only experienced in the cities and ports along theeast coast, the northwest panhandle and the Florida Keys. But the new settlements alongthe southwest coast soon began to confront devastating hurricanes. In 1848, the “smallvillage” of Tampa was hit by a major hurricane causing the tide in the bay to rise fifteenfeet above normal. The massive flood completely inundated Fort Brooke as well as thestores and homes along Tampa Bay.During the period 1875-1997, 77 hurricanes struck the state of Florida. Historians identify aflurry of major hurricane activity in the late 20s, the 1930s and 1940s. The 1920s wereforever marked with tragedy. There was the devastating hurricane in 1926 that madelandfall in Miami and the 1928 storm, which caused the banks of Lake Okeechobee to rise15 feet and drown 1,200 people. The September 1926 hurricane is the most costlyhurricane in U.S. history. The hurricane of September 1928 remains Florida’s “singlegreatest tragedy,” with an official death toll of 2,500 (Barnes, 1998 and Blake, 2007).Florida and the Gulf coast states were hit hard in the 1930s by both the Great Depressionand hurricanes. Many seniors still remember the horrifying storm of 1935 that swept acrossthe Florida Keys killing 400 people.In the 1940s, Florida was the target of seven major hurricanes. The October 18-19, 1944hurricane, later known as the Havana-Florida hurricane, tracked over the Dry Tortugas afterdestroying entire villages in Cuba and Grand Cayman Island. Warnings from the newweather forecast office, which later would become the National Hurricane Center, helped toevacuate low-lying areas along the coast, and were credited with saving many lives. Thestorm was extremely large and felt over much of the state as it moved up the Gulf coastand inland near Sarasota. Tampa and Orlando reported wind gusts over 100 mph andMiami experienced winds of 65 mph.While not a major hurricane when it made landfall on the Florida coast near Bradenton, thehurricane of October 7, 1946, caused significant damage (approximately $5 million),especially to Florida’s citrus crop. In 1950, Hurricane Easy parked itself over the west coastof Florida, drenching residents with record-breaking rains. “Its remarkable double-loopPage II-30Regional Hazards Analysis
Statewide Regional Evacuation Studies ProgramVolume 1-11 South Floridatrack caused it to strike the same region of the Florida coast (Tampa Bay) twice in the sameday!” According to an Associated Press report, “Tides from six and a half to eight feetabove normal swept the pretty resort area from Clearwater to Sarasota, washing out roads,toppling beachfront houses, sinking a few small boats, putting a tug in distress and pilingsea water like lakes around homes and hotels.” (Barnes, 1999)In the 1950s, the pattern shifted with hurricanes directing their fury on the eastern Atlanticcoast. Hurricane Donna (1960) was the only major hurricane to make landfall in Florida in adecade. The brunt of the hurricane was felt in the Keys, Collier and Lee counties; however,gusts were recorded at 120 mph in Manatee County.In the 1960s and 1970s, hurricane activity was decreased and concentrated along thewestern Gulf coast of Texas, Louisiana and Mississippi. Even with hurricanes David (aglancing blow along the east coast) and Frederic (the most costly hurricane up to that time)– both of which made landfall in 1979 – the 1970s still had the lowest number of hurricanes(12) and the lowest number of major hurricanes (4) to make landfall in the United States ofany decade in the twentieth century (Barnes, 1999). Meanwhile the state and the regionwere experiencing explosive population growth along the coast.In the 1980s, the state of Florida was spared the direct hit of a major hurricane, although1985 had the most named storms to hit the U.S. since 1916 – a total of six hurricanes andtwo tropical storms. “During the 1985 season, at one time or another, some portion ofevery coastal state from Texas to Maine was placed under a hurricane warning.” (Barnes,1999).On Labor Day weekend 1985, Hurricane Elena threatened the Tampa Bay region andapproached within 80 miles of the coast. Evacuations in Louisiana, Mississippi, Alabama andFlorida were of unprecedented proportions. Almost a million residents and visitors wereaffected in the initial evacuation orders in the Florida panhandle and coastal region ofAlabama, Mississippi and Louisiana. Then, as the storm turned and the warnings shifted,ten additional Florida counties including those in Tampa Bay were ordered to evacuate. Thethreat of Elena initiated an evacuation that forced over 500,000 to leave vulnerable areas inthe Tampa Bay region and seek shelter. Many sought shelter in the homes of friends andrelatives in inland areas of Florida and Georgia. Others went to hotels and motels, fillingevery room (and lobby) in the state, particularly along the I-75 and I-4 corridors. Morethan 300,000 sought public shelter in the Tampa Bay Region alone, one of the largestevacuations and shelter operations in U.S. history. After stalling off the coast for two days,Hurricane Elena turned toward the Florida Panhandle again, forcing the evacuation ofthousands of coastal residents just returning after the earlier round of evacuations,ultimately making landfall near Biloxi, Mississippi.Although Hurricane Elena remained more than 80 miles offshore, Elena did produce gustywinds up to 80 mph and constant rainfall. While sustained hurricane-force winds (>74mph) were not experienced in the region, over $118 million in damage was caused inPinellas County, mostly by the 6-7 foot storm surge, which hammered the coastal areasalong the Gulf and Tampa Bay.Regional Hazards AnalysisPage II-31
Volume 1-11 South FloridaStatewide Regional Evacuation Studies ProgramIn the 1985 season, Hurricane Kate, a rare landfalling November storm, was considered thefirst direct hit of a hurricane in Florida in ten years (Eloise, 1975).The 1990's went down in history as an extremely costly and deadly decade of hurricaneactivity. The last decade of the millennium brought several flooding events, includingTropical Storm Josephine (1996) and the 1998 evacuation from Hurricane Georges.Hurricane Andrew struck the east coast near Homestead on August 24, 1992 andHurricane Opal struck the panhandle in 1995, two costly storms. Hurricane Mitch (1998)made landfall in Honduras and killed tens of thousands.Hurricane Andrew affected the entire state in many ways. Only two other hurricanes inhistory, both category 5 storms – the Labor Day storm of 1935 and Camille in 1969 – werestronger than Hurricane Andrew when they made landfall in the United States. It struckSouth Florida with a storm surge of over 16 feet and winds that gusted over 175 mph. Thescale of the disaster was enormous and the massive recovery that ultimately ensued was ofepic proportions. The damages were staggering, surpassing $50 billion, affectingemergency management policies and procedures, the insurance industry and landdevelopment regulations (including the statewide building code).Hurricane forecasters and scientists had warned with Hurricane Hugo (1989) that thestrengthening of El Niño and rainfall patterns in the African Sahel desert were signalingincreased patterns of hurricane activity. The 1995 hurricane season certainly gave credenceto those predictions. Two tropical storms and two hurricanes struck the state of Florida, themost since 1953 – Hurricanes Opal (October) and Erin (August) and Tropical Storms Jerry(August) and Allison (June).Hurricane activity has indeed increased but it has been in the last five years that the deadlypredictions have come to fruition. The experiences in other parts of Florida as well as theother states have resulted in a greater awareness of the challenges and obstacles facing thismetropolitan region.a. The 2004 Hurricane SeasonIn 2004, the State of Florida was hit by an unprecedented four (4) hurricanes: Charley,Frances, Ivan, and Jeanne.August 9-14, 2004 – Hurricane Charley strengthened rapidly just before strikingthe southwestern coast of Florida as a Category 4 hurricane on the Saffir-SimpsonHurricane Scale. Charley was the strongest hurricane to hit the United States sinceAndrew in 1992 and, although small in size, it caused catastrophic wind damage inCharlotte County, Florida. Serious damage occurred well inland over the Floridapeninsula. In the Tampa Bay Region, dead center for the 24 hour forecast track,evacuations were ordered in all four counties. Charley was directly responsible for tendeaths – primarily from flying debris and fallen trees. There were an additional 20indirect deaths (www.nhc.noaa.gov).August 25-Sept. 8, 2004 – Hurricane Frances was a Cape Verde type hurricanethat reached a peak intensity of category 4 on the Saffir-Simpson Hurricane Scale. ItPage II-32Regional Hazards Analysis
Statewide Regional Evacuation Studies ProgramVolume 1-11 South Floridaaffected the Bahamas as a category 3 hurricane and the Florida east coast as a category2 hurricane. The Tampa Bay Region experienced tropical storm and minimal hurricaneforce winds, with some coastal and more extensive inland flooding caused by more than10 inches of rainfall. Frances was directly responsible for seven deaths – five in Florida,one in the Bahamas, and one in Ohio. Three deaths were caused by wind, two by stormsurge, one by freshwater flooding, and one by lightning. The hurricane was indirectlyresponsible for 42 deaths – 32 in Florida, 8 in Georgia, 1 in the Bahamas, and 1 in Ohio(www.nhc.noaa.gov).September 2-24, 2004 – Hurricane Ivan was a classical, long-lived Cape Verdehurricane that reached category 5 strength on the Saffir-Simpson Hurricane Scale(SSHS) three times. It was also the strongest hurricane on record that far southeast ofthe Lesser Antilles. Ivan caused considerable damage and loss of life as it passedthrough the Caribbean Sea. Despite the unfavorable environmental conditions, thepresence of cooler shelf water just offshore and eyewall replacement cycles, Ivanweakened only slowly and made landfall as a 105-knot hurricane (category 3 on theSSHS) on September 16 th , just west of Gulf Shores, Alabama. By this time, the eyediameter had increased to 40-50 nautical miles, which resulted in some of the strongestwinds occurring over a narrow area near the southern Alabama-western Floridapanhandle border. The forces of Ivan were directly responsible for 92 deaths. In theUnited States, 14 occurred in Florida, 8 in North Carolina, 2 in Georgia, and 1 inMississippi. The breakdown of U.S. deaths by cause is as follows: tornado (7), stormsurge (5), freshwater floods (4), mud slides (4), wind (3), and surf (2). Ivan was alsoindirectly responsible for 32 deaths in the United States.Ivan caused extensive damage to coastal and inland areas of the United States.Portions of the Interstate 10 bridge system across Pensacola Bay, Florida, were severelydamaged in several locations as a result of severe wave action on top of the 10-15 ftstorm surge. As much as a quarter-mile of the bridge collapsed into the bay. The U.SHighway 90 Causeway across the northern part of the bay was also heavily damaged.To the south of Pensacola, Florida, Perdido Key bore the brunt of Ivan's fury and wasessentially leveled. In addition, extensive beach erosion caused severe damage to orthe destruction of numerous beachfront homes, as well as apartment and condominiumbuildings. Thousands of homes in the three-county coastal area of Baldwin, Escambia,and Santa Rosa were damaged or destroyed. Cleanup efforts alone in Escambia Countyresulted in debris piles that were more than three-quarters of a mile long and 70 feethigh. In all, Ivan was the most destructive hurricane to affect this area in more than100 years. Strong winds also spread well inland, damaging homes and downing treesand power lines. At one point, more than 1.8 million people were without power in ninestates (www.nhc.noaa.gov).September 13–28, 2004 – Hurricane Jeanne produced heavy rain overGuadeloupe, Puerto Rico and the Dominican Republic and caused an estimated 3,000 ormore deaths in Haiti, from torrential rainfall flooding. Finally, Jeanne hit the northernBahamas and then the central Florida east coast as a category three hurricane. Jeannemoved across central Florida while weakening and began to recurve around the westernperiphery of the migratory ridge. The hurricane weakened to a tropical storm whilecentered about 30 nautical miles north of Tampa September 26 th and then weakened toa tropical depression about 24 hours later while moving northward across centralRegional Hazards AnalysisPage II-33
Volume 1-11 South FloridaStatewide Regional Evacuation Studies ProgramGeorgia, accompanied by heavy rain. Winds were somewhat higher in the Tampa BayRegion for Hurricane Jeanne than Hurricane Frances, resulting in wind damage andminimal coastal flooding. Areas still flooded from Frances (three weeks before) receivedadditional flood waters (www.nhc.noaa.gov).b. The 2005 Hurricane SeasonThe impact of the 2005 Atlantic hurricane season and theresulting death, injury, destruction, and populationdisplacement, were unprecedented in U.S. history. During2005, 15 tropical storms became hurricanes. For the firsttime, four major hurricanes made landfall in the UnitedStates; three of those reached category 5 intensity.The worst effects were felt from Hurricanes Katrina and Rita. These storms did notseriously impact the state of Florida; however, they have had a significant impact onemergency management and hurricane planning at the national, state and local levels.On August 29, Hurricane Katrina struck the U.S. Gulf Coast, causing severe damagefrom a two-story storm surge, powerful winds, and heavy rains. Approximately 80% ofNew Orleans was flooded after the surge from the Gulf of Mexico forced breaks in alevee, releasing water from Lake Pontchartrain into the city. Katrina became thedeadliest U.S. hurricane since 1928, and likely the costliest natural disaster on record inthe United States. On September 24, response and recovery activities in the wake ofKatrina were interrupted when Hurricane Rita struck the Gulf Coast. Rita rendered morehomes uninhabitable and thousands more seeking shelter elsewhere. More than200,000 persons were displaced by the hurricanes and dispersed to evacuee shelters in18 states. The economic and health consequences of Hurricanes Katrina and Ritaextended far beyond the Gulf region and ultimately affected states and communitiesthroughout the US (www.cdc.gov/mmwr/mguide_nd.html).Hurricane Katrina – August 23-30, 2005 Katrina was a large and intense hurricanethat struck a portion of the United States coastline along the northern Gulf of Mexicothat is particularly vulnerable to storm surge, leading to loss of life and property damageof immense proportions. The scope of human suffering inflicted by Hurricane Katrina inthe United States has been greater than that of any hurricane to strike this country inseveral generations.The total number of fatalities known, as of this writing, to be either directly or indirectlyrelated to Katrina is 1,336, based on reports to date from state and local officials in fivestates: 1,090 fatalities in Louisiana, 228 in Mississippi, 14 in Florida, 2 in Georgia, and 2in Alabama. The number of direct fatalities is highly uncertain and the true numbermight not ever be known, especially for Louisiana and Mississippi.Presumably, most of the deaths in Louisiana were directly caused by the widespreadstorm surge-induced flooding and its miserable aftermath in the New Orleans area. Thevast majority of the fatalities in Mississippi were probably directly caused by the stormsurge in the three coastal counties. In Florida three of the direct fatalities were causedPage II-34Regional Hazards Analysis
Statewide Regional Evacuation Studies ProgramVolume 1-11 South Floridaby downed trees in Broward County and the three others were due to drowning inMiami-Dade County. Two deaths were also reported in Georgia, with one directlycaused by a tornado, and the other occurring in a car accident indirectly related to thestorm. Alabama reported two indirect fatalities in a car accident during the storm.Despite the fact that inland freshwater floods produced the majority of fatalities due totropical cyclones during the past few decades, Katrina provides a grim reminder thatstorm surge poses the greatest potential cause for large loss of life in a single hurricanein this country (emphasis added).Where Katrina ranks among the deadliest hurricanes on record in the United States issomewhat uncertain, due to the unknown number of fatalities caused directly by thishurricane and by some others in the past. Katrina is surpassed by the Galveston, Texashurricane in 1900 that claimed at least 8,000 lives, and it appears to be surpassed bythe 1928 Lake Okeechobee, Florida hurricane with over 2,500 fatalities. If theassumption is correct that most of the Katrina-related fatalities were caused directly bythe storm, then Katrina ranks as the third deadliest hurricane in the United States since1900, and the deadliest in 77 years. However, two hurricanes in 1893 might each havebeen directly responsible for more fatalities in the United States than Katrina. One ofthese struck the southeastern Louisiana barrier island of Cheniere Caminanda and killedabout 2,000 people, while another struck Georgia and South Carolina and claimedsomewhere between 1,000 and 2,000 lives. As a result, Katrina ranks fourth or fifth onthe list of the deadliest hurricanes on record in the United States.The extent, magnitude, and impacts of the damage caused by Katrina are staggeringand are well beyond the scope of this report to fully describe. Thousands of homes andbusinesses throughout entire neighborhoods in the New Orleans metropolitan area weredestroyed by flood. Strong winds also caused damage in the New Orleans area,including downtown where windows in some high rise buildings were blown out and theroof of the Louisiana Superdome was partially peeled away. The storm surge of Katrinastruck the Mississippi coastline with such ferocity that entire coastal communities wereobliterated, some left with little more than the foundations on which homes, businesses,government facilities, and other historical buildings once stood. Despite being moredistant from the eye of Katrina, the storm surge over Dauphin Island, Alabamadestroyed or damaged dozens of beachfront homes and cut a new canal through theisland’s western end. Many of the most severely impacted areas along the northern Gulfcoast could take years to completely rebuild. Katrina’s heavy rains in southern Floridaflooded some neighborhoods, primarily in Miami-Dade County. Many other structuresfrom Florida and Georgia westward to Louisiana that avoided surge or freshwater floods,including some areas well inland, were damaged by strong winds and tornadoes.Considerable damage to some homes and agricultural facilities was caused by severaltornadoes in Georgia. Strong winds caused significant tree damage throughout much ofMississippi and Alabama. Combining all of the areas it impacted, Katrina left about threemillion people without electricity, some for several weeks.The economic and environmental ramifications of Katrina have been widespread andcould in some respects be long-lasting, due to impacts on large population and tourismcenters, the oil and gas industry, and transportation. The hurricane severely impactedor destroyed workplaces in New Orleans and other heavily populated areas of theRegional Hazards AnalysisPage II-35
Volume 1-11 South FloridaStatewide Regional Evacuation Studies Programnorthern Gulf coast, resulting in thousands of lost jobs and millions of dollars in lost taxrevenues for the impacted communities and states. Along the Mississippi coast, severallarge casinos on floating barges were damaged or destroyed when the surge pushedthem onshore. Large numbers of evacuees have not returned home, producing ashortage of workers for those businesses that have reopened. Major beach erosionoccurred along the tourism-dependent Mississippi and Alabama coasts. A significantpercentage of United States oil refining capacity was disrupted after the storm due toflooded refineries, crippled pipelines, and several oil rigs and platforms damaged, adriftor capsized. An oil rig under construction along the Mobile River in Alabama wasdislodged, floated 1.5 miles northward, and struck the Cochrane Bridge just north ofdowntown Mobile. An offshore oil rig washed up near the beach of Dauphin Island,Alabama. Several million gallons of oil were spilled from damaged facilities scatteredthroughout southeastern Louisiana. While several facilities have since resumedoperations, as of this writing oil and natural gas production and refining capacity in thenorthern Gulf of Mexico region remains less than that prior to Katrina. Keytransportation arteries were disrupted or cut off by the hurricane. Traffic along theMississippi River was below normal capacity for at least two weeks following the storm.Major highways into and through New Orleans were blocked by floods. Major bridgesalong the northern Gulf coast were destroyed, including several in Mississippi and theInterstate 10 Twin Span Bridge connecting New Orleans and Slidell, Louisiana.Estimates of the insured property losses caused by Katrina vary considerably and rangebetween about $20 billion and $60 billion. The American Insurance Services Group(AISG) estimates that Katrina is responsible for $38.1 billion of insured losses in theUnited States. A preliminary estimate of the total damage cost of Katrina is assumed tobe roughly twice the insured losses (using the AISG estimate), or about $75 billion. Thisfigure would make Katrina the costliest hurricane in United States history by far. Evenafter adjusting for inflation, the estimated total damage cost of Katrina is roughly doublethat of Hurricane Andrew (1992). Normalizing for inflation and for increases inpopulation and wealth, only the 1926 hurricane that struck southern Florida surpassesKatrina in terms of damage cost. However, this would not be the case if the values onthe higher end of the range of Katrina estimates are later found to be the mostaccurate. The Insurance Information Institute reports that, mostly due to Katrina, butcombined with significant impacts from the other hurricanes striking the United Statesthis year, 2005 was by a large margin the costliest year ever for insured catastrophiclosses in this country.Data provided by the Federal Emergency Management Agency (FEMA) indicate that over1.2 million people along the northern Gulf coast from southeastern Louisiana to Alabamawere under some type of evacuation order, but it is not clear how many people actuallyevacuated. Media reports indicate that many displaced residents have moved eithertemporarily or permanently to other areas in the United States. A large number of thesepeople might never return to live in their pre-Katrina homes or cities. Thousands ofpeople are still living in hotels and temporary shelters (www.nhc.noaa.gov).Hurricane Rita, September 18-26, 2005 Rita was an intense hurricane thatreached category 5 strength (on the Saffir-Simpson Hurricane Scale) over the centralGulf of Mexico, where it had the fourth-lowest central pressure on record in the AtlanticPage II-36Regional Hazards Analysis
Statewide Regional Evacuation Studies ProgramVolume 1-11 South Floridabasin. Although it weakened prior to making landfall as a category 3 hurricane near theTexas/Louisiana border, Rita produced significant storm surge that devastated coastalcommunities in southwestern Louisiana, and its winds, rain, and tornadoes causedfatalities and a wide swath of damage from eastern Texas to Alabama. Rita also causedfloods due to storm surge in portions of the Florida Keys.The approach of Rita provoked one the largest evacuations in U. S. history. Just weeksafter the country watched in horror the devastation of Hurricane Katrina, media reportsindicate that the number of evacuees in Texas could have exceeded two million.Additional evacuations involving smaller numbers took place in Louisiana(www.nhc.noaa.gov).Hurricane Wilma – October 15-25, 2005 Wilma formed and became an extremelyintense hurricane over the northwestern Caribbean Sea. It had the all-time lowestcentral pressure for an Atlantic basin hurricane, and it devastated the northeasternYucatan Peninsula as a category 4 hurricane. Wilma also inflicted extensive damageover southern Florida.Despite the strong shear in its surroundings, Wilma strengthened over the southeasternGulf of Mexico and its winds reached about 110 knots as it approached Florida.Maximum sustained winds were estimated to be near 105 knots (category 3 intensity)when landfall of the center occurred in southwestern Florida near Cape Romano October24 th . Continuing to accelerate and now moving at a forward speed of 20 to 25 knots,the hurricane crossed the southern Florida peninsula in 4.5 hours, with the centeremerging into the Atlantic just southeast of Jupiter. Maximum winds had decreased tonear 95 knots (category 2) during the crossing of Florida. Twenty-two deaths havebeen directly attributed to Wilma: 12 in Haiti, 1 in Jamaica, 4 in Mexico, and 5 in Florida.Damage was reported to have been very severe in portions of the northeastern YucatanPeninsula, where Wilma dealt a major blow to the tourist industry in that area. Insouthern Florida, damage was unusually widespread, including numerous downed trees,substantial crop losses, downed power lines and poles, broken windows, extensive roofdamage, and destruction of mobile homes. Wilma caused the largest disruption toelectrical service ever experienced in Florida. A preliminary amount of total insureddamage compiled by the Property Claims Service is $6.1 billion. Using a doubling ofinsured losses to obtain the total damage gives a current estimate of Wilma’s U.S.damage to be $12.2 billion (www.nhc.noaa.gov).c. The 2006, 2007 and 2008 SeasonsThe 2006 Hurricane season was a much quieter season for the state of Florida, with onlyone hurricane affecting the state, Hurricane Ernesto, which was actually a tropical stormwhen it impacted Florida. Tropical Storm Alberto also crossed the eastern Floridapanhandle. The 2007 hurricane season was also a relatively quite season, with nohurricanes directly affecting the State of Florida.The 2008 Atlantic hurricane season marked the end of a season that produced a recordnumber of consecutive storms to strike the United States and ranks as one of the moreRegional Hazards AnalysisPage II-37
Volume 1-11 South FloridaStatewide Regional Evacuation Studies Programactive seasons in the 64 years since comprehensive records began. Overall, the seasonis tied as the fourth most active in terms of named storms (16) and major hurricanes(5), and is tied as the fifth most active in terms of hurricanes (8) since 1944, which wasthe first year aircraft missions flew into tropical storms and hurricanes.For the first time on record, six consecutive tropical cyclones (Dolly, Edouard, Fay,Gustav, Hanna and Ike) made landfall on the U.S. mainland, and a record three majorhurricanes (Gustav, Ike and Paloma) struck Cuba. This is also the first Atlantic seasonto have a major hurricane (Category 3) form in five consecutive months (July: Bertha,August: Gustav, September: Ike, October: Omar, November: Paloma).The National Hurricane Center attributes the 2008 above-normal season to conditionsthat include:• An ongoing multi-decadal signal. This combination of ocean and atmosphericconditions has spawned increased hurricane activity since 1995.• Lingering La Niña effects. Although the La Niña that began in the Fall of 2007 endedin June, its influence of light wind shear lingered.• Warmer tropical Atlantic Ocean temperatures. On average, the tropical Atlantic wasabout 1.0 degree Fahrenheit above normal during the peak of the season.In 2008, Tropical Storm Fay made history as the only storm on record to make landfallfour times in the state of Florida, and to prompt tropical storm and hurricane watchesand warnings for the state’s entire coastline (at various times during its August lifespan).Though Florida was spared a direct hit from a major hurricane, Floridians saw majorflooding throughout the State from Tropical Storm Fay. Fay came ashore in the FloridaKeys August 18 and continued northward up the Florida Peninsula. Fay made records asthe first storm to make four landfalls in one state, impacting the Florida Keys, SouthFlorida, exiting off the east coast and coming back inland near Flagler Beach and exitingoff the Gulf Coast and making landfall again near Carrabelle. The slow-moving stormalso caused record rainfall and flooding throughout the state, with some areas getting asmuch as 25 inches of rain. Millions of dollars in damage and 15 deaths were caused inFlorida by Fay (www.noaa.nhc.gov).Hurricane Gustav brought tropical storm force winds to the Florida Keys and storm surgeand severe thunderstorms to the Florida Panhandle. As Gustav headed for the Louisianacoast, many residents evacuated to Florida to escape the storm. Many Florida counties,in conjunction with the American Red Cross, opened shelters throughout the state forevacuees (www.noaa.nhc.gov).9. Probability of Future Hurricane EventsTable II-6 provides the number of direct hits on the mainland United States coastline (1900-1996) for individual states. Florida is divided into four sections. The South Florida Region islocated in the Southeast area, while the Florida Keys are included in the Southwest area.Page II-38Regional Hazards Analysis
Statewide Regional Evacuation Studies ProgramVolume 1-11 South FloridaAreaTable II-6U.S. Mainland Hurricane Strikes by State, 1851-2006Category1 2 3 4 5All (1-5)Major(3-5)U.S. (Texas to Maine) 110 73 75 18 3 279 96Texas 23 18 12 7 0 60 19Louisiana 18 14 15 4 1 52 20Mississippi 2 5 8 0 1 16 9Alabama 16 4 6 0 0 26 6Florida 43 33 29 6 2 113 37(Northwest) 26 17 14 0 0 57 14(Northeast) 12 8 1 0 0 21 1(Southwest) 18 10 8 4 1 41 13(Southeast) 13 13 11 3 1 41 15Georgia 15 5 2 1 0 23 3South Carolina 18 6 4 2 0 30 6North Carolina 24 14 11 1 0 50 12Virginia 7 2 1 0 0 10 1Maryland 1 1 0 0 0 2 0Delaware 2 0 0 0 0 2 0New Jersey 2 0 0 0 0 2 0Pennsylvania 1 0 0 0 0 1 0New York 6 1 5 0 0 12 5Connecticut 5 3 3 0 0 11 3Rhode Island 3 2 4 0 0 9 4Massachusetts 6 2 3 0 0 11 3New Hampshire 1 1 0 0 0 2 0Maine 5 1 0 0 0 6 0Notes: State totals will not necessarily equal U.S. totals, and Florida totals will not necessarily equal sumof sectional totals.Table II-7 provides the total of major hurricane direct hits on the mainland (1900-1996) bymonth. Most major hurricanes occur in the later part of the hurricane season in September,October and November. Category one and two hurricanes tend to “spring up” in theCaribbean affecting the southwest Florida area in the early part of the season.Regional Hazards AnalysisPage II-39
Volume 1-11 South FloridaStatewide Regional Evacuation Studies ProgramTable II-7Major Hurricane Direct Hits on the U.S. Coastline, 1851-2006, by MonthJun Jul Aug Sep Oct NovU.S. (Texas to Maine) 2 4 30 44 16 96Texas 1 1 10 7 0 19(North) 1 1 3 2 0 7(Central) 0 0 2 2 0 4(South) 0 0 5 3 0 8Louisiana 2 0 7 8 3 20Mississippi 0 1 4 4 0 9Alabama 0 1 1 4 0 6Florida 0 2 6 19 10 37(Northwest) 0 2 1 7 3 13(Northeast) 0 0 0 1 0 1(Southwest) 0 0 2 5 6 13(Southeast) 0 0 4 8 3 15Georgia 0 0 1 1 1 3South Carolina 0 0 2 2 2 6North Carolina 0 0 4 8 1 13Virginia 0 0 0 1 0 1Maryland 0 0 0 0 0 0Delaware 0 0 0 0 0 0New Jersey 0 0 0 0 0 0Pennsylvania 0 0 0 0 0 0New York 0 0 1 4 0 5Connecticut 0 0 1 2 0 3Rhode Island 0 0 1 3 0 4Massachusetts 0 0 0 3 0 3New Hampshire 0 0 0 0 0 0Maine 0 0 0 0 0 0Taken from The Deadliest, Costliest, and Most Intense United States Hurricanes of this Century[NOAA Technical Memorandum NWS TPC-5], updated in 2007 (http://www.nhc.noaa.gov/pdf/NWS-TPC-5.pdf). Storms can affect more than one area in the state. Therefore, the total number ofstorms affecting Florida is less than the total number affecting all regions.Page II-40Regional Hazards Analysis
Statewide Regional Evacuation Studies ProgramVolume 1-11 South Floridaa. Monthly Zones of Origin and Hurricane TracksThe figures below (Figures II-9 to II-14) show the zones of origin and tracks fordifferent months during the hurricane season. These figures only depict averageconditions and hurricanes can originate in different locations and travel much differentpaths from the average. Nonetheless, having a sense of the general pattern can giveyou a better picture of the average hurricane season for your area.Regional Hazards AnalysisPage II-41
Volume 1-11 South FloridaStatewide Regional Evacuation Studies ProgramFigure II-9: Prevailing Tracks - JuneFigure II-10: Prevailing Tracks - JulyFigure II-11: Prevailing Tracks - AugustPage II-42Regional Hazards Analysis
Statewide Regional Evacuation Studies ProgramVolume 1-11 South FloridaFigure II-12: Prevailing Tracks - SeptemberFigure II-13: Prevailing Tracks - OctoberFigure II-14: Prevailing Tracks - NovemberRegional Hazards AnalysisPage II-43
Volume 1-11 South FloridaStatewide Regional Evacuation Studies Programb. National Oceanographic and Atmospheric Administration HistoricalAnalysis for the RegionIn the tables below, the National Hurricane Center provides a list of all the tropicalstorms and hurricanes that have passed within 100 nautical miles of five selected pointsin the South Florida Region: Key West (Table II-8a), Islamorada (Table II-8b), Flamingo(Table II-8c), Miami Beach (Table II-8d) and Fort Lauderdale (Table II-8e). Using anhistorical analysis, return intervals were developed for the South Florida Region andpresented in Tables II-9a and II-9b.Page II-44Regional Hazards Analysis
Statewide Regional Evacuation Studies ProgramVolume 1-11 South FloridaTable II-8a: Key WestRegional Hazards AnalysisPage II-45
Volume 1-11 South FloridaStatewide Regional Evacuation Studies ProgramTable II-8a: Key West (continued)Page II-46Regional Hazards Analysis
Statewide Regional Evacuation Studies ProgramVolume 1-11 South FloridaTable II-8b: IslamoradaRegional Hazards AnalysisPage II-47
Volume 1-11 South FloridaStatewide Regional Evacuation Studies ProgramTable II-8b: Islamorada (continued)Page II-48Regional Hazards Analysis
Statewide Regional Evacuation Studies ProgramVolume 1-11 South FloridaTable II-8c: FlamingoRegional Hazards AnalysisPage II-49
Volume 1-11 South FloridaStatewide Regional Evacuation Studies ProgramTable II-8c: Flamingo (continued)Page II-50Regional Hazards Analysis
Statewide Regional Evacuation Studies ProgramVolume 1-11 South FloridaTable II-8d: Miami BeachRegional Hazards AnalysisPage II-51
Volume 1-11 South FloridaStatewide Regional Evacuation Studies ProgramTable II-8d: Miami Beach (continued)Page II-52Regional Hazards Analysis
Statewide Regional Evacuation Studies ProgramVolume 1-11 South FloridaTable II-8e: Fort LauderdaleRegional Hazards AnalysisPage II-53
Volume 1-11 South FloridaStatewide Regional Evacuation Studies ProgramTable II-8e: Fort Lauderdale (continued)Page II-54Regional Hazards Analysis
Statewide Regional Evacuation Studies ProgramVolume 1-11 South FloridaTable II-9aSummary for Hurricanes and Tropical Storms, 1870-2007Key West Islamorada FlamingoMiami FortBeach LauderdaleNumber of Years 138 138 138 138 138Number of Hurricanesand Tropical Storms103 101 104 109 112Mean Number ofOccurrences per Year0.75 0.74 0.75 0.79 0.81Mean RecurrenceInterval (years)1.34 1.37 1.33 1.27 1.23Table II-9bSummary for Hurricanes, 1870-2007Key West Islamorada FlamingoMiami FortBeach LauderdaleNumber of Years 138 138 138 138 138Number of Hurricanes 38 38 40 45 45Mean Number ofOccurrences per Year0.28 0.28 0.29 0.33 0.33Mean RecurrenceInterval (years)3.63 3.63 3.45 3.07 3.07Regional Hazards AnalysisPage II-55
Volume 1-11 South FloridaStatewide Regional Evacuation Studies ProgramFigure II-15aHurricane Return Intervals for the South Florida Region - Key WestPage II-56Regional Hazards Analysis
Statewide Regional Evacuation Studies ProgramVolume 1-11 South FloridaFigure II-15bHurricane Return Intervals for the South Florida Region - IslamoradaRegional Hazards AnalysisPage II-57
Volume 1-11 South FloridaStatewide Regional Evacuation Studies ProgramFigure II-15cHurricane Return Intervals for the South Florida Region - FlamingoPage II-58Regional Hazards Analysis
Statewide Regional Evacuation Studies ProgramVolume 1-11 South FloridaFigure II-15dHurricane Return Intervals for the South Florida Region – Miami BeachRegional Hazards AnalysisPage II-59
Volume 1-11 South FloridaStatewide Regional Evacuation Studies ProgramFigure II-15eHurricane Return Intervals for the South Florida Region – Miami BeachPage II-60Regional Hazards Analysis
Statewide Regional Evacuation Studies ProgramVolume 1-11 South FloridaC. Freshwater Flooding: The 100-Year Flood Plain1. Inland / Riverine Flooding ProfileFlooding refers to the general or temporaryconditions of partial or complete inundation ofnormally dry land areas by surface water runofffrom any source (Statewide Hazard MitigationPlan, 2009). The State of Florida and the SouthFlorida Region are affected by a large number ofweather systems that result in flooding.Flooding can be divided into two major categories: Coastal and Riverine. As indicatedpreviously, interrelated hazards, such as hurricanes and severe storms, can result in bothtypes of flooding, sometimes in difference locations. Many areas of Florida are susceptibleto flooding from both storm surge and watershed runoff.Coastal flooding is usually the result of a severe weather system such as a tropical cyclone,hurricane, tropical storm or “northeaster,” which contains the element of wind. Thedamaging effects of coastal floods are caused by a combination of higher water levels of thestorm surge, the winds, rains, erosion and battering by debris. Loss of life and propertydamage are often more severe since it involves velocity wave action and accompanyingwinds.Riverine flooding is associated with a river’s watershed, which is the natural drainage basinthat conveys water runoff from rain. Riverine flooding occurs when the flow of runoff isgreater than the carrying capacities of the natural drainage systems. Rainwater that is notabsorbed by soil or vegetation seeks surface drainage lines following natural topographylines. These lines merge to form a hierarchical system of rills, creeks, streams and rivers.Generally, floods can be slow or fast rising depending on the size of the river or stream.The rivers in north Florida drain portions of Alabama and Georgia, and excessive rainfall inthose states often causes flood conditions in Florida.Flash floods are much more dangerous and flow much faster than riverine floods. They canresult from tropical storms, dam failures or excessive rain and snow. Flash floods posemore significant safety risks because of the rapid onset, the high water velocity, thepotential for channel scour and the debris load.The variations of flooding, including severe thunderstorms, hurricanes, seasonal rain andother weather related conditions, are a natural part of the earth’s hydrologic system;however, when buildings and infrastructure are constructed within the natural drainagesystem, there are significant losses. Based on frequency, floods are the most destructivecategory of natural hazards in the United States. The loss of life, property, crops, businessfacilities, utilities and transportation are major impacts of flooding. Economic losses fromRegional Hazards AnalysisPage II-61
Volume 1-11 South FloridaStatewide Regional Evacuation Studies Programimpacts to major transportation routes and modes, public health and other environmentalhazards are key factors in long-term recovery (Statewide Hazard Mitigation Plan, 2009).2. Probability of Flooding: Flood Insurance Rate Maps (FIRMs)The probability of freshwater flooding has been quantified by the Federal EmergencyManagement Agency (FEMA) through the National Flood Insurance Program. Areas subjectto flooding, the Velocity Zone, 100-year flood plain and the 500-year floodplain, have beendelineated on Flood Insurance Rate Maps (FIRMs) for every jurisdiction in the region.Moderate to low risk areas include zones B, C and X. High risk areas include zones A, AE,AH, AO, and AR. High risk coastal areas include the Velocity zones (Zones V, VE, V1-V30)and undetermined risk areas (Zone D).Table II-10Definitions of National Flood Insurance Program (NFIP) ZonesAE Areas with a 1% annual chance of flooding and a 26% chance of flooding over the life of a 30-year mortgage. In most instances base flood elevations (BFEs) derived from detailed analysesare shown at selected intervals within these zones.X500XAANIINVEAn area inundated by 500-year flooding; an area inundated by 100-year flooding with averagedepths of less than 1 foot or with drainage areas less than 1 square mile; or an area protected bylevees from the 100-year flooding.Areas outside the 1-percent annual chance floodplain, areas of 1% annual chance sheet flowflooding where average depths are less than 1 foot, areas of 1% annual chance stream floodingwhere the contributing drainage area is less than 1 square mile, or areas protected from the 1%annual chance flood by levees. No Base Flood Elevations or depths are shown within this zone.Insurance purchase is not required in these zones.Flood zone area with a 1% annual chance of flooding and a 26% chance of flooding over the lifeof a 30-year mortgage. Because detailed analyses are not performed for such areas, no depthsof base flood elevations are shown within these zones.An area that is located within a community or county that is not mapped on any published FIRM.An area designated as within a “Special Flood Hazard Area” (of SFHA) on a FIRM. This is an areainundated by 100-year flooding for which no BFEs or velocity may have been determined. Nodistinctions are made between the different flood hazard zones that may be included within theSFHA. These may include Zones A, AE, AO, AH, AR, A99, V, or VE.Coastal areas with a 1% or greater chance of flooding and an additional hazard associated withstorm waves. These areas have a 26% chance of flooding over the life of a 30-year mortgage.Base flood elevations derived from detailed analyses are shown at selected intervals within thesezones.UNDES A body of open water, such as a pond, lake, ocean, etc., located within a community’sjurisdictional limits, that has no defined flood hazard.AORiver or stream flood hazard areas and areas with a 1% or greater chance of shallow floodingeach year, usually in the form of sheet flow, with an average depth ranging from 1 to 3 feet.Page II-62Regional Hazards Analysis
Statewide Regional Evacuation Studies ProgramVolume 1-11 South FloridaThese areas have a 26% chance of flooding over the life of a 30-year mortgage. Average flooddepths derived from detailed analyses are shown within these zones.D Areas with possible but undetermined flood hazards. No flood hazard analysis has beenconducted. Flood insurance rates are commensurate with the uncertainty of the flood risk.AHVAreas with a 1% annual chance of shallow flooding, usually in the form of a pond, with anaverage depth ranging from 1 to 3 feet. These areas have a 26% chance of flooding over the lifeof a 30-year mortgage. Base flood elevations derived from detailed analyses are shown atselected intervals within these zones.Coastal areas with a 1% or greater chance of flooding and an additional hazard associated withstorm waves. These areas have a 26% chance of flooding over the life of a 30-year mortgage.No base flood elevations are shown within these zones.100IC An area where the 100-year flooding is contained within the channel banks and the channel istoo narrow to show to scale. An arbitrary channel width of 3 meters is shown. BFEs are notshown in this area, although they may be reflected on the corresponding profile.The model used to determine the flood plain, like the Sea, Lake and Overland Surges fromHurricane (SLOSH) MEOWs or MOMs and the Inland Wind model, is a cumulative model. Inother words, it is based on several storm events; no one storm will inundate all the areaswithin the flood zone. In addition, because there is a return interval (1% or greater chanceof flooding in any given year) associated with the flood level, there is a basis for planningand cost-benefit analysis.While the 6-12 inches of rain typically associated with a hurricane is not considered lifethreatening,freshwater flooding along rivers and streams can and does cause significantproperty damage and has the potential of causing personal injury and deaths. HurricaneFloyd (September 1999) caused billions of dollars in property damage in North Carolinaalone. Over the past two decades, freshwater flooding has become a leading cause ofdeath in hurricane events with most of those deaths the result of driving or walking in floodwaters.In order to identify the potential magnitude of inland flooding, the 100-year flood plain wasdelineated using the Federal Emergency Management Agency’s (FEMA) most recent digitalfiles. County maps illustrating the 100-year flood plain are presented in the Maps section ofChapter IV Appendices. Within the flood zone, it is recognized that there are properties thathave sustained repeated damage from flooding and are extremely susceptible to flooddamage. These local neighborhoods should be warned prior to hurricane events thatflooding is very probable.Regional Hazards AnalysisPage II-63
Volume 1-11 South FloridaStatewide Regional Evacuation Studies ProgramFigure II-16Page II-64Regional Hazards Analysis
Statewide Regional Evacuation Studies ProgramVolume 1-11 South FloridaThe total acreage within the flood plain by county is presented below. It was calculated usingthe total acreage as determined by the Soil Conservation Service and the FEMA FIRM Maps asof 2009.Table II-11Flood Plain Acreage by CountyArea Total Acreage Flood Plain Acreage % in Flood PlainBroward 775,946 43,081 5.55%Miami-Dade 1,250,287 557,871 44.62%Monroe 1,152,568 1,118,192 97.02%South Florida Region 3,178,801 1,719,144 54.08%Source: Soil Conservation Service (Total Acreage); FEMA (Digital Inventory of Flood PlainAcreage)3. Dam FailureA flood event may also trigger a dam failure. The dam impounds water in the reservoir, orupstream area. The amount of water impounded is measured in acre-feet. 8 Dam failuresare not routine but the results can be significant. Two factors influence the potentialseverity of a dam failure: (1) the amount of water impounded and (2) the density, type andvalue of the development downstream (Statewide Hazard Mitigation Plan, 2009).The “dam hazard” is a term indicating the potential hazard to the downstream area resultingfrom failure or mis-operation of the dam or facilities. According to the USGS NationalInventory of Dams, there are 149 major dams in the State of Florida that have beenidentified by a hazard risk of low, significant and high.• Low hazard: A dam where failure or mis-operation results in no probable loss of humanlife and low economic and/or environmental loss. Losses are principally limited to theowner’s property.• Significant hazard: A dam where failure or mis-operation results in no probable loss ofhuman life but can cause economic loss, environmental damage, disruption of lifelinefacilities or impact other concerns. These dams are often located in predominantly ruralor agricultural areas but could be located in areas with population and significantinfrastructure.• High hazard: A dam where failure or mis-operation will probably cause loss of human life(Statewide Hazard Mitigation Plan, 2009).8 An acre-foot of water is the volume that covers an acre of land to the depth of one foot.Regional Hazards AnalysisPage II-65
Volume 1-11 South FloridaStatewide Regional Evacuation Studies ProgramTable II-12Dams in the South Florida RegionDam Name NIDID Long. Lat. County River Hazard 9 USNGPUMPINGSTATION NO. 8 FL00343 -80.77 26.33 BROWARD MIAMI CANAL (C-6) L17R NK 2295312251PUMPINGSTATION NO. 7 FL00345 -80.53 26.33 BROWARDNORTH NEW RIVERCANALL17R NK 4690512315STRUCTURE 11C FL00347 -80.46 26.23 BROWARD NONE L17R NK 5377101224STRUCTURE 11B FL00348 -80.46 26.20 BROWARD NONE L17R NJ 5442297759STRUCTURE 11A FL00349 -80.45 26.18 BROWARD NONE L17R NJ 5481495364STRUCTURE NO.143 (CULVERT L-35B-1) FL00350 -80.44 26.17 BROWARDNORTH NEW RIVERCANALL17R NJ 5596394631STRUCTURE NO.34 FL00352 -80.44 26.15 BROWARDNORTH NEW RIVERCANALL17R NJ 5597392416STRUCTURE NO.141 (SPILLWAYL-38E-1) FL00353 -80.44 26.15 BROWARDNORTH NEW RIVERCANALL17R NJ 5597392416STRUCTURE 12A FL00367 -80.82 25.76 MIAMI-DADESHARK RIVERSLOUGHH17R NJ 1793849312STRUCTURE 12B FL00368 -80.77 25.76 MIAMI-DADESHARK RIVERSLOUGHH17R NJ 2311449333STRUCTURE 12C FL00369 -80.73 25.76 MIAMI-DADESHARK RIVERSLOUGHH17R NJ 2738449349STRUCTURE 12D FL00370 -80.68 25.76 MIAMI-DADESHARK RIVERSLOUGHH17R NJ 3190949361STRUCTURE NO.31 FL00384 -80.45 25.96 MIAMI-DADE MIAMI CANAL (C-6) L17R NJ 5506271370STRUCTURE 333 FL00681 -80.67 25.76 MIAMI-DADELEVEE 29 BORROWCANALL17R NJ 3309349147STRUCTURE 336 FL00683 -80.49 25.76 MIAMI-DADETAMIAMI CANAL (C-4) L17R NJ 5114349205STRUCTURE 337 FL00693 -80.44 25.94 MIAMI-DADE S-31 BYPASS CANAL L17R NJ 5607269159Source: US Army Corps of Engineers (2009)4. History of Inland FloodingBased on data collected by the National Climatic Data Center (NCDC), there were 993flooding events in Florida between 1950 and 2009, for an average of 16.83 flooding eventsper year. Total property damages were estimated at $1.43 billion, with an additional $972million in crop-related damages (www4.ncdc.noaa.gov/cgi-win/wwcgi.dll?wwevent~storms).Below is a summary of the major flooding events in the South Florida Region from 1993-2008.9 Hazard Reference: H= High, S=Significant, L=LowPage II-66Regional Hazards Analysis
Statewide Regional Evacuation Studies ProgramVolume 1-11 South FloridaOctober 1999, Hurricane Irene: Widespread flooding from Hurricane Irene inundatedmost of the metropolitan areas of Miami-Dade, Broward and Palm Beach Counties. Thisflood was responsible for property damage of $205 million, as well as $290 million of cropdamage.October 2000: On October 2 and 3, 2000, a broad area of low pressure in the Gulf ofMexico off the southwest Florida coast moved northeast across central Florida andeventually became subtropical depression number one, then tropical storm Leslie, off of thenortheast Florida coast. Some flood waters lingered for up to a week. Flood damage wasparticularly severe in the communities of Sweetwater, West Miami, Hialeah, Opa Locka andPembroke Park. An estimated 93,000 houses with about 214,000 persons were isolated byfloodwaters. Power was cut to 13,000 people. There were three indirect deaths, includingtwo males who drove vehicles into canals and one man who fell from a roof while repairinga leak. Total property damage and crop damage estimates were $450 million and $500million, respectively.5. Structural Inventories, Economic Vulnerability and Repetitive LossThe location of repetitive loss structures 10 helps to identify specific areas in the communitywhere flooding continues to be a problem and where mitigation efforts should beconcentrated. For many of these flood-prone areas, mitigation will involve significantproperty owner investment and will probably be delayed until redevelopment orreconstruction occurs. New construction or significant remodeling will require adherence tocurrent floodplain management regulations. In regard to evacuation planning, these areasare important to consider, as they represent the most vulnerable areas subject to floodingfrom significant rainfall and minor tropical storm activity. In addition, these areas may notbe coastal or reside in hurricane evacuation areas. Therefore, the residents in these areasmay constitute additional evacuation impacts.The repetitive loss properties and repetitive loss areas are addressed in the Local MitigationPlans (LMSs). A breakdown of the properties by structure type is provided in Table II-13below.10A "repetitive-loss property" is one that has suffered two or more flood losses over 10 years with thecumulative cost of repairs equaling or exceeding 50 percent of the value of the structure. Increased Costof Compliance for repetitive-loss structures is available only in communities that have repetitive-lossprovisions in their floodplain-management ordinances and track repetitive-loss damages.Regional Hazards AnalysisPage II-67
Volume 1-11 South FloridaStatewide Regional Evacuation Studies ProgramTable II-13Repetitive Loss PropertiesCommunity NameRepetitive Loss2-4 Other Condo Non-SFStructuresFamily Res Assoc. Res.Broward County 0 0 0 0 0 0Fort Lauderdale 209 142 13 14 2 38Hallandale 397 248 49 39 6 55Hollywood 459 395 16 14 4 30Lauderhill 61 61 0 0 0 0Oakland Park 116 81 0 7 0 28Pembroke Park 36 0 0 4 0 32Pembroke Pines 25 25 0 0 0 0Weston 4 0 0 4 0 0Wilton Manners 14 14 0 0 0 0Davie 49 41 0 0 2 6Deerfield 9 9 0 0 0 0Hillsboro 2 0 0 0 0 2Southwest Ranches 2 0 0 2 0 0Cooper City 8 8 0 0 0 0Coconut Creek 2 2 0 0 0 0Coral Springs 22 22 0 0 0 0Lauderdale By The Sea 3 3 0 0 0 0Lauderdale Lakes 41 41 0 0 0 0Lazy Lake 2 2 0 0 0 0Lighthouse Point 4 4 0 0 0 0Margate 22 22 0 0 0 0Miramar 77 77 0 0 0 0North Lauderdale 17 17 0 0 0 0Parkland 2 2 0 0 0 0Plantation 24 24 0 0 0 0Pompano Beach 25 17 0 0 0 8Sunrise 18 18 0 0 0 0Tamarac 22 22 0 0 0 0West Park 62 62 0 0 0 0Dania 77 61 5 4 0 7Miami-Dade County 5,649 0 5,649 0 0 0Aventura 6 0 0 3 0 3Biscayne 7 7 0 0 0 0Coral Gables 4 4 0 0 0 0Cutler Bay 57 57 0 0 0 0Doral 122 18 0 35 11 58El Portal 8 8 0 0 0 0Hialeah Gardens 3 0 0 0 0 3Hialeah 4 2 0 0 0 2Key Biscayne 2 2 0 0 0 0Medley 6 0 0 0 2 4Metropolitan Dade County 12 2 0 0 3 7Page II-68Regional Hazards Analysis
Statewide Regional Evacuation Studies ProgramVolume 1-11 South FloridaCommunity NameRepetitive Loss2-4 Other Condo Non-SFStructuresFamily Res Assoc. Res.Miami Beach 17 3 2 8 2 2Miami Gardens 23 21 0 0 0 2Miami Lakes 8 4 0 0 0 4Miami Springs 19 15 0 0 0 4City of Miami 515 322 62 57 20 54Miami-Dade County 4,634 3,912 175 155 92 300North Miami Beach 4 2 2 0 0 0North Miami 4 2 2 0 0 0Opa Locka 2 0 0 0 0 2Palmetto Bay 18 16 0 0 0 2Pinecrest 20 15 0 0 0 5South Miami 17 12 0 0 0 5Sunny Isles Beach 5 0 0 5 0 0Sweetwater 150 118 32 0 0 0Virginia Gardens 4 2 0 2 0 0West Miami 44 44 0 0 0 0Monroe County 4 2 0 0 0 2Marathon 272 198 34 10 12 18Big Pine Key 141 133 4 2 2 0Summer Land Key 170 156 8 0 0 6Islamorada 98 48 10 8 8 24Cudjoe Key 154 146 3 0 2 2Ramrod Key 33 31 2 0 0 0Lower Matecumbe 5 0 2 3 0 0Key Largo 203 173 6 5 9 10Key Colony Beach 40 4 2 24 9 11Grassy Key 18 4 0 2 6 6Long Key 2 0 0 0 2 0Marathon Shores 14 8 2 0 4 0Plantation 7 2 0 0 3 2Sugar Loaf Key 30 26 0 0 0 4Big Coppitt Key 10 4 0 0 0 6Stock Island 6 0 0 0 0 6Tavernier 40 37 0 0 0 3Little Torch Key 24 24 0 0 0 0Key West 731 531 54 29 19 98Big Torch Key 2 2 0 0 0 0Dunnellon 2 2 0 0 0 0Matecumbe 2 2 0 0 0 0Sugar Loaf Shores 8 8 0 0 0 0Source: Local Mitigation Strategy Plans for Broward, Miami-Dade and Monroe Counties; and FloridaDivision of Emergency Management, National Flood Insurance Program (numbers based on latestRepetitive Loss List, dated 06/30/09)Regional Hazards AnalysisPage II-69
Volume 1-11 South FloridaStatewide Regional Evacuation Studies ProgramD. Wildfires and the Urban InterfaceFlorida is home to millions of residents who enjoy the state'sbeautiful scenery and warm climate. But few people realizethat these qualities also create severe wildfire conditions.Each year, thousands of acres of wildland and many homesare destroyed by fires that can erupt at any time of the yearfrom a variety of causes, including arson, lightning and debrisburning. Adding to the fire hazard is the growing number ofpeople living in new communities built in areas that wereonce wildland. This growth places even greater pressure onthe state's wildland firefighters. As a result of this growth,fire protection becomes everyone's responsibility (FloridaDivision of Emergency Management, 2008www.floridadisaster.org/bpr/EMTOOLS/wildfire/wildfire.htm)1. Wildfire Hazard ProfileA wildfire is any fire occurring in the wildlands (i.e. grasslands, forest, brushland, etc).Wildfires have burned across the woodlands of Florida for centuries and are part of thenatural management of much of Florida’s ecosystems (Statewide Hazard Mitigation Plan,2009). There are four types of forest fires:• Surface fires are the most common type of wildfire burns along the floor of the forest,moving slowly killing or damaging trees.• Ground fires (muck fires) are usually started by carelessness, burn on or below theforest floor. These fires are hard to detect and even harder to extinguish.• Crown fires are spread rapidly by the wind and move fastest of all types of fires byjumping along the tops of trees.• Wildland-Urban Interface (WUI) fires are in a geographical area where structures andother human development meet or intermingle with wildlands or vegetative fuels.Florida’s typical fire season is from January to May. During relatively dry months, thepotential for wildfires increases dramatically. The driest months, combined with lowhumidity and high wind, have the highest number of fires reported (January, February andMarch). During these months, fine fuels (i.e. grass, leaves, pine needles) are in optimalburning condition. The largest number of fires caused by lightning occurs in July, coincidingwith the peak of the thunderstorm season.Each wildfire, especially near development, can threaten human life, structures and naturalresources. Urban development has moved into wildland areas where the hazard is moresevere and fire control is more difficult.Page II-70Regional Hazards Analysis
Statewide Regional Evacuation Studies ProgramVolume 1-11 South Florida2. History of Wildfire in the State of FloridaFlorida’s typical forest fire season is the dry portion of the year between January and May.The largest number of naturally caused fires occurs in July due to lightning and coincideswith the height of the thunderstorm season. However, lightning accounts for only 11.7% ofthe fires started during 1974-1990. Other sources are manmade, including arson,carelessness, debris/trash burning, and operating equipment that may emit sparks.Because so much of the State is comprised of timber lands, a major portion of the State isvulnerable to forest fires, although the threat to the population at large is not consideredsignificant.In the Spring of 1985 a drought that had been underway in the state since August 1984created numerous spot fires around the state. On May 16, 1985, a wildfire was discoveredwest of the Palm Coast Development in Flagler County. Palm Coast is a 42,000 acreplanned community situated in the coastal plain flat woods along the East Coast of Florida.A wildfire burned through Palm Coast and destroyed 100 homes, damaged 200 more andburned 13,000 acres. This disaster was a mixed wildland-urban interface fire associatedwith urban sprawl type development where the hydro-period is drastically altered and cutsthe land into many unmanaged tracts of fire vulnerable wildlands.In 1989, there were a record number of acres burned (645,326) as a result of 7,291 fires.A large percentage of the acres burned were located in the Everglades. A record number ofwildfires occurred in 1981, with 14,042 fires that burned 587,400 acres as a result of adrought that started in July of 1980 and continued throughout 1981. In 1985, anotherdrought stricken year, there were 8,261 fires that burned 443,811 acres.From 1981 through 1996, an average of 6,080 wildfires occurred per year, burning219,725 acres. Because of changing weather conditions, the yearly figures range from alow of 3,985 wildfires (86,944 acres burned) in 1991 to a record high of 14,042 wildfires(587,400 acres burned) in 1981. Florida experienced a record high (645,326 acres burned)in 1989 as a result of drought conditions around the state.The beginning months of 1998 brought widespread flooding. After the rain stopped,severe drought conditions developed and lasted from April through June of 1998. As aresult of the extreme drought conditions, high temperatures and buildup of flammablewildland fuels, the 1998 wildfires began. The first fire broke out on May 25 in theApalachicola National Forest. In a two-month period, almost 500,000 acres of the state hadburned in approximately 2,300 separate wildfires. The cost of this event reached over $160million. The wildfires of 1998 damaged or destroyed over 300 homes and the value of losttimber exceeded $300 million.Spring/Summer 2007 - The wildfires that put much of Florida in a several weeks-longsmoky haze were started May 5 by a lightning strike on Bugaboo Island in Georgia'sOkefenokee National Wildlife Refuge. Thick smoke from area wildfires forced officials toclose stretches of I-75 and I-10 in northern Florida. A section of I-95 in Duval County, fromPecan Park to State Road A1A, was also closed due to smoke, as was a section of I-75 inBroward County, near fire-ravaged Collier County in southern Florida. The fires scorched atRegional Hazards AnalysisPage II-71
Volume 1-11 South FloridaStatewide Regional Evacuation Studies Programleast 212,000 acres, according to the joint information center, a coalition of state andfederal agencies. Of those acres, 101,000 were in Florida and about 111,000 were inGeorgia. Interstate 75 was closed from Valdosta, Georgia, south to Lake City, Florida andInterstate 10 was closed from Sanderson, Florida, eastward to Live Oak.3. Wildland-Urban Interface (WUI)The Florida Division of Forestry (DOF) provides risk maps for wildfire. The web-based risksystem produces maps for Level of Concern (LOC), Fuels, Wildland Fire Susceptibility Index(WFSI), and the likelihood of the number of fires per 1000 acres per year (FOA).Unfortunately, the website does not offer a vulnerability output in terms of dollars lost andthe data was last updated in 2005. Data layers are in the process of being updated alongwith DOF’s new web-based mapping risk assessment program, due out in late 2009 or early2010.The Wildland Fire Risk Assessment System (FRAS) combines indices of Wildland FireSusceptibility and Fire Effects to generate a “Level of Concern” map. Data layers used todevelop the Wildland Fire Susceptibility Index include: fuel and crown closure classificationsand non-burnable areas from Landsat data, and topographic and fire weather data fromexisting data sets.The Fire Effects Index uses data layers derived from a variety of existing data sets. Thesedata included location of critical facilities, forest plantations, utility corridors, urban interfaceareas, roads, and firefighting resource locations; as well as, suppression cost--based on soiland fuel types.The Levels of Concern (LOC) were computed by multiplying the Wildland Fire SusceptibilityIndices by the Fire Effects Indices. The LOC values were then assigned to nine categoriesof risk and mapped for each Florida Division of Forestry District.Another component of FRAS is the Fire Response Accessibility Index (FRAI). The FRAI is arelative measure of travel time from the nearest fire station to reach a particular mappedcell. Values are assigned into one of six categories of time ranging from class 1 (greaterthan 120 minutes) to class 6 (0-14 minutes). Accessibility is based on the location of roadsand wildland firefighting resource dispatch stations. The Fire Response Accessibility Index iscoupled with the Levels of Concern data on District maps.The fire behavior model, FlamMap, is used in FRAS. FlamMap calculates the behavior of afire occurring in each 30x30 meter cell under defined weather conditions given topographic,fuels, and crown closure data.Figure II-17 illustrates the risk for wildfire within the region using the data provided by theFlorida Division of Forestry.Page II-72Regional Hazards Analysis
Statewide Regional Evacuation Studies ProgramVolume 1-11 South FloridaRegional Hazards AnalysisPage II-73
Volume 1-11 South FloridaStatewide Regional Evacuation Studies ProgramE. Hazardous Materials Incidents1. OverviewHazardous Materials are part of everyday life inAmerica. The good things chemicals bring into ourlives have become vital to us. Although majorchemical emergencies are extremely rare, therealways remains a chance that one will occur. In theState of Florida, the county emergency managementagencies plan for hazardous materials incidents andcoordinate regionally for response through the LocalEmergency Planning Committees (LEPCs).2. History of the Local EmergencyPlanning Committees (LEPCs)Public awareness of the potential danger from accidental releases of hazardous substanceshas increased over the years as serious chemical accidents have occurred around the world,including a significant release in Bhopal, India in 1984 that killed thousands, and a morelocalized event in Institute, West Virginia. In response to this public concern and thehazards that exist, the U.S. Environmental Protection Agency (EPA) began its ChemicalEmergency Preparedness Program (CEPP) in 1985. CEPP was a voluntary program toencourage state and local authorities to identify hazards in their areas and to plan forpotential chemical emergencies. This local planning complemented emergency responseplanning carried out at the national and regional levels by the National Response Team andRegional Response Teams organized by EPA, the U.S. Coast Guard, and the NationalOceanic and Atmospheric Administration (NOAA).The following year, Congress enacted many of the elements of CEPP in the EmergencyPlanning and Community Right-to-Know Act of 1986 (EPCRA), also known as Title III of theSuperfund Amendments and Reauthorization Act of 1986 (SARA). This law required statesto establish State Emergency Response Commissions and Local Emergency PlanningCommittees to develop emergency response plans for each community. EPCRA alsorequired facilities to make information available to the public on the hazardous chemicalsthey have on site. EPCRA’s reporting requirements foster a valuable dialogue betweenindustry and local communities on hazards to help citizens become more informed about thepresence of hazardous chemicals that might affect public health and the environment.According to OSHA requirements, workers on site also have a right to know about thehazardous chemicals to which they could be exposed.The South Florida LEPC (SoFlaLEPC) was created in 1988 to help the public and emergencyresponders address hazardous materials public safety issues. The focus of the committee ison planning, regional coordination, education and awareness. LEPCs can be found in everyState. In Florida, the LEPCs are organized in conjunction with the eleven Regional PlanningCouncils, which provide staff support with funding from the Florida Division of EmergencyPage II-74Regional Hazards Analysis
Statewide Regional Evacuation Studies ProgramVolume 1-11 South FloridaManagement. District 11, which incorporates the counties of Broward, Miami-Dade andMonroe Counties, and their respective jurisdictions, meets quarterly beginning in Februaryof each year. LEPC members are appointed by the State Emergency Response Commissionfor Hazardous Materials (SERC), a policy board appointed by the Governor, whichadministers the hazardous materials (HAZMAT) laws for the U.S. Environmental ProtectionAgency (EPA) at the Florida level; and at the local level, through the 11 LEPCs statewide.The Chairman of the SERC is the Secretary of the Department of Community Affairs and theAlternate Chairman is the Director of the Division of Emergency Management. Membershipof the LEPC represents 15 occupational categories as follows: Elected State and LocalOfficials, Law Enforcement, Civil Defense/Emergency Management, Firefighting, First Aid,Health and Safety, Local Environmental, Hospital, Transportation, Broadcast and PrintMedia, Community Groups, Facility Owners and Operators, Non-Elected Local Officials,Water Management District and Interested Citizens.3. South Florida LEPC Mission StatementThe mission of the SoFlaLEPC is to partner with citizens, facilities, and local emergencymanagement officials to protect communities from the adverse effects of hazardousmaterials in District XI. To support this goal, the SoFlaLEPC is committed to the followingobjectives:a. The SoFlaLEPC shall prepare hazardous materials emergency plans whichindicate the facilities that store, use, or produce hazardous substances at or aboveestablished threshold amounts and that are located in District 11;• Data collected for the plans is used in responding to and recovering from arelease or spill of hazardous or toxic substances. These plans are reviewed andupdated by the annually and are approved by the Florida Division of EmergencyManagement (FDEM) on behalf of the Commission.b. The SoFlaLEPC shall serve as the repository for District 11 reports filed underEPCRA;• FDEM has undertaken a restructuring of how facilities report their chemicalinventories of both hazardous and extremely hazardous substances underSections 311/312 of EPCRA in Florida. Online filing is now available viaFloridaHMIS.org and the information is available for public review at theSoFlaLEPC office.c. The SoFlaLEPC shall direct regional implementation activities and perform associatedoutreach functions to increase awareness and understanding of and compliancewith the EPCRA as well as the RMP programs.d. The SoFlaLEPC shall play an active role in risk communication, publiceducation, industry outreach, mitigation and emergency planning associatedwith the Clean Air Act and Risk Management Planning.Regional Hazards AnalysisPage II-75
Volume 1-11 South FloridaStatewide Regional Evacuation Studies Program4. Hazards Analysis of Hazardous MaterialsAny facility, public or private, that has at any given time during the year, extremelyhazardous materials at or above established threshold amounts is required to reportannually. It is termed a Section 302 facility (relating to the clause in EPCRA which pertainsto Extremely Hazardous Substances facilities). A hazards analysis on the facility is usuallyperformed by the county in which the facility is located. See Figure II-18 for maps showingthe general location of Section 302 facilities in District 11.The hazard analysis looks at the amounts of hazardous materials present, the risk to thesurrounding community, public facilities vulnerable to potential release such as schools,hospitals, etc. Additionally, any facility which possesses in excess of 10,000 pounds, ahazardous material for which the Occupational Safety and Health Administration (OSHA)requires the facility to keep a Material Safety Data Sheet is also required to render theannual report.While the number of hazardous substance facilities continues to increase as awareness ofthe law reaches various segments of the community, over the years EPCRA has beensuccessful in reducing facilities possessing extremely hazardous substances (EHSs) byencouraging them to seek alternative products that do not require reporting and thuspayment of the reporting fee. The reporting deadline each year is March 1 st . Within theSouth Florida LEPC (District 11), there were 427 Section 302 (EHS) facilities reporting in2007, out of 3,415 statewide (13%), and 1,760 facilities reporting under Sections 311/312,out of a total of 10,455 statewide (17%).District 11 had 345 hazardous material incidents in 2007, which was 16 percent of the totalof 2,125 incidents statewide. District 11 possesses very low proportions of most Section302 chemicals by weight and volume in the State of Florida. The exceptions in 2007 werehydrogen peroxide, of which over half was located in South Florida, and chlorine, with 27%.The ten top Section 302 chemicals reported in District 11 for 2007 are as follows:Page II-76Regional Hazards Analysis
Statewide Regional Evacuation Studies ProgramVolume 1-11 South FloridaTable II-14District 11 Top Ten Section 302 Chemicals, 2007Chemical2006 MaximumInventory (lbs)2007 MaximumInventory (lbs)Change from2006 (lbs)Percent ofStatewideInventory, 2007Sulfuric Acid 5,358,676 16,810,244 11,451,568 4.1%Chlorine* 5,097,344 5,609,404 512,060 27.3%Ammonia* 744,665 837,311 92,646 0.3%Hydrogen Peroxide ** 576,759 ** 51.0%Methyl Bromide 167,264 98,310 -68,954 1.3%Formaldehyde 102,220 77,303 -24,917 ***Sulfur Dioxide* 59,000 61,000 2,000 2.2%Nitric Acid* 148,309 52,675 -95,634 0.2%Vinyl Acetate ** 45,000 ** ***Endosulfan 80,533 37,646 -42,887 **** These chemicals are also covered under the Clean Air Act, Section 112.** Did not appear on the 2006 top ten list for District XI*** Did not appear on the 2007 top ten list for the StateSource: State Emergency Response Commission for Hazardous Materials, Annual Report 2008a. CAMEOfm, MARPLOT and ALOHA UpdateAccidental releases involving hazardous chemicals occur frequently in the United States.Therefore, the U.S. Environmental Protection Agency (EPA), the National Oceanic andAtmospheric Administration (NOAA) and firefighters collaborated to develop theComputer Aided Management of Emergency Operations (CAMEO) software system morethan twenty years ago. The CAMEO system is a combination of three programs thatwork independently or in conjunction to give hazardous materials planners and firstresponders the tools to plan for and respond to hazardous materials releases. Astechnology has advanced, numerous revisions have been made to the software. Themost recent update was released in November 2010.One of the programs, CAMEO filemaker (CAMEOfm), contains a chemical library thatprovides planners and responders with important information on a multitude ofchemicals and chemical mixtures. The program also allows the user to create achemical information database for individual facilities that have hazardous materials onsite. CAMEOfm can automatically calculate a vulnerable zone for a simulated or actualchemical release based on specific data entered by the user. The Chemical Library wasalso updated with the latest Acute Exposure Guideline Levels (AEGLs). The AEGLs areToxic Levels of Concern that can be used to predict the area in which a toxic gasRegional Hazards AnalysisPage II-77
Volume 1-11 South FloridaStatewide Regional Evacuation Studies Programconcentration may be high enough to harm people. Finally, minor changes were madeto the Reactivity Report that is used to predict possible reactions that might occur whentwo or more chemicals are mixed.The second program, Mapping Application for Response and Planning of LocalOperational Tasks (MARPLOT), is a typical Geographic Information System (GIS) withmultiple layers that allow the user to view major roads, secondary roads, water bodies,railroads, and other features on selected maps. It also allows the user to plot featureslike chemical facilities and critical facilities (schools, hospitals, day care centers, etc.) andidentify evacuation routes on the maps. MARPLOT may be used in conjunction withCAMEOfm to map a vulnerable zone around a release point and identify populationswithin the zone that may be affected by a chemical release. The upgraded version ofMARPLOT correctly displays multiple plume footprints.The third program, Areal Locations of Hazardous Atmospheres (ALOHA), was developedto allow the user to model dispersion of a hazardous chemical release. ALOHA givesemergency planners and responders the capability to model chemical plumes. The userchooses from a variety of criteria such as, location, date, time, atmospheric conditions,type/size of container, assorted hole sizes and shapes, source (puddle, gas pipeline etc.)to plot a footprint. In the updated version of ALOHA, users can now estimate thehazards associated with jet fires (flares), pool fires, vapor cloud explosions, BoilingLiquid Expanding Vapor Explosions (BLEVEs), and flammable regions (flashfires), as wellas downwind toxic threats.Over the years, CAMEO has become the most widely used hazardous materialsemergency planning and response tool in Florida and the United States. In fact, Floridanow requires electronic submission of hazards analyses in CAMEOfm format from localemergency planners. The software is provided at no cost and can be downloaded fromthe EPA website (www.epa.gov/ceppo/cameo/).b. South Florida Hazardous Material Emergency PlanComprehensive planning depends upon a clear understanding of what hazards exist andwhat risk they pose for the community. To gain this understanding, the Florida Divisionof Emergency Management has contracted with the counties within the South FloridaLocal Emergency Planning Committee (LEPC) district to conduct site-specific hazardanalyses for airborne releases of extremely hazardous substances (EHSs) covered underSection 302 of EPCRA. The hazards analyses are made available to the South FloridaLEPC and serve as the basis for developing and revising the emergency response plansthat are mandatory under the law.The hazards analyses included in this section of the plan are designed to consider allpotential acute health hazards within the South Florida LEPC area and to identify whichhazards are of high priority and should be addressed in the emergency responseplanning process. There are hundreds of facilities in the South Florida LEPC area thatare subject to the requirements of EPCRA and the number that have notified the StateEmergency Response Commission for Hazardous Materials (SERC), the LEPC, and thelocal jurisdictional fire department in accordance with the provisions of EPCRA havePage II-78Regional Hazards Analysis
Statewide Regional Evacuation Studies ProgramVolume 1-11 South Floridagrown significantly. A complete set of hazards analyses are available through the SouthFlorida LEPC.The hazards analysis for the South Florida LEPC area consists of the following threecomponents:(1) Hazards Identification – provides specific information on situations that have thepotential for causing injury to life or damage to property. A hazards identificationincludes information about:a) Chemical identities;b) The location of facilities that use, produce, process, or store hazardous materials;c) The type and design of chemical container or vessel;d) The quantity of material that could be involved in an airborne release; ande) The nature of the hazard (e.g., airborne toxic vapors or mists which are theprimary focus of this guide; also other hazards such as fire, explosion, largequantities stored or processed, handling conditions) most likely to accompanyhazardous materials spills or releases.(2) Vulnerability Analysis – identifies areas in the community that may be affected orexposed, individuals in the community who may be subject to injury or death fromcertain specific hazardous materials, and what facilities, property, or environment maybe susceptible to damage should a hazardous materials release occur. A comprehensivevulnerability analysis provides information on:a) The extent of the vulnerable zones (i.e., an estimation of the area that may beaffected in a significant way as a result of a spill or release of a known quantityof a specific chemical under defined conditions);b) The population, in terms of numbers, density, and types of individuals that couldbe within a vulnerable zone;c) The private and public property that may be damaged, including essentialsupport systems and transportation facilities and corridors; andd) The environment that may be affected, and the impact of a release on sensitivenatural areas and endangered species.(3) Risk Analysis is an assessment by the community of the likelihood (probability) of anaccidental release of a hazardous material and the actual consequences that mightoccur, based on the estimated vulnerable zones. The risk analysis is a judgment ofprobability and severity of consequences based on the history of previous incidents,local experience, and the best available current technological information. It providesan estimation of:a) The likelihood (probability) of an accidental release based on the history ofcurrent conditions and controls at the facility, consideration of any unusualenvironmental conditions, or the possibility of simultaneous emergency incidents;b) Severity of consequences of human injury that may occur, the number ofpossible injuries and deaths, and the associated high-risk groups; andc) Severity of consequences of damage to critical facilities, property, and theenvironment.Regional Hazards AnalysisPage II-79
Volume 1-11 South FloridaStatewide Regional Evacuation Studies ProgramThe hazards analysis summaries for 504 facilities in the South Florida LEPC area,updated or in the process of updating for FY 2008-09, that have reported to the StateEmergency Response Commission in compliance with Sections 302 and 303 of EPCRA,are provided in the Regional Hazardous Material Emergency Response Plan.Emergencies involving hazardous materials can be postulated as ranging from a minoremergency with no off-site effects to a major emergency that may result in an off-siterelease of hazardous/toxic materials. The overall objective of chemical emergencyresponse planning and preparedness is to minimize exposure for a spectrum ofemergencies that could produce off-site levels of contamination in excess of Levels ofConcern (LOCs) established by the US Environmental Protection Agency. Minimizing thisexposure will reduce the consequences of an emergency to persons in the area nearbyfacilities that manufacture, store or process hazardous materials.No specific emergency sequence can be isolated as the model for which to plan becauseeach emergency could have different consequences, both in nature and degree. As analternative to defining a specified emergency, the regional plan identifies variousparameters for planning which are based upon knowledge of the possible consequences,timing, and release characteristics of a spectrum of emergencies. The SoFlaLEPCHazardous Materials Emergency Response Plan then establishes the appropriateresponse for each level of threat. Therefore the Statewide Regional Evacuation Studywill not specifically address hazardous material incidents.c. Hazardous Materials Commodity Flow StudyThe Section 302 Facility Hazards Analysis discussed in the previous section identifieshazardous materials at fixed facilities, but does not address potential hazards arisingfrom the transportation hazardous materials. LEPCs often perform Regional HazardousMaterials Commodity Flow studies to determine what hazardous materials are beingtransported through their respective regions. The SoFlaLEPC has not performed aHazardous Materials Commodity Flow Study in recent years.Page II-80Regional Hazards Analysis
Statewide Regional Evacuation Studies ProgramVolume 1-11 South FloridaFigure II-18Section 302 Facilities in the South Florida RegionRegional Hazards AnalysisPage II-81
Volume 1-11 South FloridaStatewide Regional Evacuation Studies ProgramF. Terrorism and Domestic Security1. OverviewTerrorism is the use of force or violence against persons or propertyin violation of the criminal laws of the United States for purposes ofintimidation, coercion, or ransom.Terrorists often use threats to:• Create fear among the public.• Try to convince citizens that their government is powerless toprevent terrorism.• Get immediate publicity for their causes.Acts of terrorism include threats of terrorism, assassinations, kidnappings, hijackings, bombscares and bombings, cyber attacks (computer-based) and the use of chemical, biological,nuclear and radiological weapons.High-risk targets for acts of terrorism include military and civilian government facilities,international airports, large cities, and high-profile landmarks. Terrorists might also targetlarge public gatherings, water and food supplies, utilities, and corporate centers. Further,terrorists are capable of spreading fear by sending explosives or chemical and biologicalagents through the mail.a. ExplosionsTerrorists have frequently used explosive devices as one of their most commonweapons. Terrorists do not have to look far to find out how to make explosive devices;the information is readily available in books and other information sources. Thematerials needed for an explosive device can be found in many places including variety,hardware and auto supply stores. Explosive devices are highly portable using vehiclesand humans as a means of transport. They are easily detonated from remote locationsor by suicide bombers.Conventional bombs have been used to damage and destroy financial, political, socialand religious institutions. Attacks have occurred in public places and on city streets withthousands of people around the world injured and killed.b. Biological ThreatsBiological agents are organisms or toxins that can kill or incapacitate people, livestockand crops. The three basic groups of biological agents that would likely be used asweapons are bacteria, viruses and toxins. Most biological agents are difficult to growand maintain. Many break down quickly when exposed to sunlight and otherenvironmental factors, while others, such as anthrax spores, are very long lived.Biological agents can be dispersed by spraying them into the air, by infecting animalsPage II-82Regional Hazards Analysis
Statewide Regional Evacuation Studies ProgramVolume 1-11 South Floridathat carry the disease to humans and by contaminating food and water. Deliverymethods include:• Aerosols – biological agents are dispersed into the air, forming a fine mist that maydrift for miles. Inhaling the agent may cause disease in people or animals.• Animals – some diseases are spread by insects and animals, such as fleas, mice,flies, mosquitoes and livestock.• Food and water contamination – some pathogenic organisms and toxins may persistin food and water supplies. Most microbes can be killed, and toxins deactivated, bycooking food and boiling water. Most microbes are killed by boiling water for oneminute, but some require longer.• Person-to-person – spread of a few infectious agents is also possible. Humans havebeen the source of infection for smallpox, plague and the Lassa viruses.c. Chemical ThreatsChemical agents are poisonous vapors, aerosols, liquids and solids that have toxiceffects on people, animals or plants. They can be released by bombs or sprayed fromaircraft, boats and vehicles. They can be used as a liquid to create a hazard to peopleand the environment. Some chemical agents may be odorless and tasteless. They canhave an immediate effect (a few seconds to a few minutes) or a delayed effect (2 to 48hours). While potentially lethal, chemical agents are difficult to deliver in lethalconcentrations. Outdoors, the agents often dissipate rapidly. Chemical agents also aredifficult to produce.A chemical attack could come without warning. Signs of a chemical release includepeople having difficulty breathing, experiencing eye irritation, losing coordination,becoming nauseated or having a burning sensation in the nose, throat and lungs. Also,the presence of many dead insects or birds may indicate a chemical agent release.d. Nuclear BlastA nuclear blast is an explosion with intense light and heat, a damaging pressure wave,and widespread radioactive material that can contaminate the air, water, and groundsurfaces for miles around. A nuclear device can range from a weapon carried by anintercontinental missile launched by a hostile nation or terrorist organization, to a smallportable nuclear devise transported by an individual. All nuclear devices cause deadlyeffects when exploded, including blinding light, intense heat (thermal radiation), initialnuclear radiation, blast, fires started by the heat pulse, and secondary fires caused bythe destruction.(1) Hazards of Nuclear DevicesThe extent, nature, and arrival time of these hazards are difficult to predict. Thegeographical dispersion of hazard effects will be defined by the following:• Size of the device. A more powerful bomb will produce more distant effects.• Height above the ground the device was detonated. This will determine theextent of blast effects.Regional Hazards AnalysisPage II-83
Volume 1-11 South FloridaStatewide Regional Evacuation Studies Program• Nature of the surface beneath the explosion. Some materials are more likely tobecome radioactive and airborne than others. Flat areas are more susceptible toblast effects.• Existing meteorological conditions. Wind speed and direction will affect arrivaltime of fallout; precipitation may wash fallout from the atmosphere.(2) Radioactive FalloutEven if individuals are not close enough to the nuclear blast to be affected by thedirect impacts, they may be affected by radioactive fallout. Any nuclear blast resultsin some fallout. Blasts that occur near the earth’s surface create much greateramounts of fallout than blasts that occur at higher altitudes. This is because thetremendous heat produced from a nuclear blast causes an up-draft of air that formsthe familiar mushroom cloud. When a blast occurs near the earth’s surface, millionsof vaporized dirt particles also are drawn into the cloud. As the heat diminishes,radioactive materials that have vaporized condense on the particles and fall back toEarth. The phenomenon is called radioactive fallout. This fallout material decaysover a long period of time, and is the main source of residual nuclear radiation.Fallout from a nuclear explosion may be carried by wind currents for hundreds ofmiles if the right conditions exist. Effects from even a small portable deviceexploded at ground level can be potentially deadly.Nuclear radiation cannot be seen, smelled, or otherwise detected by normal senses.Radiation can only be detected by radiation monitoring devices. This makesradiological emergencies different from other types of emergencies, such as floodsor hurricanes. Monitoring can project the fallout arrival times, which will beannounced through official warning channels. However, any increase in surfacebuild-up of gritty dust and dirt should be a warning for taking protective measures.In addition to other effects, a nuclear weapon detonated in or above the earth’satmosphere can create an electromagnetic pulse (EMP), a high-density electricalfield. An EMP acts like a stroke of lightning but is stronger, faster, and shorter. AnEMP can seriously damage electronic devices connected to power sources orantennas. This includes communication systems, computers, electrical appliances,and automobile or aircraft ignition systems. The damage could range from a minorinterruption to actual burnout of components. Most electronic equipment within1,000 miles of a high-altitude nuclear detonation could be affected. Batterypoweredradios with short antennas generally would not be affected. Although anEMP is unlikely to harm most people, it could harm those with pacemakers or otherimplanted electronic devices.e. Radiological Dispersion Device (RDD)Terrorist use of an RDD – often called “dirty nuke” or “dirty bomb” – is considered farmore likely than use of a nuclear explosive device. An RDD combines a conventionalexplosive device – such as a bomb – with radioactive material. It is designed to scatterdangerous and sub-lethal amounts of radioactive material over a general area. SuchPage II-84Regional Hazards Analysis
Statewide Regional Evacuation Studies ProgramVolume 1-11 South FloridaRDDs appeal to terrorists because they require limited technical knowledge to build anddeploy compared to a nuclear device. Also, the radioactive materials in RDDs are widelyused in medicine, agriculture, industry, and research, and are easier to obtain thanweapons grade uranium or plutonium.The primary purpose of terrorist use of an RDD is to cause psychological fear andeconomic disruption. Some devices could cause fatalities from exposure to radioactivematerials. Depending on the speed at which the area of the RDD detonation wasevacuated or how successful people were at sheltering-in-place, the number of deathsand injuries from an RDD might not be substantially greater than from a conventionalbomb explosion.The size of the affected area and the level of destruction caused by an RDD woulddepend on the sophistication and size of the conventional bomb, the type of radioactivematerial used, the quality and quantity of the radioactive material and the localmeteorological conditions – primarily wind and precipitation. The area affected could beplaced off-limits to the public for several months during cleanup efforts.2. The Regional Domestic Security Task Forces (RDSTFs)Following 9/11, Florida divided itself into seven Regional Domestic Security Task Forces.These regions follow the Florida Department of Law Enforcement (FDLE) regions within theState. The South East Florida RDSTF (Region 7) consists of four counties: Palm Beach,Broward, Miami-Dade and Monroe.The goal of the RDSTF is to provide a regional response to any weapons of massdestruction (WMD) or terrorist incident that may occur within the State. It allows smallercounties that do not have lots of resources to draw from those that do. It also allows thesesmaller counties to provide assistance to larger metropolitan areas if an event occurs there.Addressing security issues at a regional level also allows for “economies of scale” forhomeland security funds, especially in recent years as the amount of Department ofHomeland Security funding to the States has decreased. Florida has been routinely hailedas a model for domestic security planning throughout the nation as a result of this regionalapproach.3. History of EventsThere have been no terrorist events in recent history in the South Florida Region.4. Vulnerability AssessmentsThe Regional Domestic Security Task Forces (RDSTFs) in the state are in the process ofidentifying critical infrastructure and key resources (CI/KR) as defined by Department ofHomeland Security (DHS) in the National Infrastructure Protection Plan (NIPP). Thisinformation will allow for county and regional profiles to be developed outlining risk versusvulnerabilities. Once complied, the region will use a tiering methodology developed by DHSand modified to support regional needs to prioritize the identified CI/KR. Vulnerabilityassessments will be completed to support mitigation efforts. Emergency Operating PlansRegional Hazards AnalysisPage II-85
Volume 1-11 South FloridaStatewide Regional Evacuation Studies Programhave been developed and validated to respond to emergency events ensuring the citizens ofFlorida are protected and safe when responding to emergency events.Similar to Hazardous Material incidents, no specific emergency sequence can be isolated asthe model for which to plan for evacuation caused by a terrorist event because eachemergency could have different consequences, both in nature and degree. As analternative to defining a specified emergency, the regional and county plans identify variousparameters for planning which are based upon knowledge of the possible consequences,timing, and target characteristics of a spectrum of emergencies. The plan then establishesthe appropriate response for each level of threat. Therefore, the Statewide RegionalEvacuation Study will not address terrorist acts specifically.G. Nuclear Power Plant IncidentsFlorida is home to five commercial nuclear reactors located at three sites:• Crystal River Nuclear Power Plant (NW of Crystal River)• St. Lucie Nuclear Power Plant (Units 1 & 2, SE of Ft. Pierce)• Turkey Point Nuclear Power Plant (Units 3 & 4, South of Miami)Two additional reactors are located in Alabama near the State line:• Farley Nuclear Power Plant (SE of Dothan, Alabama)1. Description of the Turkey Point Nuclear Power PlantTurkey Point Units 3 and 4 are part of the larger Florida Power and Light (FPL) Turkey PointPlant located in unincorporated Miami-Dade County, Florida. The Turkey Point Plantcomprises 11,000 acres and has five steam electric generating units. Units 1, 2 and 5 arefossil fuel-fired and Units 3 and 4 are nuclear-powered. All five of the steam electricgenerating units are in the developed area of the Turkey Point Plant, which liesapproximately 8 miles east of Florida City, and 4.5 miles east of the southeastern limits ofthe City of Homestead. It is approximately 9 miles east of the intersection of U.S. Highway1 and Palm Drive (SW 344 th Street).The five existing power generation units and support facilities occupy approximately 130acres of the 11,000-acre Turkey Point Plant. Turkey Point Units 3 and 4 are south of TurkeyPoint Units 1, 2 and 5, and comprise approximately 30 acres. Support facilities includeservice buildings, an administration building, fuel oil tanks, water treatment facilities,circulating water intake and outfall structures, wastewater treatment basins, and a systemsubstation. The cooling canal system occupies approximately 5,900 acres. The two 400-megawatt fossil fuel-fired steam electric generation units at the Turkey Point Plant havebeen in service since 1967 (Unit 1) and 1968 (Unit 2). These units currently burn residualfuel oil and/or natural gas with a maximum equivalent sulfur content of 1 percent. The two700-MW pressurized water nuclear reactor units have been in service since 1972 (Unit 3)and 1973 (Unit 4). Turkey Point Unit 5 is a 1,120-MW combined cycle unit that beganoperation in 2007.Page II-86Regional Hazards Analysis
Statewide Regional Evacuation Studies ProgramVolume 1-11 South FloridaTurkey Point Units 1 through 5 share a single switchyard that supplies power to the 230-kilovolt (kV) transmission lines leaving the Plant. Transmission lines exit the Turkey PointPlant in two corridors, one traveling to the west and one to the north. The Florida City –Turkey Point transmission line leaves the Turkey Point Plant to the west for approximately 5miles, where it connects to the Florida City substation. The Florida City corridor is 330 feetwide and traverses undeveloped land for most of its distance. Seven other lines leave theTurkey Point Plant to the north, in a second 330-foot wide corridor. This corridor extendsapproximately 19 miles to the Davis substation, located in southwest Miami at SW 136 thStreet and SW 127 th Avenue. The Turkey Point Unit 3 and 4 power blocks have beenelevated to 18 feet (msl) to mitigate flooding and wave impacts.In January 2008, FPL submitted an application to increase the capacity of the two existingnuclear reactors. The Turkey Point Uprate Project will increase the electrical output fromboth Units 3 and 4 without changing the footprint of the existing plants. The increase in theoutput of the Plant will be accomplished by modifications to the existing plant equipmentand will require no new construction. The two units will require modifications to theturbine-generators and attendant support and control systems. All turbine modifications willincorporate state-of-the-art technology that will provide greater efficiency in the turbinesresulting in fuel savings over the long term. The Project will also require an increase inreactor power or thermal megawatts. The increased reactor power will manifest itself in ahigher reactor coolant exit temperature and the heat transfer through the steam generatorswill increase. The Project will allow each unit to increase gross power by about 14 percent.Net electrical generation per unit is expected to increase from about 700 MW to about 804MW. The net increase will be about 104 MW per unit for a two-unit total of about 208 MW.The Turkey Point Plant has received re-licensing approval from the federal NuclearRegulatory Commission (NRC) for Unit 3 through 2032 and Unit 4 through 2033. The poweruprates at the Turkey Point Plant will be implemented in 2012. FPL plans to perform thephysical work associated with the Turkey Point Uprate Project at the time of normallyscheduled refueling outages in 2010, 2011 and 2012. The estimated cost of the uprate atTurkey Point Units 3 and 4 is approximately $750 million.Florida Power and Light also submitted a Site Certification Application to the FloridaDepartment of Environmental Protection (DEP) on June 30, 2009. If approved, theapplication would allow FPL to expand nuclear energy production at its Turkey Point facility.The proposed project consists of the construction of two new 1,100 megawatt (MW) nuclearunits, 6 and 7, and supporting facilities, as well as the placement of new transmission lines.The State of Florida would license both the transmission lines and new electrical powerplants in one proceeding pursuant to the State Power Plant Siting Act (PPSA), Chapter 403,Part II, Florida Statutes.The two nuclear generating units with supporting buildings, facilities and equipment will belocated due south of the existing Turkey Point plant site, east of the cooling canals.Associated facilities proposed in or around the new or existing plant sites include parkingareas; a nuclear administration and training building, a reclaimed water treatment facilityand treated reclaimed water delivery pipelines; radial collector wells and delivery pipelines,for cooling water backup; and an equipment barge unloading area. A new electricalsubstation (Clear Sky) will be constructed on the Turkey Point site. A 230-kV transmissionRegional Hazards AnalysisPage II-87
Volume 1-11 South FloridaStatewide Regional Evacuation Studies Programline will also be needed to connect the new substation to the existing substation on theplant property. Proposed off-site facilities include: 1) transmission lines and systemimprovements within Miami-Dade County, City of Miami, Coral Gables, Doral, Homestead,Medley, Palmetto Bay, Pinecrest, and South Miami and 2) the creation or expansion ofaccess roads and bridges (between SW 328 th Street and SW 359 th Street and east of SW137 th Avenue).2. Summary of IncidentsThe Division of Emergency Management’s Radiological Emergencies Program has the overallresponsibility for coordination of the response to a nuclear power plant emergency byfederal, state and local agencies. The Division also has the overall authority andresponsibility for updating and coordinating the plans with other response organizations.The Nuclear/Radiological Incident Annex provides an organized and integratedcapability for a timely, coordinated response by Federal agencies to terrorist incidentsinvolving nuclear or radioactive materials (Incidents of National Significance), and accidentsor incidents involving such material that may or may not rise to the level of an Incident ofNational Significance. The Department of Homeland Security (DHS) is responsible foroverall coordination of all actual and potential Incidents of National Significance, includingterrorist incidents involving nuclear materials.Therefore, the South Florida Region Evacuation Study will not address nuclear power plantincidents.However, two noteworthy events are mentioned below, neither of which required anevacuation related to the nuclear facilities.In August, 1992, Turkey Point was directly hit by Hurricane Andrew, causing damage to awater tank and to a smokestack of one of the site's fossil-fueled units. No damage wasdone to the plant's containment buildings. The plant was built to withstand winds of up to235 mph (380 km/h), greatly exceeding the maximum winds recorded by Category 5hurricanes.On February 26, 2008, both reactors were shut down due to the loss of off-site powerduring a widespread power outage in South Florida. At least 2.5 million people werewithout power. The blackout was initially caused by an overheated voltage switch that sooncaught fire in a power substation in Miami, nowhere near the plant. The fire occurred at1:08 pm, which caused an automatic shutdown of the power plant. This led to a dominoeffect that caused outages as far north as Daytona Beach and Tampa. Power was restoredby 4:30 pm. Walt Disney World, Orlando International Airport, and Miami InternationalAirport were among the places affected by the outage.Page II-88Regional Hazards Analysis
Statewide Regional Evacuation Studies ProgramVolume 1-11 South FloridaH. TsunamiTsunamis, also called seismic sea waves or, incorrectly, tidal waves, generally are caused byearthquakes, less commonly by submarine landslides, infrequently by submarine volcaniceruptions and very rarely by a large meteorite impact in the ocean. Submarine volcaniceruptions have the potential to produce truly awesome tsunami waves.The possibility of a tsunami impacting the Atlantic or Gulf Coasts of Florida is considered to beremote. This is because most tsunamis are associated with major earthquakes. The AtlanticOcean basin is not ringed by large faults as is the Pacific, which is associated both withearthquakes and tsunamis. It is thought that rare underwater landslides would pose a greaterrisk in the Atlantic Ocean. The Caribbean region has a history of both earthquakes andtsunamis. They do not appear to have impacted Florida’s coastlines. However because of thehorrific tsunami that impacted South East Asia in December 2004 and in recognition of the factthat a tsunami occurrence is possible, the Federal government has decided to expand itswarning system to include the Atlantic and Gulf Coasts of the United States.There is no history of significant tsunami activity in the region.Although it is highly unlikely that a tsunami will impact Florida, it is not impossible. It is vital toknow (and instruct children) that if the ocean suddenly recedes from the shore do not standand stare. It is necessary immediately to run uphill or away from the shore and go to thehighest location possible which may mean up the stairs of a substantial building. Everyoneshould be aware that no matter where in the world they are, if the sea is observed to recedefrom the shore, they should immediately run for high ground.Since it is impossible to predict the exact location, timing or extent of a tsunami event, thetsunami hazards was not specifically addressed in the Statewide Regional Evacuation Study.Regional Hazards AnalysisPage II-89
Volume 1-11 South FloridaStatewide Regional Evacuation Studies ProgramThis page intentionally left blank.Page II-90Regional Hazards Analysis