Annual Report 2009 (PDF 2 MB) - Wellington Institute of Technology
Annual Report 2009 (PDF 2 MB) - Wellington Institute of Technology Annual Report 2009 (PDF 2 MB) - Wellington Institute of Technology
2009 2009 2008Actual Budget Actual$000 $000 $00016. RETAINED EARNINGSOpening balance 69 1,343 (552)Net Profit 3,747 1,543 621Balance at end of financial year 3,816 2,886 6917. RESERVESOpening balance 21,065 17,539 16,982Revaluation increments 386 - 4,083Balance at end of financial year 21,451 17,539 21,065These reserves have been generated by the revaluation of equipment, land and buildings undertaken by Darroch Limited (see note 9).18. NOTES TO THE CASH FLOW STATEMENTFINANCIAL STATEMENTS(a) Reconciliation of cash and cash equivalentsFor the purposes of the cash flow statement, cash and cash equivalents includes cash on hand and in banks and investments in moneymarket instruments, net of outstanding bank overdrafts. Cash and cash equivalents at the end of the financial year as shown in the cash flowstatement is reconciled to the related items in the balance sheet as follows:Operating Funds: 1,717 1,080 (1,889)Designated Funds:- Campus development 9,150 3,650 7,966- Fit-out reinstatement 1,125 - -11,992 4,730 6,077(b) Reconciliation of profit for the period to net cash flows from operating activitiesProfit for the period 2,997 1,543 621Add/(less) non-cash items:Depreciation and amortisation of non-current assets 5,640 6,174 5,422Income recognised from gifted non-current assets (63) - -(Gain)/loss on sale or disposal of non-current assets 3 - 10Loss on write off of non-current assets 513 650 596Doubtful debts expense 31 - 68Add/(less) movements in working capital items:(increase)/decrease in receivables (521) 1,128 (1,702)(Increase)/decrease in inventories (144) 25 (25)(increase)/decrease in prepayments 22 22 227Increase/(decrease) in payables 422 (675) (106)Increase/(decrease) in provisions (281) (6) 614Increase/(decrease) in other current liabilities 1,727 (324) (1,230)Net cash flow from operating activities 10,346 8,536 4,49519. ACTIVITY-BASED MANAGEMENT INFORMATIONThe information in this note has been sourced from the Activity Based Management (ABM) model Wellington Institute of Technologyimplemented in 2007.WELLINGTON INSTITUTE OF TECHNOLOGY | 2009 ANNUAL REPORT43
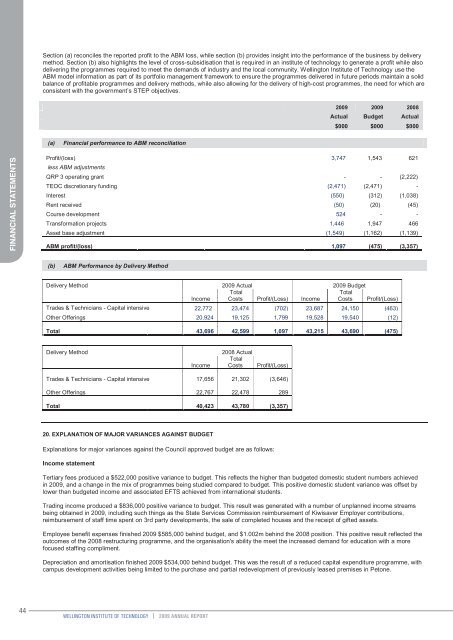
Section (a) reconciles the reported profit to the ABM loss, while section (b) provides insight into the performance of the business by deliverymethod. Section (b) also highlights the level of cross-subsidisation that is required in an institute of technology to generate a profit while alsodelivering the programmes required to meet the demands of industry and the local community. Wellington Institute of Technology use theABM model information as part of its portfolio management framework to ensure the programmes delivered in future periods maintain a solidbalance of profitable programmes and delivery methods, while also allowing for the delivery of high-cost programmes, the need for which areconsistent with the government’s STEP objectives.2009 2009 2008Actual Budget Actual$000 $000 $000(a)Financial performance to ABM reconciliationFINANCIAL STATEMENTSProfit/(loss) 3,747 1,543 621less ABM adjustmentsQRP 3 operating grant - - (2,222)TEOC discretionary funding (2,471) (2,471) -Interest (550) (312) (1,038)Rent received (50) (20) (45)Course development 524 - -Transformation projects 1,446 1,947 466Asset base adjustment (1,549) (1,162) (1,139)ABM profit/(loss) 1,097 (475) (3,357)(b)ABM Performance by Delivery MethodDelivery Method 2009 Actual 2009 BudgetTotalTotalIncome Costs Profit/(Loss) Income Costs Profit/(Loss)Trades & Technicians - Capital intensive 22,772 23,474 (702) 23,687 24,150 (463)Other Offerings 20,924 19,125 1,799 19,528 19,540 (12)Total 43,696 42,599 1,097 43,215 43,690 (475)Delivery MethodIncome2008 ActualTotalCostsProfit/(Loss)Trades & Technicians - Capital intensive 17,656 21,302 (3,646)Other Offerings 22,767 22,478 289Total 40,423 43,780 (3,357)20. EXPLANATION OF MAJOR VARIANCES AGAINST BUDGETExplanations for major variances against the Council approved budget are as follows:Income statementTertiary fees produced a $522,000 positive variance to budget. This reflects the higher than budgeted domestic student numbers achievedin 2009, and a change in the mix of programmes being studied compared to budget. This positive domestic student variance was offset bylower than budgeted income and associated EFTS achieved from international students.Trading income produced a $836,000 positive variance to budget. This result was generated with a number of unplanned income streamsbeing obtained in 2009, including such things as the State Services Commission reimbursement of Kiwisaver Employer contributions,reimbursement of staff time spent on 3rd party developments, the sale of completed houses and the receipt of gifted assets.Employee benefit expenses finished 2009 $585,000 behind budget, and $1.002m behind the 2008 position. This positive result reflected theoutcomes of the 2008 restructuring programme, and the organisation's ability the meet the increased demand for education with a morefocused staffing compliment.Depreciation and amortisation finished 2009 $534,000 behind budget. This was the result of a reduced capital expenditure programme, withcampus development activities being limited to the purchase and partial redevelopment of previously leased premises in Petone.44WELLINGTON INSTITUTE OF TECHNOLOGY | 2009 ANNUAL REPORT
- Page 4 and 5: New Strategic Alliance with Metro G
- Page 6 and 7: In August, the Government introduce
- Page 10 and 11: STUDENT SUCCESSThe Tertiary Educati
- Page 13 and 14: Advisory Committees 2009ADVISORY CO
- Page 15 and 16: STATEMENT OF OBJECTIVES AND SERVICE
- Page 17 and 18: STATEMENT OF OBJECTIVES AND SERVICE
- Page 19 and 20: STATEMENT OF OBJECTIVES AND SERVICE
- Page 21 and 22: STATEMENT OF OBJECTIVES AND SERVICE
- Page 23 and 24: STATEMENT OF OBJECTIVES AND SERVICE
- Page 25 and 26: STATEMENT OF OBJECTIVES AND SERVICE
- Page 27 and 28: Wellington Institute of TechnologyS
- Page 29 and 30: Impairment of AssetsAt each reporti
- Page 31 and 32: DepreciationDepreciation has been p
- Page 33 and 34: Income StatementFor the year ended
- Page 35 and 36: Balance SheetAs at 31 December 2009
- Page 37 and 38: Notes to the Financial Statements20
- Page 39 and 40: 2009 2009 2008Actual Budget Actual$
- Page 41: 2009 2009 2008Actual Budget Actual$
- Page 45 and 46: 23. LEASES(a) Leasing arrangementsW
- Page 47 and 48: AUDIT REPORT48WELLINGTON INSTITUTE
- Page 49 and 50: AUDIT REPORT50WELLINGTON INSTITUTE
Section (a) reconciles the reported pr<strong>of</strong>it to the ABM loss, while section (b) provides insight into the performance <strong>of</strong> the business by deliverymethod. Section (b) also highlights the level <strong>of</strong> cross-subsidisation that is required in an institute <strong>of</strong> technology to generate a pr<strong>of</strong>it while alsodelivering the programmes required to meet the demands <strong>of</strong> industry and the local community. <strong>Wellington</strong> <strong>Institute</strong> <strong>of</strong> <strong>Technology</strong> use theABM model information as part <strong>of</strong> its portfolio management framework to ensure the programmes delivered in future periods maintain a solidbalance <strong>of</strong> pr<strong>of</strong>itable programmes and delivery methods, while also allowing for the delivery <strong>of</strong> high-cost programmes, the need for which areconsistent with the government’s STEP objectives.<strong>2009</strong> <strong>2009</strong> 2008Actual Budget Actual$000 $000 $000(a)Financial performance to ABM reconciliationFINANCIAL STATEMENTSPr<strong>of</strong>it/(loss) 3,747 1,543 621less ABM adjustmentsQRP 3 operating grant - - (2,222)TEOC discretionary funding (2,471) (2,471) -Interest (550) (312) (1,038)Rent received (50) (20) (45)Course development 524 - -Transformation projects 1,446 1,947 466Asset base adjustment (1,549) (1,162) (1,139)ABM pr<strong>of</strong>it/(loss) 1,097 (475) (3,357)(b)ABM Performance by Delivery MethodDelivery Method <strong>2009</strong> Actual <strong>2009</strong> BudgetTotalTotalIncome Costs Pr<strong>of</strong>it/(Loss) Income Costs Pr<strong>of</strong>it/(Loss)Trades & Technicians - Capital intensive 22,772 23,474 (702) 23,687 24,150 (463)Other Offerings 20,924 19,125 1,799 19,528 19,540 (12)Total 43,696 42,599 1,097 43,215 43,690 (475)Delivery MethodIncome2008 ActualTotalCostsPr<strong>of</strong>it/(Loss)Trades & Technicians - Capital intensive 17,656 21,302 (3,646)Other Offerings 22,767 22,478 289Total 40,423 43,780 (3,357)20. EXPLANATION OF MAJOR VARIANCES AGAINST BUDGETExplanations for major variances against the Council approved budget are as follows:Income statementTertiary fees produced a $522,000 positive variance to budget. This reflects the higher than budgeted domestic student numbers achievedin <strong>2009</strong>, and a change in the mix <strong>of</strong> programmes being studied compared to budget. This positive domestic student variance was <strong>of</strong>fset bylower than budgeted income and associated EFTS achieved from international students.Trading income produced a $836,000 positive variance to budget. This result was generated with a number <strong>of</strong> unplanned income streamsbeing obtained in <strong>2009</strong>, including such things as the State Services Commission reimbursement <strong>of</strong> Kiwisaver Employer contributions,reimbursement <strong>of</strong> staff time spent on 3rd party developments, the sale <strong>of</strong> completed houses and the receipt <strong>of</strong> gifted assets.Employee benefit expenses finished <strong>2009</strong> $585,000 behind budget, and $1.002m behind the 2008 position. This positive result reflected theoutcomes <strong>of</strong> the 2008 restructuring programme, and the organisation's ability the meet the increased demand for education with a morefocused staffing compliment.Depreciation and amortisation finished <strong>2009</strong> $534,000 behind budget. This was the result <strong>of</strong> a reduced capital expenditure programme, withcampus development activities being limited to the purchase and partial redevelopment <strong>of</strong> previously leased premises in Petone.44WELLINGTON INSTITUTE OF TECHNOLOGY | <strong>2009</strong> ANNUAL REPORT


