Push & Pull Assessment Push & Pull Assessment
Push & Pull Assessment Push & Pull Assessment
Push & Pull Assessment Push & Pull Assessment

You also want an ePaper? Increase the reach of your titles
YUMPU automatically turns print PDFs into web optimized ePapers that Google loves.
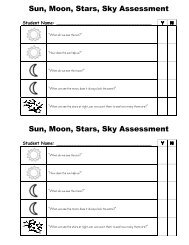
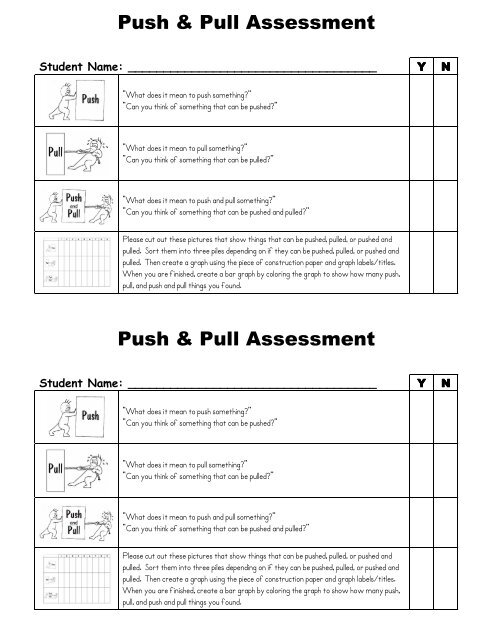
<strong>Push</strong> & <strong>Pull</strong> <strong>Assessment</strong>Student Name: ___________________________________ Y N“What does it mean to push something?”“Can you think of something that can be pushed?”“What does it mean to pull something?”“Can you think of something that can be pulled?”“What does it mean to push and pull something?”“Can you think of something that can be pushed and pulled?”Please cut out these pictures that show things that can be pushed, pulled, or pushed andpulled. Sort them into three piles depending on if they can be pushed, pulled, or pushed andpulled. Then create a graph using the piece of construction paper and graph labels/titles.When you are finished, create a bar graph by coloring the graph to show how many push,pull, and push and pull things you found.<strong>Push</strong> & <strong>Pull</strong> <strong>Assessment</strong>Student Name: ___________________________________ Y N“What does it mean to push something?”“Can you think of something that can be pushed?”“What does it mean to pull something?”“Can you think of something that can be pulled?”“What does it mean to push and pull something?”“Can you think of something that can be pushed and pulled?”Please cut out these pictures that show things that can be pushed, pulled, or pushed andpulled. Sort them into three piles depending on if they can be pushed, pulled, or pushed andpulled. Then create a graph using the piece of construction paper and graph labels/titles.When you are finished, create a bar graph by coloring the graph to show how many push,pull, and push and pull things you found.
<strong>Assessment</strong> Directions:1. Cut out picture cards. Show all picture cards to student, asking student question prompts.2. Record student response in the question prompt box or on the reverse side of the assessment sheet.3. Record “y” or “n” based on students understanding of the standard and benchmark.4. Distribute student graphing sheets.5. Distribute large sheet of 12x18 piece of construction paper.6. Distribute student push, pull, and push & pull pictures.7. Distribute student graph labels/titles.8. Allow student to create a push, pull, and push & pull graph.NOTE:Many of the pictures could be placed in more than one category. Prompt students to put pictures in the space where push, pull,or push & pull is/are being used the most. If students are able to “explain” or “justify” why they put a picture under a category,credit should be given.
Student Pictures for <strong>Push</strong> and <strong>Pull</strong> Construction Paper Graph
<strong>Push</strong> and <strong>Pull</strong> Bar Graph
Student Titles/Labels for <strong>Push</strong> and <strong>Pull</strong> Construction Paper Graph