Skills for Study Level 2 Teacher's Book - Cambridge University Press
Skills for Study Level 2 Teacher's Book - Cambridge University Press
Skills for Study Level 2 Teacher's Book - Cambridge University Press

You also want an ePaper? Increase the reach of your titles
YUMPU automatically turns print PDFs into web optimized ePapers that Google loves.
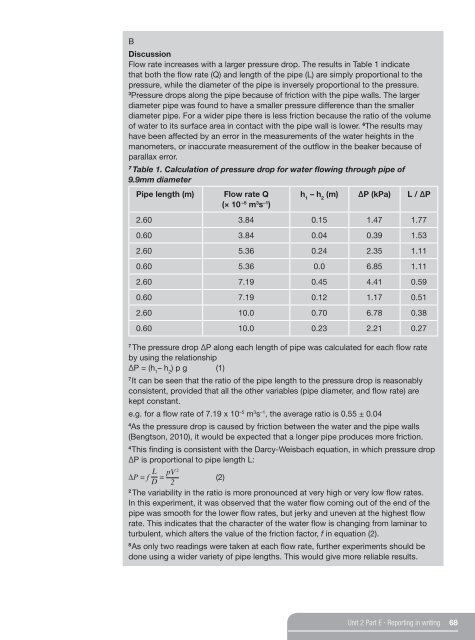
BDiscussionFlow rate increases with a larger pressure drop. The results in Table 1 indicatethat both the flow rate (Q) and length of the pipe (L) are simply proportional to thepressure, while the diameter of the pipe is inversely proportional to the pressure.3<strong>Press</strong>ure drops along the pipe because of friction with the pipe walls. The largerdiameter pipe was found to have a smaller pressure difference than the smallerdiameter pipe. For a wider pipe there is less friction because the ratio of the volumeof water to its surface area in contact with the pipe wall is lower. 6 The results mayhave been affected by an error in the measurements of the water heights in themanometers, or inaccurate measurement of the outflow in the beaker because ofparallax error.7Table 1. Calculation of pressure drop <strong>for</strong> water flowing through pipe of9.9mm diameterPipe length (m)Flow rate Q(× 10 –5 m 3 s –1 )h 1– h 2(m) ΔP (kPa) L / ΔP2.60 3.84 0.15 1.47 1.770.60 3.84 0.04 0.39 1.532.60 5.36 0.24 2.35 1.110.60 5.36 0.0 6.85 1.112.60 7.19 0.45 4.41 0.590.60 7.19 0.12 1.17 0.512.60 10.0 0.70 6.78 0.380.60 10.0 0.23 2.21 0.277The pressure drop ∆P along each length of pipe was calculated <strong>for</strong> each flow rateby using the relationshipΔP = (h 1– h 2) p g (1)7It can be seen that the ratio of the pipe length to the pressure drop is reasonablyconsistent, provided that all the other variables (pipe diameter, and flow rate) arekept constant.e.g. <strong>for</strong> a flow rate of 7.19 x 10 –5 m 3 s –1 , the average ratio is 0.55 ± 0.044As the pressure drop is caused by friction between the water and the pipe walls(Bengtson, 2010), it would be expected that a longer pipe produces more friction.4This finding is consistent with the Darcy-Weisbach equation, in which pressure dropΔP is proportional to pipe length L:ΔP = f LD = pV 2(2)22The variability in the ratio is more pronounced at very high or very low flow rates.In this experiment, it was observed that the water flow coming out of the end of thepipe was smooth <strong>for</strong> the lower flow rates, but jerky and uneven at the highest flowrate. This indicates that the character of the water flow is changing from laminar toturbulent, which alters the value of the friction factor, f in equation (2).8As only two readings were taken at each flow rate, further experiments should bedone using a wider variety of pipe lengths. This would give more reliable results.Unit 2 Part E ∙ Reporting in writing 68