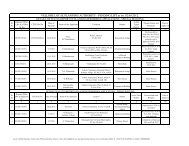
1. Area and Population - Vellore District
1. Area and Population - Vellore District
1. Area and Population - Vellore District

Create successful ePaper yourself
Turn your PDF publications into a flip-book with our unique Google optimized e-Paper software.
<strong>1.</strong>2.POPULATION BY BROAD INDUSTRIAL CATEGORIES OF WORKERSSl.NoIndustrial CategoryPersons<strong>District</strong>% to totalworkersPersonsTamil Nadu% to totalworkers(1) (2) (3) (4) (5) (6)<strong>1.</strong> Total Main Workers1172645 33.72 22799066 94.23Cultivatorsa) Agricultural Laboursb) Household Industry Manufacturing,Processing, Servicing <strong>and</strong> Repairsc) Other Workers23284023273113649157058319.8619.851<strong>1.</strong>6448.6656640907896295802956843572523.4132.643.3234.862 Marginal Workers2545357.3213952775.77Total WorkersNon Workers142718020501374<strong>1.</strong>0458.962419434331664603100_Total <strong>Population</strong> 3477317_55858946_Source: Census of India 2001
<strong>1.</strong>3 POPULATION BY RELIGIONSl.NoReligionYear : 2005-2006Persions in <strong>District</strong>Rural Urban TotalMale Female Total Male Female Total Male Female Total1 Hindu 1033987 1026298 2060285 478067 478010 956077 1512054 1504908 30169622 Muslim 30280 29944 60224 145491 145056 290547 175771 175000 3507713 Christian 22680 23294 45974 26827 29676 56503 49507 52970 1024774 Sikh 112 82 194 186 155 341 298 237 5355 Buddhist 60 52 112 138 130 268 198 182 3806 Jain 155 173 328 1612 1549 3161 1767 1722 34897 OtherReligions53 38 91 113 93 206 166 131 2978 Religionsnot stated763 748 1511 559 336 895 1322 1084 2406Source: Census of India 200<strong>1.</strong>
<strong>1.</strong>4. POPULATION BY AGE GROUPSSl.No Age Groups Persons in<strong>District</strong>s(in’00’)Persons in Tamil Percent to total inNadu(in ‘00’) <strong>District</strong> Tamil Nadu(1) (2) (3) (4) (5) (6)<strong>1.</strong> 0-142. 15-293. 30-444. 45-595. 60 <strong>and</strong> aboveTotalNOTAVAILABLESource: Census of India 200<strong>1.</strong><strong>1.</strong>5 POPULATION OF THE DISTRICT DECENNIAL GROWTHPeriod(Subject to theperiod ofavailability)[1991]Region<strong>Population</strong>[ 2001Census]Percentage VariationSince previous Census(1) (2) (3) (4)3026432 Total 3477317 14.902066718 Rural 2169319 4.96959714 Urban 1307998 36.29Source: Census of India 200<strong>1.</strong>
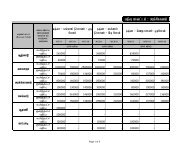
<strong>1.</strong>6 SALINET FEATURES 0F 2001 CENSUS -- BLOCK AND MUNICIPALITY WISESl.NoName of theBlock/MunicipalityMunicipalitiesDensity per sq.kmFemales per1000 malesIncrease in<strong>Population</strong>since 1991 in%Urban/Rural<strong>Population</strong> in%<strong>1.</strong> <strong>Vellore</strong> 16814.99 1014.5 <strong>1.</strong>24 49.12. Arcot 665<strong>1.</strong>53 998.5 10.50 27.93. Ranipet 5768.38 1047.5 10.94 22.34. Walajah 11080.83 1002.6 9.28 13.95. Arakkonam 8684.99 988.8 9.40 49.86. Gudiyatham 19092.28 1010.8 9.88 36.47. Ambur 5310.45 1020.6 3<strong>1.</strong>24 5<strong>1.</strong>58. Vaniyambadi 9549.22 1004.6 18.40 4<strong>1.</strong>29. Thirupattur 1309<strong>1.</strong>61 984.7 10.12 30.8Blocks1 <strong>Vellore</strong> 2138.69 1003.8 15.37 82.2/17.82 Kaniyambadi 888.96 1012.2 27.22 34.3/65.73 Anaicut 1153.49 997.5 9.52 19.9/80.14 Gudiyattam 2374.89 1002.4 12.96 39.9/60.15 Pernambut 752.31 1004.9 1<strong>1.</strong>96 26.2/73.86 K.V.Kuppam 1395.13 1006.9 1<strong>1.</strong>66 0.0/100.07 Katpadi 1763.03 1013.4 26.03 59.5/40.58 Wallajah 367.98 1007.8 18.56 49.3/50.79 Sholingur 437.01 994.5 13.78 19.8/80.210 Arcot 153<strong>1.</strong>93 1004.0 15.46 48.4/5<strong>1.</strong>611 Thimiri 385.80 101<strong>1.</strong>5 5.04 24.9/75.112 Arakkonam 824.09 974.1 1<strong>1.</strong>76 60.9/39.113 Nemili 465.10 997.8 10.49 13.7/86.314 Kaveripakkam 469.99 998.1 10.10 7.9/92.115 Tirupattur 1557.97 976.9 14.72 30.8/69.216 K<strong>and</strong>ili 546.74 964.5 19.68 0.0/100.017 Natrampalli 509.93 979.8 18.34 9.7/90.318 Jolarpet 1012.35 978.5 15.96 16.0/84.019 Alangayam 889.20 985.0 17.95 52.5/47.520 Madhanur 122<strong>1.</strong>81 1015.5 16.22 5<strong>1.</strong>5/48.5812.58 997.2Source: Census of India 2001
<strong>1.</strong>6 SALINET FEATURES 0F 2001 CENSUS -- BLOCK AND MUNICIPALITY WISESl.NoName of theBlock/MunicipalityLiteracy rate amongMale (%) Female (%)S.C. <strong>Population</strong>in %S.T. <strong>Population</strong>in %Municipalities<strong>1.</strong> <strong>Vellore</strong> 88.48 74.76 1<strong>1.</strong>58 0.192. Arcot 90.50 76.23 1<strong>1.</strong>67 0.353. Ranipet 93.25 82.28 29.04 0.084. Walajah 90.29 76.01 10.03 0.175. Arakkonam 94.42 82.19 22.66 0.896. Gudiyatham 87.57 7<strong>1.</strong>93 14.88 0.037. Ambur 85.87 73.29 14.42 0.308. Vaniyambadi 84.26 72.71 13.58 0.079. Thirupattur 87.96 75.00 15.77 0.42Blocks1 <strong>Vellore</strong> 87.73 73.58 15.64 0.432 Kaniyambadi 86.99 66.60 17.14 0.563 Anaicut 77.41 56.50 22.02 7.474 Gudiyattam 8<strong>1.</strong>99 62.65 23.06 0.415 Pernambut 76.85 57.78 33.75 0.846 K.V.Kuppam 82.95 62.00 25.57 0.907 Katpadi 88.25 72.06 16.05 0.338 Wallajah 88.06 70.02 18.64 0.219 Sholingur 83.50 59.65 15.69 0.6810 Arcot 84.90 64.26 17.08 0.4011 Thimiri 80.76 57.61 25.61 <strong>1.</strong>0412 Arakkonam 88.79 7<strong>1.</strong>43 23.10 <strong>1.</strong>5013 Nemili 80.59 56.27 26.66 <strong>1.</strong>3414 Kaveripakkam 80.03 55.83 26.59 <strong>1.</strong>3115 Tirupattur 78.24 59.92 22.05 <strong>1.</strong>8816 K<strong>and</strong>ili 74.68 53.21 16.88 <strong>1.</strong>6517 Natrampalli 76.16 53.84 14.45 0.1118 Jolarpet 75.90 55.15 12.07 3.1419 Alangayam 75.41 58.90 15.17 9.5720 Madhanur 82.51 66.79 24.09 2.35Source: Census of India 2001