Download Full PDF - 28.09 MB - The Society of Irish Foresters
Download Full PDF - 28.09 MB - The Society of Irish Foresters Download Full PDF - 28.09 MB - The Society of Irish Foresters
Crop Structure and Productivity for Unthinned Sitka Spruce 45closely related to volume productivity. Finally it was necessary to seeif the main remaining crop variable likely to influence production,i.e. stems per ha. (S) might improve volume/height and basal area/ht.relationships. Some comparisons were made.To see which of the two productivity categories, basal area ordominant diameter, was more closely related to volume at any topheight, the residuals of the Y estimates from observed values inequation (1) were compared with those in (3) and (4). (1) and (3)volume-basal area, compared best.To determine the best relationship of volume to basal area, to topdiameter and to top height in terms of more than one variable aregression of volume on basal area was first calculated giving thefollowing equation:(5) Vs= -833.8008+54.0466-1.9267G2+.0074G3 (F=167)Basal area was then combined with Rd and G. The best fit was themultiple linear equation:(6) Vs= -46.05122+1.5803G+.3472 RdG (F=1069)Combination of G with Dd 2 were less promising the best of thesebeing:(7) V8= 132.1615+.0123 Dd2G-.3953Dd2 (F= 475)and with Dd and Rd.(8) V 8= 17.8757+ 11.4782Rd+.01693 Dd 2 (F=275).Number of stems (S) was combined with Rd, G and Dd but itsinclusion with these variables made no improvement on equations(6) to (8). Equations relating to V t to the above variables weresimilar to those mentioned above, differing slightly in intercepts andcoefficients.It can be seen then that a production class range of volumes, basalareas, and diameters for top height can be calculated on the basis ofa range of curves within which 95 % of the crops sampled would fall.Total stemwood volume is of the order of20m. 3 greater than volumeto 8 cm. top diameter over the range of top heights sampled. Basalarea is more closely related to volume than is dominant diameter andis a better index by which to determine productivity class. Bestcalculations for volume involve a linear combination of basal areaand top height. The variation in volume per hectare for a top heightranges from 160 m. 3 to about 200 m 3 .YIELD CLASSESConsiderable problems were encountered when trying to estimateyield classes or classes of potential maximum mean annual incrementfrom the stands sampled. The main limitation was the sparsity ofcrops at or near rotation age.From the data assembled, however, an attempt has been made to
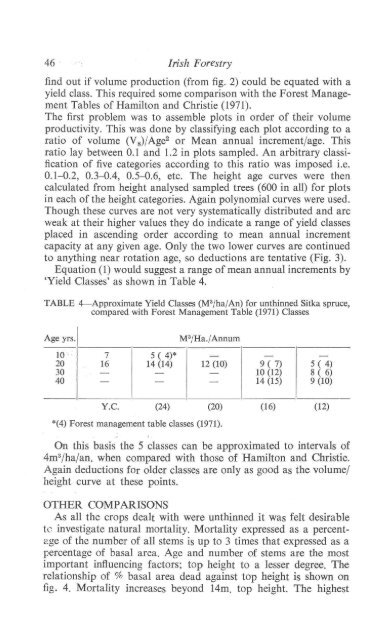
46 Irish Forestryfind out if volume production (from fig. 2) could be equated with ayield class. This required some comparison with the Forest ManagementTables of Hamilton and Christie (1971).The first problem was to assemble plots in order of their volumeproductivity. This was done by classifying each plot according to aratio of volume (V s)/Age 2 or Mean annual increment/age. Thisratio lay between 0.1 and 1.2 in plots sampled. An arbitrary classificationof five categories according to this ratio was imposed i.c.0.1-0.2, 0.3-0.4, 0.5-0.6, etc. The height age curves were thencalculated from height analysed sampled trees (600 in all) for plotsin each of the height categories. Again polynomial curves were used.Though these curves are not very systematically distributed and arcweak at their higher values they do indicate a range of yield classesplaced in ascending order according to mean annual incrementcapacity at any given age. Only the two lower curves are continuedto anything near rotation age, so deductions are tentative (Fig. 3).Equation (1) would suggest a range of mean annual increments by'Yield Classes' as shown in Table 4.TABLE 4-Approximate Yield Classes (M3/ha/An) for unthinned Sitka spruce,compared with Forest Management Table (1971) ClassesAge yrsM3/Ha./Annum10 7 5 ( 4)* -20 16 14 (14) 12 (10)30 I -- -40-- -IY.c. (24) (20)*(4) Forest management table classes (1971).- -9 ( 7) 5 ( 4)10 (12) 8 ( 6)14 (15) 9 (10)(16) (12)On this basis the 5 classes can be approximated to intervals of4m 3 /ha/an. when compared with those of Hamilton and Christie.Again deductions for older classes are only as good as the volume!height curve at these points.OTHER COMPARISONSAs all the crops dealt with were un thinned it was feIt desirabletc investigate natural mortality. Mortality expressed as a percentageof the number of all stems is up to 3 times that expressed as apercentage of basal area. Age and number of stems are the mostimportant influencing factors; top height to a lesser degree. Therelationship of % basal area dead against top height is shown onfig. 4. Mortality increases beyond 14m. top height. The highest
- Page 3: Control weedsin forestryplantations
- Page 6 and 7: 'CL;EiCG DU'CCAN,~S [S 'OCI ,ATES L
- Page 8 and 9: McCULLOCHWorlds best-selling CHAIN
- Page 10 and 11: IRISH FORESTRY:CONTENTS(A uthors al
- Page 12 and 13: IRISH FORESTRYVolume 29 1972 No.2Ed
- Page 14 and 15: Some Forestry Problems in the Europ
- Page 16 and 17: Some Forestry Problems in the Europ
- Page 18 and 19: Some Forestry Problems in the Europ
- Page 20 and 21: Some Forestry Problems in the Europ
- Page 22 and 23: Some Forestry Problems in the Europ
- Page 24 and 25: The Response of Sitka Spruce to Sul
- Page 26 and 27: The R esponse of Sitka Spruce to Su
- Page 28 and 29: The R esponse of Sitka Spruce to Su
- Page 30 and 31: The R esponse of Sitka Spruce to Su
- Page 32 and 33: The R esponse of Sitka Spruce to Su
- Page 34 and 35: The R esponse of Sitka Spruce to Su
- Page 36 and 37: The Response 0 fSitka Spruce to Sul
- Page 38 and 39: Labour Cost Trends in ForestNurseri
- Page 40 and 41: Labour Cost Trends in Forest Nurser
- Page 42 and 43: SOJ?e Patterns in Crop Structureand
- Page 44 and 45: Crop Structure and Productivity for
- Page 46 and 47: VB VtI - - --- -VB Vt + +ASHd + +H
- Page 48 and 49: LE 3Crop Structure and Productivity
- Page 50 and 51: Crop Structure and Productivity for
- Page 52 and 53: Crop Structure and Productivity for
- Page 56 and 57: Crop Structure and Productivity for
- Page 58 and 59: Crop Structure and Productivity for
- Page 60 and 61: Crop Structure and Productivity for
- Page 62 and 63: Trees Woods and Literature- · 7A w
- Page 64 and 65: M eetings 55papers were presented,
- Page 66 and 67: Notes and News 57strips, scattered
- Page 68 and 69: Notes and News 59material. Laborato
- Page 70 and 71: Obituary 61opened on 29th May 1968
- Page 72 and 73: Reviews 63includes an Appendix VI b
- Page 74 and 75: Reviews 65where the fine lines of d
- Page 76 and 77: COUNCIL REPORT FOR 1971Following th
- Page 78 and 79: PUBLIC BUSINESSThe main item of pub
- Page 80 and 81: Society Activities 711980 and beyon
- Page 82 and 83: Society Activities 73ill Macroom fo
- Page 84 and 85: cpmCLOIND,ALIKIN PAPER MILtSLIMITED
- Page 86 and 87: COMM,ONWEALTHAGRJCUL,TUR.A,LB,U'R,E
- Page 88 and 89: mltruck that's been-551-ng Ireland
- Page 90 and 91: SOLE IRISH DISTRIBUTORSICAHIR H'OU:
- Page 92 and 93: HINO CARRIES, TH'E TIMBERLOAD'S IN
- Page 94 and 95: THETOUGHONESIC~TERPI LL.ARFORKLI'FT
- Page 96 and 97: BONSIER ROUGH TERRAINTR,U'CKSTHE FO
- Page 98 and 99: PREFIXon top,keep-s weeds... ClownF
- Page 100 and 101: BEFO"RE: PLANTING· TR,EESCONSULT A
- Page 102 and 103: for printingMA,GAZINESREPOR,TSPR.OG
46 <strong>Irish</strong> Forestryfind out if volume production (from fig. 2) could be equated with ayield class. This required some comparison with the Forest ManagementTables <strong>of</strong> Hamilton and Christie (1971).<strong>The</strong> first problem was to assemble plots in order <strong>of</strong> their volumeproductivity. This was done by classifying each plot according to aratio <strong>of</strong> volume (V s)/Age 2 or Mean annual increment/age. Thisratio lay between 0.1 and 1.2 in plots sampled. An arbitrary classification<strong>of</strong> five categories according to this ratio was imposed i.c.0.1-0.2, 0.3-0.4, 0.5-0.6, etc. <strong>The</strong> height age curves were thencalculated from height analysed sampled trees (600 in all) for plotsin each <strong>of</strong> the height categories. Again polynomial curves were used.Though these curves are not very systematically distributed and arcweak at their higher values they do indicate a range <strong>of</strong> yield classesplaced in ascending order according to mean annual incrementcapacity at any given age. Only the two lower curves are continuedto anything near rotation age, so deductions are tentative (Fig. 3).Equation (1) would suggest a range <strong>of</strong> mean annual increments by'Yield Classes' as shown in Table 4.TABLE 4-Approximate Yield Classes (M3/ha/An) for unthinned Sitka spruce,compared with Forest Management Table (1971) ClassesAge yrsM3/Ha./Annum10 7 5 ( 4)* -20 16 14 (14) 12 (10)30 I -- -40-- -IY.c. (24) (20)*(4) Forest management table classes (1971).- -9 ( 7) 5 ( 4)10 (12) 8 ( 6)14 (15) 9 (10)(16) (12)On this basis the 5 classes can be approximated to intervals <strong>of</strong>4m 3 /ha/an. when compared with those <strong>of</strong> Hamilton and Christie.Again deductions for older classes are only as good as the volume!height curve at these points.OTHER COMPARISONSAs all the crops dealt with were un thinned it was feIt desirabletc investigate natural mortality. Mortality expressed as a percentage<strong>of</strong> the number <strong>of</strong> all stems is up to 3 times that expressed as apercentage <strong>of</strong> basal area. Age and number <strong>of</strong> stems are the mostimportant influencing factors; top height to a lesser degree. <strong>The</strong>relationship <strong>of</strong> % basal area dead against top height is shown onfig. 4. Mortality increases beyond 14m. top height. <strong>The</strong> highest


