Download Full PDF - 28.09 MB - The Society of Irish Foresters
Download Full PDF - 28.09 MB - The Society of Irish Foresters Download Full PDF - 28.09 MB - The Society of Irish Foresters
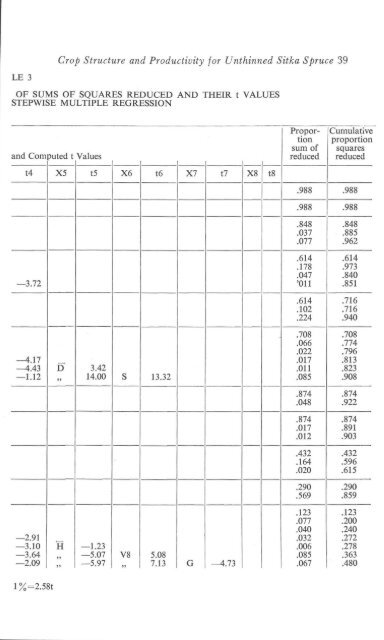
LE 3Crop Structure and Productivity for Unthinned Sitka Spruce 39OF SUMS OF SQUARES REDUCED AND THEIR t VALUESSTEPWISE MULTIPLE REGRESSIONand Computed t Valuest4 X5 t5 X6 t6 X7 t7 X8 t8-3.72-4.17-4.43 i5 3.42-1.1214.00 S 13.32"-2.91-3.10 II -1.23-3.64 -5.07 V8 5.08-2.09 " -5.977.13 G -4.73""1 %=2.58tProportionsum ofreducedCumulativeproportionsquaresreduced.988 .988.988 .988.848 .848.037.077.885.962.614 .614.178 .973.047 .840'011 .851.614 .716.102.224.716.940.708 .708.066 .774.022 .796.017 .813.011 .823.085 .908.874 .874.048 .922.874 .874.017 .891.012 .903.432 .432.164.020.596.615.290 .290.569 .859.123 .123.077 .200.040 .240.032 .272.006 .278.085 .363.067 .480
40 I rish Forestry(a) VolumesLinear regressions of the form v =a + bg were calculated fromsample tree data for all plots where v=mean tree volume,g= mean tree basal area, and a and b are constants. Forvolume to 8 cm. top diameter l v and g were computed from asample of trees 7 cm. D.B.H. and over. For total stemwoodvolume, the volume of a cone, t (.005 x length of top) wasadded to each tree within the sample and small trees wereincluded in the basal area calculation.(b) CorrelationsStepwise multiple regressions were calculated from all variablesto see if any general trends were evident. Selections weremade with each of the following eleven as independentvariables Vs, V t , Hd, 15d, 15. G, Sdd, Gdd, F, v and h."Table 2 shows the correlation matrix. Only coefficients greater than·6 are indicated (+or-). As correlations were fairly predictable thevalues of the coefficients are not shown. Table 3 summarises some ofthe relationships which featured during steps of each selection. Onlyvariables contributing .01 and more to the reduction of sums ofsquares are included in the table. In fact, many crop variables areinterrelated and this is shown in the equations from the eleven selections;These can be outlined:(i) Volume to 8 cm. top diameter (V s ): The inter-relationshipbetween V s and V t accounts for virtually all regression sums ofsquares.(ii) Volume total stemwood (V t ): V s contributed most to theregression. Later in the calculation (not illustrated), S shows a lowpositive relationship suggesting that V t rather than V s increasedwith stocking.(iii) Dominant height (Rd): H ( +) is the first variable to enter theregression. There is a low negative relationship with v (-) suggestinglower ratios with taller stands. There is also a low correlation withAlt (not illustrated).(iv) Dominant diameter(15d): Correlations with 15 (+), Rd (-)and A ( + ) contribute most to the regression.(v) Mean diameter (D): Best correlation are with 15d (+ ), S (-)and G ( +). The influence of stems on diameter is shown here.(vi) Basal area (G): Vs and Alt are positively correlated Hd and Fnegatively. V s accounts for most variation in G.(vii) Percent Stems dead (Sdd): Best correlations are with Gdd( +) and A ( + ).1 Much of the early data were recorded in Imperial measure before metricationand 8 cm. is used as the equivalent of 3 ins top diameter.
- Page 1 and 2: IRISH FORESTRYJournal of the Societ
- Page 3: Control weedsin forestryplantations
- Page 6 and 7: 'CL;EiCG DU'CCAN,~S [S 'OCI ,ATES L
- Page 8 and 9: McCULLOCHWorlds best-selling CHAIN
- Page 10 and 11: IRISH FORESTRY:CONTENTS(A uthors al
- Page 12 and 13: IRISH FORESTRYVolume 29 1972 No.2Ed
- Page 14 and 15: Some Forestry Problems in the Europ
- Page 16 and 17: Some Forestry Problems in the Europ
- Page 18 and 19: Some Forestry Problems in the Europ
- Page 20 and 21: Some Forestry Problems in the Europ
- Page 22 and 23: Some Forestry Problems in the Europ
- Page 24 and 25: The Response of Sitka Spruce to Sul
- Page 26 and 27: The R esponse of Sitka Spruce to Su
- Page 28 and 29: The R esponse of Sitka Spruce to Su
- Page 30 and 31: The R esponse of Sitka Spruce to Su
- Page 32 and 33: The R esponse of Sitka Spruce to Su
- Page 34 and 35: The R esponse of Sitka Spruce to Su
- Page 36 and 37: The Response 0 fSitka Spruce to Sul
- Page 38 and 39: Labour Cost Trends in ForestNurseri
- Page 40 and 41: Labour Cost Trends in Forest Nurser
- Page 42 and 43: SOJ?e Patterns in Crop Structureand
- Page 44 and 45: Crop Structure and Productivity for
- Page 46 and 47: VB VtI - - --- -VB Vt + +ASHd + +H
- Page 50 and 51: Crop Structure and Productivity for
- Page 52 and 53: Crop Structure and Productivity for
- Page 54 and 55: Crop Structure and Productivity for
- Page 56 and 57: Crop Structure and Productivity for
- Page 58 and 59: Crop Structure and Productivity for
- Page 60 and 61: Crop Structure and Productivity for
- Page 62 and 63: Trees Woods and Literature- · 7A w
- Page 64 and 65: M eetings 55papers were presented,
- Page 66 and 67: Notes and News 57strips, scattered
- Page 68 and 69: Notes and News 59material. Laborato
- Page 70 and 71: Obituary 61opened on 29th May 1968
- Page 72 and 73: Reviews 63includes an Appendix VI b
- Page 74 and 75: Reviews 65where the fine lines of d
- Page 76 and 77: COUNCIL REPORT FOR 1971Following th
- Page 78 and 79: PUBLIC BUSINESSThe main item of pub
- Page 80 and 81: Society Activities 711980 and beyon
- Page 82 and 83: Society Activities 73ill Macroom fo
- Page 84 and 85: cpmCLOIND,ALIKIN PAPER MILtSLIMITED
- Page 86 and 87: COMM,ONWEALTHAGRJCUL,TUR.A,LB,U'R,E
- Page 88 and 89: mltruck that's been-551-ng Ireland
- Page 90 and 91: SOLE IRISH DISTRIBUTORSICAHIR H'OU:
- Page 92 and 93: HINO CARRIES, TH'E TIMBERLOAD'S IN
- Page 94 and 95: THETOUGHONESIC~TERPI LL.ARFORKLI'FT
- Page 96 and 97: BONSIER ROUGH TERRAINTR,U'CKSTHE FO
LE 3Crop Structure and Productivity for Unthinned Sitka Spruce 39OF SUMS OF SQUARES REDUCED AND THEIR t VALUESSTEPWISE MULTIPLE REGRESSIONand Computed t Valuest4 X5 t5 X6 t6 X7 t7 X8 t8-3.72-4.17-4.43 i5 3.42-1.1214.00 S 13.32"-2.91-3.10 II -1.23-3.64 -5.07 V8 5.08-2.09 " -5.977.13 G -4.73""1 %=2.58tProportionsum <strong>of</strong>reducedCumulativeproportionsquaresreduced.988 .988.988 .988.848 .848.037.077.885.962.614 .614.178 .973.047 .840'011 .851.614 .716.102.224.716.940.708 .708.066 .774.022 .796.017 .813.011 .823.085 .908.874 .874.048 .922.874 .874.017 .891.012 .903.432 .432.164.020.596.615.290 .290.569 .859.123 .123.077 .200.040 .240.032 .272.006 .278.085 .363.067 .480


