SEC Form 17-A - Philippine Stock Exchange - Far Eastern University
SEC Form 17-A - Philippine Stock Exchange - Far Eastern University
SEC Form 17-A - Philippine Stock Exchange - Far Eastern University

Create successful ePaper yourself
Turn your PDF publications into a flip-book with our unique Google optimized e-Paper software.
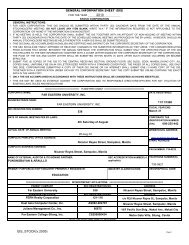
FAR EASTERN UNIVERSITYP.O. BOX 609MANILA, PHILIPPINES<strong>SEC</strong>URITIES AND EXCHANGE COMMISSION<strong>SEC</strong> FORM <strong>17</strong> - AANNUAL REPORT PURSUANT TO <strong>SEC</strong>TION <strong>17</strong>OF THE <strong>SEC</strong>URITIES REGULATION CODEAND <strong>SEC</strong>TION 141 OF THE CORPORATION CODE1. For the fiscal year ended March 31, 20102. <strong>SEC</strong> Identification Number 5383. BIR Tax Identification No. 000-225-4424. Exact name of registrant as specified in its charter <strong>Far</strong> <strong>Eastern</strong> <strong>University</strong>, Inc.5. PHILIPPINESProvince, Country or other jurisdiction ofincorporation or organization6. ____________/ / (<strong>SEC</strong> use only)/____________/Industry Classification Code:7. Nicanor Reyes Street, Sampaloc, Manila 1008Address of principal officePostal Code8. (632) 735-56-21Issuer's telephone number including area code9. NOT APPLICABLE<strong>Form</strong>er name, former address, and former fiscal year, if changed since last report.10. Securities registered pursuant to Sections 8 and 12 of the SRC, or Sec. 4 and 8 of theRSATitle of Each ClassNumber of Shares of Common<strong>Stock</strong> Outstanding and Amountof Debt OutstandingCommon <strong>Stock</strong>, P100.00 par value 9,808,448Bond with Non-Detachable Warrant,P/ 1.00 per unitNot Applicable
- 2 -11. All securities (common shares) are listed with the <strong>Philippine</strong> <strong>Stock</strong> <strong>Exchange</strong>, Inc.12. Check whether the registrant:(a) has filed reports required to be filed by Section I7 of the SRC and SRC Rule <strong>17</strong>thereunder and Sections 26 and 141 of the Corporation Code of the <strong>Philippine</strong>sduring the preceding 12 months (or for such shorter period that the registrant wasrequired to file such reports);Yes [ x ] No [ ]13. The aggregate market value of the voting stock held by non-affiliates: None
- 3 -TABLE OF CONTENTSPART I - BUSINESS AND GENERAL INFORMATION NO. OF PAGESItem 1 - Business 5Item 2 - Properties 2Item 3 - Legal Proceedings 2Item 4 - Submission of Matters ToA Vote of Security Holders 1PART II -OPERATIONAL AND FINANCIAL INFORMATIONItem 5 - Market for Issuer’s CommonEquity and Related <strong>Stock</strong>holdersMatters 3Item 6 - Management’s Discussion and 11Analysis or Plan OperationItem 7 - Financial Statements 122Item 8 - Changes in and Disagreements 1With Accountants on Accounting andFinancial DisclosurePART III -CONTROL AND COMPENSATION INFORMATIONItem 9 - Directors and Executive Officersof the Issuer 6Item 10- Executive Compensation 2Item 11- Security Ownership of CertainBeneficial Owners and Management 2Item 12- Certain Relationship and RelatedTransactions 1PART IVCORPORATE GOVERNANCEItem 13- Corporate Governance 1PART VEXHIBITS AND SCHEDULESItem 14- Exhibits and Reports on <strong>SEC</strong> <strong>Form</strong> <strong>17</strong>-Ca. Exhibits 1b. Reports on <strong>SEC</strong> FORM I7 - C 3c. Quarterly Reports 1
- 4 -PART I - BUSINESS AND GENERAL INFORMATIONItem 1. Business<strong>Far</strong> <strong>Eastern</strong> <strong>University</strong>, Inc. ("FEU or the "Corporation") was incorporated in 1933Brief Discussion of Business<strong>Far</strong> <strong>Eastern</strong> <strong>University</strong>, Inc., founded in 1928, is a private non-sectarian institution of learning.Guided by the core values of Fortitude, Excellence and Uprightness, FEU aims to be a universityof choice in Asia. Committed to the highest intellectual, moral and cultural standards, FEU strivesto produce principled and competent graduates. It nurtures a service-oriented and environmentconsciouscommunity which seeks to contribute to the advancement of the global society. Tuitionand other fees which are the main sources of its financial stability are moderate, subject togovernment regulation. The <strong>University</strong> also provides full and partial scholarships to deservingstudents. An FEU Foundation supplements the <strong>University</strong> scholarship program by providingspecial grants. The <strong>University</strong> maintains excellent facilities such as an electronic library, varioustypes of laboratories, auditorium, audio-visual and multimedia rooms, clinic, technology-basedgate security and enrollment system, gymnasiums, and spacious air-conditioned classrooms tobest serve the students. The <strong>University</strong> was granted deregulated status for five years beginningOctober 22, 2001 until October 21, 2006 per CHED Memorandum Order (CMO) No. 38, Series2001. Then, per CMO No. 52, Series of 2006, the deregulated status was extended until the endof Second Semester, SY 2006-2007. Moreover, per CMO No. 59, Series of 2007, the <strong>University</strong>was granted the same status from November 15, 2007 to November 14, 2008. On January 22,2009, through a Memorandum from the CHED Chairman, FEU’s status was extended until April30, 2009. Recently, a CHED letter addressed to President Lydia B. Echauz dated March <strong>17</strong>, 2009has extended the <strong>University</strong>’s deregulated status for another five years that is from March 11,2009 until March 30, 2014.Product:The Corporation is an educational institution. A private, non-sectarian institution oflearning comprising the following different Institutes that offer specific programs:A) Institute of Arts and Sciences (IAS)Programs:Masteral:Baccalaureate:Master of Arts (MA) major in:• Mass Communication• Letters• PsychologyBachelor of Arts major in Mass Communication (Granted permit upto recognition)Bachelor of Arts in: (Granted Government Permit to offer 1 st & 2 ndYear Levels)• English Language• Literature• Political Science• International Studies
- 5 -Bachelor of Science (BS) in Medical Technology (GrantedGovernment Permit to offer 1 st, 2 nd and 3 rd Year Levels)Bachelor of Science (BS) in BiologyBachelor of Science (BS) in:• Psychology• Applied Mathematics with Information TechnologyB) Institute of Accounts, Business and Finance (IABF)Programs:Masteral:Baccalaureate:Master of Business Administration (MBA) (Without Thesis Program)Bachelor of Science (BS) in:• Accountancy• Hotel and Restaurant Management (Granted GovernmentPermit up to Recognition)• Tourism Management (Granted Government Permit up toRecognition)Bachelor of Science in Business Administration major in:C) Institute of Education (IE)Programs:Doctoral:Masteral:• Business Economics• Financial Management• Marketing Management• Human Resource Development Management• Operations Management• Business Management• Internal Auditing• Legal ManagementDoctor of Education (Ed.D.) major in Educational AdministrationMaster of Arts in Education major in:• Educational Administration (Thesis Program)• Curriculum and Instruction (Thesis Program)• Curriculum and Instruction (Without Thesis Program)• Special Education (Thesis Program)
- 8 -Distribution methods of the products/services:Since this is an educational institution, its services are certainly focused on the students.The tuition fees of students in the following Institutes significantly contributed to the revenues ofthe <strong>University</strong>:InstitutePercentage to RevenuesInstitute of Accounts, Business 32.20%and FinanceInstitute of Arts and Sciences 13.15%Institute of Nursing 43.87%Customers:StudentsPurchases of Raw Materials: NOT APPLICABLEDistribution methods of the products/services:Since this is an educational institution, its services are certainly focused on the students.Competition:Since the school which is the main core of the business is situated in the <strong>University</strong> Belt, thecompetitors are prestigious colleges and universities within the specified area. FEU caneffectively compete with these institutions of learning because of its well-modulated tuition feessubject to government regulations, air-conditioned classrooms, electronic library and continuousimprovement of physical plant and facilities. Diverse scholarships are also offered and amagnificent line-up of cultural performances for the whole year are presented, free for allstudents. Moreover, the <strong>University</strong> recently acquired the Level III re-accredited status for mostof its Liberal Arts and Commerce programs.
- 10 -Properties leased by the corporation from FERN Realty, Inc.MonthlyRentalContractDate__Education Building – an eight (8) storey building P35,974,093.99 July 1,made of concrete materials located on plus 2009Nicanor Reyes St., Manila applicable VAT toJune 30,2010Nursing Building – an eight (8) storey buildingmade of concrete materials located onNicanor Reyes St., ManilaLaw Building – a four (4) storey building madeof concrete materials located onNicanor Reyes St., ManilaAdministration Building – a four (4) storey building madeof concrete materials located onNicanor Reyes St., ManilaGymnasium - a two (2) storey building made of concrete materialslocated on R. Papa St., ManilaThe lease contract shall not be deemed extended by implication beyond the contract period forany cause or reason whatsoever, but only by negotiation and written agreement of the LESSORand the LESSEE.
- 11 -Employees:Number of EmployeesOfficials - 12Senior Staff - 46Non-Academic:Supervisor - 64Rank-and-File - 276Academic:Lecturer - 625Regular - 375With the economic condition prevailing in the country, the corporation has no plan of hiringemployees within the ensuing twelve months. It will make use of its present employees andfaculty members to meet its manpower requirements.Inclusive Dates of CBANon-Academic July 16, 2009 - July 15, 2011Academic Sept. 1, 2009 - August 31, 2011The labor unions of the employees and the faculty members have never been on strike in thelast ten years, and pose no threat to strike in the foreseeable future. Employees and facultymembers have a harmonious relationship with the Administration.Working Capital:All of the company's working capital for its existing operation forfiscal year April 1, 2009 to March 31, 2010 was internally generated.Item 3. Legal ProceedingsHereunder is the list of the legal proceedings involving the company which are beinghandled by Atty. Enrico G. Gilera, the <strong>University</strong>’s Legal Counsel:External CasesA. Pending Court Cases as of 31 December 20091. Meynard Bathan vs. FEU, NLRC Case No. 08-11985-20092. Abner Cruz vs. FEU, NLRC Case No. 11-15913-20093. Melvira David, et al. vs. FEU, CA GR No. 1065324. Fina Gabonada vs. FEU et al; NLRC Case No. 09-13392-20085. Ma. Richelle Simon, et al, vs. NLRC Case No. 12-16513-20096. FEU-ELU (PLAC) vs, FEU, CA GR SP No. 102249
- 12 -B. Recently Dismissed cases1. Ramir Arceo, vs. FEU, NLRC Case No. 06-09197-2008; dismissed on September 29,20092. Jesus Fernando Dujua vs. FEU, NLRC Case No. 04-05603-2008; dismissed onSeptember 29, 20093. Elmer Bolanos vs. FEU/RRC Case No. 06-09197-2008; dismissed on May 29, 20094. Annabele Mercado vs. FEU, NLRC Case No. 05-04546-2007; dismissed on April 30,20095. Erlinda Ramos vs. FEU, NLRC Case No. 00-07-09644-2009; dismissed onNovember <strong>17</strong>, 2009Involvement of Directors and Officers in Certain Legal ProceedingsNone of the directors and officers were involved during the past five (5) years in any bankruptcyproceeding. Neither have they been convicted by final judgment in any criminal proceeding orbeen subject to any order, judgment or decree of competent jurisdiction, permanently ortemporarily enjoining barring, suspending, or otherwise limiting their involvement in any type ofbusiness, securities, commodities, or banking activities, nor found by any court or administrativebody to have violated a securities or commodities law.The registrant or any of its subsidiaries or affiliates is not a party to any pending legal proceedingsin which any of their property is the subject.Item 4. Submission of Matters to a Vote of Security HoldersThe registrant is not a party to any voting trust agreement. No security holder of theRegistrant holds a voting trust or any other similar agreement.Part II - OPERATIONAL AND FINANCIAL INFORMATIONItem 5. Market for Registrants Common Equity and Related <strong>Stock</strong>holders MattersDividends During the Year:Cash Dividend:DIVIDENDS DECLARED FOR THE FISCAL YEAR ENDED MARCH 31, 2009Payment/IssuedOutstandingDate Particulars Amount SharesJuly 20, 2009 P 15.00/share P 147,126,720.00 9,808,448Jan. 25, 2010 15.00/share 147,126,720.00 9,808,448P 294,253,440.00===============
- 13 -<strong>Stock</strong> Dividend:No stock dividend for the period April 1, 2009 to March 31, 2010 was declared.Recent Sales of Unregistered SecuritiesNot a single common share is considered unregistered security. All shares are registered with the<strong>Philippine</strong> <strong>Stock</strong> <strong>Exchange</strong>, Inc. Thus, checklist of requirements for Sale of Unregistered Securities isnot applicable.The <strong>Philippine</strong> <strong>Stock</strong> <strong>Exchange</strong>, Inc. is the principal market where the corporation’s common equity istraded.Market Prices of Common <strong>Stock</strong>s: (Phil. <strong>Stock</strong> <strong>Exchange</strong>, Inc.)Herewith are the high, low, and closing prices of shares of stock traded from April 2009 to March 2010:2009 HIGH LOW CLOSEApr 785.00 735.00 750.00May 765.00 750.00 750.00Jun 775.00 750.00 775.00Jul 800.00 735.00 750.00Aug 780.00 750.00 770.00Sep 780.00 760.00 760.00Oct 760.00 710.00 750.00Nov 790.00 735.00 750.00Dec 800.00 735.00 770.002010Jan 775.00 740.00 750.00Feb 800.00 750.00 785.00Mar 790.00 750.00 770.00High and low sale prices for each quarter are as follows:A) April 01, 2009 - March 31, 2010Period High Low CloseFirst Quarter P/ 775.00 P/ 745.00 P/ 758.33Second “ 786.67 748.33 760.00Third “ 783.33 726.67 756.67Fourth “ 783.33 746.67 768.33
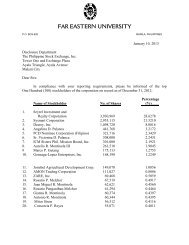
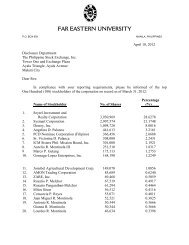
- 14 -B) April 01, 2008 - March 31, 2009Period High Low CloseFirst Quarter P/ 973.33 P/ 916.67 P/ 973.33695.24 654.76 695.24 (Adjusted)Second “ 1,263.33 876.67 1,023.33902.38 697.62 807.14 (Adjusted)Third “ 683.33 573.33 610.00Fourth “ 700.00 630.00 678.33The number of shareholders on record as of March 31, 2010 was One Thousand Four HundredTwenty-Eight (1,428). Common shares issued and outstanding were 9,808,448.20 TOP FEU STOCKHOLDERS AS OF MARCH 31, 2009Title of ClassName of Beneficial OwnerNo. of Sharesand Nature ofBeneficialOwnershipCitizenshipPercentOf Class1. Common Seyrel Investment and2,807,835 – D Filipino 28.6267Realty Corporation2. Common Sysmart Corporation 2,076,839 – D Filipino 21.<strong>17</strong>403. Common Desrey, Incorporated 784,800 – D Filipino 8.00134. Common Angelina D. Palanca 314,538 – D Filipino 3.20685. Common Sr. Victorina D. Palanca 220,000 – D Filipino 2.24306. Common ICM Sisters Phil. Mission Board, 215,000 – D Filipino 2.1920Inc.7. Common Aurelio R. Montinola III 164,099 – D Filipino 1.67308. Common PCD Nominee Corporation 162,377 – D Filipino 1.6555(Filiipno)9. Common Marco P. Gutang 125,081 – D Filipino 1.275210. Common Gonzaga-Lopez Enterprises, Inc 120,136 – D Filipino 1.224811. Common Jomibel Agricultural106,479 – D Filipino 1.0856Development Corporation12. Common Lourdes R. Montinola 94,588 – D Filipino 0.964413. Common AMON Trading Corporation 62,043 – D Filipino 0.632514. Common ZARE, Inc. 49,620 – D Filipino 0.505915. Common Rosario P. Melchor 48,228 – D Filipino 0.49<strong>17</strong>16. Common Rosario Panganiban Melchor 43,782 – D Filipino 0.4464<strong>17</strong>. Common Mitos Sison 40,366 – D Filipino 0.411518. Common Consorcia P. Reyes 39,337 – D Filipino 0.401019. Common Caridad I. Santos 33,303 – D Filipino 0.339520. Common Francisca S. Monzon 33,131 – D Filipino 0.3378
- 15 -Item 6.Management’s Discussion and Analysis or Plan of OperationFinancial Position :As of March 31, 2007, total assets reached P2,701.2 million which was 20.62% higherthan the previous year’s P2,239.5 million. Total liabilities amounted to P389.3 million whichwas 6.08% higher than the previous year’s P367.0 million. Equity amounted to P2,311.9 millionwhich was 23.46% higher than the previous year’s P1,872.5 million. Current ratio was 4.68:1and debt was <strong>17</strong>% of equity.As of March 31, 2008, total assets amounted to P3,157.3 million which was 16.89%higher than the previous year’s P2,701.2 million. Total liabilities amounted to P572.1 millionwhich was 46.96% higher than the previous year’s P389.3million. Equity amounted to P2,585.2million which was 11.82% higher than the previous year’s P2,311.9 million. Current ratio was3.9:1 and debt was 22% of equity.As of March 31, 2009 total assets amounted to P3,447.3 million. Total liabilitiesamounted to P558.1 million while total stockholders’ equity reached P2,889.2 million.Compared to the previous year, assets and stockholders’ equity increased by 9.19% and 11.76 %respectively while liabilities decreased by 2.45%. Current ratio was 4.38:1 and debt was 19% ofequity.As of March 31, 2010, total assets amounted to P3,697.7 million which was 7.26% higherthan the previous year’s P3,447.3 million. Total liabilities amounted to P500.1 million whichwas 10.39% lower than the previous year’s P558.1 million. Equity amounted to P3,197.5million which was 10.67% higher than the previous year’s P2,889.2 million. Current ratio was4.97:1 and debt was 16% of equity.For the past four (4) years, total assets increased at an average rate of 13.49% or P364.5million a year. Total liabilities increased during the first two years but gradually decreased on thelast two years. On the average, liabilities increased at around P33.27 million a year.( I n M i l l i o n P e s o s )Total Increase (Decrease) Total Increase (Decrease)Year Assets Amount % Liabilities Amount %March 31, 2006 P2,239.5 P367.0March 31, 2007 2,701.2 P461.7 20.62% 389.3 P 22.3 6.08%March 31, 2008 3,157.3 456.1 16.89% 572.1 182.8 46.96%March 31, 2009 3,447.3 290.0 9.19% 558.1 (14.0) (2.45%)March 31, 2010 3,697.7 250.4 7.26% 500.1 (58.0) (10.39%)Four year average 364.55 33.27
As a result and based on the above figures, around 55.75% of each year’s net income hasbeen retained by the company, thus, the steady increase in owners’ equity as follows:( I n M i l l i o n P e s o s )IncreaseYear Owner’s Equity (Decrease) %P1,872.5March 31, 2007 2,311.9 P439.4 23.5%March 31, 2008 2,585.3 273.4 11.8%March 31, 2009 2,889.2 303.9 11.8%March 31, 2010 3,197.5 308.3 10.7%As of March 31, 2010, owner’s equity accounts for 86.47% of total assets. Since 67.2%of the company’s total assets is current, the company can pay all its liabilities and still have53.67% current assets and 32.8% non-current assets. In pesos, this would mean P1,984.40million current assets and P1,213.2 million non-current assets after paying all liabilitiesamounting to P500.1 million as of March 31, 2010.In Million %Owners’ Equity P3,197.5 86.47%Total Assets 3,697.7 100%Non-Current Assets 1,213.2 32.8%Current Assets 2,484.5 67.2%Total Liabilities 500.1 13.52%Current Assets after Total Liabilities 1,984.4 53.67%Results of OperationsFor the year 2006-2007, net income for the period was P603.5 million which was 6.1%higher than the previous year’s P568.9 million. This year’s figure consisted of 80.2% operatingprofit and 19.8% other income. Operating profit increased by P35.1 million and other income byP.89 million. As a result, net income after tax for the year increased by P34.6 million.For the year 2007-2008, net income for the period amounted to P592.9 million which was1.8% lower than the previous year’s P603.5 million. This year’s figure consisted of 78%operating profit and 22% other income. Operating profit decreased by P21.0 million while otherincome increased by P15.5 million. The combined effect resulted in a decrease in net incomeafter tax by P10.6 million.
For the year 2008-2009, net income for the period amounted to P567.0 million which was4.4% lower than the previous year’s P592.9 million. This year’s figure consisted of 74.7%operating profit and 25.3% other income. Operating profit decreased by P39.8 million whileother income increased by P13.3 million. As a result, net income after tax decreased by P25.9million.For the year 2009-2010, net income for the period amounted to P585.2 million which was3.2% higher than the previous year’s P567.0 million. This year’s figure consisted of 74.1%operating profit and 25.9% other income. Operating profit increased by P10.7 million whileother income increased by P9.02 million. As a result, net income after tax increased by P18.2million.The company’s operating profit which is largely dependent on enrollment, was up in2006-2007 when enrollment was still at the 26,000 level but went down in 2007-2008, 2008-2009 and 2009-2010 when enrollment dropped to 23,000.Enrollment Average tuition fee Operating ProfitPeriod Covered (1 st semester) rate per unit (in million Pesos)2006 - 2007 26,229 P 976.00 P540.62007 - 2008 23,928 1,043.00 519.62008 - 2009 23,291 1,100.00 479.82009 - 2010 22,885 1,155.00 490.5Other income consists largely of investment income. During the past four years, investmentincome accounted for 71.8% of the total other income. Rental income was also a factor. Itaccounted for 18.0% of such other income.Period Finance IncomeCovered Net of Finance Cost Rental Miscellaneous Total2006 – 2007 P110.4 P23.1 P - P133.52007 – 2008 101.7 25.5 21.9 149.12008 – 2009 120.7 22.9 18.8 162.42009 – 2010 110.0 39.2 22.2 <strong>17</strong>1.4442.8 110.7 62.9 616.4Four year average 110.7 27.7 15.7 154.1Percentage 71.8% 18.0% 10.2% 100%
A Look of What Lies AheadDuring the past four years, the first semester enrollment decreased from 26,229 in 2006-2007 to 22,885 in 2009-2010. However, in the second semester, the actual drop in enrollmentfrom that of the first semester was better at 5.82% compared to the usual 10% decrease.1 st Semester 2 nd Semester IncreaseYear Enrollment Enrollment (Decrease) %2006 – 2007 26,229 24,510 (1,719) (6.55%)2007 – 2008 23,928 22,510 (1,392) (5.82%)2008 – 2009 23,291 21,744 (1,547) (6.64%)2009 – 2010 22,885 21,908 ( 977) (4.27%)Four-year average : (1,409) (5.82%)For the school year 2010-2011, the first semester enrollment increased by 1,748 studentsor 7.63% better than the previous year’s 22,885. The increase in enrollment is attributed to ourimproved facilities and new course offerings. Our newly-opened branch in Makati brought in192 students. We expect the branch enrollment to be much bigger in the succeeding years.During the past four years, our tuition rates also increased at an average of 5.5% a year.For 2010-2011, our approved tuition fee increase is only 3.5%. While the current increase in rateis relatively lower than the average 5.5%, this year’s 7.6% increase in enrollment willcompensate for the lower rate increase. With the proper management of resources, we expectthat operating profit will again improve this year.With the company’s total current assets amounting to P1,984.4 million and non-currentassets amounting to P1,213.1 million (net of all liabilities) as of March 31, 2010 and with theexpected net income, the company does not foresee any cash flow or liquidity problem in thenext 12 months. The company shall easily meet all its commitments including those forimprovements in instructional and other facilities from its present reserves and from expectedfuture earnings.For the year’s ahead, management is committed to uplift academic standards even more.This will be done through continuously updating curricula, strengthening faculty, improvingservices to students and providing the best educational facilities. With an additional campus andwith sustained improvement in all fronts, plus a reasonable tuition fee hike, the <strong>University</strong> isconfident that it will increase its market share in the industry.
Top Five (5) Key Performance IndicatorsI. Test of LiquidityLiquidity refers to the company’s ability to pay its short-term current liabilities asthey fall due. This is measured by any of the following:1. Current ratio measures the number of times that the current liabilities could bepaid with the available current assets (Adequate: at least 1.5:1)March 31, 2007 4.68:1March 31, 2008 3.90:1March 31, 2009 4.38:1March 31, 2010 4.97:12. Quick ratio measures the number of times that the current liabilities could bepaid with the available quick assets (Adequate: at least 1:1)II. Test of SolvencyMarch 31, 2007 4.44:1March 31, 2008 3.67:1March 31, 2009 4.21:1March 31, 2010 4.70:1Solvency refers to the company’s ability to pay all its debts whether such liabilitiesare current or non-current. It is somewhat similar to liquidity, except that solvencyinvolves a longer time horizon. This is measured by any of the following:1. Debt to equity ratio measures the amount of assets provided by the creditorsrelative to that provided by the owner (Adequate : 100% or less)March 31, 2007 <strong>17</strong>%March 31, 2008 22%March 31, 2009 19%March 31, 2010 16%2. Debt to asset ratio measures the amount of assets provided by the creditorsrelative to the total amount of assets of the company. (Adequate: 50% or less)March 31, 2007 14%March 31, 2008 18%March 31, 2009 16%March 31, 2010 14%
3. Equity to asset ratio measures the amount of assets provided by the ownerrelative to the total assets of the company (Adequate: 50% or more)March 31, 2007 86%March 31, 2008 82%March 31, 2009 84%March 31, 2010 86%III. Test of ProfitabilityProfitability refers to the company’s earning capacity. It also refers to the company’sability to earn a reasonable amount of income in relation to its total investment. It ismeasured by any of the following:1. Return on total assets measures how well management has used its assetsunder its control to generate income (Adequate: at least equal to theprevailing industry rate).March 31, 2007 22%March 31, 2008 19%March 31, 2009 16%March 31, 2010 16%2. Return on owner’s equity measures how much was earned on the owners’or stockholders’ investment. (Adequate: at least equal to the prevailingindustry rate).March 31, 2007 26%March 31, 2008 23%March 31, 2009 20%March 31, 2010 18%3. Earnings per share measures the net income per share.March 31, 2007 103.37March 31, 2008 84.62March 31, 2009 67.44March 31, 2010 59.66
IV.Product Standard1. Teaching performance in the <strong>University</strong> is constantly being monitored tomaintain a satisfactory level of excellence.Teaching Excellence % toTotalYear Awardees Teaching force2005-2006 581 53%2006-2007 412 37%2007-2008 430 38%2008-2009 377 34%2. The <strong>Philippine</strong> Association of Colleges and Universities Commission onAccreditation (PACUCOA) has granted Certificates of Level III ReaccreditedStatus to our BSBA and Liberal Arts Programs. It has also grantedLevel II Re-accredited Status to our Elementary and Secondary EducationPrograms.The <strong>Philippine</strong> Accreditating Association of Schools, Colleges andUniversities (PAASCU), also issued a certificate of accreditation (Level II) tothe <strong>University</strong>’s Nursing Program.3. Performance of FEU graduates in their respective Board Exams is generallybetter than the national passing rate:FEUPassing RateNationalPassing RateArchitecture, June 2009 35% 37%Architecture, January 2010 39% 50%Bar Exam., 2009 37% 25%CPA, October 2009 67% 42%CPA, May 2010 42% 40%LET (Elem.), October 2009 56% 20%LET (Secondary), October 2009 31% 28%Nursing, June 2009 79% 42%
V. Market AcceptabilityBelow is a comparative schedule of first semester enrollment for the past 4 years:SYEnrollment2007-2008 23,9282008-2009 23,2912009-2010 22,8852010-2011 24,633It was estimated that the first semester enrollment for SY 2010-2011 would be4.2% higher compared to the previous year. Final figure was better with anincrease of 7.63%. All institutes, except for the Institute of Nursing, had a betterenrollment.The number of valedictorians, salutatorians and entrance merit scholars (833 in2007-2008, 798 in 2008-2009 and 663 in 2009-2010) during the past three schoolyears is an indication that FEU is one of the better choices among the variouscolleges and universities in the metropolis.Facts( I n M i l l i o n P e s o s )March 31, 2007 March 31, 2008 March 31, 2009 March 31, 2010Quick Assets 1,729.0 2,101.0 2,348.2 2,349.7Current Assets 1,820.1 2,228.7 2,443.9 2,484.5Total Assets 2,701.2 3,157.3 3,447.3 3,697.7Current Liabilities 389.3 572.1 558.1 500.2Total Liabilities 389.3 572.1 558.1 500.2<strong>Stock</strong>holder's Equity 2,311.9 2,585.2 2,889.2 3,197.5Operating Profit 540.6 519.6 479.8 490.5Other Income 133.5 149.1 162.4 <strong>17</strong>1.4Profit Before Tax 674.1 668.7 642.2 661.9Net Profit or Profit After Tax 603.5 592.9 567.0 585.2Total Outstanding shares (average) 5,838,440 shares 7,006,368 shares 8,407,408 shares 9,808,448 shares
<strong>Form</strong>ulaA. Liquidity1. Current ratio = Current assetsCurrent Liabilities2. Acid test ratio = Quick assetsCurrent LiabilitiesB. Solvency1. Debt to Equity ratio = Total liabilitiesTotal <strong>Stock</strong>holder's Equity2. Debt to Asset ratio = Total liabilitiesTotal assets3. Equity to Asset ratio = Total <strong>Stock</strong>holder's EquityTotal assetsC. Profitability1. Return on Assets = Net ProfitTotal assets2. Return on Owner's Equity = Net ProfitTotal <strong>Stock</strong>holder's Equity3. Earning per share = Net ProfitTotal Outstanding shares (average)
- 16 -FAR EASTERN UNIVERSITYSCHEDULE OF PROPERTY, PLANT & EQUIPMENT/INVESTMENT PROPERTYSCHOOL YEAR 2009 - 2010Gross Book ValueAccumulatedDepreciation Net Book Value Location ConditionI. PROPERTY, PLANT & EQUIPMENT:-L A N D 98,457,565.00 - 98,457,565.00 Manila Very GoodBUILDINGS & LAND IMPROVEMENTSNew Technology Building II 282,459,780.00 55,847,469.00 226,612,311.00 " "Alfredo Reyes Hall 115,965,314.00 29,020,575.00 86,944,739.00 " "Leasehold Improvement 107,721,258.00 18,647,599.00 89,073,659.00 " "New Technology Building-Idle Hosp. Bldg. 9,182,068.00 536,096.00 8,645,972.00 " "Science Building 101,387,260.00 16,102,659.00 85,284,601.00 " "Arts Building 21,095,350.00 6,058,121.00 15,037,229.00 " "Nicanor Reyes Hall 45,025,597.00 4,377,102.00 40,648,495.00 " "GEC & Educational Hall - - - " "Grade school - - - " "S B Covered Walk 6<strong>17</strong>,737.00 525,076.00 92,661.00 " "Covered Passage 3,202,126.00 592,700.00 2,609,426.00 " "Fence 715,360.00 546,657.00 168,703.00 " "Campus Pavilion 1,661,650.00 309,988.00 1,351,662.00 " "GSB Covered Walk 310,000.00 263,499.00 46,501.00 " "Powerhouse 296,196.00 296,196.00 - " "Chapel 708,691.00 - 708,691.00 " "Others 9,613,894.00 857,028.00 8,756,866.00 " "Grandstand 1,423,704.00 49,263.00 1,374,441.00 " "701,385,985.00 134,030,028.00 567,355,957.00EQUIPMENTSFurnitures & Fixtures 16,995,976.00 11,739,849.00 5,256,127.00 " "Electrical & Mechanical 64,765,492.00 54,561,591.00 10,203,901.00 " "Information Technology 29,995,180.00 23,221,336.00 6,773,844.00 " "Transportation Equipment 11,857,241.00 8,496,527.00 3,360,714.00 " "Miscellaneous Fixed Assets 10,645,124.00 10,645,124.00 - " "Instruments & Utensils 565,999.00 349,528.00 216,471.00 " "T o o l s 1,<strong>17</strong>7,842.00 820,838.00 357,004.00 " "Linen 299,914.00 299,914.00 - " "Museum Collection 5,519,573.00 - 5,519,573.00 " "141,822,341.00 110,134,707.00 31,687,634.00TOTAL 941,665,891.00 244,164,735.00 697,501,156.00II. INVESTMENT PROPERTY:LAND 53,394,726.00 - 53,394,726.00 " "COLLEGE OF ENGINEERING BUILDING 207,626,479.00 76,547,067.00 131,079,412.00 " "TOTAL 261,021,205.00 76,547,067.00 184,474,138.00GRAND TOTAL 1,202,687,096.00 320,711,802.00 881,975,294.00
FAR EASTERN UNIVERSITY, INC. AND SUBSIDIARIESAMOUNTS RECEIVABLE FROM DIRECTORS, OFFICERS,EMPLOYEES, RELATED PARTIES, AND PRINCIPAL STOCKHOLDERS (OTHER THAN AFFILIATES)FOR THE YEAR ENDED MARCH 31, 2010- <strong>17</strong> -Name and Designation of DebtorBeginningBalanceAdditionsDeductionsAmountAmountDeducted Written-OffCurrent Non-CurrentEndingAbellera, Evelyn C. 302.23 302.23 302.23Acab, Deborah A. 10,400.00 10,400.00 10,400.00Acosta, Venina Corazon S. 418.97 418.97 418.97Adolfo, Marlon (3,560.00) (3,560.00) (3,560.00)Africa, Dickenson Y. 200.00 200.00 200.00Agdalpen, Renato C. 2,000.00 2,000.00 2,000.00Agluba, Noreen 63.00 63.00 63.00Agorilla, Delia 660.00 660.00 660.00Albino, Maulynn 207.50 207.50 207.50Albiva, Merlyn T. 1,464.00 1,464.00 1,464.00Alcaraz, Nellie T. 8,200.00 8,200.00 8,200.00Alcazar, Nina Aiza 415.50 415.50 415.50Alfaro, Jennylyn G. (3,835.00) (3,835.00) (3,835.00)Alibania, Hazel J. 1,000.00 1,000.00 1,000.00Alo, James 600.00 600.00 600.00Alolor, Jacqueline G. (873.00) (873.00) (873.00)Amacan, Normita C. (6.45) 3,757.55 (3,764.00) (3,764.00)Amlog, Jocelyn A. 45,000.00 45,000.00 45,000.00Ampatin, Estrella V. 26,005.00 26,005.00 26,005.00Anastacio, Nanette V. (3,309.80) (3,309.80) (3,309.80)Anastacio, Teresita M. 89.74 89.74 89.74Andres, Jocelyn 90.00 90.00 90.00Anido, Cecilia I. 70,422.99 221,077.16 (150,654.<strong>17</strong>) (150,654.<strong>17</strong>)An Lim, Jaime L. (1,455.72) (1,455.72) (1,455.72)Arabia, Julieta S. (1,900.00) (1,900.00) (1,900.00)Aragon, Lloyd Jeffrey 5,000.00 5,000.00 5,000.00Arbizo, Maria Sophia 3,695.57 3,695.57 3,695.57Arejola, Romeo 200.00 200.00 200.00Arquiza, Glenda S. (9,845.50) (9,845.50) (9,845.50)Arribe, Emma B. 245.00 245.00 245.00Asilo, Ma. Cecilia 50.00 50.00 50.00Ataat, Jose 200.00 200.00 200.00Atanque, Aurora L. (2,288.82) (2,288.82) (2,288.82)Austria, Ryan 5,000.00 5,000.00 5,000.00Ayson, Rosalino P., Jr. 14,345.00 14,376.00 (31.00) (31.00)Azor, Helen A. (1,528.<strong>17</strong>) (1,528.<strong>17</strong>) (1,528.<strong>17</strong>)Azucena, Cesario 1,339.20 1,339.20 1,339.20Baconawa, Ma. Dorina M. 79.<strong>17</strong> 79.<strong>17</strong> 79.<strong>17</strong>Badiable, Charisma Mae 5,000.00 5,000.00 5,000.00Baello, Christine N. (137.50) (137.50) (137.50)Balaoro, Maria Theresa (200.00) (200.00) (200.00)Balaria, Dalmacio P. 7,500.00 7,500.00 7,500.00Bambico, Elma 311.00 311.00 311.00Banal, Enrico R. (22,<strong>17</strong>1.50) (22,<strong>17</strong>1.50) (22,<strong>17</strong>1.50)Barcellano, Francis (4,595.00) (4,595.00) (4,595.00)Barcelona, Samson V. 200.00 200.00 200.00Bartolome, Liezl DM. (58.00) (58.00) (58.00)Batungbakal, Marisa <strong>17</strong>.50 <strong>17</strong>.50 <strong>17</strong>.50Bautista, Andres D. 3,000.00 3,000.00 3,000.00Bautista, Arlene Mae DG. 1,027.00 1,027.00 1,027.00Bayan, Zenaida E. 585.50 585.50 585.50Belardo, Ma. Jeanette 1,794.53 1,794.53 1,794.53Belleza, Asuncion L. (12,289.47) (12,289.47) (12,289.47)
Name and Designation of DebtorBeginningBalanceAdditionsDeductionsAmountAmountDeducted Written-OffCurrent Non-CurrentBeltran, Charity J. <strong>17</strong>5.00 <strong>17</strong>5.00 <strong>17</strong>5.00Belza, Mercedes A. 7,060.00 7,060.00 7,060.00Bonaobra, Salvador B. (750.00) (750.00) (750.00)Brawner, Dalisay G. 40.00 40.00 40.00Briones, Domingo J. 10,079.00 120.90 9,958.10 9,958.10Brocal, Cynthia M. 24.00 24.00 24.00Buenaventura, Alexander V. 7,060.00 7,060.00 7,060.00Buenaventura, Olga C. 27,213.00 27,213.00 27,213.00Buenavida, Amelia 165.00 165.00 165.00Bueno, Marivic 10,000.00 10,000.00 10,000.00Bulanhagui, Nida B. 620.00 620.00 620.00Bustamante, Ma. Christine H. 8,600.00 8,600.00 8,600.00Caagbay, Elpidio Z. (5,305.00) (5,305.00) (5,305.00)Cabaltica, Leilani A. 4,210.55 4,210.55 4,210.55Cabantac, Ricardo R. 7,060.00 7,060.00 7,060.00Cadorna, Rosemarie S. 656.20 656.20 656.20Cagadas, Ruly 200.00 200.00 200.00Cajucom, Mary Grace A. 440.00 440.00 440.00Calizar, Dexter A. 3,126.10 3,126.10 3,126.10Camacho, Joseph C. 600.00 600.00 600.00Cando, Cromwell N. 1,248.00 1,248.00 1,248.00Canilao, Fe V. 359,792.04 280,069.32 79,722.72 79,722.72Cao, Marilou F. (4,867.00) (4,867.00) (4,867.00)Capacio, Glenn (7,300.00) (7,300.00) (7,300.00)Caramanza, Edward M. 9,000.00 9,000.00 9,000.00Cardona, Enrico 200.00 200.00 200.00Cariquitan, Daisy 308.00 308.00 308.00Carpio, Miguel M. (13,086.34) (13,086.34) (13,086.34)Castanas, Baby Theress 82.50 82.50 82.50Castro, Joeven R, 4,555.00 4,555.00 4,555.00Cauba, Harvey A. 4,364.78 716.88 3,647.90 3,647.90Cecilio, Ma. Elaine 3,795.89 3,795.89 3,795.89Cerrer, Redentor A. 200.00 200.00 200.00Chan, Jeffrei Allan (6,927.00) (6,927.00) (6,927.00)Chu, Connie 195.20 195.20 195.20Chua, Ryan Gilbert 5,000.00 5,000.00 5,000.00Clemente, Luisa DC. 3,615.90 2,600.90 1,015.00 1,015.00Codinera, Virgilio B. 79.72 79.72 79.72Cometa, Ma. Victoria D. (7,775.00) (7,775.00) (7,775.00)Concepcion, Gerald G. 250.00 250.00 250.00Concha, Jhonalyn M. 10,900.00 10,900.00 10,900.00Cordero, Nelma 1,195.00 1,195.00 1,195.00Cruz, Anita B. 25,000.00 25,000.00 25,000.00Cruz, Anna Lisa D. (944.00) (944.00) (944.00)Cruz, Christybel O. 928.75 928.75 928.75Cruz, Eloisa G. 3,362.50 3,362.50 3,362.50Cruz, Janet R. 200.00 200.00 200.00Cruz, John Ross R. (4,500.00) (4,500.00) (4,500.00)Cruz, Jose Noel 200.00 200.00 200.00Cruz, Maricar 5,000.00 5,000.00 5,000.00Cruz, Maritess 9.16 9.16 9.16Cruz, Precita P. (1,400.00) (1,400.00) (1,400.00)Cruz, Reynaldo J. 934.05 934.05 934.05Cruz, Rosalie dela 6.68 6.68 6.68Cruz, Sandra Lyn D. 523.01 523.01 523.01Culala, Harold John D. (5,835.00) (5,835.00) (5,835.00)Cunanan, Fernando M. 3,309.80 2,284.77 1,025.03 1,025.03Custodio, Joselito 50.00 50.00 50.00Dado, Rorylyn H. (1,000.00) (1,000.00) (1,000.00)Dapla, Walter 3,851.29 3,851.29 3,851.29Davalos, Zenaida R. (499.20) (499.20) (499.20)Ending
Name and Designation of DebtorBeginningBalanceAdditionsDeductionsAmountAmountDeducted Written-OffCurrent Non-CurrentDeatras, Jeffrey (2,861.29) (2,861.29) (2,861.29)Delloro, Evelyn 748.00 748.00 748.00Demagante, Rey Francis G. 50.00 50.00 50.00Destura, Blanca 224.56 224.56 224.56Diaz, Aeneas Eli (10,000.00) (10,000.00) (10,000.00)Dingding, Quintin P. 70.00 70.00 70.00Dino, Kristopher 400.00 400.00 400.00Dizon, Mercy G. (800.00) (800.00) (800.00)Doria, Jeanette V. (260.00) (260.00) (260.00)Duena, Teodoro C., Jr. (6,000.00) (6,000.00) (6,000.00)Dulay, Sofronio C. (10,636.95) (10,636.95) (10,636.95)Dumadag, Norma M. 27,015.20 25,798.20 1,2<strong>17</strong>.00 1,2<strong>17</strong>.00Dumas, Marvin C. 150.00 150.00 150.00Dumdumaya, Myline Marie P. (1,200.00) (1,200.00) (1,200.00)Duque, Ronald 50.00 50.00 50.00Echauz, Lydia B. (20,362.80) (20,362.80) (20,362.80)Elman, Mario B. (1,800.00) (1,800.00) (1,800.00)Enriquez, Emiliana 50.00 50.00 50.00Escosia, Aurora A. 23,699.77 23,699.77 23,699.77Eser, Myline S. 33,035.86 33,035.86 33,035.86Espino, Kristine 112.00 112.00 112.00Espinosa, William V. 6,431.00 6,431.00 6,431.00Esquibel, Elizabeth 5,000.00 5,000.00 5,000.00Estabillo, Ma. Luz 529.50 529.50 529.50Estacio, Ma. Vivian G. (1,625.01) (1,625.01) (1,625.01)Esteban, Alejandro L. 5,000.00 5,000.00 5,000.00Estonanto, Mark Ronald L. 374.85 374.85 374.85Estonanto, Mavi Issel L. 32,221.65 32,221.65 32,221.65Estrella, Gloria 1,460.37 1,460.37 1,460.37Estrella, Luisito P. (300.00) (300.00) (300.00)Fabito, Evelyn 2,163.00 2,163.00 2,163.00Fabros, Marietta 5,295.67 5,295.67 5,295.67Federigan, Melissa 946.25 946.25 946.25Felizardo, Dante A. 10,000.00 10,000.00 10,000.00Feraren, Mitchell 50.00 50.00 50.00Fernandez, Benedict T. III (4,400.00) (4,400.00) (4,400.00)Fernandez, Dante Roel 699.00 699.00 699.00Fernando, Gerry V. 967.00 967.00 967.00Fesalbon, Hermond F. 7,729.34 7,729.34 7,729.34FEU Consumer's Coop. 3,295.85 3,295.85 3,295.85FEU Credit Union 1,560.92 1,560.92 1,560.92Fiesta, Erlinda P. 8,532.50 8,532.50 8,532.50Figer, Reggy C. 24,300.00 24,300.00 24,300.00Flojo, Flordeliza 168.50 168.50 168.50Flores, Hanonica S. 50.00 50.00 50.00Flores, Miguela T. (102.50) (102.50) (102.50)Flores, Roberto C. (32,250.00) (32,250.00) (32,250.00)Florida, Ma. Corazon M. (1,800.00) (1,800.00) (1,800.00)Foe, Jonathan 100.00 100.00 100.00Frades, Francisca B. (130.00) 347.85 (477.85) (477.85)Frias, Wilmer 5,000.00 5,000.00 5,000.00Fuentes, Ma. Leda J. 7,060.00 7,060.00 7,060.00Galiza, Miguela S. 45,000.00 45,000.00 45,000.00Gallardo, John 13,000.40 13,000.40 13,000.40Garcia, Dolores A. 50,000.00 50,000.00 50,000.00Garcia, Earl Jimson R. 6,000.00 6,000.00 6,000.00Garcia, Lourdes C. 16.41 16.41 16.41Garcia, Muriel B. (6,500.00) (6,500.00) (6,500.00)Garcia, Mylene M. 10,000.00 10,000.00 10,000.00Garcia, Severino M. 330,762.36 236,201.52 94,560.84 94,560.84Garin, May C. 25,000.00 15,000.00 10,000.00 10,000.00Ending
Name and Designation of DebtorBeginningBalanceAdditionsDeductionsAmountAmountDeducted Written-OffCurrent Non-CurrentGenota, Jaime F. 822.32 822.32 822.32Gil, Aurora H. - PMSI 7,060.00 7,060.00 7,060.00Go-Monilla, Ma. Joycelyn A. 280.31 280.31 280.31Gonzaga, Jemabel 505.00 505.00 505.00Gonzales, Fortune N. 397.50 397.50 397.50Gubio, James B. (6,000.00) (6,000.00) (6,000.00)Guevarra, Remedios P. 4,297.00 4,297.00 4,297.00Gupit, Dolores S. (26,896.39) (26,896.39) (26,896.39)Gutang, Marco P. (2,353.33) (2,353.33) (2,353.33)Guzman, Jericho D. 8,460.00 8,460.00 8,460.00Guzman, Jimmy 150.00 150.00 150.00Hernandez, Alma R. (1,337.50) (1,337.50) (1,337.50)Hernandez, Angeline A. 7,491.70 816.<strong>17</strong> 6,675.53 6,675.53Hilario, Jacqueline E. 662.50 662.50 662.50Hore, Lelioso G. 300.00 300.00 300.00Ibasco, Lourdes 350.00 350.00 350.00Ignacio, Lourdes D. (350.00) (350.00) (350.00)Iguas, Jose A. (980.00) (980.00) (980.00)Imbang, Ma. Nathalie A. 3,772.50 3,772.50 3,772.50Inciong, Cherry Wyne E. 7,500.00 7,500.00 7,500.00Irabagon, Miramar 6,000.00 6,000.00 6,000.00Isidro, Rosalina B. (593.75) (593.75) (593.75)Israel, Marietta C. 5,000.00 5,000.00 5,000.00Jabile, Joel E. 50.00 50.00 50.00Javier, Anabella G. 8,162.50 8,162.50 8,162.50Jesus, Angelita SD. 0.08 0.08 0.08Jimenez, Arsenia S. 5,970.00 5,970.00 5,970.00Jimenez, Marietta 2,290.86 2,290.86 2,290.86Jonson, Joyce Lisa B. (48,424.97) (48,424.97) (48,424.97)Jose, Corazon V. 2,058.57 2,058.57 2,058.57Jose, Haidee R. (1,446.80) (1,446.80) (1,446.80)Junio, Nenitha L. 767.00 767.00 767.00Kenny, Isabel 14,000.00 14,000.00 14,000.00Lagula, Janette 1<strong>17</strong>.50 1<strong>17</strong>.50 1<strong>17</strong>.50Lamboson, Roger C. (4,000.00) (4,000.00) (4,000.00)Lantin, Rommel 1,383.31 1,383.31 1,383.31Lapastora, Milagros P. 7,406.80 5,335.00 2,071.80 2,071.80Lapuebla, Alfredo N. 2,490.00 121.60 2,368.40 2,368.40Larano, Leonora 5,848.75 5,848.75 5,848.75Larda, Edmundo D. (1,500.00) (1,500.00) (1,500.00)Laudato, Emmanuel N. (1,200.00) (1,200.00) (1,200.00)Laurente, Jaime R. 1,650.25 1,650.25 1,650.25Lauro, Jocelyn P. 10,856.00 10,856.00 10,856.00Lazaro, Ma.Teresita A. 3,205.00 3,205.00 3,205.00Legaspi, Heidi 1,000.00 1,000.00 1,000.00Leon, Emma Rose H. 16,500.00 16,500.00 16,500.00Lewis, Salome 1,147.50 1,147.50 1,147.50Liggayu, Michael 200.00 200.00 200.00Lim, Nathaniel L. 3<strong>17</strong>.00 3<strong>17</strong>.00 3<strong>17</strong>.00Lintag, Graciel A. 1,180.16 1,180.16 1,180.16Listana, Mary Rose 1,012.50 1,012.50 1,012.50Lizaso, Marcelino N. 400.00 400.00 400.00Lopez, Anastacio, Jr. L. (230.00) (230.00) (230.00)Lopez, Antonio P., Jr. 15.34 15.34 15.34Lopez, Fernando M. 250.00 250.00 250.00Lopez, Mercedita P. 252.50 252.50 252.50Loza, Luningning R. 748.00 748.00 748.00Lugtu, Blyth 5.00 5.00 5.00Macadangdang, Luzviminda (137.50) (137.50) (137.50)Macalaguing, Mateo D. Jr. 10,000.00 10,000.00 10,000.00Macaraeg, Paul 6,436.23 6,436.23 6,436.23Ending
Name and Designation of DebtorBeginningBalanceAdditionsDeductionsAmountAmountDeducted Written-OffCurrent Non-CurrentMacario, Christopher 50.00 50.00 50.00Magayaga, Lea Q. (7,059.99) (7,059.99) (7,059.99)Magtoto, Eliseo 200.00 200.00 200.00Malinao, Marivic 110.00 110.00 110.00Maliwat, Herminia I. 607,752.15 206,292.60 401,459.55 401,459.55Malot, Edmund Francis 100.00 100.00 100.00Manalili, Golda P. 50.00 50.00 50.00Manansala, Paolo 81.58 81.58 81.58Mangahas, Roser Benjamin 1,397.00 1,397.00 1,397.00Manicsic, Teresa B. 84.00 84.00 84.00Manigan, Alma C. 7.61 7.61 7.61Manlapaz, Divine Grace 5,000.00 5,000.00 5,000.00Manlapaz, Victor 1,200.00 1,200.00 1,200.00Manrique, Elenita <strong>17</strong>,000.00 <strong>17</strong>,000.00 <strong>17</strong>,000.00Mazo, Flaviano S. 780.00 780.00 780.00MC Entee, Keneline M. 3,928.90 3,928.90 3,928.90Medina, Joy E. (409.52) (409.52) (409.52)Medina, Ma. Ana Karina S. 25.94 25.94 25.94Medina, Merle S. (1,075.25) (1,075.25) (1,075.25)Medrano, Rosalinda 935.50 935.50 935.50Membrot, Ezitiel R. 2,150.00 2,150.00 2,150.00Mendoza, Cecilia H. (6,186.77) (6,186.77) (6,186.77)Mendoza, Florina M. 300.00 300.00 300.00Mendoza, Jobert 10,000.00 10,000.00 10,000.00Menorca, Emmanuel S. (250.00) (250.00) (250.00)Mercado, Annabelle K. 3,758.55 3,758.55 3,758.55Miguel, Emmanuel C. 6,619.60 6,619.60 6,619.60Milarpis, Joel 4,000.00 4,000.00 4,000.00Miranda, Dennis 4,100.00 4,100.00 4,100.00Monong, Cora 6,000.00 6,000.00 6,000.00Morimonte, Bonifacio D. 500.00 500.00 500.00Mortell, Gideon 5,237.46 5,237.46 5,237.46Nagal, Glenn Z. 330,762.36 236,201.52 94,560.84 94,560.84Narval, Antonio G. 520.80 520.80 520.80Natera, Malvin G. 4,121.97 4,121.97 4,121.97Nava, Delfin D. 767.00 767.00 767.00Nicer, Joselito C. (65,500.85) (65,500.85) (65,500.85)Nietes, Raymond G. 16,689.30 16,689.30 16,689.30Ninobla, Magnolia <strong>17</strong>0.00 <strong>17</strong>0.00 <strong>17</strong>0.00Ninubla, Shiela 1,018.53 1,018.53 1,018.53Nolasco, Maria Sylva 1,775.00 1,775.00 1,775.00Noriega, Mariwilda I. (7,306.55) (7,306.55) (7,306.55)Nuestro, Sarah Joyce 10,947.97 65.74 10,882.23 10,882.23Nulla, Mila R. 21,433.75 21,433.75 21,433.75Ocampo, Wilfredo T. 1,150.00 1,150.00 1,150.00Olipas, Lorina L. 200.00 200.00 200.00Ong, Emil 4<strong>17</strong>.53 4<strong>17</strong>.53 4<strong>17</strong>.53Orjalo, Victoria G. 200.00 200.00 200.00Ortiz, Jose (4,882.00) (4,882.00) (4,882.00)Ortiz, Milixa Lourdes B. 5,000.00 5,000.00 5,000.00Oyzon, Gualberto J. 3,002.80 3,002.80 3,002.80Padilla, Maria Eleanor T. 1,430.50 1,430.50 1,430.50Pahutan, Ludivinia M. (200.00) (200.00) (200.00)Palparan, Karoline L. (900.00) (900.00) (900.00)Pamintuan, Jose Edmundo E. 100.00 100.00 100.00Pante, Ronald S. 600.00 600.00 600.00Paraiso, Lourdes Oliva C. 84,847.50 84,847.50 84,847.50Paras, Renato 50,000.00 50,000.00 50,000.00Pasag, Maribeth 315.00 315.00 315.00Pascua, Jennifer J. 40,977.91 40,977.91 40,977.91Pascual, Perfecto 350.00 350.00 350.00Ending
Name and Designation of DebtorBeginningBalanceAdditionsDeductionsAmountAmountDeducted Written-OffCurrent Non-CurrentPatricio, Natividad 598.75 598.75 598.75Paz, Rosalinda Z. 8,805.00 8,805.00 8,805.00Pekson II, Enrique Arvin (43,488.12) (43,488.12) (43,488.12)Perez, Crismin 10,591.34 10,591.34 10,591.34Perez, Jose R. Jr. 52.20 52.20 52.20Pimentel, Stephanie 285.00 285.00 285.00Pineda, Rodolfo G. (149.99) (149.99) (149.99)Ponsaran, Levy C. 2,450.00 2,450.00 2,450.00Portiz, Ellen 207.50 207.50 207.50Pring, Melanie 5,000.00 5,000.00 5,000.00Publico, Hilario Q. 5,376.50 5,376.50 5,376.50Puertollano, Derek 250.00 250.00 250.00Pulmano, Zelmo 8,000.00 8,000.00 8,000.00Querijero, Glen Hilario M. 5,000.00 5,000.00 5,000.00Quiambao, Arlene 358.50 358.50 358.50Quijano, Virginia A. 7,220.00 7,220.00 7,220.00Quintanar, Janeth A. 5,366.56 5,366.56 5,366.56Quinto, Myrna P. 7,060.00 7,060.00 7,060.00Quirimit, Luzviminda 1,942.77 1,942.77 1,942.77Ragonjah, Homer Jay D. 15.00 15.00 15.00Ramon, Elizabeth A. de - PMSI 7,060.00 7,060.00 7,060.00Ramones, Rhozallino C. 5,000.00 5,000.00 5,000.00Ramos, Erlinda L. 10,000.00 10,000.00 10,000.00Ramos, Leonora A. 1,532.89 1,532.89 1,532.89Ramos, Ma. Theresa L. 853.81 853.81 853.81Rana, Aurelio Y. (3,132.92) (3,132.92) (3,132.92)Rapirap. Raquel T. 8,288.00 8,288.00 8,288.00Rasalan, Julia 772.50 772.50 772.50Remiendo, Noraliza A. 10.00 10.00 10.00Remigio, Warley 100.00 100.00 100.00Retardo, Victor C. (600.00) (600.00) (600.00)Reyes, Byron M. 200.00 200.00 200.00Reyes, Herbert D. 4,555.00 4,555.00 4,555.00Reyes, Melodia S. 6,834.00 6,834.00 6,834.00Reyes, Ruby 572.50 572.50 572.50Reymundo, Samuel 50.00 50.00 50.00Rivera, Myrna T. (1,420.25) (1,420.25) (1,420.25)Rizada, Ryan Joseph 9,159.80 9,159.80 9,159.80Ronda, Ma. Lea A. 300.00 300.00 300.00Rosa, Giovanni dela 551.63 551.63 551.63Rosario, Alma del - PMSI (7,060.00) (7,060.00) (7,060.00)Rosario, Hilario - PMSI 14,120.00 14,120.00 14,120.00Rosete, Dwight Benedict N. (500.00) (500.00) (500.00)Roxas, Ronald L. 8,000.00 8,000.00 8,000.00Rubillos, Leonardo I. (600.00) (600.00) (600.00)Ruzol, Hipolito S. 300.00 300.00 300.00Sabaupan, Sylvette G. 23,364.75 23,364.75 23,364.75Sabaybay, Jocelyn L. 666.00 666.00 666.00Saldua, Eder John (5,000.00) (5,000.00) (5,000.00)Salonga, Lea 50.00 50.00 50.00Salud, Alann M. (520.00) (520.00) (520.00)Salvacion, Dennis C. (3,000.00) (3,000.00) (3,000.00)Salvador, Esther D. 18.00 18.00 18.00San Pablo, Ma.Cecilia A. 492.25 402.25 90.00 90.00Sante, Nova C. (981.25) (981.25) (981.25)Santiago, Christopher G. 9,638.<strong>17</strong> 9,638.<strong>17</strong> 9,638.<strong>17</strong>Santiago, Edwin B. 50.00 50.00 50.00Santiago, Genine 1,130.00 362.46 767.54 767.54Santillan, Vivian M. 190.00 190.00 190.00Santos, Arwind 49,990.00 49,990.00 49,990.00Santos, Carmelita C. (1,391.64) (1,391.64) (1,391.64)Ending
Name and Designation of DebtorBeginningBalanceAdditionsDeductionsAmountAmountDeducted Written-OffCurrent Non-CurrentSantos, Danilo B. 2,645.25 2,645.25 2,645.25Santos, Dinia 251.25 251.25 251.25Santos, Glecerio 200.00 200.00 200.00Santos, Mary Lord 5,000.00 5,000.00 5,000.00Santuile, Aida M. 8,000.00 8,000.00 8,000.00Sapitula, Preciosa S. 1,586.57 1,586.57 1,586.57Sarita, Larry 50.00 50.00 50.00Sarmiento, Lina Q. 5,691.62 4,753.25 938.37 938.37Sayco, Marjorie 206.50 206.50 206.50Sido, Ma. Victoria P. 125.80 125.80 125.80Sin, Glenda S. 7,060.00 7,060.00 7,060.00Sinang, Rolando R. 7,263.50 7,263.50 7,263.50Sincioco, Mary Ann 207.50 207.50 207.50Siongco, Ma. Teresita 2,000.00 2,000.00 2,000.00Sioson, Annabelle P. 60.00 60.00 60.00Sioson, Yolanda J. 57,480.00 57,480.00 57,480.00Soliman, Norma P. 7,060.00 7,060.00 7,060.00Sopoco, Anna Marie M. 1,890.00 1,890.00 1,890.00Soria, Eulegio E. 1,000.00 1,000.00 1,000.00Sta. Ana, Noemi V. 311.00 311.00 311.00Tabaloc, Edgardo U. Jr. 51.58 51.58 51.58Tabaniag, Flordeliza 63.75 63.75 63.75Tablizo, Anne Margareth 206.50 206.50 206.50Tagle, Susan M. 5,051.41 5,051.41 5,051.41Tamay, Shariff M. 5,000.00 5,000.00 5,000.00Tamayao, Olivia E. 4,996.60 4,996.60 4,996.60Tan, Carolina M. - PMSI 7,060.00 7,060.00 7,060.00Tan, Cedrick - PMSI (4,875.00) (4,875.00) (4,875.00)Tan, Derrick - PMSI 15,187.00 15,187.00 15,187.00Tan, Mary Joyce P.- PMSI 7,060.00 7,060.00 7,060.00Tan, Ryanne 1<strong>17</strong>.50 1<strong>17</strong>.50 1<strong>17</strong>.50Tapalgo, Elyn M. Jr. (2,657.50) (2,657.50) (2,657.50)Tecson, Rhenalyn 311.00 311.00 311.00Teoxon, Lucio 379.82 379.82 379.82Tibayan, Florencia C. 305.00 305.00 305.00Tiburcio, Jaime, Jr. 2,007.50 2,007.50 2,007.50Timbugan, Josefina - PMSI 7,060.00 7,060.00 7,060.00Tirazona, Renato A. 1,992.92 1,992.92 1,992.92Togado, Illumar I. 4,000.00 4,000.00 4,000.00Tomas, Eden A. 943.00 943.00 943.00Torres, Maruja T. 206.50 206.50 206.50Trinidad, Alfredo D. 329.07 329.07 329.07Trinidad, Josefina <strong>17</strong>0.00 <strong>17</strong>0.00 <strong>17</strong>0.00Tuazon, Nino M. 356.25 356.25 356.25Unidad, Kim Ryan 100.00 100.00 100.00Ureta, Peter 9,397.10 9,397.10 9,397.10Usita, Laarni P. 23,069.00 23,069.00 23,069.00Uy, Moira B. 4,000.00 4,000.00 4,000.00Uyson, Leslie Marie C. 15,372.00 6,113.92 9,258.08 9,258.08Valdez, Ferdinand 1,000.00 1,000.00 1,000.00Valdez, Gloria 1,237.50 1,237.50 1,237.50Valencia, Jean Pauline S. (5,198.00) (5,198.00) (5,198.00)Valencia, Ma. Theresa L. 530.00 530.00 530.00Valenzuela, Edwin E. 300.00 300.00 300.00Valmonte, Alejandra Monica 205.25 205.25 205.25Varilla, Edglyn G. 5,140.61 5,140.61 5,140.61Vera, Antonio 0.03 0.03 0.03Vera, Jose Rizalito c. (5,400.00) (5,400.00) (5,400.00)Vera, Sebastian (2,300.00) (2,300.00) (2,300.00)Verances, Ma. Laline V. (841.50) (841.50) (841.50)Vergara, Flocerfida - PMSI (35,220.00) (35,220.00) (35,220.00)Ending
Name and Designation of DebtorBeginningBalanceAdditionsDeductionsAmountAmountDeducted Written-OffCurrent Non-CurrentVergara, Melchor - PMSI (7,060.00) (7,060.00) (7,060.00)Vergara, Oliver Francis - PMSI (7,060.00) (7,060.00) (7,060.00)Vergara, Regidor - PMSI (7,060.00) (7,060.00) (7,060.00)Vergara, Romeo - PMSI 21,180.00 21,180.00 21,180.00Verzosa, Bobby 100.00 100.00 100.00Vibar, Enrico B. 7,200.00 7,200.00 7,200.00Vicera, Desmond M. 200.00 200.00 200.00Victoria, Michael S. (640.00) (640.00) (640.00)Villaceran, Eugenio V. (18,230.98) 7,060.00 (25,290.98) (25,290.98)Villamiel, Carminda (29,288.90) (29,288.90) (29,288.90)Villanueva, Ace R. 26.98 26.98 26.98Villanueva, Jonas V. (13,073.00) (13,073.00) (13,073.00)Villanueva, Ma. Concepcion 5,000.00 5,000.00 5,000.00Villapando, Marimel A. 200.00 200.00 200.00Villar, Gerald 7,060.00 7,060.00 7,060.00Vivas, Cherry Mae 300.00 300.00 300.00Woolsey, Nida B. 278.00 278.00 278.00Yabis, Geraldine 97.50 97.50 97.50Yang, Gloria 45,000.00 45,000.00 45,000.00Yanzon, Gina 500.00 500.00 500.00Yap, Caridad P. (4,841.00) (4,841.00) (4,841.00)Yatco, Ma. Carmen S. 29,320.00 29,320.00 29,320.00Zaldivar, Ramil P. 5,000.00 5,000.00 5,000.00Zulueta, Michael R. 7,000.00 7,000.00 7,000.00FACULTY ADVANCESP 2,825,974.91 - 1,269,875.56 - 1,556,099.35 1,556,099.35Aguilos, Susan S. 2,983.13 2,983.13 2,983.13Alona, Elizabeth V. (5,295.67) (5,295.67) (5,295.67)Altares, Priscilla S. (37.62) (37.62) (37.62)Anastacio, Nanette v. (5,295.67) (5,295.67) (5,295.67)Ansano, Bela R. 11,590.42 11,590.42 11,590.42Austria, Rex S. (2,160.00) (2,160.00) (2,160.00)Avengoza, Rosalie J. (6,518.64) (6,518.64) (6,518.64)Badiola, Jose Luisito V. (0.52) (0.52) (0.52)Bautista, Mary Grace S. (5,295.67) (5,295.67) (5,295.67)Cano, Charito F. 847.27 847.27 847.27Castro, Lawrence Christopher 1,765.22 1,765.22 1,765.22Cruz, Sandra Lyn E. 44,290.05 44,290.05 44,290.05Dimalibot, Martina Geraldine Q. 1,926.98 1,926.98 1,926.98Estacio, Ma. Vivian G. 3,832.70 3,832.70 3,832.70Gariguez, Mariflor N. 10,591.34 10,591.34 10,591.34Garin, May C. 5,534.22 5,534.22 5,534.22Isip, Amando F. (1,323.91) (1,323.91) (1,323.91)Javier, Nancy Joan M. 5,295.67 5,295.67 5,295.67Jose, Franco C. (6,619.59) (6,619.59) (6,619.59)Malay, Ernesto B. 20,910.00 20,910.00 20,910.00Martinez, Zenaida S. (7,943.50) (7,943.50) (7,943.50)Minas, Geraldine C. (2,100.00) (2,100.00) (2,100.00)Narciso, Wilfrida B. 5,295.67 5,295.67 5,295.67Naui, Elizabeth S. (50.00) (50.00) (50.00)Pacot, Marilou M. (7,943.50) (7,943.50) (7,943.50)Permalino, Albert Emmanuel S. 7,060.89 7,060.89 7,060.89Sagarino, Gavino N. (5,295.67) (5,295.67) (5,295.67)Salcedo, Liezel Donatila M <strong>17</strong>,190.24 <strong>17</strong>,190.24 <strong>17</strong>,190.24Salunga, Loida P. 14,960.54 14,960.54 14,960.54Salvado, Rowena E. 22,160.26 22,160.26 22,160.26Santos, Buenvenida 3,971.75 3,971.75 3,971.75Santos, Katherine Vera A. (32.50) (32.50) (32.50)Ending
Name and Designation of DebtorBeginningBalanceAdditionsDeductionsAmountAmountDeducted Written-OffCurrent Non-CurrentSantos, Melody Christian R. 3,909.51 3,909.51 3,909.51Simo, Rickson Jay (21,182.72) (21,182.72) (21,182.72)Tia, Christopher B. (0.03) (0.03) (0.03)Trinidad, Josefina M. 1,690.82 1,690.82 1,690.82Villanueva, Rosalie R. (10,591.34) (10,591.34) (10,591.34)Villegas, Ma. Marissa M. (10,591.34) (10,591.34) (10,591.34)Villorente, Elizabeth F. 1,323.91 1,323.91 1,323.91Vinluan, Renato A. 2,028.62 2,028.62 2,028.62Total P 2,916,856.23 - 1,269,875.56 P - 1,646,980.67 1,646,980.67Ampatin, Estrella V. (560.00) (560.00) (560.00)Cabasada, Albert R. III 26,099.35 26,099.35 26,099.35Caratao, Jinky Rosario 6,800.00 6,800.00 6,800.00Cruz, Reynaldo J. (5,000.00) (5,000.00) (5,000.00)Diwa, Alvin S. 31,783.91 31,783.91 31,783.91Frades, Francisca B. (451.32) (451.32) (451.32)Garin, May C. 46,130.23 46,130.23 46,130.23Molina, Mark Oliver P. (5,232.06) (5,232.06) (5,232.06)Paraiso, Lourdes Oliva 0.20 0.20 0.20Pizaro, Arthur 1,200.00 1,200.00 1,200.00Sarabia, Juliet S. 4,755.00 4,755.00 4,755.00Soria, Eulegio 1,777.00 1,777.00 1,777.00Tolentino, Rosula R. 8,646.70 8,646.70 8,646.70Villanueva, Romulo 5,212.00 5,212.00 5,212.00Villar, Gerald 20,388.77 34.30 20,354.47 20,354.47Yang, Gloria G. 11,760.00 11,760.00 11,760.00EndingTOTAL P 3,070,166.01 - 1,269,909.86 P - 1,800,256.15 1,800,256.15JANUARY 2008 - MARCH 2010Abala, GenP 155.00 P 155.00 155.00Abanco, Nini Paz M. (155.00) (155.00) (155.00)Abella, Bernard 3.88 3.88 3.88Adil, Mary Antoinette 200.00 200.00 200.00Agnes, Reynold D. 30,128.00 25,128.00 5,000.00 5,000.00Agudong, Julito A. 1,480.00 1,480.00 1,480.00Aguila, Fitzgerald 11,000.00 1,895.09 9,104.91 9,104.91Aguilar, Manuel P. 1,500.00 3,823.50 1,500.00 3,823.50 3,823.50Aguilar, Sarah Joy A. 19,650.00 19,650.00 19,650.00Agustin, Ma. Theresa A. 10,792.75 10,465.05 327.70 327.70Ahmadzadeh, Teresita 710.62 1,094.45 810.62 994.45 994.45Alagao, Ma. Cristina T. 183.68 550.00 367.01 366.67 366.67Alarde, Crispulo, Jr. 660.00 76,565.00 60,695.85 16,529.15 16,529.15Alcoberes, Philip Jay N. (1,000.00) (1,000.00) (1,000.00)Alcoriza, Jennifer M. (600.00) (600.00) (600.00)Aldeguer, Christine Carpio 4,140.00 1,780.00 2,360.00 2,360.00Alimuin, Sylvia A. 1,350.12 8,682.00 6,566.12 3,466.00 3,466.00Alvarez, Alfredo R. 20,588.20 18,961.45 1,626.75 1,626.75Andrada, Gaylene H. (733.40) 1,147.00 947.00 (533.40) (533.40)Angel, Heherson M. 3,243.00 281.25 2,961.75 2,961.75Angeles, Lemuel 600.00 100.00 500.00 500.00Anido, Cecilia I. 4,386.67 1,009,285.90 5,823.82 1,007,848.75 1,007,848.75An Lim, Jaime L. 119,500.00 88,182.00 <strong>17</strong>6,682.00 31,000.00 31,000.00Apolonio, Jerry D. 431.50 281.50 150.00 150.00
Name and Designation of DebtorBeginningBalanceAdditionsDeductionsAmountAmountDeducted Written-OffCurrent Non-CurrentArabia, Julieta S. 16,629.90 92,992.80 83,336.90 26,285.80 26,285.80Arago, Teodulfo A. 2,253.40 1,<strong>17</strong>8.00 1,075.40 1,075.40Areola, Vina 7,700.00 7,700.00 7,700.00Arquiza, Glenda 73,000.00 <strong>17</strong>9,724.25 199,130.25 53,594.00 53,594.00Arriola, Eric John C. (200.00) 200.00 200.00 (200.00) (200.00)Asis, Amelia B. 5,064.50 64.50 5,000.00 5,000.00Atanacio, Heidi C. 3,467.00 3,467.00 3,467.00Atanque, Aurora L. 14,789.40 32.00 18,632.00 (3,810.60) (3,810.60)Ayson, Paulino 632.75 632.75 632.75Ayson, Rosalino P. 10,027.63 12,757.30 15,956.28 6,828.65 6,828.65Baccay, Yolanda A. 20,000.00 8,611.05 27,057.55 1,553.50 1,553.50Badiola, Jose Luisito V. 200.00 200.00 200.00Baello, Christine N. 22,271.00 18,610.65 3,660.35 3,660.35Baja, Lauro 996.25 996.25 996.25Balaoro, Maria Theresa (200.00) 100.00 100.00 (200.00) (200.00)Balarosan, Edna G. 2,193.34 28,970.00 13,314.59 <strong>17</strong>,848.75 <strong>17</strong>,848.75Balita, Paulita C. 34,708.73 46,000.00 58,921.96 21,786.77 21,786.77Bantayan, Maria Emilia R. 8,350.00 2,639.92 5,710.08 5,710.08Baquiran, Leonidez 200.00 200.00 200.00Barro, Liana M. 11,095.02 10,<strong>17</strong>5.02 920.00 920.00Barroga, Junalyn 145.00 145.00 145.00Batan, Ericson S. 1,516.60 1,516.60 1,516.60Batoon, Allen 850.00 850.00 850.00Bautista, Juan Andres 10,572.00 10.00 10,562.00 10,562.00Baylon, Milagros D. 297.50 297.00 0.50 0.50Bejo, Noel B. 4,604.50 634.50 3,970.00 3,970.00Belardo, Amy G. 1,750.00 23,665.50 1,750.00 23,665.50 23,665.50Belaya, Vina Grace C. (1,862.40) 4,412.70 2,295.90 254.40 254.40Belleza, Asuncion L. 40,811.00 93,547.74 96,900.74 37,458.00 37,458.00Bello, Yolanda L. 8,492.00 5,078.75 3,413.25 3,413.25Beltran, Edna M. 7,500.00 37,985.00 32,985.00 12,500.00 12,500.00Beltran, Manuel D. 550.00 600.00 (50.00) (50.00)Belza, Mercedes A. 14,583.80 62,089.09 64,257.91 12,414.98 12,414.98Bengo, Manuelito V. 36,653.99 32,126.84 4,527.15 4,527.15Bernado, Norma V. 13,400.90 8,702.35 4,698.55 4,698.55Bernardo, Rodrigo G. 21,412.00 6,999.00 6,999.00 21,412.00 28,411.00Bilan, Jeanette L. 1,326.18 1,326.18 1,326.18Bingculado, Roger B. 2,500.00 38,000.00 22,500.00 18,000.00 18,000.00Bisco, Melanie C. 10,000.00 10,000.00 10,000.00Bolo, Benjamin A. 69,121.09 62,454.41 6,666.68 6,666.68Botaslac, Benjamin D. 27,959.00 2,959.00 25,000.00 25,000.00Brillo, Eva B. 100,000.00 93,333.33 6,666.67 6,666.67Brillon, Cherish Aileen A. (25.00) (25.00) (25.00)Buen, Jennifer T. 6,948.00 5,029.00 1,919.00 1,919.00Buenafe, Ma. Belinda G. 1,773.76 80.01 1,693.75 1,693.75Buendia, Ma. Esperanza 20,000.00 20,000.00 20,000.00Bueno, Marivie 370.75 370.75 370.75Buot, Joseph 600.00 600.00 600.00Buquid, Apolonio A. 18,653.00 18,153.00 500.00 500.00Burac, Joseph T. 32,215.50 8,331.80 23,883.70 23,883.70Bustamante, Maria Christine H. 600.00 49,649.00 41,354.00 8,895.00 8,895.00Caagbay, Elpidio Z. 71,000.00 58,000.00 13,000.00 13,000.00Cabaltica, Leilani A. 57,386.67 145,183.50 163,721.42 38,848.75 38,848.75Cabasada, Albert R. III (12,300.00) 24.00 24.00 (12,300.00) (12,300.00)Cabilto, Gerardo P. 10,800.00 12,000.00 21,800.00 1,000.00 1,000.00Cabinta, Ma. Dolores B. 65,312.00 37,812.00 27,500.00 27,500.00Cabrera, Alicia M. 7,100.65 4,212.00 2,888.65 2,888.65Cabrera, Roberlyn V. 36,000.00 4,000.00 32,000.00 32,000.00Cada, Leonardo F. 13,650.66 12,463.76 1,186.90 1,186.90Cajucom, Cherry S. 4,386.67 14,590.00 11,327.92 7,648.75 7,648.75Cajucom, Marie Christine B. 850.00 850.00 850.00Ending
Name and Designation of DebtorBeginningBalanceAdditionsDeductionsAmountAmountDeducted Written-OffCurrent Non-CurrentCamaclang, Merlita J. 6,569.62 63,534.00 46,103.62 24,000.00 24,000.00Camana, Love V. 2,675.00 27,888.25 26,775.75 3,787.50 3,787.50Campomanes, Carolina 1.00 6.00 (5.00) (5.00)Canare, Sabino C. (375.00) (375.00) (375.00)Cando, Cromwell N. 4,000.00 36,696.85 37,000.00 3,696.85 3,696.85Canilao, Fe V. 104,386.67 8,970.00 105,507.92 7,848.75 7,848.75Canosa, Michelle 20,000.00 20,000.00 20,000.00Cao, Marilou F 18,925.75 18,425.75 500.00 500.00Capacio, Glenn (5,000.00) (5,000.00) (5,000.00)Capili, Leslie Ann V. 100.00 1,920.00 (1,820.00) (1,820.00)Capili, Regina R. (418.13) 6,623.85 3,464.87 2,740.85 2,740.85Carino, Raquel G. 4,598.00 4,598.00 4,598.00Carlos, Salome S. (850.00) 498.50 498.50 (850.00) (850.00)Carpio, Miguel M. 53,124.50 204.50 52,920.00 52,920.00Carpio, Rustica 1,788.00 1,788.00 1,788.00Castillo, Carolina 24,000.00 45,937.00 34,937.00 35,000.00 35,000.00Castro, Joeven R. 5,158.79 8,970.02 6,280.06 7,848.75 7,848.75Casuco, Leonida S. (14,614.40) 35,002.50 8,002.50 12,385.60 12,385.60Cayetano, Lovella M. 6,000.00 25,000.00 29,681.81 1,318.19 1,318.19Chastein, Cherry R. 10,000.00 10,000.00 10,000.00Chua, Wilson S. 5,000.00 4,450.00 550.00 550.00Ciubal, Willie Y. 3,150.00 136.00 3,886.00 (600.00) (600.00)Corpuz, Cristina R. 650.00 150.00 500.00 500.00Cotorno, Lorine B. 13,600.00 8,800.00 4,800.00 4,800.00Cruz, Benjamin F. 25,000.00 30,000.00 (5,000.00) (5,000.00)Cruz, Christybel O. 45,000.00 40,500.00 4,500.00 4,500.00Cruz, Noel L. 20,433.91 46,956.47 66,796.13 594.25 594.25Cruz, Rebecca S. 30,992.50 992.50 30,000.00 30,000.00Cuibillas, Jorge P. 8,464.50 5,043.75 3,420.75 3,420.75Culala, Harold John D. 30,000.75 21,000.75 9,000.00 9,000.00Dacayanan, Marites G. (237.04) 5,014.50 5,014.50 (237.04) (237.04)Daguman, Ian 650.00 650.00 650.00Dalton, Juanita 6<strong>17</strong>.50 6<strong>17</strong>.50 6<strong>17</strong>.50Damasco, Charmaine Gay 1,022.00 1,639.50 (6<strong>17</strong>.50) (6<strong>17</strong>.50)Davalos, Zenaida R. 250.00 250.00 250.00David, Melvira C. (335.00) (335.00) (335.00)Decena, May Celine 272.00 272.00 272.00Defino, Lorna M. 492.00 222.00 270.00 270.00Destura, Blanca 10,749.58 74,690.25 51,638.43 33,801.40 33,801.40Diamante, Fernan M. 26,430.20 5,672.00 20,758.20 20,758.20Diaz, Joel 850.00 850.00 850.00Dimaano, Jessalyn 15,000.00 15,000.00 15,000.00Dimalibot, Ma. Martina Geraldine 200.00 200.00 200.00Diorico, Marites C. 24,487.60 15,812.50 8,675.10 8,675.10Dios, Rolando Gerald 200.00 200.00 200.00Dizon, Kenneth Earl I. 200.00 200.00 200.00Doble, Jon Derek 52,800.00 24,000.00 28,800.00 28,800.00Doctolero, Priscila L. 737.25 664.50 72.75 72.75Domingo, Ernesto E. 200.00 200.00 200.00Dominguez, Rex S. 24,339.66 39,100.00 63,439.16 0.50 0.50Dones, Irene P. 27,400.00 1,344.00 28,844.00 (100.00) (100.00)Dublin, Marietta T. 1,756.15 68.00 1,688.15 1,688.15Ducut, Mirela G. 37,164.60 30,342.20 49,398.10 18,108.70 18,108.70Dulalia, Nelson M. 1,450.00 (1,450.00) (1,450.00)Durban, Joel M. 966.60 (966.60) (966.60)Dy Kam, Felicidad 1,025.00 (1,025.00) (1,025.00)Echauz, Lydia B. 50,000.00 57,549.35 50,000.00 57,549.35 57,549.35Eleazar, Glenda C. 34,386.67 44,984.75 43,967.11 35,404.31 35,404.31Enriquez, Rex Cezar P. (200.00) 975.00 975.00 (200.00) (200.00)Ermitano, Nolivienne C. (237.50) (237.50) (237.50)Escobia, Irma L. <strong>17</strong>,500.01 16,250.01 1,250.00 1,250.00Ending
Name and Designation of DebtorBeginningBalanceAdditionsDeductionsAmountAmountDeducted Written-OffCurrent Non-CurrentEscobia, Jaime T. 23,300.00 20,970.00 2,330.00 2,330.00Escosia, Aurora A. 5,869.06 28,775.75 27,096.31 7,548.50 7,548.50Esguerra, Anna Leah R. 200.00 200.00 200.00Esguerra, Marissa B.. 203.00 563.00 (360.00) (360.00)Espinosa, William V. 56,420.00 62,420.00 (6,000.00) (6,000.00)Espiritu, Elizabeth O. 1,537.34 11,868.90 4,114.70 9,291.54 9,291.54Estacio, Ma. Vivian G. 13,773.33 34,408.50 19,499.74 28,682.09 28,682.09Estrella, Luisito P. 5,700.00 <strong>17</strong>,500.00 22,400.00 800.00 800.00Evangelista, Erika <strong>17</strong>,375.00 <strong>17</strong>,375.00 <strong>17</strong>,375.00Evangelista, Rey M. 28,309.19 92,850.60 62,706.25 58,453.54 58,453.54Fajardo, Rolando 2,150.00 (2,150.00) (2,150.00)Ferareza, Rimar 250.00 250.00 250.00Fernandez, Rosana S. (2,500.00) 6,366.60 6,366.60 (2,500.00) (2,500.00)Fernando, Gerry V. 20,000.00 64,392.01 51,540.47 32,851.54 32,851.54Fernando, Rogelio E. 5,000.00 1,000.00 4,000.00 4,000.00Fiesta, Erlinda P. 55,913.20 3,000.00 52,913.20 52,913.20Flora, Dolores 10,774.33 8,388.67 2,385.66 2,385.66Flores, Floriza Ann 18,000.00 18,000.00 18,000.00Flores, Ma.Cecilia D. 100.00 100.00 100.00Flores, Miguela Trinidad 43,333.33 39,000.00 72,750.00 9,583.33 9,583.33Flores, Roberto C. 140,000.00 56,000.00 84,000.00 84,000.00Flores, Teresita T. 3,090.50 66.50 3,024.00 3,024.00Foronda, John Clarence 1,000.00 1,000.00 1,000.00Fortaleza, Ramon M. 2,011.35 2,011.35 2,011.35Frades, Francisca B. 37,482.00 38,990.25 61,022.25 15,450.00 15,450.00Fronda, Adelaida C. (1,000.00) 5,273.75 972.00 4,301.75 (1,000.00) 3,301.75Galo, Crispin L. 6,550.25 6,550.25 6,550.25Garcia, Dolores A. 100.00 100.00 100.00Garcia, Miriam 9,038.12 21,392.25 20,753.12 9,677.25 9,677.25Garcia, Mylene M. 20,035.00 18,035.00 2,000.00 2,000.00Garcia, Myllah D. 7,615.90 7,576.90 39.00 39.00Garcia, Severino M. 66,664.00 206,974.75 <strong>17</strong>3,638.75 100,000.00 100,000.00Garrido, Elma C. 5,775.45 0.50 5,774.95 5,774.95Gaspillo, Rudy M> 20,621.55 20,621.55 20,621.55Gella, Delia D. 200.00 200.00 200.00Gella, Frederick S. (2,000.10) (2,000.10) (2,000.10)Gemzon, Elena F. 3,655.33 9,145.00 4,951.58 7,848.75 7,848.75Gerardo, Elsa F. 975.00 (975.00) (975.00)Gervacio, Ma. Cristina SJ. (240.00) 5,383.00 5,383.00 (240.00) (240.00)Gilera, Enrico G. 68,315.74 100,855.50 79,<strong>17</strong>1.24 90,000.00 90,000.00Golloso, Helen E. 4,499.99 5,000.00 (500.01) (500.01)Gonzales, Emmanuel S. 629.25 629.25 629.25Gorod, Flordeliza N. 66,630.92 57,186.52 9,444.40 9,444.40Grasparil, James Andrew (1,575.00) (1,575.00) (1,575.00)Guarin, Ellen G. 400.00 400.00 400.00Gubio, James B. 2,400.00 24,702.60 14,254.20 12,848.40 12,848.40Guevarra, Dorvin H. 32,034.93 18,<strong>17</strong>1.74 13,863.19 13,863.19Guevarra, Ma. Theresa M. (425.00) 31,8<strong>17</strong>.50 28,647.80 3,169.70 (425.00) 2,744.70Guevarra, Remedios P. 50,020.00 25,020.00 25,000.00 25,000.00Gurrea, Ruby 200.00 200.00 200.00Gusi, Rechilda D. 821.40 11,134.05 4,609.90 7,345.55 7,345.55Gutierrez, Lucita A. 29,080.50 28,<strong>17</strong>2.50 908.00 908.00Guzman, Barbara Michelle 910.50 933.50 (23.00) (23.00)Guzman, Guillerma M. 31,963.00 4,963.00 27,000.00 27,000.00Guzman, Ma. Corazon A. 21,503.44 22,503.44 (1,000.00) (1,000.00)Hatt, Cielito Sanvictores 12,111.35 979.50 14,065.85 (975.00) (975.00)Hernandez, Jan Joseph S. 1,186.45 1,186.45 1,186.45Hizon, Irma L. 6,586.00 6,386.00 200.00 200.00Ibalio, Dyann A. 7,295.80 7,295.00 0.80 0.80Ignacio, Lourdes D. 30,991.57 35,000.00 50,991.57 15,000.00 15,000.00Iguas, Jose A. 11,107.70 9,486.75 15,800.05 4,794.40 4,794.40Ending
Name and Designation of DebtorBeginningBalanceAdditionsDeductionsAmountAmountDeducted Written-OffCurrent Non-CurrentInciong, Cherry Wyne 477.00 7,402.00 6,699.00 1,180.00 1,180.00Indico, Julie Ann 348.50 348.50 348.50Ireneo, Elsa A. 20,000.00 20,000.00 20,000.00Isidro, Teresita L. 4,241.00 62,890.76 26,872.99 40,258.77 40,258.77Jamisod, Rafael 600.00 600.00 600.00Jamon, Romano M. 200.00 200.00 200.00Janagap, Fe Q. 52,274.90 37,921.65 14,353.25 14,353.25Jarlos, Anna Liza 3,655.33 32,070.00 12,936.58 22,788.75 22,788.75Jauco, Magdalena 7,303.10 3,182.75 4,120.35 4,120.35Javier, Mary Jacquelou 200.00 200.00 200.00Jerusalem, Violeta L. 45,737.28 118,694.50 <strong>17</strong>3,801.26 (9,369.48) (9,369.48)Jesus, Angelita SD. 4,386.67 58,964.58 45,381.25 <strong>17</strong>,970.00 <strong>17</strong>,970.00Jimenez, Arsenia S. 28,150.00 18,150.00 10,000.00 10,000.00Jintalan, Elma C. 42,290.00 34,000.00 8,290.00 8,290.00Joloya, Ma. Aura Christine 361.00 234.00 127.00 127.00Jose, Angelina P. 341,383.87 50,000.00 341,383.87 50,000.00 50,000.00Julio, Beata R. 16,897.45 1,618.50 15,278.95 15,278.95Junio, Nenitha L. 125.00 125.00 125.00Kenny Isabel 50,000.00 50,000.00 50,000.00Knuttel, Jens 7,948.30 7,948.30 7,948.30Ko, Robert H. 192.00 62.00 130.00 130.00Kuan, Robert 543,032.13 50,000.00 543,032.13 50,000.00 50,000.00Lacanilao, Gary 375.00 375.00 375.00Ladera, Renville M. (38.00) 28,136.75 23,000.00 5,098.75 5,098.75Lajara, Galilea R. 91,256.09 80,426.19 10,829.90 10,829.90Lakian, Teodosio (1,650.00) (1,650.00) (1,650.00)Lamorena, Juditha M. 42,000.00 192,012.28 167,321.10 66,691.18 66,691.18Lansang, Brenda 650.00 116,377.52 116,827.52 200.00 200.00Lapastora, Milagros 6,665.00 76,345.85 69,138.50 13,872.35 13,872.35Lauro, Jocelyn P. 9,799.00 38,297.00 39,521.88 8,574.12 8,574.12Laxamana, Rachel D. 23,380.00 21,042.00 2,338.00 2,338.00Lee, Nestor 4,386.67 1,483.25 4,6<strong>17</strong>.67 1,252.25 1,252.25Leon, Angelito Y. 53,970.00 45,000.00 8,970.00 8,970.00Leon, Emma Rose H. 3,741.00 23,674.75 41,265.75 (13,850.00) (13,850.00)Leon, Jocelyn E. 2,193.34 10,730.00 3,930.59 8,992.75 8,992.75Leonardo, Marietta 20,515.00 22,285.00 (1,770.00) (1,770.00)Leonardo, Violeta M. 135,299.50 110,299.50 25,000.00 25,000.00Lepon, Ma. Luisa M. 250.00 5,000.00 8,250.00 (3,000.00) (3,000.00)Letrero, Bernard 1,550.00 162.75 62.75 1,650.00 1,650.00Lim, Royce Randall 200.00 200.00 200.00Limon, Miguel Antonio P. 100.00 100.00 100.00Lindo, Alicia C. 15,624.00 26,947.90 37,629.95 4,941.95 4,941.95Lojo, Joanne Marie 20,000.00 20,000.00 20,000.00Lopez, Antonio C. 26,244.62 20,512.15 18,432.12 28,324.65 28,324.65Lopez, Mercedita P. 46,239.00 <strong>17</strong>,947.00 28,292.00 28,292.00Lopez, Ricardo S. 15,891.80 19,936.66 32,828.42 3,000.04 3,000.04Lopez, Ruelda A. 5,000.00 5,000.00 5,000.00Loyola, Voltaire 72.00 72.00 72.00Lumacad, Fernando B. (32,539.00) 50.33 50.33 (32,539.00) (32,488.67)Luyun, Teofilo P. Jr. 8,446.94 9,570.00 10,168.19 7,848.75 7,848.75Mabborang, Mishel T. 200.00 200.00 200.00Macalintal, Connie SJ. 6,345.01 5,000.01 1,345.00 1,345.00Macapagal, Arnualdo B. 45,950.50 240,847.74 236,788.00 50,010.24 50,010.24Macaraig, Melinda 11,755.30 8,994.50 2,760.80 2,760.80Macasaet, Grace Minerva 1,044.00 5,092.75 6,101.00 35.75 35.75Madria, Emenvenciano 650.00 650.00 650.00Magayaga, Lea Q. 1,200.00 800.00 400.00 400.00Magbuhat, Frances Ann 15,000.00 15,000.00 15,000.00Magmanlac, Mark Roland 20,000.00 20,000.00 20,000.00Mahilum, Rosalinda S. 200.00 200.00 200.00Malcampo, Agnes C. 35,085.00 25,539.56 9,545.44 9,545.44Ending
Name and Designation of DebtorBeginningBalanceAdditionsDeductionsAmountAmountDeducted Written-OffCurrent Non-CurrentMaliwat, Herminia I. 112,145.31 103,224.00 110,110.37 105,258.94 105,258.94Mamaid, Melanie P. 39,684.00 39,3<strong>17</strong>.33 366.67 366.67Manalansan, Paolo F. 6,250.00 10,063.00 12,713.00 3,600.00 3,600.00Manalo, Evelyn P. 10,000.00 10,000.00 10,000.00Manalo, Marilou 15,000.00 15,000.00 15,000.00Manaois, Mario B. 2,104.20 2,104.20 2,104.20Manguerra, Laarni C. 1,000.00 5,000.00 5,000.00 1,000.00 1,000.00Marcelino, Ariel Christopher 19,669.00 <strong>17</strong>,702.10 1,966.90 1,966.90Marcelo, Gerry A. 4,386.67 8,257.00 5,473.05 7,<strong>17</strong>0.62 7,<strong>17</strong>0.62Marcial, Maridel S. 14,444.51 671.00 13,619.26 1,496.25 1,496.25Mariano, Maria Lourdes A. 9,196.00 9,196.00 9,196.00Maristela, Teresita 215.00 215.00 215.00Martin, Wilhelmina E. 2,901.25 1,406.25 1,495.00 1,495.00Mateo, Jacinto C. Jr. 35,024.25 30,024.25 5,000.00 5,000.00Mazo, Flaviano S. 9,781.77 13,326.75 10,867.50 12,241.02 12,241.02Medel, Mervin 200.00 200.00 200.00Medina, Buenaventura Jr. 1,050.00 1,050.00 1,050.00Medina, Joy E. 600.00 43,193.25 42,483.73 1,309.52 1,309.52Melchor, Elizabeth P. 1,336.50 724.50 612.00 612.00Mendoza, Cecilia H. 200.00 200.00 200.00Mendoza, Gloria A. 7,447.25 2,419.25 5,028.00 5,028.00Mendoza, Simplica A. 12,203.00 25,702.68 (13,499.68) (13,499.68)Menez, Karren G. 6,000.00 34,738.00 39,740.00 998.00 998.00Menorca, Emmanuel S. 27,642.00 13,300.76 14,341.24 14,341.24Mercado, Valerie Grace P. 30,000.00 30,000.00 30,000.00Mesina, Karen T. (4,000.00) (4,000.00) (4,000.00)Miguel, Emmanuel C. 200.00 200.00 200.00Mina, Enrique N. 293.50 200.00 93.50 93.50Minas, Geraldine C. 9,316.00 12,288.00 (2,972.00) (2,972.00)Mintu, Cynthia B. 2,110.50 1,800.00 310.50 310.50Mitra, Melvin P. 552.35 552.35 552.35Molina, Ma. Olivia G. 59,120.00 49,120.00 10,000.00 10,000.00Molina, Mark Oliver P. 4,386.67 8,970.00 5,507.92 7,848.75 7,848.75Monderin, Victor C. 2,577.00 321.50 2,255.50 2,255.50Monfero, Rowena A. 6,000.00 36,149.75 38,404.00 3,745.75 3,745.75Montano, Moses M. 941.67 941.67 941.67Montinola, Aurelio R. III 274,838.73 50,000.00 274,838.73 50,000.00 50,000.00Montinola, Gianna R. 387,795.94 50,000.00 387,795.94 50,000.00 50,000.00Montinola, Lourdes R. 1,800,488.76 50,000.00 1,800,488.76 50,000.00 50,000.00Morilla, Toriana A. 850.00 850.00 850.00Mostajo, Esmeralda D. 12,000.00 53,998.00 55,438.75 10,559.25 10,559.25Nagal, Glenn Z. 0.33 200,000.00 198,000.66 1,999.67 1,999.67Nagtalon, Leo Angelo 640.00 640.00 640.00Najjar, Mary Chastine T. 3,130.80 33,752.90 27,364.40 9,519.30 9,519.30Naui, Elizabeth S. (93.75) 272.00 272.00 (93.75) (93.75)Navarro, Lilibeth C. 200.00 200.00 200.00Nebril, Jonathan A. 5,000.00 2,025.00 2,118.00 4,907.00 4,907.00Nicdao, Lazaro B. 8,758.80 1,114.70 8,762.80 1,110.70 1,110.70Nicer, Joselito C. 22,272.72 61,754.50 55,608.72 28,418.50 28,418.50Nicolas, Crispinita 190.00 190.00 190.00Nob, Rene M. (1,800.00) (1,800.00) (1,800.00)Norcio, Glen R. 644.00 744.00 (100.00) (100.00)Noriega, Mariwilda 11,616.76 40,448.13 28,733.16 23,331.73 23,331.73Nuestro, Sarah A. 150.00 150.00 150.00Nulla, Mila R. 43,857.00 118,933.95 98,974.00 63,816.95 63,816.95Oaferina, Gemmalyn A. (1,000.04) 9,451.25 10,382.55 (1,931.34) (1,931.34)Olivares, Joh Paul T. 78,200.00 57,200.00 21,000.00 21,000.00Omampo, Rolando B. 27,278.00 27,278.00 27,278.00Ondevilla, Miel Kristian 4,500.00 110.00 1,010.00 3,600.00 3,600.00Orias, Ronito B. 4,000.00 713.01 2,713.01 2,000.00 2,000.00Orolfo, Teodora C. 11,184.00 60,763.35 66,913.00 5,034.35 5,034.35Ending
Name and Designation of DebtorBeginningBalanceAdditionsDeductionsAmountAmountDeducted Written-OffCurrent Non-CurrentOrozco, Glorina P. 14,366.50 14,366.50 14,366.50Pacquing, Elizabeth P. 4,386.67 19,561.50 11,777.55 12,<strong>17</strong>0.62 12,<strong>17</strong>0.62Padilla, Leo A. 348.50 348.50 348.50Padual, Jennifer C. 30,000.00 5,000.00 25,000.00 25,000.00Pagdilao, Menchie C. 100.00 100.00 100.00Paguirigan, Viviana 1,443.25 1,443.25 1,443.25Pahutan, Ludivinia M. (1,000.00) 3.25 3.25 (1,000.00) (1,000.00)Pal, Salvacion A. 10,000.00 6,439.65 15,006.00 1,433.65 1,433.65Palaje, Joseph M. 400.00 400.00 400.00Palencia, Marjueve M. (1,000.00) 800.00 800.00 (1,000.00) (1,000.00)Palis, Fernando F. 2,250.00 8,688.45 10,081.30 857.15 857.15Palparan, Karoline L. 35,569.51 5,569.51 30,000.00 30,000.00Panesa, Isabelita A. 3,892.55 2,757.50 1,135.05 1,135.05Panganiban, Don Brendo 20,000.00 20,000.00 20,000.00Pantas, Felix L. Jr. 5,492.01 22,132.75 11,927.26 15,697.50 15,697.50Panzo, Salome V. 1,087.50 362.50 725.00 725.00Paraiso, Jesus R. 65,430.95 15,607.25 49,823.70 49,823.70Paras, Renato 50,000.00 50,000.00 50,000.00Pascua, Jennifer J. 4,000.00 650.00 650.00 4,000.00 4,650.00Pascual, Danilo S. 9,<strong>17</strong>5.00 9,<strong>17</strong>5.00 9,<strong>17</strong>5.00Pataunia, Ma. Cecilia C. (1,583.50) 343.00 343.00 (1,583.50) (1,583.50)Paz, Rosalinda Z. 13,160.00 28,521.75 25,984.25 15,697.50 15,697.50Pearson, Lou Dominic 57,663.75 57,663.75 57,663.75Pelaez, Felimon P. 7,344.00 594.00 6,750.00 6,750.00Pening, Teodoro 10,655.42 70,342.05 28,<strong>17</strong>7.67 52,819.80 52,819.80Perez, Hector 2,166.66 43,851.25 40,563.91 5,454.00 5,454.00Perez, Winnie E. (50.00) 37,954.25 37,954.25 (50.00) (50.00)Pineda, Rodolfo G. (655.25) (655.25) (655.25)Pizaro, Arthur P. 4,500.00 9,023.00 5,923.00 7,600.00 7,600.00Polido, Maria Myrel M.. 7,500.00 15,855.50 22,105.50 1,250.00 1,250.00Ponsaran, Levy C. 1,500.00 5,628.75 3,478.75 3,650.00 3,650.00Presas, Heinrich G. (2,500.00) 20,000.00 20,000.00 (2,500.00) (2,500.00)Punsalan, Angelita 973.25 161.75 811.50 811.50Quijano, Arianne 10,000.00 10,000.00 10,000.00Quinto, Myrna P. 46,905.00 43,405.00 3,500.00 3,500.00Ramirfez, Marnel 20,000.00 20,000.00 20,000.00Ramos, Bernadette 39,000.00 6,850.91 44,996.96 853.95 853.95Ramos, Henry C. 9,000.00 5,000.00 5,000.00 9,000.00 9,000.00Ramos, Leonora A. 34,575.00 6,975.00 27,600.00 27,600.00Ramos, Rebben Japheth 15,000.00 15,000.00 15,000.00Ramos, Teodorica L. 44,000.00 37,500.00 6,500.00 6,500.00Rana, Aurelio Y. 120,422.10 46,387.75 74,034.35 74,034.35Rapirap, Raquel T. 59,136.67 54,187.00 91,141.59 22,182.08 22,182.08Rayos, Nancy 20,000.00 20,000.00 20,000.00Reambonanza, Maria Teresita 20,000.00 20,000.00 20,000.00Remiendo, Nora Liza A. 2,333.34 27,201.00 31,867.67 (2,333.33) (2,333.33)Restor, Nerissa A. 30,784.00 28,500.90 2,283.10 2,283.10Resuello, Heidi 200.00 200.00 200.00Retardo, Victor Cezar 25,027.00 5,027.00 20,000.00 20,000.00Reyes, Melodia S. 8,773.33 34,160.00 19,387.08 23,546.25 23,546.25Reyes, Mercedes C. <strong>17</strong>,036.60 47,104.15 38,482.40 25,658.35 25,658.35Reyes, Richard R. (212.00) 3,192.00 264.00 2,716.00 2,716.00Reyes, Richard Anthony 20,000.00 20,000.00 20,000.00Reyes, Richard Glenn C. 31,405.50 27,098.75 4,306.75 4,306.75Reyes, Rosa M. 0.25 0.25 0.25Rimano, Joy S. 2,490.00 5,550.00 7,673.33 366.67 366.67Rito, Estrellita S. 15,253.<strong>17</strong> 10,253.<strong>17</strong> 5,000.00 5,000.00Rosal, Josefina T. 43,940.00 28,940.00 15,000.00 15,000.00Rosario, Enrico 450.00 150.00 300.00 300.00Rosario, Ma. Theresa O. 4,155.50 2,3<strong>17</strong>.75 1,837.75 1,837.75Rosario, Warly Evelyn 10,288.96 26,954.15 25,537.46 11,705.65 11,705.65Ending
Name and Designation of DebtorBeginningBalanceAdditionsDeductionsAmountAmountDeducted Written-OffCurrent Non-CurrentRubillos, Leonardo I. 10,000.00 11,000.00 (1,000.00) (1,000.00)Rufo, Rowena O. 1,997.26 1,220.26 777.00 777.00Ruzol, Hipolito 850.00 850.00 850.00Sabas, Angel Francisco 612.80 4,521.51 2,070.80 3,063.51 3,063.51Sabaupan, Sylvette G. 47,089.51 40,380.41 6,709.10 6,709.10Salagubang, Reulay Kay B. 10,000.00 10,000.00 10,000.00Salloman, Philip M. 28,594.10 11,479.85 <strong>17</strong>,114.25 <strong>17</strong>,114.25Salvador, Paulino 50.00 50.00 50.00Samarita, Mercy Cristy B. 8,150.81 7,744.31 406.50 406.50Samson, Leylani H. 34,450.00 9,450.00 25,000.00 25,000.00Santaren, Emma C. 31,028.30 30,160.40 867.90 867.90Santos, Carmelita 852.00 342.00 510.00 510.00Santos, Leonida 13,160.00 27,081.50 16,695.25 23,546.25 23,546.25Santos, Marilou D. 1,100.00 366.67 733.33 733.33Saplala, Mariano F. 4,386.67 13,200.50 9,738.42 7,848.75 7,848.75Sarabia, Juliet C. 22,167.41 77,855.75 79,476.19 20,546.97 20,546.97Sasis, Florentino I. 53,609.80 5,000.00 48,609.80 48,609.80Sayat, Ruby DG. 5,000.00 2,500.00 2,500.00 2,500.00Simbol, Elvira C. 15,458.25 5,000.00 10,458.25 10,458.25Simo, Rickson Jay P. 200.00 200.00 200.00Siongco, Josephine C. 9,613.95 6,567.00 3,046.95 3,046.95Sioson, Yolanda J. 32,530.02 31,467.02 1,063.00 1,063.00Sison, Erlinda G. 10,136.85 100.00 10,036.85 10,036.85Sison, Roger Amadeo (290.00) 200.00 200.00 (290.00) (290.00)Sison, Waltedrudes M. 1,862.40 1,862.40 1,862.40Solano, Maria S. 5,600.00 5,700.00 (100.00) (100.00)Soliman, Norma P. 14,475.75 11,453.00 3,022.75 3,022.75Solivio, Rosalie E. 35,099.95 35,008.75 91.20 91.20Soriano, Carol Bongar 1,246.00 1,246.00 1,246.00Soriano, Myla Grace 200.00 200.00 200.00Sta.Cruz, Cinderella A. (4,200.00) 5,821.00 5,821.00 (4,200.00) (4,200.00)Sta.Maria, Hipolito M. 12,600.00 41,700.00 53,600.00 700.00 700.00Suba, Sally Chua 52,666.65 75,532.00 97,748.65 30,450.00 30,450.00Tagle, Susan H. 30,200.02 32,366.00 40,366.00 22,200.02 22,200.02Tajonera, Joan Patrick 12,088.85 12,088.85 12,088.85Talampas, Ma. Cristina J. 27,818.20 65,009.00 80,327.20 12,500.00 12,500.00Tamondong, Ivy 200.00 200.00 200.00Tampol, Eduardo 220.00 220.00 220.00Tan, Paulino 50,000.00 50,000.00 50,000.00Tanafranca, Enrico V. 983.00 833.00 150.00 150.00Tapalgo, Elyn M. 590.00 10,928.00 10,899.33 618.67 618.67Tapit, Neila E. 6,080.00 53,259.00 25,711.25 33,627.75 33,627.75Tayag, Evelyn R. 28,697.71 28,697.67 0.04 0.04Tecson, Wilfrido 50,000.00 50,000.00 50,000.00Temporosa, Bernard T. (4,212.00) 55,057.75 34,050.00 16,795.75 16,795.75Tiotangco, Angelina N. 54,871.25 23,071.25 31,800.00 31,800.00Tirazona, Renato L. 12,012.08 41,156.25 44,296.00 8,872.33 8,872.33Tizon, Dolores J. 2,193.34 9,290.00 3,634.59 7,848.75 7,848.75Togado, Illumar 2,000.00 8,000.00 8,666.65 1,333.35 1,333.35Tolentino, Rosula R. 12,151.35 11,112.95 1,038.40 1,038.40Topenio, Jimmy P. 11,978.75 5,306.00 6,672.75 6,672.75Torres, Maruja 414.00 414.00 414.00Torres, Teem 2,344.40 4.00 2,340.40 2,340.40Umpad, Mara 48,000.00 152,000.00 <strong>17</strong>6,000.00 24,000.00 24,000.00Urquico, Ma. Luisa 666.00 666.00 666.00Usita, Laarni P. 73,740.90 54,254.43 19,486.47 19,486.47Valderrama, Ruth D. 1,410.87 24,0<strong>17</strong>.10 16,349.53 9,078.44 9,078.44Valencia, Eufracia 670.25 670.25 670.25Valencia, Jean Pauline S. 53,795.25 44,795.26 8,999.99 8,999.99Valencia, Joy G. 3,490.95 522.00 2,968.95 2,968.95Valenzuela, Rowena B. 40,851.25 39,000.00 1,851.25 1,851.25Ending
Name and Designation of DebtorBeginningBalanceAdditionsDeductionsAmountAmountDeducted Written-OffCurrent Non-CurrentVanguardia, Cesar G. 11,775.00 1,775.00 10,000.00 10,000.00Velasco, Maria Luisa R. 200.00 200.00 200.00Velasquez, Damian D. (4,100.00) <strong>17</strong>,283.00 <strong>17</strong>,283.00 (4,100.00) (4,100.00)Velasquez, Ma. Charisma B. 1,000.00 5,002.25 5,002.25 1,000.00 1,000.00Velasquez, Willyn V. 4,000.00 5,600.00 10,600.00 (1,000.00) (1,000.00)Vera, Alpher 10,000.00 27,284.00 33,423.74 3,860.26 3,860.26Vera, Liorinda D. 779.94 779.94 779.94Vera, Michael R. 5,000.00 239.50 239.50 5,000.00 5,000.00Vergara, Febes 200.00 200.00 200.00Vibas, Danilo T. 11,424.26 11,424.26 11,424.26Vicera, Reynante P. (1,300.00) (1,300.00) (1,300.00)Victoria, Michael S. 8,773.33 23,274.50 16,350.33 15,697.50 15,697.50Victoria, Wendelliza M. 6,402.80 28,914.15 32,498.75 2,818.20 2,818.20Villanueva, Ma. Concepcion (497.30) 13,718.36 6,896.50 6,324.56 6,324.56Villanueva, Ruth 650.00 650.00 650.00Villapando, Marimel A. (50.00) 9,846.00 6,780.66 3,015.34 3,015.34Villar, Gerald L. 41,570.25 33,519.00 8,051.25 8,051.25Villaroya, Robinson L. (4,000.00) (4,000.00) (4,000.00)Villegas, Mary Claire L. 14,500.00 13,291.63 1,208.37 1,208.37Vinluan, Lourdes R. 1,953.34 89,736.04 50,041.38 41,648.00 41,648.00Vinluan, Renato A. 4,875.00 14,881.25 14,881.25 4,875.00 19,756.25Vitug, Eliza J. 9,411.60 7,459.00 1,952.60 1,952.60Wee, Mariano B. 8,349.70 2,367.25 5,982.45 5,982.45Yang, Gloria G,. 5,354.00 354.00 5,000.00 5,000.00Yap, Donato C. 200.00 200.00 200.00Yatco, Maria Carmen 19,791.69 50,400.00 65,825.04 4,366.65 4,366.65Zaldivar, Felicia P. 4,122.34 135,562.30 71,967.84 67,716.80 67,716.80Zaldivar, Ramil P. 2,060.65 2,060.65 2,060.65Zamudio, Rowena B. 1,700.00 1,800.01 (100.01) (100.01)Zape, Vida Edna C. 19,4<strong>17</strong>.70 74,654.05 98,012.94 (3,941.19) (3,941.19)P 5,624,436.87 11,708,489.55 11,856,639.52 P 5,391,386.12 84,900.78 5,476,286.90EndingAlvarez, Alfredo 2,000.00 2,000.00 2,000.00Ampatin, Estrella V. 27,220.00 8,400.00 8,310.00 27,310.00 27,310.00Cabasada, Albert R. 8,114.36 8,114.36 8,114.36Capili, Regina R. 3,640.00 1,820.00 1,820.00 1,820.00Destura, Blanca 1,800.00 900.00 900.00 900.00Domingo, Leovildo V. 69,600.00 102,876.15 (33,276.15) (33,276.15)Fernando, Gerry V. 27,000.00 24,498.63 2,501.37 2,501.37Frades, Francisca B. 150,640.00 43,250.44 107,389.56 107,389.56Inciong, Cherry Wyne 55,948.81 56,228.81 (280.00) (280.00)Leon, Jocelyn E. 166,566.97 159,286.97 7,280.00 7,280.00Lopez, Martin Z. <strong>17</strong>5,1<strong>17</strong>.00 203,857.89 (28,740.89) (28,740.89)Mendoza, Malaya 7,650.00 7,962.00 7,962.00 7,650.00 7,650.00Molina, Mark Oliver P. (138,534.51) 575,<strong>17</strong>5.40 360,597.52 76,043.37 76,043.37Quines, Dante P. 300.00 300.00 300.00Rapirap, Raquel T. (2,972.00) 325,461.95 296,661.95 25,828.00 25,828.00Rosal, Josefina T. 1,000.00 1,000.00 1,000.00Rosales, Amormia Rhodora J. <strong>17</strong>,600.00 21,800.00 (4,200.00) (4,200.00)Tolentino, Rosula R. 105,191.89 67,581.89 37,610.00 37,610.00P (95,222.15) 1,690,104.02 1,355,632.25 P 220,185.26 19,064.36 239,249.62TOTAL - 1131012 P 5,529,214.72 13,398,593.57 13,212,271.77 P 5,611,571.38 103,965.14 5,715,536.52
- 18 -Item 7:Financial StatementsThe Financial Statements including the applicable schedules listed in theaccompanying index to financial statements and supplementary schedulesare filed as part of this form I7 - A.
THE FAR EASTERN UNIVERSITY, INCORPORATEDSTATEMENTS OF FINANCIAL POSITIONMARCH 31, 2010 AND 2009(With Comparative Figures for 2008)(Amounts in <strong>Philippine</strong> Pesos)2008Notes 2010 2009 (As Restated)A S S E T SCURRENT ASSETSCash and cash equivalents 4 P 427,163,215 P 1,121,771,210 P 1,148,501,776Receivables - net 5 699,920,334 133,310,657 111,845,027Available-for-sale investments 6 1,202,638,312 1,073,109,957 840,687,402Held-to-maturity investments 20,000,000 20,000,000 -Other current assets 4, 5 134,823,634 95,692,468 127,690,496Total Current Assets 2,484,545,495 2,443,884,292 2,228,724,701NON-CURRENT ASSETSDue from a related party <strong>17</strong> 218,774,500 100,000,000 100,000,000Held-to-maturity investments - - 32,071,040Investments in subsidiaries and an associate 7 102,563,489 96,313,489 88,941,889Investment property - net 8 184,474,137 194,855,462 202,399,663Property and equipment - net 9 697,501,156 601,011,101 491,142,241Deferred tax assets - net 16 7,089,946 5,701,855 8,590,596Other non-current assets 2,765,207 5,598,807 5,463,973Total Non-current Assets 1,213,168,435 1,003,480,714 928,609,402TOTAL ASSETS P 3,697,713,930 P 3,447,365,006 P 3,157,334,103LIABILITIES AND EQUITYCURRENT LIABILITIESAccounts payable and other liabilities 10 P 410,324,304 P 380,536,852 P 430,264,990Trust funds 11 43,970,750 58,490,642 76,162,222Unearned tuition fees 12 - 75,499,149 16,854,919Income tax payable 45,878,467 43,616,798 48,792,628Total Current Liabilities 500,<strong>17</strong>3,521 558,143,441 572,074,759EQUITYCapital stock 18 984,577,900 984,577,900 704,369,900Treasury stock 18 ( 3,733,100 ) ( 3,733,100 ) ( 3,733,100 )Accumulated fair value gains (losses) 6 7,857,562 ( 9,533,437 )1,233,243Retained earnings 18Appropriated 1,675,099,0<strong>17</strong> 975,099,0<strong>17</strong> 1,147,161,414Unappropriated 533,739,030 942,811,185 736,227,887Total Equity 3,197,540,409 2,889,221,565 2,585,259,344TOTAL LIABILITIES AND EQUITY P 3,697,713,930 P 3,447,365,006 P 3,157,334,103See Notes to Financial Statements.
THE FAR EASTERN UNIVERSITY, INCORPORATEDSTATEMENTS OF COMPREHENSIVE INCOMEFOR THE YEARS ENDED MARCH 31, 2010 AND 2009(With Comparative Figures for 2008)(Amounts in <strong>Philippine</strong> Pesos)2008Notes 2010 2009 (As Restated)EDUCATIONAL INCOME 12Tuition fees - net P 1,665,790,366 P 1,611,808,467 P 1,580,683,033Other school fees 35,257,665 50,280,810 33,146,5101,701,048,031 1,662,089,277 1,613,829,543OPERATING EXPENSES 13 1,210,578,122 1,182,310,970 1,094,192,396OPERATING PROFIT 490,469,909 479,778,307 519,637,147OTHER INCOME (CHARGES)Finance income 14 113,408,092 120,713,165 106,423,249Rental 8 39,<strong>17</strong>9,482 22,927,970 25,494,398Management fees 5 14,080,414 11,527,024 20,145,930Finance costs ( 3,482,984 )- ( 4,747,863 )Others 8,232,332 7,227,083 1,738,889<strong>17</strong>1,4<strong>17</strong>,336 162,395,242 149,054,603PROFIT BEFORE TAX 661,887,245 642,<strong>17</strong>3,549 668,691,750TAX EXPENSE 16 76,705,960 75,<strong>17</strong>5,688 75,785,747NET PROFIT 585,181,285 566,997,861 592,906,003OTHER COMPREHENSIVEINCOMEFair value gains (losses) 6 <strong>17</strong>,390,999 ( 8,016,081 )1,286,340Reclassification to profit or loss - ( 2,750,599 ) ( 5,514,166 )<strong>17</strong>,390,999 ( 10,766,680 ) ( 4,227,826 )TOTAL COMPREHENSIVEINCOME P 602,572,284 P 556,231,181 P 588,678,<strong>17</strong>7Earnings Per ShareBasic and Diluted 19 P 59.66 P 67.44 P 84.62See Notes to Financial Statements.
THE FAR EASTERN UNIVERSITY, INCORPORATEDSTATEMENTS OF CHANGES IN EQUITYFOR THE YEARS ENDED MARCH 31, 2010 AND 2009(With Comparative Figures for 2008)(Amounts in <strong>Philippine</strong> Pesos)AccumulatedFair ValueRetained EarningsNotes Capital <strong>Stock</strong> Treasury <strong>Stock</strong> Gains (Losses) Appropriated Unappropriated Total EquityBalance at April 1, 2009 P 984,577,900 ( P 3,733,100 ) ( P 9,533,437 ) P 975,099,0<strong>17</strong> P 942,811,185 P 2,889,221,565Comprehensive incomeNet profit for the year - - - - 585,181,285 585,181,285Fair value gains for the year 6 - - <strong>17</strong>,390,999 - - <strong>17</strong>,390,999Total comprehensive income - - <strong>17</strong>,390,999 - 585,181,285 602,572,284Transactions with ownersAppropriations for the year 18 - - - 1,000,000,000 ( 1,000,000,000 ) -Reversal of appropriationsduring the year 18 - - - ( 300,000,000 ) 300,000,000 -Cash dividends 18 - - - - ( 294,253,440 ) ( 294,253,440 )- - - 700,000,000 ( 994,253,440 ) ( 294,253,440 )Balance at March 31, 2010 P 984,577,900 ( P 3,733,100 ) P 7,857,562 P 1,675,099,0<strong>17</strong> P 533,739,030 P 3,197,540,409Balance at April 1, 2008 P 704,369,900 ( P 3,733,100 ) P 1,233,243 P 1,147,161,414 P 736,227,887 P 2,585,259,344Comprehensive incomeNet profit for the year - - - - 566,997,861 566,997,861Fair value losses for the year 6 - - ( 8,016,081 ) - - ( 8,016,081 )Reclassification to profit or lossfor the year - - ( 2,750,599 ) - - ( 2,750,599 )Total comprehensive income - - ( 10,766,680 ) - 566,997,861 556,231,181Transactions with ownersIssuance during the year 280,208,000 - - - - 280,208,000Reversal of appropriationsduring the year 18 - - - ( <strong>17</strong>2,062,397 ) <strong>17</strong>2,062,397 -Cash dividends 18 - - - - ( 252,268,960 ) ( 252,268,960 )<strong>Stock</strong> dividends 18 - - - - ( 280,208,000 ) ( 280,208,000 )280,208,000 - - ( <strong>17</strong>2,062,397 ) ( 360,414,563 ) ( 252,268,960 )Balance at March 31, 2009 P 984,577,900 ( P 3,733,100 ) ( P 9,533,437 ) P 975,099,0<strong>17</strong> P 942,811,185 P 2,889,221,565Balance at April 1, 2007As previously reported P 704,369,900 ( P 3,733,100 ) P 5,461,069 P 697,161,414 P 938,901,911 P 2,342,161,194Prior period adjustments - - - - ( 30,293,467 ) ( 30,293,467 )As restated 704,369,900 ( 3,733,100 ) 5,461,069 697,161,414 908,608,444 2,311,867,727Comprehensive incomeNet profit for the year - - - - 592,906,003 592,906,003Fair value gains for the year 6 - - 1,286,340 - - 1,286,340Reclassification to profit or lossfor the year - - ( 5,514,166 ) - - ( 5,514,166 )Total comprehensive income - - ( 4,227,826 ) - 592,906,003 588,678,<strong>17</strong>7Transactions with ownersAppropriations for the year 18 - - - 450,000,000 ( 450,000,000 ) -Cash dividends 18 - - - - ( 315,286,560 ) ( 315,286,560 )- - - 450,000,000 ( 765,286,560 ) ( 315,286,560 )Balance at March 31, 2008 P 704,369,900 ( P 3,733,100 ) P 1,233,243 P 1,147,161,414 P 736,227,887 P 2,585,259,344See Notes to Financial Statements.
THE FAR EASTERN UNIVERSITY, INCORPORATEDSTATEMENTS OF CASH FLOWSFOR THE YEARS ENDED MARCH 31, 2010 AND 2009(With Comparative Figures for 2008)(Amounts in <strong>Philippine</strong> Pesos)2008Notes 2010 2009 (As Restated)CASH FLOWS FROM OPERATING ACTIVITIESProfit before tax P 661,887,245 P 642,<strong>17</strong>3,549 P 668,691,750Adjustments for:Interest income 14 ( 113,408,092 ) ( 1<strong>17</strong>,675,433 ) ( 106,423,249 )Depreciation and amortization 13 51,192,377 46,524,455 42,254,725Unrealized foreign exchange losses (gains) 3,482,984 ( 3,037,732 )4,747,863Gain on disposal of property and equipment - ( 726,424 )-Loss on sale of investment - - 2,842,069Operating profit before working capital changes 603,154,514 567,258,415 612,113,158Increase in receivables ( 86,959,370 ) ( 13,575,721 ) ( 2,630,642 )Decrease (increase) in other assets ( 40,253,212 )27,907,548 ( 99,068,120 )Increase in accounts payable and other liabilities 101,013,918 7,878,567 56,906,567Increase (decrease) in unearned tuition fees ( 75,499,149 )58,644,230 16,854,919Decrease in trust funds ( 14,519,892 ) ( <strong>17</strong>,671,580 ) ( 25,109,062 )Cash generated from operations 486,936,809 630,441,459 559,066,820Income taxes paid ( 71,876,736 ) ( 73,507,131 ) ( 69,936,888 )Net Cash From Operating Activities 415,060,073 556,934,328 489,129,932CASH FLOWS FROM INVESTING ACTIVITIESIncrease in loans receivable 5 ( 477,000,000 )- -Acquisitions of property and equipmentand investment property 8, 9 ( 137,301,107 ) ( 148,849,114 ) ( 48,003,906 )Increase in due from a related party <strong>17</strong> ( 118,774,500 )- ( 35,000,000 )Increase in available-for-sale investments 6 ( 112,137,356 ) ( 240,347,166 ) ( 22,914,741 )Interest received 110,757,785 105,270,892 90,267,525Investment made to joint venture under registration 7 ( 6,250,000 )-Decrease in held-to-maturity investments - 13,743,603 257,510Additional investment in subsidiaries 7 - ( 7,371,600 )-Proceeds from disposal of property and equipment - 726,424 -Net Cash Used in Investing Activities ( 740,705,<strong>17</strong>8 ) ( 276,826,961 ) ( 15,393,612 )CASH FLOWS FROM FINANCING ACTIVITYDividends paid 18 ( 365,479,906 ) ( 309,875,665 ) ( 194,554,457 )Effect of <strong>Exchange</strong> Rate Changeson Cash and Cash Equivalents ( 3,482,984 )3,037,732 ( 6,607,781 )NET DECREASE IN CASHAND CASH EQUIVALENTS ( 694,607,995 ) ( 26,730,566 ) 272,574,082CASH AND CASH EQUIVALENTSAT BEGINNING OF YEAR 1,121,771,210 1,148,501,776 875,927,694CASH AND CASH EQUIVALENTSAT END OF YEAR P 427,163,215 P 1,121,771,210 P 1,148,501,776Supplemental Information on Noncash Financing Activities:1) The <strong>University</strong> declared and issued stock dividends amounting to P280.2 million in 2009 (see Note 18).2) In 2010, 2009 and 2008, the <strong>University</strong> declared cash dividends totaling P294.3 million, P252.3 million and P315.3 million, respectively,of which P8.5 million, P24.6 million and P119.5 million, respectively, were not paid in the year of declarations (see Notes 10 and 18).See Notes to Financial Statements.
THE FAR EASTERN UNIVERSITY, INCORPORATEDNOTES TO FINANCIAL STATEMENTSMARCH 31, 2010 AND 2009(With Comparative Figures for 2008)(Amounts in <strong>Philippine</strong> Pesos)1. CORPORATE INFORMATIONThe <strong>Far</strong> <strong>Eastern</strong> <strong>University</strong>, Incorporated (the <strong>University</strong> or FEU) is a domesticeducational institution founded in June of 1928 and incorporated on January 5, 1933.The <strong>University</strong> was registered with the Securities and <strong>Exchange</strong> Commission (<strong>SEC</strong>)on March 7, 1940. The <strong>University</strong> is a private, non-sectarian institution of learningcomprising the following different institutes that offer specific courses, namely,Institute of Arts and Sciences; Institute of Accounts, Business and Finance; Instituteof Education; Institute of Architecture and Fine Arts; Institute of Nursing; Instituteof Engineering; Institute of Law; and Institute of Graduate Studies.The <strong>University</strong> became a listed corporation in the <strong>Philippine</strong> <strong>Stock</strong> <strong>Exchange</strong> onJuly 11, 1986.In 2010, the <strong>University</strong> established the FEU Makati Campus in Makati City(see Note 5). Also in November 2009, FEU entered into a Joint Venture (JV)Agreement to establish a joint venture company (JVC) for culinary arts. Theregistration of the JVC was approved by the <strong>SEC</strong> on May 7, 2010.As of March 31, 2010, 2009 and 2008, the <strong>University</strong> holds interest in the followingsubsidiaries and associate which were all incorporated and operating in the<strong>Philippine</strong>s:Percentage of Effective OwnershipCompany Name 2010 2009 2008Subsidiaries:East Asia ComputerCenter, Inc. (EACCI) 100% 100% 100%<strong>Far</strong> <strong>Eastern</strong> College-Silang,Inc. (FECSI) 100% 100% -Fern Realty Corporation (FRC) 37.52% 37.52% 36.73%TMC – FRC Sports Performanceand Physical MedicineCenter, Inc. (SPARC) 22.51% - -Associate –Juliana Management Co.,Inc. (JMCI) 49% 49% 49%FECSI was incorporated on January 21, 2009 but has not yet started commercialoperations as of March 31, 2010. FECSI and EACCI, similar to the <strong>University</strong>, werealso established to operate as educational institutions. FRC, on the other hand,operates as a real estate company leasing most of its investment properties to the<strong>University</strong> and other related parties.
- 2 -Although the <strong>University</strong> controls less than 50% of the voting shares of stock of FRC,it has the power to govern the financial and operating policies of the said entity as the<strong>University</strong> has the power to cast the majority of votes at meetings of the board ofdirectors and elect officers of FRC. Accordingly, FRC is recognized as a subsidiary ofthe <strong>University</strong>. FRC acquired 60% equity ownership interest over SPARC which isengaged in the business of organizing, owning, operating, managing and maintaining asports facility for the rehabilitation and sports performance enhancement within the<strong>Philippine</strong>s.The registered office address and principal place of business of the <strong>University</strong> islocated at Nicanor Reyes Sr. Street, Sampaloc, Manila.The financial statements of the <strong>University</strong> for the year ended March 31, 2010(including the comparatives for the years ended March 31, 2009 and 2008) wereauthorized for issue by the Board of Trustees (BOT) on July 6, 2010.2. SUMMARY OF SIGNIFICANT ACCOUNTING POLICIESThe significant accounting policies that have been used in the preparation of thesefinancial statements are summarized below. These policies have been consistentlyapplied to all the years presented, unless otherwise stated.2.1 Basis of Preparation of Financial Statements(a)Statement of Compliance with <strong>Philippine</strong> Financial Reporting StandardsThe financial statements of the <strong>University</strong> have been prepared in accordancewith <strong>Philippine</strong> Financial Reporting Standards (PFRS). PFRS are adopted bythe Financial Reporting Standards Council (FRSC) from the pronouncementsissued by the International Accounting Standards Board.The financial statements have been prepared using the measurement basesspecified by PFRS for each type of asset, liability, income and expense. Thesefinancial statements have been prepared on the historical cost basis, except forthe revaluation of certain financial assets. The measurement bases are morefully described in the accounting policies that follow.(b)Presentation of Financial StatementsThe financial statements are presented in accordance with <strong>Philippine</strong>Accounting Standard (PAS) 1 (Revised 2007), Presentation of Financial Statements.The <strong>University</strong> presents all items of income and expenses in a single statementof comprehensive income. Two comparative periods are presented for thestatement of financial position when the <strong>University</strong> applies an accounting policyretrospectively, makes a retrospective restatement of items in its financialstatements, or reclassifies items in the financial statements.Certain accounts in 2009 and 2008 financial statements were reclassified toconform with the 2010 financial statement presentation, hence, two comparativeperiods for the statement of financial position are presented (see Note 4).
- 3 -(c)Functional CurrencyThese financial statements are presented in <strong>Philippine</strong> pesos, the <strong>University</strong>’sfunctional currency, and all values represent absolute amounts except whenotherwise indicated.Items included in the financial statements of the <strong>University</strong> are measured usingthe currency of the primary economic environment in which the entity operates(the functional currency).2.2 Adoption of New Interpretations, Revisions and Amendments to PFRS(a)Effective in fiscal year 2010 that are relevant to the <strong>University</strong>In 2010, the <strong>University</strong> adopted the following new revisions and amendments toPFRS that are relevant to the <strong>University</strong> and effective for financial statementsfor the annual period beginning on or after January 1, 2009:PAS 1 (Revised 2007) : Presentation of Financial StatementsPFRS 7 (Amendment) : Financial Instruments: DisclosuresVarious Standards : 2008 Annual Improvements to PFRSDiscussed below are the effects on the financial statements of the new andamended standards.(i) PAS 1 (Revised 2007), Presentation of Financial Statements, requires an entity topresent all items of income and expense recognized in the period in a singlestatement of comprehensive income or in two statements: a separatestatement of income and a statement of comprehensive income. Incomeand expense recognized in profit or loss is presented in the statement ofincome in the same way as the previous version of PAS 1. The statement ofcomprehensive income includes the profit or loss for the period and eachcomponent of income and expense recognized outside of profit or loss orthe “non-owner changes in equity”, which are no longer allowed to bepresented in the statements of changes in equity, classified by nature(e.g., gains or losses on available-for-sale assets or translation differencesrelated to foreign operations). A statement showing an entity’s financialposition at the beginning of the previous period is also required when theentity retrospectively applies an accounting policy or makes a retrospectiverestatement, or when it reclassifies items in its financial statements.The <strong>University</strong>’s adoption of PAS 1 (Revised 2007) did not result in anymaterial adjustments in its financial statements as the change in accountingpolicy only affects presentation aspects. Two comparative periods arepresented for the statement of financial position since the <strong>University</strong>reclassified certain items in the financial statements (see Note 4).The <strong>University</strong> has elected to present a single statement of comprehensiveincome (see Note 2.1).
- 4 -(ii) PFRS 7 (Amendment), Financial Instruments Disclosures. The amendmentrequires additional disclosures for financial instruments that are measured atfair value in the statement of financial position. These fair valuemeasurements are categorized into a three-level fair value hierarchy, whichreflects the extent to which they are based on observable market data.A separate quantitative maturity analysis must be presented for derivativefinancial liabilities that shows the remaining contractual maturities, wherethese are essential for an understanding of the timing of cash flows.The change in accounting policy only results in additional disclosures(see Note 22.2).(iii) 2008 Annual Improvements to PFRS. The FRSC has adopted theImprovements to PFRS 2008 which became effective for the annual periodsbeginning on or after January 1, 2009. Among those improvements, thefollowing are the amendments relevant to the <strong>University</strong>:• PAS 36 (Amendment), Impairment of Assets. Where fair value less cost tosell is calculated on the basis of discounted cash flows, disclosuresequivalent to those for value-in-use calculation should be made.The amendment has no significant impact on the 2010 financialstatements since in 2010 fair values of non-financial assets were notcalculated on the basis of discounted cash flows.• PAS 39 (Amendment), Financial Instruments: Recognition and Measurement.The definition of financial asset or financial liability at fair value throughprofit or loss as it related to items that are held for trading was changed.A financial asset or liability that is part of a portfolio of financialinstruments managed together with evidence of an actual recent patternof short-term profit taking is included in such a portfolio on initialrecognition. The <strong>University</strong> determined that adoption of thisamendment had no material effect on its 2010 financial statements.• PAS 40 (Amendment), Investment Property. PAS 40 is amended to includeproperty under construction or development for future use asinvestment property in its definition of investment property.This results in such property being within the scope of PAS 40;previously, it was within the scope of PAS 16. Also, if an entity’s policyis to measure investment property at fair value, but during constructionor development of an investment property the entity is unable to reliablymeasure its fair value, then the entity would be permitted to measure theinvestment property at cost until construction or development iscomplete. At such time, the entity would be able to measure theinvestment property at fair value. The adoption had no material effecton its 2010 financial statements as the <strong>University</strong> has no property underconstruction or development for future use as investment property.
- 5 -(b)Effective in fiscal year 2010 but not relevant to the <strong>University</strong>The following amendments, interpretations and improvements to publishedstandards are mandatory for accounting periods beginning on or afterJanuary 1, 2009 but are not relevant to the <strong>University</strong>’s financial statements:PFRS 1 and PAS 27(Amendments) : PFRS 1 – First Time Adoption of PFRSand PAS 27 – Consolidated andSeparate Financial StatementsPFRS 2 (Amendment) : Share-based PaymentPFRS 8 (Amendment) : Operating Segments<strong>Philippine</strong> InterpretationIFRIC 13 : Customer Loyalty ProgrammesIFRIC 16 : Hedges of a Net Investment in aForeign Operation(c) Effective subsequent to fiscal year 2010There are new PFRS, revisions, amendments, annual improvements andinterpretations to existing standards that are effective for periods subsequent to2010. Among those pronouncements, management has initially determined thefollowing, which the <strong>University</strong> will apply in accordance with their transitionalprovisions, to be relevant to its financial statements.(i) <strong>Philippine</strong> Interpretation IFRIC <strong>17</strong>, Distribution of Non-cash Assets to Owners(effective from July 1, 2009). IFRIC <strong>17</strong> clarifies that a dividend payableshould be recognized when the dividend is appropriately authorized and isno longer at the discretion of the entity. Also, an entity should measure thedividend payable at the fair value of the net assets to be distributed and thedifference between the dividend paid and the carrying amount of the netassets distributed in profit or loss. The <strong>University</strong> will apply theinterpretation prospectively starting January 1, 2010.(ii) <strong>Philippine</strong> Interpretation IFRIC 19, Extinguishing Financial Liabilities withEquity Instruments (effective from July 1, 2010). It addresses accounting byan entity when the terms of a financial liability are renegotiated and result inthe entity issuing equity instruments to a creditor to extinguish all or part ofthe financial liability. These transactions are sometimes referred to as “debtfor equity” exchanges or swaps, and have happened with increased regularityduring the financial crisis. The interpretation requires the debtor to accountfor a financial liability which is extinguished by equity instruments asfollows:• the issue of equity instruments to a creditor to extinguish all (or part of afinancial liability) is consideration paid in accordance with PAS 39,Financial Instruments: Recognition and Measurement;• the entity measures the equity instruments issued at fair value, unless thiscannot be reliably measured;
- 6 -• if the fair value of the equity instruments cannot be reliably measured,then the fair value of the financial liability extinguished is used; and,• the difference between the carrying amount of the financial liabilityextinguished and the consideration paid is recognized in profit or loss.Management has determined that the adoption of the interpretation will nothave any material effect on its financial statements as it does not normallyextinguish financial liabilities through equity swap.(iii) 2009 Annual Improvements to PFRS. The FRSC has adopted theImprovements to PFRS 2009. Most of these amendments became effective forannual periods beginning on or after July 1, 2009, or January 1, 2010.Among those improvements, only the following amendments wereidentified to be relevant to the <strong>University</strong>’s financial statements:• PAS 1 (Amendment), Presentation of Financial Statements (effective fromJanuary 1, 2010). The amendment clarifies the current and non-currentclassification of a liability that can, at the option of the counterparty, besettled by the issue of the entity’s equity instruments. The <strong>University</strong>will apply the amendment in its 2011 financial statements but does notexpect it to have a material impact on the <strong>University</strong>’s financialstatements.• PAS 7 (Amendment), Statement of Cash Flows (effective fromJanuary 1, 2010). The amendment clarifies that only an expenditure thatresults in a recognized asset can be classified as a cash flow frominvesting activities. The amendment will not have a material impact onthe financial statements since only recognized assets are classified by the<strong>University</strong> as cash flow from investing activities.• PAS <strong>17</strong> (Amendment), Leases (effective from January 1, 2010).The amendment clarifies that when a lease includes both land andbuilding elements, an entity assesses the classification of each element asfinance or an operating lease separately in accordance with the generalguidance on lease classification set out in PAS <strong>17</strong>. Management hasinitially determined that this will not have material impact on thefinancial statements of the <strong>University</strong>.• PAS 36 (Amendment), Impairment of Assets (effective fromJanuary 1, 2010). PAS 36 clarifies that the largest unit permitted for thepurpose of allocating goodwill to cash-generating units for goodwillimpairment is the operating segment level defined in PFRS 8 beforeaggregation. This amendment will not have material impact on the<strong>University</strong>’s financial statements.
- 7 -(iv) PFRS 9, Financial Instruments (effective from January 1, 2013). PFRS 9 is thefirst part of Phase 1 of the project to replace PAS 39, in its entirety by theend of 2010. The main phases are (with a separate project dealing withrecognition):o Phase 1: Classification and Measuremento Phase 2: Impairment Methodologyo Phase 3: Hedge AccountingPFRS 9 introduces major simplifications of the classification andmeasurement provisions under PAS 39. These include reduction from fourmeasurement categories into two categories, i.e. fair value and amortizedcost, and from several impairment methods into one method.Management is yet to assess the impact that this amendment is likely to haveon the financial statements of the <strong>University</strong>. However, it does not expectto implement the amendments until fiscal year 2014 when all chapters of thePAS 39 replacement have been published at which time the <strong>University</strong>expects it can comprehensively assess the impact of the revised standard.2.3 Separate Financial Statements and Investments in Subsidiaries andan AssociateThese financial statements are prepared as the <strong>University</strong>’s separate financialstatements. The <strong>University</strong> also prepares consolidated financial statements as requiredunder PFRS.The <strong>University</strong>’s investments in subsidiaries and an associate are accounted for inthese separate financial statements at cost, less any impairment loss. Impairment lossis provided when there is objective evidence that the investments in subsidiaries,an associate and advances to joint venture under registration will not be recovered.Such impairment loss is measured as the difference between the carrying amount ofthe investment and the present value of the estimated cash flows discounted at thecurrent market rate of return for similar financial asset. The amount of theimpairment loss is recognized in profit or loss in the statement of comprehensiveincome.Any goodwill arising from the acquisition of investments in subsidiaries andassociates, representing the excess of the acquisition costs over the fair value of the<strong>University</strong>’s share in the identifiable net assets of the acquired subsidiaries orassociates at the date of acquisition, is included in the amount recognized asinvestments in subsidiaries and associates.Subsidiaries are entities over which the <strong>University</strong> has the power to govern thefinancial reporting policies generally accompanying a shareholding of more than onehalf of the voting rights. The <strong>University</strong> obtains and exercises control through votingrights. The existence and effect of potential voting rights that are currentlyexercisable and convertible are considered when assessing whether the <strong>University</strong>controls another entity.Associate is an entity over which the <strong>University</strong> is able to exert significant influencebut which is neither subsidiary nor interest in a joint venture.
- 8 -As of March 31, 2010, the registration of the <strong>University</strong>’s joint venture with PHICulinary Arts and Food Services, Inc. is pending approval by the <strong>SEC</strong>. Accordingly,investment made to the joint venture is included under Investments in Subsidiariesand an Associate account as Advances to Joint Venture under Registration. Jointventure is an entity whose economic activities are controlled jointly by the venturers.2.4 Financial AssetsFinancial assets include cash and cash equivalents and other financial instruments.Financial assets, other than hedging instruments, are classified into the followingcategories: financial assets at fair value through profit or loss, loans and receivables,held-to-maturity investments and available-for-sale financial assets. Financial assetsare assigned to the different categories by management on initial recognition,depending on the purpose for which the investments were acquired. The designationof financial assets is re-evaluated at every reporting date at which date a choice ofclassification or accounting treatment is available, subject to compliance with specificprovisions of applicable accounting standards.Regular purchase and sales of financial assets are recognized on their trade date.All financial assets that are not classified as at fair value through profit or loss areinitially recognized at fair value, plus transaction costs. Financial assets carried at fairvalue through profit or loss are initially recognized at fair value and transaction costsare recognized directly in profit or loss in the statement of comprehensive income.Currently, the <strong>University</strong>’s financial instruments are categorized as follows:(a)Loans and ReceivablesLoans and receivables are non-derivative financial assets with fixed ordeterminable payments that are not quoted in an active market. They arisewhen the <strong>University</strong> provides money, goods or services directly to a debtor withno intention of trading the receivables. They are included in current assetswhen their maturity is within 12 months after the reporting period.Loans and receivables are subsequently measured at amortized cost using theeffective interest method, less any impairment loss. Any change in their value isrecognized in profit or loss. Impairment loss is provided when there isobjective evidence that the <strong>University</strong> will not be able to collect all amounts dueto it in accordance with the original terms of the receivables. The amount ofthe impairment loss is determined as the difference between the assets’ carryingamount and the present value of estimated cash flows.The <strong>University</strong>’s financial assets categorized as loans and receivables arepresented as Cash and Cash Equivalents, Receivables, Due from a Related Partyand Other Current Assets to the extent of the restricted cash and cashequivalents included therein, in the statement of financial position.Cash and cash equivalents are defined as cash on hand, demand deposits andshort-term, highly liquid investments readily convertible to known amounts ofcash and which are subject to insignificant risk of changes in value.
- 9 -(b)Held-to-maturity InvestmentsThis includes non-derivative financial assets with fixed or determinablepayments and a fixed date of maturity. Investments are classified asheld-to- maturity if the <strong>University</strong> has the positive intention and ability to holdthem until maturity which is presented as Held-to-maturity Investments in thenon-current section of the statement of financial position, except thosematuring within 12 months from the reporting period which are presented aspart of current assets. Investments intended to be held for an undefined periodare not included in this classification.Held-to-maturity investments are measured at amortized cost using the effectiveinterest method. In addition, if there is objective evidence that the investmenthas been impaired, the financial asset is measured at the present value ofestimated cash flows. Changes to the carrying amount of the investment arerecognized in profit or loss.(c)Available-for-sale Financial AssetsThis include non-derivative financial assets that are either designated to thiscategory or do not qualify for inclusion in any of the other categories offinancial assets. These are presented as Available-for-sale Investments in thenon-current section of the statement of financial position unless managementintends to dispose of the investment within 12 months from the reportingperiod.All financial assets within this category are subsequently measured at fair value,unless otherwise disclosed, with changes in value recognized in othercomprehensive income, net of any effects arising from income taxes. When theasset is disposed of or is determined to be impaired the cumulative gain or lossrecognized in other comprehensive income is reclassified from revaluationreserve to profit or loss and presented as a reclassification adjustment withinother comprehensive income.Reversal of impairment loss is recognized in other comprehensive income,except for financial assets that are debt securities which are recognized in profitor loss only if the reversal can be objectively related to an event occurring afterthe impairment loss was recognized.Impairment losses, except those pertaining to tuition and other fees receivables whichare presented under Operating Expenses, recognized on financial assets are presentedas part of Finance Costs in the statement of comprehensive income.For investments that are actively traded in organized financial markets, fair value isdetermined by reference to stock exchange-quoted market bid prices at the close ofbusiness on the reporting period. For investments where there is no quoted marketprice, fair value is determined by reference to the current market value of anotherinstrument which is substantially the same or is calculated based on the expected cashflows (such as dividend income) of the underlying net asset base of the investment.
- 10 -Non-compounding interest, dividend income and other cash flows resulting fromholding financial assets are recognized in profit or loss when earned, regardless ofhow the related carrying amount of financial assets is measured. All income andexpense relating to financial assets recognized in profit or loss are presented in thestatement of comprehensive income line item Finance Income and Finance Costs,respectively.Derecognition of financial assets occurs when the rights to receive cash flows fromthe financial instruments expire or are transferred and substantially all of the risks andrewards of ownership have been transferred.2.5 Property and EquipmentExcept for land, which is stated at cost less any impairment in value, property andequipment are stated at cost less accumulated depreciation and amortization, andimpairment in value, if any.The cost of an asset comprises its purchase price and directly attributable costs ofbringing the asset to working condition for its intended use. Expenditures foradditions, major improvements and renewals are capitalized; expenditures for repairsand maintenance are charged to expense as incurred. When assets are sold, retired orotherwise disposed of, their cost and related accumulated depreciation, amortizationand impairment losses are removed from the accounts and any resulting gain or loss isreflected in income for the period.Depreciation and amortization are computed on the straight-line basis over theestimated useful lives of the assets as follows:Building and improvementsLeasehold improvementsFurniture and equipmentMiscellaneous equipment20 years20 years3-6 years5 yearsLeasehold improvements are amortized over 20 years regardless of the term of leasecontract which is usually shorter than the expected useful life of the improvementsbecause it is highly probable that the lease contract with FRC will be renewed beforethe end of such contract.An asset’s carrying amount is written down immediately to its recoverableamount if the asset’s carrying amount is greater than its estimated recoverable amount(see Note 2.12).The residual values and estimated useful lives of property and equipment arereviewed, and adjusted if appropriate, at the end of each reporting period.An item of property and equipment is derecognized upon disposal or when no futureeconomic benefits are expected to arise from the continued use of the asset. Any gainor loss arising on derecognition of the asset (calculated as the difference between thenet disposal proceeds and the carrying amount of the item) is included in profit orloss in the year the item is derecognized.
- 11 -2.6 Investment PropertyInvestment property is measured initially at acquisition cost. Subsequently,investment property, except land which is carried at cost less impairment in value,if any, is carried at cost less accumulated depreciation and impairment in value.Depreciation of investment property, which consists of building and improvements,are computed using the straight-line method over its estimated useful life of 20 years.Investment property is derecognized upon disposal or when permanently withdrawnfrom use and no future economic benefit is expected from its disposal. Any gain orloss on the retirement or disposal of an investment property is recognized in profit orloss in the year of retirement or disposal.Transfers are made to investment property when, and only when, there is a change inuse, evidenced by the end of owner-occupation, commencement of an operating leaseto another party or by the end of construction or development. Transfers are madefrom investment property when, and only when, there is a change in use, evidencedby commencement of the owner-occupation of commencement of development witha view to sell.2.7 Financial LiabilitiesFinancial liabilities of the <strong>University</strong> include accounts payable and other liabilities,which are measured at amortized cost using the effective interest rate method.Financial liabilities are recognized when the <strong>University</strong> becomes a party to thecontractual agreements of the instrument. All interest related charges are recognizedas an expense in profit or loss under the caption Finance Costs in the statement ofcomprehensive income.The liabilities are initially recognized at their fair value and subsequently measured atamortized cost.Financial liabilities are derecognized from the statement of financial position onlywhen the obligations are extinguished either through discharge, cancellation orexpiration.2.8 ProvisionsProvisions are recognized when present obligations will probably lead to an outflowof economic resources and they can be estimated reliably even if the timing or amountof the outflow may still be uncertain. A present obligation arises from the presence ofa legal or constructive commitment that has resulted from past events.Provisions are measured at the estimated expenditure required to settle the presentobligation, based on the most reliable evidence available at the end of the reportingperiod, including the risks and uncertainties associated with the present obligation.Where there are a number of similar obligations, the likelihood that an outflow will berequired in settlement is determined by considering the class of obligations as a whole.When time value of money is material, long term-provisions are discounted to theirpresent values using a pretax rate that reflects market assessments and the risksspecific to the obligation. Provisions are reviewed at the end of each reporting periodand adjusted to reflect the current best estimate.
- 12 -In those cases where the possible outflow of economic resource as a result of presentobligations is considered improbable or remote, or the amount to be provided forcannot be measured reliably, no liability is recognized in the financial statements.Similarly, possible inflows of economic benefits to the <strong>University</strong> that do not yet meetthe recognition criteria of an asset are considered contingent assets, hence, are notrecognized in the financial statements. On the other hand, any reimbursement thatthe <strong>University</strong> can be virtually certain to collect from a third party with respect to theobligation is recognized as a separate asset not exceeding the amount of the relatedprovision.2.9 Revenue and Expense RecognitionRevenue is recognized to the extent that the revenue can be reliably measured, it isprobable that the economic benefits will flow to the <strong>University</strong>, and the costs incurredor to be incurred can be measured reliably. In addition, the following specificrecognition criteria must also be met before revenue is recognized:(a) Tuition and Other School Fees – Revenue is recognized in profit or loss over thecorresponding school term. Tuition fee received in advance and applicable to aschool term after the reporting period is not recognized in profit or loss until thenext reporting period (see also Note 12).(b) Management Fees – Revenue is recognized on a monthly basis upon rendering ofthe services.(c)Interest – Income is recognized as the interest accrues taking into account theeffective yield on the asset.(d) Rental – Revenue is recognized over the lease term using the straight-line method.Revenue is measured by reference to the fair value of consideration received orreceivable by the <strong>University</strong> for services rendered, excluding value-added tax (VAT)and discounts.Cost and expenses are recognized in profit or loss upon utilization of goods orservices or at the date such cost and expenses are incurred.2.10 LeasesThe <strong>University</strong> accounts for its leases as follows:(a)<strong>University</strong> as LesseeLeases which do not transfer to the <strong>University</strong> substantially all the risks andbenefits of ownership of the asset are classified as operating leases. Operatinglease payments are recognized as expense in profit or loss in the statement ofcomprehensive income on a straight-line basis over the lease term. Associatedcosts, such as maintenance and insurance, are expensed as incurred.
- 13 -(b)<strong>University</strong> as LessorLeases which do not transfer to the lessee substantially all the risks and benefitsof ownership of the asset are classified as operating leases. Lease income fromoperating leases is recognized in profit or loss in the statement ofcomprehensive income on a straight-line basis over the lease term.The <strong>University</strong> determines whether an arrangement is, or contains a lease based onthe substance of the arrangement. It makes an assessment of whether the fulfillmentof the arrangement is dependent on the use of a specific asset or assets and thearrangement conveys a right to use the asset.2.11 Foreign Currency TransactionsThe accounting records of the <strong>University</strong> are maintained in <strong>Philippine</strong> pesos. Foreigncurrency transactions during the year are translated into the functional currency atexchange rates which approximate those prevailing on transaction dates.Foreign currency gains and losses resulting from the settlement of such transactionsand from the translation at year-end exchange rates of monetary assets and liabilitiesdenominated in foreign currencies are recognized in the statement of comprehensiveincome as part of income or loss from operations.2.12 Impairment of Non-financial AssetsThe <strong>University</strong>’s investments in subsidiaries and an associate, property andequipment, investment property and certain other non-current assets are subject toimpairment testing. All other individual assets or cash-generating units are tested forimpairment whenever events or changes in circumstances indicate that the carryingamount may not be recoverable.For purposes of assessing impairment, assets are grouped at the lowest levels forwhich there are separately identifiable cash flows (cash-generating units). As a result,some assets are tested individually for impairment and some are tested atcash-generating unit level.An impairment loss is recognized for the amount by which the asset orcash-generating unit’s carrying amount exceeds its recoverable amount. Therecoverable amount is the higher of fair value, reflecting market conditions less coststo sell, and value in use, based on an internal evaluation of discounted cash flow.Impairment loss is charged pro-rata to the other assets in the cash-generating unit.All assets are subsequently reassessed for indications that an impairment losspreviously recognized may no longer exist and the carrying amount of the asset isadjusted to the recoverable amount resulting in the reversal of the impairment loss.
- 14 -2.13 Employee Benefits(a)Post-employment BenefitsPost-employment benefits are provided to employees through a defined contributionplan.A defined contribution plan is a pension plan under which the <strong>University</strong> pays fixedcontributions into an independent entity. The <strong>University</strong> has no legal or constructiveobligations to pay further contributions after payment of the fixed contribution. Thecontributions recognized in respect of defined contribution plans are expensed as theyfall due. Liabilities and assets may be recognized if underpayment or prepayment hasoccurred and are included in current liabilities or current assets as they are normally ofa short term nature.(b)Termination BenefitsTermination benefits are payable when employment is terminated by the <strong>University</strong>before the normal retirement date, or whenever an employee accepts voluntaryredundancy in exchange for these benefits. The <strong>University</strong> recognizes terminationbenefits when it is demonstrably committed to either: (a) terminating the employmentof current employees according to a detailed formal plan without possibility ofwithdrawal; or (b) providing termination benefits as a result of an offer made toencourage voluntary redundancy. Benefits falling due more than 12 months after thereporting period are discounted to present value.(c)Compensated AbsencesCompensated absences are recognized for the number of paid leave days(including holiday entitlement) remaining at the end of the reporting period. They areincluded in Accounts Payable and Other Liabilities account at the undiscountedamount that the <strong>University</strong> expects to pay as a result of the unused entitlement.2.14 Trust FundsThis represents restricted funds of the <strong>University</strong> that are intended for studentwelfare, development, loan, assistance and scholarship fund, and for other specificeducational purposes. The <strong>University</strong> administers the use of these funds based on thespecific purpose such funds are identified with.2.15 Income TaxesTax expense recognized in profit or loss comprises the sum of deferred tax andcurrent tax not recognized in other comprehensive income or directly in equity, if any.Current tax assets or liabilities comprise those claims from, or obligations to, fiscalauthorities relating to the current or prior reporting period, that are uncollected orunpaid at end of the reporting period. They are calculated according to the tax ratesand tax laws applicable to the fiscal periods to which they relate, based on the taxableprofit for the year. All changes to current tax assets or liabilities are recognized as acomponent of tax expense in profit or loss.
- 15 -Deferred tax is provided, using the liability method on temporary differences at theend of the reporting period between the tax base of assets and liabilities and theircarrying amounts for financial reporting purposes. Under the liability method, withcertain exceptions, deferred tax liabilities are recognized for all taxable temporarydifferences and deferred tax assets are recognized for all deductible temporarydifferences and the carryforward of unused tax losses and unused tax credits to theextent that it is probable that taxable profit will be available against which the deferredincome tax asset can be utilized.The carrying amount of deferred tax assets is reviewed at the end of the reportingperiod and reduced to the extent that it is probable that sufficient taxable profit willbe available to allow all or part of the deferred tax asset to be utilized.Deferred tax assets and liabilities are measured at the tax rates that are expected toapply to the period when the asset is realized or the liability is settled, provided suchtax rates have been enacted or substantively enacted at the end of the reportingperiod.Most changes in deferred tax assets or liabilities are recognized as a component of taxexpense in profit or loss. Only changes in deferred tax assets or liabilities that relateto items recognized in other comprehensive income or directly in equity arerecognized in other comprehensive income or directly in equity.2.16 Related PartiesParties are considered to be related if one party has the ability, directly or indirectly, tocontrol the other party or exercise significant influence over the other party in makingfinancial and operating decisions. Parties are also considered to be related if they aresubject to common control or common significant influence. Related parties may beindividuals or corporate entities. Transactions between related parties are based onterms similar to those offered to non-related parties.2.<strong>17</strong> EquityCapital stock represents the nominal value of shares that have been issued.Treasury shares are stated at the cost of re-acquiring such shares.Accumulated fair value gains (losses) comprise gains and losses arising from therevaluation of available-for-sale financial assets.Retained earnings include all current and prior period results of operations asdisclosed in profit or loss in the statement of comprehensive income. Theappropriated portion represents the amount which is not available for distribution.2.18 Earnings Per ShareBasic earnings per share (EPS) is determined by dividing net profit by the weightedaverage number of shares subscribed and issued during the year after givingretroactive effect to stock dividend declared, stock split and reverse stock split duringthe current year, if any.
- 16 -Diluted earnings per share is computed by adjusting the weighted average number ofordinary shares outstanding to assume conversion of dilutive potential shares. The<strong>University</strong> does not have dilutive potential shares outstanding that would requiredisclosure of diluted earnings per share in the statement of comprehensive income.3. SIGNIFICANT ACCOUNTING JUDGMENTS AND ESTIMATESThe <strong>University</strong>’s financial statements are prepared in accordance with PFRS requiremanagement to make judgments and estimates that affect amounts reported in thefinancial statements and related notes. Judgments and estimates are continuallyevaluated and are based on historical experience and other factors, includingexpectations of future events that are believed to be reasonable under circumstances.Actual results may ultimately vary from these estimates.3.1 Critical Management Judgments in Applying Accounting PoliciesIn the process of applying the <strong>University</strong>’s accounting policies, management has madethe following judgments, apart from those involving estimation, which have the mostsignificant effect on the amounts recognized in the financial statements:(a)Held-to-maturity InvestmentsIn classifying non-derivative financial assets with fixed or determinablepayments and fixed maturity, such as bonds, as held-to-maturity investments,the <strong>University</strong> evaluates its intention and ability to hold such investments up tomaturity. If the <strong>University</strong> fails to keep these investments to maturity otherthan for specific circumstances as allowed under the standards, it will berequired to reclassify the whole class to available-for-sale financial assets. Insuch a case, the investments would therefore be measured at fair value, notamortized cost.As of March 31, 2010, 2009 and 2008, there are no held-to-maturity investmentsdisposed of before their maturity.(b)Distinction Between Investment Properties and Owner-managed PropertiesThe <strong>University</strong> determines whether a property qualifies as investment property.In making its judgment, the <strong>University</strong> considers whether the property generatescash flows largely independent of the other assets held by an entity.Owner-occupied properties generate cash flows that are attributable not only tothe property but also to other assets used in the process of supplyingeducational services.Some properties comprise a portion that is held to earn rental or for capitalappreciation and another portion that is held for use in the supply of services orfor administrative purposes. If portion can be sold separately (or leased outseparately under finance lease), the <strong>University</strong> accounts for such portionseparately. If the portion cannot be sold separately, the property is accountedfor as investment property only if an insignificant portion is held for use in thesupply of services or for administrative purposes. Judgment is applied indetermining whether ancillary services are so significant that a property does notqualify as investment property. The <strong>University</strong> considers each propertyseparately in making its judgment.
- <strong>17</strong> -(c)Classification of LeasesThe <strong>University</strong> has entered into various lease agreements as either a lessor or alessee. Critical judgment was exercised by management to distinguish each leaseagreement as either an operating or finance lease by looking at the transfer orretention of significant risk and rewards of ownership of the properties coveredby the agreements. Currently, all of the <strong>University</strong>’s lease agreements aredetermined to be operating leases.Rental expense charged to operations amounted to P55.0 million in 2010,P56.2 million in 2009 and P50.5 million in 2008 (see Note 13) while rentalincome earned in 2010, 2009 and 2008 are presented as Rental Income in thestatements of comprehensive income (see Note 8).(d)Provisions and ContingenciesJudgment is exercised by management to distinguish between provisions andcontingencies. Policies on recognition and disclosure of provision anddisclosure of contingencies are discussed in Note 2.8 and relevant disclosuresare presented in Note 20.3.2 Key Sources of Estimation UncertaintyThe following are the key assumptions concerning the future, and other key sourcesof estimation uncertainty at the end of the reporting period, that have a significant riskof causing a material adjustment to the carrying amounts of assets and liabilitieswithin the next financial year:(a)Allowance for Impairment of ReceivablesThe <strong>University</strong> maintains an allowance for impairment loss on receivables at alevel considered adequate to cover probable uncollectible receivables. The levelof this allowance is evaluated by management on the basis of factors that affectthe collectibility of the accounts. These factors include, but are not limited to,history of the students’ payment behavior, age of receivables and other externalfactors affecting the education industry. The <strong>University</strong> constantly reviews theage and status of receivables, and identifies accounts that should be providedwith allowance. Analyses of the net realizable value of receivables as ofMarch 31, 2010, 2009 and 2008 are presented in Note 5.Impairment losses recognized on receivables amounted to about P22.0 millionin 2010, P<strong>17</strong>.6 million in 2009 and P<strong>17</strong>.4 million in 2008 (see Note 5).(b)Valuation of Financial Assets Other than Loans and Other ReceivablesThe <strong>University</strong> carries certain financial assets at fair value, which requires theextensive use of accounting estimates and judgment. In cases where activemarket quotes are not available, fair value is determined by reference to thecurrent market value of another instrument which is substantially the same or iscalculated based on the expected cash flows of the underlying net base of theinstrument. The amount of changes in fair value would differ if the <strong>University</strong>utilized different valuation methods and assumptions. Any change in fair valueof these financial assets would affect profit and loss and equity.
- 18 -Fair value gains and losses recognized on available-for-sale financial assets in2010, 2009 and 2008 are presented as Accumulated Fair Value Gains (Losses) inthe statements of changes in equity (see Note 6).(c)Impairment of Available-for-sale InvestmentsThe determination when an investment is other-than-temporarily impairedrequires significant judgment. In making this judgment, the <strong>University</strong>evaluates, among other factors, the duration and extent to which the fair valueof an investment is less than its cost, and the financial health of and near-termbusiness outlook for the investee, including factors such as industry and sectorperformance, changes in technology and operational and financing cash flows.No impairment loss was recognized on available-for-sale investments in 2010,2009 and 2008. Analyses of the carrying value of the available-for-saleinvestments as of March 31, 2010, 2009 and 2008 are presented in Note 6.(d)Useful Lives of Investment Property and Property and EquipmentThe <strong>University</strong> estimates the useful lives of investment property and propertyand equipment based on the period over which the assets are expected to beavailable for use. The estimated useful lives of these assets are reviewedperiodically and are updated if expectations differ from previous estimates dueto physical wear and tear, technical or commercial obsolescence and legal orother limits on the use of the assets. Analyses of the carrying amounts ofinvestment property and property and equipment are presented in Notes 8and 9, respectively. Actual results, however, may vary due to changes in factorsmentioned above. Based on management assessment as of March 31, 2010,2009 and 2008, no change in the estimated useful lives of the assets is necessary.(e)Impairment of Non-financial AssetsPFRS requires that an impairment review be performed when certainimpairment indicators are present. The <strong>University</strong>’s policy on estimating theimpairment of non-financial assets is discussed in detail in Note 2.12. Thoughmanagement believes that the assumptions used in the estimation of fair valuesreflected in the financial statements are appropriate and reasonable, significantchanges in these assumptions may materially affect the assessment ofrecoverable values and any resulting impairment loss could have a materialadverse effect on the results of operations.The <strong>University</strong> did not recognize any impairment loss on property andequipment, investment property and investments in subsidiaries and an associatein 2010, 2009 and 2008.
- 19 -4. CASH AND CASH EQUIVALENTSCash and cash equivalents include the following components as of March 31:2010 2009 2008Cash on hand andin banks P 100,407,916 P 149,405,908 P 193,801,807Short-term placements 326,755,299 972,365,302 954,699,969P 427,163,215 P 1,121,771,210 P 1,148,501,776Cash in banks generally earn interest at rates based on daily bank deposit rates.Short-term placements are made for varying periods of up to three months dependingon the immediate cash requirements of the <strong>University</strong>. These placements earneffective annual interest ranging from 2.5% to 4.5% in 2010, 3.75% to 7.00% in 2009and 3.75% to 5.25% in 2008 for peso placements and 1.75% to 4.00% in 2009 and2.25% to 2.50% in 2008 for dollar placements. There are no dollar placements in2010. Interest income earned from cash and cash equivalents are presented as part ofFinance Income in the statements of comprehensive income (see Note 14).Certain portion of cash and cash equivalents are set aside to cover for trust funds(see Note 11). The amount of cash and cash equivalents set aside to cover trust fundswere P44.0 million, P58.5 million and P76.2 million as of March 31, 2010, 2009 and2008, respectively. Considering the restriction on such amounts of cash and cashequivalents, the <strong>University</strong> retrospectively reclassified them to Other Current Assetsin 2010 (see Note 2.1).5. RECEIVABLESThis account is composed of the following:2008Notes 2010 2009 (As restated)Tuition and otherschool fees P 104,475,283 P 64,246,194 P 54,371,503Allowance forimpairment ( 15,727,708) ( 14,146,263) ( 11,872,333 )88,747,575 50,099,931 42,499,<strong>17</strong>0Loans receivable 477,000,000 - -Receivable from:FEU EducationalFoundation, Inc.(FEFI) 36,671,312 38,040,770 28,843,710East Asia EducationalFoundation, Inc.(EAEF) 22,415,485 18,165,787 14,116,055Related parties <strong>17</strong>.2 7,475,114 4,984,005 2,341,650Accrued interest 4, 6, <strong>17</strong>.1 11,380,645 8,730,337 14,644,925Advances to employees 9,279,805 11,479,722 9,145,859Others 46,950,398 1,810,105 253,658P 699,920,334 P 133,310,657 P 111,845,027
- 20 -A reconciliation of the allowance for impairment loss on receivables at the beginningand end of 2010, 2009 and 2008 is shown below.Note 2010 2009 2008Balance at beginningof year P 14,146,263 P 11,872,333 P 11,436,501Impairment lossesduring the year 13 22,035,435 <strong>17</strong>,581,234 <strong>17</strong>,450,897Receivables written offduring the year ( 20,453,990) ( 15,307,304) ( <strong>17</strong>,015,065 )P 15,727,708 P 14,146,263 P 11,872,333All of the <strong>University</strong>’s receivables had been reviewed for indicators of impairment.Certain tuition and other fees receivables were found to be impaired and allowancehas been recorded accordingly. The allowance for impairment loss on receivables asof March 31, 2010, 2009 and 2008 relates only to receivables from students whichhave been outstanding for more than one semester and specifically identified to beimpaired. No allowance for impairment loss on all other receivables was provided asof March 31, 2010, 2009 and 2008 since management believes that those arecollectible in full. Impairment loss recognized on receivables is presented as part ofOperating Expenses in the statements of comprehensive income (see Note 13).Loans receivable represents promissory notes issued to certain rental and leasingcorporation as part of <strong>University</strong>’s trust fund arrangement with a certain local bank.Interest income earned from these loans is presented as part of Finance Income in the2010 statement of comprehensive income (see Note 14).Other receivables in 2010 includes a P43.7 million option money for the acquisitionof shares of stock of Crans Montana Holdings Corporation (Crans Montana)(see Note 20.3). Such option money will be refunded to the <strong>University</strong> uponacquisition of Crans Montana or failure by FEU to pursue such acquisition. Pendingconsummation of the Crans Montana acquisition, the <strong>University</strong> temporarily leasedthe properties (land and building located in Makati City) owned by Crans Montanaand made improvements thereon, including construction of a new school building, forthe FEU Makati Campus (see Notes 1 and 20.1). In relation to such improvements,the <strong>University</strong> has made advances to contractors amounting to P52.0 million as ofMarch 31, 2010. Such advances are presented as part of Other Current Assets in the2010 statement of financial position.The <strong>University</strong> provides management services to EAEF which agreed to paymanagement fee computed at a certain percentage of their gross revenue subject tocertain conditions. Management fees earned amounted to P14.1 million in 2010,P11.5 million in 2009 and P20.1 million in 2008 which are presented as ManagementFees in the statements of comprehensive income. Receivable from EAEF representsthe outstanding receivables arising from management services provided by the<strong>University</strong> to EAEF and those arising from the lease of a school building to EAEF(see Note 8).The <strong>University</strong> provides cash advances to FEFI for the latter’s operating requirementssuch as faculty payroll, which FEFI regularly pays to the <strong>University</strong>. The outstandingreceivables arising from this transaction are presented above as Receivable fromFEFI.
- 21 -6. AVAILABLE-FOR-SALE (AFS) INVESTMENTSThis category of financial assets consists of the following:2010 2009 2008Debt securities:Government P 678,<strong>17</strong>9,527 P 792,260,802 P 706,326,539Corporate 502,529,786 261,110,403 109,258,5041,180,709,313 1,053,371,205 815,585,043Equity securities 21,928,999 19,738,752 25,102,359P 1,202,638,312 P 1,073,109,957 P 840,687,402Interest income recognized in 2010, 2009 and 2008 are presented as part of FinanceIncome in the statements of comprehensive income.Certain AFS investments reached their maturity in 2009 and 2008 and were no longerreinvested; thus reclassified to Cash and Cash Equivalents resulting in thereclassification to profit or loss of cumulative gains of P2.8 million in 2009 andP5.5 million in 2008 which were previously recognized in equity.Analyses of the movements in the carrying amounts of the <strong>University</strong>’s investmentsheld by trustee banks are presented below.Note 2010 2009 2008Balance at beginning ofyear P 1,073,109,957 P 840,687,402 P 816,893,531Additions 464,552,265 663,027,476 287,469,902Withdrawals ( 414,986,880) ( 467,769,330) ( 302,906,036 )Investment income – net 14 62,571,971 45,180,490 37,943,665Fair value gains (losses) <strong>17</strong>,390,999 ( 8,016,081) 1,286,340Balance at end of year P 1,202,638,312 P 1,073,109,957 P 840,687,4027. INVESTMENTS IN SUBSIDIARIES AND AN ASSOCIATEThis account consists of the following as of March 31:2010 2009 2008Investments in:SubsidiariesFRC P 64,419,299 P 64,419,299 P 63,297,699EACCI 20,104,999 20,104,999 20,104,999FECSI 6,250,000 6,250,000 -Associate – JMCI 7,878,121 7,878,121 7,878,121Allowance for impairment ( 2,338,930) ( 2,338,930) ( 2,338,930 )96,313,489 96,313,489 88,941,889Advances to joint ventureunder registration 6,250,000 - -P 102,563,489 P 96,313,489 P 88,941,889
- 22 -In November 2009, the <strong>University</strong> entered into a JV Agreement with a co-venturer toestablish and operate a culinary skills training center which shall provide courses ofstudy in the culinary arts. The <strong>University</strong> and co-venturer invested P6.3 million eachto ICF-CCE, Inc., the JVC. Pending approval by the <strong>SEC</strong> of the JVC’s registration(see Notes 1 and 2.3), the amount invested by the <strong>University</strong> is presented as Advancesto Joint Venture under Registration in the Investment in Subsidiaries and an Associateaccount in the 2010 statement of financial position. The registration with the <strong>SEC</strong>was approved after the reporting date (see Note 1).In April 2008, the <strong>University</strong> made an additional investment in FRC amounting toP1.1 million which increased the <strong>University</strong>’s equity ownership interest from36.73% to 37.52%.The shares of stocks of the subsidiaries and an associate are not listed in the stockexchange; hence, the fair value of the shares cannot be determined reliably. However,management believes that the carrying amount of the investments is fully recoverable.8. INVESTMENT PROPERTYThis account consists of the FEU East Asia Main Building and its improvementsbeing leased out to EAEF.The gross carrying amounts and accumulated depreciation of investment property atthe beginning and end of 2010, 2009 and 2008 are shown below.Building andLand Improvements TotalMarch 31, 2010Cost P 53,394,726 P 207,626,479 P 261,021,205Accumulated depreciation - ( 76,547,068) ( 76,547,068)Net carrying amount P 53,394,726 P 131,079,411 P 184,474,137March 31, 2009Cost P 53,394,726 P 207,626,479 P 261,021,205Accumulated depreciation - ( 66,165,743) ( 66,165,743)Net carrying amount P 53,394,726 P 141,460,736 P 194,855,462March 31, 2008Cost P 53,394,726 P 204,900,484 P 258,295,210Accumulated depreciation - ( 55,895,547) ( 55,895,547)Net carrying amount P 53,394,726 P 149,004,937 P 202,399,663April 1, 2007Cost P 53,394,726 P 204,900,484 P 258,295,210Accumulated depreciation - ( 45,185,685) ( 45,185,685)Net carrying amount P 53,394,726 P 159,714,799 P 213,109,525
- 23 -A reconciliation of the carrying amounts at the beginning and end of 2010, 2009 and2008, of investment property is shown below.Building andLand Improvements TotalBalance at April 1, 2009,net of accumulateddepreciation P 53,394,726 P 141,460,736 P 194,855,462Depreciation chargesfor the year - ( 10,381,325) ( 10,381,325)Balance at March 31, 2010,net of accumulateddepreciation P 53,394,726 P 131,079,411 P 184,474,137Balance at April 1, 2008,net of accumulateddepreciation P 53,394,726 P 149,004,937 P 202,399,663Additions - 2,725,995 2,725,995Depreciation chargesfor the year - ( 10,270,196) ( 10,270,196)Balance at March 31, 2009,net of accumulateddepreciation P 53,394,726 P 141,460,736 P 194,855,462Balance at April 1, 2007,net of accumulateddepreciation P 53,394,726 P 159,714,799 P 213,109,525Depreciation chargesfor the year - ( 10,709,862) ( 10,709,862)Balance at March 31, 2008,net of accumulateddepreciation P 53,394,726 P 149,004,937 P 202,399,663The total rental income earned from investment property amounted toP39.2 million in 2010, P22.9 million in 2009 and P25.5 million in 2008 which arepresented as Rental under Other Income (Charges) in the statements ofcomprehensive income (see also Note 20.2). The direct operating expenses incurredby the <strong>University</strong> relating to the investment property is presented as part ofDepreciation and Amortization under General Operating Expenses in the statementsof comprehensive income (see Note 13).The fair value of investment property as of March 31, 2010 is P280.2 million andP386.5 million as of March 31, 2009 and 2008 which were determined based on themost recent valuation performed by independent appraisers immediately after thereporting periods.
- 24 -9. PROPERTY AND EQUIPMENTThe gross carrying amounts and accumulated depreciation and amortization at thebeginning and end of 2010, 2009 and 2008 are shown below.Building and Furniture and Leasehold MiscellaneousLand Improvements Equipment Improvements Equipment TotalMarch 31, 2010Cost P 98,457,565 P 628,387,963 P 123,613,889 P 72,998,023 P 18,208,452 P 941,665,892Accumulateddepreciation andamortization - ( 115,382,431 ) ( 98,019,303 ) ( 18,647,599 ) ( 12,115,403 ) ( 244,164,736 )Net carrying value P 98,457,565 P 513,005,532 P 25,594,586 P 54,350,424 P 6,093,049 P 697,501,156March 31, 2009Cost P 98,457,565 P 513,765,632 P 114,826,750 P 65,423,403 P 13,515,760 P 805,989,110Accumulateddepreciation andamortization - ( 89,307,115 ) ( 88,590,851 ) ( 15,190,788 ) ( 11,889,255 ) ( 204,978,009 )Net carrying value P 98,457,565 P 424,458,5<strong>17</strong> P 26,235,899 P 50,232,615 P 1,626,505 P 601,011,101March 31, 2008Cost P 98,457,565 P 391,268,141 P 107,011,947 P 50,719,189 P 12,409,149 P 659,865,991Accumulateddepreciation andamortization - ( 67,658,804) ( 77,080,300 ) ( 12,325,394 ) ( 11,659,252 ) ( 168,723,750 )Net carrying value P 98,457,565 P 323,609,337 P 29,931,647 P 38,393,795 P 749,897 P 491,142,241April 1, 2007Cost P 98,457,565 P 363,116,887 P 88,895,056 P 49,301,578 P 12,090,999 P 611,862,085Accumulateddepreciation andamortization - ( 48,836,475) ( 66,938,240 ) ( 9,860,315 ) ( 11,543,857 ) ( 137,<strong>17</strong>8,887 )Net carrying value P 98,457,565 P 314,280,412 P 21,956,816 P 39,441,263 P 547,142 P 474,683,198A reconciliation of the carrying amounts, at the beginning and end of 2010, 2009 and2008, of property and equipment is shown below.Building and Furniture and Leasehold MiscellaneousLand Improvements Equipment Improvements Equipment TotalBalance at April 1, 2009,net of accumulateddepreciation andamortization P 98,457,565 P 424,458,5<strong>17</strong> P 26,235,899 P 50,232,615 P 1,626,505 P 601,011,101Additions - 114,622,330 10,411,464 7,574,620 4,692,693 137,301,107Depreciation andamortization chargesfor the year - ( 26,075,315 ) ( 11,052,777 ) ( 3,456,811 ) ( 226,149 ) ( 40,811,052 )Balance at March 31, 2010,net of accumulateddepreciation andamortization P 98,457,565 P 513,005,532 P 25,594,586 P 54,350,424 P 6,093,049 P 697,501,156Balance at April 1, 2008,net of accumulateddepreciation andamortization P 98,457,565 P 323,609,337 P 29,931,647 P 38,393,795 P 749,897 P 491,142,241Additions - 122,497,491 7,814,803 14,704,214 1,106,611 146,123,119Depreciation andamortization chargesfor the year - ( 21,648,311 ) ( 11,510,551 ) ( 2,865,394 ) ( 230,003 ) ( 36,254,259 )Balance at March 31, 2009,net of accumulateddepreciation andamortization P 98,457,565 P 424,458,5<strong>17</strong> P 26,235,899 P 50,232,615 P 1,626,505 P 601,011,101Balance at April 1, 2007,net of accumulateddepreciation andamortization P 98,457,565 P 314,280,412 P 21,956,816 P 39,441,263 P 547,142 P 474,683,198Additions - 28,151,254 18,116,891 1,4<strong>17</strong>,611 318,150 48,003,906Depreciation andamortization chargesfor the year - ( 18,822,329 ) ( 10,142,060 ) ( 2,465,079 ) ( 115,395 ) ( 31,544,863 )Balance at March 31, 2008,net of accumulateddepreciation andamortization P 98,457,565 P 323,609,337 P 29,931,647 P 38,393,795 P 749,897 P 491,142,241
- 25 -10. ACCOUNTS PAYABLE AND OTHER LIABILITIESThis account consists of:Notes 2010 2009 2008Accounts payable P 47,803,128 P 41,270,585 P 35,707,914Accrued expenses <strong>17</strong>.3 89,586,908 74,459,814 57,845,983Dividends payable 18.2 71,226,466 57,606,705 139,805,663Funds payable 55,705,967 38,743,<strong>17</strong>0 27,887,733Amounts due tostudents 37,573,353 33,746,306 46,555,113Withholding and othertaxes payable 36,131,410 36,045,790 43,473,581Payable to FEUretirement plan 15 32,313,215 36,901,623 41,886,105Accrued salaries andemployee benefits 29,614,032 54,229,149 30,048,030Deposits payable 1,340,235 1,326,485 1,326,485Other current liabilities 9,029,590 6,207,225 5,728,383P 410,324,304 P 380,536,852 P 430,264,990Accrued expenses include the <strong>University</strong>’s accrual for utilities, rentals and directors’bonuses. Funds payable are amounts due to third parties for cooperative members’fees; school uniforms of students; and computer loans of employees. Amounts dueto students represent excess payment of miscellaneous fees from students.11. TRUST FUNDSThis account consists of the following as of March 31:2010 2009 2008Visual aid developmentfund P 14,635,307 P 13,224,923 P 13,670,640FEU Central StudentOrganization:Student loan fund 13,384,402 12,777,129 10,502,842Student scholarshipfund 2,290,745 3,902,308 3,919,602Student welfare anddevelopment fund 13,141,458 26,202,141 40,693,748Student assistance fund - - 2,653,039Others 518,838 2,384,141 4,722,351P 43,970,750 P 58,490,642 P 76,162,222These trust funds represent collections to defray expenses related to activities forspecific educational purposes. As discussed in Note 4, the amounts of cash and cashequivalents corresponding to the outstanding balances of these funds presented aspart of Other Current Assets in the statements of financial position are set aside andrestricted for such purposes.
- 26 -12. TUITION AND OTHER SCHOOL FEESDetails of net tuition and other school fees presented in the statements ofcomprehensive income are as follows:2010 2009 2008Tuition P 1,746,362,097 P 1,694,493,469 P 1,655,826,499Less discounts:Scholarship 61,000,082 63,723,848 57,508,745Cash 10,294,191 10,214,508 10,038,965Family 9,277,458 8,746,646 7,595,75680,571,731 82,685,002 75,143,4661,665,790,366 1,611,808,467 1,580,683,033Other school fees:Entrance fees 12,879,474 29,904,890 13,500,341Identification cards 9,903,306 8,775,916 8,655,013Transcript fees 8,794,229 9,030,205 7,919,956Diplomas 2,910,208 1,745,791 2,315,965Miscellaneous 770,448 824,008 755,23535,257,665 50,280,810 33,146,510P 1,701,048,031 P 1,662,089,277 P 1,613,829,543Towards the end of the fiscal year, the <strong>University</strong> collected tuition fees from studentsfor summer classes which start after the reporting period. Such collections areexcluded from tuition fees earned for the year and presented as Unearned TuitionFees in the 2009 and 2008 statements of financial position and recognized as revenuein the following year. There are no unearned tuition fees in 2010.13. OPERATING EXPENSESOperating expenses consists of:Notes 2010 2009 2008Instructional and AcademicSalaries and allowances <strong>17</strong>.5 P 519,662,398 P 527,192,891 P 495,587,597Employees benefits 15, <strong>17</strong>.5 165,028,563 164,350,335 150,395,234Related learningexperience 31,738,871 21,641,432 19,474,376Affiliation <strong>17</strong>,153,509 9,960,332 11,418,035Others 19,128,326 21,503,870 <strong>17</strong>,370,504752,711,667 744,648,860 694,245,746AdministrativeSalaries and allowances 92,596,727 84,461,509 77,655,820Rental <strong>17</strong>.3 55,008,187 56,180,367 50,504,658Employees benefits 15 44,727,498 39,266,335 36,165,361Directors’ bonus 12,010,000 11,750,000 10,500,000Others 14,167,855 10,259,595 11,502,529218,510,267 201,9<strong>17</strong>,806 186,328,368
- 27 -Notes 2010 2009 2008Maintenance and <strong>University</strong>OperationsUtilities 66,785,904 67,818,876 60,771,052Salaries and allowances 21,722,461 23,490,070 24,196,975Janitorial services 11,915,987 12,808,640 11,707,163Repairs and maintenance 11,406,398 4,619,377 4,330,271Employee benefits 15 11,198,934 11,296,291 11,772,106Property insurance 1,485,816 1,160,749 564,594124,515,500 121,194,003 113,342,161GeneralDepreciation andamortization 8, 9 51,192,377 46,524,455 42,254,725Impairment losseson receivables 5 22,035,435 <strong>17</strong>,581,234 <strong>17</strong>,450,897Security services 15,782,208 25,834,071 18,314,315Publicity and promotions 9,0<strong>17</strong>,636 6,615,235 8,033,477Professional fees 8,818,080 6,306,848 5,416,097Maintenance of art works 2,812,457 6,<strong>17</strong>6,320 2,184,264Donation and charitablecontributions 1,803,543 629,864 533,888Taxes and licenses 654,492 1,985,560 505,605Others 2,724,460 2,896,714 5,582,853114,840,688 114,550,301 100,276,121Total Operating Expenses P 1,210,578,122 P 1,182,310,970 P 1,094,192,39614. FINANCE INCOMEThis account consists of interest income from:Notes 2010 2009 2008AFS investments 6 P 62,571,971 P 45,180,490 P 37,943,665Cash and cashequivalents 4 41,295,682 65,927,344 62,635,081Due from arelated party <strong>17</strong>.1 5,698,023 4,895,036 3,164,618Loans receivable 5 2,192,416 - -HTM investments 1,650,000 1,672,563 2,679,885Foreign exchangegains – net - 3,037,732 -P 113,408,092 P 120,713,165 P 106,423,249
- 28 -15. EMPLOYEES’ HEALTH, WELFARE AND RETIREMENT FUNDThe <strong>University</strong> maintains a funded and contributory retirement plan, which is adefined contribution type of retirement plan since 1967, covering regular teaching andnon-teaching personnel members.The retirement fund is under the administration of an organization, the FEU Health,Welfare and Retirement Fund (the Fund), through its Retirement Board.Contributions to this fund are in accordance with the defined contribution establishedby the Retirement Board which is the sum of the employees’ and the <strong>University</strong>’scontributions. Employees’ contribution is 5% of basic salary while the <strong>University</strong>’scontribution is equivalent to 20% of the employees’ basic salary. Retirement expenserecognized in profit or loss in the statements of comprehensive income amounted toP86.6 million in 2010, P85.9 million in 2009 and P63.4 million in 2008 (see Note 13).The Fund’s statements of financial position as of December 31, 2009, 2008 and 2007showed the following:2009 2008 2007AssetsMoney market placements P 715,250,000 P 643,050,000 P 555,853,116Receivables 52,926,997 38,547,269 40,186,159Cash in banks 9,997,093 10,784,913 4,628,136Others 136,263 185,654 208,505778,310,353 692,567,836 600,875,916Liabilities ( 55,569,843) ( 50,395,960) ( 49,871,692 )Net Assets P 722,740,510 P 642,<strong>17</strong>1,876 P 551,004,22416. INCOME TAXESThe components of the <strong>University</strong>’s tax expense presented in profit or loss are asfollows:2010 2009 2008Current tax expense:Special rate at 10% P 56,990,568 P 51,743,268 P 59,615,310Final tax at 20% 21,103,483 20,543,679 19,135,61378,094,051 72,286,947 78,750,923Deferred tax expense (income):Deferred tax arising fromorigination and reversalof temporary differences ( 1,388,091) 2,888,741 ( 2,965,<strong>17</strong>6 )P 76,705,960 P 75,<strong>17</strong>5,688 P 75,785,747
- 29 -A reconciliation of tax on pretax income computed at the applicable statutory rates totax expense reported in profit or loss follows:2010 2009 2008Tax on pretax income at 10% P 66,188,724 P 64,2<strong>17</strong>,355 P 66,869,<strong>17</strong>5Adjustments for incomesubjected to higher tax rates 10,551,718 9,265,639 8,809,750Derecognition of previouslyrecognized deferred tax - 1,700,000 -Others ( 34,482) ( 7,306) 106,822Tax expense P 76,705,960 P 75,<strong>17</strong>5,688 P 75,785,747The net deferred tax assets relate to the following as of March 31:Statements of Financial PositionProfit or Loss2010 2009 2008 2010 2009 2008Deferred tax assets:Accrued rent expense P 5,168,876 P 4,591,002 P 3,543,085 ( P 577,874 ) ( P 1,047,9<strong>17</strong> ) ( P 1,131,710 )Allowance for impairment onreceivables 1,572,771 1,414,626 1,187,233 ( 158,145 ) ( 227,393 ) ( 43,583 )Unrealized foreign currency loss 348,299 - 474,786 ( 348,299 ) 474,786 ( 104,391 )Unearned income - - 1,685,492 - 1,685,492 ( 1,685,492 )Accrued donation - - 1,700,000 - 1,700,000 -Deferred tax liability –Unrealized foreign currency gains - ( 303,773 ) - ( 303,773 ) 303,773 -Deferred tax expense (income) ( P 1,388,091 ) P 2,888,741 ( P 2,965,<strong>17</strong>6 )Deferred tax assets – net P 7,089,946 P 5,701,855 P 8,590,596The <strong>University</strong> availed of the Tax Incentives Provisions of Republic Act (R.A.)No. 8525, Adopt-a-School Act of 1998. Total benefit from the availment ofthese tax incentives provided under the R.A. is the sum of the amount ofcontribution/donation that was actually, directly and exclusively incurred for theAdopt-a-School Program, with limitations, conditions and rules set forth inSection 34 (H) of the Tax Code and fifty percent (50%) of the amount of suchcontribution/donation.<strong>17</strong>. RELATED PARTY TRANSACTIONSThe <strong>University</strong>’s related parties include its subsidiaries, the <strong>University</strong>’s keymanagement and others as described below. The following are its significanttransactions with related parties:<strong>17</strong>.1 Interest-bearing AdvancesThe <strong>University</strong> has outstanding cash advances to FRC with an aggregate principalamount of P100.0 million as of March 31, 2009 and 2008. These advances bearinterest due quarterly based on 91-day Treasury bill rates ranging from 3.94% to4.55% in 2010, 4.61% to 6.84% in 2009 and 3.95% to 4.15% in 2008. In 2010,additional advances amounting to P118.8 million were granted by the <strong>University</strong> toFRC for the construction of school building and campus for FECSI. Interest ratecharged on these advances is fixed at 2.5% per annum based on usual interest rate onthe <strong>University</strong>’s placements.
- 30 -Total interest income earned from the advances amounted to P5.7 million in 2010,P4.9 million in 2009 and P3.2 million in 2008 which were presented as part ofFinance Income in the statements of comprehensive income (see Note 14).The related outstanding interest receivables are shown as Accrued Interest under theReceivables account in the statements of financial position (see Note 5). Themovement in the outstanding balance which is presented as Due from a Related Partyin the statements of financial position is shown below.2010 2009 2008Balance at beginning of year P 100,000,000 P 100,000,000 P 100,000,000Advances during the year 118,774,500 - -Balance at end of year P 218,774,500 P 100,000,000 P 100,000,000<strong>17</strong>.2 Noninterest-bearing AdvancesThe <strong>University</strong> grants unsecured and noninterest-bearing advances to certain relatedparties for working capital purposes which are currently due and demandable.Summarized below are the outstanding receivables shown as part of receivable fromrelated parties under the Receivables account in the statements of financial positionarising from these transactions (see Note 5).NetNetAdditions2008 Additions 2009 (Deductions) 2010FRC P 2,341,650 P 775,647 P 3,1<strong>17</strong>,297 (P 2,828,391) P 288,906FECSI - 1,866,708 1,866,708 5,319,500 7,186,208<strong>17</strong>.3 Lease of Campus Premises from FRCP 2,341,650 P 2,462,355 P 4,984,005 P 2,491,109 P 7,475,114The <strong>University</strong> leases certain buildings located within the campus premises from FRCfor a period of 10 years from July 1, 2005 to June 30, 2015. The lease period isrenewable subject to conditions mutually agreed upon by both parties. Total rentalexpense charged to operations amounted to P55.0 million in 2010, P56.2 million in2009 and P50.5 million 2008 under the Administrative Expenses (see Note 13) whileoutstanding payables as of March 31, 2010, 2009 and 2008 amounted to P45.8 million,P42.6 million and P36.1 million, respectively, presented as part of Accrued Expensesunder Accounts Payable and Other Liabilities in the statements of financial position(see Note 10). .<strong>17</strong>.4 Lease of Certain Floor to FRCThe <strong>University</strong> leases the mezzanine floor of one of the <strong>University</strong>’s building to FRCfor a period of 10 years from September 1, 2007 to August 31, 20<strong>17</strong>, renewable uponmutual consent of both parties. Based on the lease contract, the <strong>University</strong> providesdiscounts on the monthly rental during the lean season of the school year. Rentincome from FRC amounted to P800,000 in 2010 and 2009 and P560,000 in 2008which is shown as part of Rental under Other Income (Charges) in the statements ofcomprehensive income. There are no outstanding receivables as of the end of eachyear.
- 31 -<strong>17</strong>.5 Key Management Personnel CompensationTotal remunerations of the <strong>University</strong>’s key management personnel presented as partof salaries and allowances and employees benefits under the Instructional andAcademic Expenses (see Note 13) is as follows:2010 2009 2008Short-term benefits P 116,432,220 P 113,999,963 P 100,412,356Retirement benefits 18,247,691 18,063,955 16,321,494P 134,679,911 P 132,063,918 P 116,733,85018. EQUITY18.1 Capital <strong>Stock</strong>SharesAmount2010 2009 2008 2010 2009 2008Common shares – P100 par valueAuthorized 10,000,000 10,000,000 10,000,000Issued and outstanding:Balance at beginning of year 9,845,779 7,043,699 7,043,699 P 984,577,900 P 704,369,900 P 704,369,900Issued during the year - 2,802,080 - - 280,208,000 -Balance at end of year 9,845,779 9,845,779 7,043,699 984,577,900 984,577,900 704,369,900Treasury stock – at cost ( 37,331 ) ( 37,331 ) ( 37,331 ) ( 3,733,100 ) ( 3,733,100 ) ( 3,733,100 )Total outstanding 9,808,448 9,808,448 7,006,368 P 980,844,800 P 980,844,800 P 700,636,80018.2 Retained EarningsSignificant transactions affecting Retained Earnings, which is also restricted at anamount equivalent to the cost of treasury shares, are as follows:(a) Appropriation of Retained EarningsAppropriated Retained Earnings consists of appropriations for:Note 2010 2009 2008Property andinvestmentacquisition P 1,000,000,000 P - P -Expansion of facilities 599,333,335 899,333,335 1,010,000,000General retirement 57,000,000 57,000,000 57,000,000Contingencies 20.4 18,765,682 18,765,682 20,161,414Purchase of equipmentand improvements - - 30,000,000Acquisition oflaboratoryequipment - - 20,000,000Repairs andimprovements - - 10,000,000P 1,675,099,0<strong>17</strong> P 975,099,0<strong>17</strong> P 1,147,161,414
- 32 -On March 25, 2008, additional appropriation for school expansion of P300 millionwas approved by the BOT. In 2009, the <strong>University</strong> made a reversal of appropriationsamounting to P<strong>17</strong>2.1 million pertaining to expansion of facilities, repairs andimprovements, acquisition of laboratory equipment and purchase of equipment andimprovements. In 2010, the <strong>University</strong> appropriated P1.0 billion for property andinvestment acquisition and reversed P300.0 million relating to expansion of facilities.(b) Dividend DeclarationThe BOT approved the following dividend declarations in 2010, 2009 and 2008,respectively:Date ofDeclaration Record Payment Amount2010Cash dividend ofP15 per share June 19, 2009 July 6, 2009 July 20, 2009 P 147,126,720Cash dividend ofP15 per share December 15, 2009 January 8, 2010 January 25, 2010 147,126,720P 294,253,4402009Cash dividend ofP15 per share June <strong>17</strong>, 2008 July 7, 2008 July 21, 2008 P 105,095,52040% stock dividendequivalent to2,802,547 shares August 23, 2008 September 15, 2008 October 9, 2008 280,208,000467 fractional sharespaid out in cash atP100 per share August 23, 2008 September 15, 2008 October 9, 2008 46,720Cash dividend ofP15 per share December 16, 2008 January 8, 2009 January 22, 2009 147,126,720P 532,476,9602008Cash dividend ofP15 per share June 26, 2007 July 11, 2007 July 23, 2007 P 105,095,520Cash dividend ofP15 per share December 18, 2007 January 7, 2008 January <strong>17</strong>, 2008 105,095,520Cash dividend ofP15 per share March 25, 2008 April 10, 2008 April 24, 2008 105,095,520P 315,286,560Unpaid dividends as of March 31, 2010, 2009 and 2008 are presented as dividendspayable under Accounts Payable and Other Liabilities in the statements of financialposition (see Note 10).
- 33 -19. EARNINGS PER SHAREEarnings per share amounts were computed as follows:2010 2009 2008Net profit P 585,181,285 P 566,997,861 P 592,906,003Divided by weighted averagenumber of outstandingshares, net of treasury stockof 37,331 shares 9,808,448 8,407,408 7,006,368Basic and dilutedearnings per share P 59.66 P 67.44 P 84.62The weighted average number of shares outstanding as of March 31, 2009 iscomputed as follows:Number of Months Weighted numbershares outstanding of sharesBalance at beginning of year 7,006,368 12 84,076,416Issuance on October 9, 2008 2,802,080 6 16,812,480Balance at end of year 9,808,448 100,888,896Divided by total monthsas of March 31, 2009 12Weighted average numberof shares outstanding 8,407,408There were no stock issuances in 2010 and 2008, hence, the weighted average numberof shares outstanding is equivalent to the total outstanding shares as ofMarch 31, 2010 and 2008.The <strong>University</strong> has no dilutive potential common shares as of March 31, 2010, 2009and 2008.20. COMMITMENTS AND CONTINGENCIES20.1 Operating Lease Commitments – <strong>University</strong> as Lessee(a) Lease Agreement with FRCThe <strong>University</strong> is a lessee under non-cancellable operating leases covering certainbuildings. The lease has 10-year terms with renewal options and includes annualescalation rates of 10%. The future minimum rentals payable under thesenon-cancellable operating leases are as follows as of March 31:2010 2009 2008Within one year P 43,312,809 P 39,375,281 P 35,795,710After one year but not morethan five years 221,116,303 201,014,828 182,740,740More than five years16,222,259 79,636,542 137,285,912P 280,651,371 P 320,026,651 P 355,822,362
- 34 -(b) Lease Agreement with Crans MontanaThe <strong>University</strong> also entered into a contract of lease with Crans Montana for thebuilding occupied by FEU Makati Campus commencing on November 18, 2009 untilNovember <strong>17</strong>, 2010. The parties amended the contract extending the lease term for aperiod of 10 years. The future minimum rentals payable under this non-cancellableoperating lease is as follows as of March 31, 2010:Within one year P 2,623, 200After one year but not more than five years 10,492,800More than five years 12,241,600P 25,357,60020.2 Operating Lease Commitments – <strong>University</strong> as LessorThe <strong>University</strong> leases out certain buildings to EAEF for a period of one to ten yearsuntil August 31, 20<strong>17</strong> (see Note 8). Total rent income recognized in profit or lossamounted to P39.2 million in 2010, P22.9 million in 2009 and P25.5 million in 2008.Future minimum rental receivables, excluding contingent rental, under these operatingleases as of March 31, 2010, 2009 and 2008 are as follows:2010 2009 2008Within one year P 28,666,776 P 28,666,776 P <strong>17</strong>,483,208After one year but not morethan five years 114,667,104 114,667,104 69,932,832More than five years57,333,552 86,000,328 69,932,83220.3 Acquisition of Crans MontanaP 200,667,432 P 229,334,208 P 157,348,872In 2010, the <strong>University</strong> has made a commitment to acquire all shares of stock ofCrans Montana and paid option money amounting to P43.7 million for suchacquisition and which shall be refunded to the <strong>University</strong> upon acquisition or failureto pursue such acquisition (see Note 5). The total acquisition price is aboutP216.0 million.20.4 Legal ClaimsAs of March 31, 2010, 2009 and 2008, the <strong>University</strong> is a defendant in certain civilcases which are pending in the local courts, certain illegal dismissal cases pendingbefore the national Labor Relations Commission, and a class suit for damages bycertain students which is pending before the Court of Appeals.The <strong>University</strong>’s management and its legal counsel believe that liabilities, if any, whichmay result from the outcome of these cases, will not materially affect the financialposition and results of operations of the <strong>University</strong>. However, the <strong>University</strong> hasappropriated portion of its retained earnings for these contingencies (see Note 18.2).
- 35 -20.5 OthersThere are other contingencies that arise in the normal course of business that are notrecognized in the <strong>University</strong>’s financial statements. However, management believesthat losses, if any, arising from these commitments and contingencies will notmaterially affect its financial statements.21. RISK MANAGEMENT OBJECTIVES AND POLICIESThe <strong>University</strong> is exposed to certain financial risks in relation to financial instruments.Its main purpose for its dealings in financial instruments is to fund operational andcapital expenditures. The BOT has overall responsibility for the establishment andoversight of the <strong>University</strong>’s risk management framework. It has a risk managementcommittee headed by an independent trustee that is responsible for developing andmonitoring the <strong>University</strong>’s policies, which address risk management areas.Management is responsible for monitoring compliance with the <strong>University</strong>’s riskmanagement policies and procedures and for reviewing the adequacy of these policiesin relation to the risks faced by the <strong>University</strong>.The <strong>University</strong> does not actively engage in trading of financial assets for speculativepurposes nor does it write options. The most significant financial risks to which the<strong>University</strong> is exposed to are described below.21.1 Interest Rate SensitivityThe <strong>University</strong>’s exposure to interest rate risk arises from the followinginterest-bearing financial instruments which are subject to variable interest rates. Allother financial assets and liabilities have fixed rates.Notes 2010 2009 2008Cash and cashequivalents 4 P 427,163,215 P 1,121,771,210 P 1,148,501,776AFS investments 6 1,202,638,312 1,073,109,957 840,687,402Held-to-maturityinvestments 20,000,000 20,000,000 32,071,040Due from arelated party <strong>17</strong>.1 100,000,000 100,000,000 100,000,000P 1,749,801,527 P 2,314,881,167 P 2,121,260,218
- 36 -The following table illustrates the sensitivity of profit before tax for the years withregard to the <strong>University</strong>’s interest-bearing financial instruments. These percentageshave been determined based on the average market volatility rates, using standarddeviation, in the previous 12 months, estimated at 68% level of confidence. Thesensitivity analysis is based on the <strong>University</strong>’s financial instruments held atMarch 31, 2010, 2009 and 2008.2010 2009 2008Reasonably Effect on Reasonably Effect on Reasonably Effect onpossible profit before possible profit before possible profit beforechange in rate tax change in rate tax change in rate taxCash and cash equivalents +/-1.39% P 5,925,674 +/-2.67% P 31,423,827 +/-1.35% P 16,574,626AFS investments +/-0.94% 16,034,252 +/-2.83% 28,147,720 +/-1.54% 11,1<strong>17</strong>,533Held-to-maturity investments +/-1.39% 278,000 +/-2.67% 534,000 +/-1.35% 432,959Due from a related party +/-0.78% 780,297 +/-2.73% 2,733,463 +/-2.76% 2,761,04021.2 Credit RiskP 23,018,223 P 62,839,010 P 30,886,158Credit risk represents the loss the <strong>University</strong> would incur if the counterparty failed toperform under its contractual obligations. The <strong>University</strong>’s exposure to credit risk onits receivables related primarily to the inability of the debtors to pay and students tofully settle the unpaid balance of tuition fees and other charges which are owed to the<strong>University</strong> based on installment payment schemes. The <strong>University</strong> has establishedcontrols and procedures in its credit policy to determine and to monitor the creditworthiness of the students based on relevant factors. Also, students are not allowedto enroll in the following semester unless the unpaid balance in the previous semesterhas been paid. The <strong>University</strong> also withholds the academic records and clearance ofthe students with unpaid balance, thus ensuring that collectibility is reasonablyassured. The <strong>University</strong>’s exposure to credit risk on its other receivable from debtorsand related parties is managed through close account monitoring and setting limits.The <strong>University</strong> neither has any significant exposure to any individual customer orcounterparty nor does it have any other concentration of credit risk arising fromcounterparties in similar business activities, geographic region or economic parties.With respect to credit risk arising from cash and cash equivalents, receivables, duefrom a related party, AFS investments and HTM investments, the <strong>University</strong>’sexposure to credit risk arises from default of the counterparty, with maximumexposure equal to the carrying amount of these instruments. The maximum exposureto credit risk at the end of the reporting period is as follows:Notes 2010 2009 2008Cash and cashequivalents 4 P 427,163,215 P 1,121,771,210 P 1,148,501,776Receivables 5 699,920,334 133,310,657 111,845,027AFS investments 6 1,202,638,312 1,073,109,957 840,687,402Due from arelated party <strong>17</strong>.1 218,774,500 100,000,000 100,000,000HTM investments 20,000,000 20,000,000 32,071,040Restricted cash andcash equivalents 4, 11 43,970,750 58,490,642 76,162,222P 2,612,467,111 P 2,506,682,466 P 2,309,267,467
- 37 -The table below shows the credit quality of the <strong>University</strong>’s financial assets as ofMarch 31, 2010, 2009 and 2008 (presented in ‘000s) having past due but not impairedcomponents.NeitherPast duepast due nor Impaired Notimpaired (see Note 5) impaired Total2010Cash andcash equivalents P 427,163 P - P - P 427,163Receivables 683,522 15,728 16,398 715,649AFS investments 1,202,638 - - 1,202,638Held-to-maturityinvestments 20,000 - - 20,000Restricted cash andcash equivalents 43,970 - - 43,970Due from arelated party 218,775 - - 218,775P 2,596,068 P 15,728 P 16,398 P 2,628,1942009Cash andcash equivalents P 1,121,771 P - P - P 1,121,771Receivables 118,536 14,146 14,775 147,457AFS investments 1,073,110 - - 1,073,110Held-to-maturityinvestments 20,000 - - 20,000Restricted cash andcash equivalents 58,491 - - 58,491Due from arelated party 100,000 - - 100,000P 2,491,908 P 14,146 P 14,775 P 2,520,8292008Cash andcash equivalents P 1,148,502 P - P - P 1,148,502Receivables 85,154 11,872 26,692 123,718AFS investments 840,687 - - 840,687Held-to-maturityinvestments 32,071 - - 32,071Restricted cash andcash equivalents 76,162 - - 76,162Due from arelated party 100,000 - - 100,000P 2,282,576 P 11,872 P 26,692 P 2,321,140The age of past due but not impaired receivables is about six months for each of thethree years.
- 38 -The <strong>University</strong> classifies tuition and other fee receivables from students based on thenumber of semesters the receivables have been outstanding. Receivables fromstudents that are outstanding for more than one semester are analyzed to determinewhether they are impaired. Those that are not outstanding for more than onesemester or are currently receivable are determined to be collectible, based onhistorical experience.The <strong>University</strong>’s management considers that all the above financial assets are notimpaired, except those specifically provided with allowance for impairment, as of thereporting dates and of good credit quality. Cash and cash equivalents, AFSinvestments and HTM investments are coursed through reputable financialinstitutions duly approved by the BOT. The balance of Due from a Related Partyaccount is from a profitable related party with good payment record; collectionstherefrom are reasonably assured.21.3 Liquidity RiskThe <strong>University</strong> manages liquidity risk by maintaining a balance between continuity offunding and flexibility. Treasury controls and procedures are in place to ensure thatsufficient cash is maintained to cover daily operational and working capitalrequirements. Management closely monitors the <strong>University</strong>’s future and contingentobligations and ensures that future cash collections are sufficient to meet them inaccordance with internal policies. The <strong>University</strong> invests in cash placements whenexcess cash is obtained from operations.Financial liabilities of the <strong>University</strong> at the end of the reporting period comprise ofaccounts payable and accrued expenses and dividends payables which are allshort-term in nature and have contractual maturities of less than 12 months.21.4 Other Price Risk SensitivityThe <strong>University</strong>’s exposure to price risk arises from its investments in equity and debtsecurities, which are classified as AFS investments in the statements of financialposition.Management monitors its equity and debt securities in its investment portfolio basedon market indices. Material investments within the portfolio are managed on anindividual basis.AFS investments consist of publicly listed equity securities and government securitieswhich are carried at fair value and non-listed equity securities for which no fair valueinformation is available and that are therefore carried at cost.For equity securities listed in the <strong>Philippine</strong>s, an average volatility of 26.06%, 36.68%and 56.14% has been observed during 2010, 2009 and 2008 respectively. If quotedprice for these securities increased or decreased by that amount profit before taxwould have changed by P4.9 million, P7.1 million and P9.8 million in 2010, 2009 and2008, respectively.The investments in listed equity securities are considered long-term strategicinvestments. In accordance with the <strong>University</strong>’s policies, no specific hedgingactivities are undertaken in relation to these investments. The investments arecontinuously monitored and voting rights arising from these equity instruments areutilized in the <strong>University</strong>’s favor.
- 39 -22. CATEGORIES AND FAIR VALUES OF FINANCIAL ASSETS ANDLIABILITIES22.1 Comparison of Carrying Amounts and Fair ValuesThe carrying amounts and fair values of the categories of financial assets and liabilitiespresented in the statements of financial position are shown below.Notes 2010 2009 2008Carrying Fair Carrying Fair Carrying FairValues Values Values Values Values ValuesFinancial assetsLoans and receivablesCash and cashequivalents 4 P 427,163,215 P 427,163,215 P 1,121,771,210 P 1,121,771,210 P 1,148,501,776 P 1,148,501,776Receivables 5 699,920,334 699,920,334 133,310,657 133,310,657 111,845,027 111,845,027Restricted cashand cashequivalents 4, 11 43,970,750 43,970,750 58,490,642 58,490,642 76,162,222 76,162,222Due from arelated party 218,774,500 218,774,500 100,000,000 100,000,000 100,000,000 100,000,0001,389,828,799 1,389,828,799 1,413,572,509 1,413,572,509 1,436,509,025 1,436,509,025AFS investments 6Debt securities 1,180,709,313 1,180,709,313 1,053,371,205 1,053,371,205 815,585,043 815,585,043Equity securities 21,928,999 21,928,999 19,738,752 19,738,752 25,102,359 25,102,3591,202,638,312 1,202,638,312 1,073,109,957 1,073,109,957 840,687,402 840,687,402HTM investmentsDebt securities 20,000,000 20,000,000 20,000,000 20,000,000 32,071,040 32,071,040P 2,612,467,111 P 2,612,467,111 P 2,506,682,466 P 2,506,682,466 P 2,309,267,467 P 2,309,267,467Financial liabilitiesAccounts payable andaccrued expenses 10 P 410,324,304 P 410,324,304 P 380,536,852 P 380,536,852 P 430,264,990 P 430,264,990See Notes 2.4 and 2.7 for a description of the accounting policies for each category offinancial instruments. A description of the <strong>University</strong>’s risk management objectivesand policies for financial instruments is provided in Note 21.22.2 Fair Value HierarchyThe <strong>University</strong> adopted the amendments to PFRS 7, Improving Disclosures about FinancialInstruments, effective January 1, 2009. These amendments require the <strong>University</strong> topresent certain information about financial instruments measured at fair value in thestatements of financial position. In the first year of application, comparativeinformation need not be presented for the disclosures required by the amendment.Accordingly, the disclosure for the fair value hierarchy is only presented forMarch 31, 2010.In accordance with this amendment, financial assets and liabilities measured at fairvalue in the statements of financial position are categorized in accordance with the fairvalue hierarchy. This hierarchy groups financial assets and liabilities into three levelsbased on the significance of inputs used in measuring the fair value of the financialassets and liabilities. The fair value hierarchy has the following levels:• Level 1: quoted prices (unadjusted) in active markets for identical assets orliabilities;• Level 2: inputs other than quoted prices included within Level 1 that areobservable for the resource or liability, either directly (i.e., as prices) or indirectly(i.e., derived from prices); and,• Level 3: inputs for the asset or liability that are not based on observable marketdata (unobservable inputs).
- 40 -The level within which the financial asset or liability is classified is determined basedon the lowest level of significant input to the fair value measurement.The breakdown of the <strong>University</strong>’s AFS investments measured at fair value in itsstatement of financial position as of March 31, 2010 is as follows:Level 1 Level 2 Level 3 TotalDebt securities:Government P 678,<strong>17</strong>9,527 P - P - P 678,<strong>17</strong>9,527Corporate 55,540,548 - 446,989,238 502,529,786Equity securities 21,928,999 - - 21,928,999P 755,649,074 P - P 446,989,238 P 1,202,638,31223. CAPITAL MANAGEMENT OBJECTIVES, POLICIES ANDPROCEDURESThe <strong>University</strong> aims to provide returns on equity to shareholders while managingoperational and strategic objectives. The <strong>University</strong> manages its capital structure andmakes adjustments to it, in the light of changes in economic conditions. To maintainor adjust capital structure, the <strong>University</strong> may adjust the dividend payment toshareholders, return capital to shareholders or issue new shares.The <strong>University</strong> defines capital as paid-in capital stock and retained earnings, bothappropriated and unappropriated. Other components of equity such as treasury stockand revaluation reserves are excluded from capital for purposes of capitalmanagement. The BOT has overall responsibility for monitoring of capital inproportion to risks. Profiles for capital ratios are set in the light of changes in the<strong>University</strong>’s external environment and the risks underlying the <strong>University</strong>’s business,operation and industry.The <strong>University</strong> monitors capital on the basis of debt-to-equity ratio, which iscalculated as total debt net of unearned tuition fees and deferred tax liability dividedby total equity. Capital for the reporting period March 31, 2010, 2009 and 2008 underreview is summarized as follows:2010 2009 2008Total debt – net P 500,<strong>17</strong>3,521 P 482,644,292 P 555,219,840Total equity 3,197,540,409 2,889,221,565 2,585,259,344Debt-to-equity ratio 0.16 : 1.00 0.<strong>17</strong> : 1.00 0.21 : 1:00The <strong>University</strong> is not subject to any externally-imposed capital requirements.There was no change in the <strong>University</strong>’s approach to capital management during theyear.
THE FAR EASTERN UNIVERSITY, INCORPORATED AND SUBSIDIARIESCONSOLIDATED STATEMENTS OF FINANCIAL POSITIONMARCH 31, 2010 AND 2009(With Comparative Figures for 2008)(Amounts in <strong>Philippine</strong> Pesos)2009 2008(As Restated - (As Restated -Notes 2010 see Note 2.1) see Note 2.1)A S S E T SCURRENT ASSETSCash and cash equivalents 5 P 468,148,054 P 1,<strong>17</strong>2,859,362 P 1,207,342,389Receivables - net 6 839,947,375 138,151,928 113,434,183Available-for-sale investments 7 1,240,095,151 1,088,109,957 840,687,402Held-to-maturity investments 20,000,000 20,000,000 -Real estate held for sale 8 122,532,288 129,216,942 129,216,942Other current assets 5, 6 128,520,280 90,677,164 134,567,441Total Current Assets 2,819,243,148 2,639,015,353 2,425,248,357NON-CURRENT ASSETSHeld-to-maturity investments - - 32,071,040Investment in an associate 9 13,251,976 7,055,963 7,105,379Investment property - net 10 371,577,<strong>17</strong>7 364,903,545 363,737,216Property and equipment - net 11 1,207,576,778 843,473,310 720,820,379Deferred tax assets 18 10,841,548 9,228,791 11,357,319Other non-current assets 2 16,1<strong>17</strong>,892 26,151,492 <strong>17</strong>,816,656Total Non-current Assets 1,619,365,371 1,250,813,101 1,152,907,989TOTAL ASSETS P 4,438,608,519 P 3,889,828,454 P 3,578,156,346LIABILITIES AND EQUITYCURRENT LIABILITIESAccounts payable and other liabilities 12 P 453,578,125 P 349,657,377 P 420,350,624Deferred income 14 2,715,463 76,555,105 24,287,583Trust funds 13 43,970,750 58,490,641 76,162,222Income tax payable 78,758,273 48,721,315 54,676,608Notes payable 10 3,371,494 3,103,359 1,895,782Total Current Liabilities 582,394,105 536,527,797 577,372,819NON-CURRENT LIABILITIESNotes payable 10 6,955,744 10,327,238 -Deferred tax liabilities 18 13,822,482 13,<strong>17</strong>0,629 12,1<strong>17</strong>,687Total Non-current Liabilities 20,778,226 23,497,867 12,1<strong>17</strong>,687Total Liabilities 603,<strong>17</strong>2,331 560,025,664 589,490,506Forward
- 2 -Notes 2010 2009 2008EQUITYEquity attributable to ownersof the parent companyCapital stock 20 984,577,900 984,577,900 704,369,900Treasury stock 20 ( 3,733,100 ) ( 3,733,100 ) ( 3,733,100 )Accumulated fair value gains (losses) 7 7,857,562 ( 9,533,437 )1,233,243Retained earnings 20Appropriated 1,675,099,0<strong>17</strong> 975,099,0<strong>17</strong> 1,147,161,414Unappropriated 731,601,395 1,068,447,399 843,661,207Total equity attributable toowners of the parent company 3,395,402,774 3,014,857,779 2,692,692,664Non-controlling interest 440,033,414 314,945,011 295,973,<strong>17</strong>6Total Equity 3,835,436,188 3,329,802,790 2,988,665,840TOTAL LIABILITIES AND EQUITY P 4,438,608,519 P 3,889,828,454 P 3,578,156,346See Notes to Consolidated Financial Statements.
THE FAR EASTERN UNIVERSITY, INCORPORATED AND SUBSIDIARIESCONSOLIDATED STATEMENTS OF COMPREHENSIVE INCOMEFOR THE YEARS ENDED MARCH 31, 2010 AND 2009(With Comparative Figures for 2008)(Amounts in <strong>Philippine</strong> Pesos)2008Notes 2010 2009 (As Restated)REVENUESEducational income 14Tuition fees - net P 1,665,790,366 P 1,611,808,467 P 1,580,683,033Other school fees 35,257,665 50,280,810 33,146,5101,701,048,031 1,662,089,277 1,613,829,543Rental 10 58,772,878 50,437,726 41,289,534Sale of real estate 8 8,032,714 - -1,767,853,623 1,712,527,003 1,655,119,077COSTS AND OPERATING EXPENSES 15 1,208,484,789 1,166,169,195 1,077,236,959OPERATING PROFIT 559,368,834 546,357,808 577,882,118OTHER INCOME (CHARGES)Gain on sale of investment property 10 211,609,<strong>17</strong>0 - -Finance income 16 110,665,596 120,856,838 106,418,765Management fees 6 14,080,414 11,527,024 20,145,930Finance costs ( 3,482,984 )- ( 5,431,506 )Share in net losses of an associate 9 ( 53,987 ) ( 49,416 ) (24,732 )Others 12,208,533 13,597,675 2,362,837345,026,742 145,932,121 123,471,294PROFIT BEFORE PREACACQUISITIONINCOME AND TAX 904,395,576 692,289,929 701,353,412PREACQUISITION INCOME 1 - 3,999,262 -PROFIT BEFORE TAX 904,395,576 696,289,191 701,353,412TAX EXPENSE 18 126,699,737 86,995,739 87,546,984NET PROFIT 777,695,839 609,293,452 613,806,428OTHER COMPREHENSIVE INCOMEFair value gains (losses) 7 <strong>17</strong>,390,999 ( 8,016,082 )1,<strong>17</strong>6,093Reclassification to profit or loss - ( 2,750,598 ) ( 5,514,166 )<strong>17</strong>,390,999 ( 10,766,680 ) ( 4,338,073 )TOTAL COMPREHENSIVE INCOME P 795,086,838 P 598,526,772 P 609,468,355Net profit attributable to:Owners of the parent company P 657,407,436 P 585,200,755 P 600,693,262Non-controlling interest 120,288,403 24,092,697 13,113,166P 777,695,839 P 609,293,452 P 613,806,428Total comprehensive income attributable to:Owners of the parent company P 674,798,435 P 574,434,075 P 596,355,189Non-controlling interest 120,288,403 24,092,697 13,113,166P 795,086,838 P 598,526,772 P 609,468,355Earnings Per ShareBasic and Diluted 21 P 67.02 P 69.61 P 85.74See Notes to Consolidated Financial Statements.
THE FAR EASTERN UNIVERSITY, INCORPORATED AND SUBSIDIARIESCONSOLIDATED STATEMENTS OF CHANGES IN EQUITYFOR THE YEARS ENDED MARCH 31, 2010 AND 2009(With Comparative Figures for 2008)(Amounts in <strong>Philippine</strong> Pesos)Attributable to Owners of the Parent CompanyAccumulated FairRetained EarningsNon-controllingNotes Capital <strong>Stock</strong> Treasury <strong>Stock</strong> Value Gains (Losses) Appropriated Unappropriated Interest Total EquityBalance at April 1, 2009 P 984,577,900 ( P 3,733,100 ) ( P 9,533,437 ) P 975,099,0<strong>17</strong> P 1,068,447,399 P 314,945,011 P 3,329,802,790Comprehensive incomeNet profit for the year - - - - 657,407,436 120,288,403 777,695,839Fair value gains for the year 7 - - <strong>17</strong>,390,999 - - - <strong>17</strong>,390,999Total comprehensive income - - <strong>17</strong>,390,999 - 657,407,436 120,288,403 795,086,838Transactions with ownersAppropriations for the year 20 - - - 1,000,000,000 ( 1,000,000,000 )- -Reversal of appropriations during the year 20 - - - ( 300,000,000 )300,000,000 - -Cash dividends 20 - - - - ( 294,253,440 )- (294,253,440 )- - - 700,000,000 ( 994,253,440 )- (294,253,440 )Transaction with non-controlling interestIncrease in non-controlling interest 1 - - - - - 4,800,000 4,800,000Balance at March 31, 2010 P 984,577,900 ( P 3,733,100 ) P 7,857,562 P 1,675,099,0<strong>17</strong> P 731,601,395 P 440,033,414 P 3,835,436,188Balance at April 1, 2008 P 704,369,900 ( P 3,733,100 ) P 1,233,243 P 1,147,161,414 P 843,661,207 P 295,973,<strong>17</strong>6 P 2,988,665,840Comprehensive incomeNet profit for the year - - - - 585,200,755 24,092,697 609,293,452Fair value losses for the year 7 - - ( 8,016,082 )- - - (8,016,082 )Reclassification to profit or lossfor the year - - ( 2,750,598 )- - - (2,750,598 )Total comprehensive income - - ( 10,766,680 )- 585,200,755 24,092,697 598,526,772Transactions with ownersIssuance during the year 280,208,000 - - - - - 280,208,000Reversal of appropriations during the year 20 - - - ( <strong>17</strong>2,062,397 )<strong>17</strong>2,062,397 - -Cash dividends 20 - - - - ( 252,268,960 )- (252,268,960 )<strong>Stock</strong> dividends 20 - - - - ( 280,208,000 )- (280,208,000 )280,208,000 - - ( <strong>17</strong>2,062,397 ) ( 360,414,563 )- (252,268,960 )Transaction with non-controlling interestDecrease in non-controlling interest 1 - - - - - ( 5,120,862 ) (5,120,862 )Balance at March 31, 2009 P 984,577,900 ( P 3,733,100 ) ( P 9,533,437 ) P 975,099,0<strong>17</strong> P 1,068,447,399 P 314,945,011 P 3,329,802,790Balance at April 1, 2007As previously reported P 704,369,900 ( P 3,733,100 ) P 5,571,316 P 697,161,414 P 1,028,997,472 P 282,860,010 P 2,715,227,012Prior period adjustments - - - - ( 20,742,967 )- (20,742,967 )As restated 704,369,900 ( 3,733,100 )5,571,316 697,161,414 1,008,254,505 282,860,010 2,694,484,045Comprehensive incomeNet profit for the year - - - - 600,693,262 13,113,166 613,806,428Fair value gains for the year 7 - - 1,<strong>17</strong>6,093 - - - 1,<strong>17</strong>6,093Reclassification to profit or lossfor the year - - ( 5,514,166 )- - - (5,514,166 )Total comprehensive income - - ( 4,338,073 )- 600,693,262 13,113,166 609,468,355Transactions with ownersAppropriations for the year 20 - - - 450,000,000 ( 450,000,000 )- -Cash dividends 20 - - - - ( 315,286,560 )- (315,286,560 )- - - 450,000,000 ( 765,286,560 )- (315,286,560 )Balance at March 31, 2008 P 704,369,900 ( P 3,733,100 ) P 1,233,243 P 1,147,161,414 P 843,661,207 P 295,973,<strong>17</strong>6 P 2,988,665,840See Notes to Consolidated Financial Statements.
THE FAR EASTERN UNIVERSITY, INCORPORATED AND SUBSIDIARIESCONSOLIDATED STATEMENTS OF CASH FLOWSFOR THE YEARS ENDED MARCH 31, 2010 AND 2009(With Comparative Figures for 2008)(Amounts in <strong>Philippine</strong> Pesos)2008Notes 2010 2009 (As Restated)CASH FLOWS FROM OPERATING ACTIVITIESProfit before tax P 904,395,576 P 696,289,191 P 701,353,412Adjustments for:Gain on sale of investment property 10 ( 211,609,<strong>17</strong>0 )- -Interest income 16 ( 110,665,596 ) ( 1<strong>17</strong>,819,106 ) ( 106,418,765 )Depreciation 10, 11 58,378,201 52,944,002 46,899,496Unrealized foreign exchange losses (gains) 3,482,984 ( 3,037,732 )4,747,861Share in net losses of an associate 9 53,987 49,416 24,732Preacquisition income 1 - ( 3,999,262 )-Gain on disposal of property and equipment - ( 726,424 )-Loss on sale of investment - - 2,842,069Operating profit before working capital changes 644,035,982 623,700,085 649,448,805Increase in receivables ( 108,764,370 ) ( 16,276,113 ) ( 3,060,882 )Decrease in real estate held for sale 6,684,654 - 59,603,214Decrease (increase) in other assets ( 32,672,921 )31,588,975 ( 105,926,543 )Increase (decrease) in accounts payable and other liabilities <strong>17</strong>5,147,214 ( 13,086,542 )51,897,736Increase (decrease) in deferred income ( 73,839,642 )52,267,522 16,722,873Decrease in trust funds ( 14,519,891 ) ( <strong>17</strong>,671,581 ) ( 25,109,062 )Cash generated from operations 596,071,026 660,522,346 643,576,141Income taxes paid ( 87,960,278 ) ( 86,924,696 ) ( 78,126,826 )Net Cash From Operating Activities 508,110,748 573,597,650 565,449,315CASH FLOWS FROM INVESTING ACTIVITIESIncrease in loans receivable 6 ( 477,000,000 )- -Acquisitions of investment property 10 - ( 15,723,242 ) ( 96,147,971 )Acquisitions of property and equipment 11 ( 431,849,189 ) ( 147,865,321 ) ( 108,533,445 )Increase in available-for-sale investments - net 7 ( 134,594,195 ) ( 258,189,235 ) ( 13,871,477 )Interest received 108,937,577 109,929,197 87,525,308Proceeds from sale of investment property 10 100,000,000 - -Investment made to joint venture under registration 9 ( 6,250,000 )Proceeds from disposal of property and equipment - 726,424 -Decrease in held-to-maturity investments - 12,071,040 257,510Net Cash Used in Investing Activities ( 840,755,807 ) ( 299,051,137 ) ( 130,770,075 )CASH FLOWS FROM FINANCING ACTIVITIESDividends paid 20 ( 365,479,906 ) ( 309,875,665 ) ( 194,554,457 )Payment of notes payable 10 ( 3,103,359 ) ( 2,191,607 ) ( 1,753,954 )Net Cash Used in Financing Activities ( 368,583,265 ) ( 312,067,272 ) ( 196,308,411 )Effect of <strong>Exchange</strong> Rate Changeson Cash and Cash Equivalents ( 3,482,984 )3,037,732 ( 6,607,781 )NET INCREASE (DECREASE) INCASH AND CASH EQUIVALENTS ( 704,711,308 ) ( 34,483,027 )231,763,048CASH AND CASH EQUIVALENTSAT BEGINNING OF YEAR 1,<strong>17</strong>2,859,362 1,207,342,389 975,579,341CASH AND CASH EQUIVALENTSAT END OF YEAR P 468,148,054 P 1,<strong>17</strong>2,859,362 P 1,207,342,389Supplemental Information on Noncash Investing and Financing Activities:1) The <strong>University</strong> declared and issued stock dividends amounting to P280.2 million in 2009 (see Note 20).2) In 2010, 2009 and 2008, the <strong>University</strong> declared cash dividends totaling P294.3 million, P252.3 million and P315.3 million, respectively,of which P8.5 million, P24.6 million and P119.5 million, respectively, were not paid in the year of declarations (see Notes 12 and 20).3) In December 2009, Fern Realy Corporation (FRC) sold a parcel of land for a total consideration of P240 million. Of such amount, P140 millionwas unpaid as of March 31, 2010 (see Note 10).4) In September 2008, FRC acquired a condominium unit by applying the P6.7 million advance payments made to the developer and issuing apromissory note for P13.4 million for the remaining cost of the unit (see Note 10).See Notes to Consolidated Financial Statements.
THE FAR EASTERN UNIVERSITY, INCORPORATEDAND SUBSIDIARIESNOTES TO CONSOLIDATED FINANCIAL STATEMENTSMARCH 31, 2010 AND 2009(With Comparative Figures for 2008)(Amounts in <strong>Philippine</strong> Pesos)1. CORPORATE INFORMATIONThe <strong>Far</strong> <strong>Eastern</strong> <strong>University</strong>, Incorporated (the <strong>University</strong> or parent company) is adomestic educational institution founded in June of 1928 and incorporated onJanuary 5, 1933. The <strong>University</strong> was registered with the Securities and <strong>Exchange</strong>Commission (<strong>SEC</strong>) on March 7, 1940. As a private, non-sectarian institution oflearning comprising the following different institutes that offer specific courses,namely, Institute of Arts and Sciences; Institute of Accounts, Business and Finance;Institute of Education; Institute of Architecture and Fine Arts; Institute of Nursing;Institute of Engineering; Institute of Law; and Institute of Graduate Studies.The <strong>University</strong> became a listed corporation in the <strong>Philippine</strong> <strong>Stock</strong> <strong>Exchange</strong> onJuly 11, 1986.In 2010, the <strong>University</strong> established the FEU Makati Campus in Makati City(see Note 6). Also in November 2009, FEU entered into a Joint Venture (JV)Agreement to establish a joint venture company (JVC) for culinary arts. Theregistration of the JVC was approved by the <strong>SEC</strong> on May 7, 2010(see Notes 2.3 and 9).As of March 31, 2010, 2009 and 2008, the <strong>University</strong> holds interest in the followingsubsidiaries and associate which were all incorporated and operating in the<strong>Philippine</strong>s:Percentage of Effective OwnershipCompany Name 2010 2009 2008Subsidiaries:East Asia ComputerCenter, Inc. (EACCI) 100% 100% 100%<strong>Far</strong> <strong>Eastern</strong> College-Silang,Inc. (FECSI) 100% 100% -Fern Realty Corporation (FRC) 37.52% 37.52% 36.73%TMC – FRC Sports Performanceand Physical MedicineCenter, Inc. (SPARC) 22.51% - -Associate –Juliana Management Co.,Inc. (JMCI) 49% 49% 49%
- 2 -FECSI was incorporated on January 21, 2009 but has not yet started commercialoperations as of March 31, 2010. FECSI and EACCI, similar to the <strong>University</strong>, werealso established to operate as educational institutions.FRC, on the other hand, operates as a real estate company leasing most of itsinvestment properties to the <strong>University</strong> and other related parties. In 2009, FEU madeadditional investment to FRC which resulted in 37.52% ownership interest,recognition of preacquisition income and decrease in non-controlling interest. FRCacquired 60% equity ownership interest over SPARC which is engaged in the businessof organizing, owning, operating, managing and maintaining a sports facility for therehabilitation and sports performance enhancement within the <strong>Philippine</strong>s.The parent company and its subsidiaries are collectively referred to as the Group.Although the <strong>University</strong> controls less than 50% of the voting shares of stock of FRC,it has the power to govern the financial and operating policies of the said entity. Also,the <strong>University</strong> has the power to cast the majority of votes at meetings of the board ofdirectors and elect officers of FRC. Accordingly, FRC is recognized as a subsidiary ofthe <strong>University</strong>.The registered office address and principal place of business of the <strong>University</strong> islocated at Nicanor Reyes Sr. Street, Sampaloc, Manila.The consolidated financial statements of the Group for the year endedMarch 31, 2010 (including the comparatives for the years ended March 31, 2009 and2008) were authorized for issue by the Board of Trustees (BOT) on July 6, 2010.2. SUMMARY OF SIGNIFICANT ACCOUNTING POLICIESThe significant accounting policies that have been used in the preparation of theseconsolidated financial statements are summarized below. These policies have beenconsistently applied to all the years presented, unless otherwise stated.2.1 Basis of Preparation of Consolidated Financial Statements(a)Statement of Compliance with <strong>Philippine</strong> Financial Reporting StandardsThe consolidated financial statements of the Group have been prepared inaccordance with <strong>Philippine</strong> Financial Reporting Standards (PFRS). PFRS areadopted by the Financial Reporting Standards Council (FRSC) from thepronouncements issued by the International Accounting Standards Board.The consolidated financial statements have been prepared using themeasurement bases specified by PFRS for each type of asset, liability, incomeand expense. These consolidated financial statements have been prepared onthe historical cost basis, except for the revaluation of certain financial assets.The measurement bases are more fully described in the accounting policies thatfollow.
- 3 -(b)Presentation of Consolidated Financial StatementsThe consolidated financial statements are presented in accordance with<strong>Philippine</strong> Accounting Standard (PAS) 1 (Revised 2007), Presentation of FinancialStatements. The Group presents all items of income and expenses in a singlestatement of comprehensive income. Two comparative periods are presentedfor the consolidated statement of financial position when the <strong>University</strong> appliesan accounting policy retrospectively, makes a retrospective restatement of itemsin its financial statements, or reclassifies items in the financial statements.The reclassification of construction in progress from Property andEquipment to Investment Property account in 2010 (see Notes 10 and 11) isdue to FRC’s adoption of the improvements on PAS 40, Investment Property[see Note 2.2 (a)(v)]. Such improvement requires a prospective treatment of thechange in classification of construction in progress. On the other hand, thereclassification from Real Estate Held for Sale of the parcels of land exchangedwith another real estate company (see Notes 8 and 11) requires retrospectivetreatment. Accordingly, the 2008 consolidated statement of financial position isalso presented.There are other accounts in 2009 and 2008 consolidated financial statementsthat were reclassified to conform with the 2010 financial statement presentation.(c)Functional CurrencyThese consolidated financial statements are presented in <strong>Philippine</strong> pesos, the<strong>University</strong>’s functional currency, and all values represent absolute amountsexcept when otherwise indicated.Items included in the consolidated financial statements of the <strong>University</strong> aremeasured using the currency of the primary economic environment in which theentity operates (the functional currency).2.2 Adoption of New Interpretations, Revisions and Amendments to PFRS(a)Effective in fiscal year 2010 that are relevant to the <strong>University</strong>In 2010, the <strong>University</strong> adopted the following new revisions and amendments toPFRS that are relevant to the <strong>University</strong> and effective for financial statementsfor the annual period beginning on or after January 1, 2009:PAS 1 (Revised 2007) : Presentation of Financial StatementsPAS 23 (Revised 2007) : Borrowing CostsPFRS 7 (Amendment) : Financial Instruments: DisclosuresPFRS 8 : Operating SegmentsVarious Standards : 2008 Annual Improvements to PFRS
- 4 -Discussed below are the effects on the financial statements of the new andamended standards.(i) PAS 1 (Revised 2007), Presentation of Financial Statements, requires an entity topresent all items of income and expense recognized in the period in a singlestatement of comprehensive income or in two statements: a separatestatement of income and a statement of comprehensive income. Incomeand expense recognized in profit or loss is presented in the statement ofincome in the same way as the previous version of PAS 1. The statement ofcomprehensive income includes the profit or loss for the period and eachcomponent of income and expense recognized outside of profit or loss orthe “non-owner changes in equity”, which are no longer allowed to bepresented in the statements of changes in equity, classified by nature(e.g., gains or losses on available-for-sale assets or translation differencesrelated to foreign operations). A statement showing an entity’s financialposition at the beginning of the previous period is also required when theentity retrospectively applies an accounting policy or makes a retrospectiverestatement, or when it reclassifies items in its financial statements.The Group’s adoption of PAS 1 (Revised 2007) did not result in anymaterial adjustments in its consolidated financial statements as the change inaccounting policy only affects presentation aspects. Two comparativeperiods are presented for the consolidated statement of financial positionsince the <strong>University</strong> and FRC reclassified certain items in the consolidatedfinancial statements (see Note 2.1 [b]). The Group has elected to present asingle consolidated statement of comprehensive income (see Note 2.1).(ii) PAS 23 (Revised 2007), Borrowing Costs. Under the revised PAS 23, allborrowing costs that are directly attributable to the acquisition, constructionor production of a qualifying asset shall be capitalized as part of the cost ofthe asset. The option of immediately expensing borrowing costs that qualifyfor asset recognition has been removed. The adoption of this new standardhad no significant effect on the 2010 consolidated financial statements, aswell as for prior period and future periods, as the Group’s currentaccounting policy is to capitalize interest directly related to qualifying assets.(iii) PFRS 7 (Amendment), Financial Instruments Disclosures. The amendmentrequires additional disclosures for financial instruments that are measured atfair value in the statement of financial position. These fair valuemeasurements are categorized into a three-level fair value hierarchy, whichreflects the extent to which they are based on observable market data. Aseparate quantitative maturity analysis must be presented for derivativefinancial liabilities that shows the remaining contractual maturities, wherethese are essential for an understanding of the timing of cash flows. Thechange in accounting policy only results in additional disclosures(see Note 24.2).
- 5 -(iv) PFRS 8, Operating Segments. Under this new standard, a reportable operatingsegment is identified based on the information about the components of theentity that management uses to make decisions about the operating matters.In addition, segment assets, liabilities, and performance, as well as certaindisclosures, are to be measured and presented based on the internal reportsprepared for and reviewed by the chief decision makers. The Groupidentifies operating segments and reports on segments assets, liabilities, andperformance based on internal management reports, hence, adoption of thisnew standard did not have an impact on the Group’s consolidated financialstatements.(v) 2008 Annual Improvements to PFRS. The FRSC has adopted theImprovements to PFRS 2008 which became effective for the annual periodsbeginning on or after January 1, 2009. Among those improvements, thefollowing are the amendments relevant to the Group:• PAS 16 (Amendment), Property, Plant and Equipment and consequentialamendment to PAS 7, Statement of Cash Flows. The amendment clarifiesthat an entity in the course of ordinary activities, sells property, plantand equipment that was held for rental transfers the property, plant andequipment to inventories at carrying amount when they ceased to berented and are held for sale. A consequential amendment to PAS 7states that cash flows arising from purchase, rental and sale of thoseassets are classified as cash flows from operating activities. Also, theterm “net selling price” has been replaced with “fair value less cost tosell” in the definition of recoverable amount so as to achieveconsistency with the terminology used in PFRS 5. This amendment didnot result in any significant adjustment on the 2010 consolidatedfinancial statements.• PAS 23 (Amendment), Borrowing Costs. The amendment clarifies thedefinition of borrowing costs to include interest expense determinedusing the effective interest method under PAS 39. This amendment hadno material effect on the 2010 consolidated financial statements.• PAS 36 (Amendment), Impairment of Assets. Where fair value less cost tosell is calculated on the basis of discounted cash flows, disclosuresequivalent to those for value-in-use calculation should be made. Theamendment had no significant impact on the 2010 consolidated financialstatements since in 2010, fair values of non-financial assets were notcalculated on the basis of discounted cash flows.• PAS 40 (Amendment), Investment Property. PAS 40 is amended to includeproperty under construction or development for future use asinvestment property in its definition of investment property. Thisresults in such property being within the scope of PAS 40; previously, itwas within the scope of PAS 16. Also, if an entity’s policy is to measureinvestment property at fair value, but during construction ordevelopment of an investment property the entity is unable to reliablymeasure its fair value, then the entity would be permitted to measure theinvestment property at cost until construction or development iscomplete. At such time, the entity would be able to measure the
- 6 -investment property at fair value. The adoption of this amendmentresulted in the reclassification from Property and Equipment toInvestment Property account of certain properties under construction inthe 2010 consolidated financial statements (see Notes 10 and 11).(b)Effective in fiscal year 2010 but not relevant to the <strong>University</strong>The following amendments, interpretations and improvements to publishedstandards are mandatory for accounting periods beginning on or afterJanuary 1, 2009 but are not relevant to the Group’s consolidated financialstatements:PAS 32 and PAS 1(Amendments) : Financial Instruments: Presentationand Presentation of FinancialStatements – Puttable FinancialInstruments and ObligationsArising on LiquidationPFRS 1 and PAS 27(Amendments) : PFRS 1 – First Time Adoption of PFRSand PAS 27 – Consolidated andSeparate Financial StatementsPFRS 2 (Amendment) : Share-based Payment<strong>Philippine</strong> InterpretationsIFRIC 13 : Customer Loyalty ProgrammesIFRIC 16 : Hedges of a Net Investment in aForeign Operation(c) Effective subsequent to fiscal year 2010There are new PFRS, revisions, amendments, annual improvements andinterpretations to existing standards that are effective for periods subsequent to2010. Among those pronouncements, management has initially determined thefollowing, which the Group will apply in accordance with their transitionalprovisions, to be relevant to its consolidated financial statements:(i) PAS 27 (Revised), Consolidated and Separate Financial Statements (effective fromJuly 1, 2009). The revised standard requires the effects of all transactionswith non-controlling interests to be recorded in equity if there is no changein control and these transactions will no longer result in goodwill or gainsand losses. The standard also specifies the accounting when control is lost.Any remaining interest in the equity is re-measured to fair value, and a gainor loss is recognized in profit or loss. The Group will apply this revisedstandard prospectively from April 1, 2010 to all transactions withnon-controlling interests.
- 7 -(ii) PFRS 3 (Revised), Business Combinations (effective from July 1, 2009). Therevised standard continues to apply the acquisition method to businesscombinations, with some significant changes. For example, all payments topurchase a business are to be recorded at fair value at the acquisition date,with contingent payments classified as debt subsequently re-measuredthrough profit or loss. There is a choice on an acquisition-by-acquisitionbasis to measure the non-controlling interest in the acquiree either at fairvalue or at the non-controlling interest’s proportionate share of theacquiree’s net assets. All acquisition related costs should be expensed.The Group will apply PFRS 3 (Revised) prospectively to all businesscombinations from April 1, 2010, if any.(iii) <strong>Philippine</strong> Interpretation IFRIC <strong>17</strong>, Distribution of Non-cash Assets to Owners(effective from July 1, 2009). IFRIC <strong>17</strong> clarifies that a dividend payableshould be recognized when the dividend is appropriately authorized and isno longer at the discretion of the entity. Also, an entity should measure thedividend payable at the fair value of the net assets to be distributed and thedifference between the dividend paid and the carrying amount of the netassets distributed in profit or loss. The Group will apply the interpretationprospectively starting April 1, 2010.(iv) <strong>Philippine</strong> Interpretation IFRIC 19, Extinguishing Financial Liabilities withEquity Instruments (effective from July 1, 2010). It addresses accounting byan entity when the terms of a financial liability are renegotiated and result inthe entity issuing equity instruments to a creditor to extinguish all or part ofthe financial liability. These transactions are sometimes referred to as “debtfor equity” exchanges or swaps, and have happened with increased regularityduring the financial crisis. The interpretation requires the debtor to accountfor a financial liability which is extinguished by equity instruments asfollows:• the issue of equity instruments to a creditor to extinguish all (or part of afinancial liability) is consideration paid in accordance with PAS 39;• the entity measures the equity instruments issued at fair value, unless thiscannot be reliably measured;• if the fair value of the equity instruments cannot be reliably measured,then the fair value of the financial liability extinguished is used; and,• the difference between the carrying amount of the financial liabilityextinguished and the consideration paid is recognized in profit or loss.Management has determined that the adoption of the interpretation will nothave any material effect on its consolidated financial statements as it doesnot normally extinguish financial liabilities through equity swap.
- 8 -(v) <strong>Philippine</strong> Interpretation IFRIC 15, Agreement for the Construction of Real Estate(effective from January 1, 2012). This interpretation provides guidance onhow to determine whether an agreement for the construction of real estateis within the scope of PAS 11, Construction Contracts, or PAS 18, Revenue, andaccordingly, when revenue from construction should be recognized. It islikely to result in PAS 18 being applied to a wider range of transactions.IFRIC 15 is not expected to have a significant effect on the Group’soperations as all real estate transactions of FRC are accounted for underPAS 18.(vi) 2009 Annual Improvements to PFRS. The FRSC has adopted theImprovements to PFRS 2009. Most of these amendments became effective forannual periods beginning on or after July 1, 2009, or January 1, 2010.Among those improvements, only the following amendments wereidentified to be relevant to the Group’s consolidated financial statements:• PAS 1 (Amendment), Presentation of Financial Statements (effective fromJanuary 1, 2010). The amendment clarifies the current and non-currentclassification of a liability that can, at the option of the counterparty, besettled by the issue of the entity’s equity instruments. The Group willapply the amendment in its 2011 consolidated financial statements butexpects it to have no material impact on the consolidated financialstatements.• PAS 7 (Amendment), Statement of Cash Flows (effective from January 1,2010). The amendment clarifies that only an expenditure that results ina recognized asset can be classified as a cash flow from investingactivities. The amendment will not have a material impact on theconsolidated financial statements since only recognized assets areclassified by the Group as cash flow from investing activities.• PAS <strong>17</strong> (Amendment), Leases (effective from January 1, 2010). Theamendment clarifies that when a lease includes both land and buildingelements, an entity assesses the classification of each element as financeor an operating lease separately in accordance with the general guidanceon lease classification set out in PAS <strong>17</strong>. Management has initiallydetermined that this will not have material impact on the consolidatedfinancial statements since the Group’s lease agreements for both landand buildings are separately classified as operating leases.• PAS 36 (Amendment), Impairment of Assets (effective fromJanuary 1, 2010). PAS 36 clarifies that the largest unit permitted for thepurpose of allocating goodwill to cash-generating units for goodwillimpairment is the operating segment level defined in PFRS 8 beforeaggregation. This amendment will not have material impact on theGroup’s consolidated financial statements.
- 9 -(vii) PFRS 9, Financial Instruments (effective from January 1, 2013). PFRS 9 is thefirst part of Phase 1 of the project to replace PAS 39, Financial Instruments:Recognition and Measurement, in its entirety by the end of 2010. The mainphases are (with a separate project dealing with recognition):o Phase 1: Classification and Measuremento Phase 2: Impairment Methodologyo Phase 3: Hedge AccountingPFRS 9 introduces major simplifications of the classification andmeasurement provisions under PAS 39. These include reduction from fourmeasurement categories into two categories, i.e. fair value and amortizedcost, and from several impairment methods into one method.Management is yet to assess the impact that this amendment is likely to haveon the consolidated financial statements of the Group. However, it doesnot expect to implement the amendments until fiscal year 2014 when allchapters of the PAS 39 replacement have been published at which time theGroup expects it can comprehensively assess the impact of the revisedstandard.2.3 Consolidated Financial Statements and Investment in an AssociateThe consolidated financial statements comprise the financial statements of the<strong>University</strong> and its subsidiaries as of March 31, 2010, 2009 and 2008 and for each ofthe three years in the period ended March 31, 2010. The financial statements ofsubsidiaries are prepared for the same reporting year, except for EACCI whose fiscalyear ends at April 30, as the <strong>University</strong> using consistent accounting policies. Amountsreported in the financial statements of subsidiaries and associate have been adjustedwhere necessary to ensure consistency with the accounting policies adopted by theGroup.All intercompany balances and transactions with subsidiaries, including unrealizedgains and losses arising from intercompany transactions, have been eliminated in fullin consolidation. Intercompany losses, if any, that indicate impairment are recognizedin the consolidated financial statements.The Group accounts for its investment in subsidiaries, associate and non-controllinginterests as follows:(a) Investments in SubsidiariesSubsidiaries are all entities over which the <strong>University</strong> has the power to control thefinancial and operating policies. The <strong>University</strong> obtains and exercises controlthrough voting rights.Subsidiaries are consolidated from the date the <strong>University</strong> obtains control untilsuch time that such control ceases.
- 10 -Acquired subsidiaries are subject to application of the purchase method foracquisitions. This involves the revaluation at fair value of all identifiable assetsand liabilities, including contingent liabilities of the subsidiary, at the acquisitiondate, regardless of whether or not they were recorded in the financial statementsof the subsidiary prior to acquisition. On initial recognition, the assets andliabilities of the subsidiary are included in the consolidated statement of financialposition at their fair values, which are also used as the bases for subsequentmeasurement in accordance with the Group’s accounting policies.Goodwill represents the excess of the cost of an acquisition of a subsidiary orassociate over the fair value of the Group’s share of the net identifiable assets ofthe acquired subsidiary or associate at the date of acquisition. Currently, due toimmateriality, goodwill on acquisition of subsidiaries is presented as part ofOther Non-current Assets in the consolidated statement of financial position.Goodwill on acquisitions of associates is included in the carrying value ofinvestments in associates. Goodwill is tested annually for impairment(see Note 2.13).(b) Investment in an AssociateAssociate is an entity over which the Group is able to exercise significantinfluence but which is neither a subsidiary nor interest in a joint venture.Investments in associate is initially recognized at cost and subsequently accountedfor using the equity method.Acquired investment in associate is also subject to purchase accounting.However, any goodwill or fair value adjustment attributable to the share in theassociate is included in the amount recognized as investment in associate. Allsubsequent changes to the share in the equity of the associate are recognized inthe carrying amount of the Group’s investment. Changes resulting from theprofit or loss generated by the associate are reported as Equity in Net Losses ofan Associate in the Group’s consolidated statement of comprehensive income andtherefore affect the net results of operations of the Group.In computing the Group’s share in net earnings or losses of its associate,unrealized gains or losses on transactions between the Group and its associate areeliminated to the extent of the Group’s interest in the associate. Where unrealizedlosses are eliminated, the underlying asset is also tested for impairment from agroup perspective.(c) Transactions with Non-controlling InterestsThe Group applies a policy of treating transactions with non-controlling interestsas transactions with parties external to the Group. Disposals of equityinvestments to non-controlling interests result in gains and losses for the Groupthat are recorded in the consolidated statement of comprehensive income.Purchases of equity shares from non-controlling interests may result in goodwill,being the difference between any consideration paid and the relevant shareacquired of the carrying value of net assets of the subsidiary.
- 11 -As of March 31, 2010, the registration of the <strong>University</strong>’s joint venture with PHICulinary Arts and Food Services, Inc. is pending approval by the <strong>SEC</strong>. Accordingly,investment made to the joint venture is included in Investment in an Associateaccount as Advances to Joint Venture under Registration. Joint venture is an entitywhose economic activities are controlled jointly by the venturers.2.4 Financial AssetsFinancial assets include cash and other financial instruments. Financial assets, otherthan hedging instruments, are classified into the following categories: financial assetsat fair value through profit or loss, loans and receivables, held-to-maturity investmentsand available-for-sale financial assets. Financial assets are assigned to the differentcategories by management on initial recognition, depending on the purpose for whichthe investments were acquired. The designation of financial assets is re-evaluated atevery reporting date at which date a choice of classification or accounting treatment isavailable, subject to compliance with specific provisions of applicable accountingstandards.Regular purchase and sales of financial assets are recognized on their trade date. Allfinancial assets that are not classified as at fair value through profit or loss are initiallyrecognized at fair value, plus transaction costs. Financial assets carried at fair valuethrough profit or loss are initially recognized at fair value and transaction costs arerecognized directly in profit or loss in the consolidated statement of comprehensiveincome.Currently, the Group’s financial instruments are categorized as follows:(a)Loans and ReceivablesLoans and receivables are non-derivative financial assets with fixed ordeterminable payments that are not quoted in an active market. They arisewhen the Group provides money, goods or services directly to a debtor with nointention of trading the receivables. They are included in current assets whentheir maturity is within 12 months after the reporting period.Loans and receivables are subsequently measured at amortized cost using theeffective interest method, less any impairment loss. Any change in their value isrecognized in profit or loss. Impairment loss is provided when there isobjective evidence that the Group will not be able to collect all amounts due toit in accordance with the original terms of the receivables. The amount of theimpairment loss is determined as the difference between the assets’ carryingamount and the present value of estimated cash flows.The Group’s financial assets categorized as loans and receivables are presentedas Cash and Cash Equivalents, Receivables and Other Current Assets, to theextent of the restricted cash and cash equivalents included therein, in theconsolidated statement of financial position.Cash and cash equivalents are defined as cash on hand, demand deposits andshort-term, highly liquid investments readily convertible to known amounts ofcash and which are subject to insignificant risk of changes in value.
- 12 -(b)Held-to-maturity InvestmentsThis includes non-derivative financial assets with fixed or determinablepayments and a fixed date of maturity. Investments are classified asheld-to maturity if the Group has the positive intention and ability to hold themuntil maturity which is presented as Held-to-maturity Investments in thenon-current section of the consolidated statement of financial position, exceptthose maturing within 12 months from the reporting period which are presentedas part of current assets. Investments intended to be held for an undefinedperiod are not included in this classification.Held-to-maturity investments are measured at amortized cost using the effectiveinterest method. In addition, if there is objective evidence that the investmenthas been impaired, the financial asset is measured at the present value ofestimated cash flows. Changes to the carrying amount of the investment arerecognized in profit or loss.(c)Available-for-sale Financial AssetsThis include non-derivative financial assets that are either designated to thiscategory or do not qualify for inclusion in any of the other categories offinancial assets. These are presented as Available-for-sale Investments in thenon-current section of the consolidated statement of financial position unlessmanagement intends to dispose of the investment within 12 months from thereporting period.All financial assets within this category are subsequently measured at fair value,unless otherwise disclosed, with changes in value recognized in othercomprehensive income, net of any effects arising from income taxes. When theasset is disposed of or is determined to be impaired the cumulative gain or lossrecognized in other comprehensive income is reclassified from revaluationreserve to profit or loss and presented as a reclassification adjustment withinother comprehensive income.Reversal of impairment loss is recognized in other comprehensive income,except for financial assets that are debt securities which are recognized in profitor loss only if the reversal can be objectively related to an event occurring afterthe impairment loss was recognized.Impairment losses, except those pertaining to tuition and other fees receivables whichare presented under Operating Expenses, recognized on financial assets are presentedas part of Finance Costs in the consolidated statement of comprehensive income.For investments that are actively traded in organized financial markets, fair value isdetermined by reference to stock exchange-quoted market bid prices at the close ofbusiness on the reporting period. For investments where there is no quoted marketprice, fair value is determined by reference to the current market value of anotherinstrument which is substantially the same or is calculated based on the expected cashflows (such as dividend income) of the underlying net asset base of the investment.
- 13 -Non-compounding interest, dividend income and other cash flows resulting fromholding financial assets are recognized in profit or loss when earned, regardless ofhow the related carrying amount of financial assets is measured. All income andexpense relating to financial assets recognized in profit or loss are presented in theconsolidated statement of comprehensive income line item Finance Income andFinance Costs, respectively.Derecognition of financial assets occurs when the rights to receive cash flows fromthe financial instruments expire or are transferred and substantially all of the risks andrewards of ownership have been transferred.2.5 Real Estate Held for SaleAcquisition costs of raw land intended for future development by FRC, includingother costs and expenses incurred to effect the transfer of title of the property as wellas related property development costs are accumulated in this account.Real estate held for sale is carried at the lower of cost and net realizable value. Netrealizable value is the estimated selling price in the ordinary course of business, lessestimated costs to complete and the estimated costs necessary to make the sale.Real estate held for sale is expected to be sold within 2 to 10 years from the time ofacquisition, which is considered as the normal operating cycle of FRC with respect toits development and sale of real estate properties.2.6 Property and EquipmentExcept for land, which is stated at cost less any impairment in value, property andequipment are stated at cost less accumulated depreciation and amortization, andimpairment in value, if any.The cost of an asset comprises its purchase price and directly attributable costs ofbringing the asset to working condition for its intended use. Expenditures foradditions, major improvements and renewals are capitalized; expenditures for repairsand maintenance are charged to expense as incurred. When assets are sold, retired orotherwise disposed of, their cost and related accumulated depreciation andimpairment losses are removed from the accounts and any resulting gain or loss isreflected in income for the period.Depreciation is computed on the straight-line basis over the estimated useful lives ofthe assets as follows:Building and improvementsFurniture and equipmentMiscellaneous equipment20 years3-6 years5 yearsConstruction in progress represents properties under construction and is stated atcost. This includes cost of construction, applicable borrowing cost and other directcosts (see Note 2.16). The account is not depreciated until such time that the assetsare completed and available for use.
- 14 -An asset’s carrying amount is written down immediately to its recoverableamount if the asset’s carrying amount is greater than its estimated recoverable amount(see Note 2.13).The residual values and estimated useful lives of property and equipment arereviewed, and adjusted if appropriate, at the end of each reporting period.An item of property and equipment is derecognized upon disposal or when no futureeconomic benefits are expected to arise from the continued use of the asset. Any gainor loss arising on derecognition of the asset (calculated as the difference between thenet disposal proceeds and the carrying amount of the item) is included in profit orloss in the year the item is derecognized.2.7 Investment PropertyInvestment property is measured initially at acquisition cost. Subsequently,investment property, except land which is carried at cost less impairment in value, ifany, is carried at cost less accumulated depreciation and any impairment in value.Depreciation is computed on a straight line basis over the estimated useful lives of theassets as follows:Building and improvementsLand improvements20 to 50 years5 yearsAn investment property’s carrying amount is written down immediately to itsrecoverable amount if the property’s carrying amount is greater than its estimatedrecoverable amount (see Note 2.13).Investment property is derecognized upon disposal or when permanently withdrawnfrom use and no future economic benefit is expected from its disposal. Any gain orloss on the retirement or disposal of an investment property is recognized in profit orloss in the year of retirement or disposal.Transfer is made to investment property when, and only when, there is a change inuse, evidenced by the end of owner-occupation, commencement of an operating leaseto another party or by the end of construction or development. Transfer is madefrom investment property when and only when, there is a change in use, evidenced bycommencement of the owner-occupation or commencement of development with aview to sell.2.8 Financial LiabilitiesThe Group’s financial liabilities include accounts payable and other liabilities andnotes payable, which are measured at amortized cost using the effective interest ratemethod.Financial liabilities are recognized when the Group becomes a party to the contractualagreements of the instrument. All interest related charges are recognized as anexpense in profit or loss under the caption Finance Costs in the consolidatedstatement of comprehensive income.
- 15 -The liabilities are initially recognized at their fair value and subsequently measured atamortized cost less settlement payments.Financial liabilities are derecognized from the consolidated statement of financialposition only when the obligations are extinguished either through discharge,cancellation or expiration.2.9 ProvisionsProvisions are recognized when present obligations will probably lead to an outflowof economic resources and they can be estimated reliably even if the timing or amountof the outflow may still be uncertain. A present obligation arises from the presence ofa legal or constructive commitment that has resulted from past events.Provisions are measured at the estimated expenditure required to settle the presentobligation, based on the most reliable evidence available at the end of the reportingperiod, including the risks and uncertainties associated with the present obligation.Where there are a number of similar obligations, the likelihood that an outflow will berequired in settlement is determined by considering the class of obligations as a whole.When time value of money is material, long term-provisions are discounted to theirpresent values using a pretax rate that reflects market assessments and the risksspecific to the obligation. Provisions are reviewed at the end of each reporting periodand adjusted to reflect the current best estimate.In those cases where the possible outflow of economic resource as a result of presentobligations is considered improbable or remote, or the amount to be provided forcannot be measured reliably, no liability is recognized in the consolidated financialstatements. Similarly, possible inflows of economic benefits to the Group that do notyet meet the recognition criteria of an asset are considered contingent assets, hence,are not recognized in the consolidated financial statements. On the other hand, anyreimbursement that the Group can be virtually certain to collect from a third partywith respect to the obligation is recognized as a separate asset not exceeding theamount of the related provision.2.10 Revenue and Expense RecognitionRevenue is recognized to the extent that the revenue can be reliably measured, it isprobable that the economic benefits will flow to the Group, and the costs incurred orto be incurred can be measured reliably. In addition, the following specificrecognition criteria must also be met before revenue is recognized:(a) Tuition and Other School Fees – Revenue is recognized in profit or loss over thecorresponding school term. Tuition received in advance and applicable to aschool term after the reporting period is not recognized in profit or loss until thenext reporting period (see also Note 14).(b) Sale of Real Estate – Revenue is recognized when the earning process is virtuallycomplete and collectibility of the entire sales price is reasonably assured.(c)Management Fees – Revenue is recognized on monthly basis upon rendering of theservices.
- 16 -(d) Rental – Revenue is recognized in profit or loss over the term of the lease usingthe straight-line method, and in certain cases, the amount determined usingstraight-line method or amount determined using a certain percentage of thelessee’s gross annual revenue whichever is higher. Rent received in advance isrecorded as Deferred Income in the consolidated statement of financial positionand transferred to Rental revenue when earned.(e)Interest – Income is recognized as the interest accrues taking into account theeffective yield on the asset.Revenue is measured by reference to the fair value of consideration received orreceivable by the Group for services rendered, excluding value-added tax (VAT) andtrade discounts.Cost and expenses are recognized in profit or loss upon receipt of goods, utilizationof services or at the date they are incurred. All finance costs are reported in profit orloss on the accrual basis.2.11 LeasesThe Group accounts for its leases as follows:(a)Group as LesseeLeases which do not transfer to the Group substantially all the risks and benefitsof ownership of the asset are classified as operating leases. Operating leasepayments are recognized as expense in profit or loss in the consolidatedstatement of comprehensive income on a straight-line basis over the lease term.Associated costs, such as maintenance and insurance, are expensed as incurred.(b)Group as LessorLeases which do not transfer to the lessee substantially all the risks and benefitsof ownership of the asset are classified as operating leases. Lease income fromoperating leases is recognized in profit or loss in the consolidated statement ofcomprehensive income on a straight-line basis over the lease term.The Group determines whether an arrangement is, or contains a lease based on thesubstance of the arrangement. It makes an assessment of whether the fulfillment ofthe arrangement is dependent on the use of a specific asset or assets and thearrangement conveys a right to use the asset.2.12 Foreign Currency TransactionsThe accounting records of the Group are maintained in <strong>Philippine</strong> pesos. Foreigncurrency transactions during the year are translated into the functional currency atexchange rates which approximate those prevailing on transaction dates.Foreign currency gains and losses resulting from the settlement of such transactionsand from the translation at year-end exchange rates of monetary assets and liabilitiesdenominated in foreign currencies are recognized in the consolidated statement ofcomprehensive income as part of income or loss from operations.
- <strong>17</strong> -2.13 Impairment of Non-financial AssetsThe Group’s investment in an associate, property and equipment, investmentproperty and certain other non-current assets are subject to impairment testing. Allother individual assets or cash-generating units are tested for impairment wheneverevents or changes in circumstances indicate that the carrying amount may not berecoverable.For purposes of assessing impairment, assets are grouped at the lowest levels forwhich there are separately identifiable cash flows (cash-generating units). As a result,some assets are tested individually for impairment and some are tested atcash-generating unit level.An impairment loss is recognized for the amount by which the asset orcash-generating unit’s carrying amount exceeds its recoverable amount. Therecoverable amount is the higher of fair value, reflecting market conditions less coststo sell, and value in use, based on an internal evaluation of discounted cash flow.Impairment loss is charged pro-rata to the other assets in the cash-generating unit.All assets are subsequently reassessed for indications that an impairment losspreviously recognized may no longer exist and the carrying amount of the asset isadjusted to the recoverable amount resulting in the reversal of the impairment loss.2.14 Employee Benefits(a)Post-employment BenefitsPost-employment benefits are provided to employees through a defined contributionplan.A defined contribution plan is a pension plan under which the Group pays fixedcontributions into an independent entity. The Group has no legal or constructiveobligations to pay further contributions after payment of the fixed contribution. Thecontributions recognized in respect of defined contribution plans are expensed as theyfall due. Liabilities and assets may be recognized if underpayment or prepayment hasoccurred and are included in current liabilities or current assets as they are normally ofa short term nature.(b)Termination BenefitsTermination benefits are payable when employment is terminated by the Groupbefore the normal retirement date, or whenever an employee accepts voluntaryredundancy in exchange for these benefits. The Group recognizes terminationbenefits when it is demonstrably committed to either: (a) terminating the employmentof current employees according to a detailed formal plan without possibility ofwithdrawal; or (b) providing termination benefits as a result of an offer made toencourage voluntary redundancy. Benefits falling due more than 12 months after thereporting period are discounted to present value.
- 18 -(c)Compensated AbsencesCompensated absences are recognized for the number of paid leave days (includingholiday entitlement) remaining at the end of the reporting period. They are includedin Accounts Payable and Other Liabilities account at the undiscounted amount thatthe Group expects to pay as a result of the unused entitlement.2.15 Trust FundsThis represents restricted funds of the <strong>University</strong> that are intended for studentwelfare, development, loan, assistance and scholarship fund, and for other specificeducational purposes. The <strong>University</strong> administers the use of these funds based on thespecific purpose such funds are identified with.2.16 Borrowing CostsBorrowing costs are recognized as expenses in the period in which they are incurred,except to the extent that they are capitalized. Borrowing costs that are attributable tothe acquisition, construction or production of a qualifying asset (i.e., an asset thattakes a substantial period of time to get ready for its intended use or sale) arecapitalized as part of cost of such asset. The capitalization of borrowing costscommences when expenditures for the asset and borrowing costs are being incurredand activities that are necessary to prepare the asset for its intended use or sale are inprogress. Capitalization ceases when substantially all such activities are complete.2.<strong>17</strong> Income TaxesTax expense recognized in profit or loss comprises the sum of deferred tax andcurrent tax not recognized in other comprehensive income or directly in equity, if any.Current tax assets or liabilities comprise those claims from, or obligations to, fiscalauthorities relating to the current or prior reporting period, that are uncollected orunpaid at the end of the reporting period. They are calculated according to the taxrates and tax laws applicable to the fiscal periods to which they relate, based on thetaxable profit for the year. All changes to current tax assets or liabilities arerecognized as a component of tax expense in profit or loss.Deferred tax is provided, using the liability method on temporary differences at theend of the reporting period between the tax base of assets and liabilities and theircarrying amounts for financial reporting purposes. Under the liability method, withcertain exceptions, deferred tax liabilities are recognized for all taxable temporarydifferences and deferred tax assets are recognized for all deductible temporarydifferences and the carryforward of unused tax losses and unused tax credits to theextent that it is probable that taxable profit will be available against which the deferredincome tax asset can be utilized.The carrying amount of deferred tax assets is reviewed at the end of the reportingperiod and reduced to the extent that it is probable that sufficient taxable profit willbe available to allow all or part of the deferred tax asset to be utilized.
- 19 -Deferred tax assets and liabilities are measured at the tax rates that are expected toapply to the period when the asset is realized or the liability is settled, provided suchtax rates have been enacted or substantively enacted at the end of the reportingperiod.Most changes in deferred tax assets or liabilities are recognized as a component of taxexpense in profit or loss. Only changes in deferred tax assets or liabilities that relateto items recognized in other comprehensive income or directly in equity arerecognized in other comprehensive income or directly in equity.2.18 Related PartiesParties are considered to be related if one party has the ability, directly or indirectly, tocontrol the other party or exercise significant influence over the other party in makingfinancial and operating decisions. Parties are also considered to be related if they aresubject to common control or common significant influence. Related parties may beindividuals or corporate entities. Transactions between related parties are based onterms similar to those offered to non-related parties.2.19 EquityCapital stock represents the nominal value of shares that have been issued.Treasury shares are stated at the cost of re-acquiring such shares.Accumulated fair value gains (losses) comprise gains and losses arising from therevaluation of available-for-sale investments.Retained earnings include all current and prior period results of operations asdisclosed in profit or loss in the statement of comprehensive income. Theappropriated portion represents the amount which is not available for distribution.2.20 Earnings Per ShareBasic earnings per share (EPS) is determined by dividing net profit by the weightedaverage number of shares subscribed and issued during the year after givingretroactive effect to stock dividend declared, stock split and reverse stock split duringthe current year, if any.Diluted earnings per share is computed by adjusting the weighted average number ofordinary shares outstanding to assume conversion of dilutive potential shares. The<strong>University</strong> does not have dilutive potential shares outstanding that would requiredisclosure of diluted earnings per share in the statements of comprehensive income.2.21 Segment ReportingA business segment is a group of asset and operations engaged in providing productsor services that are subject to risks and returns and are different from those of otherbusiness segments.
- 20 -The activities undertaken by the education segment includes income from tuition feesand other school fees from offering specific courses as discussed in Note 1. Realestate segment includes leasing of properties and acquiring and developing realproperties for sale or lease. Corporate and others consists of revenues and expenseswhich are not classified under the two major business segments.The Group’s operating segments are organized and managed separately according tothe nature of the products and services provided, with each segment representing astrategic business unit that offers different products and serve different markets.The measurement policies the Group uses for segment reporting under PFRS 8 arethe same as those used in its consolidated financial statements. Share in net loss of anassociate, finance income, finance costs, miscellaneous income, preacquisition incomeand tax expense are not included in arriving at the operating profit of the operatingsegment. In addition, corporate assets which are not directly attributable to thebusiness activities of any operating segment are not allocated to a segment.Financial information on operating segments is presented in Note 4 to theconsolidated financial statements.3. SIGNIFICANT ACCOUNTING JUDGMENTS AND ESTIMATESThe Group’s financial statements prepared in accordance with PFRS requiremanagement to make judgments and estimates that affect amounts reported in theconsolidated financial statements and related notes. Judgments and estimates arecontinually evaluated and are based on historical experience and other factors,including expectations of future events that are believed to be reasonable undercircumstances. Actual results may ultimately vary from these estimates.3.1 Critical Judgments in Applying Accounting PoliciesIn the process of applying the Group’s accounting policies, management has made thefollowing judgments, apart from those involving estimation, which have the mostsignificant effect on the amounts recognized in the consolidated financial statements:(a)Classification of Held-to-maturity InvestmentsIn classifying non-derivative financial assets with fixed or determinablepayments and fixed maturity, such as bonds, as held-to-maturity investments theGroup evaluates its intention and ability to hold such investments up tomaturity.If the Group fails to keep these investments to maturity other than for specificcircumstances as allowed under the standards, it will be required to reclassify thewhole class as available-for-sale financial assets. In such a case, the investmentswould therefore be measured at fair value, not amortized cost.As of March 31, 2010, 2009 and 2008, there are no held-to-maturity investmentsdisposed of before their maturity.
- 21 -(b)Distinction Between Investment Properties and Owner-managed PropertiesThe Group determines whether a property qualifies as investment property. Inmaking its judgment, the Group considers whether the property generates cashflows largely independent of the other assets held by an entity. Owner-occupiedproperties generate cash flows that are attributable not only to the property butalso to other assets used in the process of supplying services.Some properties comprise a portion that is held to earn rental or for capitalappreciation and another portion that is held for use in the supply of services orfor administrative purposes. If portion can be sold separately (or leased outseparately under finance lease), the Group accounts for such portion separately.If the portion cannot be sold separately, the property is accounted for asinvestment property only if an insignificant portion is held for use in the supplyof services or for administrative purposes. Judgment is applied in determiningwhether ancillary services are so significant that a property does not qualify asinvestment property. The Group considers each property separately in makingits judgment.(c)Classification of LeasesThe Group has entered into various lease agreements as either a lessor or alessee. Critical judgment was exercised by management to distinguish each leaseagreement as either an operating or finance lease by looking at the transfer orretention of significant risk and rewards of ownership of the properties coveredby the agreements. Currently, all of the Group’s lease agreements aredetermined to be operating leases.Rental expense charged to operations amounted to P7.9 million in 2010,P<strong>17</strong>.1 million in 2009 and P11.3 million in 2008 (see Note 15) while rentalincome earned in 2009, 2008 and 2007 are presented as Rental under Revenuesin the consolidated statements of comprehensive income.(d)Provisions and ContingenciesJudgment is exercised by management to distinguish between provisions andcontingencies. Policies on recognition and disclosure of provision anddisclosure of contingencies are discussed in Note 2.9 and relevant disclosuresare presented in Note 22.
- 22 -3.2 Key Sources of Estimation UncertaintyThe following are the key assumptions concerning the future, and other key sourcesof estimation uncertainty at the end of the reporting period, that have a significant riskof causing a material adjustment to the carrying amounts of assets and liabilitieswithin the next financial year:(a)Allowance for Impairment of ReceivablesThe Group maintains an allowance for impairment loss on receivables at a levelconsidered adequate to cover probable uncollectible receivables. The level ofthis allowance is evaluated by management on the basis of factors that affect thecollectibility of the accounts. These factors include, but are not limited to,history of the students’ payment behavior, age of receivables and other externalfactors affecting the education industry. The Group constantly reviews the ageand status of receivables, and identifies accounts that should be provided withallowance. Analyses of net realizable value of receivables as of March 31, 2010,2009 and 2008 are presented in Note 6.Impairment losses recognized on receivables amounted to about P22.0 millionin 2010, P<strong>17</strong>.6 million in 2009 and P<strong>17</strong>.4 million in 2008 (see Note 6).(b)Valuation of Financial Assets Other than Loans and Other ReceivablesThe Group carries certain financial assets at fair value, which requires theextensive use of accounting estimates and judgment. In cases where activemarket quotes are not available, fair value is determined by reference to thecurrent market value of another instrument which is substantially the same or iscalculated based on the expected cash flows of the underlying net base of theinstrument. The amount of changes in fair value would differ if the Grouputilized different valuation methods and assumptions. Any change in fair valueof these financial assets would affect profit and loss and fund balance.Fair value gains and losses recognized on available-for-sale investments in 2010,2009 and 2008 are presented as Accumulated Fair Value Gains (Losses) in theconsolidated statements of changes in equity (see Note 7).
- 23 -(c)Impairment of Available-for-sale InvestmentsThe determination when an investment is other-than-temporarily impairedrequires significant judgment. In making this judgment, the Group evaluates,among other factors, the duration and extent to which the fair value of aninvestment is less than its cost, and the financial health of and near-termbusiness outlook for the investee, including factors such as industry and sectorperformance, changes in technology and operational and financing cash flows.Analyses of the carrying value of the available-for-sale investments as ofMarch 31, 2010, 2009 and 2008 are presented in Note 7.(d)Useful Lives of Investment Property and Property and EquipmentThe Group estimates the useful lives of investment property and property andequipment based on the period over which the assets are expected to beavailable for use. The estimated useful lives of these assets are reviewedperiodically and are updated if expectations differ from previous estimates dueto physical wear and tear, technical or commercial obsolescence and legal orother limits on the use of the assets. Analyses of the carrying amounts ofinvestment property and property and equipment are presented inNotes 10 and 11, respectively. Actual results, however, may vary due to changesin factors mentioned above. Based on management assessment as ofMarch 31, 2010, 2009 and 2008, no change in the estimated useful lives of theassets is necessary.(e)Impairment of Non-financial AssetsPFRS requires that an impairment review be performed when certainimpairment indicators are present. The Group’s policy on estimating theimpairment of non-financial assets is discussed in detail in Note 2.13. Thoughmanagement believes that the assumptions used in the estimation of fair valuesreflected in the financial statements are appropriate and reasonable, significantchanges in these assumptions may materially affect the assessment ofrecoverable values and any resulting impairment loss could have a materialadverse effect on the results of operations.The Group did not recognize any impairment loss on property and equipment,investment property and investment in an associate in 2010, 2009 and 2008.
- 24 -4. SEGMENT INFORMATIONManagement currently identifies the Group’s three operating segments and isconsistent with accounting policies described in Note 2.21. These operating segmentsare monitored and strategic decisions are made on the basis of adjusted segmentoperating results.The following tables present revenue and profit information regarding businesssegments for the years ended March 31, 2010, 2009 and 2008 and certain asset andliability information regarding segments as at March 31, 2010, 2009 and 2008(amounts in thousands):CorporateEducation Real Estate and Others Total2010Segment revenues P 1,701,048 P 278,415 P 14,080 P 1,993,543Cost of real estate sales - ( 6,685 ) - ( 6,685 )Operating expenses ( 1,163,918 ) ( 33,831 ) ( 4,051 ) ( 1,201,800 )Segment operating profit P 537,130 P 237,899 P 10,029 P 785,058Total Segment Assets P 3,345,076 P 1,026,207 P 30,879 P 4,402,162Total Segment Liabilities P 444,671 P 143,987 P 692 P 589,3502009Segment revenues P 1,662,089 P 50,438 P 11,527 P 1,724,054Operating expenses ( 1,142,352 ) ( 23,421 ) ( 397 ) ( 1,166,<strong>17</strong>0 )Segment operating profit P 519,737 P 27,0<strong>17</strong> P 11,130 P 557,884Total Segment Assets P 3,<strong>17</strong>7,865 P 663,308 P 20,0<strong>17</strong> P 3,861,190Total Segment Liabilities P 503,981 P 42,371, P 503 P 546,8552008Segment revenues P 1,613,830 P 41,290 P 20,146 P 1,675,266Operating expenses ( 1,054,473 ) ( 22,621 ) ( 143 ) ( 1,077,237 )Segment operating profit P 559,357 P 18,669 P 20,003 P 598,029Total Segment Assets P 2,955,546 P 584,315 P 7,480 P 3,547,341Total Segment Liabilities P 523,823 P 53,425 P 125 P 577,373Segment assets include all operating assets used by a segment and consist principallyof operating cash, receivables, available-for-sale investments, held-to-maturityinvestments, real estate held for sale, investment property and property andequipment. Segment liabilities include all operating liabilities as presented in theconsolidated statements of financial position except for deferred tax liabilities.Segment assets do not include deferred taxes, investment in an associate and otherassets which are considered corporate assets and are not allocated to any segment’sassets.
- 25 -The totals presented for the Group’s operating segments reconcile to the key financialfigures presented in Group’s financial statements as follows (amounts in thousands):2010 2009 2008Segment operating profit P 785,058 P 557,884 P 598,029Finance income 110,666 120,857 106,419Miscellaneous income 12,209 13,598 2,362Finance costs ( 3,483 ) - ( 5,432 )Share in net loss of an associate ( 54 ) ( 49 ) ( 25 )Preacquisition income - 3,999 -Tax expense ( 126,700 ) ( 86,996 ) ( 87,547 )Group Net Profit P 777,696 P 609,293 P 613,806Segment assets P 4,402,162 P 3,861,190 P 3,547,341Investment in an associate 13,252 7,056 7,105Goodwill 12,353 12,353 12,353Deferred tax assets 10,842 9,229 11,357Total Assets P 4,438,609 P 3,889,828 P 3,578,156Segment liabilities P 589,350 P 546,855 P 577,373Deferred tax liabilities 13,822 13,<strong>17</strong>1 12,118Total Liabilities P 603,<strong>17</strong>2 P 560,026 P 589,491The segment revenues equal the Group revenues for the reporting periods presented,hence, a reconciliation is no longer presented.5. CASH AND CASH EQUIVALENTSCash and cash equivalents include the following components as of March 31:2010 2009 2008Cash on hand and in banks P 114,333,595 P 157,747,5<strong>17</strong> P 197,126,244Short-term placements 353,814,459 1,015,111,845 1,010,216,145P 468,148,054 P 1,<strong>17</strong>2,859,362 P 1,207,342,389Cash in banks generally earn interest at rates based on daily bank deposit rates.Short-term placements are made for varying periods of up to three months dependingon the immediate cash requirements of the Group. These placements earn effectiveannual interest ranging from 2.5% to 4.5% in 2010, 3.75% to 7.00% in 2009 and3.75% to 5.25% in 2008 for peso placements and 1.75% to 4.00% in 2009 and 2.25%to 2.50% in 2008 for dollar placements. There are no dollar placements in 2010.Interest income earned from cash and cash equivalents were presented as part ofFinance Income in the consolidated statements of comprehensive income(see Note 16).
- 26 -Certain portion of cash and cash equivalents are set aside to cover for trust funds ofthe <strong>University</strong> (see Note 13). The amount of cash and cash equivalents set aside tocover trust funds were P44.0 million, P58.5 million and P76.2 million as of March 31,2010, 2009 and 2008, respectively. Considering the restriction on such amounts ofcash and cash equivalents, the <strong>University</strong> retrospectively reclassified them to OtherCurrent Assets in 2010.6. RECEIVABLESThis account is composed of the following:2008Notes 2010 2009 (As Restated)Tuition and otherschool fees P 104,475,283 P 64,246,194 P 54,371,503Allowance forimpairment ( 15,727,708) ( 14,146,263) ( 11,872,333 )88,747,575 50,099,931 42,499,<strong>17</strong>0Loans receivable 477,000,000 - -Accounts receivable 10.1 140,000,000 - -Receivable from:FEU EducationalFoundation, Inc.(FEFI) 36,671,312 38,040,770 28,843,710East Asia EducationalFoundation, Inc.(EAEF) 22,415,485 18,165,787 14,116,055Accrued interest 5, 7 10,200,097 8,472,078 14,821,789Advances to employees 9,279,805 11,479,722 9,145,859Rental receivable 7,022,965 8,202,478 829,938Others 48,610,136 3,691,162 3,<strong>17</strong>7,662P 839,947,375 P 138,151,928 P 113,434,183A reconciliation of the allowance for impairment loss on receivables at the beginningand end of 2010, 2009 and 2008 is shown below.Note 2010 2009 2008Balance at beginningof year P 14,146,263 P 11,872,333 P 11,436,501Impairment lossesduring the year 15 22,035,435 <strong>17</strong>,581,234 <strong>17</strong>,450,897Receivables written offduring the year ( 20,453,990) ( 15,307,304) ( <strong>17</strong>,015,065 )P 15,727,708 P 14,146,263 P 11,872,333
- 27 -All of the Group’s receivables have been reviewed for indicators of impairment.Certain tuition and other fees receivables were found to be impaired and allowancehas been recorded accordingly. The allowance for impairment loss on receivables asof March 31, 2010, 2009 and 2008 relates only to receivables from students whichhave been outstanding for more than one semester and specifically identified to beimpaired. Impairment loss recognized on receivables is presented as part ofGeneral Operating Expenses in the consolidated statements of comprehensiveincome (see Note 15). No allowance for impairment loss on all other receivables wasprovided as of March 31, 2010, 2009 and 2008 since management believes that thoseare collectible in full.Loans receivable represents promissory notes issued to certain rental and leasingcorporation as part of the <strong>University</strong>’s trust fund arrangement with a certain localbank. Interest income earned from these loans is presented as part of FinanceIncome in the 2010 consolidated statement of comprehensive income (see Note 16).Other receivables in 2010 includes a P43.7 million option money for the acquisitionof shares of stock of Crans Montana Holdings Corporation (Crans Montana)(see Note 22.4). Such option money will be refunded to the <strong>University</strong> uponacquisition of Crans Montana or failure by FEU to pursue such acquisition. Pendingconsummation of the Crans Montana acquisition, the <strong>University</strong> temporarily leasedthe properties (land and building located in Makati City) owned by Crans Montanaand made improvements thereon, including construction of a new school building, forthe FEU Makati Campus (see Notes 1 and 22.2). In relation to such improvements,the <strong>University</strong> has made advances to contractors amounting to P52.0 million as ofMarch 31, 2010. Such advances are presented as part of Other Current Assets in the2010 consolidated statement of financial position.The <strong>University</strong> provides management services to EAEF which agreed to paymanagement fee computed at a certain percentage of their gross revenue subject tocertain conditions. Management fees earned amounted to P14.1 million in 2010,P11.5 million in 2009 and P20.1 million in 2008 which are presented as ManagementFees in the consolidated statements of comprehensive income. Receivable fromEAEF represents the outstanding receivables arising from management servicesprovided by the <strong>University</strong> to EAEF and those arising from the lease of schoolbuilding to EAEF (see Note 10).The <strong>University</strong> provides cash advances to FEFI for the latter’s operating requirementssuch as faculty payroll, which FEFI regularly pays to the <strong>University</strong>. The outstandingreceivables arising from this transaction are presented above as Receivable fromFEFI.
- 28 -7. AVAILABLE-FOR-SALE (AFS) INVESTMENTSThis category of financial assets consists of the following:2010 2009 2008Debt securities:Government P 678,<strong>17</strong>9,527 P 792,260,802 P 706,326,539Corporate 539,986,625 276,110,403 109,258,5041,218,166,152 1,068,371,205 815,585,043Equity securities 21,928,999 19,738,752 25,102,359P 1,240,095,151 P 1,088,109,957 P 840,687,402Interest income recognized in 2010, 2009 and 2008 are presented as part of FinanceIncome in the consolidated statements of comprehensive income (see Note 16).Certain AFS investments reached their maturity in 2009 and 2008 and were no longerreinvested; thus reclassified to Cash and Cash Equivalents resulting in thereclassification to profit or loss of cumulative gains of P2.8 million in 2009 andP5.5 million in 2008 which were previously recognized in equity.Analyses of the movements in the carrying amounts of the Group’s investments heldby trustee banks are presented below.Note 2010 2009 2008Balance at beginning ofyear P 1,088,109,957 P 840,687,402 P 816,893,531Additions 486,7<strong>17</strong>,814 678,027,477 287,469,902Withdrawals ( 414,986,880) ( 467,769,330) ( 302,795,789 )Investment income – net 16 62,863,261 45,180,490 37,943,665Fair value gains (losses) <strong>17</strong>,390,999 ( 8,016,082) 1,<strong>17</strong>6,093Balance at end of year P 1,240,095,151 P 1,088,109,957 P 840,687,4028. REAL ESTATE HELD FOR SALEReal estate held for sale as of March 31, 2010, 2009 and 2008 represents certain lots atthe following locations:2009 2008(As Restated – (As Restated –2010 see Note 2.1) see Note 2.1)Silang, Cavite P 103,751,973 P 103,751,973 P 103,751,973Ferndale Homes, Quezon City 18,780,315 25,464,969 25,464,969P 122,532,288 P 129,216,942 P 129,216,942Total sale generated and cost of real property sold amounted to P8.0 million andP6.7 million, respectively for 2010. The sale is reported as Sale of Real Estate in the2010 consolidated statement of comprehensive income while the related cost ispresented as Cost of Real Estate Sold in the 2010 consolidated statement ofcomprehensive income (see Note 15).
- 29 -In December 2007, FRC entered into a memorandum of agreement with another realestate company for the exchange of their respective parcels of land which are bothlocated in a subdivision in Silang, Cavite. However, the Group was not able toreclassify the property to Property and Equipment at the time of the exchange whenit has already made certain that the property will be leased to FECSI. Accordingly,the Group made a retrospective reclassification of the property in 2010. The cost ofthe Group’s property, which was reclassified to Property and Equipment, wasP59.8 million (see Note 11). No gain or loss was recognized on the exchange sincemanagement determined that it has no commercial substance in accordance with theconditions set forth in PAS 40, Investment Property. The exchange has been consideredto have no commercial substance since the fair values of the properties exchanged didnot significantly differ as these are both located in the same area and these did notchange as a result of the exchange.Management has assessed that the net realizable value of the assets is higher thantheir cost, hence, no impairment loss was recognized in 2010, 2009 and 2008.9. INVESTMENT IN AN ASSOCIATEThis account consists of the following as of March 31:2010 2009 2008Investment in an associateAcquisition cost P 7,878,121 P 7,878,121 P 7,878,121Accumulated equity innet losses:Balance at beginning of year ( 822,158) ( 772,742) ( 748,010 )Share in net losses ( 53,987) ( 49,416) ( 24,732 )Balance at end of year ( 876,145) ( 822,158) ( 772,742 )7,001,976 7,055,963 7,105,379Advances to joint ventureunder registration 6,250,000 - -P 13,251,976 P 7,055,963 P 7,105,379JMCI’s summary of the financial information as of December 31, 2010, 2009 and2008 are as follows:2010 2009 2008Total assets P 14,913,564 P 14,824,762 P 14,826,831Total liabilities 623,820 424,840 326,060Total equity 14,289,744 14,399,922 14,500,771Net loss 110,<strong>17</strong>8 100,849 50,474
- 30 -In November 2009, the <strong>University</strong> entered into a JV Agreement with a co-venturer toestablish and operate a culinary skills training center which shall provide courses ofstudy in the culinary arts. The <strong>University</strong> and co-venturer invested P6.3 million eachto ICF-CCE, Inc., the JVC. Pending approval by the <strong>SEC</strong> of the JVC’s registration(see Notes 1 and 2.3), the amount invested by the <strong>University</strong> is presented as Advancesto Joint Venture under Registration in the Investment in an Associate account in the2010 consolidated statement of financial position. The registration with the <strong>SEC</strong> wasapproved after the reporting date (see Note 1).10. INVESTMENT PROPERTYThe gross carrying amounts and accumulated depreciation of investment property atthe beginning and end of 2010, 2009 and 2008 are shown below.Building ConstructionLand and inLand Improvements Improvements Progress TotalMarch 31, 2010Cost P 135,983,037 P 2,941,664 P 306,970,521 P 23,914,725 P 469,809,947Accumulateddepreciation - ( 2,419,214) ( 95,813,556 ) - ( 98,232,770 )Net carrying amount P 135,983,037 P 522,450 P 211,156,965 P 23,914,725 P 371,577,<strong>17</strong>7March 31, 2009Cost P 138,676,925 P 2,941,664 P 306,970,521 P - P 448,589,110Accumulateddepreciation - ( 2,012,361) ( 81,673,204 ) - ( 83,685,565 )Net carrying amount P 138,676,925 P 929,303 P 225,297,3<strong>17</strong> P - P 364,903,545March 31, 2008Cost P 125,982,883 P 2,722,557 P 304,160,428 P - P 432,865,868Accumulateddepreciation - ( 1,467,850) ( 67,660,802 ) - ( 69,128,652 )Net carrying amount P 125,982,883 P 1,254,707 P 236,499,626 P - P 363,737,216April 1, 2007Cost P 91,893,657 P 2,1<strong>17</strong>,490 P 242,559,966 P - P 336,571,113Accumulateddepreciation - ( 1,020,911) ( 54,883,329 ) - ( 55,904,240 )Net carrying amount P 91,893,657 P 1,096,579 P 187,676,637 P - P 280,666,873
- 31 -A reconciliation of the carrying amounts at the beginning and end of 2010, 2009 and2008, of investment property is shown below.Building and ConstructionLand Building inLand Improvements Improvements Progress TotalBalance at April 1, 2009,net of accumulateddepreciation P 138,676,925 P 929,303 P 225,297,3<strong>17</strong> P - P 364,903,545Disposal ( 2,693,888) - - - ( 2,693,888 )Reclassification - - - 23,914,725 23,914,725Depreciation chargesfor the year - ( 406,853) ( 14,140,352 ) - ( 14,547,205 )Balance atMarch 31, 2010,net of accumulateddepreciation P 135,983,037 P 522,450 P 211,156,965 P 23,914,725 P 371,577,<strong>17</strong>7Balance at April 1, 2008,net of accumulateddepreciation P 125,982,883 P 1,254,707 P 236,499,626 P - P 363,737,216Additions 12,694,042 219,107 2,810,093 - 15,723,242Depreciation chargesfor the year - ( 544,511) ( 14,012,402 ) - ( 14,556,913 )Balance atMarch 31, 2009,net of accumulateddepreciation P 138,676,925 P 929,303 P 225,297,3<strong>17</strong> P - P 364,903,545Balance at April 1, 2007,net of accumulateddepreciation P 91,893,657 P 1,096,579 P 187,676,637 P - P 280,666,873Additions 34,089,226 458,283 61,600,462 - 96,147,971Reclassification - 146,784 - - 146,784Depreciation chargesfor the year - ( 446,939) ( 12,777,473 ) - ( 13,224,412 )Balance atMarch 31, 2008,net of accumulateddepreciation P 125,982,883 P 1,254,707 P 236,499,626 P - P 363,737,216The total rental income earned from the investment property amounted toP58.8 million in 2010, P50.4 million in 2009, P41.3 million in 2008 and presented asRentals under Revenues in the consolidated statements of comprehensive income(see also Note 22.3). The direct operating expenses which include depreciationexpense incurred by the <strong>University</strong> relating to investment property is presented as partof Depreciation and Amortization under General Operating Expenses in theconsolidated statements of comprehensive income (see Note 15).The fair value of the investment property as of March 31, 2010 is P2.3 billion, andP2.5 billion as of March 31, 2009 and 2008 which was determined based on the mostrecent valuation performed by independent appraisers immediately after the end ofthe reporting periods except that portion pertaining to FRC’s investment propertyamounting to P2.1 billion which was based on valuation in prior year.Interest expense capitalized as part of the construction in progress amounted toP0.7 million in 2010, P0.9 million in 2009 and nil in 2008.
- 32 -10.1 Sale of Parcel of LandIn December 2009, FRC sold its parcels of land located in Quezon City, for a totalconsideration of P240.0 million which is inclusive of output VAT. The carrying valueof the property as of the date of sale amounted to P2.3 million. Total gain recognizedfrom this transaction amounted to P211.6 million presented as Gain on Sale ofInvestment Property in the 2010 consolidated statement of comprehensive income.Receivable arising from this transaction amounting to P140.0 million as ofMarch 31, 2010 is presented as Accounts Receivable under Receivables in the 2010consolidated statement of financial position (see Note 6).10.2 ReclassificationsIn 2010, FRC reclassified from Property and Equipment, the condominium unit thatwas acquired in prior year and is still undergoing minor construction and renovationworks as of March 31, 2010. The condominium unit was acquired in prior year asreplacement for the original unit acquired by FRC. The original contract wascancelled and replaced in May 2008 prior to its maturity with a new contract for a unitthat is significantly bigger than the original. The new contract required a 25%downpayment and monthly installment payments of P341,975, which is covered by apromissory note issued in favor of the seller; payable starting September 2008 untilJanuary 2013. FRC has already made a total of P8.5 million payments, net ofadministrative fees to the seller, in the cancelled contract of which P6.7 million hasbeen applied as downpayment for the new contract. The remaining amount whichpertains to input taxes is presented as part of Other Current Assets in theconsolidated statements of financial position.The current portion of the liability arising from this transaction was P3.4 million,P3.1 million, and P1.9 million as of March 31, 2010, 2009 and 2008, respectively,while the non-current portion was P7.0 million, P10.3 million and nil as ofMarch 31, 2010 and 2009 and 2008, respectively. These liabilities are presented in theconsolidated statements of financial position as Notes Payable.Interest expense capitalized as part of construction in progress pertaining to thecondominium unit amounted to P1.0 million in 2010 and P0.9 million in 2009.11. PROPERTY AND EQUIPMENTThe gross carrying amounts and accumulated depreciation at the beginning and endof 2010, 2009 and 2008 are shown below.Building and Furniture and Miscellaneous ConstructionLand Improvements Equipment Equipment in Progress TotalMarch 31, 2010Cost P 257,219,324 P 782,503,943 P 127,256,408 P 25,137,266 P 279,104,119 P 1,471,221,060Accumulateddepreciation - ( 152,625,123 ) ( 98,498,881 ) ( 12,520,278 ) - ( 263,644,282 )Net carrying value P 257,219,324 P 629,878,820 P 28,757,527 P 12,616,988 P 279,104,119 P 1,207,576,778March 31, 2009 – As RestatedCost P 257,219,324 P 654,637,049 P 115,455,954 P 13,515,759 P 23,914,725 P 1,064,742,811Accumulateddepreciation - ( 120,539,142 ) ( 88,841,105 ) ( 11,889,254 ) - ( 221,269,501 )Net carrying value P 257,219,324 P 534,097,907 P 26,614,849 P 1,626,505 P 23,914,725 P 843,473,310
- 33 -Building and Furniture and Miscellaneous ConstructionLand Improvements Equipment Equipment in Progress TotalMarch 31, 2008 – As RestatedCost P 257,219,324 P 5<strong>17</strong>,435,345 P 107,580,928 P 12,409,148 P 9,084,363 P 903,729,108Accumulateddepreciation - ( 93,944,046 ) ( 77,305,432 ) ( 11,659,251 ) - ( 182,908,729 )Net carrying value P 257,219,324 P 423,491,299 P 30,275,496 P 749,897 P 9,084,363 P 720,820,379April 1, 2007Cost P 197,383,724 P 487,866,479 P 89,420,099 P 12,090,999 P 8,434,363 P 795,195,664Accumulateddepreciation - ( 70,575,246 ) ( 67,114,543 ) ( 11,543,857 ) - ( 149,233,646 )Net carrying value P 197,383,724 P 4<strong>17</strong>,291,233 P 22,305,556 P 547,142 P 8,434,363 P 645,962,018A reconciliation of the carrying amounts at the beginning and end of 2010, 2009 and2008 of property and equipment is shown below.Building and Furniture and Miscellaneous ConstructionLand Improvements Equipment Equipment in Progress TotalBalance at April 1, 2009,net of accumulateddepreciation P 257,219,324 P 534,097,907 P 26,614,849 P 1,626,505 P 23,914,725 P 843,473,310Additions - 127,803,892 13,413,153 11,528,025 279,104,119 431,849,189Reclassifications - - - - ( 23,914,725 ) ( 23,914,725 )Depreciation chargesfor the year - ( 32,022,979 ) ( 11,270,475 ) ( 537,542 ) - ( 43,830,996 )Balance at March 31, 2010,net of accumulateddepreciation P 257,219,324 P 629,878,820 P 28,757,527 P 12,616,988 P 279,104,119 P 1,207,576,778Balance at April 1, 2008,net of accumulateddepreciation P 257,219,324 P 423,491,299 P 30,275,496 P 749,897 P 9,084,363 P 720,820,379Additions - 137,201,704 7,906,080 1,106,611 23,914,725 <strong>17</strong>0,129,120Derecognition - - ( 4,737 ) - ( 9,084,363 ) ( 9,089,100 )Depreciation chargesfor the year - ( 26,595,096 ) ( 11,561,990 ) ( 230,003 ) - ( 38,387,089 )Balance at March 31, 2009,net of accumulateddepreciation P 257,219,324 P 534,097,907 P 26,614,849 P 1,626,505 P 23,914,725 P 843,473,310Balance at April 1, 2007,net of accumulateddepreciation P 197,383,724 P 4<strong>17</strong>,291,233 P 22,305,556 P 547,142 P 8,434,363 P 645,962,018Additions 59,835,600 29,568,866 18,160,829 318,150 650,000 108,533,445Depreciation chargesfor the year - ( 23,368,800 ) ( 10,190,889 ) ( 115,395 ) - ( 33,675,084 )Balance at March 31, 2008,net of accumulateddepreciation P 257,219,324 P 423,491,299 P 30,275,496 P 749,897 P 9,084,363 P 720,820,379As discussed in Note 8, FRC exchanged certain parcels of land with another realestate company in 2007. The exchange was recorded at the carrying value of theproperty given up amounting to P59.8 million by FRC because managementdetermined that such exchange has no commercial substance.
- 34 -12. ACCOUNTS PAYABLE AND OTHER LIABILITIESThis account consists of:2008Notes 2010 2009 (As Restated)Accounts payable P 48,363,855 P 41,670,926 P 35,781,894Dividends payable 20.2 71,226,466 58,499,156 140,701,054Funds payable 55,705,967 38,743,<strong>17</strong>0 27,887,732Payable to contractor 50,7<strong>17</strong>,331 - -Accrued expense 45,340,965 33,569,525 24,573,479Withholding and othertaxes payable 38,360,652 36,513,664 43,934,253Amounts due to students 37,573,353 33,746,306 46,555,113Payable to FEUretirement plan <strong>17</strong> 32,313,215 36,901,623 41,886,105Accrued salaries andemployee benefits 29,614,032 54,229,149 30,048,030Retention payable 26,691,627 - -Deposits payable 6,133,212 9,831,557 23,550,545Other current liabilities 11,537,450 5,952,301 5,432,419P 453,578,125 P 349,657,377 P 420,350,624Accrued expenses include the Group’s accrual for utilities, rentals and directors’bonuses. Funds payable are amounts due to third parties for cooperative members’fees; school uniforms of students; and computer loans of employees. Amounts dueto students represent excess payment of miscellaneous fees from students.13. TRUST FUNDSThis account consists of the following as of March 31:2010 2009 2008Visual aid developmentfund P 14,635,307 P 13,224,923 P 13,670,640FEU Central StudentOrganization:Student loan fund 13,384,402 12,777,129 10,502,842Student scholarshipfund 2,290,745 3,902,308 3,919,602Student welfare anddevelopment fund 13,141,458 26,202,141 40,693,748Student assistance fund - - 2,653,039Others 518,838 2,384,140 4,722,351P 43,970,750 P 58,490,641 P 76,162,222
- 35 -These trust funds represent collections to defray expenses related to activities forspecific educational purposes. As discussed in Note 5, the amounts of cash and cashequivalents corresponding to the outstanding balances of these funds presented aspart of Other Current Assets in the consolidated statements of financial position areset aside and restricted for such purposes.14. TUITION AND OTHER SCHOOL FEESDetails of this account presented in the consolidated statements of comprehensiveincome are as follows:2010 2009 2008Tuition P 1,746,362,097 P 1,694,493,469 P 1,655,826,499Less discounts:Scholarship 61,000,082 63,723,848 57,508,745Cash 10,294,191 10,214,508 10,038,965Family 9,277,458 8,746,646 7,595,75680,571,731 82,685,002 75,143,4661,665,790,366 1,611,808,467 1,580,683,033Other school fees:Entrance fees 12,879,474 29,904,890 13,500,341Identification cards 9,903,306 8,775,916 8,655,013Transcript fees 8,794,229 9,030,205 7,919,956Diplomas 2,910,208 1,745,791 2,315,965Miscellaneous 770,448 824,008 755,23535,257,665 50,280,810 33,146,510P 1,701,048,031 P 1,662,089,277 P 1,613,829,543Towards the end of the fiscal year, the <strong>University</strong> collected tuition fees from studentsfor summer classes which start after the reporting period. Such collections areexcluded from tuition fees earned for the year and presented as part of DeferredIncome in the 2009 and 2008 consolidated statements of financial position andrecognized as revenue in the following year. There are no unearned tuition fees in2010.
- 36 -15. COSTS AND OPERATING EXPENSESCosts and Operating expenses consists of:Notes 2010 2009 2008Instructional and AcademicSalaries and allowances 19 P 519,662,398 P 527,192,891 P 495,587,597Employees benefits <strong>17</strong> 165,028,563 164,350,335 150,395,234Related learningexperience 31,738,871 21,641,432 19,474,376Affiliation <strong>17</strong>,153,509 9,960,332 11,418,036Others 19,128,326 21,503,871 <strong>17</strong>,370,504752,711,667 744,648,861 694,245,747Real Estate SalesCost of real estate sold 8 6,684,654 - -AdministrativeSalaries and allowances 19 98,577,604 87,788,025 80,599,603Employees benefits <strong>17</strong> 44,727,498 39,266,335 36,165,361Directors’ bonus 12,010,000 11,750,000 10,500,000Rental 7,914,634 <strong>17</strong>,136,041 11,345,139Others 20,833,245 <strong>17</strong>,243,886 16,772,935184,062,981 <strong>17</strong>3,184,287 155,383,038Maintenance and <strong>University</strong>OperationsUtilities 67,704,864 68,074,983 61,619,734Salaries and allowances 21,722,461 23,490,070 24,196,975Repairs and maintenance 18,579,781 6,458,042 8,071,553Janitorial services 11,915,987 12,808,640 11,707,163Employee benefits <strong>17</strong> 11,198,934 11,296,291 11,772,106Property insurance 1,485,816 1,160,749 564,594132,607,843 123,288,775 1<strong>17</strong>,932,125GeneralDepreciation 10, 11 58,378,201 52,944,002 46,899,496Impairment losseson receivables 6 22,035,435 <strong>17</strong>,581,234 <strong>17</strong>,450,897Security services 15,782,208 25,834,071 18,314,315Professional fees 14,068,475 6,306,848 5,416,097Publicity and promotions 9,0<strong>17</strong>,636 6,615,235 8,033,477Taxes and licenses 5,226,801 5,333,533 4,322,713Maintenance of art works 2,812,457 6,<strong>17</strong>6,320 2,184,264Donation and charitablecontributions 2,091,949 1,358,909 1,471,938Others 3,004,482 2,897,120 5,582,852132,4<strong>17</strong>,644 125,047,272 109,676,049Total Costs andOperating Expenses P 1,208,484,789 P 1,166,169,195 P 1,077,236,959
- 37 -16. FINANCE INCOMEThis account consists of interest income from:Notes 2010 2009 2008AFS investments 7 P 62,863,261 P 45,180,490 P 37,943,665Cash and cashequivalents 5 43,959,919 69,502,580 65,795,215Receivables 6 2,192,416 1,463,473 -HTM 1,650,000 1,672,563 2,679,885Foreign exchangegain – net - 3,037,732 -P 110,665,596 P 120,856,838 P 106,418,765<strong>17</strong>. EMPLOYEES’ HEALTH, WELFARE AND RETIREMENT FUNDThe Group maintains a funded and contributory retirement plan, which is a definedcontribution type of retirement plan since 1967, covering regular teaching andnon-teaching personnel members.The retirement fund is under the administration of an organization, the FEU Health,Welfare and Retirement Fund, through its Retirement Board.Contributions to this fund are in accordance with the defined contribution establishedby the Retirement Board which is the sum of the employees’ and the Group’scontributions. Employees’ contribution is 5% of basic salary while the Group’scontribution is equivalent to 20% of the employees’ basic salary. Retirement expenserecognized in the <strong>University</strong>’s consolidated statement of comprehensive incomeamounted to P86.6 million in 2010, P85.9 million in 2009 and P63.4 million in 2008(see Note 15).The Fund’s statements of financial position as of December 31, 2009, 2008 and 2007showed the following:2009 2008 2007AssetsMoney market placements P 715,250,000 P 643,050,000 P 555,853,116Receivables 52,926,997 38,547,269 40,186,159Cash in banks 9,997,093 10,784,913 4,628,136Others 136,263 185,654 208,505778,310,353 692,567,836 600,875,916Liabilities ( 55,569,843) ( 50,395,960) ( 49,871,692 )Net Assets P 722,740,510 P 642,<strong>17</strong>1,876 P 551,004,224
- 38 -18. INCOME TAXESThe components of the tax expense presented in profit or loss are as follows:2010 2009 2008Current tax expense:Special rate at 10% P 56,990,568 P 51,743,268 P 59,615,310Regular corporate incometax (RCIT) rate at 30% in2010, 35% and 30% in2009 and 35%in 2008 48,978,646 10,812,275 10,675,348Final tax at 20% and 7.5% 21,691,427 21,258,726 19,135,614127,660,641 83,814,269 89,426,272Deferred tax expense (income):Deferred tax benefit arisingfrom origination and reversalof temporary differences ( 960,904) 4,788,752 ( 1,879,288 )Effect of change in RCIT rate - ( 1,607,282) -( 960,904) 3,181,470 ( 1,879,288 )P 126,699,737 P 86,995,739 P 87,546,984A reconciliation of tax on pretax income computed at the applicable statutory rates totax expense reported in profit or loss is as follows:2010 2009 2008Tax on pretax income at 10% P 90,439,558 P 69,628,919 P 70,135,341Adjustments for incomesubjected to:RCIT rate 48,303,738 10,843,328 6,208,259Final tax 10,257,745 8,858,395 9,711,972Excess of OSD overitemized deductions ( 24,161,010) ( 3,289,439) -Effect of change in RCIT rate - ( 1,607,282) -Others 1,859,706 2,561,818 1,491,412Tax expense P 126,699,737 P 86,995,739 P 87,546,984
- 39 -The deferred tax assets and liabilities relate to the following as of March 31:Consolidated Statements of Financial PositionProfit or Loss2010 2009 2008 2010 2009 2008Deferred tax assets:Accrued rent expense P 5,168,876 P 4,591,002 P 3,543,085 ( P 577,874 ) ( P 1,047,9<strong>17</strong> ) ( P 1,131,710 )Unearned rental income 3,751,602 3,223,163 2,601,432 ( 528,439 ) ( 621,731 ) ( 2,601,432 )Allowance for impairment onreceivables 1,572,771 1,414,626 1,187,233 ( 158,145 ) ( 227,393 ) ( 43,583 )Unrealized foreign currency loss 348,299 - 474,786 ( 348,299 ) 474,786 ( 104,391 )Unearned income - - 1,685,492 - 1,685,492 ( 1,685,492 )Accrued donation - - 1,700,000 - 1,700,000 -Net-operating loss carryover - - 163,<strong>17</strong>6 - 163,<strong>17</strong>6 ( 50,143 )Minimum corporate income tax(MCIT) - - 2,115 - 2,115 -Deferred tax assets P 10,841,548 P 9,228,791 P 11,357,319Deferred tax liabilities:Accrued rent income ( P 13,822,482 ) ( P 12,866,856 ) ( P 12,1<strong>17</strong>,687 ) 955,626 749,169 3,737,463Unrealized foreign currency gains - ( 303,773 ) - ( 303,773 ) 303,773 -Deferred tax liabilities ( P 13,822,482 ) (P 13,<strong>17</strong>0,629 ) ( P 12,1<strong>17</strong>,687 )Deferred tax expense (income) ( P 960,904 ) P 3,181,470 ( P 1,879,288 )The <strong>University</strong> availed of the Tax Incentives Provisions of Republic Act (R.A.)No. 8525, Adopt-a-School Act of 1998. Total benefit from the availment of this taxincentives provided under the R.A. is the sum of the amount of contribution/donation that were actually, directly and exclusively incurred for the Adopt-a-SchoolProgram, with limitations, conditions and rules set forth in Section 34 (H) of the TaxCode and fifty percent (50%) of the amount of such contribution/donation.FRC is subject to MCIT which is computed at 2% of gross income, as defined underthe tax regulations. No MCIT was recognized in 2010, 2009 and 2008 as RCIT washigher than MCIT in those years.On July 6, 2008, R.A. No. 9504 became effective giving corporate taxpayers an optionto claim itemized deduction or optional standard deduction (OSD) equivalent to 40%of gross income which is relevant only to FRC. Once the option is made, it shall beirrevocable for the taxable year for which the option was made. In 2010 and 2009,FRC opted to use OSD in computing its RCIT.In accordance with R.A.No. 9337, RCIT rate, which is also applicable to FRC only,was reduced from 35% to 30% while nonallowable deductions for interest expensefrom 42% to 33% of interest income subjected to final tax beginning January 1, 2009.19. RELATED PARTY TRANSACTIONSTotal remunerations of the Group’s key management personnel presented as part ofsalaries and allowances and employees benefits under the Instructional and Academic,and Administrative Expenses caption (see Note 15) is as follows:2010 2009 2008Short-term benefits P 120,223,887 P 113,999,963 P 100,412,356Retirement benefits 18,247,691 18,063,955 16,321,494P 138,471,578 P 132,063,918 P 116,733,850
- 40 -20. EQUITY20.1 Capital <strong>Stock</strong>SharesAmount2010 2009 2008 2010 2009 2008Common shares – P100 par valueAuthorized 10,000,000 10,000,000 10,000,000Issued and outstanding:Balance at beginning of year 9,845,779 7,043,699 7,043,699 P 984,577,900 P 704,369,900 P 704,369,900Issued during the year - 2,802,080 - - 280,208,000 -Balance at end of year 9,845,779 9,845,779 7,043,699 984,577,900 984,577,900 704,369,900Treasury stock – at cost ( 37,331 ) ( 37,331 ) ( 37,331 ) ( 3,733,100 ) ( 3,733,100 ) ( 3,733,100 )Total outstanding 9,808,448 9,808,448 7,006,368 P 980,844,800 P 980,844,800 P 700,636,80020.2 Retained EarningsSignificant transactions affecting Retained Earnings, which is also restricted at anamount equivalent to the cost of treasury shares, are as follows:(a) Appropriation of Retained EarningsAppropriated Retained Earnings consists of appropriations for:Note 2010 2009 2008Property andinvestmentacquisition P 1,000,000,000 P - P -Expansion of facilities 599,333,335 899,333,335 1,010,000,000General retirement 57,000,000 57,000,000 57,000,000Contingencies 22.5 18,765,682 18,765,682 20,161,414Purchase of equipmentand improvements - - 30,000,000Acquisition oflaboratoryequipment - - 20,000,000Repairs andimprovements - - 10,000,000P 1,675,099,0<strong>17</strong> P 975,099,0<strong>17</strong> P 1,147,161,414On March 25, 2008, additional appropriation for school expansion of P300 millionwas approved by the BOT. In 2009, the <strong>University</strong> made a reversal of appropriationsamounting to P<strong>17</strong>2.1 million pertaining to expansion of facilities, repairs andimprovements, acquisition of laboratory equipment and purchase of equipment andimprovements. In 2010, the <strong>University</strong> appropriated P1.0 billion for property andinvestment acquisition and reversed P300.0 million relating to expansion of facilities.
- 41 -(b) Dividend DeclarationThe BOT approved the following dividend declarations in 2010, 2009 and 2008,respectively:Date ofDeclaration Record Payment Amount2010Cash dividend ofP15 per share June 19, 2009 July 6, 2009 July 20, 2009 P 147,126,720Cash dividend ofP15 per share December 15, 2009 January 8, 2010 January 25, 2010 147,126,720P 294,253,4402009Cash dividend ofP15 per share June <strong>17</strong>, 2008 July 7, 2008 July 21, 2008 P 105,095,52040% stock dividendequivalent to2,802,547 shares August 23, 2008 September 15, 2008 October 9, 2008 280,208,000467 fractional sharespaid out in cash atP100 per share August 23, 2008 September 15, 2008 October 9, 2008 46,720Cash dividend ofP15 per share December 16, 2008 January 8, 2009 January 22, 2009 147,126,720P 532,476,9602008Cash dividend ofP15 per share June 26, 2007 July 11, 2007 July 23, 2007 P 105,095,520Cash dividend ofP15 per share December 18, 2007 January 7, 2008 January <strong>17</strong>, 2008 105,095,520Cash dividend ofP15 per share March 25, 2008 April 10, 2008 April 24, 2008 105,095,520P 315,286,560Unpaid dividends as of March 31, 2010, 2009 and 2008 are presented as dividendspayable under Accounts Payable and Other Liabilities in the consolidated statementsof financial position (see Note 12).21. EARNINGS PER SHAREEarnings per share amounts were computed as follows:2010 2009 2008Net profit attributable to ownersof the <strong>University</strong> P 657,407,436 P 585,200,755 P 600,693,262Divided by weighted averagenumber of outstandingshares, net of treasury stockof 37,331 shares 9,808,448 8,407,408 7,006,368Basic and dilutedearnings per share P 67.02 P 69.61 P 85.74
- 42 -The weighted average number of shares outstanding as of March 31, 2009 iscomputed as follows:Number of Months Weighted numbershares Outstanding of sharesBalance at beginning of year 7,006,368 12 84,076,416Issuance on October 9, 2008 2,802,080 6 16,812,480Balance at end of year 9,808,448 100,888,896Divided by total monthsas of March 31, 2009 12Weighted average numberof shares outstanding 8,407,408There were no stock issuances in 2010 and 2008, hence, the weighted average numberof shares outstanding is equivalent to the total outstanding shares as of March 31,2010 and 2008.The <strong>University</strong> has no dilutive potential common shares as of March 31, 2010, 2009and 2008.22. COMMITMENTS AND CONTINGENCIES22.1 Purchase of Condominium UnitAs discussed in Note 10.2, FRC has an existing contract with a real estate companyfor the acquisition of a condominium unit which is still undergoing minorconstruction and renovation works. Future payments under this contract are asfollows which is presented as Notes Payable in the consolidated statements offinancial position.2010 2009 2008Within one year P 3,371,494 P 3,103,359 P 1,895,782After one year but notmore than five years 6,955,744 10,327,238 -P 10,327,238 P 13,430,597 P 1,895,78222.2 Operating Lease Commitments – Group as LesseeThe <strong>University</strong> entered into a contract of lease with Crans Montana for the buildingoccupied by FEU Makati Campus commencing on November 18, 2009 untilNovember <strong>17</strong>, 2010. The parties amended the contract extending the lease term for aperiod of 10 years. The future minimum rentals payable under this operating lease isas follows as of March 31, 2010:Within one year P 2,623,200After one year but not more than five years 10,492,800More than five years 12,241,600P 25,357,600
- 43 -22.3 Operating Lease Commitments – Group as LessorThe <strong>University</strong> leases out certain buildings to EAEF for a period of one to ten yearsuntil August 31, 20<strong>17</strong> (see Note 10). Total rent income recognized in the <strong>University</strong>’sconsolidated statements of comprehensive income amounted to P39.2 million in2010, P22.9 million in 2009 and P25.5 million in 2008.Future minimum rental receivables, excluding contingent rental, under these operatingleases as of March 31, 2010, 2009 and 2008 are as follows:2010 2009 2008Within one year P 28,666,776 P 28,666,776 P <strong>17</strong>,483,208After one year but not morethan five years 114,667,104 114,667,104 69,932,832More than five years57,333,552 86,000,328 69,932,832P 200,667,432 P 229,334,208 P 157,348,872FRC leases out certain land and buildings to several related and non-related parties fora period of one to ten years. Certain lease contracts stipulate contingent rentals at acertain percentage of the lessee’s monthly gross revenue. FRC’s lease agreement withNicanor Reyes Educational Foundation, Inc. (Fern College) which covers certainbuildings that Fern College occupies within the campus from June 1, 2007 toMay 31, 20<strong>17</strong> provides for an annual rental of P1.4 million or 10% of gross annualrevenue, whichever is higher. Rental income recognized from this transactionamounted to P6.7 million in 2010, P5.5 million in 2009 and P1.4 million in 2008.Future minimum rental receivables, excluding contingent rental, under these operatingleases as of March 31 are as follows:2010 2009 2008Within one year P 52,648,424 P 50,442,397 P 110,606,309After one year but not morethan five years 192,814,163 252,835,730 226,149,835More than five years23,215,842 <strong>17</strong>,802,160 12,886,18922.4 Acquisition of Crans MontanaP 268,678,429 P 321,080,287 P 349,642,333In 2010, the <strong>University</strong> has made a commitment to acquire all shares of stock ofCrans Montana and paid option money amounting to P43.7 million for suchacquisition. The option money shall be refunded to the <strong>University</strong> upon acquisitionor failure to pursue such acquisition (see Note 6). The total acquisition price is aboutP216.0 million.
- 44 -22.5 Legal ClaimsFRC is a party to a case filed by World War II Veterans Legionaries of the<strong>Philippine</strong>s, which seeks the annulment of FRC’s title over approximately15 to 25 hectares of land that had been the subject matter of a joint developmentagreement with Ayala Land, Inc. The specific bounds of the claimed area were notspecified by the plaintiff. The plaintiff also sought monetary damages in the amountof approximately P300,000 and monthly rentals of P300,000, while the case is pendingin court. FRC’s management and its legal counsel, however, are vigorously contestingthe claims.The case was initially dismissed by the Regional Trial Court and is currently pendingon appeal before the Court of Appeals.The Group’s management and its legal counsel believe that the liabilities, if any, whichmay result from the outcome of these cases, will not materially affect the financialposition and results of operations of the Group. However, the Group hasappropriated portion of its retained earnings for these contingencies (see Note 20.2)22.6 OthersThere are other contingencies that arise in the normal course of business that are notrecognized in the Group’s financial statements. However, management believes thatlosses, if any, arising from these commitments and contingencies will not materiallyaffect its consolidated financial statements.23. RISK MANAGEMENT OBJECTIVES AND POLICIESThe Group is exposed to certain financial risks in relation to financial instruments. Itsmain purpose for its dealings in financial instruments is to fund operational andcapital expenditures. The BOT has overall responsibility for the establishment andoversight of the Group’s risk management framework. It has a risk managementcommittee headed by an independent trustee that is responsible for developing andmonitoring the Group’s policies, which address risk management areas.Management is responsible for monitoring compliance with the Group’s riskmanagement policies and procedures and for reviewing the adequacy of these policiesin relation to the risks faced by the Group.The Group does not actively engage in trading of financial assets for speculativepurposes nor does it write options. The most significant financial risks to which theGroup is exposed to are described below.
- 45 -23.1 Interest Rate SensitivityThe Group’s exposure to interest rate risk arises from the following interest-bearingfinancial instruments which are subject to variable interest rates. All other financialassets and liabilities have fixed rates.Notes 2010 2009 2008Cash and cashequivalents 5 P 468,148,054 P 1,<strong>17</strong>2,859,362 P 1,207,342,389AFS investments 7 1,240,095,151 1,088,109,957 840,687,402Held-to-maturityinvestments 20,000,000 20,000,000 32,071,040P 1,728,243,205 P 2,280,969,319 P 2,080,100,831The following table illustrates the sensitivity of profit before tax for the years inregards to the Group’s interest-bearing financial instruments. These percentages havebeen determined based on the average market volatility rates, using standarddeviation, in the previous 12 months, estimated at 68% level of confidence. Thesensitivity analysis is based on the Group’s financial instruments held atMarch 31, 2010, 2009 and 2008.2010 2009 2008Reasonably Effect on Reasonably Effect on Reasonably Effect onpossible profit before possible profit before possible profit beforechange in rate tax change in rate tax change in rate taxCash and cash equivalents +/-1.39% P 4,992,069 +/-2.67% P 32,788,553 +/-1.35% P <strong>17</strong>,375,862AFS investments +/-0.94% 16,554,134 +/-2.83% 28,547,356 +/-1.54% 11,1<strong>17</strong>,533Held-to-maturity investments +/-1.39% 278,000 +/-2.67% 534,000 +/-1.35% 432,95923.2 Credit RiskP 21,824,203 P 61,869,909 P 28,926354Credit risk represents the loss the Group would incur if the counterparty failed toperform under its contractual obligations. The Group’s exposure to credit risk on itsreceivables related primarily to the inability of the debtors to pay and students to fullysettle the unpaid balance of tuition fees and other charges which are owed to theGroup based on installment payment schemes. The Group has established controlsand procedures in its credit policy to determine and to monitor the credit worthinessof the students based on relevant factors. Also, students are not allowed to enroll inthe following semester unless the unpaid balance in the previous semester has beenpaid. The Group also withholds the academic records and clearance of the studentswith unpaid balance, thus ensuring that collectibility is reasonably assured. TheGroup’s exposure to credit risk on its other receivable from debtors and relatedparties is managed through close account monitoring and setting limits.The Group neither has any significant exposure to any individual customer orcounterparty nor does it have any other concentration of credit risk arising fromcounterparties in similar business activities, geographic region or economic parties.
- 46 -With respect to credit risk arising from cash and cash equivalents, receivables, AFSinvestments and HTM investments, the Group’s exposure to credit risk arises fromdefault of the counterparty, with maximum exposure equal to the carrying amount ofthese instruments. The maximum exposure to credit risk at the end of the reportingperiod is as follows:Notes 2010 2009 2008Cash and cashequivalents 5 P 468,148,054 P 1,<strong>17</strong>2,859,362 P 1,207,342,389Receivables 6 839,947,375 138,151,928 113,434,183AFS investments 7 1,240,095,151 1,088,109,957 840,687,402HTM investments 20,000,000 20,000,000 32,071,040Restricted cash andcash equivalents 5, 13 43,970,750 58,490,642 76,162,222P 2,612,161,330 P 2,477,611,889 P 2,269,697,236The table below shows the credit quality of the Group’s financial assets as ofMarch 31, 2010, 2009 and 2008 (presented in ‘000) having past due but not impairedcomponents.NeitherPast duepast due nor Impaired Notimpaired (see Note 6) impaired Total2010Cash andcash equivalents P 468,148 P - P - P 468,148Receivables 823,549 15,728 16,398 855,675AFS investments 1,240,095 - - 1,240,095Held-to-maturityinvestments 20,000 - - 20,000Restricted cash andcash equivalents 43,970 - - 43,970P 2,595,762 P 15,728 P 16,398 P 2,627,8882009Cash andcash equivalents P 1,<strong>17</strong>2,859 P - P - P 1,<strong>17</strong>2,859Receivables 123,377 14,146 14,775 152,298AFS investments 1,088,110 - - 1,088,110Held-to-maturityinvestments 20,000 - - 20,000Restricted cash andcash equivalents 58,491 - - 58,491P 2,462,837 P 14,146 P 14,775 P 2,491,758
- 47 -NeitherPast duepast due nor Impaired Notimpaired (see Note 6) impaired Total2008Cash andcash equivalents P 1,207,342 P - P - P 1,207,342Receivables 86,742 11,872 26,692 125,306AFS investments 840,687 - - 840,687Held-to-maturityinvestments 32,071 - - 32,071Restricted cash 76,162 - - 76,162P 2,243,004 P 11,872 P 26,692 P 2,281,568The age of past due but not impaired receivables is about six months for each of thethree years.The Group classifies tuition and other fee receivables from students based on thenumber of semesters the receivables have been outstanding. Receivables fromstudents that are outstanding for more than one semester are analyzed to determinewhether they are impaired. Those that are not outstanding for more than onesemester or are currently receivable are determined to be collectible, based onhistorical experience.The Group’s management considers that all the above financial assets are notimpaired, except those specifically provided with allowance for impairment, as of theend of the reporting periods and of good credit quality. Cash and cash equivalents,AFS investments and HTM investments are coursed through reputable financialinstitutions duly approved by the BOT.23.3 Liquidity RiskThe Group manages liquidity risk by maintaining a balance between continuity offunding and flexibility. Treasury controls and procedures are in place to ensure thatsufficient cash is maintained to cover daily operational and working capitalrequirements. Management closely monitors the Group’s future and contingentobligations and ensures that future cash collections are sufficient to meet them inaccordance with internal policies. The Group invests in cash placements when excesscash is obtained from operations.Financial liabilities of the Group at the end of the reporting period comprise ofaccounts payable and accrued expenses, dividends payables and notes payable –current which are all short-term in nature and have contractual maturities of less than12 months from the reporting period, except for the non-current portion of notespayable amounting to P7.0 million and P10.3 million as of March 31, 2010 and 2009,respectively, which are due beyond 12 months.
- 48 -23.4 Other Price Risk SensitivityThe Group’s exposure to price risk arises from its investments in equity and debtsecurities, which are classified as AFS investments in the consolidated statements offinancial position.Management monitors its equity and debt securities in its investment portfolio basedon market indices. Material investments within the portfolio are managed on anindividual basis.AFS investments consist of publicly listed equity securities and government securitieswhich are carried at fair value and non-listed equity securities for which no fair valueinformation is available and that are therefore carried at cost.For equity securities listed in the <strong>Philippine</strong>s, an average volatility of 26.06%, 36.68%and 56.14% has been observed during 2010, 2009 and 2008 respectively. If quotedprice for these securities increased or decreased by that amount profit before taxwould have changed by P4.9 million, P7.1 million and P9.8 million in 2010, 2009 and2008, respectively.The investments in listed equity securities are considered long-term strategicinvestments. In accordance with the Group’s policies, no specific hedging activitiesare undertaken in relation to these investments. The investments are continuouslymonitored and voting rights arising from these equity instruments are utilized in theGroup’s favor.24. CATEGORIES AND FAIR VALUES OF FINANCIAL ASSETS ANDLIABILITIES24.1 Comparison of Carrying Amounts and Fair ValuesThe carrying amounts and fair values of the categories of financial assets and liabilitiespresented in the consolidated statements of financial position are shown below.Notes 2010 2009 2008Carrying Fair Carrying Fair Carrying FairValues Values Values Values Values ValuesFinancial assetsLoans and receivablesCash and cashequivalents 5 P 468,148,054 P 468,148,054 P 1,<strong>17</strong>2,859,362 P 1,<strong>17</strong>2,859,362 P 1,207,342,389 P 1,207,342,389Receivables 6 839,947,375 839,947,375 138,151,928 138,151,928 113,434,183 113,434,183Restricted cash andand cashequivalents 5, 13 43,970,750 43,970,750 58,490,642 58,490,642 76,162,222 76,162,2221,352,066,<strong>17</strong>9 1,352,066,<strong>17</strong>9 1,369,501,932 1,369,501,932 1,396,938,794 1,396,938,794AFS investments 7Debt securities 1,218,166,152 1,218,166,152 1,068,371,205 1,068,371,205 815,585,043 815,585,043Equity securities 21,928,999 21,928,999 19,738,752 19,738,752 25,102,359 25,102,3591,240,095,151 1,240,095,151 1,088,109,957 1,088,109,957 840,687,402 840,687,402HTM investmentsDebt securities 20,000,000 20,000,000 20,000,000 20,000,000 32,071,040 32,071,040P 2,612,161,330 P 2,612,161,330 P 2,477,611,889 P 2,477,611,889 P 2,269,697,236 P 2,269,697,236Financial liabilitiesAccounts payable andaccrued expenses 12 P 453,578,125 P 453,578,125 P 349,657,377 P 349,657,377 P 420,350,624 P 420,350,624Notes payable 10 10,327,238 10,327,238 13,430,597 13,430,597 1,895,782 1,895,782P 463,905,363 P 463,905,363 P 363,087,974 P 363,087,974 P 422,246,406 P 422,246,406
- 49 -See Notes 2.4 and 2.8 for a description of the accounting policies for each category offinancial instruments. A description of the Group’s risk management objectives andpolicies for financial instruments is provided in Note 23.24.2 Fair Value HierarchyThe Group adopted the amendments to PFRS 7, Improving Disclosures about FinancialInstruments, effective January 1, 2009. These amendments require the Group topresent certain information about financial instruments measured at fair value in theconsolidated statements of financial position. In the first year of application,comparative information need not be presented for the disclosures required by theamendment. Accordingly, the disclosure for the fair value hierarchy is only presentedfor March 31, 2010.In accordance with this amendment, financial assets and liabilities measured at fairvalue in the consolidated statements of financial position are categorized inaccordance with the fair value hierarchy. This hierarchy groups financial assets andliabilities into three levels based on the significance of inputs used in measuring thefair value of the financial assets and liabilities. The fair value hierarchy has thefollowing levels:• Level 1: quoted prices (unadjusted) in active markets for identical assets orliabilities;• Level 2: inputs other than quoted prices included within Level 1 that areobservable for the resource or liability, either directly (i.e., as prices) or indirectly(i.e., derived from prices); and,• Level 3: inputs for the asset or liability that are not based on observable marketdata (unobservable inputs).The level within which the financial asset or liability is classified is determined basedon the lowest level of significant input to the fair value measurement.The breakdown of the Group’s AFS investments measured at fair value in itsstatement of financial position as of March 31, 2010 is as follows:Level 1 Level 2 Level 3 TotalDebt securities:Government P 678,<strong>17</strong>9,527 P - P - P 678,<strong>17</strong>9,527Corporate 55,540,548 - 484,446,077 539,986,625Equity securities 21,928,999 - - 21,928,999P 755,649,074 P - P 484,446,077 P 1,240,095,151
- 50 -25. CAPITAL MANAGEMENT OBJECTIVES, POLICIES ANDPROCEDURESThe Group aims to provide returns on equity to shareholders while managingoperational and strategic objectives. The Group manages its capital structure andmakes adjustments to it, in the light of changes in economic conditions. To maintainor adjust capital structure, the Group may adjust the dividend payment toshareholders, return capital to shareholders or issue new shares.The Group defines capital as paid-in capital stock and retained earnings, bothappropriated and unappropriated. Other components of equity such as treasurystock, accumulated fair value gains (losses) and minority interest are excluded fromcapital for purposes of capital management. The BOT has overall responsibility formonitoring of capital in proportion to risks. Profiles for capital ratios are set in thelight of changes in the Group’s external environment and the risks underlying theGroup’s business, operation and industry.The Group monitors capital on the basis of debt-to-equity ratio, which is calculated astotal debt, net of deferred income and deferred tax liabilities divided by total equity.Capital for the reporting period March 31, 2010, 2009 and 2008 under review issummarized as follows:2010 2009 2008Total debt – net P 586,634,386 P 470,299,930 P 553,085,236Total equity attributableto owners of theparent company 3,395,346,584 3,014,857,779 2,692,692,664Debt-to-equity ratio 0.<strong>17</strong> : 1.00 0.16 : 1.00 0.21 : 1:00The Group is not subject to any externally-imposed capital requirements.There was no change in the Group’s approach to capital management during the year.
THE FAR EASTERN UNIVERSITY, INCORPORATED AND SUBSIDIARIESINDEX TO SUPPLEMENTARY SCHEDULESMARCH 31, 2010Statement of Management’s Responsibility for the Consolidated Financial StatementsIndependent Auditors’ Report on the <strong>SEC</strong> Supplementary SchedulesFiled Separately from the Basic Financial StatementsSupplementary Schedules to Consolidated Financial Statements(<strong>Form</strong> <strong>17</strong>-A, Item 7)Page No.A. Marketable Securities - (Current Marketable Equity Securities and OtherShort-term Cash Investments) 1B. Amounts Receivable from Directors, Officers, Employees, Related Partiesand Principal <strong>Stock</strong>holders (Other than Affiliates) 2C. Noncurrent Marketable Equity Securities, Other Long-term Investments in<strong>Stock</strong>s and Other Investments 18D. Indebtedness to Unconsolidated Subsidiaries and Related Parties NAE. Other Assets 19F. Long-term Debt NA*G. Indebtedness to Related Parties (Long-term Loansfrom Related Companies)NAH. Guarantees of Securities of Other Issuers NAI. Capital <strong>Stock</strong> 20Supplementary Schedule to Parent Financial Statements(<strong>SEC</strong> Circular No. 11)Reconciliation of Parent Company Retained Earnings for Dividend Declaration 21* Balance of account is less than 5% of the total liabilities of the Group.
THE FAR EASTERN UNIVERSITY, INCORPORATED AND SUBSIDIARIESSchedule A - Marketable Securities - (Current Marketable Equity Securities and Other Short-Term Cash Investments)For the year ended March 31, 2010Name of banksAmount shown on the statements offinancial positionIncome received and accruedBank of the <strong>Philippine</strong> Islands P 735,846,427 P53,131,605Banco de Oro 486,690,497 36,725,691Metrobank 167,715,521 5,741,449Security Bank 100,000,000 3,710,070Unionbank 39,000,000 1,318,780Rizal Commercial Banking Corp. 32,820,698 3,001,898Chinabank 30,000,000 2,732,687Citibank 20,000,000 1,650,000Land Bank 1,836,467 461,000TOTAL P 1,613,909,610 P108,473,180The amounts are presented in the statements of financial position as follows:Short-term placements P 353,814,459 P43,959,919Available-for-sale investments 1,240,095,151 62,863,261Held-to-maturity investment 20,000,000 1,650,000P 1,613,909,610 P108,473,1801
THE FAR EASTERN UNIVERSITY, INCORPORATED AND SUBSIDIARIESSCHEDULE B - AMOUNTS RECEIVABLE FROM DIRECTORS, OFFICERS,EMPLOYEES, RELATED PARTIES, AND PRINCIPAL STOCKHOLDERS (OTHER THAN AFFILIATES)FOR THE YEAR ENDED MARCH 31, 2010(Amounts in <strong>Philippine</strong> Pesos)Name and Designation of DebtorBeginningBalanceAdditionsDeductionsAmountAmountDeducted Written-OffCurrent Non-CurrentEndingAbellera, Evelyn C. 302.23 302.23 302.23Acab, Deborah A. 10,400.00 10,400.00 10,400.00Acosta, Venina Corazon S. 418.97 418.97 418.97Adolfo, Marlon (3,560.00) (3,560.00) (3,560.00)Africa, Dickenson Y. 200.00 200.00 200.00Agdalpen, Renato C. 2,000.00 2,000.00 2,000.00Agluba, Noreen 63.00 63.00 63.00Agorilla, Delia 660.00 660.00 660.00Albino, Maulynn 207.50 207.50 207.50Albiva, Merlyn T. 1,464.00 1,464.00 1,464.00Alcaraz, Nellie T. 8,200.00 8,200.00 8,200.00Alcazar, Nina Aiza 415.50 415.50 415.50Alfaro, Jennylyn G. (3,835.00) (3,835.00) (3,835.00)Alibania, Hazel J. 1,000.00 1,000.00 1,000.00Alo, James 600.00 600.00 600.00Alolor, Jacqueline G. (873.00) (873.00) (873.00)Amacan, Normita C. (6.45) 3,757.55 (3,764.00) (3,764.00)Amlog, Jocelyn A. 45,000.00 45,000.00 45,000.00Ampatin, Estrella V. 26,005.00 26,005.00 26,005.00Anastacio, Nanette V. (3,309.80) (3,309.80) (3,309.80)Anastacio, Teresita M. 89.74 89.74 89.74Andres, Jocelyn 90.00 90.00 90.00Anido, Cecilia I. 70,422.99 221,077.16 (150,654.<strong>17</strong>) (150,654.<strong>17</strong>)An Lim, Jaime L. (1,455.72) (1,455.72) (1,455.72)Arabia, Julieta S. (1,900.00) (1,900.00) (1,900.00)Aragon, Lloyd Jeffrey 5,000.00 5,000.00 5,000.00Arbizo, Maria Sophia 3,695.57 3,695.57 3,695.57Arejola, Romeo 200.00 200.00 200.00Arquiza, Glenda S. (9,845.50) (9,845.50) (9,845.50)Arribe, Emma B. 245.00 245.00 245.00Asilo, Ma. Cecilia 50.00 50.00 50.00Ataat, Jose 200.00 200.00 200.00Atanque, Aurora L. (2,288.82) (2,288.82) (2,288.82)Austria, Ryan 5,000.00 5,000.00 5,000.00Ayson, Rosalino P., Jr. 14,345.00 14,376.00 (31.00) (31.00)Azor, Helen A. (1,528.<strong>17</strong>) (1,528.<strong>17</strong>) (1,528.<strong>17</strong>)Azucena, Cesario 1,339.20 1,339.20 1,339.20Baconawa, Ma. Dorina M. 79.<strong>17</strong> 79.<strong>17</strong> 79.<strong>17</strong>Badiable, Charisma Mae 5,000.00 5,000.00 5,000.00Baello, Christine N. (137.50) (137.50) (137.50)Balaoro, Maria Theresa (200.00) (200.00) (200.00)Balaria, Dalmacio P. 7,500.00 7,500.00 7,500.00Bambico, Elma 311.00 311.00 311.00Banal, Enrico R. (22,<strong>17</strong>1.50) (22,<strong>17</strong>1.50) (22,<strong>17</strong>1.50)Barcellano, Francis (4,595.00) (4,595.00) (4,595.00)Barcelona, Samson V. 200.00 200.00 200.00Bartolome, Liezl DM. (58.00) (58.00) (58.00)Batungbakal, Marisa <strong>17</strong>.50 <strong>17</strong>.50 <strong>17</strong>.50Bautista, Andres D. 3,000.00 3,000.00 3,000.00Bautista, Arlene Mae DG. 1,027.00 1,027.00 1,027.00Bayan, Zenaida E. 585.50 585.50 585.50Belardo, Ma. Jeanette 1,794.53 1,794.53 1,794.53Belleza, Asuncion L. (12,289.47) (12,289.47) (12,289.47)Beltran, Charity J. <strong>17</strong>5.00 <strong>17</strong>5.00 <strong>17</strong>5.00Belza, Mercedes A. 7,060.00 7,060.00 7,060.00Bonaobra, Salvador B. (750.00) (750.00) (750.00)
Name and Designation of DebtorBeginningBalanceAdditionsDeductionsAmountAmountDeducted Written-OffCurrent Non-CurrentBrawner, Dalisay G. 40.00 40.00 40.00Briones, Domingo J. 10,079.00 120.90 9,958.10 9,958.10Brocal, Cynthia M. 24.00 24.00 24.00Buenaventura, Alexander V. 7,060.00 7,060.00 7,060.00Buenaventura, Olga C. 27,213.00 27,213.00 27,213.00Buenavida, Amelia 165.00 165.00 165.00Bueno, Marivic 10,000.00 10,000.00 10,000.00Bulanhagui, Nida B. 620.00 620.00 620.00Bustamante, Ma. Christine H. 8,600.00 8,600.00 8,600.00Caagbay, Elpidio Z. (5,305.00) (5,305.00) (5,305.00)Cabaltica, Leilani A. 4,210.55 4,210.55 4,210.55Cabantac, Ricardo R. 7,060.00 7,060.00 7,060.00Cadorna, Rosemarie S. 656.20 656.20 656.20Cagadas, Ruly 200.00 200.00 200.00Cajucom, Mary Grace A. 440.00 440.00 440.00Calizar, Dexter A. 3,126.10 3,126.10 3,126.10Camacho, Joseph C. 600.00 600.00 600.00Cando, Cromwell N. 1,248.00 1,248.00 1,248.00Canilao, Fe V. 359,792.04 280,069.32 79,722.72 79,722.72Cao, Marilou F. (4,867.00) (4,867.00) (4,867.00)Capacio, Glenn (7,300.00) (7,300.00) (7,300.00)Caramanza, Edward M. 9,000.00 9,000.00 9,000.00Cardona, Enrico 200.00 200.00 200.00Cariquitan, Daisy 308.00 308.00 308.00Carpio, Miguel M. (13,086.34) (13,086.34) (13,086.34)Castanas, Baby Theress 82.50 82.50 82.50Castro, Joeven R, 4,555.00 4,555.00 4,555.00Cauba, Harvey A. 4,364.78 716.88 3,647.90 3,647.90Cecilio, Ma. Elaine 3,795.89 3,795.89 3,795.89Cerrer, Redentor A. 200.00 200.00 200.00Chan, Jeffrei Allan (6,927.00) (6,927.00) (6,927.00)Chu, Connie 195.20 195.20 195.20Chua, Ryan Gilbert 5,000.00 5,000.00 5,000.00Clemente, Luisa DC. 3,615.90 2,600.90 1,015.00 1,015.00Codinera, Virgilio B. 79.72 79.72 79.72Cometa, Ma. Victoria D. (7,775.00) (7,775.00) (7,775.00)Concepcion, Gerald G. 250.00 250.00 250.00Concha, Jhonalyn M. 10,900.00 10,900.00 10,900.00Cordero, Nelma 1,195.00 1,195.00 1,195.00Cruz, Anita B. 25,000.00 25,000.00 25,000.00Cruz, Anna Lisa D. (944.00) (944.00) (944.00)Cruz, Christybel O. 928.75 928.75 928.75Cruz, Eloisa G. 3,362.50 3,362.50 3,362.50Cruz, Janet R. 200.00 200.00 200.00Cruz, John Ross R. (4,500.00) (4,500.00) (4,500.00)Cruz, Jose Noel 200.00 200.00 200.00Cruz, Maricar 5,000.00 5,000.00 5,000.00Cruz, Maritess 9.16 9.16 9.16Cruz, Precita P. (1,400.00) (1,400.00) (1,400.00)Cruz, Reynaldo J. 934.05 934.05 934.05Cruz, Rosalie dela 6.68 6.68 6.68Cruz, Sandra Lyn D. 523.01 523.01 523.01Culala, Harold John D. (5,835.00) (5,835.00) (5,835.00)Cunanan, Fernando M. 3,309.80 2,284.77 1,025.03 1,025.03Custodio, Joselito 50.00 50.00 50.00Dado, Rorylyn H. (1,000.00) (1,000.00) (1,000.00)Dapla, Walter 3,851.29 3,851.29 3,851.29Davalos, Zenaida R. (499.20) (499.20) (499.20)Deatras, Jeffrey (2,861.29) (2,861.29) (2,861.29)Delloro, Evelyn 748.00 748.00 748.00Demagante, Rey Francis G. 50.00 50.00 50.00Destura, Blanca 224.56 224.56 224.56Diaz, Aeneas Eli (10,000.00) (10,000.00) (10,000.00)Dingding, Quintin P. 70.00 70.00 70.00Ending
Name and Designation of DebtorBeginningBalanceAdditionsDeductionsAmountAmountDeducted Written-OffCurrent Non-CurrentDino, Kristopher 400.00 400.00 400.00Dizon, Mercy G. (800.00) (800.00) (800.00)Doria, Jeanette V. (260.00) (260.00) (260.00)Duena, Teodoro C., Jr. (6,000.00) (6,000.00) (6,000.00)Dulay, Sofronio C. (10,636.95) (10,636.95) (10,636.95)Dumadag, Norma M. 27,015.20 25,798.20 1,2<strong>17</strong>.00 1,2<strong>17</strong>.00Dumas, Marvin C. 150.00 150.00 150.00Dumdumaya, Myline Marie P. (1,200.00) (1,200.00) (1,200.00)Duque, Ronald 50.00 50.00 50.00Echauz, Lydia B. (20,362.80) (20,362.80) (20,362.80)Elman, Mario B. (1,800.00) (1,800.00) (1,800.00)Enriquez, Emiliana 50.00 50.00 50.00Escosia, Aurora A. 23,699.77 23,699.77 23,699.77Eser, Myline S. 33,035.86 33,035.86 33,035.86Espino, Kristine 112.00 112.00 112.00Espinosa, William V. 6,431.00 6,431.00 6,431.00Esquibel, Elizabeth 5,000.00 5,000.00 5,000.00Estabillo, Ma. Luz 529.50 529.50 529.50Estacio, Ma. Vivian G. (1,625.01) (1,625.01) (1,625.01)Esteban, Alejandro L. 5,000.00 5,000.00 5,000.00Estonanto, Mark Ronald L. 374.85 374.85 374.85Estonanto, Mavi Issel L. 32,221.65 32,221.65 32,221.65Estrella, Gloria 1,460.37 1,460.37 1,460.37Estrella, Luisito P. (300.00) (300.00) (300.00)Fabito, Evelyn 2,163.00 2,163.00 2,163.00Fabros, Marietta 5,295.67 5,295.67 5,295.67Federigan, Melissa 946.25 946.25 946.25Felizardo, Dante A. 10,000.00 10,000.00 10,000.00Feraren, Mitchell 50.00 50.00 50.00Fernandez, Benedict T. III (4,400.00) (4,400.00) (4,400.00)Fernandez, Dante Roel 699.00 699.00 699.00Fernando, Gerry V. 967.00 967.00 967.00Fesalbon, Hermond F. 7,729.34 7,729.34 7,729.34FEU Consumer's Coop. 3,295.85 3,295.85 3,295.85FEU Credit Union 1,560.92 1,560.92 1,560.92Fiesta, Erlinda P. 8,532.50 8,532.50 8,532.50Figer, Reggy C. 24,300.00 24,300.00 24,300.00Flojo, Flordeliza 168.50 168.50 168.50Flores, Hanonica S. 50.00 50.00 50.00Flores, Miguela T. (102.50) (102.50) (102.50)Flores, Roberto C. (32,250.00) (32,250.00) (32,250.00)Florida, Ma. Corazon M. (1,800.00) (1,800.00) (1,800.00)Foe, Jonathan 100.00 100.00 100.00Frades, Francisca B. (130.00) 347.85 (477.85) (477.85)Frias, Wilmer 5,000.00 5,000.00 5,000.00Fuentes, Ma. Leda J. 7,060.00 7,060.00 7,060.00Galiza, Miguela S. 45,000.00 45,000.00 45,000.00Gallardo, John 13,000.40 13,000.40 13,000.40Garcia, Dolores A. 50,000.00 50,000.00 50,000.00Garcia, Earl Jimson R. 6,000.00 6,000.00 6,000.00Garcia, Lourdes C. 16.41 16.41 16.41Garcia, Muriel B. (6,500.00) (6,500.00) (6,500.00)Garcia, Mylene M. 10,000.00 10,000.00 10,000.00Garcia, Severino M. 330,762.36 236,201.52 94,560.84 94,560.84Garin, May C. 25,000.00 15,000.00 10,000.00 10,000.00Genota, Jaime F. 822.32 822.32 822.32Gil, Aurora H. - PMSI 7,060.00 7,060.00 7,060.00Go-Monilla, Ma. Joycelyn A. 280.31 280.31 280.31Gonzaga, Jemabel 505.00 505.00 505.00Gonzales, Fortune N. 397.50 397.50 397.50Gubio, James B. (6,000.00) (6,000.00) (6,000.00)Guevarra, Remedios P. 4,297.00 4,297.00 4,297.00Gupit, Dolores S. (26,896.39) (26,896.39) (26,896.39)Gutang, Marco P. (2,353.33) (2,353.33) (2,353.33)Ending
Name and Designation of DebtorBeginningBalanceAdditionsDeductionsAmountAmountDeducted Written-OffCurrent Non-CurrentGuzman, Jericho D. 8,460.00 8,460.00 8,460.00Guzman, Jimmy 150.00 150.00 150.00Hernandez, Alma R. (1,337.50) (1,337.50) (1,337.50)Hernandez, Angeline A. 7,491.70 816.<strong>17</strong> 6,675.53 6,675.53Hilario, Jacqueline E. 662.50 662.50 662.50Hore, Lelioso G. 300.00 300.00 300.00Ibasco, Lourdes 350.00 350.00 350.00Ignacio, Lourdes D. (350.00) (350.00) (350.00)Iguas, Jose A. (980.00) (980.00) (980.00)Imbang, Ma. Nathalie A. 3,772.50 3,772.50 3,772.50Inciong, Cherry Wyne E. 7,500.00 7,500.00 7,500.00Irabagon, Miramar 6,000.00 6,000.00 6,000.00Isidro, Rosalina B. (593.75) (593.75) (593.75)Israel, Marietta C. 5,000.00 5,000.00 5,000.00Jabile, Joel E. 50.00 50.00 50.00Javier, Anabella G. 8,162.50 8,162.50 8,162.50Jesus, Angelita SD. 0.08 0.08 0.08Jimenez, Arsenia S. 5,970.00 5,970.00 5,970.00Jimenez, Marietta 2,290.86 2,290.86 2,290.86Jonson, Joyce Lisa B. (48,424.97) (48,424.97) (48,424.97)Jose, Corazon V. 2,058.57 2,058.57 2,058.57Jose, Haidee R. (1,446.80) (1,446.80) (1,446.80)Junio, Nenitha L. 767.00 767.00 767.00Kenny, Isabel 14,000.00 14,000.00 14,000.00Lagula, Janette 1<strong>17</strong>.50 1<strong>17</strong>.50 1<strong>17</strong>.50Lamboson, Roger C. (4,000.00) (4,000.00) (4,000.00)Lantin, Rommel 1,383.31 1,383.31 1,383.31Lapastora, Milagros P. 7,406.80 5,335.00 2,071.80 2,071.80Lapuebla, Alfredo N. 2,490.00 121.60 2,368.40 2,368.40Larano, Leonora 5,848.75 5,848.75 5,848.75Larda, Edmundo D. (1,500.00) (1,500.00) (1,500.00)Laudato, Emmanuel N. (1,200.00) (1,200.00) (1,200.00)Laurente, Jaime R. 1,650.25 1,650.25 1,650.25Lauro, Jocelyn P. 10,856.00 10,856.00 10,856.00Lazaro, Ma.Teresita A. 3,205.00 3,205.00 3,205.00Legaspi, Heidi 1,000.00 1,000.00 1,000.00Leon, Emma Rose H. 16,500.00 16,500.00 16,500.00Lewis, Salome 1,147.50 1,147.50 1,147.50Liggayu, Michael 200.00 200.00 200.00Lim, Nathaniel L. 3<strong>17</strong>.00 3<strong>17</strong>.00 3<strong>17</strong>.00Lintag, Graciel A. 1,180.16 1,180.16 1,180.16Listana, Mary Rose 1,012.50 1,012.50 1,012.50Lizaso, Marcelino N. 400.00 400.00 400.00Lopez, Anastacio, Jr. L. (230.00) (230.00) (230.00)Lopez, Antonio P., Jr. 15.34 15.34 15.34Lopez, Fernando M. 250.00 250.00 250.00Lopez, Mercedita P. 252.50 252.50 252.50Loza, Luningning R. 748.00 748.00 748.00Lugtu, Blyth 5.00 5.00 5.00Macadangdang, Luzviminda (137.50) (137.50) (137.50)Macalaguing, Mateo D. Jr. 10,000.00 10,000.00 10,000.00Macaraeg, Paul 6,436.23 6,436.23 6,436.23Macario, Christopher 50.00 50.00 50.00Magayaga, Lea Q. (7,059.99) (7,059.99) (7,059.99)Magtoto, Eliseo 200.00 200.00 200.00Malinao, Marivic 110.00 110.00 110.00Maliwat, Herminia I. 607,752.15 206,292.60 401,459.55 401,459.55Malot, Edmund Francis 100.00 100.00 100.00Manalili, Golda P. 50.00 50.00 50.00Manansala, Paolo 81.58 81.58 81.58Mangahas, Roser Benjamin 1,397.00 1,397.00 1,397.00Manicsic, Teresa B. 84.00 84.00 84.00Manigan, Alma C. 7.61 7.61 7.61Manlapaz, Divine Grace 5,000.00 5,000.00 5,000.00Ending
Name and Designation of DebtorBeginningBalanceAdditionsDeductionsAmountAmountDeducted Written-OffCurrent Non-CurrentManlapaz, Victor 1,200.00 1,200.00 1,200.00Manrique, Elenita <strong>17</strong>,000.00 <strong>17</strong>,000.00 <strong>17</strong>,000.00Mazo, Flaviano S. 780.00 780.00 780.00MC Entee, Keneline M. 3,928.90 3,928.90 3,928.90Medina, Joy E. (409.52) (409.52) (409.52)Medina, Ma. Ana Karina S. 25.94 25.94 25.94Medina, Merle S. (1,075.25) (1,075.25) (1,075.25)Medrano, Rosalinda 935.50 935.50 935.50Membrot, Ezitiel R. 2,150.00 2,150.00 2,150.00Mendoza, Cecilia H. (6,186.77) (6,186.77) (6,186.77)Mendoza, Florina M. 300.00 300.00 300.00Mendoza, Jobert 10,000.00 10,000.00 10,000.00Menorca, Emmanuel S. (250.00) (250.00) (250.00)Mercado, Annabelle K. 3,758.55 3,758.55 3,758.55Miguel, Emmanuel C. 6,619.60 6,619.60 6,619.60Milarpis, Joel 4,000.00 4,000.00 4,000.00Miranda, Dennis 4,100.00 4,100.00 4,100.00Monong, Cora 6,000.00 6,000.00 6,000.00Morimonte, Bonifacio D. 500.00 500.00 500.00Mortell, Gideon 5,237.46 5,237.46 5,237.46Nagal, Glenn Z. 330,762.36 236,201.52 94,560.84 94,560.84Narval, Antonio G. 520.80 520.80 520.80Natera, Malvin G. 4,121.97 4,121.97 4,121.97Nava, Delfin D. 767.00 767.00 767.00Nicer, Joselito C. (65,500.85) (65,500.85) (65,500.85)Nietes, Raymond G. 16,689.30 16,689.30 16,689.30Ninobla, Magnolia <strong>17</strong>0.00 <strong>17</strong>0.00 <strong>17</strong>0.00Ninubla, Shiela 1,018.53 1,018.53 1,018.53Nolasco, Maria Sylva 1,775.00 1,775.00 1,775.00Noriega, Mariwilda I. (7,306.55) (7,306.55) (7,306.55)Nuestro, Sarah Joyce 10,947.97 65.74 10,882.23 10,882.23Nulla, Mila R. 21,433.75 21,433.75 21,433.75Ocampo, Wilfredo T. 1,150.00 1,150.00 1,150.00Olipas, Lorina L. 200.00 200.00 200.00Ong, Emil 4<strong>17</strong>.53 4<strong>17</strong>.53 4<strong>17</strong>.53Orjalo, Victoria G. 200.00 200.00 200.00Ortiz, Jose (4,882.00) (4,882.00) (4,882.00)Ortiz, Milixa Lourdes B. 5,000.00 5,000.00 5,000.00Oyzon, Gualberto J. 3,002.80 3,002.80 3,002.80Padilla, Maria Eleanor T. 1,430.50 1,430.50 1,430.50Pahutan, Ludivinia M. (200.00) (200.00) (200.00)Palparan, Karoline L. (900.00) (900.00) (900.00)Pamintuan, Jose Edmundo E. 100.00 100.00 100.00Pante, Ronald S. 600.00 600.00 600.00Paraiso, Lourdes Oliva C. 84,847.50 84,847.50 84,847.50Paras, Renato 50,000.00 50,000.00 50,000.00Pasag, Maribeth 315.00 315.00 315.00Pascua, Jennifer J. 40,977.91 40,977.91 40,977.91Pascual, Perfecto 350.00 350.00 350.00Patricio, Natividad 598.75 598.75 598.75Paz, Rosalinda Z. 8,805.00 8,805.00 8,805.00Pekson II, Enrique Arvin (43,488.12) (43,488.12) (43,488.12)Perez, Crismin 10,591.34 10,591.34 10,591.34Perez, Jose R. Jr. 52.20 52.20 52.20Pimentel, Stephanie 285.00 285.00 285.00Pineda, Rodolfo G. (149.99) (149.99) (149.99)Ponsaran, Levy C. 2,450.00 2,450.00 2,450.00Portiz, Ellen 207.50 207.50 207.50Pring, Melanie 5,000.00 5,000.00 5,000.00Publico, Hilario Q. 5,376.50 5,376.50 5,376.50Puertollano, Derek 250.00 250.00 250.00Pulmano, Zelmo 8,000.00 8,000.00 8,000.00Querijero, Glen Hilario M. 5,000.00 5,000.00 5,000.00Quiambao, Arlene 358.50 358.50 358.50Ending
Name and Designation of DebtorBeginningBalanceAdditionsDeductionsAmountAmountDeducted Written-OffCurrent Non-CurrentQuijano, Virginia A. 7,220.00 7,220.00 7,220.00Quintanar, Janeth A. 5,366.56 5,366.56 5,366.56Quinto, Myrna P. 7,060.00 7,060.00 7,060.00Quirimit, Luzviminda 1,942.77 1,942.77 1,942.77Ragonjah, Homer Jay D. 15.00 15.00 15.00Ramon, Elizabeth A. de - PMSI 7,060.00 7,060.00 7,060.00Ramones, Rhozallino C. 5,000.00 5,000.00 5,000.00Ramos, Erlinda L. 10,000.00 10,000.00 10,000.00Ramos, Leonora A. 1,532.89 1,532.89 1,532.89Ramos, Ma. Theresa L. 853.81 853.81 853.81Rana, Aurelio Y. (3,132.92) (3,132.92) (3,132.92)Rapirap. Raquel T. 8,288.00 8,288.00 8,288.00Rasalan, Julia 772.50 772.50 772.50Remiendo, Noraliza A. 10.00 10.00 10.00Remigio, Warley 100.00 100.00 100.00Retardo, Victor C. (600.00) (600.00) (600.00)Reyes, Byron M. 200.00 200.00 200.00Reyes, Herbert D. 4,555.00 4,555.00 4,555.00Reyes, Melodia S. 6,834.00 6,834.00 6,834.00Reyes, Ruby 572.50 572.50 572.50Reymundo, Samuel 50.00 50.00 50.00Rivera, Myrna T. (1,420.25) (1,420.25) (1,420.25)Rizada, Ryan Joseph 9,159.80 9,159.80 9,159.80Ronda, Ma. Lea A. 300.00 300.00 300.00Rosa, Giovanni dela 551.63 551.63 551.63Rosario, Alma del - PMSI (7,060.00) (7,060.00) (7,060.00)Rosario, Hilario - PMSI 14,120.00 14,120.00 14,120.00Rosete, Dwight Benedict N. (500.00) (500.00) (500.00)Roxas, Ronald L. 8,000.00 8,000.00 8,000.00Rubillos, Leonardo I. (600.00) (600.00) (600.00)Ruzol, Hipolito S. 300.00 300.00 300.00Sabaupan, Sylvette G. 23,364.75 23,364.75 23,364.75Sabaybay, Jocelyn L. 666.00 666.00 666.00Saldua, Eder John (5,000.00) (5,000.00) (5,000.00)Salonga, Lea 50.00 50.00 50.00Salud, Alann M. (520.00) (520.00) (520.00)Salvacion, Dennis C. (3,000.00) (3,000.00) (3,000.00)Salvador, Esther D. 18.00 18.00 18.00San Pablo, Ma.Cecilia A. 492.25 402.25 90.00 90.00Sante, Nova C. (981.25) (981.25) (981.25)Santiago, Christopher G. 9,638.<strong>17</strong> 9,638.<strong>17</strong> 9,638.<strong>17</strong>Santiago, Edwin B. 50.00 50.00 50.00Santiago, Genine 1,130.00 362.46 767.54 767.54Santillan, Vivian M. 190.00 190.00 190.00Santos, Arwind 49,990.00 49,990.00 49,990.00Santos, Carmelita C. (1,391.64) (1,391.64) (1,391.64)Santos, Danilo B. 2,645.25 2,645.25 2,645.25Santos, Dinia 251.25 251.25 251.25Santos, Glecerio 200.00 200.00 200.00Santos, Mary Lord 5,000.00 5,000.00 5,000.00Santuile, Aida M. 8,000.00 8,000.00 8,000.00Sapitula, Preciosa S. 1,586.57 1,586.57 1,586.57Sarita, Larry 50.00 50.00 50.00Sarmiento, Lina Q. 5,691.62 4,753.25 938.37 938.37Sayco, Marjorie 206.50 206.50 206.50Sido, Ma. Victoria P. 125.80 125.80 125.80Sin, Glenda S. 7,060.00 7,060.00 7,060.00Sinang, Rolando R. 7,263.50 7,263.50 7,263.50Sincioco, Mary Ann 207.50 207.50 207.50Siongco, Ma. Teresita 2,000.00 2,000.00 2,000.00Sioson, Annabelle P. 60.00 60.00 60.00Sioson, Yolanda J. 57,480.00 57,480.00 57,480.00Soliman, Norma P. 7,060.00 7,060.00 7,060.00Sopoco, Anna Marie M. 1,890.00 1,890.00 1,890.00Ending
Name and Designation of DebtorBeginningBalanceAdditionsDeductionsAmountAmountDeducted Written-OffCurrent Non-CurrentSoria, Eulegio E. 1,000.00 1,000.00 1,000.00Sta. Ana, Noemi V. 311.00 311.00 311.00Tabaloc, Edgardo U. Jr. 51.58 51.58 51.58Tabaniag, Flordeliza 63.75 63.75 63.75Tablizo, Anne Margareth 206.50 206.50 206.50Tagle, Susan M. 5,051.41 5,051.41 5,051.41Tamay, Shariff M. 5,000.00 5,000.00 5,000.00Tamayao, Olivia E. 4,996.60 4,996.60 4,996.60Tan, Carolina M. - PMSI 7,060.00 7,060.00 7,060.00Tan, Cedrick - PMSI (4,875.00) (4,875.00) (4,875.00)Tan, Derrick - PMSI 15,187.00 15,187.00 15,187.00Tan, Mary Joyce P.- PMSI 7,060.00 7,060.00 7,060.00Tan, Ryanne 1<strong>17</strong>.50 1<strong>17</strong>.50 1<strong>17</strong>.50Tapalgo, Elyn M. Jr. (2,657.50) (2,657.50) (2,657.50)Tecson, Rhenalyn 311.00 311.00 311.00Teoxon, Lucio 379.82 379.82 379.82Tibayan, Florencia C. 305.00 305.00 305.00Tiburcio, Jaime, Jr. 2,007.50 2,007.50 2,007.50Timbugan, Josefina - PMSI 7,060.00 7,060.00 7,060.00Tirazona, Renato A. 1,992.92 1,992.92 1,992.92Togado, Illumar I. 4,000.00 4,000.00 4,000.00Tomas, Eden A. 943.00 943.00 943.00Torres, Maruja T. 206.50 206.50 206.50Trinidad, Alfredo D. 329.07 329.07 329.07Trinidad, Josefina <strong>17</strong>0.00 <strong>17</strong>0.00 <strong>17</strong>0.00Tuazon, Nino M. 356.25 356.25 356.25Unidad, Kim Ryan 100.00 100.00 100.00Ureta, Peter 9,397.10 9,397.10 9,397.10Usita, Laarni P. 23,069.00 23,069.00 23,069.00Uy, Moira B. 4,000.00 4,000.00 4,000.00Uyson, Leslie Marie C. 15,372.00 6,113.92 9,258.08 9,258.08Valdez, Ferdinand 1,000.00 1,000.00 1,000.00Valdez, Gloria 1,237.50 1,237.50 1,237.50Valencia, Jean Pauline S. (5,198.00) (5,198.00) (5,198.00)Valencia, Ma. Theresa L. 530.00 530.00 530.00Valenzuela, Edwin E. 300.00 300.00 300.00Valmonte, Alejandra Monica 205.25 205.25 205.25Varilla, Edglyn G. 5,140.61 5,140.61 5,140.61Vera, Antonio 0.03 0.03 0.03Vera, Jose Rizalito c. (5,400.00) (5,400.00) (5,400.00)Vera, Sebastian (2,300.00) (2,300.00) (2,300.00)Verances, Ma. Laline V. (841.50) (841.50) (841.50)Vergara, Flocerfida - PMSI (35,220.00) (35,220.00) (35,220.00)Vergara, Melchor - PMSI (7,060.00) (7,060.00) (7,060.00)Vergara, Oliver Francis - PMSI (7,060.00) (7,060.00) (7,060.00)Vergara, Regidor - PMSI (7,060.00) (7,060.00) (7,060.00)Vergara, Romeo - PMSI 21,180.00 21,180.00 21,180.00Verzosa, Bobby 100.00 100.00 100.00Vibar, Enrico B. 7,200.00 7,200.00 7,200.00Vicera, Desmond M. 200.00 200.00 200.00Ending
Name and Designation of DebtorBeginningBalanceAdditionsDeductionsAmountAmountDeducted Written-OffCurrent Non-CurrentVictoria, Michael S. (640.00) (640.00) (640.00)Villaceran, Eugenio V. (18,230.98) 7,060.00 (25,290.98) (25,290.98)Villamiel, Carminda (29,288.90) (29,288.90) (29,288.90)Villanueva, Ace R. 26.98 26.98 26.98Villanueva, Jonas V. (13,073.00) (13,073.00) (13,073.00)Villanueva, Ma. Concepcion 5,000.00 5,000.00 5,000.00Villapando, Marimel A. 200.00 200.00 200.00Villar, Gerald 7,060.00 7,060.00 7,060.00Vivas, Cherry Mae 300.00 300.00 300.00Woolsey, Nida B. 278.00 278.00 278.00Yabis, Geraldine 97.50 97.50 97.50Yang, Gloria 45,000.00 45,000.00 45,000.00Yanzon, Gina 500.00 500.00 500.00Yap, Caridad P. (4,841.00) (4,841.00) (4,841.00)Yatco, Ma. Carmen S. 29,320.00 29,320.00 29,320.00Zaldivar, Ramil P. 5,000.00 5,000.00 5,000.00Zulueta, Michael R. 7,000.00 7,000.00 7,000.00FACULTY ADVANCESP 2,825,974.91 - 1,269,875.56 - 1,556,099.35 1,556,099.35Aguilos, Susan S. 2,983.13 2,983.13 2,983.13Alona, Elizabeth V. (5,295.67) (5,295.67) (5,295.67)Altares, Priscilla S. (37.62) (37.62) (37.62)Anastacio, Nanette v. (5,295.67) (5,295.67) (5,295.67)Ansano, Bela R. 11,590.42 11,590.42 11,590.42Austria, Rex S. (2,160.00) (2,160.00) (2,160.00)Avengoza, Rosalie J. (6,518.64) (6,518.64) (6,518.64)Badiola, Jose Luisito V. (0.52) (0.52) (0.52)Bautista, Mary Grace S. (5,295.67) (5,295.67) (5,295.67)Cano, Charito F. 847.27 847.27 847.27Castro, Lawrence Christopher 1,765.22 1,765.22 1,765.22Cruz, Sandra Lyn E. 44,290.05 44,290.05 44,290.05Dimalibot, Martina Geraldine Q. 1,926.98 1,926.98 1,926.98Estacio, Ma. Vivian G. 3,832.70 3,832.70 3,832.70Gariguez, Mariflor N. 10,591.34 10,591.34 10,591.34Garin, May C. 5,534.22 5,534.22 5,534.22Isip, Amando F. (1,323.91) (1,323.91) (1,323.91)Javier, Nancy Joan M. 5,295.67 5,295.67 5,295.67Jose, Franco C. (6,619.59) (6,619.59) (6,619.59)Malay, Ernesto B. 20,910.00 20,910.00 20,910.00Martinez, Zenaida S. (7,943.50) (7,943.50) (7,943.50)Minas, Geraldine C. (2,100.00) (2,100.00) (2,100.00)Narciso, Wilfrida B. 5,295.67 5,295.67 5,295.67Naui, Elizabeth S. (50.00) (50.00) (50.00)Pacot, Marilou M. (7,943.50) (7,943.50) (7,943.50)Permalino, Albert Emmanuel S. 7,060.89 7,060.89 7,060.89Sagarino, Gavino N. (5,295.67) (5,295.67) (5,295.67)Salcedo, Liezel Donatila M <strong>17</strong>,190.24 <strong>17</strong>,190.24 <strong>17</strong>,190.24Salunga, Loida P. 14,960.54 14,960.54 14,960.54Salvado, Rowena E. 22,160.26 22,160.26 22,160.26Santos, Buenvenida 3,971.75 3,971.75 3,971.75Santos, Katherine Vera A. (32.50) (32.50) (32.50)Santos, Melody Christian R. 3,909.51 3,909.51 3,909.51Simo, Rickson Jay (21,182.72) (21,182.72) (21,182.72)Tia, Christopher B. (0.03) (0.03) (0.03)Trinidad, Josefina M. 1,690.82 1,690.82 1,690.82Villanueva, Rosalie R. (10,591.34) (10,591.34) (10,591.34)Villegas, Ma. Marissa M. (10,591.34) (10,591.34) (10,591.34)Villorente, Elizabeth F. 1,323.91 1,323.91 1,323.91Vinluan, Renato A. 2,028.62 2,028.62 2,028.62Total P 2,916,856.23 - 1,269,875.56 P - 1,646,980.67 1,646,980.67Ending
Name and Designation of DebtorBeginningBalanceAdditionsDeductionsAmountAmountDeducted Written-OffCurrent Non-CurrentEndingAmpatin, Estrella V. (560.00) (560.00) (560.00)Cabasada, Albert R. III 26,099.35 26,099.35 26,099.35Caratao, Jinky Rosario 6,800.00 6,800.00 6,800.00Cruz, Reynaldo J. (5,000.00) (5,000.00) (5,000.00)Diwa, Alvin S. 31,783.91 31,783.91 31,783.91Frades, Francisca B. (451.32) (451.32) (451.32)Garin, May C. 46,130.23 46,130.23 46,130.23Molina, Mark Oliver P. (5,232.06) (5,232.06) (5,232.06)Paraiso, Lourdes Oliva 0.20 0.20 0.20Pizaro, Arthur 1,200.00 1,200.00 1,200.00Sarabia, Juliet S. 4,755.00 4,755.00 4,755.00Soria, Eulegio 1,777.00 1,777.00 1,777.00Tolentino, Rosula R. 8,646.70 8,646.70 8,646.70Villanueva, Romulo 5,212.00 5,212.00 5,212.00Villar, Gerald 20,388.77 34.30 20,354.47 20,354.47Yang, Gloria G. 11,760.00 11,760.00 11,760.00TOTAL P 3,070,166.01 - 1,269,909.86 P - 1,800,256.15 1,800,256.15JANUARY 2008 - MARCH 2010Abala, GenelinP 155.00 P 155.00 155.00Abanco, Nini Paz M. (155.00) (155.00) (155.00)Abella, Bernard 3.88 3.88 3.88Adil, Mary Antoinette 200.00 200.00 200.00Agnes, Reynold D. 30,128.00 25,128.00 5,000.00 5,000.00Agudong, Julito A. 1,480.00 1,480.00 1,480.00Aguila, Fitzgerald 11,000.00 1,895.09 9,104.91 9,104.91Aguilar, Manuel P. 1,500.00 3,823.50 1,500.00 3,823.50 3,823.50Aguilar, Sarah Joy A. 19,650.00 19,650.00 19,650.00Agustin, Ma. Theresa A. 10,792.75 10,465.05 327.70 327.70Ahmadzadeh, Teresita 710.62 1,094.45 810.62 994.45 994.45Alagao, Ma. Cristina T. 183.68 550.00 367.01 366.67 366.67Alarde, Crispulo, Jr. 660.00 76,565.00 60,695.85 16,529.15 16,529.15Alcoberes, Philip Jay N. (1,000.00) (1,000.00) (1,000.00)Alcoriza, Jennifer M. (600.00) (600.00) (600.00)Aldeguer, Christine Carpio 4,140.00 1,780.00 2,360.00 2,360.00Alimuin, Sylvia A. 1,350.12 8,682.00 6,566.12 3,466.00 3,466.00Alvarez, Alfredo R. 20,588.20 18,961.45 1,626.75 1,626.75Andrada, Gaylene H. (733.40) 1,147.00 947.00 (533.40) (533.40)Angel, Heherson M. 3,243.00 281.25 2,961.75 2,961.75Angeles, Lemuel 600.00 100.00 500.00 500.00Anido, Cecilia I. 4,386.67 1,009,285.90 5,823.82 1,007,848.75 1,007,848.75An Lim, Jaime L. 119,500.00 88,182.00 <strong>17</strong>6,682.00 31,000.00 31,000.00Apolonio, Jerry D. 431.50 281.50 150.00 150.00Arabia, Julieta S. 16,629.90 92,992.80 83,336.90 26,285.80 26,285.80Arago, Teodulfo A. 2,253.40 1,<strong>17</strong>8.00 1,075.40 1,075.40Areola, Vina 7,700.00 7,700.00 7,700.00Arquiza, Glenda 73,000.00 <strong>17</strong>9,724.25 199,130.25 53,594.00 53,594.00Arriola, Eric John C. (200.00) 200.00 200.00 (200.00) (200.00)Asis, Amelia B. 5,064.50 64.50 5,000.00 5,000.00Atanacio, Heidi C. 3,467.00 3,467.00 3,467.00Atanque, Aurora L. 14,789.40 32.00 18,632.00 (3,810.60) (3,810.60)Ayson, Paulino 632.75 632.75 632.75Ayson, Rosalino P. 10,027.63 12,757.30 15,956.28 6,828.65 6,828.65Baccay, Yolanda A. 20,000.00 8,611.05 27,057.55 1,553.50 1,553.50Badiola, Jose Luisito V. 200.00 200.00 200.00Baello, Christine N. 22,271.00 18,610.65 3,660.35 3,660.35
Name and Designation of DebtorBeginningBalanceAdditionsDeductionsAmountAmountDeducted Written-OffCurrent Non-CurrentBaja, Lauro 996.25 996.25 996.25Balaoro, Maria Theresa (200.00) 100.00 100.00 (200.00) (200.00)Balarosan, Edna G. 2,193.34 28,970.00 13,314.59 <strong>17</strong>,848.75 <strong>17</strong>,848.75Balita, Paulita C. 34,708.73 46,000.00 58,921.96 21,786.77 21,786.77Bantayan, Maria Emilia R. 8,350.00 2,639.92 5,710.08 5,710.08Baquiran, Leonidez 200.00 200.00 200.00Barro, Liana M. 11,095.02 10,<strong>17</strong>5.02 920.00 920.00Barroga, Junalyn 145.00 145.00 145.00Batan, Ericson S. 1,516.60 1,516.60 1,516.60Batoon, Allen 850.00 850.00 850.00Bautista, Juan Andres 10,572.00 10.00 10,562.00 10,562.00Baylon, Milagros D. 297.50 297.00 0.50 0.50Bejo, Noel B. 4,604.50 634.50 3,970.00 3,970.00Belardo, Amy G. 1,750.00 23,665.50 1,750.00 23,665.50 23,665.50Belaya, Vina Grace C. (1,862.40) 4,412.70 2,295.90 254.40 254.40Belleza, Asuncion L. 40,811.00 93,547.74 96,900.74 37,458.00 37,458.00Bello, Yolanda L. 8,492.00 5,078.75 3,413.25 3,413.25Beltran, Edna M. 7,500.00 37,985.00 32,985.00 12,500.00 12,500.00Beltran, Manuel D. 550.00 600.00 (50.00) (50.00)Belza, Mercedes A. 14,583.80 62,089.09 64,257.91 12,414.98 12,414.98Bengo, Manuelito V. 36,653.99 32,126.84 4,527.15 4,527.15Bernado, Norma V. 13,400.90 8,702.35 4,698.55 4,698.55Bernardo, Rodrigo G. 21,412.00 6,999.00 6,999.00 21,412.00 28,411.00Bilan, Jeanette L. 1,326.18 1,326.18 1,326.18Bingculado, Roger B. 2,500.00 38,000.00 22,500.00 18,000.00 18,000.00Bisco, Melanie C. 10,000.00 10,000.00 10,000.00Bolo, Benjamin A. 69,121.09 62,454.41 6,666.68 6,666.68Botaslac, Benjamin D. 27,959.00 2,959.00 25,000.00 25,000.00Brillo, Eva B. 100,000.00 93,333.33 6,666.67 6,666.67Brillon, Cherish Aileen A. (25.00) (25.00) (25.00)Buen, Jennifer T. 6,948.00 5,029.00 1,919.00 1,919.00Buenafe, Ma. Belinda G. 1,773.76 80.01 1,693.75 1,693.75Buendia, Ma. Esperanza 20,000.00 20,000.00 20,000.00Bueno, Marivie 370.75 370.75 370.75Buot, Joseph 600.00 600.00 600.00Buquid, Apolonio A. 18,653.00 18,153.00 500.00 500.00Burac, Joseph T. 32,215.50 8,331.80 23,883.70 23,883.70Bustamante, Maria Christine H. 600.00 49,649.00 41,354.00 8,895.00 8,895.00Caagbay, Elpidio Z. 71,000.00 58,000.00 13,000.00 13,000.00Cabaltica, Leilani A. 57,386.67 145,183.50 163,721.42 38,848.75 38,848.75Cabasada, Albert R. III (12,300.00) 24.00 24.00 (12,300.00) (12,300.00)Cabilto, Gerardo P. 10,800.00 12,000.00 21,800.00 1,000.00 1,000.00Cabinta, Ma. Dolores B. 65,312.00 37,812.00 27,500.00 27,500.00Cabrera, Alicia M. 7,100.65 4,212.00 2,888.65 2,888.65Cabrera, Roberlyn V. 36,000.00 4,000.00 32,000.00 32,000.00Cada, Leonardo F. 13,650.66 12,463.76 1,186.90 1,186.90Cajucom, Cherry S. 4,386.67 14,590.00 11,327.92 7,648.75 7,648.75Cajucom, Marie Christine B. 850.00 850.00 850.00Camaclang, Merlita J. 6,569.62 63,534.00 46,103.62 24,000.00 24,000.00Camana, Love V. 2,675.00 27,888.25 26,775.75 3,787.50 3,787.50Campomanes, Carolina 1.00 6.00 (5.00) (5.00)Canare, Sabino C. (375.00) (375.00) (375.00)Cando, Cromwell N. 4,000.00 36,696.85 37,000.00 3,696.85 3,696.85Canilao, Fe V. 104,386.67 8,970.00 105,507.92 7,848.75 7,848.75Canosa, Michelle 20,000.00 20,000.00 20,000.00Cao, Marilou F 18,925.75 18,425.75 500.00 500.00Capacio, Glenn (5,000.00) (5,000.00) (5,000.00)Capili, Leslie Ann V. 100.00 1,920.00 (1,820.00) (1,820.00)Capili, Regina R. (418.13) 6,623.85 3,464.87 2,740.85 2,740.85Carino, Raquel G. 4,598.00 4,598.00 4,598.00Carlos, Salome S. (850.00) 498.50 498.50 (850.00) (850.00)Carpio, Miguel M. 53,124.50 204.50 52,920.00 52,920.00Carpio, Rustica 1,788.00 1,788.00 1,788.00Castillo, Carolina 24,000.00 45,937.00 34,937.00 35,000.00 35,000.00Ending
Name and Designation of DebtorBeginningBalanceAdditionsDeductionsAmountAmountDeducted Written-OffCurrent Non-CurrentCastro, Joeven R. 5,158.79 8,970.02 6,280.06 7,848.75 7,848.75Casuco, Leonida S. (14,614.40) 35,002.50 8,002.50 12,385.60 12,385.60Cayetano, Lovella M. 6,000.00 25,000.00 29,681.81 1,318.19 1,318.19Chastein, Cherry R. 10,000.00 10,000.00 10,000.00Chua, Wilson S. 5,000.00 4,450.00 550.00 550.00Ciubal, Willie Y. 3,150.00 136.00 3,886.00 (600.00) (600.00)Corpuz, Cristina R. 650.00 150.00 500.00 500.00Cotorno, Lorine B. 13,600.00 8,800.00 4,800.00 4,800.00Cruz, Benjamin F. 25,000.00 30,000.00 (5,000.00) (5,000.00)Cruz, Christybel O. 45,000.00 40,500.00 4,500.00 4,500.00Cruz, Noel L. 20,433.91 46,956.47 66,796.13 594.25 594.25Cruz, Rebecca S. 30,992.50 992.50 30,000.00 30,000.00Cuibillas, Jorge P. 8,464.50 5,043.75 3,420.75 3,420.75Culala, Harold John D. 30,000.75 21,000.75 9,000.00 9,000.00Dacayanan, Marites G. (237.04) 5,014.50 5,014.50 (237.04) (237.04)Daguman, Ian 650.00 650.00 650.00Dalton, Juanita 6<strong>17</strong>.50 6<strong>17</strong>.50 6<strong>17</strong>.50Damasco, Charmaine Gay 1,022.00 1,639.50 (6<strong>17</strong>.50) (6<strong>17</strong>.50)Davalos, Zenaida R. 250.00 250.00 250.00David, Melvira C. (335.00) (335.00) (335.00)Decena, May Celine 272.00 272.00 272.00Defino, Lorna M. 492.00 222.00 270.00 270.00Destura, Blanca 10,749.58 74,690.25 51,638.43 33,801.40 33,801.40Diamante, Fernan M. 26,430.20 5,672.00 20,758.20 20,758.20Diaz, Joel 850.00 850.00 850.00Dimaano, Jessalyn 15,000.00 15,000.00 15,000.00Dimalibot, Ma. Martina Geraldine 200.00 200.00 200.00Diorico, Marites C. 24,487.60 15,812.50 8,675.10 8,675.10Dios, Rolando Gerald 200.00 200.00 200.00Dizon, Kenneth Earl I. 200.00 200.00 200.00Doble, Jon Derek 52,800.00 24,000.00 28,800.00 28,800.00Doctolero, Priscila L. 737.25 664.50 72.75 72.75Domingo, Ernesto E. 200.00 200.00 200.00Dominguez, Rex S. 24,339.66 39,100.00 63,439.16 0.50 0.50Dones, Irene P. 27,400.00 1,344.00 28,844.00 (100.00) (100.00)Dublin, Marietta T. 1,756.15 68.00 1,688.15 1,688.15Ducut, Mirela G. 37,164.60 30,342.20 49,398.10 18,108.70 18,108.70Dulalia, Nelson M. 1,450.00 (1,450.00) (1,450.00)Durban, Joel M. 966.60 (966.60) (966.60)Dy Kam, Felicidad 1,025.00 (1,025.00) (1,025.00)Echauz, Lydia B. 50,000.00 57,549.35 50,000.00 57,549.35 57,549.35Eleazar, Glenda C. 34,386.67 44,984.75 43,967.11 35,404.31 35,404.31Enriquez, Rex Cezar P. (200.00) 975.00 975.00 (200.00) (200.00)Ermitano, Nolivienne C. (237.50) (237.50) (237.50)Escobia, Irma L. <strong>17</strong>,500.01 16,250.01 1,250.00 1,250.00Escobia, Jaime T. 23,300.00 20,970.00 2,330.00 2,330.00Escosia, Aurora A. 5,869.06 28,775.75 27,096.31 7,548.50 7,548.50Esguerra, Anna Leah R. 200.00 200.00 200.00Esguerra, Marissa B.. 203.00 563.00 (360.00) (360.00)Espinosa, William V. 56,420.00 62,420.00 (6,000.00) (6,000.00)Espiritu, Elizabeth O. 1,537.34 11,868.90 4,114.70 9,291.54 9,291.54Estacio, Ma. Vivian G. 13,773.33 34,408.50 19,499.74 28,682.09 28,682.09Estrella, Luisito P. 5,700.00 <strong>17</strong>,500.00 22,400.00 800.00 800.00Evangelista, Erika <strong>17</strong>,375.00 <strong>17</strong>,375.00 <strong>17</strong>,375.00Evangelista, Rey M. 28,309.19 92,850.60 62,706.25 58,453.54 58,453.54Fajardo, Rolando 2,150.00 (2,150.00) (2,150.00)Ferareza, Rimar 250.00 250.00 250.00Fernandez, Rosana S. (2,500.00) 6,366.60 6,366.60 (2,500.00) (2,500.00)Fernando, Gerry V. 20,000.00 64,392.01 51,540.47 32,851.54 32,851.54Fernando, Rogelio E. 5,000.00 1,000.00 4,000.00 4,000.00Fiesta, Erlinda P. 55,913.20 3,000.00 52,913.20 52,913.20Flora, Dolores 10,774.33 8,388.67 2,385.66 2,385.66Flores, Floriza Ann 18,000.00 18,000.00 18,000.00Flores, Ma.Cecilia D. 100.00 100.00 100.00Ending
Name and Designation of DebtorBeginningBalanceAdditionsDeductionsAmountAmountDeducted Written-OffCurrent Non-CurrentFlores, Miguela Trinidad 43,333.33 39,000.00 72,750.00 9,583.33 9,583.33Flores, Roberto C. 140,000.00 56,000.00 84,000.00 84,000.00Flores, Teresita T. 3,090.50 66.50 3,024.00 3,024.00Foronda, John Clarence 1,000.00 1,000.00 1,000.00Fortaleza, Ramon M. 2,011.35 2,011.35 2,011.35Frades, Francisca B. 37,482.00 38,990.25 61,022.25 15,450.00 15,450.00Fronda, Adelaida C. (1,000.00) 5,273.75 972.00 4,301.75 (1,000.00) 3,301.75Galo, Crispin L. 6,550.25 6,550.25 6,550.25Garcia, Dolores A. 100.00 100.00 100.00Garcia, Miriam 9,038.12 21,392.25 20,753.12 9,677.25 9,677.25Garcia, Mylene M. 20,035.00 18,035.00 2,000.00 2,000.00Garcia, Myllah D. 7,615.90 7,576.90 39.00 39.00Garcia, Severino M. 66,664.00 206,974.75 <strong>17</strong>3,638.75 100,000.00 100,000.00Garrido, Elma C. 5,775.45 0.50 5,774.95 5,774.95Gaspillo, Rudy M> 20,621.55 20,621.55 20,621.55Gella, Delia D. 200.00 200.00 200.00Gella, Frederick S. (2,000.10) (2,000.10) (2,000.10)Gemzon, Elena F. 3,655.33 9,145.00 4,951.58 7,848.75 7,848.75Gerardo, Elsa F. 975.00 (975.00) (975.00)Gervacio, Ma. Cristina SJ. (240.00) 5,383.00 5,383.00 (240.00) (240.00)Gilera, Enrico G. 68,315.74 100,855.50 79,<strong>17</strong>1.24 90,000.00 90,000.00Golloso, Helen E. 4,499.99 5,000.00 (500.01) (500.01)Gonzales, Emmanuel S. 629.25 629.25 629.25Gorod, Flordeliza N. 66,630.92 57,186.52 9,444.40 9,444.40Grasparil, James Andrew (1,575.00) (1,575.00) (1,575.00)Guarin, Ellen G. 400.00 400.00 400.00Gubio, James B. 2,400.00 24,702.60 14,254.20 12,848.40 12,848.40Guevarra, Dorvin H. 32,034.93 18,<strong>17</strong>1.74 13,863.19 13,863.19Guevarra, Ma. Theresa M. (425.00) 31,8<strong>17</strong>.50 28,647.80 3,169.70 (425.00) 2,744.70Guevarra, Remedios P. 50,020.00 25,020.00 25,000.00 25,000.00Gurrea, Ruby 200.00 200.00 200.00Gusi, Rechilda D. 821.40 11,134.05 4,609.90 7,345.55 7,345.55Gutierrez, Lucita A. 29,080.50 28,<strong>17</strong>2.50 908.00 908.00Guzman, Barbara Michelle 910.50 933.50 (23.00) (23.00)Guzman, Guillerma M. 31,963.00 4,963.00 27,000.00 27,000.00Guzman, Ma. Corazon A. 21,503.44 22,503.44 (1,000.00) (1,000.00)Hatt, Cielito Sanvictores 12,111.35 979.50 14,065.85 (975.00) (975.00)Hernandez, Jan Joseph S. 1,186.45 1,186.45 1,186.45Hizon, Irma L. 6,586.00 6,386.00 200.00 200.00Ibalio, Dyann A. 7,295.80 7,295.00 0.80 0.80Ignacio, Lourdes D. 30,991.57 35,000.00 50,991.57 15,000.00 15,000.00Iguas, Jose A. 11,107.70 9,486.75 15,800.05 4,794.40 4,794.40Inciong, Cherry Wyne 477.00 7,402.00 6,699.00 1,180.00 1,180.00Indico, Julie Ann 348.50 348.50 348.50Ireneo, Elsa A. 20,000.00 20,000.00 20,000.00Isidro, Teresita L. 4,241.00 62,890.76 26,872.99 40,258.77 40,258.77Jamisod, Rafael 600.00 600.00 600.00Jamon, Romano M. 200.00 200.00 200.00Janagap, Fe Q. 52,274.90 37,921.65 14,353.25 14,353.25Jarlos, Anna Liza 3,655.33 32,070.00 12,936.58 22,788.75 22,788.75Jauco, Magdalena 7,303.10 3,182.75 4,120.35 4,120.35Javier, Mary Jacquelou 200.00 200.00 200.00Jerusalem, Violeta L. 45,737.28 118,694.50 <strong>17</strong>3,801.26 (9,369.48) (9,369.48)Jesus, Angelita SD. 4,386.67 58,964.58 45,381.25 <strong>17</strong>,970.00 <strong>17</strong>,970.00Jimenez, Arsenia S. 28,150.00 18,150.00 10,000.00 10,000.00Jintalan, Elma C. 42,290.00 34,000.00 8,290.00 8,290.00Joloya, Ma. Aura Christine 361.00 234.00 127.00 127.00Jose, Angelina P. 341,383.87 50,000.00 341,383.87 50,000.00 50,000.00Julio, Beata R. 16,897.45 1,618.50 15,278.95 15,278.95Junio, Nenitha L. 125.00 125.00 125.00Kenny Isabel 50,000.00 50,000.00 50,000.00Knuttel, Jens 7,948.30 7,948.30 7,948.30Ko, Robert H. 192.00 62.00 130.00 130.00Kuan, Robert 543,032.13 50,000.00 543,032.13 50,000.00 50,000.00Ending
Name and Designation of DebtorBeginningBalanceAdditionsDeductionsAmountAmountDeducted Written-OffCurrent Non-CurrentLacanilao, Gary 375.00 375.00 375.00Ladera, Renville M. (38.00) 28,136.75 23,000.00 5,098.75 5,098.75Lajara, Galilea R. 91,256.09 80,426.19 10,829.90 10,829.90Lakian, Teodosio (1,650.00) (1,650.00) (1,650.00)Lamorena, Juditha M. 42,000.00 192,012.28 167,321.10 66,691.18 66,691.18Lansang, Brenda 650.00 116,377.52 116,827.52 200.00 200.00Lapastora, Milagros 6,665.00 76,345.85 69,138.50 13,872.35 13,872.35Lauro, Jocelyn P. 9,799.00 38,297.00 39,521.88 8,574.12 8,574.12Laxamana, Rachel D. 23,380.00 21,042.00 2,338.00 2,338.00Lee, Nestor 4,386.67 1,483.25 4,6<strong>17</strong>.67 1,252.25 1,252.25Leon, Angelito Y. 53,970.00 45,000.00 8,970.00 8,970.00Leon, Emma Rose H. 3,741.00 23,674.75 41,265.75 (13,850.00) (13,850.00)Leon, Jocelyn E. 2,193.34 10,730.00 3,930.59 8,992.75 8,992.75Leonardo, Marietta 20,515.00 22,285.00 (1,770.00) (1,770.00)Leonardo, Violeta M. 135,299.50 110,299.50 25,000.00 25,000.00Lepon, Ma. Luisa M. 250.00 5,000.00 8,250.00 (3,000.00) (3,000.00)Letrero, Bernard 1,550.00 162.75 62.75 1,650.00 1,650.00Lim, Royce Randall 200.00 200.00 200.00Limon, Miguel Antonio P. 100.00 100.00 100.00Lindo, Alicia C. 15,624.00 26,947.90 37,629.95 4,941.95 4,941.95Lojo, Joanne Marie 20,000.00 20,000.00 20,000.00Lopez, Antonio C. 26,244.62 20,512.15 18,432.12 28,324.65 28,324.65Lopez, Mercedita P. 46,239.00 <strong>17</strong>,947.00 28,292.00 28,292.00Lopez, Ricardo S. 15,891.80 19,936.66 32,828.42 3,000.04 3,000.04Lopez, Ruelda A. 5,000.00 5,000.00 5,000.00Loyola, Voltaire 72.00 72.00 72.00Lumacad, Fernando B. (32,539.00) 50.33 50.33 (32,539.00) (32,488.67)Luyun, Teofilo P. Jr. 8,446.94 9,570.00 10,168.19 7,848.75 7,848.75Mabborang, Mishel T. 200.00 200.00 200.00Macalintal, Connie SJ. 6,345.01 5,000.01 1,345.00 1,345.00Macapagal, Arnualdo B. 45,950.50 240,847.74 236,788.00 50,010.24 50,010.24Macaraig, Melinda 11,755.30 8,994.50 2,760.80 2,760.80Macasaet, Grace Minerva 1,044.00 5,092.75 6,101.00 35.75 35.75Madria, Emenvenciano 650.00 650.00 650.00Magayaga, Lea Q. 1,200.00 800.00 400.00 400.00Magbuhat, Frances Ann 15,000.00 15,000.00 15,000.00Magmanlac, Mark Roland 20,000.00 20,000.00 20,000.00Mahilum, Rosalinda S. 200.00 200.00 200.00Malcampo, Agnes C. 35,085.00 25,539.56 9,545.44 9,545.44Maliwat, Herminia I. 112,145.31 103,224.00 110,110.37 105,258.94 105,258.94Mamaid, Melanie P. 39,684.00 39,3<strong>17</strong>.33 366.67 366.67Manalansan, Paolo F. 6,250.00 10,063.00 12,713.00 3,600.00 3,600.00Manalo, Evelyn P. 10,000.00 10,000.00 10,000.00Manalo, Marilou 15,000.00 15,000.00 15,000.00Manaois, Mario B. 2,104.20 2,104.20 2,104.20Manguerra, Laarni C. 1,000.00 5,000.00 5,000.00 1,000.00 1,000.00Marcelino, Ariel Christopher 19,669.00 <strong>17</strong>,702.10 1,966.90 1,966.90Marcelo, Gerry A. 4,386.67 8,257.00 5,473.05 7,<strong>17</strong>0.62 7,<strong>17</strong>0.62Marcial, Maridel S. 14,444.51 671.00 13,619.26 1,496.25 1,496.25Mariano, Maria Lourdes A. 9,196.00 9,196.00 9,196.00Maristela, Teresita 215.00 215.00 215.00Martin, Wilhelmina E. 2,901.25 1,406.25 1,495.00 1,495.00Mateo, Jacinto C. Jr. 35,024.25 30,024.25 5,000.00 5,000.00Mazo, Flaviano S. 9,781.77 13,326.75 10,867.50 12,241.02 12,241.02Medel, Mervin 200.00 200.00 200.00Medina, Buenaventura Jr. 1,050.00 1,050.00 1,050.00Medina, Joy E. 600.00 43,193.25 42,483.73 1,309.52 1,309.52Melchor, Elizabeth P. 1,336.50 724.50 612.00 612.00Mendoza, Cecilia H. 200.00 200.00 200.00Mendoza, Gloria A. 7,447.25 2,419.25 5,028.00 5,028.00Mendoza, Simplica A. 12,203.00 25,702.68 (13,499.68) (13,499.68)Menez, Karren G. 6,000.00 34,738.00 39,740.00 998.00 998.00Menorca, Emmanuel S. 27,642.00 13,300.76 14,341.24 14,341.24Mercado, Valerie Grace P. 30,000.00 30,000.00 30,000.00Ending
Name and Designation of DebtorBeginningBalanceAdditionsDeductionsAmountAmountDeducted Written-OffCurrent Non-CurrentMesina, Karen T. (4,000.00) (4,000.00) (4,000.00)Miguel, Emmanuel C. 200.00 200.00 200.00Mina, Enrique N. 293.50 200.00 93.50 93.50Minas, Geraldine C. 9,316.00 12,288.00 (2,972.00) (2,972.00)Mintu, Cynthia B. 2,110.50 1,800.00 310.50 310.50Mitra, Melvin P. 552.35 552.35 552.35Molina, Ma. Olivia G. 59,120.00 49,120.00 10,000.00 10,000.00Molina, Mark Oliver P. 4,386.67 8,970.00 5,507.92 7,848.75 7,848.75Monderin, Victor C. 2,577.00 321.50 2,255.50 2,255.50Monfero, Rowena A. 6,000.00 36,149.75 38,404.00 3,745.75 3,745.75Montano, Moses M. 941.67 941.67 941.67Montinola, Aurelio R. III 274,838.73 50,000.00 274,838.73 50,000.00 50,000.00Montinola, Gianna R. 387,795.94 50,000.00 387,795.94 50,000.00 50,000.00Montinola, Lourdes R. 1,800,488.76 50,000.00 1,800,488.76 50,000.00 50,000.00Morilla, Toriana A. 850.00 850.00 850.00Mostajo, Esmeralda D. 12,000.00 53,998.00 55,438.75 10,559.25 10,559.25Nagal, Glenn Z. 0.33 200,000.00 198,000.66 1,999.67 1,999.67Nagtalon, Leo Angelo 640.00 640.00 640.00Najjar, Mary Chastine T. 3,130.80 33,752.90 27,364.40 9,519.30 9,519.30Naui, Elizabeth S. (93.75) 272.00 272.00 (93.75) (93.75)Navarro, Lilibeth C. 200.00 200.00 200.00Nebril, Jonathan A. 5,000.00 2,025.00 2,118.00 4,907.00 4,907.00Nicdao, Lazaro B. 8,758.80 1,114.70 8,762.80 1,110.70 1,110.70Nicer, Joselito C. 22,272.72 61,754.50 55,608.72 28,418.50 28,418.50Nicolas, Crispinita 190.00 190.00 190.00Nob, Rene M. (1,800.00) (1,800.00) (1,800.00)Norcio, Glen R. 644.00 744.00 (100.00) (100.00)Noriega, Mariwilda 11,616.76 40,448.13 28,733.16 23,331.73 23,331.73Nuestro, Sarah A. 150.00 150.00 150.00Nulla, Mila R. 43,857.00 118,933.95 98,974.00 63,816.95 63,816.95Oaferina, Gemmalyn A. (1,000.04) 9,451.25 10,382.55 (1,931.34) (1,931.34)Olivares, Joh Paul T. 78,200.00 57,200.00 21,000.00 21,000.00Omampo, Rolando B. 27,278.00 27,278.00 27,278.00Ondevilla, Miel Kristian 4,500.00 110.00 1,010.00 3,600.00 3,600.00Orias, Ronito B. 4,000.00 713.01 2,713.01 2,000.00 2,000.00Orolfo, Teodora C. 11,184.00 60,763.35 66,913.00 5,034.35 5,034.35Orozco, Glorina P. 14,366.50 14,366.50 14,366.50Pacquing, Elizabeth P. 4,386.67 19,561.50 11,777.55 12,<strong>17</strong>0.62 12,<strong>17</strong>0.62Padilla, Leo A. 348.50 348.50 348.50Padual, Jennifer C. 30,000.00 5,000.00 25,000.00 25,000.00Pagdilao, Menchie C. 100.00 100.00 100.00Paguirigan, Viviana 1,443.25 1,443.25 1,443.25Pahutan, Ludivinia M. (1,000.00) 3.25 3.25 (1,000.00) (1,000.00)Pal, Salvacion A. 10,000.00 6,439.65 15,006.00 1,433.65 1,433.65Palaje, Joseph M. 400.00 400.00 400.00Palencia, Marjueve M. (1,000.00) 800.00 800.00 (1,000.00) (1,000.00)Palis, Fernando F. 2,250.00 8,688.45 10,081.30 857.15 857.15Palparan, Karoline L. 35,569.51 5,569.51 30,000.00 30,000.00Panesa, Isabelita A. 3,892.55 2,757.50 1,135.05 1,135.05Panganiban, Don Brendo 20,000.00 20,000.00 20,000.00Pantas, Felix L. Jr. 5,492.01 22,132.75 11,927.26 15,697.50 15,697.50Panzo, Salome V. 1,087.50 362.50 725.00 725.00Paraiso, Jesus R. 65,430.95 15,607.25 49,823.70 49,823.70Paras, Renato 50,000.00 50,000.00 50,000.00Pascua, Jennifer J. 4,000.00 650.00 650.00 4,000.00 4,650.00Pascual, Danilo S. 9,<strong>17</strong>5.00 9,<strong>17</strong>5.00 9,<strong>17</strong>5.00Pataunia, Ma. Cecilia C. (1,583.50) 343.00 343.00 (1,583.50) (1,583.50)Paz, Rosalinda Z. 13,160.00 28,521.75 25,984.25 15,697.50 15,697.50Pearson, Lou Dominic 57,663.75 57,663.75 57,663.75Pelaez, Felimon P. 7,344.00 594.00 6,750.00 6,750.00Pening, Teodoro 10,655.42 70,342.05 28,<strong>17</strong>7.67 52,819.80 52,819.80Perez, Hector 2,166.66 43,851.25 40,563.91 5,454.00 5,454.00Perez, Winnie E. (50.00) 37,954.25 37,954.25 (50.00) (50.00)Pineda, Rodolfo G. (655.25) (655.25) (655.25)Ending
Name and Designation of DebtorBeginningBalanceAdditionsDeductionsAmountAmountDeducted Written-OffCurrent Non-CurrentPizaro, Arthur P. 4,500.00 9,023.00 5,923.00 7,600.00 7,600.00Polido, Maria Myrel M.. 7,500.00 15,855.50 22,105.50 1,250.00 1,250.00Ponsaran, Levy C. 1,500.00 5,628.75 3,478.75 3,650.00 3,650.00Presas, Heinrich G. (2,500.00) 20,000.00 20,000.00 (2,500.00) (2,500.00)Punsalan, Angelita 973.25 161.75 811.50 811.50Quijano, Arianne 10,000.00 10,000.00 10,000.00Quinto, Myrna P. 46,905.00 43,405.00 3,500.00 3,500.00Ramirfez, Marnel 20,000.00 20,000.00 20,000.00Ramos, Bernadette 39,000.00 6,850.91 44,996.96 853.95 853.95Ramos, Henry C. 9,000.00 5,000.00 5,000.00 9,000.00 9,000.00Ramos, Leonora A. 34,575.00 6,975.00 27,600.00 27,600.00Ramos, Rebben Japheth 15,000.00 15,000.00 15,000.00Ramos, Teodorica L. 44,000.00 37,500.00 6,500.00 6,500.00Rana, Aurelio Y. 120,422.10 46,387.75 74,034.35 74,034.35Rapirap, Raquel T. 59,136.67 54,187.00 91,141.59 22,182.08 22,182.08Rayos, Nancy 20,000.00 20,000.00 20,000.00Reambonanza, Maria Teresita 20,000.00 20,000.00 20,000.00Remiendo, Nora Liza A. 2,333.34 27,201.00 31,867.67 (2,333.33) (2,333.33)Restor, Nerissa A. 30,784.00 28,500.90 2,283.10 2,283.10Resuello, Heidi 200.00 200.00 200.00Retardo, Victor Cezar 25,027.00 5,027.00 20,000.00 20,000.00Reyes, Melodia S. 8,773.33 34,160.00 19,387.08 23,546.25 23,546.25Reyes, Mercedes C. <strong>17</strong>,036.60 47,104.15 38,482.40 25,658.35 25,658.35Reyes, Richard R. (212.00) 3,192.00 264.00 2,716.00 2,716.00Reyes, Richard Anthony 20,000.00 20,000.00 20,000.00Reyes, Richard Glenn C. 31,405.50 27,098.75 4,306.75 4,306.75Reyes, Rosa M. 0.25 0.25 0.25Rimano, Joy S. 2,490.00 5,550.00 7,673.33 366.67 366.67Rito, Estrellita S. 15,253.<strong>17</strong> 10,253.<strong>17</strong> 5,000.00 5,000.00Rosal, Josefina T. 43,940.00 28,940.00 15,000.00 15,000.00Rosario, Enrico 450.00 150.00 300.00 300.00Rosario, Ma. Theresa O. 4,155.50 2,3<strong>17</strong>.75 1,837.75 1,837.75Rosario, Warly Evelyn 10,288.96 26,954.15 25,537.46 11,705.65 11,705.65Rubillos, Leonardo I. 10,000.00 11,000.00 (1,000.00) (1,000.00)Rufo, Rowena O. 1,997.26 1,220.26 777.00 777.00Ruzol, Hipolito 850.00 850.00 850.00Sabas, Angel Francisco 612.80 4,521.51 2,070.80 3,063.51 3,063.51Sabaupan, Sylvette G. 47,089.51 40,380.41 6,709.10 6,709.10Salagubang, Reulay Kay B. 10,000.00 10,000.00 10,000.00Salloman, Philip M. 28,594.10 11,479.85 <strong>17</strong>,114.25 <strong>17</strong>,114.25Salvador, Paulino 50.00 50.00 50.00Samarita, Mercy Cristy B. 8,150.81 7,744.31 406.50 406.50Samson, Leylani H. 34,450.00 9,450.00 25,000.00 25,000.00Santaren, Emma C. 31,028.30 30,160.40 867.90 867.90Santos, Carmelita 852.00 342.00 510.00 510.00Santos, Leonida 13,160.00 27,081.50 16,695.25 23,546.25 23,546.25Santos, Marilou D. 1,100.00 366.67 733.33 733.33Saplala, Mariano F. 4,386.67 13,200.50 9,738.42 7,848.75 7,848.75Sarabia, Juliet C. 22,167.41 77,855.75 79,476.19 20,546.97 20,546.97Sasis, Florentino I. 53,609.80 5,000.00 48,609.80 48,609.80Sayat, Ruby DG. 5,000.00 2,500.00 2,500.00 2,500.00Simbol, Elvira C. 15,458.25 5,000.00 10,458.25 10,458.25Simo, Rickson Jay P. 200.00 200.00 200.00Siongco, Josephine C. 9,613.95 6,567.00 3,046.95 3,046.95Sioson, Yolanda J. 32,530.02 31,467.02 1,063.00 1,063.00Sison, Erlinda G. 10,136.85 100.00 10,036.85 10,036.85Sison, Roger Amadeo (290.00) 200.00 200.00 (290.00) (290.00)Sison, Waltedrudes M. 1,862.40 1,862.40 1,862.40Solano, Maria S. 5,600.00 5,700.00 (100.00) (100.00)Soliman, Norma P. 14,475.75 11,453.00 3,022.75 3,022.75Solivio, Rosalie E. 35,099.95 35,008.75 91.20 91.20Soriano, Carol Bongar 1,246.00 1,246.00 1,246.00Soriano, Myla Grace 200.00 200.00 200.00Sta.Cruz, Cinderella A. (4,200.00) 5,821.00 5,821.00 (4,200.00) (4,200.00)Ending
Name and Designation of DebtorBeginningBalanceAdditionsDeductionsAmountAmountDeducted Written-OffCurrent Non-CurrentSta.Maria, Hipolito M. 12,600.00 41,700.00 53,600.00 700.00 700.00Suba, Sally Chua 52,666.65 75,532.00 97,748.65 30,450.00 30,450.00Tagle, Susan H. 30,200.02 32,366.00 40,366.00 22,200.02 22,200.02Tajonera, Joan Patrick 12,088.85 12,088.85 12,088.85Talampas, Ma. Cristina J. 27,818.20 65,009.00 80,327.20 12,500.00 12,500.00Tamondong, Ivy 200.00 200.00 200.00Tampol, Eduardo 220.00 220.00 220.00Tan, Paulino 50,000.00 50,000.00 50,000.00Tanafranca, Enrico V. 983.00 833.00 150.00 150.00Tapalgo, Elyn M. 590.00 10,928.00 10,899.33 618.67 618.67Tapit, Neila E. 6,080.00 53,259.00 25,711.25 33,627.75 33,627.75Tayag, Evelyn R. 28,697.71 28,697.67 0.04 0.04Tecson, Wilfrido 50,000.00 50,000.00 50,000.00Temporosa, Bernard T. (4,212.00) 55,057.75 34,050.00 16,795.75 16,795.75Tiotangco, Angelina N. 54,871.25 23,071.25 31,800.00 31,800.00Tirazona, Renato L. 12,012.08 41,156.25 44,296.00 8,872.33 8,872.33Tizon, Dolores J. 2,193.34 9,290.00 3,634.59 7,848.75 7,848.75Togado, Illumar 2,000.00 8,000.00 8,666.65 1,333.35 1,333.35Tolentino, Rosula R. 12,151.35 11,112.95 1,038.40 1,038.40Topenio, Jimmy P. 11,978.75 5,306.00 6,672.75 6,672.75Torres, Maruja 414.00 414.00 414.00Torres, Teem 2,344.40 4.00 2,340.40 2,340.40Umpad, Mara 48,000.00 152,000.00 <strong>17</strong>6,000.00 24,000.00 24,000.00Urquico, Ma. Luisa 666.00 666.00 666.00Usita, Laarni P. 73,740.90 54,254.43 19,486.47 19,486.47Valderrama, Ruth D. 1,410.87 24,0<strong>17</strong>.10 16,349.53 9,078.44 9,078.44Valencia, Eufracia 670.25 670.25 670.25Valencia, Jean Pauline S. 53,795.25 44,795.26 8,999.99 8,999.99Valencia, Joy G. 3,490.95 522.00 2,968.95 2,968.95Valenzuela, Rowena B. 40,851.25 39,000.00 1,851.25 1,851.25Ending
Name and Designation of DebtorBeginningBalanceAdditionsDeductionsAmountAmountDeducted Written-OffCurrent Non-CurrentVanguardia, Cesar G. 11,775.00 1,775.00 10,000.00 10,000.00Velasco, Maria Luisa R. 200.00 200.00 200.00Velasquez, Damian D. (4,100.00) <strong>17</strong>,283.00 <strong>17</strong>,283.00 (4,100.00) (4,100.00)Velasquez, Ma. Charisma B. 1,000.00 5,002.25 5,002.25 1,000.00 1,000.00Velasquez, Willyn V. 4,000.00 5,600.00 10,600.00 (1,000.00) (1,000.00)Vera, Alpher 10,000.00 27,284.00 33,423.74 3,860.26 3,860.26Vera, Liorinda D. 779.94 779.94 779.94Vera, Michael R. 5,000.00 239.50 239.50 5,000.00 5,000.00Vergara, Febes 200.00 200.00 200.00Vibas, Danilo T. 11,424.26 11,424.26 11,424.26Vicera, Reynante P. (1,300.00) (1,300.00) (1,300.00)Victoria, Michael S. 8,773.33 23,274.50 16,350.33 15,697.50 15,697.50Victoria, Wendelliza M. 6,402.80 28,914.15 32,498.75 2,818.20 2,818.20Villanueva, Ma. Concepcion (497.30) 13,718.36 6,896.50 6,324.56 6,324.56Villanueva, Ruth 650.00 650.00 650.00Villapando, Marimel A. (50.00) 9,846.00 6,780.66 3,015.34 3,015.34Villar, Gerald L. 41,570.25 33,519.00 8,051.25 8,051.25Villaroya, Robinson L. (4,000.00) (4,000.00) (4,000.00)Villegas, Mary Claire L. 14,500.00 13,291.63 1,208.37 1,208.37Vinluan, Lourdes R. 1,953.34 89,736.04 50,041.38 41,648.00 41,648.00Vinluan, Renato A. 4,875.00 14,881.25 14,881.25 4,875.00 19,756.25Vitug, Eliza J. 9,411.60 7,459.00 1,952.60 1,952.60Wee, Mariano B. 8,349.70 2,367.25 5,982.45 5,982.45Yang, Gloria G,. 5,354.00 354.00 5,000.00 5,000.00Yap, Donato C. 200.00 200.00 200.00Yatco, Maria Carmen 19,791.69 50,400.00 65,825.04 4,366.65 4,366.65Zaldivar, Felicia P. 4,122.34 135,562.30 71,967.84 67,716.80 67,716.80Zaldivar, Ramil P. 2,060.65 2,060.65 2,060.65Zamudio, Rowena B. 1,700.00 1,800.01 (100.01) (100.01)Zape, Vida Edna C. 19,4<strong>17</strong>.70 74,654.05 98,012.94 (3,941.19) (3,941.19)P 5,624,436.87 11,708,489.55 11,856,639.52 P 5,391,386.12 84,900.78 5,476,286.90EndingAlvarez, Alfredo 2,000.00 2,000.00 2,000.00Ampatin, Estrella V. 27,220.00 8,400.00 8,310.00 27,310.00 27,310.00Cabasada, Albert R. 8,114.36 8,114.36 8,114.36Capili, Regina R. 3,640.00 1,820.00 1,820.00 1,820.00Destura, Blanca 1,800.00 900.00 900.00 900.00Domingo, Leovildo V. 69,600.00 102,876.15 (33,276.15) (33,276.15)Fernando, Gerry V. 27,000.00 24,498.63 2,501.37 2,501.37Frades, Francisca B. 150,640.00 43,250.44 107,389.56 107,389.56Inciong, Cherry Wyne 55,948.81 56,228.81 (280.00) (280.00)Leon, Jocelyn E. 166,566.97 159,286.97 7,280.00 7,280.00Lopez, Martin Z. <strong>17</strong>5,1<strong>17</strong>.00 203,857.89 (28,740.89) (28,740.89)Mendoza, Malaya 7,650.00 7,962.00 7,962.00 7,650.00 7,650.00Molina, Mark Oliver P. (138,534.51) 575,<strong>17</strong>5.40 360,597.52 76,043.37 76,043.37Quines, Dante P. 300.00 300.00 300.00Rapirap, Raquel T. (2,972.00) 325,461.95 296,661.95 25,828.00 25,828.00Rosal, Josefina T. 1,000.00 1,000.00 1,000.00Rosales, Amormia Rhodora J. <strong>17</strong>,600.00 21,800.00 (4,200.00) (4,200.00)Tolentino, Rosula R. 105,191.89 67,581.89 37,610.00 37,610.00P (95,222.15) 1,690,104.02 1,355,632.25 P 220,185.26 19,064.36 239,249.62TOTAL - 1131012 P 5,529,214.72 13,398,593.57 13,212,271.77 P 5,611,571.38 103,965.14 5,715,536.52
Name and Designation of DebtorBeginningBalanceAdditionsDeductionsAmountAmountDeducted Written-OffCurrent Non-CurrentEnding
THE FAR EASTERN UNIVERSITY, INCORPORATED AND SUBSIDIARIESSCHEDULE C - NONCURRENT MARKETABLE EQUITY <strong>SEC</strong>URITIES,OTHER LONG-TERM INVESTMENTS IN STOCKS AND OTHER INVESTMENTSFOR THE YEAR ENDED MARCH 31, 2010Name of Issuing Entity andDescription of Each InvestmentBEGINNING BALANCEADDITIONS (DEDUCTIONS)ENDING BALANCEDividendsNumber of Number of Number of Received/AccruedShares or Shares or Equity in Earnings Shares or from InvestmentsPrincipal Principal Dividends (Losses) ofPrincipal Not AccountedAmount of Bonds Amount of Bonds Received/ Investees for the Amount of Bonds Percentage for by the Equityand Notes Amount in Pesos and Notes Amount in Pesos (Declared)Periodand Notes Amount in Pesos Ownership MethodInvestment - Juliana Mngt. (associate) 43,659 P 7,055,963 P - P - ( P 53,987 ) 43,659 P 7,001,976 49.00%P 7,055,963 P - P - ( P 53,987 ) 43,659 P 7,001,97618
THE FAR EASTERN UNIVERSITY, INCORPORATED AND SUBSIDIARIESSCHEDULE E - OTHER ASSETSFOR THE YEAR ENDED MARCH 31, 2010DescriptionBeginningBalanceAdditionsat CostCharged to Costsand ExpensesDeductionsCharged toOther AccountsOther Changes-Additions(Deductions)EndingBalanceOther Current AssetsRestricted cash P 58,490,642 P - P - P - P ( 14,519,892 ) P 43,970,750Advances to suppliers 20,954,948 - ( 4,006,673 )- - 16,948,275Prepayments 1,558,956 - - - 57,234,123 58,793,079Others 9,672,618 - - - ( 864,442 )8,808,<strong>17</strong>6P 90,677,164 P - P ( 4,006,673 ) P - P 41,849,789 P 128,520,280Other Non-Current AssetsGoodwill P 12,352,684 P - P - P - P - P 12,352,684Surety Bond 2,833,600 - - - ( 2,833,600 )-Marketable Securities 2,530,373 - - - - 2,530,373Club membership shares 1,000,000 - - - - 1,000,000Cash bond 134,835 - - - - 134,835Long-term refundable deposit 100,000 - - - - 100,000P 18,951,492 P - P - P - P ( 2,833,600 ) P 16,1<strong>17</strong>,89219
THE FAR EASTERN UNIVERSITY, INCORPORATEDSCHEDULE I - CAPITAL STOCKFOR THE YEAR ENDED MARCH 31, 2010Number of shares held byTitle of Issue 2 Number of sharesauthorizedNumber of shares issuedand outstanding as shownunder the related balancesheet captionNumber of shares reservedfor options, warrants,coversion and other rightsRelated parties 3Directors, officers and employeesOthers10,000,000 9,808,448 Board of trustees 599,557Issuance during the year - Officers 40,0599,808,448 Employees/Faculty 16,5841Indicate in a note any significant changes since the date of the last balance sheet filed.2Include in this column each type of issue authorized.3Affiliates referred to include affiliates for which separate financial statements are filed and those included in consolidated financial statements, other than the issuer of the particular security.20
THE FAR EASTERN UNIVERSITY, INCORPORATEDNicanor Reyes Sr. Street, Sampaloc, ManilaReconciliation of Retained Earnings for Dividend DeclarationMarch 31, 2010UNAPPROPRIATED RETAINED EARNINGSFOR DIVIDEND DECLARATIONAT BEGINNING OF YEAR * P 937,802,775Net Profit Realized for the YearNet profit per audited financial statements 585,181,285Less reconciling item - deferred tax income 1,388,091583,793,194Add (Less) Changes in Retained Earnings for the YearAppropriation during the year ( 1,000,000,000 )Reversals of appropriations 300,000,000Dividend declarations during the year ( 294,253,440 )(994,253,440 )UNAPPROPRIATED RETAINED EARNINGSFOR DIVIDEND DECLARATION AT END OF YEAR P 527,342,52921
- 21 -Item 8:Changes in and Disagreements with Accountants on Accounting andFinancial DisclosureThere has been no recent change in and disagreement withAccountants on accounting and financial disclosure.PART III - CONTROL AND COMPENSATIONItem 9.Trustees and Executive OfficersName Ages Citizenship PositionLourdes R. Montinola 82 Filipino Chair, Board ofTrusteesAurelio R. Montinola III 58 Filipino Vice Chair,Board of TrusteesLydia B. Echauz 62 Filipino President/TrusteeAngelina P. Jose 57 Filipino Corporate Secretary/TrusteePaulino Y. Tan 63 Filipino TrusteeGianna R. Montinola 52 Filipino TrusteeRenato L. Paras 83 Filipino TrusteeWilfrido C. Tecson 87 Filipino Independent TrusteeRobert F. Kuan 61 Filipino Independent TrusteeElizabeth P. Melchor 53 Filipino Vice President forPlanning andDevelopmentMiguel M. Carpio 54 Filipino Vice President forAcademic AffairsFe V. Canilao 64 Filipino Chief Financial OfficerHerminia I. Maliwat 61 Filipino TreasurerGlenn Z. Nagal 52 Filipino ComptrollerSeverino M. Garcia 61 Filipino Compliance Officer
TRUSTEES AND EXECUTIVE OFFICERS:- 22 -1. Lourdes R. Montinola, 82, Filipino: Chair of the Board of Trustees of <strong>Far</strong> <strong>Eastern</strong><strong>University</strong>, Inc. (June 1989 to present)Other Corporate Affiliations: Chair, Board of Directors, FERN Realty Corporation; Chairand President, FEU Educational Foundation, Inc.; Chair, Nicanor Reyes EducationalFoundation; Chair, Executive Committee, <strong>Far</strong> <strong>Eastern</strong> <strong>University</strong>, Inc.;Chair, <strong>Far</strong> <strong>Eastern</strong> College Silang; Governor, Nicanor Reyes Memorial Foundation;Trustee, FEU-Dr. Nicanor Reyes Medical Foundation; Trustee, AY Foundation, Inc.;Member, Museum Foundation of the <strong>Philippine</strong>s, Oriental Ceramic Society, HeritageConservation Society, Asia Society, & <strong>Philippine</strong> Textile Society.Dr. Montinola holds a Bachelor of Arts degree (cum laude) from Marymount College,New York, U.S.A., and an M. A. in Cultural History from the Asean Graduate Institute ofArts. She completed the Management Development Program for College and <strong>University</strong>Administrators in the Institute for Educational Management, Graduate School ofEducation, Harvard <strong>University</strong>, U.S.A. She obtained her Ph. D. in English: CreativeWriting from the <strong>University</strong> of the <strong>Philippine</strong>s.2. Aurelio Montinola III, 58, Filipino: Vice Chairman of the Board of Trustees,<strong>Far</strong> <strong>Eastern</strong> <strong>University</strong>, Inc. (June 1989 to present)President and Chief Executive Officer of Bank of the <strong>Philippine</strong> Islands and President,Bankers Association of the <strong>Philippine</strong>s. His other affiliations, among others, include:Chairman of the Board of Directors of Amon Trading Corporation; Vice Chairman of theBoard of Directors of Republic Cement Corporation; Chairman of East Asia EducationalFoundation, Inc.; Regional Board of Advisers, MasterCard International; Director, AyalaLand, Inc.; President, BPI Foundation, Inc.; Member, Makati Business Club; andMember, Management Association of the <strong>Philippine</strong>s; Member, Board of Directors,<strong>Far</strong> <strong>Eastern</strong> College Silang.He graduated with a BS Management Engineering degree at the Ateneo de Manila<strong>University</strong> in 1973, and received his MBA at Harvard Business School in 1977.3. Lydia B. Echauz, 62, Filipino: President (June 2003 to present) and Member ofthe Board of Trustees, <strong>Far</strong> <strong>Eastern</strong> <strong>University</strong>, Inc. (1999 to present)Appointed Acting President of <strong>Far</strong> <strong>Eastern</strong> <strong>University</strong> in 2002, and since 2003,President, FEU-East Asia College; President, FEU-FERN College; President, FEU EastAsia Educational Foundation, Inc.; in 2010 President, <strong>Far</strong> <strong>Eastern</strong> College Silang. Since2002, member, Board of Directors of FERN Realty Corporation and Governor, NicanorReyes Memorial Foundation. She is past President of the Association of SoutheastAsian Institutes of Higher Learning – <strong>Philippine</strong> Council; Director of the <strong>Philippine</strong>Association of Colleges and Universities; Alternate Director, Coordinating Council of<strong>Philippine</strong> Educational Associations; and member of the Management Association of the<strong>Philippine</strong>s. She was Dean of the Graduate School of Business, De La Salle <strong>University</strong>Professional Schools, Inc., from 1986 to 2002; former Associate Director of the MBAProgram, Ateneo de Manila <strong>University</strong> Graduate School of Business for seven years;also Associate Professor of the College of Business Administration, <strong>University</strong> of theEast, for twelve years.
- 23 -Dr. Echauz is a Bachelor of Arts, major in Economics and Mathematics fromSt. Theresa’s College, MBA from Ateneo de Manila <strong>University</strong>, and DBA fromDe La Salle <strong>University</strong>, and awarded outstanding alumna of all three educationalinstitutions, outstanding Bulakena, Manilan, Filipino and mother by variousorganiziations.4. Angelina Palanca Jose, 57, Filipino: Trustee (1990 to present) and CorporateSecretary, <strong>Far</strong> <strong>Eastern</strong> <strong>University</strong>, Inc. (1998 to present)Other Corporate Affiliations: Member, Board of Directors, FERN Realty Corporation;Secretary, Treasurer and Trustee, Nicanor Reyes Educational Foundation; CorporateSecretary and Trustee, FEU Educational Foundation Inc.; Corporate Secretary andGovernor, Nicanor Reyes Memorial Foundation; and member, Executive Committee, <strong>Far</strong><strong>Eastern</strong> <strong>University</strong>, Inc.; Corporate Secretary, <strong>Far</strong> <strong>Eastern</strong> College Silang.Ms. Jose obtained her Bachelor of Science degree, major in Economics, from the<strong>University</strong> of the <strong>Philippine</strong>s (Dean’s Medal).5. Paulino Y. Tan, 64, Filipino: Trustee, <strong>Far</strong> <strong>Eastern</strong> <strong>University</strong>, Inc. (1991 to present)Other Business Experience: President of Asia Pacific College; IT Services Consultant,SM (Shoemart) Inc. At present, member of the Board of Directors/Trustees of thefollowing companies: Nicanor Reyes Educational Foundation, Inc., FEU EducationalFoundation, Inc., East Asia Educational Foundation, Inc., Lyceum of Batangas, Lyceumof Laguna, Foundation for Upgrading the Standard of Education (FUSE),SM(Shoemart) Foundation, Inc., Asia Pacific Technology Educational Foundation,FERN Realty Corporation and <strong>Far</strong> <strong>Eastern</strong> College Silang.Dr. Tan obtained the Degree of Bachelor in Science in Chemical Engineering (summacum laude) from De La Salle <strong>University</strong>. He topped the Chemical Engineering BoardExamination and obtained both his M. S. and Ph.D. in Chemical Engineering from the<strong>University</strong> of Notre Dame, Indiana, U.S.A.6. Gianna R. Montinola, 52, Filipino: Trustee of <strong>Far</strong> <strong>Eastern</strong> <strong>University</strong>, Inc. (1989-1993 and 1996 to present)Concurrently Director and Corporate Secretary of FERN Realty Corporation andConsultant for Marketing and Communications of <strong>Far</strong> <strong>Eastern</strong> <strong>University</strong>. A lawyer byprofession, she was connected with the Quisumbing, Torres and Evangelista Law Office(an affiliate of the Baker & McKenzie Law Office, U.S.A.) from 1986 to 1992. She servedas <strong>Philippine</strong> Honorary Consul to the Republic of Peru from 1992 to 1996, and joinedthe Marketing and Business Development departments of Rockwell Land Corporationfrom 1996 to 1998. She is a member of the Board of Directors and Corporate Secretaryof Amon Trading Corporation and a Director of True Value Hardware Corporation. Sheis also a co-founder of non-profit organizations Hands On Manila Foundation, Inc. andChairperson of PeaceTech, Inc.She obtained her Bachelor of Arts degree in International Relations from Mount HolyokeCollege, USA and a Bachelor of Laws (Ll.B.) degree, with honors, from the Ateneo deManila College of Law.
- 24 -7. Renato L. Paras, 84, Filipino: Trustee of <strong>Far</strong> <strong>Eastern</strong> <strong>University</strong>, Inc. (1989-1991and 2002 to present)Other Corporate Affiliations: Chair of CHEMREZ Technologies and of <strong>Philippine</strong>Ratings; Vice Chair of CIBI Foundation and East Asia Educational Foundation, Inc. Heis also a member of the Board of Directors/Trustees of the following: FERN RealtyCorporation, CIBI Information, Inc., Insular Life Health Care, IBM <strong>Philippine</strong>s RetirementFund Committee and is Asia Pacific Regional Treasurer of the World Organization ofScout Movement. Dr. Paras was a member of the Central Bank Monetary Board, wasalso Board Director and CFO of Procter & Gamble <strong>Philippine</strong>s, and Consultant onInternal Auditing to CFO of San Miguel Corporation.Dr. Paras is a Certified Public Accountant. He topped the CPA Board Exam in 1948. Hefinished his Bachelor of Science in Accountancy in FEU in 1949 (summa cum laude),and earned his Master of Science in Accountancy at Columbia <strong>University</strong> in New York asan FEU scholar. He took up an Advanced Management Program conducted by theHarvard Graduate School of Business Faculty. In the year 2000, he was conferred anhonorary degree of Doctor of Humanities by FEU. He is listed in the Accountancy Hall ofFame.8. Wilfrido C. Tecson, 87, Filipino: Trustee (1989-2001) and Independent Trustee,<strong>Far</strong> <strong>Eastern</strong> <strong>University</strong> (2001 to present)Banking Experience: Co-founded Solid Bank and assumed positions of President, CEOand Vice Chairman until he retired; served as Vice President of China BankingCorporation and as President and Vice Chairman of Equitable Banking Corporation.At present, he is a Director of the Lepanto Mining Corporation. He is founding Treasurerof the Hero Foundation, Inc. and the Museong Pambata, and is a member of the Boardof Trustees of the YMCA.Dr. Tecson graduated with the degree of Bachelor of Science in Commerce, major inAccounting (summa cum laude) from FEU, and was conferred the degree of Doctor ofBusiness Management (honoris causa) by FEU in 1993.9. Robert F. Kuan, 61, Filipino: Independent Trustee of <strong>Far</strong> <strong>Eastern</strong> <strong>University</strong>, Inc.(2004 to present)Other Business Affiliations: Chairman, St. Luke’s Medical Center; Trustee, St. Luke’sCollege of Medicine–William H. Quasha Memorial; Trustee, Brent International School ofManila; Chairman, Brent International School Baguio, Inc.; Trustee, Brent InternationalSchool Subic, Inc.; Chairman, Brent International School, Inc.; Chairman, St. Theodoreof Tarsus Hospital in Sagada, Inc.; Director, China Banking Corporation;Founder/President, Chowking Food Corporation (1985 – 2000); Director, <strong>Far</strong> <strong>Eastern</strong>College Silang.Mr. Kuan graduated from the <strong>University</strong> of the <strong>Philippine</strong>s (1970) with a degree ofBachelor of Science in Business Administration. In 1975, he earned his Masters inBusiness Management from the Asian Institute of Management (AIM). In 1993, he tookup the Top Management Program at AIM, a program exclusively for company Presidentsand Chief Executive Officers. He was a TOFIL (Ten Outstanding Filipino) Awardee in2003 in the field of Business & Entrepreneurship; Agora Awardee for Entrepreneurship;Triple-A Awardee of AIM; and Outstanding Alumnus of the <strong>University</strong> of the <strong>Philippine</strong>s(UP) in the field of Business.
- 25 -10. Miguel M. Carpio, 54, Filipino: Vice-President for Academic Affairs, <strong>Far</strong> <strong>Eastern</strong><strong>University</strong>, Inc. (April 2008 to present)Other Professional Experience: Founding member and incorporator, UST College ofArchitecture Alumni Association and the Council of Architectural Researchers andEducators; Chairman, CHED Technical Committee on Architecture and Member,Regional Assessment Team for Architecture; Fellow, United Architects of the <strong>Philippine</strong>s(UAP); Director, UAP Sta. Mesa Chapter; Member, <strong>Philippine</strong> Institute of EnvironmentalPlanners; Executive Director, Commission on Education of the UAP (2002 to 2004);President of the Council of Deans and Heads of Architecture Schools in the <strong>Philippine</strong>sor CODHASP (2003 to 2005); Secretary, National Committee on Architecture and AlliedArts of the National Commission on Culture and the Arts (NCCA) (2003 to 2007);Member, National Real Estate Association, Inc.; Dean, FEU Institute of Architecture andFine Arts (November 2000 to March 2008); Executive Director, FEU Center for Studieson the Urban Environment or FEU-SURE (2000 to 2002).Arch./En.P. Carpio is a registered and licensed Architect and Environmental Planner.He graduated with the degree of Bachelor of Science in Architecture from the <strong>University</strong>of Santo Tomas and earned a Master of Environmental Management and Developmentdegree from the Australian National <strong>University</strong> in Canberra, Australia. He also earnedacademic units in the Master in Urban and Regional Planning from the <strong>University</strong> of the<strong>Philippine</strong>s. He is currently working on his dissertation in the Ph.D. in DevelopmentStudies at the <strong>University</strong> of Santo Tomas.11. Elizabeth P. Melchor, 53, Filipino: Vice President for Planning and Development,<strong>Far</strong> <strong>Eastern</strong> <strong>University</strong>, Inc. (April 2008 to present)Other Professional Experience: Trustee, FEU-Nicanor Reyes Medical Foundation;Governor, Nicanor Reyes Memorial Foundation; Trustee, East Asia EducationalFoundation, Inc.; Director, <strong>Far</strong> <strong>Eastern</strong> College Silang; Vice-President, AlejandroMelchor Jr. Memorial Foundation; Trustee and Officer, Cradle of Joy Learning Center;Member, Commission on Tertiary Education, <strong>Philippine</strong> Accrediting Association ofSchools, Colleges and Universities (PAASCU); Dean, Registrar and OutstandingTeacher Awardee, Assumption College, Makati; Visiting Professor, Huaqiao <strong>University</strong>,Quanzhou, China; Scholar, Beijing Language Institute; Chapter Head, Haggai Institute ofAdvanced Leadership; Vice President for Academic Affairs, <strong>Far</strong> <strong>Eastern</strong> <strong>University</strong>, Inc.(2004 to 2008).Dr. Melchor holds a Bachelor of Science degree, major in Physics (College Scholar),and a Master of Science, major in Physics, from the <strong>University</strong> of the <strong>Philippine</strong>s,Diliman. She earned her doctorate degree in Education from the California Coast<strong>University</strong> in Santa Ana, California, U.S.A.12. Fe V. Canilao, 64, Filipino: Chief Financial Officer, <strong>Far</strong> <strong>Eastern</strong> <strong>University</strong>, Inc.(1996 to present)Other Business Experience: Served as Vice President for Finance prior to her currentposition. At present, Vice President of FERN Realty Corporation; Alternate Member,Executive Committee, and Investor Relations Officer, <strong>Far</strong> <strong>Eastern</strong> <strong>University</strong>, Inc.;Trustee and Treasurer, East Asia Educational Foundation, Inc.; Assistant CorporateSecretary, Nicanor Reyes Educational Foundation and the FEU Educational Foundation,Inc.; Treasurer, <strong>Far</strong> <strong>Eastern</strong> College Silang.
- 26 -Ms. Canilao, a Certified Public Accountant, earned her Bachelor of Science in BusinessAdministration from the <strong>Philippine</strong> Women’s <strong>University</strong> and her MBA from FEU.13. Herminia I. Maliwat, 61, Filipino: Treasurer, <strong>Far</strong> <strong>Eastern</strong> <strong>University</strong>, Inc. (1998 topresent)Ms. Maliwat is a Certified Public Accountant. She obtained her BS in Accounting, cumlaude, from the <strong>University</strong> of the East.Before joining FEU, she worked as Chief Accountant for 10 years and Instructor for8 years at the College of the Holy Spirit, as Administrative and Finance Officer for16 years at the Asia Foundation, and as External Auditor for 10 years at theMother Edelwina Educational Foundation. She also served as Executive Director of theFEU Educational Foundation for three years and as 2007-08 Committee Chairperson onspecial projects of the <strong>Philippine</strong> Institute of Certified Public Accountants (PICPA).14. Glenn Z. Nagal, 53, Filipino: Comptroller, <strong>Far</strong> <strong>Eastern</strong> <strong>University</strong>, Inc. (1996 topresent)Work experience: External Auditor, Carlos J. Valdes and Company; Examiner, CentralBank of the <strong>Philippine</strong>s; Internal Audit Manager, <strong>Far</strong> <strong>Eastern</strong> <strong>University</strong>;Chief Accountant and Budget Director, <strong>Far</strong> <strong>Eastern</strong> <strong>University</strong>; Accounting Professor,<strong>Far</strong> <strong>Eastern</strong> <strong>University</strong>.A Certified Public Accountant by profession, Mr. Nagal graduated with the degree ofBachelor of Science in Commerce, major in Accounting from <strong>Far</strong> <strong>Eastern</strong> <strong>University</strong>.15. Severino M. Garcia, 61, Filipino: Compliance Officer, <strong>Far</strong> <strong>Eastern</strong> <strong>University</strong>, Inc.(January 21, 2003 to present)<strong>Form</strong>er Assistant Vice President – Audit.Mr. Garcia earned the degree of Bachelor of Science in Commerce, major in Accountingfrom FEU. A Certified Public Accountant, he worked in different companies as Auditor,Chief Accountant, Finance and Accounting Manager and Senior Financial Analyst.The members of the Board of Trustees of the Corporation are elected at the Annual <strong>Stock</strong>holders'Meeting to hold office until the next succeeding annual meeting, up to the time their respectivesuccessors shall have been elected and qualified.The officers are appointed or elected annually by the Board of Trustees at its organizationalmeeting, each to hold office until the corresponding meeting of the Board the following year or untila successor shall have been elected, appointed and qualified.Significant EmployeesThe corporation considers its entire work force as significant employees. Everyone is expected towork together as a team to achieve the corporation’s goals and objectives.
- 27 -Family RelationshipsThe Chair, Dr. Lourdes R. Montinola, is the mother of Mr. Aurelio R. Montinola III andAtty. Gianna R. Montinola, all of whom are members of the Board of Trustees.Item 10:Executive CompensationApril 1/2008 to April 1/2009 to April 1/2010 toMarch 31/2009 March 31/2010 March 31/2011NamePrincipal PositionLourdes R. Montinola Chair, Board of TrusteesLydia B. Echauz Trustee/PresidentAngelina P. Jose Trustee/Corporate SecretaryFe V. CanilaoChief Financial OfficerCecilia I. Anido VP – Academic AffairsMiguel M. Carpio VP – Special Projects*Elizabeth P. Melchor VP – Planning and DevelopmentHerminia I. Maliwat TreasurerSeverino M. Garcia Compliance Officer* Effective November 9, 2009_____________ _____________ ____________P62,797,434.00 P69,744,631.52 P75,616,648.36The compensation above presented are actual for the last two (2) completed fiscal years andthe estimate for the ensuing fiscal year ending March 31, 2011. Aggregate amount is P/208,158,713.88==============Compensation of DirectorsA. Standard ArrangementB. Other ArrangementThe members of the Board of Trustees of the corporation are receiving gasallowances for regular board/special board meetings attended. They are also entitledto bonuses at the end of the fiscal year at the discretion of the Board, while theofficers of the corporation are entitled to basic salaries, living allowance, specialfinancial assistance, fringe benefits, and also bonuses at the discretion of the Board.There are no other material terms or conditions of employment for contractualexecutive officers.Voting Trust HoldersThe Registrant is not a party to any voting trust agreement. No security holder of the Registrantholds a voting trust or other similar agreements.
- 28 -No information is available on all outstanding warrants or options held by the members of theBoard of Trustees and officers of the corporation.Summary Compensation TableSummary and Principal Position Year Salary Bonus Other AnnualCompensationLourdes R. MontinolaChair, Board of TrusteesLydia B. EchauzTrustee/PresidentAngelina P. JoseTrustee/Corporate SecretaryFe V. CanilaoChief Financial OfficerCecilia I. AnidoVP-Academic AffairsElizabeth P. MelchorVP-Planning and DevelopmentMiguel M. CarpioVP-Special ProjectsSeverino M. GarciaCompliance OfficerHerminia I. MaliwatTreasurer- x - - x - - x - - x -- x - - x - - x - - x -- x - - x - - x - - x -- x - - x - - x - - x -- x - - x - - x - - x -- x - - x - - x - - x -- x - - x - - x - - x -- x - - x - - x - - x -- x - - x - - x - - x -Grand Total 2008-2009 P/ 43,091,751.54 P/ 19,705,682.00 - x -2009-2010 48,736,473.56 21,008,157.96 - x -2010-2011(est.)53,122,756.18 22,493,892.18 - x -
- 29 -Item 11:Security Ownership of Certain Beneficial Owners and ManagementBeneficial Owners of More Than 5% and 10% Securities as of March 31, 2010As of March 31, 2010, <strong>Far</strong> <strong>Eastern</strong> <strong>University</strong> does not have on record any person, party orentity who beneficially owns more than 5% and 10% of common stock except as set forth in thetable below:Title of ClassName, Address of RecordOwner and Relationship withIssuerCitizenshipNo. ofShares HeldPercentCommon Desrey, Incorporated 110 th Fl., Pacific Star Bldg.Cor. Makati & Gil Puyat Ave.Makati CityCommon Seyrel Investment andRealty Corporation 210 th Fl., Pacific Star Bldg.Cor. Makati & Gil Puyat Ave.Makati CityCommon Sysmart Corporation 3426 MKSE, Ayala AvenueMakati CityFilipino 784,800 8.0013Filipino 2,807,835 28.6267Filipino 2,076,839 21.<strong>17</strong>40All of the above are direct beneficial owners of the securities.1 Dr. Lourdes, R. Montinola as President is authorized to vote for the shares of the Corporation.2 Ibid3 Mr. Henry Sy Sr. as Chair of the Board will vote for the shares of the Corporation.
- 30 -Security Ownership of ManagementTitle of ClassCommonCommonCommonCommonCommonCommonCommonCommonCommonCommonCommonCommonCommonName of Beneficial OwnerLourdes R. MontinolaChair, Board of TrusteesLydia B. EchauzTrustee/PresidentAurelio R. Montinola IIIVice Chair, Board of TrusteesAngelina Palanca JoseTrustee/Corporate SecretaryWilfrido C. TecsonTrusteePaulino Y. TanTrusteeGianna R. MontinolaTrusteeRenato L. ParasTrusteeRobert F. KuanTrusteeElizabeth P. MelchorVP for Planning andDevelopmentFe V. CanilaoChief Financial OfficerHerminia I. MaliwatTreasurerGlenn Z. NagalComptrollerNumber ofShares andand Nature ofBeneficialOwnershipCitizenshipPercentOf Class94,588 - D Filipino 0.96445,919 - D Filipino 0.0603164,099 - D Filipino 1.6730314,538 - D Filipino 3.20681 - I Filipino 0.000011 - I Filipino 0.0000120,409 - D Filipino 0.20811 - I Filipino 0.000011 - I Filipino 0.00001<strong>17</strong>,862 - D Filipino 0.182121,737 - D Filipino 0.221656 - D Filipino 0.00057404 - D Filipino 0.0041Security of Ownership of Management as a GroupTotal Shares - 639,616Percentage - 6.5210%
- 31 -Item 12:Certain Relationship and Related TransactionsDuring the last two (2) years, the corporation or any of the members of the Board of Trusteeswas never a party or proposed to be a party in any related transaction.PART IV - Corporate GovernanceItem 13.Corporate Governance• The <strong>University</strong>’s compliance with <strong>SEC</strong> Memorandum Circular No. 2 datedApril 5, 2002, as well as all relevant circulars on Corporate Governancehas been monitored.• FAR EASTERN UNIVERSITY, its trustees, officers and employeescomplied with the leading practices and principles on good corporategovernance as embodied in the company’s Manual;• FAR EASTERN UNIVERSITY also complied with the appropriateperformance self-rating assessment and performance evaluation systemto determine and measure compliance with the Manual. Thecorporation’s evaluation system was approved by the Board of Trusteesat its meeting on March 16, 2004;• FAR EASTERN UNIVERSITY did not commit any major deviations fromthe provisions of its Manual. Our Corporate Governance ComplianceOfficer submitted his 2009 certification to the Securities and <strong>Exchange</strong>Commission on the extent of the company’s compliance with its manualon January 20, 2010.• All members of the Board of Trustees as well as Senior Managementofficers completed and were duly certified to have attended a specialseminar on Corporate Governance conducted by an entity accredited bythe Securities and <strong>Exchange</strong> Commission.• In September 2009, the university participated in the CorporateGovernance Survey using the Corporate Governance Scorecardprepared by the Institute of Corporate Directors.• <strong>Far</strong> <strong>Eastern</strong> <strong>University</strong> submitted its Revised Manual on CorporateGovernance to the Securities and <strong>Exchange</strong> Commission on January 8,2010.
- 32 -PART V – EXHIBITS AND SCHEDULESItem 14 Exhibits and Reports on <strong>SEC</strong> <strong>Form</strong> <strong>17</strong>-C(a) ExhibitThe exhibits are not applicable to the company nor require any answer.(b) Report on <strong>SEC</strong> <strong>Form</strong> <strong>17</strong>-C1. Resolution approved at the Board of Trustees’ meeting held onJune 19, 2009:Declaration of P15.00/share cash dividend on record as ofJuly 6, 2009, payable on July 20, 2009.Report received on June 22, 2009.2. Resolutions approved at the Annual <strong>Stock</strong>holders’ meeting held onAugust 22, 2009:a. Minutes of the Annual Meeting on August 23, 2008;b. Academic Report of the President and Annual Report ofthe Chairman for fiscal year 2008-2009;c. Ratification and confirmation of the acts of the officers andtrustees in the furtherance of the matters covered by theannual report for fiscal year 2008-2009;d. Elected trustees and independent trustees for the fiscalyear 2009-2010;e. Re-Appointment of Punongbayan and Araullo as ExternalAuditor for the fiscal year 2009-2010; andf. Vote of appreciation to the Board of Trustees, the officials,faculty and staff.Report received on August 25, 2009.3. Resolutions approved at the Annual <strong>Stock</strong>holders’ meeting held onAugust 22, 2009 ratified and confirmed by the stockholders holding88.37% of the total issued and outstanding capital stocks of theCorporation:
- 33 -Amendment of Article 1 of the Amended Articles of Incorporationof <strong>Far</strong> <strong>Eastern</strong> <strong>University</strong> from:First. That the name of said corporation shall be –The <strong>Far</strong> <strong>Eastern</strong> <strong>University</strong>, IncorporatedTo henceforth read as follows:First. That the name of said corporation shall be –FAR EASTERN UNIVERSITY, INC. doing business under thename and style FAR EASTERN UNIVERSITY4. Resolutions approved at the Organizational Meeting of the Board ofTrustees held on September 15, 2009:a. Elected Corporate and <strong>University</strong> Officials for the fiscalyear 2009-2010;b. Composition of the Executive Committee;c. Composition of the Audit Committee;d. Composition of the Corporate Governance Committee;e. Composition of the Nomination Committee;f. Composition of the Risk Management; andg. Composition of the Compensation CommitteeReport received on September 16, 2009.5. Resolution approved at the Special Board of Trustees’ meeting held onSeptember 30, 2009:Opening of <strong>Far</strong> <strong>Eastern</strong> <strong>University</strong> branch in Makati City andentering into a lease agreement with Crans Montana PropertyHoldings Corporation for its property located in Makati City.Report received on September 30, 2009.6. Resolution approved at the Board of Trustees’ meeting held on December15, 2009:Declaration of P15.00/share cash dividend on record as ofJanuary 8, 2010, payable on January 25, 2010.Report received on December <strong>17</strong>, 2009.
- 34 -7. Resolution approved at the Board of Trustees’ meeting held on March 16,2010:Appropriation from the retained earnings the amount ofOne Billion Pesos (P1,000,000,000.00) for property acquisitionand investment.Report received on March 16, 2010.8. Resolutions approved at the Board of Trustees’ meeting held onMarch 16, 2010:Authorizing the Corporation to join and participate as aparty/co-venturer with PHI Culinary Arts and Food ServicesInstitute, Inc. to set up a joint venture corporation namedICF-CCE, Inc. for the purpose of owning and operating aculinary arts school to be named “ICF@FEU’’ under thefollowing capital contribution scheme:<strong>Far</strong> <strong>Eastern</strong> <strong>University</strong> : 50%PHI Culinary Artsand Food Services Institute, Inc. : 50%and under such other terms and conditions as may beconsistent with the foregoing and beneficial to theCorporation.(c) Quarterly Reports:Ended June 30, 2009Received August 14, 2009Ended September 30, 2009Received November 13, 2009Ended December 31, 2009Received February 12, 2010Report received on March 18, 2010.Ended December 31, 2009 (Amended)Received March 8, 2010
- 35 -Business and General InformationI. Industry ProfileThe following are the dominant characteristics of the education industry:- The business of higher education in the country is in the hands of the privatesector.- There is an uneven distribution of colleges and universities across the regions.This connotes a problem of unequal access to higher education. This isevidenced by the high concentration of state and private colleges and universitiesin the National Capital Region and Southern Tagalog Regions.- Statistics show a high mismatch between education and occupation.- The number of graduates in fields like commerce and business administrationcontinues to increase even if unemployment among these graduates is on therise.<strong>Far</strong> <strong>Eastern</strong> <strong>University</strong>’s market is made up of the working class and the middle incomegroup. FEU is situated in Manila, particularly in the area popularly known as the<strong>University</strong> Belt. To be competitive, the university must continuously improve its productsand at the same time maintain reasonable tuition fees.II.Group of related services which contribute 10% or more to revenues1. Institute of Accounts, Business and Finance 32.20%2. Institute of Arts and Sciences 13.15%3. Institute of Nursing 43.87%III. Teaching services are rendered to students who come and enroll.IV. No patents, trademarks, copyrights, licenses, franchises, concessions, and royaltyagreements are held by the company.V. All courses offered are with CHED recognition.VI Standard set by CHED encourages the <strong>University</strong> to continuously improve its quality ofteaching and its facilities.Operational and Financial InformationDividend payments are normally restricted by reserves and appropriations made by thecompany, and by the amount needed to ensure smooth and unhampered operationsduring the year.Control and Compensation InformationNo warrants or options are given by the corporation.
FAR EASTERN UNIVERSITYP.O. BOX 609MANILA, PHILIPPINES<strong>SEC</strong>URITIES AND EXCHANGE COMMISSION<strong>SEC</strong> FORM <strong>17</strong> - AANNUAL REPORT PURSUANT TO <strong>SEC</strong>TION <strong>17</strong>OF THE <strong>SEC</strong>URITIES REGULATION CODEAND <strong>SEC</strong>TION 141 OF THE CORPORATION CODE1. For the fiscal year ended March 31, 20092. <strong>SEC</strong> Identification Number 5383. BIR Tax Identification No. 000-225-4424. Exact name of registrant as specified in its charter <strong>Far</strong> <strong>Eastern</strong> <strong>University</strong>, Inc.5. PHILIPPINESProvince, Country or other jurisdiction ofincorporation or organization6. ____________/ / (<strong>SEC</strong> use only)/____________/Industry Classification Code:7. Nicanor Reyes Street, Sampaloc, Manila 1008Address of principal officePostal Code8. (632) 735-56-21Issuer's telephone number including area code9. NOT APPLICABLE<strong>Form</strong>er name, former address, and former fiscal year, if changed since last report.10. Securities registered pursuant to Sections 8 and 12 of the SRC, or Sec. 4 and 8 of theRSATitle of Each ClassNumber of Shares of Common<strong>Stock</strong> Outstanding and Amountof Debt OutstandingCommon <strong>Stock</strong>, P100.00 par value 9,808,448Bond with Non-Detachable Warrant,P/ 1.00 per unitNot Applicable
- 2 -11. All securities (common shares) are listed with the <strong>Philippine</strong> <strong>Stock</strong> <strong>Exchange</strong>, Inc.12. Check whether the registrant:(a) has filed reports required to be filed by Section I7 of the SRC and SRC Rule <strong>17</strong>thereunder and Sections 26 and 141 of the Corporation Code of the <strong>Philippine</strong>sduring the preceding 12 months (or for such shorter period that the registrant wasrequired to file such reports);Yes [ x ] No [ ]13. The aggregate market value of the voting stock held by non-affiliates: None
- 3 -TABLE OF CONTENTSPART I - BUSINESS AND GENERAL INFORMATION NO. OF PAGESItem 1 - Business 5Item 2 - Properties 3Item 3 - Legal Proceedings 2Item 4 - Submission of Matters ToA Vote of Security Holders 1PART II -OPERATIONAL AND FINANCIAL INFORMATIONItem 5 -Item 6 -Market for Issuer’s CommonEquity and Related <strong>Stock</strong>holdersMatters 3Management’s Discussion andAnalysis or Plan Operation 9Item 7 - Financial Statements 115Item 8 - Changes in and Disagreements 1With Accountants on Accounting andFinancial DisclosurePART III -CONTROL AND COMPENSATION INFORMATIONItem 9 - Directors and Executive Officersof the Issuer 6Item 10- Executive Compensation 2Item 11- Security Ownership of CertainBeneficial Owners and Management 2Item 12- Certain Relationship and RelatedTransactions 1PART IVCORPORATE GOVERNANCEItem 13- Corporate Governance 1PART VEXHIBITS AND SCHEDULESItem 14- Exhibits and Reports on <strong>SEC</strong> <strong>Form</strong> <strong>17</strong>-Ca. Exhibits 1b. Reports on <strong>SEC</strong> FORM I7 - C 3c. Quarterly Reports 1
- 4 -PART I - BUSINESS AND GENERAL INFORMATIONItem 1. Business<strong>Far</strong> <strong>Eastern</strong> <strong>University</strong>, Inc. ("FEU or the "Corporation") was incorporated in 1933Brief Discussion of Business<strong>Far</strong> <strong>Eastern</strong> <strong>University</strong>, Inc., founded in 1928, is a private non-sectarian institution of learningcommitted to the highest intellectual, moral and cultural standards. It strives to produceprincipled and competent graduates. It nurtures a service-oriented community which seeks tocontribute to the advancement of society. Tuition and other fees which are the main sources of itsfinancial stability are moderate, subject to government regulation. The <strong>University</strong> also provides fulland partial scholarships to deserving students. An FEU Foundation supplements the <strong>University</strong>scholarship program by providing special grants. The <strong>University</strong> maintains excellent facilities suchas an electronic library, various types of laboratories, auditorium, audio-visual and multimediarooms, clinic, technology-based gate security and enrollment system, gymnasiums, and spaciousair-conditioned classrooms to best serve the students. The <strong>University</strong> was granted deregulatedstatus for five years beginning October 22, 2001 until October 21, 2006 per CHED MemorandumOrder (CMO) No. 38, Series 2001. Then, per CMO No. 52, Series of 2006, the deregulated statuswas extended until the end of Second Semester, SY 2006-2007. Moreover, per CMO No. 59,Series of 2007, the <strong>University</strong> was granted the same status from November 15, 2007 to November14, 2008. On January 22, 2009, through a Memorandum from the CHED Chairman, FEU’s statuswas extended until April 30, 2009. Recently, a CHED letter addressed to President Lydia B.Echauz dated March <strong>17</strong>, 2009 has extended the <strong>University</strong>’s deregulated status for another fiveyears that is from March 11, 2009 until March 30, 2014.Product:The Corporation is an educational institution. A private, non-sectarian institution oflearning comprising the following different Institutes that offer specific courses:A) Institute of Arts and Sciences (IAS)Courses:Masteral:Baccalaureate:Master of Arts (MA) major in:• Mass Communication• Letters• PsychologyBachelor of Arts in Mass Communication (Granted permit up torecognition)Bachelor of Arts in: (Granted Government Permit to offer 1 st & 2 ndYear Levels)• English• Literature• Political Science• International Studies
- 5 -Bachelor of Science (BS) in Medical Technology (GrantedGovernment Permit to offer 1 st and 2 nd Year Levels)Bachelor of Science (BS) major in BiologyBachelor of Science (BS) in:• Psychology• Applied Mathematics with Information TechnologyB) Institute of Accounts, Business and Finance (IABF)Courses:Masteral:Baccalaureate:Master of Business Administration (MBA) (Without Thesis Program)Bachelor of Science (BS) in:• Accountancy• Hotel and Restaurant Management (Granted GovernmentPermit to offer 3 rd Year Level)• Tourism Management (Granted Government Permit to offer1 st & 2 nd Year Levels)Bachelor of Science in Business Administration major in:C) Institute of Education (IE)Courses:Doctoral:Masteral:• Business Economics• Financial Management• Marketing Management• Human Resource Development Management• Operations ManagementDoctor of Education (Ed.D.) major in Educational AdministrationMaster of Arts in Education major in:• Educational Administration (Thesis Program)• Curriculum and Instruction (Thesis Program)• Curriculum and Instruction (Without Thesis Program)• Special Education (Thesis Program)
- 6 -Baccalaureate:Certificate:Bachelor of Elementary Education (B.E.Ed.) major in:• General Education• Special EducationBachelor of Secondary Education (B.S.Ed.) major in:• Mathematics• Sports & Recreational Management• English• Filipino• General Science• Music, Arts and Physical EducationTeacher Certificate ProgramD) Institute of Architecture and Fine Arts (IARFA)Courses:Baccalaureate:Bachelor of Science in Architecture (B.S. Arch.)Bachelor of Fine Arts (BFA) major in:• Advertising Arts• PaintingE) Institute of Law (IL)Courses:Post-Baccalaureate:Bachelor of Laws (Ll.B.)Juris Doctor of LawsF) Institute of Nursing (IN)Courses:Masteral:Master of Arts in NursingBaccalaureate:Bachelor of Science in Nursing (BSN)
- 7 -All courses offered in the <strong>University</strong> were granted approval/permits by CHED and other concernedgovernment institutions.Accreditation on CoursesThe <strong>Philippine</strong> Association of Colleges and Universities Commission on Accreditation(PACUCOA) granted Certificates of Level III Reaccredited Status, from April 24, 2006 toApril 2011 to Liberal Arts major in:1. Literature Program2. English Program3. English Language Program3. Mass Communication Program4. Economics Program5. Political Science ProgramSimilarly, effective March 06, 2006 to March 2011, PACUCOA granted a Level IIIReaccredited Status to Commerce, major in:1. Economics/Financial Economics Program2. Finance Program3. Financial Accounting Program4. Internal Auditing Program5. Legal Management Program6. Management Program7. Marketing / Marketing Management Program8. Tourism Management ProgramLikewise, the Bachelor in Elementary Education Program and Bachelor in SecondaryEducation Program were granted by PACUCOA Level II Reaccredited Status effectiveFebruary 16, 2004 until February 2009.The <strong>Philippine</strong> Accreditating Association of Schools, Colleges and Universities(PAASCU) issued a certificate of accreditation to the <strong>University</strong>’s Nursing Program from May6, 2005 valid until May 2010.Using quality management system, the <strong>University</strong> is also ISO (International StandardOrganization) certified through Certificate Registration No. TUV100 05 0416 TMS valid fromJanuary 18, 2006 to January <strong>17</strong>, 2009.
- 8 -Distribution methods of the products/services:Since this is an educational institution, its services are certainly focused on thestudents.The tuition fees of students in the following Institutes significantly contributed to the revenues ofthe <strong>University</strong>:InstitutePercentage to RevenuesInstitute of Accounts, Business 23.50%and FinanceInstitute of Arts and Sciences 10.00%Associate in Health Science Education 20.75%Institute of Nursing 37.25%Customers:StudentsPurchases of Raw Materials: NOT APPLICABLEDistribution methods of the products/services:Since this is an educational institution, its services are certainly focused on the students.Competition:Since the school which is the main core of the business is situated in the <strong>University</strong> Belt, thecompetitors are prestigious colleges and universities within the specified area. FEU caneffectively compete with these institutions of learning because of its well-modulated tuition feessubject to government regulations, air-conditioned classrooms, electronic library and continuousimprovement of physical plant and facilities. Diverse scholarships are also offered and amagnificent line-up of cultural performances for the whole year are presented, free for allstudents. Moreover, the <strong>University</strong> recently acquired the Level III re-accredited status formost of its Liberal Arts and Commerce programs.
- 9 -Item 2. PropertiesFEU owns Seventeen Thousand Nine Hundred Sixty-Seven (<strong>17</strong>,967) square meters of real properties with improvementsin Nicanor Reyes Street, Sampaloc, Manila, wherein its main campus is situated.The principal properties which include buildings, land improvements and equipments are as follows:Gross Book ValueAccumulatedDepreciation Net Book Value Location ConditionI. PROPERTY, PLANT & EQUIPMENT:-L A N D 98,457,565.00 - 98,457,565.00 Manila Very GoodBUILDINGS & LAND IMPROVEMENTSNew Technology Building II 280,167,<strong>17</strong>5.00 41,839,111.00 238,328,064.00 " "Alfredo Reyes Hall 65,970,226.00 25,305,397.00 40,664,829.00 " "Leasehold Improvement 65,423,403.00 15,190,789.00 50,232,614.00 " "New Technology Building-Idle Hosp. Bldg. 5,382,741.00 266,959.00 5,115,782.00 " "Science Building 98,608,277.00 11,<strong>17</strong>2,245.00 87,436,032.00 " "Arts Building 10,<strong>17</strong>4,184.00 5,549,412.00 4,624,772.00 " "Nicanor Reyes Hall 39,700,111.00 2,392,096.00 37,308,015.00 " "GEC & Educational Hall - - - " "Grade School - - - " "S B Covered Walk 6<strong>17</strong>,737.00 494,189.00 123,548.00 " "Covered Passage 2,660,195.00 459,691.00 2,200,504.00 " "Fence 715,360.00 510,889.00 204,471.00 " "Campus Pavilion 1,107,976.00 254,590.00 853,386.00 " "GSB Covered Walk 310,000.00 247,999.00 62,001.00 " "Powerhouse 296,196.00 296,196.00 - " "Chapel 166,760.00 - 166,760.00 " "Others 7,840,138.00 469,078.00 7,371,060.00 " "Grandstand 48,554.00 49,263.00 (709.00) " "579,189,033.00 104,497,904.00 474,691,129.00EQUIPMENTSFurnitures & Fixtures 15,466,280.00 10,264,741.00 5,201,539.00 " "Electrical & Mechanical 61,679,287.00 50,435,969.00 11,243,318.00 " "Information Technology 25,922,341.00 19,137,084.00 6,785,257.00 " "Transportation Equipment 11,758,843.00 8,753,057.00 3,005,786.00 " "Miscellaneous Fixed Assets 10,645,124.00 10,645,124.00 - " "Instruments & Utensils 548,270.00 278,261.00 270,009.00 " "T o o l s 1,032,878.00 684,410.00 348,468.00 " "Linen 299,914.00 281,459.00 18,455.00 " "Museum Collection 989,573.00 - 989,573.00 " "128,342,510.00 100,480,105.00 27,862,405.00TOTAL 805,989,108.00 204,978,009.00 601,011,099.00II. INVESTMENT PROPERTY:LAND 53,394,726.00 - 53,394,726.00 " "COLLEGE OF ENGINEERING BUILDING 207,626,479.00 66,165,744.00 141,460,735.00 " "TOTAL 261,021,205.00 66,165,744.00 194,855,461.00GRAND TOTAL 1,067,010,313.00 271,143,753.00 795,866,560.00The above-mentioned properties are not mortgaged, encumbered, or under any lien.
- 10 -Properties leased by the corporation from FERN Realty, Inc.MonthlyRental_ContractDate__Education Building – an eight (8) storey building P32,703,721.81 July 1,made of concrete materials located on plus 2008Nicanor Reyes St., Manila applicable VAT toJune 30,2009Nursing Building – an eight (8) storey buildingmade of concrete materials located onNicanor Reyes St., ManilaLaw Building – a four (4) storey building madeof concrete materials located onNicanor Reyes St., ManilaAdministration Building – a four (4) storey building madeof concrete materials located onNicanor Reyes St., ManilaGymnasium - a two (2) storey building made of concrete materialslocated on R. Papa St., ManilaThe lease contract shall not be deemed extended by implication beyond the contract period forany cause or reason whatsoever, but only by negotiation and written agreement of the LESSORand the LESSEE.
- 11 -Employees:Number of EmployeesOfficials - 12Senior Staff - 50Non-Academic:Supervisor - 64Rank-and-File - 270Academic:Lecturer - 715Regular - 363With the economic condition prevailing in the country, the corporation has no plan of hiringemployees within the ensuing twelve months. It will make use of its present employees andfaculty members to meet its manpower requirements.Inclusive Dates of CBANon-Academic July 16, 2006 - July 15, 2009Academic Sept. 1, 2006 - August 31, 2009The labor unions of the employees and the faculty members have never been on strike in thelast ten years, and pose no threat to strike in the foreseeable future. Employees and facultymembers have a harmonious relationship with the Administration.Working Capital:All of the company's working capital for its existing operation forfiscal year April 1, 2008 to March 31, 2009 was internally generated.Item 3. Legal ProceedingsHereunder is the list of the legal proceedings involving the company which are beinghandled by Atty. Enrico G. Gilera, the <strong>University</strong>’s Legal Counsel:External CasesA. Pending Courts Cases as of 31 March 20091. Ramir Arceo, et al. vs. FEU, NLRC Case No. 06-09197-20082. Elmer Bolanos NLRC vs. FEU/RRC Case No. 09-12562-20083. Melvira David, et al. vs. FEU, CA GR No. 1065324. Fina Gabonada vs. FEU, NLRC Case No. 09-13392-20085. Fina Gabonada vs. FEU, NLRC Case No. 00-02-02043-20036. FEU-ELU (PLAC) vs. FEU, CA GR No.1022497. Jesus Fernando Dujua vs. FEU, NLRC Case No. 04-05603-20088. Annabelle Mercado vs. FEU, NLRC Case No. 05-04546-2007
- 12 -B. Recently Dismissed cases1. Delia Valenzuela et al. vs. FEU, NLRC Case No. 00-06-06312-2007,dismissed on 28 May 20082. Jimmy Angeles vs. FEU, NLRC Case No. 05-07<strong>17</strong>7-2008,dismissed on <strong>17</strong> July 20083. FEU-ELU (PLAC) vs. FEU, NCMB-NCR Case No. 24-02-05-2008,dismissed on 21 October 20084. Rodrigo Dela Cruz et al. vs. FEU/RRC, NLRC Case No. 07-10304-2008,dismissed on 12 March 2009Involvement of Directors and Officers in Certain Legal ProceedingsNone of the directors and officers were involved during the past five (5) years in any bankruptcyproceeding. Neither have they been convicted by final judgment in any criminal proceeding orbeen subject to any order, judgment or decree of competent jurisdiction, permanently ortemporarily enjoining barring, suspending, or otherwise limiting their involvement in any type ofbusiness, securities, commodities, or banking activities, nor found by any court or administrativebody to have violated a securities or commodities law.The registrant or any of its subsidiaries or affiliates is not a party to any pending legal proceedingsin which any of their property is the subject.Item 4. Submission of Matters to a Vote of Security HoldersThe registrant is not a party to any voting trust agreement. No security holder of theRegistrant holds a voting trust or any other similar agreement.Part II - OPERATIONAL AND FINANCIAL INFORMATIONItem 5. Market for Registrants Common Equity and Related <strong>Stock</strong>holders MattersDividends During the Year:Cash Dividend:DIVIDENDS DECLARED FOR THE FISCAL YEAR ENDED MARCH 31, 2009Payment/IssuedOutstandingDate Particulars Amount SharesApril 24, 2008 P 15.00/share P 105,095,520.00 7,006,368July 21, 2008 15.00/share 105,095,520.00 7,006,368Jan. <strong>17</strong>, 2009 15.00/share 147,126,720.00 9,808,448P 357,3<strong>17</strong>,760.00===============
- 13 -<strong>Stock</strong> Dividend:40% stock dividend approved by the Board of Trustees at its meeting held on March 25, 2008, to allstockholders on record as of September 15, 2008, duly ratified and confirmed by the stockholders withmore than two-thirds (2/3) of the total issued and outstanding shares at its regular annual meeting onAugust 23, 2008. Said stock dividend was issued and released on October 9, 2008 after the listing ofshares constituting the stock dividend was approved by the <strong>Philippine</strong> <strong>Stock</strong> <strong>Exchange</strong>, Inc. and theSecurities and <strong>Exchange</strong> Commission.All fractional shares resulting from said stock dividend shall be paid in cash by the Corporation at parvalue.Recent Sales of Unregistered SecuritiesNot a single common share is considered unregistered security. All shares are registered with the<strong>Philippine</strong> <strong>Stock</strong> <strong>Exchange</strong>, Inc. Thus, checklist of requirements for Sale of Unregistered Securities isnot applicable.The <strong>Philippine</strong> <strong>Stock</strong> <strong>Exchange</strong>, Inc. is the principal market where the corporation’s common equity istraded.Market Prices of Common <strong>Stock</strong>s: (Phil. <strong>Stock</strong> <strong>Exchange</strong>, Inc.)Herewith are the high, low, and closing prices of shares of stock traded from April 2008 to March 2009:Actual prices (in Php)Adjusted prices (in Php)*2008 HIGH LOW CLOSE HIGH LOW CLOSEApr 920.00 910.00 920.00 657.14 650.00 657.14May 1,000.00 900.00 1,000.00 714.29 642.86 714.29Jun 1,000.00 940.00 1,000.00 714.29 671.43 714.29Jul 1,200.00 900.00 980.00 857.14 642.86 700.00Aug 1,300.00 980.00 1,290.00 928.57 700.00 921.43Sep 1,290.00 750.00 800.00 921.43 750.00 800.00Oct 755.00 500.00 575.00Nov 650.00 600.00 635.00Dec 645.00 620.00 620.002009Jan 650.00 620.00 630.00Feb 650.00 620.00 620.00Mar 800.00 650.00 785.00*due to 40% stock dividend on September 10, 2008High and low sale prices for each quarter are as follows:A) April 01, 2008 - March 31, 2009Period High Low CloseFirst Quarter P/ 973.33 P/ 916.67 P/ 973.33695.24 654.76 695.24 (Adjusted)Second “ 1,263.33 876.67 1,023.33902.38 697.62 807.14 (Adjusted)Third “ 683.33 573.33 610.00Fourth “ 700.00 630.00 678.33
- 14 -B) April 1, 2007 – March 31, 2008Period High Low CloseFirst Quarter P/ 835.00 P/ 753.33 P/ 821.67Second “ 870.00 831.67 870.00Third “ 845.00 803.33 813.33Fourth “ 923.33 853.33 906.67The number of shareholders on record as of March 31, 2009 was One Thousand Four HundredTen (1,410). Common shares issued and outstanding were 9,808,448.20 TOP FEU STOCKHOLDERS AS OF MARCH 31, 2009Title of ClassName of Beneficial OwnerNo. of Sharesand Nature ofBeneficialOwnershipCitizenshipPercentOf Class1. Common Seyrel Investment and2,807,835 – D Filipino 28.6267Realty Corporation2. Common Sysmart Corporation 2,068,068 – D Filipino 21.08463. Common Desrey, Incorporated 784,800 – D Filipino 8.00134. Common Angelina D. Palanca 311,374 – D Filipino 3.<strong>17</strong>455. Common Sr. Victorina D. Palanca 220,000 – D Filipino 2.24306. Common ICM Sisters Phil. Mission Board, 215,000 – D Filipino 2.1920Inc.7. Common Aurelio R. Montinola III 158,888 – D Filipino 1.61998. Common PCD Nominee Corporation 125,6<strong>17</strong> – D Filipino 1.3020(Filiipno)9. Common Marco P. Gutang 125,081 – D Filipino 1.275210. Common Gonzaga-Lopez Enterprises, Inc 120,136 – D Filipino 1.224811. Common Lourdes R. Montinola 115,404 – D Filipino 1.<strong>17</strong>6612. Common Jomibel Agricultural106,479 – D Filipino 1.0856Development Corporation13. Common AMON Trading Corporation 58,403 – D Filipino 0.595414. Common ZARE, Inc. 49,620 – D Filipino 0.505915. Common Rosario P. Melchor 48,228 – D Filipino 0.49<strong>17</strong>16. Common Rosario Panganiban Melchor 43,782 – D Filipino 0.4464<strong>17</strong>. Common Mitos Sison 40,366 – D Filipino 0.411518. Common Consorcia P. Reyes 39,337 – D Filipino 0.401019. Common Caridad I. Santos 33,303 – D Filipino 0.339520. Common Francisca S. Monzon 33,131 – D Filipino 0.3378
- 15 -Item 6.Management’s Discussion and Analysis or Plan of OperationFinancial Position :As of March 31, 2006, total assets reached P2,230.1 million which was 27.59% higherthan the previous year’s P1,748 million while total liabilities amounted to P357.6 million whichwas 20.66% higher than the previous year’s P296.4 million. Equity amounted to P1,872.5million which was 29% higher than the previous year’s P1,451.6 million. Current ratio was4.77:1 and debt was 19% of equity.As of March 31, 2007, total assets amounted to P2,710.8 million which was 21.55%higher than the previous year’s P2,230.1 million. Total liabilities amounted to P398.9 millionwhich was 11.5% higher than the previous year’s P357.6 million. Equity amounted to P2,311.8million which was 23.46% higher than the previous year’s P1,872.5 million. Current ratio was6.3:1 and debt was <strong>17</strong>% of equity.As of March 31, 2008 total assets amounted to P3,157.3 million. Total liabilitiesamounted to P572.0 million while total stockholders’ equity reached P2,585.2 million.Compared to the previous year, assets, liabilities and stockholders’ equity increased by 16.47%,43.39% and 11.83 % respectively. Current ratio was 4.49:1 and debt was 22% of equity.As of March 31, 2009, total assets amounted to P3,447.3 million which was 9.19% higherthan the previous year’s P3,157.3 million. Total liabilities amounted to P558.1 million whichwas 2.44% lower than the previous year’s P572.0 million. Equity amounted to P2,889.2 millionwhich was 11.76% higher than the previous year’s P2,585.2 million. Current ratio was 4.89:1and debt was 19% of equity.For the last 4 years, total assets increased at an average rate of 18.7% or P424.8 million ayear. Total liabilities also increased but at a lower average rate of 18.29% or P65.4 million a yearwhile equity increased at an average rate of 19.01% or P359.4 million a year. The increase inassets was due to the increase in liabilities and stockholders’ equity. The increase in liabilitieswas due to special funds and deposits collected from students which were intended for certainspecific purposes. The increase in equity was due to the continuous positive results of operationsfor the past 4 years which exceeded cash dividends paid over the same period of time.During the past four years, the company’s solvency steadily improved as shown by thefollowing figures in million Pesos:Excess of AssetsYear Total Assets Total Liabilities over LiabilitiesMarch 31, 2006 P 2,230.1 357.6 1,872.5March 31, 2007 2,710.8 398.9 2,311.9March 31, 2008 3,157.3 572.0 2,585.3March 31, 2009 3,447.3 558.1 2,889.2
As of March 31, 2009, the company has P6.<strong>17</strong> worth of assets to pay for every P1.00worth of liability.During the same period of time, the company’s liquidity steadily improved as shown bythe following statistics in million Pesos:Excess of Current AssetsYear Current Assets Current Liabilities over Current LiabilitiesMarch 31, 2006 P 1,297.5 271.8 1,025.7March 31, 2007 1,829.7 294.2 1,535.5March 31, 2008 2,228.7 495.9 1,732.8March 31, 2009 2,443.8 499.6 1,944.2As of March 31, 2009, the company has P4.89 worth of current assets to pay for everyP1.00 worth of current liability.The constant and steady improvement in the company’s financial condition both insolvency and liquidity is largely attributed to the company’s net income each year over the pastfour years, net of cash dividends paid over the same period of time.Excess of NetCash DividendsIncome over CashNet Income Paid Dividends PaidYear ( in million ) ( in million ) % ( in million ) %2005 - 2006 P 538.6 112.1 20.8% 426.5 79.2%2006 - 2007 603.5 <strong>17</strong>5.1 29% 428.4 71%2007 - 2008 592.9 315.2 53.2% 277.7 46.8%2008 – 2009 567.0 252.2 44.5% 314.8 55.5%As a result and based on the above figures, around 63.12% of each year’s net income hasbeen retained by the company, thus, the steady increase in owners’ equity as follows:IncreaseOwner’s Equity(Decrease)Year ( in million ) ( in million ) %P1,451.6March 31, 2006 1,872.5 420.9 29.0%March 31, 2007 2,311.9 439.4 23.5%March 31, 2008 2,585.3 273.4 11.8%March 31, 2009 2,889.2 303.9 11.8%
As of March 31, 2009, owner’s equity accounts for 83.8% of total assets. Since 70.9% ofthe company’s total assets is current, the company can pay all its liabilities and still have 54.7%current assets and 29.1% non-current assets. In pesos, this would mean P1,885.7 million currentassets and P1,003.5 million non-current assets after paying all liabilities amounting to P558.1million as of March 31, 2009.In Million %Owners’ Equity 2,889.2 83.8%Total Assets 3,447.4 100%Non-Current Assets 1,003.5 29.1%Current Assets 2,443.9 70.9%Total Liabilities 558.1 16.2%Current Assets after Total Liabilities 1,885.7 54.7%Results of OperationsFor the year 2005-2006, net income for the period amounted to P538.6 million which was40% higher than the previous year’s P384.6 million. This year’s figure consisted of 85% netoperating (educational) income and 15% other income. Net operating income increased byP156.2 million while other income increased by P16.4 million. As a result, net income after taxincreased by P154.0 million.For the year 2006-2007, net income for the period was P603.5 million which was 12%higher than the previous year’s P538.6 million. This year’s figure consisted of 82% netoperating (educational) income and 18% other income. Net operating income increased byP36.8 million and other income by P29.3 million. As a result, net income after tax for the yearincreased by P64.9 million.For the year 2007-2008, net income for the period amounted to P592.9 million which was1.75% lower than the previous year’s P603.5 million. This year’s figure consisted of 80% netoperating (educational) income and 20% other income. Net operating income decreased byP16.2 million while other income increased by P10.8 million. The combined effect resulted in adecrease in net income after tax by P10.6 million this year.For the year 2008-2009, net income for the period amounted to P567.0 million which was4.37% lower than the previous year’s P592.9 million. This year’s figure consisted of 77.4% netoperating (educational) income and 22.6% other income. Net operating income decreased byP39.7 million. Other income increased by P13.2 million. As a result, net income after tax forthe year decreased by P25.9 million.
The company’s operating (educational) income was up in 2005-2006 and 2006-2007 dueto good enrollment. It went down in 2007-2008 and 2008-2009 when enrollment dropped to the23,000 level.Average tuition feeEnrollmentYear rate per unit (1 st semester)2005 - 2006 902.00 26,4112006 - 2007 976.00 26,2292007 - 2008 1,043.00 23,9282008 - 2009 1,100.00 23,291Other income steadily improved despite lower interest rates due to higher amounts ofplacements. During the past two years, 2007-2008 and 2008-2009, investment income accountsfor 81% of other income. Rental income was also a factor. It accounts for <strong>17</strong>% of total otherincome.A Look of What Lies AheadDuring the past four years, the first semester enrollment gradually decreased from 26,411in 2005-2006 to 23,291 in 2008-2009. Second semester enrollment normally drops by 10% fromthat of the first semester but actual results were better at an average of 7.25% decrease. Over thesame period, tuition rates increased by 11%, 7%, 6% and 5% respectively. Net operating(educational) income in 2006-2007 when enrollment was still at the 26,000 level posted a slightimprovement of 7.14%. It was also in 2007-2008 and 2008-2009 when enrollment went down to23,000 level that net operating income decreased by 2.9% and 7.4% respectively.This current school year, the further reduction in the first semester enrollment by about1.75% and the low increase in tuition fees of 5% may affect the profitability of operations unlessoperating expenses are limited to the minimum.With the company’s total current assets amounting to P1,885.7 million and non-currentassets amounting to P1,003.5 million (net of all liabilities) as of March 31, 2009 and with theexpected net income, the company does not foresee any cash flow or liquidity problem in thenext 12 months or so despite the drop in enrollment and lower tuition fee increase. It is alsoexpected that the company shall easily meet all its commitments including those forimprovements in instructional and other facilities from its present reserves and from expectedfuture earnings.As for the years ahead, management will continue to uplift its academic standard bycontinuously updating its curriculum, strengthening its faculty, and further improving itsfacilities. With sustained improvements in all fronts and with reasonable tuition fee rates, the<strong>University</strong> is confident that it will still be able to maintain its market share in the industry.
Top Five (5) Key Performance IndicatorsI. Test of LiquidityLiquidity refers to the company’s ability to pay its short-term current liabilities asthey fall due. This is measured by any of the following:II. Test of Solvency1. Current ratio measures the number of times that the current liabilities could bepaid with the available current assets (Adequate: at least 1.5:1)March 31, 2006 4.77:1March 31, 2007 6.22:1March 31, 2008 4.49:1March 31, 2009 4.89:12. Quick ratio measures the number of times that the current liabilities could bepaid with the available quick assets (Adequate: at least 1:1)March 31, 2006 4.75:1March 31, 2007 6.11:1March 31, 2008 4.39:1March 31, 2009 4.82:1Solvency refers to the company’s ability to pay all its debts whether such liabilitiesare current or non-current. It is somewhat similar to liquidity, except that solvencyinvolves a longer time horizon. This is measured by any of the following:1. Debt to equity ratio measures the amount of assets provided by the creditorsrelative to that provided by the owner (Adequate : 100% or less)March 31, 2006 19%March 31, 2007 <strong>17</strong>%March 31, 2008 22%March 31, 2009 19%2. Debt to asset ratio measures the amount of assets provided by the creditorsrelative to the total amount of assets of the company. (Adequate: 50% or less)March 31, 2006 16%March 31, 2007 15%March 31, 2008 18%March 31, 2009 16%
3. Equity to asset ratio measures the amount of assets provided by the ownerrelative to the total assets of the company (Adequate: 50% or more)March 31, 2006 84%March 31, 2007 85%March 31, 2008 82%March 31, 2009 84%III. Test of ProfitabilityProfitability refers to the company’s earning capacity. It also refers to the company’sability to earn a reasonable amount of income in relation to its total investment. It ismeasured by any of the following:1. Return on total assets measures how well management has used its assetsunder its control to generate income (Adequate: at least equal to theprevailing industry rate).March 31, 2006 24%March 31, 2007 22%March 31, 2008 19%March 31, 2009 16%2. Return on owner’s equity measures how much was earned on the owners’or stockholders’ investment. (Adequate: at least equal to the prevailingindustry rate).March 31, 2006 29%March 31, 2007 26%March 31, 2008 23%March 31, 2009 20%3. Earnings per share measures the net income per share.March 31, 2006 115.39March 31, 2007 103.37March 31, 2008 84.62March 31, 2009 67.44IV.Product Standard1. Teaching performance in the <strong>University</strong> is constantly being monitored tomaintain a satisfactory level of excellence.
Teaching Excellence % toTotalYear Awardees Teaching force2005-2006 581 53%2006-2007 412 37%2007-2008 430 38%2008-2009 377 34%2. The <strong>Philippine</strong> Association of Colleges and Universities Commission onAccreditation (PACUCOA) has granted Certificates of Level III ReaccreditedStatus to our Commerce and Liberal Arts Programs. It has alsogranted Level II Re-accredited Status to our Elementary and SecondaryEducation Programs.The <strong>Philippine</strong> Accreditating Association of Schools, Colleges andUniversities (PAASCU), also issued a certificate of accreditation to the<strong>University</strong>’s Nursing Program.3. Performance of FEU graduates in their respective Board Exams is generallybetter than the national passing rate:FEUPassing RateNationalPassing RateArchitecture, Jan.2009 31% 39%Bar Exam, 2008 43% 21%CPA, Oct., 2008 54% 37%CPA, May 2009 36% 28%LET (Elem), Apr. 2009 33% 28%LET (Secondary), Apr. 2009 48% 25%Nursing, Nov. 2008 61% 45%V. Market AcceptabilityBelow is a comparative schedule of first semester enrollment for the past 4 years:SYEnrollment2006-2007 26,2292007-2008 23,9282008-2009 23,2912009-2010 22,885
Due to the economic recession, it was estimated that the first semester enrollmentfor SY 2009-2010 will be around 10% lower. Final figure was better with adecrease of only 1.75%. It also turned out that all institutes, except for theInstitute of Nursing, had a better enrollment.The surge in the number of valedictorians, salutatorians and entrance meritscholars to around 800 a year (833 in 2007-2008 and 798 in 2008-2009) duringthe past two school years is an indication that FEU has become one of the betterchoices among the various colleges and universities in the metropolis.Facts:( In Million Pesos )March 31, 2006 March 31, 2007 March 31, 2008 March 31, 2009Quick Assets 1,291.3 1,798.9 2,<strong>17</strong>7.2 2,406.7Current Assets 1,297.5 1,829.7 2,228.7 2,443.9Total Assets 2,230.2 2,710.8 3,157.3 3,447.3Current Liabilities 271.8 294.2 495.9 499.6Total Liabilities 357.6 399.0 572.0 558.1<strong>Stock</strong>holder’s Equity 1,872.5 2,311.9 2,585.2 2,889.2Net Income after Tax 538.6 603.5 592.9 567.0Total Outstanding shares(average) 4,671,142 shares 5,838,440 shares 7,006,368 shares 8,407,408 sharesOther Items1. There are no known trends, events or uncertainties which may have a material impact onliquidity.2. There are no known events that will trigger direct or contingent financial obligation thatmay be material to the company. There are also no known events that would result inany default or acceleration of an obligation.3. There are no material off-balance sheet transactions, arrangements, obligations(including contingent obligations), and other relationships of the company withunconsolidated entities or other persons created during the reporting period.
4. There are no sales of Unregistered or Exempt Securities including Recent Issuance ofSecurities Constituting an Exempt Transaction.<strong>Form</strong>ula1. Liquidity1. Current ratio = Current assetsCurrent Liabilities2. Acid test ratio = Quick assetsCurrent Liabilities2. Solvency1. Debt to Equity ratio = Total liabilitiesTotal <strong>Stock</strong>holder's Equity2. Debt to Asset ratio = Total liabilitiesTotal assets3. Equity to Asset ratio = Total <strong>Stock</strong>holder's EquityTotal assets3. Profitability1. Return on Assets = Net IncomeTotal assets2. Return on Owner's Equity = Net IncomeTotal <strong>Stock</strong>holder's Equity3. Earning per share = Net IncomeTotal Outstanding shares (average)
- 16 -FAR EASTERN UNIVERSITYSCHEDULE OF PROPERTY, PLANT & EQUIPMENT/INVESTMENT PROPERTYSCHOOL YEAR 2008 - 2009AccumulatedGross Book Value Depreciation Net Book Value Location ConditionI. PROPERTY, PLANT & EQUIPMENT:-L A N D 98,457,565.00 - 98,457,565.00 Manila Very GoodBUILDINGS & LAND IMPROVEMENTSNew Technology Building II 280,167,<strong>17</strong>5.00 41,839,111.00 238,328,064.00 " "Alfredo Reyes Hall 65,970,226.00 25,305,397.00 40,664,829.00 " "Leasehold Improvement 65,423,403.00 15,190,789.00 50,232,614.00 " "New Technology Building-Idle Hosp. Bldg. 5,382,741.00 266,959.00 5,115,782.00 " "Science Building 98,608,277.00 11,<strong>17</strong>2,245.00 87,436,032.00 " "Arts Building 10,<strong>17</strong>4,184.00 5,549,412.00 4,624,772.00 " "Nicanor Reyes Hall 39,700,111.00 2,392,096.00 37,308,015.00 " "GEC & Educational Hall - - - " "Grade school - - - " "S B Covered Walk 6<strong>17</strong>,737.00 494,189.00 123,548.00 " "Covered Passage 2,660,195.00 459,691.00 2,200,504.00 " "Fence 715,360.00 510,889.00 204,471.00 " "Campus Pavilion 1,107,976.00 254,590.00 853,386.00 " "GSB Covered Walk 310,000.00 247,999.00 62,001.00 " "Powerhouse 296,196.00 296,196.00 - " "Chapel 166,760.00 - 166,760.00 " "Others 7,840,138.00 469,078.00 7,371,060.00 " "Grandstand 48,554.00 49,263.00 (709.00) " "579,189,033.00 104,497,904.00 474,691,129.00EQUIPMENTSFurnitures & Fixtures 15,466,280.00 10,264,741.00 5,201,539.00 " "Electrical & Mechanical 61,679,287.00 50,435,969.00 11,243,318.00 " "Information Technology 25,922,341.00 19,137,084.00 6,785,257.00 " "Transportation Equipment 11,758,843.00 8,753,057.00 3,005,786.00 " "Miscellaneous Fixed Assets 10,645,124.00 10,645,124.00 - " "Instruments & Utensils 548,270.00 278,261.00 270,009.00 " "T o o l s 1,032,878.00 684,410.00 348,468.00 " "Linen 299,914.00 281,459.00 18,455.00 " "Museum Collection 989,573.00 - 989,573.00 " "128,342,510.00 100,480,105.00 27,862,405.00TOTAL 805,989,108.00 204,978,009.00 601,011,099.00II. INVESTMENT PROPERTY:LAND 53,394,726.00 53,394,726.00 " "COLLEGE OF ENGINEERING BUILDING 207,626,479.00 66,165,744.00 141,460,735.00 " "TOTAL 261,021,205.00 66,165,744.00 194,855,461.00GRAND TOTAL 1,067,010,313.00 271,143,753.00 795,866,560.00
FAR EASTERN UNIVERSITYSCHEDULE B - AMOUNTS RECEIVABLE FROM DIRECTORS, OFFICERS,EMPLOYEES, RELATED PARTIES, AND PRINCIPAL STOCKHOLDERS (OTHER THAN AFFILIATES)FOR THE YEAR ENDED 2009ANNEX C.1.2Name and Designation of DebtorBeginningBalanceAdditionsAmountDeductedDeductionsAmountWritten-OffCurrentNon-CurrentEndingAbala, Genelin G. 5,295.67 5,295.67 5,295.67Abellera, Evelyn C. 302.23 302.23 302.23Acab, Deborah A. 10,400.00 10,400.00 10,400.00Acosta, Venina Corazon S. 418.97 418.97 418.97Adolfo, Marlon (3,560.00) (3,560.00) (3,560.00)Africa, Dickenson Y. 200.00 200.00 200.00Agdalpen, Renato C. 2,000.00 2,000.00 2,000.00Agluba, Noreen 63.00 63.00 63.00Agorilla, Delia 660.00 660.00 660.00Aguirre, Estelita 200.00 200.00 200.00Alarde, Crispulo Jr. S. 22,532.51 22,231.51 301.00 - 301.00Albino, Maulynn 207.50 207.50 207.50Albiva, Merlyn T. 1,464.00 1,464.00 1,464.00Alcaraz, Nellie T. 8,200.00 8,200.00 8,200.00Alcazar, Nina Aiza 415.50 415.50 415.50Alfaro, Jennylyn G. (3,835.00) (3,835.00) (3,835.00)Alibania, Hazel J. 1,000.00 1,000.00 1,000.00Almalvez, Arlena C. 200.00 200.00 200.00Alo, James 600.00 600.00 600.00Alolor, Jacqueline G. (873.00) (873.00) (873.00)Amacan, Normita C. 15,113.55 13,608.00 1,505.55 - 1,505.55Amlog, Jocelyn A. 45,000.00 45,000.00 45,000.00Ampatin, Estrella V. 26,005.00 26,005.00 26,005.00Anastacio, Nanette V. (3,309.80) (3,309.80) (3,309.80)Anastacio, Teresita M. 89.74 89.74 89.74Andres, Jocelyn 90.00 90.00 90.00Anido, Cecilia I. 334,016.06 263,593.07 70,422.99 70,422.99An Lim, Jaime L. 97,711.02 99,166.74 (1,455.72) - (1,455.72)Arabia, Julieta S. 600.00 2,500.00 (1,900.00) - (1,900.00)Aragon, Lloyd Jeffrey 5,000.00 5,000.00 5,000.00Arbizo, Maria Sophia 3,695.57 3,695.57 3,695.57Arejola, Romeo 200.00 200.00 200.00Arig, Mellicent J. (300.00) (300.00) (300.00)Arquiza, Glenda S. 6,824.50 16,670.00 (9,845.50) - (9,845.50)Arreca, Edgardo C. (500.00) (500.00) (500.00)Arribe, Emma B. 245.00 245.00 245.00Asilo, Ma. Cecilia 50.00 50.00 50.00Ataat, Jose 200.00 200.00 200.00Atanque, Aurora L. 2,835.06 5,123.88 (2,288.82) - (2,288.82)Austria, Ryan 5,000.00 5,000.00 5,000.00Ayson, Rosalino P., Jr. 31,505.00 <strong>17</strong>,160.00 14,345.00 14,345.00Azor, Helen A. (1,528.<strong>17</strong>) (1,528.<strong>17</strong>) (1,528.<strong>17</strong>)Azucena, Cesario 1,339.20 1,339.20 1,339.20Babilonia, Jonathan 450.00 450.00 450.00Baconawa, Ma. Dorina M. 79.<strong>17</strong> 79.<strong>17</strong> 79.<strong>17</strong>Badiable, Charisma Mae 5,000.00 5,000.00 5,000.00Baello, Christine N. (137.50) (137.50) (137.50)
Balaoro, Maria Theresa 200.00 (200.00) - (200.00)Balaria, Dalmacio P. 7,500.00 7,500.00 7,500.00Balita, Paulita C. 9,436.50 1,750.00 7,686.50 - 7,686.50Bambico, Elma 311.00 311.00 311.00Banal, Enrico R. (22,<strong>17</strong>1.50) (22,<strong>17</strong>1.50) (22,<strong>17</strong>1.50)Banas, Gloria V. 24.20 24.20 24.20Barcellano, Francis (4,595.00) (4,595.00) (4,595.00)Barcelona, Samson V. 200.00 200.00 200.00Bartolome, Liezl DM. 764.00 822.00 (58.00) - (58.00)Batungbakal, Marisa <strong>17</strong>.50 <strong>17</strong>.50 <strong>17</strong>.50Bautista, Andres D. 3,000.00 3,000.00 3,000.00Bautista, Arlene Mae DG. 1,027.00 1,027.00 1,027.00Bautista, Christopher 588.40 588.40 588.40Bautista, Rosalinda 300.00 300.00 300.00Bayan, Alfred F. 3,457.64 3,457.64 3,457.64Bayan, Zenaida E. 585.50 585.50 585.50Bayona, Daniel G. 545.90 545.90 545.90Belardo, Ma. Jeanette 1,794.53 1,794.53 1,794.53Belleza, Asuncion L. 16,649.00 28,938.47 (12,289.47) - (12,289.47)Beltran, Charity J. <strong>17</strong>5.00 <strong>17</strong>5.00 <strong>17</strong>5.00Belza, Mercedes A. 7,060.00 7,060.00 7,060.00Bermudez, Israel 300.00 300.00 300.00Bermudez, Neil C. 1,600.00 1,600.00 1,600.00Bonaobra, Salvador B. (750.00) (750.00) (750.00)Brawner, Dalisay G. 40.00 40.00 40.00Briones, Domingo J. 10,079.00 10,079.00 10,079.00Brocal, Cynthia M. 24.00 24.00 24.00Buenaventura, Alexander V. 7,060.00 7,060.00 7,060.00Buenaventura, Olga C. 27,213.00 27,213.00 27,213.00Buenavida, Amelia 165.00 165.00 165.00Bueno, Marivic 10,000.00 10,000.00 10,000.00Bulanhagui, Nida B. 620.00 620.00 620.00Bustamante, Ma. Christine H. 11,000.00 1,000.00 3,400.00 8,600.00 8,600.00Caagbay, Elpidio Z. (5,779.30) 3,974.30 3,500.00 (5,305.00) - (5,305.00)Cabaltica, Leilani A. 11,210.55 7,000.00 4,210.55 4,210.55Cabantac, Ricardo R. 7,060.00 7,060.00 7,060.00Cabulay, Danny A. 54.00 54.00 54.00Cadorna, Rosemarie S. 656.20 656.20 656.20Cagadas, Ruly 200.00 200.00 200.00Cajucom, Mary Grace A. 440.00 440.00 440.00Calizar, Dexter A. 3,126.10 3,126.10 3,126.10Calub, Mary Virginia Blesilda 10,000.00 10,000.00 10,000.00Camacho, Joseph C. 600.00 600.00 600.00Cando, Cromwell N. 1,248.00 1,248.00 1,248.00Canilao, Fe V. 663,200.47 303,408.43 359,792.04 359,792.04Canlas, Aurora V. 227.70 227.70 227.70Canobas, Ruel V. 33.00 33.00 33.00Cao, Marilou F. (2,769.00) 2,098.00 (2,098.00) (2,769.00) (4,867.00)Capacio, Glenn (7,300.00) (7,300.00) (7,300.00)Caramanza, Edward M. 9,000.00 9,000.00 9,000.00Cardona, Enrico 200.00 200.00 200.00Cariquitan, Daisy 308.00 308.00 308.00Carpio, Miguel M. (13,086.34) (13,086.34) (13,086.34)Casaclang, Editha Y. 11,796.00 11,796.00 11,796.00Castanas, Baby Theress 82.50 82.50 82.50Castro, Joeven R, 4,555.00 4,555.00 4,555.00Castro, Ma. Clara C. 566.36 566.36 566.36Cauba, Harvey A. 10,000.00 5,635.22 4,364.78 4,364.78
Cecilio, Ma. Elaine 3,795.89 3,795.89 3,795.89Cerrer, Redentor A. 200.00 200.00 200.00Chan, Jeffrei Allan (6,927.00) (6,927.00) (6,927.00)Chu, Connie 195.20 195.20 195.20Chua, Ryan Gilbert 5,000.00 5,000.00 5,000.00Clemente, Luisa DC. 3,615.90 3,615.90 3,615.90Clerigo, Bernard A. 1,000.00 1,080.00 (80.00) - (80.00)Clores, Roy 3,230.00 3,230.00 3,230.00Codinera, Virgilio B. 79.72 79.72 79.72Cometa, Ma. Victoria D. (7,775.00) (7,775.00) (7,775.00)Concepcion, Gerald G. 250.00 250.00 250.00Concepcion, Lourdes Q. 930.72 930.72 930.72Concha, Jhonalyn M. 10,900.00 10,900.00 10,900.00Copiaco, Ross Joseph 50.00 50.00 50.00Cordero, Nelma 1,195.00 1,195.00 1,195.00Cruz, Anita B. 25,000.00 25,000.00 25,000.00Cruz, Anna Lisa D. (944.00) (944.00) (944.00)Cruz, Christybel O. 928.75 928.75 928.75Cruz, Eloisa G. 3,362.50 3,362.50 3,362.50Cruz, Felipe T. 1,200.00 1,200.00 1,200.00Cruz, Janet R. 200.00 200.00 200.00Cruz, John Ross R. (4,500.00) (4,500.00) (4,500.00)Cruz, Jose Noel 200.00 200.00 200.00Cruz, Maricar 5,000.00 5,000.00 5,000.00Cruz, Maritess 9.16 9.16 9.16Cruz, Precita P. (1,400.00) (1,400.00) (1,400.00)Cruz, Reynaldo J. 934.05 934.05 934.05Cruz, Rosalie dela 6.68 6.68 6.68Cruz, Sandra Lyn D. 523.01 523.01 523.01Cuartero, Pacifico C. (1,700.00) (1,700.00) (1,700.00)Culala, Harold John D. (835.00) 5,000.00 (5,000.00) (835.00) (5,835.00)Cunanan, Fernando M. 3,309.80 3,309.80 3,309.80Cureg, Benedicto A. 5,522.64 5,522.64 5,522.64Custodio, Joselito 50.00 50.00 50.00Dado, Rorylyn H. (1,000.00) (1,000.00) (1,000.00)Dalton, Juanita C. 12,739.40 12,739.40 12,739.40Dapla, Walter 3,851.29 3,851.29 3,851.29Davalos, Zenaida R. (499.20) (499.20) (499.20)David, Melvira c. 300.00 300.00 300.00Dean, Victoriano P. 3,412.50 3,412.50 3,412.50Deatras, Jeffrey (2,861.29) (2,861.29) (2,861.29)Delloro, Evelyn 748.00 748.00 748.00Demagante, Rey Francis G. 50.00 50.00 50.00Destura, Blanca 224.56 224.56 224.56Diaz, Aeneas Eli (10,000.00) (10,000.00) (10,000.00)Diaz, Reynaldo 255.00 255.00 255.00Dingding, Quintin P. 70.00 70.00 70.00Dino, Kristopher 400.00 400.00 400.00Dizon, Mercy G. (800.00) (800.00) (800.00)Dones, Irene P. 600.00 600.00 600.00Doria, Jeanette V. (260.00) (260.00) (260.00)Duena, Teodoro C., Jr. (6,000.00) (6,000.00) (6,000.00)Dulay, Sofronio C. (10,636.95) (10,636.95) (10,636.95)Dumadag, Norma M. 27,015.20 27,015.20 27,015.20Dumas, Marvin C. 150.00 150.00 150.00Dumdumaya, Myline Marie P. (1,200.00) (1,200.00) (1,200.00)Duque, Ronald 50.00 50.00 50.00Duran, Benedict James D. (47,271.57) (47,271.57) (47,271.57)
Echauz, Lydia B. (20,362.80) (20,362.80) (20,362.80)EDSA- Shangrila Plaza 1,300.00 1,300.00 1,300.00Elman, Mario B. (1,800.00) (1,800.00) (1,800.00)Enriquez, Christian Jo C. (4,939.39) (4,939.39) (4,939.39)Enriquez, Emiliana 50.00 50.00 50.00Enriquez, Rex Cesar 200.00 200.00 200.00Escoltero, Emily (2,9<strong>17</strong>.93) (2,9<strong>17</strong>.93) (2,9<strong>17</strong>.93)Escosia, Aurora A. 25,899.77 2,200.00 23,699.77 23,699.77Eser, Myline S. 33,035.86 33,035.86 33,035.86Espino, Kristine 112.00 112.00 112.00Espinosa, William V. 6,431.00 6,431.00 6,431.00Espiritu, Christine Joy 300.00 300.00 300.00Esquibel, Elizabeth 5,000.00 5,000.00 5,000.00Estabillo, Ma. Luz 529.50 529.50 529.50Estacio, Ma. Vivian G. (1,625.01) (1,625.01) (1,625.01)Esteban, Alejandro L. 5,000.00 5,000.00 5,000.00Estonanto, Mark Ronald L. 374.85 374.85 374.85Estonanto, Mavi Issel L. 32,221.65 32,221.65 32,221.65Estrella, Gloria 1,460.37 1,460.37 1,460.37Estrella, Luisito P. (300.00) (300.00) (300.00)Fabito, Evelyn 2,163.00 2,163.00 2,163.00Fabros, Marietta 5,295.67 5,295.67 5,295.67Federigan, Melissa 946.25 946.25 946.25Felizardo, Dante A. 10,000.00 10,000.00 10,000.00Feraren, Mitchell 50.00 50.00 50.00Fernandez, Benedict T. III (4,400.00) (4,400.00) (4,400.00)Fernandez, Dante Roel 699.00 699.00 699.00Fernandez, Roderick 588.40 588.40 588.40Fernando, Gerry V. 967.00 967.00 967.00Fesalbon, Hermond F. 7,729.34 7,729.34 7,729.34FEU Consumer's Coop. 3,295.85 3,295.85 3,295.85FEU Credit Union 1,560.92 1,560.92 1,560.92Fiesta, Erlinda P. 8,532.50 8,532.50 8,532.50Figer, Reggy C. 24,300.00 24,300.00 24,300.00Flojo, Flordeliza 168.50 168.50 168.50Flores, Hanonica S. 50.00 50.00 50.00Flores, Miguela T. (102.50) (102.50) (102.50)Flores, Raul 600.00 600.00 600.00Flores, Renato C. 2,000.01 2,000.01 2,000.01Flores, Roberto C. (32,250.00) (32,250.00) (32,250.00)Florida, Ma. Corazon M. (1,800.00) (1,800.00) (1,800.00)Foe, Jonathan 100.00 100.00 100.00Frades, Francisca B. 9,002.85 9,132.85 (130.00) - (130.00)Frias, Wilmer 5,000.00 5,000.00 5,000.00Fuentes, Ma. Leda J. 7,060.00 7,060.00 7,060.00Galang, Aurora C. 980.00 980.00 980.00Galiza, Miguela S. 45,000.00 45,000.00 45,000.00Gallardo, John 13,000.40 13,000.40 13,000.40Garcia, Dolores A. 50,000.00 50,000.00 50,000.00Garcia, Earl Jimson R. 6,000.00 6,000.00 6,000.00Garcia, Lourdes C. 16.41 16.41 16.41Garcia, Muriel B. (6,500.00) (6,500.00) (6,500.00)Garcia, Mylene M. 19,000.00 9,000.00 10,000.00 10,000.00Garcia, Severino M. 624,147.34 293,384.98 330,762.36 330,762.36Garin, May C. 29,900.00 4,900.00 25,000.00 25,000.00Genota, Jaime F. 822.32 822.32 822.32Gil, Aurora H. - PMSI 7,060.00 7,060.00 7,060.00Go-Monilla, Ma. Joycelyn A. 280.31 280.31 280.31
Gonzaga, Jemabel 505.00 505.00 505.00Gonzales, Fortune N. 397.50 397.50 397.50Guardame, Quintal Nilo 305.72 305.72 305.72Gubio, James B. (4,000.00) 2,000.00 (2,000.00) (4,000.00) (6,000.00)Guevarra, Remedios P. 10,297.00 6,000.00 4,297.00 4,297.00Gupit, Dolores S. (26,896.39) (26,896.39) (26,896.39)Gutang, Marco P. (2,353.33) (2,353.33) (2,353.33)Guzman, Jericho D. 8,460.00 8,460.00 8,460.00Guzman, Jimmy 150.00 150.00 150.00Guzman, Jose 300.00 300.00 300.00Hernandez, Alma R. (1,337.50) (1,337.50) (1,337.50)Hernandez, Angeline A. 7,491.70 7,491.70 7,491.70Hilario, Jacqueline E. 662.50 662.50 662.50Hore, Lelioso G. 300.00 300.00 300.00Ibasco, Lourdes 350.00 350.00 350.00Ignacio, Lourdes D. 6,983.00 4,900.00 12,233.00 (350.00) - (350.00)Iguas, Jose A. 2,997.00 3,977.00 (980.00) - (980.00)Imbang, Ma. Nathalie A. 3,772.50 3,772.50 3,772.50Inciong, Cherry Wyne E. 7,500.00 7,500.00 7,500.00Irabagon, Miramar 6,000.00 6,000.00 6,000.00Isidro, Rosalina B. (593.75) (593.75) (593.75)Israel, Marietta C. 19,700.00 14,700.00 5,000.00 5,000.00Jabile, Joel E. 50.00 50.00 50.00Jagnis, Neil 300.00 300.00 300.00Javier, Anabella G. 8,162.50 8,162.50 8,162.50Jesus, Angelita SD. 5,714.30 5,714.22 0.08 0.08Jimenez, Arsenia S. 5,970.00 5,970.00 5,970.00Jimenez, Marietta 2,290.86 2,290.86 2,290.86Jonson, Joyce Lisa B. (48,424.97) (48,424.97) (48,424.97)Jose, Corazon V. 5,409.20 3,350.63 2,058.57 2,058.57Jose, Haidee R. (1,446.80) (1,446.80) (1,446.80)Junio, Nenitha L. 767.00 767.00 767.00Kenny, Isabel 14,000.00 14,000.00 - 14,000.00Laboy, Michael C. 20,818.00 15,166.37 5,651.63 5,651.63Lagula, Janette 1<strong>17</strong>.50 1<strong>17</strong>.50 1<strong>17</strong>.50Lamboson, Roger C. (4,000.00) (4,000.00) (4,000.00)Lamorena, Juditha M. 44,893.20 24,000.00 20,893.20 20,893.20Lantin, Rommel 1,383.31 1,383.31 1,383.31Lapastora, Milagros P. 33,066.80 25,660.00 7,406.80 7,406.80Lapuebla, Alfredo N. 2,490.00 2,490.00 2,490.00Larano, Leonora 6,048.75 200.00 5,848.75 5,848.75Larda, Edmundo D. (1,500.00) (1,500.00) (1,500.00)Laudato, Emmanuel N. (1,200.00) (1,200.00) (1,200.00)Laurente, Jaime R. 1,650.25 1,650.25 1,650.25Lauro, Jocelyn P. 10,856.00 10,856.00 10,856.00Lazaro, Ma.Teresita A. 3,205.00 3,205.00 3,205.00Legaspi, Heidi 1,000.00 1,000.00 1,000.00Leon, Emma Rose H. 22,750.00 6,250.00 16,500.00 16,500.00Leonin, Clarito V. (200.00) (200.00) (200.00)Lewis, Salome 1,147.50 1,147.50 1,147.50Liggayu, Michael 200.00 200.00 200.00Lim, Nathaniel L. 3<strong>17</strong>.00 3<strong>17</strong>.00 3<strong>17</strong>.00Lintag, Graciel A. 1,180.16 1,180.16 1,180.16Listana, Mary Rose 1,012.50 1,012.50 1,012.50Lizaso, Marcelino N. Jr. 400.00 400.00 400.00Lopez, Anastacio, Jr. L. 7,966.00 8,196.00 (230.00) (230.00)Lopez, Antonio P., Jr. 15.34 15.34 15.34Lopez, Fernando M. 250.00 250.00 250.00
Lopez, Mercedita P. 252.50 252.50 252.50Loza, Luningning R. 748.00 748.00 748.00Lugtu, Blyth 5.00 5.00 5.00Luna, Lillian N. 967.14 967.14 967.14Macadangdang, Luzviminda (137.50) (137.50) (137.50)Macalaguing, Mateo D. Jr. 10,000.00 10,000.00 10,000.00Macalalad, Consuelo 150.00 150.00 150.00Macaraeg, Paul 30,000.00 23,563.77 6,436.23 6,436.23Macario, Christopher 50.00 50.00 50.00Magayaga, Lea Q. (7,059.99) (7,059.99) (7,059.99)Magtoto, Eliseo 200.00 200.00 200.00Malabag, Pastor B. 2,638.58 2,638.58 2,638.58Malinao, Marivic 110.00 110.00 110.00Maliwat, Herminia I. 861,567.51 253,815.36 607,752.15 607,752.15Malot, Edmund Francis 100.00 100.00 100.00Manalili, Golda P. 50.00 50.00 50.00Mananquil, Amado 1,800.00 1,800.00 1,800.00Manansala, Paolo 81.58 81.58 81.58Mangahas, Roser Benjamin 1,397.00 1,397.00 1,397.00Manicsic, Teresa B. 84.00 84.00 84.00Manigan, Alma C. 7.61 7.61 7.61Manlapaz, Divine Grace 5,000.00 5,000.00 5,000.00Manlapaz, Victor 1,200.00 1,200.00 1,200.00Manrique, Elenita <strong>17</strong>,000.00 <strong>17</strong>,000.00 <strong>17</strong>,000.00Matullano, Edgardo C. 1,248.86 1,248.86 1,248.86Mazo, Flaviano S. 780.00 780.00 780.00MC Entee, Keneline M. 3,928.90 3,928.90 3,928.90Medina, Joy E. 2,419.52 0.33 2,829.37 (409.52) - (409.52)Medina, Ma. Ana Karina S. 25.94 25.94 25.94Medina, Merle S. (1,075.25) (1,075.25) (1,075.25)Medrano, Rosalinda 935.50 935.50 935.50Membrot, Ezitiel R. 2,150.00 2,150.00 2,150.00Mendoza, Cecilia H. (6,186.77) (6,186.77) (6,186.77)Mendoza, Florina M. 300.00 300.00 300.00Mendoza, Jobert 10,000.00 10,000.00 10,000.00Menez, Karren G. (550.00) (550.00) (550.00)Menorca, Emmanuel S. (282.00) 32.00 (250.00) (250.00)Mercado, Annabelle K. 3,758.55 3,758.55 3,758.55Miguel, Emmanuel C. 6,619.60 6,619.60 6,619.60Milarpis, Joel 4,000.00 4,000.00 4,000.00Minas, Geraldine C. 1,050.00 1,050.00 1,050.00Miranda, Dennis 4,100.00 4,100.00 4,100.00Mondares, Lailani D. (1,000.00) (1,000.00) (1,000.00)Monong, Cora 6,000.00 6,000.00 6,000.00Morimonte, Bonifacio D. 500.00 500.00 500.00Mortel, Honorardo M. (247.00) (247.00) (247.00)Mortell, Gideon 5,237.46 5,237.46 5,237.46Nagal, Glenn Z. 586,647.34 255,884.98 330,762.36 330,762.36Narval, Antonio G. 520.80 520.80 520.80Natera, Malvin G. 4,121.97 4,121.97 4,121.97Naui, Elizabeth S. 93.75 187.50 (93.75) (93.75)Nava, Delfin D. 767.00 767.00 767.00Nicer, Joselito C. (65,500.85) (65,500.85) (65,500.85)Nietes, Raymond G. 16,689.30 16,689.30 16,689.30Ninobla, Magnolia <strong>17</strong>0.00 <strong>17</strong>0.00 <strong>17</strong>0.00Ninubla, Shiela 1,018.53 1,018.53 1,018.53Nolasco, Maria Sylva 1,775.00 1,775.00 1,775.00Noriega, Mariwilda I. (7,306.55) (7,306.55) (7,306.55)
Nuestro, Sarah Joyce 15,000.00 4,052.03 10,947.97 10,947.97Nulla, Mila R. 21,433.75 21,433.75 21,433.75Oasan, Albert C. 750.00 750.00 750.00Ocampo, Wilfredo T. 1,150.00 1,150.00 1,150.00Olipas, Lorina L. 200.00 200.00 200.00Ong, Emil 4<strong>17</strong>.53 4<strong>17</strong>.53 4<strong>17</strong>.53Orjalo, Victoria G. 200.00 200.00 200.00Ortiz, Jose (4,882.00) (4,882.00) (4,882.00)Ortiz, Milixa Lourdes B. 5,000.00 5,000.00 5,000.00Oyzon, Gualberto J. 3,002.80 3,002.80 3,002.80Padilla, Maria Eleanor T. 1,430.50 1,430.50 1,430.50Pahutan, Ludivinia M. <strong>17</strong>,682.30 <strong>17</strong>,882.30 (200.00) - (200.00)Palparan, Karoline L. (900.00) (900.00) (900.00)Pamintuan, Jose Edmundo E. 100.00 100.00 100.00Pangilinan, Christopher 1,316.80 1,316.80 1,316.80Pangilinan, Genice R. 1,520.00 2,520.00 (1,000.00) - (1,000.00)Pantas, Felix Jr. (3,482.50) (3,482.50) (3,482.50)Pante, Ronald S. 600.00 600.00 600.00Paraiso, Lourdes Oliva C. 90,410.00 5,562.50 84,847.50 84,847.50Paras, Renato 50,000.00 50,000.00 50,000.00 50,000.00 50,000.00Pasag, Maribeth 315.00 315.00 315.00Pascua, Jennifer J. 44,977.91 4,000.00 40,977.91 40,977.91Pascual, Perfecto 350.00 350.00 350.00Pataunia, Ma. Cecilia 5.16 5.16 5.16Patricio, Natividad 598.75 598.75 598.75Paz, Rosalinda Z. 32,509.00 3,796.00 27,500.00 3,796.00 5,009.00 8,805.00Pekson II, Enrique Arvin (43,488.12) (43,488.12) (43,488.12)Pelareja, Juanito Y. 213.00 213.00 213.00Perez, Crismin 10,591.34 10,591.34 10,591.34Perez, Jose R. Jr. 52.20 52.20 52.20Pimentel, Stephanie 285.00 285.00 285.00Pineda, Rodolfo G. 71.26 221.25 (149.99) - (149.99)Ponsaran, Levy C. 2,450.00 2,450.00 2,450.00Portiz, Ellen 207.50 207.50 207.50Pring, Melanie 5,000.00 5,000.00 5,000.00Publico, Hilario Q. 5,376.50 5,376.50 5,376.50Puertollano, Derek 250.00 250.00 250.00Pulmano, Zelmo 8,000.00 8,000.00 8,000.00Puro, Kristopher John 150.00 150.00 150.00Querijero, Glen Hilario M. 5,000.00 5,000.00 5,000.00Quiambao, Arlene 358.50 358.50 358.50Quijano, Virginia A. 7,220.00 7,220.00 7,220.00Quijencio, Wilfredo D. 666.00 666.00 666.00Quintanar, Janeth A. 5,366.56 5,366.56 5,366.56Quinto, Myrna P. 9,060.00 2,000.00 7,060.00 7,060.00Quirimit, Luzviminda 1,942.77 1,942.77 1,942.77Ragonjah, Homer Jay D. 15.00 15.00 15.00Ramon, Elizabeth A. de - PMSI 7,060.00 7,060.00 7,060.00Ramones, Rhozallino C. 5,000.00 5,000.00 5,000.00Ramos, Donna B. 11.50 (11.50) - (11.50)Ramos, Erlinda L. 10,000.00 10,000.00 10,000.00Ramos, Leonora A. 2,250.00 7<strong>17</strong>.11 1,532.89 1,532.89Ramos, Ma. Theresa L. 853.81 853.81 853.81Rana, Aurelio Y. 23,498.08 26,631.00 (3,132.92) - (3,132.92)Rapirap. Raquel T. 8,288.00 8,288.00 8,288.00Rasalan, Julia 772.50 772.50 772.50Redulla, Everjeann Christie R. 34.71 34.71 34.71Remiendo, Noraliza A. 902.09 892.09 10.00 10.00
Remigio, Warley 100.00 100.00 100.00Retardo, Victor C. (600.00) (600.00) (600.00)Reyes, Byron M. 200.00 200.00 200.00Reyes, Herbert D. 4,555.00 4,555.00 4,555.00Reyes, Melodia S. 6,834.00 6,834.00 6,834.00Reyes, Ruby 572.50 572.50 572.50Reymundo, Samuel 50.00 50.00 50.00Rivera, Myrna T. (1,420.25) (1,420.25) (1,420.25)Rizada, Ryan Joseph 9,159.80 9,159.80 9,159.80Ronda, Ma. Lea A. 300.00 300.00 300.00Rosa, Giovanni dela 551.63 551.63 551.63Rosario, Alma del 7,060.00 (7,060.00) (7,060.00)Rosario, Hilario - PMSI 14,120.00 14,120.00 14,120.00Rosete, Dwight Benedict N. 1,500.00 2,000.00 (500.00) (500.00)Roxas, Ronald L. 8,000.00 8,000.00 8,000.00Rubillos, Leonardo I. (600.00) (600.00) (600.00)Ruzol, Hipolito S. 300.00 300.00 300.00Sabaupan, Sylvette G. 23,364.75 23,364.75 23,364.75Sabaybay, Jocelyn L. 666.00 666.00 666.00Saldua, Eder John (5,000.00) (5,000.00) (5,000.00)Salonga, Lea 50.00 50.00 50.00Salud, Alann M. (520.00) (520.00) (520.00)Salvacion, Dennis C. (3,000.00) (3,000.00) (3,000.00)Salvador, Esther D. 18.00 18.00 18.00San Pablo, Ma.Cecilia A. 492.25 492.25 492.25Sansaet, Sheery O. (107.50) 53.75 (53.75) (53.75)Sante, Nova C. (981.25) (981.25) (981.25)Santiago, Christopher G. 9,638.<strong>17</strong> 9,638.<strong>17</strong> 9,638.<strong>17</strong>Santiago, Edwin B. 50.00 50.00 50.00Santiago, Genine 1,130.00 1,130.00 1,130.00Santillan, Vivian M. 190.00 190.00 190.00Santos, Arwind 49,990.00 49,990.00 49,990.00Santos, Carmelita C. (1,391.64) (1,391.64) (1,391.64)Santos, Danilo B. 2,645.25 2,645.25 2,645.25Santos, Dinia 251.25 251.25 251.25Santos, Florentino I. (1,788.00) (1,788.00) (1,788.00)Santos, Glecerio 200.00 200.00 200.00Santos, Jing 267.00 267.00 267.00Santos, Mary Lord 5,000.00 5,000.00 5,000.00Santos, Michelle R. 574.56 574.56 574.56Santuile, Aida M. 8,000.00 8,000.00 8,000.00Sapitula, Preciosa S. 1,586.57 1,586.57 1,586.57Sarita, Larry 50.00 50.00 50.00Sarmiento, Lina Q. 7,325.77 1,634.15 5,691.62 5,691.62Sauco, Carlos P. 5,206.14 5,206.14 5,206.14Sayco, Marjorie 206.50 206.50 206.50Sido, Ma. Victoria P. 6,125.80 6,000.00 125.80 125.80Sin, Glenda S. 7,060.00 7,060.00 7,060.00Sinang, Rolando R. 7,263.50 7,263.50 7,263.50Sincioco, Mary Ann 207.50 207.50 207.50Siongco, Ma. Teresita 2,000.00 2,000.00 2,000.00Sioson, Annabelle P. 60.00 60.00 60.00Sioson, Yolanda J. 57,480.00 57,480.00 57,480.00Soliman, Norma P. 7,060.00 7,060.00 7,060.00Sopoco, Anna Marie M. 1,890.00 1,890.00 1,890.00Soria, Eulegio E. 1,000.00 1,000.00 1,000.00Soronel, Rolando A. 1,<strong>17</strong>5.00 1,<strong>17</strong>5.00 1,<strong>17</strong>5.00Sta. Ana, Noemi V. 311.00 311.00 311.00
Tabaloc, Edgardo U. Jr. 51.58 51.58 51.58Tabaniag, Flordeliza 63.75 63.75 63.75Tablizo, Anne Margareth 206.50 206.50 206.50Tagle, Susan M. 5,051.41 5,051.41 5,051.41Tamay, Shariff M. 5,000.00 5,000.00 5,000.00Tamayao, Olivia E. 4,996.60 4,996.60 4,996.60Tan, Carolina M. - PMSI 7,060.00 7,060.00 7,060.00Tan, Cedrick - PMSI (4,875.00) (4,875.00) (4,875.00)Tan, Derrick - PMSI 15,187.00 15,187.00 15,187.00Tan, Mary Joyce P.- PMSI 7,060.00 7,060.00 7,060.00Tan, Ryanne 1<strong>17</strong>.50 1<strong>17</strong>.50 1<strong>17</strong>.50Tapalgo, Elyn M. Jr. (2,657.50) (2,657.50) (2,657.50)Tapit, Neila E. (672.00) (672.00) (672.00)Tecson, Rhenalyn 311.00 311.00 311.00Teoxon, Lucio 379.82 379.82 379.82Tibayan, Florencia C. 305.00 305.00 305.00Tiburcio, Jaime, Jr. 2,007.50 2,007.50 2,007.50Timbugan, Josefina - PMSI 7,060.00 7,060.00 7,060.00 7,060.00 - 7,060.00Tingcungco, Elizabeth G. 259.02 259.02 259.02Tirazona, Renato A. 1,989.92 3.00 3.00 1,989.92 1,992.92Tiu, Michael 200.00 200.00 200.00Togado, Illumar I. 5,250.00 1,250.00 4,000.00 4,000.00Tomas, Eden A. 943.00 943.00 943.00Torres, Irma R. (300.00) (300.00) (300.00)Torres, Maruja T. 206.50 206.50 206.50Trinidad, Alfredo D. 329.07 329.07 329.07Trinidad, Josefina <strong>17</strong>0.00 <strong>17</strong>0.00 <strong>17</strong>0.00Tuazon, Nino M. 356.25 356.25 356.25Unidad, Kim Ryan 100.00 100.00 100.00Ureta, Peter 9,397.10 9,397.10 9,397.10Usita, Laarni P. 23,069.00 23,069.00 23,069.00Utzurrum, Jonathan B. 7,<strong>17</strong>8.00 7,<strong>17</strong>8.00 7,<strong>17</strong>8.00Uy, Moira B. 4,000.00 4,000.00 4,000.00Uyson, Leslie Marie C. 15,372.00 15,372.00 15,372.00Valdez, Ferdinand 1,000.00 1,000.00 1,000.00Valdez, Gloria 1,237.50 1,237.50 1,237.50Valencia, Jean Pauline S. (5,198.00) (5,198.00) (5,198.00)Valencia, Ma. Theresa L. 3,195.00 2,665.00 530.00 530.00Valencia, Venancio 300.00 300.00 300.00Valente, Jovito S. (2,659.60) (2,659.60) (2,659.60)Valenzuela, Edwin E. 300.00 300.00 300.00Vallo, Mary Rose C. <strong>17</strong>5.00 <strong>17</strong>5.00 <strong>17</strong>5.00Valmonte, Alejandra Monica 205.25 205.25 205.25Varilla, Edglyn G. 5,140.61 5,140.61 5,140.61Vega, Jose Mario D. 300.00 300.00 300.00Velasco, Antonio Y. 650.10 650.10 650.10Vera, Antonio 25,813.45 25,813.42 0.03 0.03Vera, Jose Rizalito c. (5,400.00) (5,400.00) (5,400.00)Vera, Sebastian (2,300.00) (2,300.00) (2,300.00)Verances, Ma. Laline V. (841.50) (841.50) (841.50)Vergara, Flocerfida - PMSI (35,220.00) (35,220.00) (35,220.00)Vergara, Melchor - PMSI (7,060.00) (7,060.00) (7,060.00)Vergara, Oliver Francis - PMSI (7,060.00) (7,060.00) (7,060.00)Vergara, Regidor - PMSI (7,060.00) (7,060.00) (7,060.00)Vergara, Romeo - PMSI 21,180.00 21,180.00 21,180.00Verzosa, Bobby 100.00 100.00 100.00Vibar, Enrico B. 7,200.00 7,200.00 7,200.00Vicera, Desmond M. 200.00 200.00 200.00
Victoria, Michael S. (640.00) (640.00) (640.00)Villaceran, Eugenio V. (18,230.98) (18,230.98) (18,230.98)Villamiel, Carminda (29,288.90) (29,288.90) (29,288.90)Villanueva, Ace R. 26.98 26.98 26.98Villanueva, Jerome 400.00 400.00 400.00Villanueva, Jonas V. (13,073.00) (13,073.00) (13,073.00)Villanueva, Ma. Concepcion 5,330.00 330.00 5,000.00 5,000.00Villapando, Marimel A. 200.00 200.00 200.00Villar, Gerald 7,060.00 7,060.00 7,060.00Vinluan, Lourdes R. 41,328.00 42,000.00 (672.00) - (672.00)Vivas, Cherry Mae 300.00 300.00 300.00Woolsey, Nida B. 268.00 10.00 10.00 268.00 278.00Yabis, Geraldine 97.50 97.50 97.50Yang, Gloria 45,000.00 45,000.00 45,000.00Yanzon, Gina 500.00 500.00 500.00Yap, Caridad P. (4,841.00) (4,841.00) (4,841.00)Yatco, Ma. Carmen S. 29,320.00 29,320.00 29,320.00Zaldivar, Felicia P. (672.00) (672.00) (672.00)Zaldivar, Ramil P. 5,000.00 5,000.00 5,000.00Zara, Marc Vincez R. 2,500.00 2,500.00 2,500.00Zulueta, Michael R. 7,000.00 7,000.00 7,000.00- -4,830,040.90 84,829.38 2,023,033.70 (15,194.39) 2,907,030.97 2,891,836.58-FACULTY ADVANCES -Agoncillo, Divina Gracia O. 1,986.94 1,986.94Aguilos, Susan S. 2,983.13 2,983.13Alona, Elizabeth V. (5,295.67) (5,295.67)Altares, Priscilla S. (37.62) (37.62)Anastacio, Nanette v. (5,295.67) (5,295.67)Ansano, Bela R. 11,590.42 11,590.42Austria, Rex S. (2,160.00) (2,160.00)Avengoza, Rosalie J. (6,518.64) (6,518.64)Badiola, Jose Luisito V. (0.52) (0.52)Bautista, Mary Grace S. (5,295.67) (5,295.67)Cano, Charito F. 847.27 847.27Castro, Lawrence Christopher 1,765.22 1,765.22Cruz, Sandra Lyn E. 44,290.05 44,290.05Dimalibot, Martina Geraldine Q. 1,926.98 1,926.98Estacio, Ma. Vivian G. 3,832.70 3,832.70Gariguez, Mariflor N. 10,591.34 10,591.34Garin, May C. 5,534.22 5,534.22Isip, Amando F. (1,323.91) (1,323.91)Javier, Nancy Joan M. 5,295.67 5,295.67Jose, Franco C. (6,619.59) (6,619.59)Malay, Ernesto B. 20,910.00 20,910.00Martinez, Zenaida S. (7,943.50) (7,943.50)Minas, Geraldine C. (3,150.00) (3,150.00)Narciso, Wilfrida B. 5,295.67 5,295.67Naui, Elizabeth S. (50.00) (50.00)Pacot, Marilou M. (7,943.50) (7,943.50)Permalino, Albert Emmanuel S. 7,060.89 7,060.89Sagarino, Gavino N. (5,295.67) (5,295.67)Salcedo, Liezel Donatila M <strong>17</strong>,190.24 <strong>17</strong>,190.24Salonga, Ma. Elena A. 147.16 147.16Salunga, Loida P. 14,960.54 14,960.54Salvado, Rowena E. 22,160.26 22,160.26Santos, Buenvenida 3,971.75 3,971.75
Santos, Katherine Vera A. (32.50) (32.50)Santos, Melody Christian R. 3,909.51 3,909.51Simo, Rickson Jay (21,182.72) (21,182.72)Tia, Christopher B. (0.03) (0.03)Trinidad, Josefina M. 1,690.82 1,690.82Villanueva, Rosalie R. (10,591.34) (10,591.34)Villegas, Ma. Marissa M. (10,591.34) (10,591.34)Villorente, Elizabeth F. 1,323.91 1,323.91Vinluan, Renato A. 2,028.62 2,028.62-Total 4,922,006.32 84,829.38 2,023,033.70 (15,194.39) 2,983,802.00---Ampatin, Estrella V. 560.00 (560.00) (560.00)Arquiza, Glenda S. 7,500.00 7,500.00Cabasada, Albert R. III 53,3<strong>17</strong>.71 28,629.64 55,848.00 26,099.35Caratao, Jinky Rosario 6,800.00 6,800.00Cruz, Reynaldo J. 5,000.00 (5,000.00)Diwa, Alvin S. 40,400.00 8,616.09 31,783.91Faustino, Jose V. 96,311.35 14,000.00 93,660.08 16,651.27Fernando, Gerry V. (1,282.30) 7,560.00 7,560.00 (1,282.30)Frades, Francisca B. (451.32) (451.32)Garin, May C. 66,130.23 20,000.00 46,130.23Leon, Jocelyn E. de (0.50) 9,984.46 3,643.80 6,339.66 6,340.16Molina, Mark Oliver P. (4,232.06) 79,950.00 80,950.00 (1,000.00) (5,232.06)Paraiso, Lourdes Oliva 0.20 0.20Pizaro, Arthur 1,200.00 1,200.00Salvador, Mary Grace C. 16,000.00 16,000.00Sarabia, Juliet S. 12,755.00 8,000.00 4,755.00Soria, Eulegio 1,777.00 1,777.00Tolentino, Rosula R. 8,646.70 24,620.03 24,620.03 8,646.70Villanueva, Romulo 5,212.00 5,212.00Villar, Gerald 20,388.77 20,388.77Yang, Gloria G. 94,260.00 82,169.20 164,669.20 11,760.00--5,346,739.10 331,742.71 2,496,160.90 (10,414.73) 3,182,320.91---------------
APRIL 2008 - MARCH 2009 ---JANUARY 2008- C/A --Abelardo, Luzviminda 9,404.00 40,484.38 33,888.38 16,000.00 16,000.00Abella, Bernard (5.68) 24.78 15.22 3.88 3.88Abellera, Evelyn C. 6,186.20 5,593.10 593.10 593.10Abello, Susan B. 6,119.00 5,003.00 - 1,116.00Acosta, Marizon Isabel R. 400.00 600.00 - (200.00)Adil, Mary Antoinette 200.00 200.00 200.00Advincula, Helen D. 20,250.00 250.00 20,000.00 20,000.00Aguila, Fitzgerald 11,000.00 - 11,000.00Ahmadzadeh, Teresita 16.00 15,521.25 14,826.63 - 710.62Alabarca, Wilma J. 8,167.50 5,0<strong>17</strong>.50 - 3,150.00Alagao, Ma. Cristina T. 1,844.25 1,660.57 - 183.68Alarde, Crispulo, Jr. 18,962.50 74,905.25 93,207.75 - 660.00Albano, Allan Rey 4,000.00 4,000.00Alcoberes, Philip Jay N. <strong>17</strong>0.00 10,850.25 12,020.25 - (1,000.00)Alcoriza, Jennifer M. 600.00 - (600.00)Alimuin, Sylvia A. 1,444.75 16,700.25 16,794.88 - 1,350.12Amlog, Jocelyn 300.00 200.00 - 100.00Anido, Cecilia I. 500.05 7,473.00 3,586.38 - 4,386.67An Lim, Jaime L. 115,649.75 45,060.00 41,209.75 19,500.00 119,500.00Anonuevo, Monica L. 300.00 14,<strong>17</strong>5.42 10,075.42 - 4,400.00Apostol, Esther S. 787.50 975.00 - (187.50)Arabia, Julieta S. 9,934.00 76,459.80 69,763.90 - 16,629.90Areola, Vina 15,200.00 7,500.00 - 7,700.00Arquiza, Glenda 150,624.00 77,624.00 - 73,000.00Arriola, Eric John C. 10,000.00 10,200.00 - (200.00)Artezuela, Marilou 39,414.00 414.00 - 39,000.00Artus, Liezel C. 200.00 650.00 997.50 (147.50) (147.50)Atanacio, Heidi C. 31,328.00 14,664.00 - 16,664.00Atanque, Aurora L. 82.00 79,403.80 64,696.40 - 14,789.40Ayson, Rosalino P. 5,042.50 <strong>17</strong>,342.38 12,357.25 - 10,027.63Ayson, Rozsano V. 14,865.00 13,378.50 - 1,486.50Baccay, Yolanda A. 1,650.00 49,838.53 31,488.53 - 20,000.00Badiola, Jose Luisito V. 200.00 - 200.00Balaoro, Maria Theresa 200.00 7,885.00 8,285.00 - (200.00)Balarosan, Edna G. 21,580.00 19,386.66 - 2,193.34Balita, Paulita C. 16,463.19 183,021.40 164,775.86 - 34,708.73Bantayan, Maria Emilia R. 10,000.00 1,650.00 - 8,350.00Baquiran, Leonidez 200.00 - 200.00Barroga, Junalyn 145.00 145.00Bartolome, Liezel M. 27,378.00 24,902.40 - 2,475.60Batan, Ericson S. 10,991.60 9,475.00 - 1,516.60Batang, Delia S. 37,578.00 27,578.00 - 10,000.00Batoon, Allen 850.00 - 850.00Bautista, Danilo B. 772.50 7,200.00 3,472.50 - 4,500.00Belardo, Amy G. 26,666.00 24,916.00 - 1,750.00Belaya, Vina Grace C. 1,862.40 - (1,862.40)Belleza, Asuncion L. 15,000.00 35,000.00 9,189.00 - 40,811.00Beltran, Edna M. 25,214.08 <strong>17</strong>,714.08 - 7,500.00Belza, Mercedes A. 998.00 85,073.80 71,488.00 - 14,583.80Bernardo, Rodrigo G. 8,389.25 75,412.00 62,389.25 - 21,412.00Bingculado, Roger B. 2,500.00 34,000.00 34,000.00 - 2,500.00Bontigao, Eli N. 1,200.00 9,856.00 9,056.00 - 2,000.00
Borja, Sofriano A. 7,000.00 15,000.00 11,250.00 - 10,750.00Brigino, Frederick L. 800.00 825.00 - (25.00)Brillon, Cherish Aileen A. 31.00 23,800.00 23,856.00 - (25.00)Bueno, Marivie 370.75 370.75Buot, Joseph 600.00 - 600.00Bustamante, Maria Christine H. 10,000.00 6,800.00 16,200.00 - 600.00Butcon, Vincent Edward R. 800.00 825.00 - (25.00)Cabaltica, Leilani A. 4,000.00 146,580.00 93,193.33 - 57,386.67Cabasada, Albert R. III 7.00 12,307.00 - (12,300.00)Cabebe, Lolita D. 65.00 791.00 921.00 - (65.00)Cabilto, Gerardo P. <strong>17</strong>,000.00 6,200.00 - 10,800.00Cajucom, Cherry H. 2,979.34 11,580.00 10,<strong>17</strong>2.67 - 4,386.67Cajucom, Marie Christine B. 850.00 - 850.00Calub, May Virginia Blesilda 200.00 - 200.00Camaclang, Merlita J. 749.00 12,890.86 7,070.24 - 6,569.62Camana, Love V. <strong>17</strong>,760.00 15,085.00 - 2,675.00Canare, Sabino C. 375.00 - (375.00)Cando, Cromwell N. 20,000.00 16,000.00 - 4,000.00Canilao, Fe V. 506,704.00 402,3<strong>17</strong>.33 - 104,386.67Canoza, Geraldine E. 48,661.30 46,780.30 - 1,881.00Capacio, Glenn 50,000.00 55,000.00 - (5,000.00)Capili, Regina R. 2,533.50 4,616.75 7,568.38 - (418.13)Caranguian, Reynaldo G. 9,836.00 37.00 - 9,799.00Carlos, Salome S. 1,<strong>17</strong>0.00 950.00 2,970.00 - (850.00)Carpio, Rustica 1,788.00 - 1,788.00Casaclang, Editha U. 65.00 <strong>17</strong>,244.01 15,133.35 - 2,<strong>17</strong>5.66Castillo, Carolina 45,000.00 21,000.00 - 24,000.00Castro, Bryan M. 2,472.00 1,800.00 - 672.00Castro, Joeven R. 23,124.25 <strong>17</strong>,965.46 - 5,158.79Castronuevo, Ellaine P. 15,028.50 13,778.50 - 1,250.00Casuco, Leonida S. 180.00 28,614.40 43,408.80 - (14,614.40)Cauba, Harvey A 200.00 - 200.00Cayetano, Lovella M. 36,813.25 30,813.25 - 6,000.00Chastein, Cherry R. 61,500.00 51,500.00 - 10,000.00Cinco, Concepcion R. 10,025.00 25.00 - 10,000.00Cinco, Estrella J. 10,356.65 12,456.65 - (2,100.00)Ciubal, Willie Y. 10,054.00 6,904.00 - 3,150.00Civil, Jerwin John Y. 14,000.00 15,933.20 - (1,933.20)Clerigo, Bernard A. 11,538.00 9,786.00 - 1,752.00Contreras, Jelina Joy S. 39,200.00 200.00 - 39,000.00Copiaco, Ross Joseph B. 2,979.34 6,580.00 5,222.67 - 4,336.67Cortez, Lina 88.76 (88.76) (88.76)Cruz, Benjamin F. 25,000.00 105,000.00 100,000.00 - 30,000.00Cruz, Noel L. 26,433.91 6,000.00 - 20,433.91Cruz, Reynaldo J. 167.15 167.00 - 0.15Cuevas, Romeo C. 1,459.72 1,459.00 - 0.72Cunanan, Manuel Luis 154,000.00 - 154,000.00Dacayanan, Marites G. 6,889.00 7,126.04 - (237.04)Daguman, Ian 650.00 - 650.00Davalos, Zenaida R. 800.00 548.00 1,098.00 - 250.00David, Melvira C. 15,037.00 15,372.00 - (335.00)Decena, May Celine 272.00 - 272.00Destura, Blanca 2,618.25 13,628.50 5497.<strong>17</strong> - 10,749.58Diaz, Joel 850.00 - 850.00Dimalibot, Ma. Martina Geraldine 200.00 - 200.00Dingding, Quintin P. 120.00 44,521.50 20,641.50 - 24,000.00Dios, Rolando Gerald 200.00 - 200.00Dizon, Kenneth Earl I. 400.00 200.00 - 200.00
Dizon, Riza R. 100.00 200.00 - (100.00)Dominguez, Rex S. 4,992.00 81,307.07 61,959.41 - 24,339.66Dones, Irene P. 38,226.00 10,826.00 - 27,400.00Ducut, Mirela G. 48,714.45 11,549.85 - 37,164.60Dulay, Sofronio A. Jr. 48,450.00 29,250.00 - 19,200.00Echauz, Lydia B. 50,000.00 - 50,000.00Eleazar, Glenda C. <strong>17</strong>,625.00 41,580.00 24,818.33 - 34,386.67Enriquez, Rex Cezar P. 837.50 1,037.50 - (200.00)Ermitano, Nolivienne C. 650.00 887.50 - (237.50)Escleto, Wilberto 10,800.00 10,825.00 - (25.00)Escosia, Aurora A. 2,257.95 46,582.30 42,971.19 - 5,869.06Esguerra, Anna Leah R. 200.00 - 200.00Espiritu, Elizabeth O. 2,380.00 842.66 - 1,537.34Estacio, Ma. Vivian G. 68,269.00 54,495.67 - 13,773.33Estrella, Luisito P. 5,000.00 26,352.00 25,652.00 - 5,700.00Evangelista, Rey M. 250.00 70,099.37 42,040.18 - 28,309.19Faustino, Jose V. 18,<strong>17</strong>3.86 102,087.65 107,152.32 - 13,109.19Ferareza, Rimar 250.00 250.00Fernando, Gerry V. 21,096.98 1,096.98 - 20,000.00Flora, Dolores 12,750.00 15,<strong>17</strong>1.00 <strong>17</strong>,146.67 - 10,774.33Flores, Cecilia D. 100.00 - 100.00Flores, Miguela T. 76,000.00 32,666.67 - 43,333.33Frades, Francisca B. 169.00 58,292.00 20,979.00 - 37,482.00Fronda, Adelaida C. 5,044.00 6,044.00 - (1,000.00)Galang, Lemery N. 5,477.00 5,000.00 - 477.00Galicia, Reynaldo M. 200.00 30,426.00 23,484.00 - 7,142.00Galo, Crispin L. 20,742.58 1,800.00 22,542.25 0.33Garcia, Dolores A. 100.00 - 100.00Garcia, Miriam 10,845.75 1,807.63 - 9,038.12Garcia, Severino M. 200,000.00 133,336.00 - 66,664.00Garin, May C. 15,011.75 30,011.77 - (15,000.02)Gella, Delia D. 200.00 - 200.00Gella, Frederick S. 25,122.75 27,122.85 - (2,000.10)Gemzon, Elena F. 464.50 5,483.00 2,292.<strong>17</strong> - 3,655.33Gervacio, Ma. Cristina SJ. 240.00 5,328.00 5,808.00 - (240.00)Gilera, Enrico G. 213,790.15 145,474.41 - 68,315.74Golloso, Helen E. 14,745.50 10,245.51 - 4,499.99Gomez, Rhia A. 1,000.00 1,025.00 - (25.00)Grasparil, James Andrew 35,004.39 36,579.39 - (1,575.00)Guarin, Ellen G. 400.00 - 400.00Gubio, James B. 16,477.00 14,077.00 - 2,400.00Guevarra, Dorvin H. 9,163.71 5,775.00 11,545.91 - 3,392.80Guevarra, Ma. Theresa M. 425.00 104.00 954.00 - (425.00)Gurrea, Ruby 1,214.00 1,014.00 - 200.00Gusi, Rechilda D. 310.00 1,746.55 1,235.15 - 821.40Gutierrez, Maria Myrel M. 15,000.00 7,500.00 - 7,500.00Hernandez, Jan Joseph S. 5,957.25 4,770.80 - 1,186.45Hilario, Gilbert P. 10,991.60 9,474.80 - 1,516.80Hilario, Jose S. 1,466.93 1,466.50 - 0.43Ignacio, Lourdes D. 54,000.00 37,534.24 60,542.67 - 30,991.57Iguas, Jose A. 190.00 55,370.33 44,452.63 - 11,107.70Inciong, Cherry Wyne 15,551.00 15,074.00 - 477.00Indico, Julie Ann 348.50 2,776.96 2,776.96 348.50Isidro, Teresita L. 15,780.50 11,539.50 - 4,241.00Israel, Marietta C. 5,573.40 26,138.42 13,209.90 - 18,501.92Jamon, Romano M. 400.00 200.00 - 200.00Jarlos, Anna Liza 10,483.00 6,827.67 - 3,655.33Javier, Mary Jacquelou 200.00 - 200.00
Jayme, Fatima Winniclare Q. 31.25 20,450.00 481.25 - 20,000.00Jerusalem, Violeta L. 70,502.00 196,789.76 221,554.48 - 45,737.28Jesus, Angelita SD. 502.50 10,436.00 6,551.83 - 4,386.67Jose, Angelina P. 341,383.87 - 341,383.87Kenny Isabel 50,000.00 - 50,000.00Kuan, Robert 543,032.13 - 543,032.13Labartine, Elvira C. 10,250.00 7,750.00 - 2,500.00Lacsamana, Recuerdo G. 12,000.00 9,750.00 - 2,250.00Lakian, Teodosio 21,706.63 23,356.63 - (1,650.00)Lamorena, Juditha M. 120.00 127,000.00 85,120.00 - 42,000.00Lansang, Brenda 6,050.00 5,400.00 - 650.00Lapastora, Milagros 574.95 48,371.75 42,281.70 - 6,665.00Lauro, Jocelyn P. 68,199.00 58,400.00 - 9,799.00Lazaro, Maria Teresita A. 14,274.00 72,518.94 66,033.45 - 20,759.49Lee, Nestor 260.00 20,473.31 16,346.64 - 4,386.67Leon, Emma Rose H. 61,381.00 57,640.00 - 3,741.00Leon, Jocelyn E. 7,881.75 6,707.00 12,395.41 - 2,193.34Leonin, Clarito 200.00 200.00Lepon, Ma. Luisa M. 6,000.00 13,023.75 18,773.75 - 250.00Letrero, Bernard 14,325.00 12,775.00 - 1,550.00Liggayu, Michael 750.00 250.00 750.00 - 250.00Lim, Royce Randall 200.00 - 200.00Limon, Miguel Antonio P. 350.00 3,391.88 3,641.88 - 100.00Lindo, Alicia C. 3,952.50 45,748.80 34,077.30 - 15,624.00Lluz, Samarlita N. 7,378.75 6,189.38 - 1,189.37Lopez, Anastacio L. 454.00 10,000.00 6,954.00 - 3,500.00Lopez, Antonio C. 33,000.00 16,988.91 23,744.29 - 26,244.62Lopez, Jomelyn G. <strong>17</strong>,000.00 10,200.00 - 6,800.00Lopez, Ricardo S. 1,251.50 37,279.80 22,639.50 - 15,891.80Loyola, Voltaire 72.00 - 72.00Lumacad, Fernando B. 380.00 32,939.00 65,858.00 - (32,539.00)Luyun, Teofilo P. Jr. 27,315.00 18,868.06 - 8,446.94Mabborang, Mishel T. 200.00 - 200.00Macapagal, Arnualdo B. 598.50 <strong>17</strong>2,850.00 127,498.00 - 45,950.50Macasaet, Grace Minerva 16,738.00 15,694.00 - 1,044.00Maclang, Edwin V. 5,477.00 5,000.00 - 477.00Madria, Emenvenciano 650.00 - 650.00Madriaga, Joventina D. 6,138.00 1,188.00 - 4,950.00Mahilum, Rosalinda S. 1,066.70 866.70 - 200.00Maliwat, Herminia I. 3,277.00 1<strong>17</strong>,436.63 8,568.32 - 112,145.31Manalansan, Paolo F. 19,546.00 13,296.00 - 6,250.00Manguerra, Laarni C. 32,000.00 31,000.00 - 1,000.00Manuel, Cynthia DR. 14,750.00 11,416.66 - 3,333.34Marcelo, Gerry A. 19,236.00 14,849.33 - 4,386.67Marcial, Johnny O. 63,156.60 46,026.13 - <strong>17</strong>,130.47Marcial, Maridel S. 5,311.00 34,838.00 25,704.49 - 14,444.51Maristela, Teresita 215.00 215.00Mazo, Flaviano S. 6,731.77 24,000.00 20,950.00 - 9,781.77Mazo, Reynaldo jr. S. 19,000.00 9,500.00 - 9,500.00Medina, Buenaventura Jr. 1,050.00 1,050.00Medina, Joy E. 11,151.00 10,551.00 - 600.00Melano, Petronio A. 14,506.00 8,665.20 - 5,840.80Mendoza, Cecilia H. 200.00 - 200.00Mendoza, Ferdinand M. 20,080.00 18,813.34 - 1,266.66Mendoza, Norberto M. 20,400.00 20,500.00 - (100.00)Menez, Karren G. 2,607.50 41,842.40 38,449.90 - 6,000.00Mesina, Karen T. 56,844.00 60,844.00 - (4,000.00)Mitra, Melvin P. 1,290.00 875.00 1,612.65 - 552.35
Molina, Mark Oliver P. 9,830.00 3,250.00 - 6,580.00Monfero, Rowena A. 12,847.25 6,847.25 - 6,000.00Montano, Moses M. 5,441.67 4,500.00 - 941.67Montinola, Aurelio R. III 274,838.73 - 274,838.73Montinola, Gianna R. 387,795.94 - 387,795.94Montinola, Lourdes R. 1,800,488.76 - 1,800,488.76Morilla, Toriana A. 850.00 - 850.00Mostajo, Esmeralda D. 10.00 28,404.50 16,414.50 - 12,000.00Nagal, Glenn Z. 298,190.00 298,189.67 - 0.33Nagtalon, Leo Angelo 640.00 640.00Najjar, Mary Chastine T. 10,815.50 7,684.70 - 3,130.80Naui, Elizabeth S. 5,384.75 5,478.50 - (93.75)Navarro, Lilibeth C. 200.00 - 200.00Nebril, Jonathan A. 12,400.00 7,400.00 - 5,000.00Nicdao, Lazaro B. 11,228.16 2,469.36 - 8,758.80Nicer, Joselito C. 2,655.00 59,238.70 39,620.98 - 22,272.72Nicolas, Crispinita 6,393.81 6,203.81 - 190.00Nieto, Rowena H. 180.00 672.00 628.00 - 224.00Nob, Rene M. 20,000.00 21,800.00 - (1,800.00)Noriega, Mariwilda 7,525.30 80,642.95 76,551.49 - 11,616.76Noveno, Ruena O. 30,200.00 30,400.00 - (200.00)Nuestro, Sarah A. 666.70 516.70 - 150.00Nulla, Mila R. 35,365.76 52,844.00 44,352.76 - 43,857.00Oaferina, Gemmalyn A. 10,721.00 11,721.04 - (1,000.04)Ocampo, Dhean R. 11,783.34 5,000.00 16,833.40 (50.00) (50.06)Odon, Luke Mark 45.00 90.00 - (45.00)Oliver, Michael 30,000.00 14,310.24 15,689.76Ondevilla, Miel Kristian 9,100.00 4,600.00 - 4,500.00Orias, Ronito B. 4,000.00 - 4,000.00Orolfo, Teodora C. 1,276.50 57,500.00 47,592.50 - 11,184.00Ortiz, Jose R. 59.38 - 59.38Ortiz, Milixa Lourdes B. <strong>17</strong>0.00 16,900.00 <strong>17</strong>,129.38 - (59.38)Pacquing, Elizabeth P. 694.50 26,713.34 23,021.<strong>17</strong> - 4,386.67Padilla, Leo A. 348.50 348.50Paguibitan, Rebecca V. 850.00 1,500.00 - (650.00)Paguio, Ernesto B. 290.00 51,972.00 51,590.00 - 672.00Pahutan, Ludivinia M. 9,882.30 10,882.30 - (1,000.00)Pal, Salvacion A. 930.00 10,000.00 930.00 - 10,000.00Palaje, Joseph M. 200.00 400.00 200.00 - 400.00Palencia, Marjueve M. 14,391.00 15,391.00 - (1,000.00)Palenzuela, Delia S. 19,200.00 526.75 19,200.00 - 526.75Palis, Fernando F. 770.05 7,500.00 6,020.05 - 2,250.00Pangilinan, Genice R. 10,023.50 35,672.00 27,471.50 - 18,224.00Pantas, Felix L. Jr. 4,063.00 13,350.00 11,920.99 - 5,492.01Panzo, Salome V. 1,087.50 362.50 - 725.00Paras, Renato 107,8<strong>17</strong>.84 - 107,8<strong>17</strong>.84Pascua, Jennifer J. 5,300.00 650.00 - 4,650.00Pascual, Danilo S. 10,825.00 1,650.00 - 9,<strong>17</strong>5.00Pataunia, Ma. Cecilia C. 200.00 1,783.50 - (1,583.50)Paulino, Oscar E. 200.00 92,005.25 22,725.44 - 69,479.81Paz, Rosalinda Z. 2,979.34 34,871.50 24,690.84 - 13,160.00Pening, Teodoro 12,786.50 2,131.08 - 10,655.42Perez, Hector 7,820.00 41,700.00 47,353.34 - 2,166.66Perez, Winnie E. 50.00 29.00 129.00 - (50.00)Pineda, Rodolfo G. 400.00 24,378.34 25,433.59 - (655.25)Pizaro, Arthur P. 9,000.00 4,500.00 - 4,500.00Polido, Angelita E. 42,922.34 40,969.54 - 1,952.80Ponsaran, Levy C. 12,250.00 10,750.00 - 1,500.00
Presas, Heinrich G. 10,650.00 13,150.00 - (2,500.00)Prudencio, Philip I. 5,000.00 32,445.75 36,927.88 - 5<strong>17</strong>.87Rada, Nedi P. 30,224.00 25,224.00 - 5,000.00Ragasa, Samuel M. 45,050.05 37,040.08 - 8,009.97Ramisan, Georgie R., 216.70 316.70 - (100.00)Ramones, Marigrace M. 33,367.00 1,625.00 36,335.66 - (1,343.66)Ramos, Bernadette 39,000.00 - 39,000.00Ramos, Henry C. 29,087.50 20,087.50 - 9,000.00Ramos, Norberto M. 100.00 250.00 250.00 - 100.00Rapirap, Raquel T. 107,140.00 48,003.33 - 59,136.67Remiendo, Nora Liza A. 2,333.33 29,826.50 29,826.49 - 2,333.34Resuello, Heidi 123.50 200.00 123.50 - 200.00Reyes, Cecil G. 200.00 - 200.00Reyes, Melodia S. 18,160.00 9,386.67 - 8,773.33Reyes, Mercedes C. 4,050.75 35,646.30 22,660.45 - <strong>17</strong>,036.60Reyes, Richard R. 200.00 1,831.50 2,243.50 - (212.00)Reyes, Rosa M. 1,627.25 1,627.00 - 0.25Rico, Edna S.A. 32,842.00 25,241.00 - 7,601.00Rimano, Joy S. 7,831.50 5,341.50 - 2,490.00Robinos, Josephine D. 1,492.00 1,037.50 - 454.50Roque, Nelson Leo O. 64,147.02 49,147.02 - 15,000.00Rosario, Enrico 450.00 150.00 - 300.00Rosario, Warly Evelyn 4,400.25 19,134.75 13,246.04 - 10,288.96Ruzol, Hipolito 850.00 - 850.00Sabas, Angel Francisco 210.10 2,075.60 1,672.90 - 612.80Salvador, Paulino 50.00 50.00Sanchez, Leilani D. 575.00 558.30 - 16.70San Pablo, Ma. Cecilia A. 4,077.00 4,479.25 - (402.25)Santos, Leonida 4,875.00 19,853.00 11,568.00 - 13,160.00Sanvictores, Cielito S. <strong>17</strong>,790.44 5,679.09 - 12,111.35Saplala, Mariano F. 6,580.00 2,193.33 - 4,386.67Sarabia, Julieta 78,277.16 56,109.75 - 22,167.41Savella, Marilyn S. 975.00 600.00 - 375.00Sayat, Carmelo D. 15,042.00 9,042.00 - 6,000.00Sido, Ma. Victoria P. 1,200.00 7,107.50 1,7<strong>17</strong>.50 - 6,590.00Simo, Rickson Jay P. 200.00 - 200.00Sinang, Rolando R. 24,040.00 22,040.00 - 2,000.00Sison, Erlinda G. 13,935.70 8,070.93 - 5,864.77Sison, Roger Amadeo 290.00 40,450.00 41,030.00 - (290.00)Sison, Waltedrudes M. 1,862.40 - 1,862.40Songco, Dionisio L. 4,487.25 2,243.63 - 2,243.62Soreta, Loida R. 27,000.00 22,700.00 - 4,300.00Soriano, Carol Bongar 1,046.00 200.00 200.00 1,246.00Soriano, Myla Grace 200.00 200.00Sta.Cruz, Cinderella A. 62,581.40 66,781.40 - (4,200.00)Sta. Maria, Amelia M. 5,750.00 750.00 - 5,000.00Sta.Maria, Hipolito M. 42,000.00 29,400.00 - 12,600.00Suba, Sally Chua 90,907.54 38,240.89 - 52,666.65Tagle, Susan H. 3,837.55 207,325.21 180,962.74 - 30,200.02Talampas, Ma. Cristina J. 3,434.25 60,000.00 35,616.05 - 27,818.20Tamondong, Ivy 200.00 200.00Tampol, Eduardo 220.00 220.00Tan, Paulino 50,000.00 - 50,000.00Tapalgo, Elyn M. 6,770.00 6,180.00 - 590.00Tapit, Neila E. 51,140.00 45,060.00 - 6,080.00Taragua, Alma Trinidad R. 300.00 116,314.86 112,414.86 - 4,200.00Taruc, Pancho V. 1,673.32 1,489.98 - 183.34Tecson, Wilfrido 50,000.00 - 50,000.00
Timogan, Raymundo P. <strong>17</strong>,300.00 37,789.55 46,098.26 - 8,991.29Tirazona, Renato L. 10,005.00 41,812.25 39,805.<strong>17</strong> - 12,012.08Tizon, Dolores J. <strong>17</strong>,455.00 15,261.66 - 2,193.34Togado, Illumar 13,252.05 11,252.05 - 2,000.00Tolentino, Honey Chile 61,802.44 44,374.75 - <strong>17</strong>,427.69Torres, Maruja 414.00 - 414.00Trinidad, Aristotle R. 400.00 200.00 - 200.00Umpad, Mara 120,000.00 72,000.00 - 48,000.00Urquico, Ma. Luisa 666.00 666.00Valderrama, Ruth D. 22,811.75 21,400.88 - 1,410.87Valeza, Ariel R. 19,100.00 14,100.00 - 5,000.00Vallo, Mary Rose C. 24,763.75 24,938.75 - (<strong>17</strong>5.00)Vasquez, Vilma S. 15,374.00 12,224.00 - 3,150.00Velasco, Maria Luisa R. 200.00 - 200.00Velasquez, Damian D. 41,000.00 45,100.00 - (4,100.00)Velasquez, Ma. Charisma B. 30,999.80 29,999.80 - 1,000.00Velasquez, Willyn V. 5,253.50 1,253.50 - 4,000.00Vera, Alpher 10,200.00 35,523.60 35,723.60 10,000.00Vera, Brenda 10,100.00 100.00 - 10,000.00Vera, Michael R. 21,785.89 16,785.89 - 5,000.00Vergara, Febes 200.00 - 200.00Vicera, Reynante P. 20,000.00 21,300.00 (1,300.00) (1,300.00)Victortia, Michael S. 5,958.67 20,455.50 <strong>17</strong>,640.84 8,773.33 8,773.33Victoria, Wendelliza M. 6,426.80 24.00 6,402.80 6,402.80Villanueva, Ruth 650.00 - 650.00Villapando, Marimel A. 350.00 400.00 - (50.00)Villaroya, Robinson L. 20,000.00 24,000.00 - (4,000.00)Vinluan, Lourdes R. 2,371.90 9,790.75 10,209.31 - 1,953.34Vinluan, Renato A. 5,225.00 350.00 700.00 - 4,875.00Yap, Donato C. 200.00 200.00Yatco, Maria Carmen 47,700.00 27,908.31 - 19,791.69Ymas, Sergio S. Jr. 8,367.41 8,567.41 - (200.00)Ysla, Mark Salvador 5,000.00 - 5,000.00Zaldivar, Felicia P. 63,460.45 59,338.11 - 4,122.34Zape, Vida Edna C. 6,676.00 52,449.25 39,707.55 - 19,4<strong>17</strong>.70-876,663.71 13,165,792.66 7,413,855.71 70,086.85 6,628,600.66--Alvarez, Alfredo 4,000.00 2,000.00 - 2,000.00Ampatin, Estrella V. 162,319.00 70,692.44 205,791.44 - 27,220.00Cabasada, Albert R. 22,038.00 107,700.00 121,623.64 - 8,114.36Faustino, Jose V. 14,360.00 224,701.73 185,820.00 - 53,241.73Mendoza, Malaya 7,650.00 - 7,650.00Molina, Mark Oliver P. 37,000.00 600,069.28 787,376.89 - (150,307.61)Quines, Dante P. 300.00 - 300.00Rapirap, Raquel T. 66,380.00 69,352.00 - (2,972.00)Rosal, Josefina T. 3,000.00 2,000.00 - 1,000.00Santos, Florentino I. 144,840.00 55,865.25 196,310.34 - 4,394.91Sinang, Rolando 2,000.00 2,000.00 3,000.00 - 1,000.00-382,557.00 1,142,358.70 1,573,274.31 - (48,358.61)--TOTAL - 1131012 1,259,220.71 14,308,151.36 8,987,130.02 70,086.85 6,580,242.05
- 18 -Item 7:Financial StatementsThe Financial Statements including the applicable schedules listed in theaccompanying index to financial statements and supplementary schedulesare filed as part of this form I7 - A.
INDEX TO THE FINANCIAL STATEMENTSAND SUPPLEMENTARY SCHEDULESFINANCIAL STATEMENTSNO. OF PAGESI. PARENT CORPORATION FINANCIAL STATEMENTSSTATEMENT OF MANAGEMENT'S RESPONSIBILITYFOR FINANCIAL STATEMENTS 1REPORT OF INDEPENDENT PUBLIC ACCOUNTANTS 2BALANCE SHEETS AS OF MARCH 31, 2009 and 2008 1STATEMENTS OF INCOME FOR THE YEARS ENDEDMARCH 31, 2009, 2008 and 2007 1STATEMENT OF CHANGES IN STOCKHOLDERS' EQUITYFOR THE YEARS ENDED MARCH 31, 2009, 2008 and2007 1STATEMENTS OF CASH FLOWS FOR THE YEARSENDED MARCH 31, 2009, 2008 AND 2007 1SUPPLEMENTARY SCHEDULENOTES TO FINANCIAL STATEMENTS 35II.CONSOLIDATED FINANCIAL STATEMENTSSTATEMENT OF MANAGEMENT'S RESPONSIBILITYFOR FINANCIAL STATEMENTS 1REPORT OF INDEPENDENT PUBLIC ACCOUNTANTS 2BALANCE SHEETS AS OF MARCH 31, 2008 and 2007 2STATEMENTS OF INCOME FOR THE YEARS ENDEDMARCH 31, 2009, 2008 and 2007 1STATEMENT OF CHANGES IN STOCKHOLDERS' EQUITYFOR THE YEARS ENDED MARCH 31, 2009, 2008 and2007 1STATEMENTS OF CASH FLOWS FOR THE YEARSENDED MARCH 31, 2009, 2008 AND 2007 1SUPPLEMENTARY SCHEDULENOTES TO FINANCIAL STATEMENTS 41INDEX TO SUPPLEMENTARY SCHEDULES 23REPORT OF INDEPENDENT AUDITORS TO ACCOMPANY<strong>SEC</strong> SCHEDULES FILED SEPARATELY FROM THEBASIC FINANCIAL STATEMENTS 1
FAR EASTERN UNIVERSITY, INC.BALANCE SHEETMARCH 31, 2009(With Comparative Figures for 2008)(Amounts in <strong>Philippine</strong> Pesos)2008(As restated -Notes 2009 see Note 18)A S S E T SCURRENT ASSETSCash and cash equivalents 4 P 1,180,261,852 P 1,224,663,998Receivables - net 5 133,310,657 111,845,027Available-for-sale investments 6 1,073,109,957 840,687,402Held-to-maturity investments 20,000,000 -Other current assets 37,201,826 51,528,274Total Current Assets 2,443,884,292 2,228,724,701NON-CURRENT ASSETSDue from a related party <strong>17</strong> 100,000,000 100,000,000Held-to-maturity investments - 32,071,040Investments in subsidiaries and an associate 7 96,313,489 88,941,889Investment property - net 8 194,855,462 202,399,663Property and equipment - net 9 601,011,101 491,142,241Deferred tax assets - net 16 5,701,855 8,590,596Other non-current assets 5,598,807 5,463,973Total Non-current Assets 1,003,480,714 928,609,402TOTAL ASSETS P 3,447,365,006 P 3,157,334,103LIABILITIES AND EQUITYCURRENT LIABILITIESAccounts payable and other liabilities 10 P 380,536,852 P 430,264,990Unearned tuition fees 12 75,499,149 16,854,919Income tax payable 43,616,798 48,792,628Total Current Liabilities 499,652,799 495,912,537NON-CURRENT LIABILITYTrust funds 11 58,490,642 76,162,222Total Liabilities 558,143,441 572,074,759EQUITYCapital stock 18 984,577,900 704,369,900Treasury stock 18 ( 3,733,100 ) ( 3,733,100 )Accumulated fair value gains (losses) 6 ( 9,533,437 )1,233,243Retained earnings 18Appropriated 975,099,0<strong>17</strong> 1,147,161,414Unappropriated 942,811,185 736,227,887Total Equity 2,889,221,565 2,585,259,344TOTAL LIABILITIES AND EQUITY P 3,447,365,006 P 3,157,334,103See Notes to Financial Statements.
FAR EASTERN UNIVERSITY, INC.INCOME STATEMENTFOR THE YEAR ENDED MARCH 31, 2009(With Comparative Figures for 2008 and 2007)(Amounts in <strong>Philippine</strong> Pesos)2008 2007(As restated - (As restated -Notes 2009 see Note 18) see Note 18)EDUCATIONAL INCOMETuition fees - net of discounts 12 P 1,611,808,467 P 1,580,683,033 P 1,565,968,902Miscellaneous 50,280,810 33,146,510 30,085,6661,662,089,277 1,613,829,543 1,596,054,568OPERATING EXPENSES 13 1,164,729,736 1,076,741,499 1,042,752,573OPERATING INCOME 497,359,541 537,088,044 553,301,995OTHER INCOME (CHARGES)Finance income 14 120,713,165 106,423,249 114,137,124Finance costs 5 ( <strong>17</strong>,581,234 ) ( 22,198,760 ) ( 16,390,811 )Rental 8 22,927,970 25,494,398 42,011,777Miscellaneous 5 18,754,107 21,884,819 ( 18,937,022 )144,814,008 131,603,706 120,821,068INCOME BEFORE TAX 642,<strong>17</strong>3,549 668,691,750 674,123,063TAX EXPENSE 16 75,<strong>17</strong>5,688 75,785,747 70,596,011NET INCOME P 566,997,861 P 592,906,003 P 603,527,052Earnings Per Share 19 P 67.44 P 84.62 P 103.37See Notes to Financial Statements.
FAR EASTERN UNIVERSITY, INC.STATEMENT OF CHANGES IN EQUITYFOR THE YEAR ENDED MARCH 31, 2009(With Comparative Figures for 2008 and 2007)(Amounts in <strong>Philippine</strong> Pesos)2008 2007(As restated - (As restated -Notes 2009 see Note 18) see Note 18)CAPITAL STOCK 18Balance at beginning of year P 704,369,900 P 704,369,900 P 470,847,300Issuance during the year 280,208,000 - 233,522,600Balance at end of year 984,577,900 704,369,900 704,369,900TREASURY STOCK - at cost (37,331 shares) 18 ( 3,733,100 ) ( 3,733,100 ) ( 3,733,100 )ACCUMULATED FAIR VALUE GAINS (LOSSES)Balance at beginning of year 1,233,243 5,461,069 ( 5,536,147 )Fair value gains (losses) for the year 6 ( 8,016,081 )1,286,340 5,428,886Reclassification to profit and loss during the year ( 2,750,599 ) ( 5,514,166 )5,568,330Balance at end of year ( 9,533,437 )1,233,243 5,461,069RETAINED EARNINGS 18AppropriatedBalance at beginning of year 1,147,161,414 697,161,414 697,161,414Appropriations for the year - 450,000,000 -Reversal of appropriations ( <strong>17</strong>2,062,397 )- -Balance at end of year 975,099,0<strong>17</strong> 1,147,161,414 697,161,414UnappropriatedBalance at beginning of yearAs previously reported 766,521,354 938,901,911 744,094,609Prior period adjustment ( 30,293,467 ) ( 30,293,467 ) ( 30,293,467 )As restated 736,227,887 908,608,444 713,801,142Net income 566,997,861 592,906,003 603,527,052Cash dividends ( 252,268,960 ) ( 315,286,560 ) ( <strong>17</strong>5,197,150 )<strong>Stock</strong> dividends ( 280,208,000 )- ( 233,522,600 )Reversal of appropriations <strong>17</strong>2,062,397 - -Appropriations for the year - ( 450,000,000 )-Balance at end of year 942,811,185 736,227,887 908,608,444Total Retained Earnings 1,9<strong>17</strong>,910,202 1,883,389,301 1,605,769,858TOTAL EQUITY P 2,889,221,565 P 2,585,259,344 P 2,311,867,727Net Gains (Losses) Recognized Directly in Equity 6 ( P 8,016,081 ) P 1,286,340 P 5,428,886See Notes to Financial Statements.
FAR EASTERN UNIVERSITY, INC.CASH FLOW STATEMENTFOR THE YEAR ENDED MARCH 31, 2009(With Comparative Figures for 2008 and 2007)(Amounts in <strong>Philippine</strong> Pesos)2008 2007(As restated - (As restated -Notes 2009 see Note 18) see Note 18)CASH FLOWS FROM OPERATING ACTIVITIESIncome before income tax P 642,<strong>17</strong>3,549 P 668,691,750 P 674,123,063Adjustments for:Interest income 14 ( 1<strong>17</strong>,675,433 ) ( 106,423,249 ) ( 114,137,124 )Depreciation and amortization 13 46,524,455 42,254,725 44,048,226Impairment loss on receivables 5 <strong>17</strong>,581,234 <strong>17</strong>,450,897 12,686,351Unrealized foreign exchange loss (gain) ( 3,037,732 )4,747,861 3,703,946Gain on disposal of property and equipment ( 726,424 )- ( 102,083 )Loss on sale of investment - 2,842,069 20,865,189Operating income before working capital changes 584,839,649 629,564,053 641,187,568Decrease (increase) in receivables ( 31,156,955 ) ( 20,081,539 )31,052,834Decrease (increase) in other current assets 11,481,582 ( 20,745,290 ) ( 19,748,024 )Increase in accounts payable and other liabilities 7,878,567 56,906,567 1,162,734Increase in unearned tuition fees 58,644,230 16,854,919 -Increase (decrease) in trust funds ( <strong>17</strong>,671,580 ) ( 25,109,062 )18,958,605Cash generated from operations 614,015,493 637,389,648 672,613,7<strong>17</strong>Income taxes paid ( 74,6<strong>17</strong>,911 ) ( 69,936,888 ) ( 68,863,380 )Net Cash from Operating Activities 539,397,582 567,452,760 603,750,337CASH FLOWS FROM INVESTING ACTIVITIESAcquisitions of property and equipmentand investment property 8, 9 ( 148,849,114 ) ( 48,003,906 ) ( 2,565,486 )Increase in available-for-sale investments 6 ( 240,347,166 ) ( 22,914,741 ) ( 466,849,424 )Interest received 105,270,892 90,267,525 95,592,492Decrease (increase) in held-to-maturity investments 13,743,603 257,510 ( 19,703,753 )Additional investment in subsidiaries 7 ( 7,371,600 )- -Proceeds from disposal of property and equipment 726,424 - <strong>17</strong>5,000Decrease (increase) in other non-current assets ( 134,834 ) ( 2,160,606 )28,771,625Increase in due from a related party - ( 35,000,000 )-Net Cash Used in Investing Activities ( 276,961,795 ) ( <strong>17</strong>,554,218 ) ( 364,579,546 )CASH FLOWS FROM FINANCING ACTIVITYDividends paid 18 ( 309,875,665 ) ( 194,554,457 ) ( <strong>17</strong>5,162,650 )Effect of <strong>Exchange</strong> Rate Changeson Cash and Cash Equivalents 3,037,732 ( 6,607,781 ) ( 3,703,946 )NET INCREASE (DECREASE) INCASH AND CASH EQUIVALENTS ( 44,402,146 )348,736,304 60,304,195CASH AND CASH EQUIVALENTSAT BEGINNING OF YEAR 1,224,663,998 875,927,694 815,623,499CASH AND CASH EQUIVALENTSAT END OF YEAR P 1,180,261,852 P 1,224,663,998 P 875,927,694Supplemental information on noncash financing activities:1) The <strong>University</strong> declared and issued stock dividends amounting to P280.2 million in 2009 and P233.5 million in 2007 (see Note 18.2).2) In 2009, 2008 and 2007, the <strong>University</strong> declared cash dividends totaling P252.3 million, P315.3 million and P<strong>17</strong>5.2 million, respectively,of which P24.6 million and P119.5 million remained unpaid as of March 31, 2009 and 2008, respectively (see Notes 10 and 18).See Notes to Financial Statements.
FAR EASTERN UNIVERSITY, INC.NOTES TO FINANCIAL STATEMENTSMARCH 31, 2009(With Comparative Figures for 2008 and 2007)(Amounts in <strong>Philippine</strong> Pesos)1. CORPORATE INFORMATION<strong>Far</strong> <strong>Eastern</strong> <strong>University</strong>, Inc. (the <strong>University</strong>) is a domestic educational institutionfounded in June of 1928 and incorporated on January 5, 1933. The <strong>University</strong> is aprivate, non-sectarian institution of learning comprising the following differentinstitutes that offer specific courses, namely, Institute of Arts and Sciences; Instituteof Accounts, Business and Finance; Institute of Education; Institute of Architectureand Fine Arts; Institute of Nursing; Institute of Engineering; Institute of Law; andInstitute of Graduate Studies.The <strong>University</strong> became a listed corporation in the <strong>Philippine</strong> <strong>Stock</strong> <strong>Exchange</strong> onJuly 11, 1986.As of March 31, 2009, 2008 and 2007, the <strong>University</strong> holds interest in the followingsubsidiaries and associate which were all incorporated and operating in the<strong>Philippine</strong>s:Percentage of OwnershipCompany Name 2009 2008 2007Subsidiaries:East Asia ComputerCenter, Inc. (EACCI) 100% 100% 100%<strong>Far</strong> <strong>Eastern</strong> College-Silang,Inc. (FECSI) 100% - -Fern Realty Corporation (FRC) 37.52% 36.73% 36.73%Associate –Juliana Management Co.,Inc. (JMCI) 49% 49% 49%FECSI was incorporated on January 21, 2009 but has not yet started commercialoperations as of March 31, 2009. FECSI and EACCI, similar to the <strong>University</strong>, werealso established to operate as educational institutions. FRC, on the other hand,operates as a real estate company leasing most of its investment properties to the<strong>University</strong> and other related parties.Although the <strong>University</strong> controls less than 50% of the voting shares of stock of FRC,it has the power to govern the financial and operating policies of the said entity as the<strong>University</strong> has the power to cast the majority of votes at meetings of the board ofdirectors and elect officers of FRC. Accordingly, FRC is recognized as a subsidiary ofthe <strong>University</strong>.
- 2 -The registered office address and principal place of business of the <strong>University</strong> islocated at Nicanor Reyes Sr. Street, Sampaloc, Manila.The financial statements of the <strong>University</strong> for the year ended March 31, 2009(including the comparatives as restated for the years ended March 31, 2008 and 2007)were authorized for issue by the Board of Trustees (BOT) on June 19, 2009.2. SUMMARY OF SIGNIFICANT ACCOUNTING POLICIESThe significant accounting policies that have been used in the preparation of thesefinancial statements are summarized below. These policies have been consistentlyapplied to all the years presented, unless otherwise stated.2.1 Basis of Preparation of Financial Statements(a)Statement of Compliance with <strong>Philippine</strong> Financial Reporting StandardsThe financial statements of the <strong>University</strong> have been prepared in accordancewith <strong>Philippine</strong> Financial Reporting Standards (PFRS). PFRS are adopted bythe Financial Reporting Standards Council (FRSC) from the pronouncementsissued by the International Accounting Standards Board.The financial statements have been prepared using the measurement basesspecified by PFRS for each type of asset, liability, income and expense. Thesefinancial statements have been prepared on the historical cost basis, except forthe revaluation of certain financial assets. The measurement bases are morefully described in the accounting policies that follow.(b)Functional CurrencyThese financial statements are presented in <strong>Philippine</strong> pesos, the <strong>University</strong>’sfunctional currency, and all values represent absolute amounts except whenotherwise indicated. Functional currency is the currency of the primaryeconomic environment in which the entity operates. Items included in thefinancial statements of the <strong>University</strong> are measured using its functional currency.(c)Reclassification of Certain AccountsCertain accounts in the 2008 and 2007 financial statements have beenreclassified to conform to 2009 presentation and classification.2.2 Impact of New Amendments and Interpretations to Existing Standards(a)Effective in fiscal year 2009 that are relevant to the <strong>University</strong>Of the amendments and interpretations that are effective for the fiscal year2009, only PAS 39 and PFRS 7 (Amendments), PAS 39, Financial Instruments:Recognition and Measurements and PFRS 7, Financial Instruments: Disclosures (effectivefrom July 1, 2008), are relevant to the <strong>University</strong>. The amendments permit anentity to:
- 3 -(i)(ii)Reclassify non-derivative financial assets (other than those designated atfair value through profit or loss by the entity upon initial recognition) outof fair value through profit or loss category in particular circumstances;and,Transfer from the available-for-sale category to the loans and receivablecategory those financial assets that would have met the definition of loansand receivables, provided that the entity has the intention and the abilityto hold those financial assets for the foreseeable future.The amendments are applicable in a partially retrospective manner up toJuly 1, 2008 provided that the reclassification was made on or beforeNovember 15, 2008, the cut-off date set by the FRSC. After the cut-off date, allreclassifications will only take effect prospectively. As the <strong>University</strong> did notexercise the option to reclassify its financial assets, the adoption of theseamendments has no impact on its 2009 financial statements.(b)Effective in fiscal year 2009 but not relevant to the <strong>University</strong><strong>Philippine</strong> InterpretationIFRIC 11 : PFRS 2 – Group and Treasury ShareTransactions<strong>Philippine</strong> InterpretationIFRIC 12 : Service Concession Agreements<strong>Philippine</strong> InterpretationIFRIC 14 : PAS 19 – The Limit on a DefinedBenefit Asset, Minimum FundingRequirements and their Interaction(c) Effective subsequent to fiscal year 2009There are new and amended standards and <strong>Philippine</strong> Interpretations that areeffective beginning on or after January 1, 2009 but not required to be adoptedby the <strong>University</strong> until after fiscal year 2009. Of those new standards, thefollowing are relevant to the <strong>University</strong> and which it will apply in accordancewith their transitional provisions:PAS 1 (Revised 2007) : Presentation of Financial StatementsPAS 27 (Amendments) : Consolidated and Separate FinancialStatementsPFRS 3 (Revised) : Business CombinationsVarious Standards : 2008 Annual Improvements to PFRS
- 4 -Below is a discussion of the possible impact of these accounting standards onthe <strong>University</strong>’s financial statements.(i)(ii)PAS 1 (Revised 2007), Presentation of Financial Statements (effective fromJanuary 1, 2009). The amendment requires an entity to present all items ofincome and expense recognized in the period in a single statement ofcomprehensive income or in two statements: a separate income statementand a statement of comprehensive income. The income statement shalldisclose income and expense recognized in profit and loss in the same wayas the current version of PAS 1. The statement of comprehensive incomeshall disclose profit or loss for the period, plus each component of incomeand expense recognized outside of profit and loss classified by nature(e.g., gains or losses on available-for-sale assets or translation differencesrelated to foreign operations). Changes in equity arising from transactionswith owners are excluded from the statement of comprehensive income(e.g., dividends and capital increase). An entity would also be required toinclude in its set of financial statements a statement showing its financialposition (or balance sheet) at the beginning of the previous period whenthe entity retrospectively applies an accounting policy or makes aretrospective restatement. The <strong>University</strong> will apply PAS 1 (Revised 2007)in its financial statements for fiscal year 2010.PAS 27 (Amendment), Consolidated and Separate Financial Statements(effective from July 1, 2009). The amendment mainly relates to changes inthe accounting for non-controlling interest and the loss of control of asubsidiary. The amendment to standard is not expected to havesignificant impact on the financial statements.(iii) PFRS 3 (Revised 2007), Business Combinations (effective from July 1, 2009).The revised standard includes in its scope business combinationsinvolving only mutual entities, and those in which separate entities orbusinesses are brought together to form a reporting entity by contractalone. All business combinations are accounted for by applying theacquisition method (referred to previously as the purchase method). Theadoption of this revised standard is not expected to have significantimpact on the financial statements.(iv) 2008 Annual Improvements to PFRS. The FRSC has issued theImprovements to <strong>Philippine</strong> Financial Reporting Standards 2008. Theseamendments become effective in the <strong>Philippine</strong>s in annual periodsbeginning on or after January 1, 2009. The <strong>University</strong> expects theamendments to the following standards to be relevant to the <strong>University</strong>’saccounting policies:• PAS 39 (Amendment), Financial Instruments: Recognition and Measurement.The definition of financial asset or financial liability at fair valuethrough profit or loss as it relates to items that are held for trading waschanged. A financial asset or liability that is part of a portfolio offinancial instruments managed together with evidence of an actualrecent pattern of short-term profit taking is included in such aportfolio on initial recognition. The <strong>University</strong> initially determinedthat adoption of this amendment will not have a material effect on its2009 financial statements.
- 5 -• PAS 40 (Amendment), Investment Property. PAS 40 is amended toinclude property under construction or development for future use asinvestment property in its definition of investment property. Thisresults in such property being within the scope of PAS 40; previously,it was within the scope of PAS 16. Also, if an entity’s policy is tomeasure investment property at fair value, but during construction ordevelopment of an investment property the entity is unable to reliablymeasure its fair value, then the entity would be permitted to measurethe investment property at cost until construction or development iscomplete. At such time, the entity would be able to measure theinvestment property at fair value.Minor amendments are made to several other standards; however, thoseamendments are not also expected to have a material impact on the<strong>University</strong>’s financial statements.2.3 Separate Financial Statements and Investments in Subsidiaries and anAssociateThese financial statements are prepared as the <strong>University</strong>’s separate financialstatements.The <strong>University</strong>’s investments in subsidiaries and an associate are accounted for inthese separate financial statements at cost, less any impairment loss. Impairment lossis provided when there is objective evidence that the investments in subsidiaries willnot be recovered. Such impairment loss is measured as the difference between thecarrying amount of the investment and the present value of the estimated cash flowsdiscounted at the current market rate of return for similar financial asset. The amountof the impairment loss is recognized in the income statement.Any goodwill arising from the acquisition of investments in subsidiaries andassociates, representing the excess of the acquisition costs over the fair value of the<strong>University</strong>’s share in the identifiable net assets of the acquired subsidiaries orassociates at the date of acquisition, is included in the amount recognized asinvestment in subsidiaries and associates.Subsidiaries are entities over which the <strong>University</strong> has the power to govern thefinancial reporting policies generally accompanying a shareholding of more than onehalf of the voting rights. The <strong>University</strong> obtains and exercises control through votingrights. The existence and effect of potential voting rights that are currentlyexercisable and convertible are considered when assessing whether the <strong>University</strong>controls another entity.Associate is an entity over which the <strong>University</strong> is able to exert significant influencebut which is neither subsidiary nor interest in a joint venture.
- 6 -2.4 Financial AssetsFinancial assets include cash and cash equivalents and other financial instruments.Financial assets, other than hedging instruments, are classified into the followingcategories: financial assets at fair value through profit or loss, loans and receivables,held-to-maturity investments and available-for-sale financial assets. Financial assetsare assigned to the different categories by management on initial recognition,depending on the purpose for which the investments were acquired. The designationof financial assets is re-evaluated at every reporting date at which date a choice ofclassification or accounting treatment is available, subject to compliance with specificprovisions of applicable accounting standards.Regular purchase and sales of financial assets are recognized on their trade date. Allfinancial assets that are not classified as at fair value through profit or loss are initiallyrecognized at fair value, plus transaction costs. Financial assets carried at fair valuethrough profit or loss are initially recognized at fair value and transaction costs areexpensed in the income statement.Currently, the <strong>University</strong>’s financial instruments are categorized as follows:(a)Loans and ReceivablesLoans and receivables are non-derivative financial assets with fixed ordeterminable payments that are not quoted in an active market. They arisewhen the <strong>University</strong> provides money, goods or services directly to a debtor withno intention of trading the receivables. They are included in current assets,except for maturities greater than 12 months after the balance sheet date whichare classified as non-current assets.Loans and receivables are subsequently measured at amortized cost using theeffective interest method, less any impairment losses. Any change in their valueis recognized in profit or loss. Impairment loss is provided when there isobjective evidence that the <strong>University</strong> will not be able to collect all amounts dueto it in accordance with the original terms of the receivables. The amount ofthe impairment loss is determined as the difference between the assets’ carryingamount and the present value of estimated cash flows.The <strong>University</strong>’s financial assets categorized as loans and receivables arepresented as Cash and Cash Equivalents, Receivables and Due from a RelatedParty in the balance sheet.Cash and cash equivalents are defined as cash on hand, demand deposits andshort-term, highly liquid investments readily convertible to known amounts ofcash and which are subject to insignificant risk of changes in value.(b)Held-to-maturity InvestmentsThis includes non-derivative financial assets with fixed or determinablepayments and a fixed date of maturity. Investments are classified as held-tomaturity if the <strong>University</strong> has the positive intention and ability to hold themuntil maturity which is presented as Held-to-maturity Investments in thenon-current section of the balance sheet, except those maturing within12 months of the balance sheet date. Investments intended to be held for anundefined period are not included in this classification.
- 7 -Held-to-maturity investments are measured at amortized cost using the effectiveinterest method. In addition, if there is objective evidence that the investmenthas been impaired, the financial asset is measured at the present value ofestimated cash flows. Any changes to the carrying amount of the investmentare recognized in profit or loss.(c)Available-for-sale Financial AssetsThis include non-derivative financial assets that are either designated to thiscategory or do not qualify for inclusion in any of the other categories offinancial assets. These are presented as Available-for-sale Investments in thenon-current section of the balance sheet unless management intends to disposeof the investment within 12 months from the balance sheet date.All financial assets within this category are subsequently measured at fair value,unless otherwise disclosed, with changes in value recognized in equity, net ofany effects arising from income taxes. Gains and losses arising from securitiesclassified as available-for-sale are recognized in the income statement when theyare sold or when the investment is impaired.In the case of impairment, the cumulative loss previously recognized directly inequity is transferred to the income statement. If circumstances change,impairment losses on available-for-sale equity instruments are not reversedthrough the income statement. On the other hand, if in a subsequent period thefair value of a debt instrument classified as available-for-sale increases and theincrease can be objectively related to an event occurring after the impairmentloss was recognized in income statement, the impairment loss is reversedthrough the income statement.Impairment losses recognized on financial assets are presented as part of FinanceCosts in the income statement.For investments that are actively traded in organized financial markets, fair value isdetermined by reference to stock exchange-quoted market bid prices at the close ofbusiness on the balance sheet date. For investments where there is no quoted marketprice, fair value is determined by reference to the current market value of anotherinstrument which is substantially the same or is calculated based on the expected cashflows (such as dividend income) of the underlying net asset base of the investment.Non-compounding interest, dividend income and other cash flows resulting fromholding financial assets are recognized in profit or loss when earned, regardless ofhow the related carrying amount of financial assets is measured. All income andexpense relating to financial assets recognized in profit or loss are presented in theincome statement line item Finance Income and Finance Costs, respectively.Derecognition of financial assets occurs when the rights to receive cash flows fromthe financial instruments expire or are transferred and substantially all of the risks andrewards of ownership have been transferred.
- 8 -2.5 Property and EquipmentExcept for land, which is stated at cost less any impairment in value, property andequipment are stated at cost less accumulated depreciation and amortization, andimpairment in value, if any.The cost of an asset comprises its purchase price and directly attributable costs ofbringing the asset to working condition for its intended use. Expenditures foradditions, major improvements and renewals are capitalized; expenditures for repairsand maintenance are charged to expense as incurred. When assets are sold, retired orotherwise disposed of, their cost and related accumulated depreciation, amortizationand impairment losses are removed from the accounts and any resulting gain or loss isreflected in income for the period.Depreciation and amortization are computed on the straight-line basis over theestimated useful lives of the assets as follows:Building and improvementsLeasehold improvementsFurniture and equipmentMiscellaneous eqipment20 years20 years3-6 years5 yearsLeasehold improvements are amortized over 20 years regardless of the term of leasecontract which is usually shorter than the expected useful life of the improvementsbecause it is highly probable that the lease contract with FRC will be renewed beforethe end of such contract.An asset’s carrying amount is written down immediately to its recoverableamount if the asset’s carrying amount is greater than its estimated recoverable amount(see Note 2.12).The residual values and estimated useful lives of property and equipment arereviewed, and adjusted if appropriate, at each balance sheet date.An item of property and equipment is derecognized upon disposal or when no futureeconomic benefits are expected to arise from the continued use of the asset. Any gainor loss arising on derecognition of the asset (calculated as the difference between thenet disposal proceeds and the carrying amount of the item) is included in the incomestatement in the year the item is derecognized.2.6 Investment PropertyInvestment property is measured initially at acquisition cost. Subsequently,investment property, except land which is carried at cost less impairment in value, ifany, is carried at cost less accumulated depreciation and impairment in value.Depreciation of investment property, which consists of building and improvements,are computed using the straight-line method over its estimated useful life of 20 years.Investment property is derecognized upon disposal or when permanently withdrawnfrom use and no future economic benefit is expected from its disposal. Any gain orloss on the retirement or disposal of an investment property is recognized in theincome statement in the year of retirement or disposal.
- 9 -Transfers are made to investment property when, and only when, there is a change inuse, evidence by the end of owner-occupation, commencement of an operating leaseto another party or by the end of construction or development. Transfers are madefrom investment property when, and only when, there is a change in use, evidencedby commencement of the owner-occupation of commencement of development witha view to sell.2.7 Financial LiabilitiesFinancial liabilities include accounts payable and other liabilities, which are measuredat amortized cost using the effective interest rate method.Financial liabilities are recognized when the <strong>University</strong> becomes a party to thecontractual agreements of the instrument. All interest related charges are recognizedas an expense in the income statement under the caption Finance Costs.The liabilities are initially recognized at their fair value and subsequently measured atamortized cost less settlement payments.Financial liabilities are derecognized from the balance sheet only when the obligationsare extinguished either through discharge, cancellation or expiration.2.8 ProvisionsProvisions are recognized when present obligations will probably lead to an outflowof economic resources and they can be estimated reliably even if the timing or amountof the outflow may still be uncertain. A present obligation arises from the presence ofa legal or constructive commitment that has resulted from past events.Provisions are measured at the estimated expenditure required to settle the presentobligation, based on the most reliable evidence available at the balance sheet date,including the risks and uncertainties associated with the present obligation. Anyreimbursement expected to be received in the course of settlement of the presentobligation is recognized, if virtually certain as a separate asset, not exceeding theamount of the related provision. Where there are a number of similar obligations, thelikelihood that an outflow will be required in settlement is determined by consideringthe class of obligations as a whole. In addition, where time value of money ismaterial, long-term provisions are discounted to their present values using a pretaxrate that reflects market assessments and the risks specific to the obligation.Provisions are reviewed at each balance sheet date and adjusted to reflect the currentbest estimate.In those cases where the possible outflow of economic resource as a result of presentobligations is considered improbable or remote, or the amount to be provided forcannot be measured reliably, no liability is recognized in the financial statements.Probable inflows of economic benefits that do not yet meet the recognition criteria ofan asset are considered contingent assets, hence, are not recognized in the financialstatements.
- 10 -2.9 Revenue and Expense RecognitionRevenue is recognized to the extent that the revenue can be reliably measured, it isprobable that the economic benefits will flow to the <strong>University</strong>, and the costs incurredor to be incurred can be measured reliably. In addition, the following specificrecognition criteria must also be met before revenue is recognized:(a) Tuition and Other Fees – Tuition and other fees are recognized as income over thecorresponding school term.(b) Interest – Revenue is recognized as the interest accrues (taking into account theeffective yield on the asset).(c)Rental – Revenue is recognized over the lease term using the straight-line method.Revenue is measured by reference to the fair value of consideration received orreceivable by the <strong>University</strong> for services rendered, excluding value-added tax (VAT)and discounts.Cost and expenses are recognized in the income statement upon receipt of goods,utilization of service or at the date such cost and expenses are incurred.2.10 LeasesThe <strong>University</strong> accounts for its leases as follows:(a)<strong>University</strong> as LesseeLeases which do not transfer to the <strong>University</strong> substantially all the risks andbenefits of ownership of the asset are classified as operating leases. Operatinglease payments are recognized as expense in the income statement on astraight-line basis over the lease term. Associated costs, such as maintenanceand insurance, are expensed as incurred.(b)<strong>University</strong> as LessorLeases which do not transfer to the lessee substantially all the risks and benefitsof ownership of the asset are classified as operating leases. Lease income fromoperating leases is recognized as income in the income statement on a straightlinebasis over the lease term.2.11 Foreign Currency TransactionsThe accounting records of the <strong>University</strong> are maintained in <strong>Philippine</strong> pesos. Foreigncurrency transactions during the year are translated into the functional currency atexchange rates which approximate those prevailing on transaction dates.Foreign currency gains and losses resulting from the settlement of such transactionsand from the translation at year-end exchange rates of monetary assets and liabilitiesdenominated in foreign currencies are recognized in the income statement.
- 11 -2.12 Impairment of Non-financial AssetsThe <strong>University</strong>’s investments in subsidiaries and an associate, property andequipment, investment property and certain other non-current assets are subject toimpairment testing. All other individual assets or cash-generating units are tested forimpairment whenever events or changes in circumstances indicate that the carryingamount may not be recoverable.For purposes of assessing impairment, assets are grouped at the lowest levels forwhich there are separately identifiable cash flows (cash-generating units). As a result,some assets are tested individually for impairment and some are tested at cashgeneratingunit level.An impairment loss is recognized for the amount by which the asset orcash-generating unit’s carrying amount exceeds its recoverable amount. Therecoverable amount is the higher of fair value, reflecting market conditions less coststo sell, and value in use, based on an internal evaluation of discounted cash flow.Impairment loss is charged pro-rata to the other assets in the cash-generating unit.All assets are subsequently reassessed for indications that an impairment losspreviously recognized may no longer exist and the carrying amount of the asset isadjusted to the recoverable amount resulting in the reversal of the impairment loss.2.13 Employee Benefits(a)Retirement Benefit ObligationsPension benefits are provided to employees through a defined contribution plan.A defined contribution plan is a pension plan under which the <strong>University</strong> pays fixedcontributions into an independent entity. The <strong>University</strong> has no legal or constructiveobligations to pay further contributions after payment of the fixed contribution. Thecontributions recognized in respect of defined contribution plans are expensed as theyfall due. Liabilities and assets may be recognized if underpayment or prepayment hasoccurred and are included in current liabilities or current assets as they are normally ofa short term nature.(b)Termination BenefitsTermination benefits are payable when employment is terminated by the <strong>University</strong>before the normal retirement date, or whenever an employee accepts voluntaryredundancy in exchange for these benefits. The <strong>University</strong> recognizes terminationbenefits when it is demonstrably committed to either: (a) terminating the employmentof current employees according to a detailed formal plan without possibility ofwithdrawal; or (b) providing termination benefits as a result of an offer made toencourage voluntary redundancy. Benefits falling due more than 12 months after thebalance sheet date are discounted to present value.(c)Compensated AbsencesCompensated absences are recognized for the number of paid leave days (includingholiday entitlement) remaining at the balance sheet date. They are included inAccounts Payable and Other Liabilities account at the undiscounted amount that the<strong>University</strong> expects to pay as a result of the unused entitlement.
- 12 -2.14 Trust FundsThis represents restricted funds of the <strong>University</strong> that are intended for studentwelfare, development, loan, assistance and scholarship fund, and for other specificeducational purposes. The <strong>University</strong> administers the use of these funds based on thespecific purpose such funds are identified with.2.15 Income TaxesCurrent tax assets or liabilities comprise those claims from, or obligations to, fiscalauthorities relating to the current or prior reporting period, that are uncollected orunpaid at the balance sheet date. They are calculated according to the tax rates andtax laws applicable to the fiscal periods to which they relate, based on the taxableprofit for the year. All changes to current tax assets or liabilities are recognized as acomponent of tax expense in the income statement.Deferred tax is provided, using the balance sheet liability method on temporarydifferences at the balance sheet date between the tax base of assets and liabilities andtheir carrying amounts for financial reporting purposes.Under the balance sheet liability method, with certain exceptions, deferred taxliabilities are recognized for all taxable temporary differences and deferred tax assetsare recognized for all deductible temporary differences and the carryforward ofunused tax losses and unused tax credits to the extent that it is probable that taxableprofit will be available against which the deferred income tax asset can be utilized.The carrying amount of deferred tax assets is reviewed at each balance sheet date andreduced to the extent that it is probable that sufficient taxable profit will be availableto allow all or part of the deferred tax asset to be utilized.Deferred tax assets and liabilities are measured at the tax rates that are expected toapply to the period when the asset is realized or the liability is settled, based on taxrates and tax laws that have been enacted or substantively enacted at the balance sheetdate.Most changes in deferred tax assets or liabilities are recognized as a component of taxexpense in the income statement.2.16 Related PartiesParties are considered to be related if one party has the ability, directly or indirectly, tocontrol the other party or exercise significant influence over the other party in makingfinancial and operating decisions. Parties are also considered to be related if they aresubject to common control or common significant influence. Related parties may beindividuals or corporate entities. Transactions between related parties are based onterms similar to those offered to non-related parties.
- 13 -2.<strong>17</strong> EquityCapital stock is determined using the nominal value of shares that have been issued.Treasury shares are stated at the cost of re-acquiring such shares.Accumulated fair value gains (losses) comprise gains and losses due to the revaluationof available-for-sale financial assets.Retained earnings include all current and prior period results as reported in theincome statement. The appropriated portion represents the amount which is notavailable for distribution.2.18 Earnings Per ShareBasic earnings per share is determined by dividing net income by the weighted averagenumber of shares subscribed and issued during the year after giving retroactive effectto stock dividend declared, stock split and reverse stock split during the current year,if any.Diluted earnings per share is computed by adjusting the weighted average number ofordinary shares outstanding to assume conversion of dilutive potential shares. The<strong>University</strong> does not have dilutive potential shares outstanding that would requiredisclosure of diluted earnings per share in the income statements.3. SIGNIFICANT ACCOUNTING JUDGMENTS AND ESTIMATESThe <strong>University</strong>’s financial statements prepared in accordance with PFRS requiremanagement to make judgments and estimates that affect amounts reported in thefinancial statements and related notes. Judgments and estimates are continuallyevaluated and are based on historical experience and other factors, includingexpectations of future events that are believed to be reasonable under circumstances.Actual results may ultimately vary from these estimates.3.1 Critical Management Judgments in Applying Accounting PoliciesIn the process of applying the <strong>University</strong>’s accounting policies, management has madethe following judgments, apart from those involving estimation, which have the mostsignificant effect on the amounts recognized in the financial statements:(a)Held-to-maturity InvestmentsIn classifying non-derivative financial assets with fixed or determinablepayments and fixed maturity, such as bonds, as held-to-maturity (HTM)investments the <strong>University</strong> evaluates its intention and ability to hold suchinvestments up to maturity.If the <strong>University</strong> fails to keep these investments to maturity other than forspecific circumstances as allowed under the standards, it will be required toreclassify the whole class to available-for-sale financial assets. In such a case,the investments would therefore be measured at fair value, not amortized cost.
- 14 -As of March 31, 2009 and 2008, there are no held-to-maturity investmentsdisposed of before their maturity.(b)Distinction Between Investment Properties and Owner-managed PropertiesThe <strong>University</strong> determines whether a property qualifies as investment property.In making its judgment, the <strong>University</strong> considers whether the property generatescash flows largely independent of the other assets held by an entity. Owneroccupiedproperties generate cash flows that are attributable not only to theproperty but also to other assets used in the production or supply process.Some properties comprise a portion that is held to earn rental or for capitalappreciation and another portion that is held for use in the supply of services orfor administrative purposes. If portion can be sold separately (or leased outseparately under finance lease), the <strong>University</strong> accounts for such portionseparately. If the portion cannot be sold separately, the property is accountedfor as investment property only if an insignificant portion is held for use in thesupply of services or for administrative purposes. Judgment is applied indetermining whether ancillary services are so significant that a property does notqualify as investment property. The <strong>University</strong> considers each propertyseparately in making its judgment.(c)Classification of LeasesThe <strong>University</strong> has entered into various lease agreements as either a lessor or alessee. Critical judgment was exercised by management to distinguish each leaseagreement as either an operating or finance lease by looking at the transfer orretention of significant risk and rewards of ownership of the properties coveredby the agreements. Currently, all of the <strong>University</strong>’s lease agreements aredetermined to be operating leases.Rental expense charged to operations amounted to P56.2 million in 2009,P50.5 million in 2008 and P48.2 million in 2007 (see Note 13) while rentalincome earned in 2009, 2008 and 2007are presented as Rental Income in theincome statements (see Note 8).(d)Provisions and ContingenciesJudgment is exercised by management to distinguish between provisions andcontingencies. Policies on recognition and disclosure of provision anddisclosure of contingencies are discussed in Note 2.8 and relevant disclosuresare presented in Note 20.
- 15 -3.2 Key Sources of Estimation UncertaintyThe following are the key assumptions concerning the future, and other key sourcesof estimation uncertainty at the balance sheet date, that have a significant risk ofcausing a material adjustment to the carrying amounts of assets and liabilities withinthe next financial year:(a)Allowance for Impairment of ReceivablesThe <strong>University</strong> maintains an allowance for impairment loss on receivables at alevel considered adequate to cover probable uncollectible receivables. The levelof this allowance is evaluated by management on the basis of factors that affectthe collectibility of the accounts. These factors include, but are not limited to,history of the students’ payment behavior, age of receivables and other externalfactors affecting the education industry. The <strong>University</strong> constantly reviews theage and status of receivables, and identifies accounts that should be providedwith allowance. Analyses of the net realizable value of receivables as ofMarch 31, 2009 and 2008 are presented in Note 5.Impairment losses recognized on receivables amounted to about P<strong>17</strong>.6 millionin 2009, P<strong>17</strong>.5 million in 2008 and P12.7 million in 2007 (see Note 5).(b)Valuation of Financial Assets Other than Loans and Other ReceivablesThe <strong>University</strong> carries certain financial assets at fair value, which requires theextensive use of accounting estimates and judgment. In cases where activemarket quotes are not available, fair value is determined by reference to thecurrent market value of another instrument which is substantially the same or iscalculated based on the expected cash flows of the underlying net base of theinstrument. The amount of changes in fair value would differ if the <strong>University</strong>utilized different valuation methods and assumptions. Any change in fair valueof these financial assets would affect profit and loss and equity.Fair value gains and losses recognized on available-for-sale financial assets in2009, 2008 and 2007 are presented as Accumulated Fair Value Gains (Losses) inthe statements of changes in equity (see Note 6).(c)Impairment of Available-for-sale InvestmentsThe determination when an investment is other-than-temporarily impairedrequires significant judgment. In making this judgment, the <strong>University</strong>evaluates, among other factors, the duration and extent to which the fair valueof an investment is less than its cost, and the financial health of and near-termbusiness outlook for the investee, including factors such as industry and sectorperformance, changes in technology and operational and financing cash flows.Analyses of the carrying value of the available-for-sale investments as ofMarch 31, 2009 and 2008 are presented in Note 6.
- 16 -(d)Useful Lives of Investment Property and Property and EquipmentThe <strong>University</strong> estimates the useful lives of investment property and propertyand equipment based on the period over which the assets are expected to beavailable for use. The estimated useful lives of these assets are reviewedperiodically and are updated if expectations differ from previous estimates dueto physical wear and tear, technical or commercial obsolescence and legal orother limits on the use of the assets. Analyses of the carrying amounts ofinvestment property and property and equipment are presented in Notes 8 and9, respectively. Actual results, however, may vary due to changes in factorsmentioned above. Based on management assessment as of March 31, 2009 and2008, no change in the estimated useful lives of the assets is necessary.(e)Impairment of Non-financial AssetsPFRS requires that an impairment review be performed when certainimpairment indicators are present. The <strong>University</strong>’s policy on estimating theimpairment of non-financial assets is discussed in detail in Note 2.12. Thoughmanagement believes that the assumptions used in the estimation of fair valuesreflected in the financial statements are appropriate and reasonable, significantchanges in these assumptions may materially affect the assessment ofrecoverable values and any resulting impairment loss could have a materialadverse effect on the results of operations.The <strong>University</strong> did not recognize any impairment loss on property andequipment, investment property and investments in subsidiaries and an associatein 2009, 2008 and 2007.4. CASH AND CASH EQUIVALENTSCash and cash equivalents include the following components as of March 31:2009 2008Cash on hand and in banks P 149,405,908 P 193,801,807Short-term placements 1,030,855,944 1,030,862,191P 1,180,261,852 P 1,224,663,998Cash in banks generally earn interest at rates based on daily bank deposit rates.Short-term placements are made for varying periods of up to three months dependingon the immediate cash requirements of the <strong>University</strong> and earn effective annualinterest ranging from 3.75% to 7.00% in 2009 and 3.75% to 5.25% in 2008 for pesoplacements and 1.75% to 4.00% in 2009 and 2.25% to 2.50% in 2008 for dollarplacements. Interest income earned from cash and cash equivalents are presented aspart of Finance Income in the income statements.Certain portions of cash and cash equivalents are set aside to cover for trust funds asdisclosed in Note 11.
- <strong>17</strong> -5. RECEIVABLESThis account is composed of the following:2008(As restated –Notes 2009 see Note 18)Tuition and other fees P 64,246,194 P 54,371,503Allowance for impairment losseson tuition and other fees ( 14,146,263 ) ( 11,872,333 )50,099,931 42,499,<strong>17</strong>0Receivable from:FEU EducationalFoundation, Inc. 38,040,770 28,843,710East Asia EducationalFoundation, Inc. (EAEF) 18,165,787 14,116,055Related parties <strong>17</strong>.2 4,984,005 2,341,650Advances to employees 11,479,722 9,145,859Accrued interest 4, 6,<strong>17</strong>.1 8,730,337 14,644,925Others 1,810,105 253,658P 133,310,657 P 111,845,027A reconciliation of the allowance for impairment loss on receivables at the beginningand end of 2009 and 2008 is shown below.2009 2008Balance at beginning of year P 11,872,333 P 11,436,501Impairment losses during the year <strong>17</strong>,581,234 <strong>17</strong>,450,897Receivables written off during the year ( 15,307,304 ) ( <strong>17</strong>,015,065 )Balance at end of year P 14,146,263 P 11,872,333All of the <strong>University</strong>’s receivables had been reviewed for indicators of impairment.Certain tuition and other fees receivables were found to be impaired and allowancehas been recorded accordingly. The allowance for impairment loss on receivables asof March 31, 2009 and 2008 relates only to receivables from students which havebeen outstanding for more than one semester and specifically identified to beimpaired. Impairment loss recognized on receivables is presented as part of FinanceCosts in the income statements.No allowance for impairment loss on all other receivables was provided as ofMarch 31, 2009 and 2008 since management believes that those are collectible in full.The <strong>University</strong> provides management services to EAEF which agreed to paymanagement fee computed at a certain percentage of their gross revenue subject tocertain conditions. Management fees earned amounted to P11.5 million in 2009,P20.1 million in 2008 and nil in 2007 which are presented as part of the captionMiscellaneous under Other Income (Charges) in the income statements. Theoutstanding receivables arising from this transaction are presented above asReceivable from EAEF.
- 18 -6. AVAILABLE-FOR-SALE (AFS) INVESTMENTSThis category of financial assets consists of the following:2009 2008Debt securities:Government P 792,260,802 P 706,326,539Corporate 261,110,403 109,258,5041,053,371,205 815,585,043Equity securities 19,738,752 25,102,359P1,073,109,957 P 840,687,402Interest income recognized in 2009, 2008 and 2007 are presented as part of FinanceIncome in the income statements.Certain AFS investments reached their maturity in 2009, 2008 and 2007 and were nolonger reinvested; thus reclassified to Cash and Cash Equivalents resulting in thereclassification to the income statements of cumulative gain of P2.8 million in 2009and P5.5 million in 2008, and cumulative loss of P5.6 million in 2007 which werepreviously recognized in equity.Analyses of the movement in the carrying amounts of the <strong>University</strong>’s investmentsheld by trustee banks are presented below.Note 2009 2008Balance at beginningof year P 840,687,402 P 816,893,531Additions 692,948,490 312,503,139Withdrawals ( 467,769,330 ) ( 302,906,036 )Investment income - net 14 15,259,476 12,910,428Fair value gains (losses) ( 8,016,081 ) 1,286,340Balance at end of year P 1,073,109,957 P 840,687,4027. INVESTMENTS IN SUBSIDIARIES AND AN ASSOCIATEThis account consists of the following as of March 31:2009 2008Subsidiaries:FRC P 64,419,299 P 63,297,699EACCI 20,104,999 20,104,999FECSI 6,250,000 -Associate – JMCI 7,878,121 7,878,121Total investments at cost 98,652,419 91,280,819Allowance for impairment ( 2,338,930 ) ( 2,338,930 )P 96,313,489 P 88,941,889
- 19 -In April 2008, the <strong>University</strong> made an additional investment in FRC amounting toP1.1 million which increased the <strong>University</strong>’s equity ownership interest from36.73% to 37.52%.The shares of stocks of the subsidiaries and an associate are not listed in the stockexchange; hence, the fair value of the shares cannot be determined reliably. However,management believes that the carrying amount of the investments is fully recoverable.8. INVESTMENT PROPERTYThis account consists of the FEU East Asia Main Building and its improvementsbeing leased out to EAEF.The gross carrying amounts and accumulated depreciation of investment property atthe beginning and end of 2009 and 2008 are shown below.Building andLand Improvements TotalMarch 31, 2009Cost P 53,394,726 P 207,626,479 P 261,021,205Accumulated depreciation - ( 66,165,743) ( 66,165,743)Net carrying amount P 53,394,726 P 141,460,736 P 194,855,462March 31, 2008Cost P 53,394,726 P 204,900,484 P 258,295,210Accumulated depreciation - ( 55,895,547) ( 55,895,547)Net carrying amount P 53,394,726 P 149,004,937 P 202,399,663April 1, 2007Cost P 53,394,726 P 204,900,484 P 258,295,210Accumulated depreciation - ( 45,185,685) ( 45,185,685)Net carrying amount P 53,394,726 P 159,714,799 P 213,109,525
- 20 -A reconciliation of the carrying amounts at the beginning and end of 2009 and 2008,of investment property is shown below.Building andLand Improvements TotalBalance at April 1, 2008,net of accumulateddepreciation P 53,394,726 P 149,004,937 P 202,399,663Additions - 2,725,995 2,725,995Depreciation chargesfor the year - ( 10,270,196) ( 10,270,196)Balance at March 31, 2009,net of accumulateddepreciation P 53,394,726 P 141,460,736 P 194,855,462Balance at April 1, 2007,net of accumulateddepreciation P 53,394,726 P 159,714,799 P 213,109,525Depreciation chargesfor the year - ( 10,709,862) ( 10,709,862)Balance at March 31, 2008,net of accumulateddepreciation P 53,394,726 P 149,004,937 P 202,399,663The total rental income earned from the investment property amounted toP22.9 million in 2009, P25.5 million in 2008 and P42.0 million in 2007 which arepresented as Rental in the income statements (see Note 20.2). Depreciation expenseand other related expenses incurred from the asset such as real property taxes arepresented as part of General Operating Expenses in the income statements(see Note 13).The fair value of investment property as of March 31, 2009 and 2008 wasP386.5 million which were determined based on the most recent valuation performedby independent appraisers immediately after the balance sheet date.
- 21 -9. PROPERTY AND EQUIPMENTThe gross carrying amounts and accumulated depreciation and amortization at thebeginning and end of 2009 and 2008 are shown below.Building and Furniture and Leasehold MiscellaneousLand Improvements Equipment Improvements Equipment TotalMarch 31, 2009Cost P 98,457565 P 513,765,632 P 114,826,750 P 65,423,403 P 13,515,760 P 805,989,110Accumulateddepreciation andamortization - ( 89,307,115 ) ( 88,590,851 ) ( 15,190,788 ) ( 11,889,255 ) ( 204,978,009 )Net carrying value P 98,457,565 P 424,458,5<strong>17</strong> P 26,235,899 P 50,232,615 P 1,626,505 P 601,011,101March 31, 2008Cost P 98,457,565 P 391,268,141 P 107,011,947 P 50,719,189 P 12,409,149 P 659,865,991Accumulateddepreciation andamortization - ( 67,658,804 ) ( 77,080,300 ) ( 12,325,394 ) ( 11,659,252 ) ( 168,723,750 )Net carrying value P 98,457,565 P 323,609,337 P 29,931,647 P 38,393,795 P 749,897 P 491,142,241April 1, 2007Cost P 98,457,565 P 363,116,887 P 88,895,056 P 49,301,578 P 12,090,999 P 611,862,085Accumulateddepreciation andamortization - ( 48,836,475) ( 66,938,240 ) ( 9,860,315 ) ( 11,543,857 ) ( 137,<strong>17</strong>8,887 )Net carrying value P 98,457,565 P 314,280,412 P 21,956,816 P 39,441,263 P 547,142 P 474,683,198A reconciliation of the carrying amounts, at the beginning and end of 2009 and 2008,of property and equipment is shown below.Building and Furniture and Leasehold MiscellaneousLand Improvements Equipment Improvements Equipment TotalBalance at April 1, 2008,net of accumulateddepreciation andamortization P 98,457,565 P 323,609,337 P 29,931,647 P 38,393,795 P 749,897 P 491,142,241Additions - 122,497,491 7,814,803 14,704,214 1,106,611 146,123,119Depreciation andamortization chargesfor the year - ( 21,648,311 ) ( 11,510,551 ) ( 2,865,394 ) ( 230,003 ) ( 36,254,259 )Balance at March 31, 2009,net of accumulateddepreciation andamortization P 98,457,565 P 424,458,5<strong>17</strong> P 26,235,899 P 50,232,615 P 1,626,505 P 601,011,101Balance at April 1, 2007,net of accumulateddepreciation andamortization P 98,457,565 P 314,280,412 P 21,956,816 P 39,441,263 P 547,142 P 474,683,198Additions - 28,151,254 18,116,891 1,4<strong>17</strong>,611 318,150 48,003,906Depreciation andamortization chargesfor the year - ( 18,822,329 ) ( 10,142,060 ) ( 2,465,079 ) ( 115,395 ) ( 31,544,863 )Balance at March 31, 2008,net of accumulateddepreciation andamortization P 98,457,565 P 323,609,337 P 29,931,647 P 38,393,795 P 749,897 P 491,142,241
- 22 -10. ACCOUNTS PAYABLE AND OTHER LIABILITIESThis account consists of:Notes 2009 2008Accounts payable P 41,270,585 P 35,707,914Accrued expenses 74,459,814 57,845,983Dividends payable 18.2 57,606,705 139,805,663Accrued salaries and benefits 54,229,149 30,048,030Payable to FEU retirement plan 36,901,623 41,886,105Withholding and other taxes payable 36,045,790 43,473,581Funds payable 34,361,963 27,339,986Amount due to students 33,746,306 46,555,113Deposits payable 1,326,485 1,326,485Other current liabilities 10,588,432 6,276,130P 380,536,852 P 430,264,99011. TRUST FUNDSThis account consists of the following as of March 31:2009 2008Student welfare and development fund P 26,202,141 P 40,693,748Visual aid development fund 13,224,923 13,670,640FEU Central Student Organization:Student loan fund 12,777,129 10,502,842Student scholarship fund 3,902,308 3,919,602Student assistance fund - 2,653,039Others 2,384,141 4,722,351P 58,490,642 P 76,162,222These trust funds represent collections to defray expenses related to activities forspecific educational purposes. As discussed in Note 4, the amounts of cashequivalent to the outstanding balances of these funds are set aside for such purposes.12. TUITION FEESDetails of net tuition fees presented in the income statements are as follows:2009 2008 2007Tuition and other fees P 1,694,493,469 P 1,655,826,499 P 1,636,730,534Less discounts:Scholarship 63,723,848 57,508,745 52,764,930Cash 10,214,508 10,038,965 9,804,230Family 8,746,646 7,595,756 8,192,47282,685,002 75,143,466 70,761,632P 1,611,808,467 P 1,580,683,033 P 1,565,968,902
- 23 -Towards the end of the fiscal year, the <strong>University</strong> collected tuition fees from studentsfor summer classes which start after the balance sheet date. Such collections areexcluded from tuition fees earned for the year and presented as Unearned TuitionFees in the balance sheets and recognized as revenue in the following year.13. OPERATING EXPENSESOperating expenses consists of:Notes 2009 2008 2007Instructional and AcademicSalaries and allowances <strong>17</strong>.5 P 527,192,891 P 495,587,597 P 468,925,094Employees benefits 15, <strong>17</strong>.5 164,350,335 150,395,234 134,297,699Related learningexperience 21,641,432 19,474,376 19,959,588Affiliation 9,960,332 11,418,035 11,265,056Others 21,503,870 <strong>17</strong>,370,504 15,225,060744,648,860 694,245,746 649,672,497AdministrativeSalaries and allowances 84,461,509 77,655,820 70,511,646Rental <strong>17</strong>.3 56,180,367 50,504,658 48,2<strong>17</strong>,745Employees benefits 15 39,266,335 36,165,361 35,115,<strong>17</strong>5Directors’ bonus 11,750,000 10,500,000 8,250,000Others 10,259,595 11,502,529 9,545,930201,9<strong>17</strong>,806 186,328,368 <strong>17</strong>1,640,496Maintenance and <strong>University</strong>OperationsUtilities 67,818,876 60,771,052 68,867,729Salaries and allowances 23,490,070 24,196,975 23,049,555Janitorial services 12,808,640 11,707,163 13,052,135Employee benefits 15 11,296,291 11,772,106 10,492,989Repairs and maintenance 4,619,377 4,330,271 29,441,<strong>17</strong>5Property insurance 1,160,749 564,594 1,487,187121,194,003 113,342,161 146,390,770GeneralDepreciation andamortization 8, 9 46,524,455 42,254,725 44,048,226Security services 25,834,071 18,314,315 15,323,818Publicity and promotions 6,615,235 8,033,477 4,966,479Professional fees 6,306,848 5,416,097 1,510,752Maintenance of art works 6,<strong>17</strong>6,320 2,184,264 3,474,476Taxes and licenses 1,985,560 445,275 2,078,976Donation and charitablecontributions 629,864 533,888 818,470Others 2,896,714 5,582,853 2,827,61396,969,067 82,825,224 75,048,810Total Operating Expenses P 1,164,729,736 P 1,076,741,499 P 1,042,752,573
- 24 -14. FINANCE INCOMEThis account consists of:Notes 2009 2008 2007Interest income from:Cash and cashequivalents 4 P 65,927,344 P 62,635,081 P 50,096,607AFS financial assets 6 45,180,490 37,943,665 53,455,661Advances torelated party <strong>17</strong>.1 4,895,036 3,164,618 7,9<strong>17</strong>,733HTM investments 1,672,563 2,679,885 2,667,123Foreign exchangegains – net 3,037,732 - -P 120,713,165 P 106,423,249 P 114,137,12415. EMPLOYEES’ HEALTH, WELFARE AND RETIREMENT FUNDThe <strong>University</strong> maintains a funded and contributory retirement plan, which is adefined contribution type of retirement plan since 1967, covering regular teaching andnon-teaching personnel members.The retirement fund is under the administration of an organization, the FEU Health,Welfare and Retirement Fund (the Fund), through its Retirement Board.Contributions to this fund are in accordance with the defined contribution establishedby the Retirement Board which is the sum of the employees’ and the <strong>University</strong>’scontributions. Employees’ contribution is 5% of basic salary while the <strong>University</strong>’scontribution is equivalent to 20% of the employees’ basic salary. Retirement expenserecognized in the <strong>University</strong>’s income statements amounted to P85.9 million in 2009,P63.4 million in 2008 and P49.0 million in 2007 (see Note 13).The Fund’s balance sheets as of December 31, 2008 and 2007 showed the following:2008 2007AssetsMoney market placements P 643,050,000 P 555,853,116Receivables 38,547,269 40,186,159Cash in banks 10,784,913 4,628,136Others 185,654 208,505692,567,836 600,875,916Liabilities ( 50,395,960) ( 49,871,692 )P 642,<strong>17</strong>1,876 P 551,004,224
- 25 -16. INCOME TAXESThe components of the <strong>University</strong>’s tax expense presented in the income statementsare as follows:2009 2008 2007Current tax expense:Special rate at 10% P 51,743,268 P 59,615,310 P 58,009,602Final tax at 20% 20,543,679 19,135,613 13,822,06872,286,947 78,750,923 71,831,670Deferred tax expense (income):Deferred tax arising fromorigination and reversalof temporary differences 2,888,741 ( 2,965,<strong>17</strong>6) ( 1,235,659 )P 75,<strong>17</strong>5,688 P 75,785,747 P 70,596,011A reconciliation of tax on pretax income computed at the applicable statutory rates totax expense reported in the income statements follows:2009 2008 2007Tax on pretax income at 10% P 64,2<strong>17</strong>,355 P 66,869,<strong>17</strong>5 P 68,340,033Adjustments for incomesubjected to higher tax rates 9,265,639 8,809,750 2,272,403Derecognition of previouslyrecognized deferred tax 1,700,000 - -Others ( 7,306) 106,822 ( 16,425 )Tax expense P 75,<strong>17</strong>5,688 P 75,785,747 P 70,596,011The net deferred tax assets relate to the following as of March 31:Balance SheetsIncome Statements2009 2008 2009 2008 2007Deferred tax assets:Accrued rent expense P 4,591,002 P 3,543,085 (P 1,047,9<strong>17</strong>) (P 1,131,710) P 272,458Allowance for impairmentof receivables 1,414,626 1,187,233 ( 227,393) ( 43,583) ( 683,357)Unearned income - 1,685,492 1,685,492 ( 1,685,492) -Accrued donation - 1,700,000 1,700,000 - -Unrealized foreign currency loss - 474,786 474,786 ( 104,391) ( 824,760)Deferred tax liability –Unrealized foreign currency gains ( 303,773) - 303,773 - -Deferred tax expense (income) P 2,888,741 (P 2,965,<strong>17</strong>6) (P 1,235,659)Deferred tax assets – net P 5,701,855 P 8,590,596The <strong>University</strong> availed of the Tax Incentives Provisions of Republic Act (R.A.)No. 8525, Adopt-a-School Act of 1998. Total benefit from the availment ofthis tax incentives provided under the R.A. is the sum of the amount ofcontribution/donation that were actually, directly and exclusively incurred for theAdopt-a-School Program, with limitations, conditions and rules set forth inSection 34 (H) of the Tax Code and fifty percent (50%) of the amount of suchcontribution/donation.
- 26 -<strong>17</strong>. RELATED PARTY TRANSACTIONSThe <strong>University</strong>’s related parties include its subsidiaries, the <strong>University</strong>’s keymanagement and others as described below. The following are its significanttransactions with related parties:<strong>17</strong>.1 Interest-bearing AdvancesThe <strong>University</strong> has outstanding cash advances to FRC with an aggregate principalamount of P100.0 million as of March 31, 2009 and 2008. This advances bear interestdue quarterly based on 91-day Treasury bill rates ranging from 4.61% to 6.84% in2009, 3.95% to 4.15% in 2008 and 3.00% to 6.63% in 2007. Total interest incomeearned from the advances amounted to P4.9 million in 2009, P3.2 million in 2008 andP8.0 million in 2007 which were presented as part of Finance Income in the incomestatements (see Note 14). The related outstanding interest receivables are shown asAccrued Interest under the Receivables account in the balance sheets (see Note 5).<strong>17</strong>.2 Noninterest-bearing AdvancesThe <strong>University</strong> grants unsecured and noninterest-bearing advances to certain relatedparties for working capital purposes which are currently due and demandable.Summarized below are the outstanding receivables shown as part of advances torelated parties under the Receivables accounts in the balance sheets arising from thesetransactions (see Note 5).2008 Net Additions 2009FRC P 2,341,650 P 775,647 P 3,1<strong>17</strong>,297FECSI - 1,866,708 1,866,708<strong>17</strong>.3 Lease of Campus Premises from FRCP 2,341,650 P 2,462,355 P 4,984,005The <strong>University</strong> leases certain buildings located within the campus premises from FRCfor a period of 10 years from July 1, 2005 to June 30, 2015. The lease period isrenewable subject to conditions mutually agreed upon by both parties. Total rentalexpense charged to operations amounted to P56.2 million in 2009, P50.5 million in2008 and P48.2 million 2007 under the Administrative Expenses (see Note 13) whilethere are no outstanding receivables as of the end of each year.<strong>17</strong>.4 Lease of Certain Floor to FRCThe <strong>University</strong> leases the mezzanine floor of one of the <strong>University</strong>’s building to FRCfor a period of 10 years from September 1, 2007 to August 31, 20<strong>17</strong>, renewable uponmutual consent of both parties. Based on the lease contract, the <strong>University</strong> providesdiscounts on the monthly rental during the lean season of the school year. Rentincome from FRC amounted to P800,000 in 2009 and P560,000 in 2008 which isshown as part of Rental under Other Income (Charges) in the income statements.
- 27 -<strong>17</strong>.5 Key Management Personnel CompensationTotal remunerations of the <strong>University</strong>’s key management personnel presented as partof salaries and allowances and employees benefits under the Instructional andAcademic Expenses (see Note 13) is as follows:2009 2008 2007Short-term benefits P 113,999,963 P 100,412,356 P 103,872,843Retirement benefits 18,063,955 16,321,494 13,592,380P 132,063,918 P 116,733,850 P 1<strong>17</strong>,465,22318. EQUITY18.1 Capital <strong>Stock</strong>The <strong>University</strong> has 10 million shares of authorized capital stock, with P100 par value,of which 9,845,779 shares are issued as of March 31, 2009 and 7,043,699 shares areissued as of March 31, 2008 and 2007. Total outstanding shares are 9,808,448 sharesas of March 31, 2009 and 7,006,368 shares as of March 31, 2008 and 2007 while37,331 shares costing P3.7 million are held in treasury as of those dates.18.2 Retained EarningsSignificant transactions affecting Retained Earnings, which is also restricted at anamount equivalent to the cost of treasury shares, are as follows:(a) Appropriation of Retained EarningsAppropriated Retained Earnings consists of appropriations for:Note 2009 2008 2007Expansion of facilities P 899,333,335 P 1,010,000,000 P 610,000,000General retirement 57,000,000 57,000,000 7,000,000Contingencies 20.3 18,765,682 20,161,414 20,161,414Purchase of equipmentand improvements - 30,000,000 30,000,000Acquisition of laboratoryequipment - 20,000,000 20,000,000Repairs and improvements - 10,000,000 10,000,000P 975,099,0<strong>17</strong> P 1,147,161,414 P 697,161,414The BOT approved on June 26, 2007, P100 million and P50 million additionalappropriations for expansion of facilities and general retirement, respectively, andagain on March 25, 2008, an additional appropriation for school expansion ofP300 million. In 2009, the <strong>University</strong> made a reversal of appropriations amounting toP<strong>17</strong>2.1 million pertaining to expansion of facilities, repairs and improvements,acquisition of laboratory equipment and purchase of equipment and improvements.
- 28 -(b) Dividend DeclarationThe BOT approved the following dividend declarations in 2009, 2008 and 2007,respectively:Date ofDeclaration Record Payment Amount2009Cash dividend ofP15 per share June <strong>17</strong>, 2008 July 7, 2008 July 21, 2008 P 105,095,52040% stock dividendequivalent to2,802,547 shares August 23, 2008 September 15, 2008 October 9, 2008 280,208,000467 fractional sharespaid out in cash atP100 per share August 23, 2008 September 15, 2008 October 9, 2008 46,720Cash dividend ofP15 per share December 16, 2008 January 8, 2009 January 22, 2009 147,126,720P 532,476,9602008Cash dividend ofP15 per share June 26, 2007 July 11, 2007 July 23, 2007 P 105,095,520Cash dividend ofP15 per share December 18, 2007 January 7, 2008 January <strong>17</strong>, 2008 105,095,520Cash dividend ofP15 per share March 25, 2008 April 10, 2008 April 24, 2008 105,095,520P 315,286,5602007Cash dividend ofP15 per share June 20, 2006 July <strong>17</strong>, 2006 July <strong>17</strong>, 2006 P 70,067,13050% stock dividendequivalent to2,335,226 shares March 21, 2006 September 6, 2006 October 2, 2006 233,522,600345 fractional sharespaid out in cash atP100 per share March 21, 2006 September 6, 2006 October 2, 2006 34,500Cash dividend ofP15 per share December 19, 2006 January 5, 2007 January 15, 2007 105,095,520P 408,719,750Unpaid dividends as of March 31, 2009 and 2008 are presented as dividends payableunder Accounts Payable and Other Liabilities in the balance sheets (see Note 10).(c) Prior Period AdjustmentsPrior period adjustments were recorded by the <strong>University</strong> to correct theoverstatement in the balances of Retained Earnings as of April 1, 2008, 2007 and2006 mainly because of accrued interest receivable amounting to P30.3 million thatwas not reversed in previous years. This adjustment resulted in a decrease in thebalances of Retained Earnings as of April 1, 2008, 2007, and 2006 from the previouslyreported amounts and a decrease in accrued interest receivable by the same amount.The other adjustments which affected income and expense in those years were merelyoffsetting; thus had no effect on Retained Earnings.
- 29 -19. EARNINGS PER SHAREEarnings per share amounts were computed as follows:2009 2008 2007Net income P 566,997,861 P 592,906,003 P 603,527,052Divided by weighted averagenumber of outstandingshares, net of treasury stockof 37,331 shares 8,407,408 7,006,368 5,838,755Earnings per share P 67.44 P 84.62 P 103.37The weighted average number of shares outstanding as of March 31, 2009 iscomputed as follows:Number of Months Weighted numbershares outstanding of sharesBalance at beginning of year 7,006,368 12 84,076,416Issuance on October 9, 2008 2,802,080 6 16,812,480Balance at end of year 9,808,448 100,888,896Divided by total monthsas of March 31, 2009 12Weighted average numberof shares outstanding 8,407,408The weighted average number of shares outstanding as of March 31, 2007 iscomputed as follows:Number of Months Weighted numbershares outstanding of sharesBalance at beginning of year 4,671,142 12 56,053,704Issuance on October 2, 2006 2,335,226 6 14,011,356Balance at end of year 7,006,368 70,065,060Divided by total monthsas of March 31, 2007 12Weighted average numberof shares outstanding 5,838,755There were no stock issuance in 2008, hence, the weighted average number of sharesoutstanding is equivalent to the total outstanding shares as of March 31, 2008.Diluted earnings per share were not determined since the <strong>University</strong> does not havedilutive shares as of March 31, 2009, 2008 and 2007.
- 30 -20. COMMITMENTS AND CONTINGENCIES20.1 Operating Lease Commitments – <strong>University</strong> as LesseeThe <strong>University</strong> is a lessee under non-cancellable operating leases covering certainbuildings. The lease has 10-year terms with renewal options and includes annualescalation rates of 10%. The future minimum rentals payable under these noncancellableoperating leases are as follows as of March 31:2009 2008Within one year P 39,375,281 P 35,795,710After one year but not morethan five years 201,014,828 182,740,740More than five years 79,636,542 137,285,91220.2 Operating Lease Commitments – <strong>University</strong> as LessorP 320,026,651 P 355,822,362The <strong>University</strong> leases out certain buildings to EAEF for a period of one to ten yearsuntil August 31, 20<strong>17</strong> (see Note 8). Total rent income recognized in the <strong>University</strong>’sincome statements amounted to P22.9 million in 2009, P25.5 million in 2008 andP42.0 million in 2007.Future minimum rental receivables, excluding contingent rental, under these operatingleases as of March 31, 2009 and 2008 are as follows:2009 2008Within one year P 28,666,776 P <strong>17</strong>,483,208After one year but not morethan five years 114,667,104 69,932,832More than five years 86,000,328 69,932,83220.3 Legal ClaimsP 229,334,208 P 157,348,872As of March 31, 2009 and 2008, the <strong>University</strong> is a defendant in certain civil caseswhich are pending in the local courts, certain illegal dismissal cases pending before thenational Labor Relations Commission, and a class suit for damages by certain studentswhich is pending before the Court of Appeals.The <strong>University</strong>’s management and its legal counsel believe that the liabilities, if any,which may result from the outcome of these cases, will not materially affect thefinancial position and results of operations of the <strong>University</strong>. However, the<strong>University</strong> has appropriated portion of its retained earnings for these contingencies(see Note 18.2).
- 31 -20.4 OthersThere are other contingencies that arise in the normal course of business that are notrecognized in the <strong>University</strong>’s financial statements. However, management believesthat losses, if any, arising from these commitments and contingencies will notmaterially affect its financial statements.21. RISK MANAGEMENT OBJECTIVES AND POLICIESThe <strong>University</strong> is exposed to certain financial risks in relation to financial instruments.Its main purpose for its dealings in financial instruments is to fund operational andcapital expenditures. The BOT has overall responsibility for the establishment andoversight of the <strong>University</strong>’s risk management framework. It has a risk managementcommittee headed by an independent trustee that is responsible for developing andmonitoring the <strong>University</strong>’s policies, which address risk management areas.Management is responsible for monitoring compliance with the <strong>University</strong>’s riskmanagement policies and procedures and for reviewing the adequacy of these policiesin relation to the risks faced by the <strong>University</strong>.The <strong>University</strong> does not actively engage in trading of financial assets for speculativepurposes nor does it write options. The most significant financial risks to which the<strong>University</strong> is exposed to are described below.21.1 Interest Rate SensitivityThe <strong>University</strong>’s exposure to interest rate risk arises from the following interestbearingfinancial instruments which are subject to variable interest rates. All otherfinancial assets and liabilities have fixed rates.Notes 2009 2008Cash and cash equivalents 4 P 1,180,261,852 P 1,224,663,998AFS investments 6 1,073,109,957 840,687,402Due from a related party <strong>17</strong>.1 100,000,000 100,000,000P 2,353,371,809 P 2,165,351,400The following table illustrates the sensitivity of income before tax for the years withregard to the <strong>University</strong>’s interest-bearing financial instruments. These percentageshave been determined based on the average market volatility rates, using standarddeviation, in the previous 12 months, estimated at 68% level of confidence. Thesensitivity analysis is based on the <strong>University</strong>’s financial instruments held atMarch 31, 2009 and 2008.2009 2008Reasonably Effect on Reasonably Effect onpossible change income before possible change income beforein rate tax in rate taxCash and cash equivalents +/-2.67 % P 31,423,827 +/-1.35 % P 16,574,626AFS investments +/-2.83% 28,147,720 +/-1.54% 11,1<strong>17</strong>,533Due from a related party +/-2.73% 2,733,463 +/-2.76 % 2,761,040P 62,305,010 P 30,453,199
- 32 -21.2 Credit RiskCredit risk represents the loss the <strong>University</strong> would incur if the counterparty failed toperform under its contractual obligations. The <strong>University</strong>’s exposure to credit risk onits receivables related primarily to the inability of the debtors to pay and students tofully settle the unpaid balance of tuition fees and other charges which are owed to the<strong>University</strong> based on installment payment schemes. The <strong>University</strong> has establishedcontrols and procedures in its credit policy to determine and to monitor the creditworthiness of the students based on relevant factors. Also, students are not allowedto enroll in the following semester unless the unpaid balance in the previous semesterhas been paid. The <strong>University</strong> also withholds the academic records and clearance ofthe students with unpaid balance, thus ensuring that collectibility is reasonablyassured. The <strong>University</strong>’s exposure to credit risk on its other receivable from debtorsand related parties is managed through close account monitoring and setting limits.The <strong>University</strong> neither has any significant exposure to any individual customer orcounterparty nor does it have any other concentration of credit risk arising fromcounterparties in similar business activities, geographic region or economic parties.With respect to credit risk arising from cash and cash equivalents, receivables, duefrom a related party, AFS investments and HTM investments, the <strong>University</strong>’sexposure to credit risk arises from default of the counterparty, with maximumexposure equal to the carrying amount of these instruments. The maximum exposureto credit risk at the balance sheet date is as follows:Notes 2009 2008Cash and cash equivalents 4 P 1,180,261,852 P 1,224,663,998Receivables 5 133,310,657 111,845,027AFS investments 6 1,073,109,957 840,687,402Due from a related party <strong>17</strong> 100,000,000 100,000,000HTM investments 20,000,000 32,071,040P 2,506,682,466 P 2,309,267,467The table below shows the credit quality of the <strong>University</strong>’s receivables which are theonly financial assets as of March 31, 2009 and 2008 (presented in ‘000s) having pastdue but not impaired components.NeitherPast duepast due nor Impaired Notimpaired (see Note 5) impaired Total2009Tuition and other fees P 35,325 P 14,146 P 14,775 P 64,246Related party 4,984 - - 4,984Employees 11,480 - - 11,480Others 66,747 - - 66,747P 118,536 P 14,146 P 14,775 P 147,4572008Tuition and other fees P 15,808 P 11,872 P 26,692 P 54,372Related party 2,342 - - 2,342Employees 9,146 - - 9,146Others 57,858 - - 57,858P 85,154 P 11,872 P 26,692 P 123,718
- 33 -The age of past due but not impaired receivables is about six months for both years.The <strong>University</strong> classifies tuition and other fee receivables from students based on thenumber of semesters the receivables have been outstanding. Receivables fromstudents that are outstanding for more than one semester are analyzed to determinewhether they are impaired. Those that are not outstanding for more than onesemester or are currently receivable are determined to be collectible, based onhistorical experience.The <strong>University</strong>’s management considers that all the above financial assets are notimpaired, except those specifically provided with allowance for impairment, as of thebalance sheet dates and of good credit quality. Cash and cash equivalents, AFSinvestments and HTM investments are coursed through reputable financialinstitutions duly approved by the BOT. The balance due from a related party is froma profitable related party with good payment record; collections therefrom arereasonably assured.21.3 Liquidity RiskThe <strong>University</strong> manages liquidity risk by maintaining a balance between continuity offunding and flexibility. Treasury controls and procedures are in place to ensure thatsufficient cash is maintained to cover daily operational and working capitalrequirements. Management closely monitors the <strong>University</strong>’s future and contingentobligations and ensures that future cash collections are sufficient to meet them inaccordance with internal policies. The <strong>University</strong> invests in cash placements whenexcess cash is obtained from operations.Financial liabilities of the <strong>University</strong> at the balance sheet date comprise of accountspayable and accrued expenses and dividends payables which are all short-term innature and have contractual maturities of less than 12 months.21.4 Other Price Risk SensitivityThe <strong>University</strong>’s exposure to price risk arises from its investments in equity and debtsecurities, which are classified as AFS investments in the balance sheets.Management monitors its equity and debt securities in its investment portfolio basedon market indices. Material investments within the portfolio are managed on anindividual basis.AFS investments consist of publicly listed equity securities and government securitieswhich are carried at fair value and non-listed equity securities for which no fair valueinformation is available and that are therefore carried at cost.For equity securities listed in the <strong>Philippine</strong>s, an average volatility of 36.68% and56.14% has been observed during 2009 and 2008, respectively. If quoted price forthese securities increased or decreased by that amount income before tax would havechanged by P7.1 million and P9.8 million in 2009 and 2008, respectively.The investments in listed equity securities are considered long-term strategicinvestments. In accordance with the <strong>University</strong>’s policies, no specific hedgingactivities are undertaken in relation to these investments. The investments arecontinuously monitored and voting rights arising from these equity instruments areutilized in the <strong>University</strong>’s favor.
- 34 -22. CATEGORIES AND FAIR VALUES OF FINANCIAL ASSETS ANDLIABILITIESThe carrying amounts and fair values of the categories of financial assets andliabilities presented in the balance sheets are shown below.2009 2008Carrying Fair Carrying FairNotes Values Values Values ValuesFinancial assetsLoans and receivables:Cash and cash equivalents 4 P 1,180,261,852 P 1,180,261,852 P 1,224,663,998 P1,224,663,998Receivables 5 133,310,657 133,310,657 111,845,027 111,845,027Due from a related party 100,000,000 100,000,000 100,000,000 100,000,0001,413,572,509 1,413,572,509 1,436,509,025 1,436,509,025AFS investments: 6Debt securities 1,053,371,205 1,053,371,205 815,585,043 815,585,043Equity securities 19,738,752 19,738,752 25,102,359 25,102,3591,073,109,957 1,073,109,957 840,687,402 840,687,402HTM investments –Debt securities 20,000,000 20,000,000 32,071,040 32,071,040P2,506,682,466 P2,506,682,466 P 2,309,267,467 P2,309,267,467Financial liabilitiesFinancial liabilities at amortized cost –Accounts payable andother liabilities 10 P 380,536,852 P 380,536,852 P 430,264,990 P 430,264,990See Notes 2.4 and 2.7 for a description of the accounting policies for each categoryof financial instruments. A description of the <strong>University</strong>’s risk managementobjectives and policies for financial instruments is provided in Note 21.23. CAPITAL MANAGEMENT OBJECTIVES, POLICIES ANDPROCEDURESThe <strong>University</strong> aims to provide returns on equity to shareholders while managingoperational and strategic objectives. The <strong>University</strong> manages its capital structure andmakes adjustments to it, in the light of changes in economic conditions. To maintainor adjust capital structure, the <strong>University</strong> may adjust the dividend payment toshareholders, return capital to shareholders or issue new shares.The <strong>University</strong> defines capital as paid-in capital stock and retained earnings, bothappropriated and unappropriated. Other components of equity such as treasury stockand revaluation reserves are excluded from capital for purposes of capitalmanagement. The BOT has overall responsibility for monitoring of capital inproportion to risks. Profiles for capital ratios are set in the light of changes in the<strong>University</strong>’s external environment and the risks underlying the <strong>University</strong>’s business,operation and industry.
- 35 -The <strong>University</strong> monitors capital on the basis of debt-to-equity ratio, which iscalculated as total debt divided by total equity. Capital for the reporting periodMarch 31, 2009 and 2008 under review is summarized as follows:2009 2008Total debt P 558,143,441 P 572,074,759Total equity 2,902,488,102 2,587,759,201Debt-to-equity ratio 0.19 : 1.00 0.22 : 1.00The <strong>University</strong> is not subject to any externally-imposed capital requirements.There was no change in the <strong>University</strong>’s approach to capital management during theyear.
FAR EASTERN UNIVERSITY, INC. AND SUBSIDIARIESCONSOLIDATED BALANCE SHEETMARCH 31, 2009(With Comparative Figures for 2008)(Amounts in <strong>Philippine</strong> Pesos)2008(As restated -Notes 2009 see Note 19)A S S E T SCURRENT ASSETSCash and cash equivalents 4 P 1,231,350,003 P 1,283,504,611Receivables - net 5 138,151,928 113,434,183Available-for-sale investments 6 1,088,109,957 840,687,402Held-to-maturity investments 20,000,000 -Real estate held for sale 7 189,052,542 189,052,542Other current assets 32,186,523 58,405,219Total Current Assets 2,698,850,953 2,485,083,957NON-CURRENT ASSETSHeld-to-maturity investments - 32,071,040Investments in an associate 8 7,055,963 7,105,379Investment property - net 9 364,903,545 363,737,216Property and equipment - net 10 783,637,710 660,984,778Deferred tax assets <strong>17</strong> 9,228,791 11,357,319Other non-current assets 26,151,492 <strong>17</strong>,816,657Total Non-current Assets 1,190,977,501 1,093,072,389TOTAL ASSETS P 3,889,828,454 P 3,578,156,346LIABILITIES AND EQUITYCURRENT LIABILITIESAccounts payable and other liabilities 11 P 349,657,377 P 420,350,624Deferred income 13 76,555,105 24,287,583Income tax payable 48,721,315 54,676,608Notes payable 10 3,103,359 1,895,782Total Current Liabilities 478,037,156 501,210,597NON-CURRENT LIABILITIESTrust funds 12 58,490,641 76,162,222Notes payable 10 10,327,238 -Deferred tax liabilities <strong>17</strong> 13,<strong>17</strong>0,629 12,1<strong>17</strong>,687Total Non-current Liabilities 81,988,508 88,279,909Total Liabilities 560,025,664 589,490,506Forward
- 2 -Notes 2009 2008EQUITYEquity attributable to equity holders of FEUCapital stock 19 984,577,900 704,369,900Treasury stock 19 ( 3,733,100 ) ( 3,733,100 )Accumulated fair value gains (losses) 6 ( 9,533,437 )1,233,243Retained earnings 19Appropriated 975,099,0<strong>17</strong> 1,147,161,414Unappropriated 1,068,447,399 843,661,207Total equity attributable toequity holders of FEU 3,014,857,779 2,692,692,664Minority interest 314,945,011 295,973,<strong>17</strong>6Total Equity 3,329,802,790 2,988,665,840TOTAL LIABILITIES AND EQUITY P 3,889,828,454 P 3,578,156,346See Notes to Consolidated Financial Statements.
FAR EASTERN UNIVERSITY, INC. AND SUBSIDIARIESCONSOLIDATED INCOME STATEMENTFOR THE YEAR ENDED MARCH 31, 2009(With Comparative Figures for 2008 and 2007)(Amounts in <strong>Philippine</strong> Pesos)2008 2007(As restated - (As restated -Notes 2009 see Note 19) see Note 19)REVENUESEducational incomeTuition fees - net 13 P 1,611,808,467 P 1,580,683,033 P 1,565,968,902Miscellaneous 50,280,810 33,146,510 30,085,6661,662,089,277 1,613,829,543 1,596,054,568Rentals 9 50,437,726 41,289,534 47,795,0<strong>17</strong>1,712,527,003 1,655,119,077 1,643,849,585OPERATING EXPENSES 14 1,148,587,556 1,059,786,062 1,0<strong>17</strong>,528,871OPERATING INCOME 563,939,447 595,333,015 626,320,714OTHER INCOME (CHARGES)Finance income 15 120,856,838 106,418,765 111,293,760Finance costs 5 ( <strong>17</strong>,581,639 ) ( 22,882,403 ) ( 16,390,810 )Equity in net losses of an associate 8 ( 49,416 ) ( 24,732 ) (36,104 )Miscellaneous 5 25,124,699 22,508,767 ( 10,784,558 )128,350,482 106,020,397 84,082,288INCOME BEFORE TAX 692,289,929 701,353,412 710,403,002PREACQUISITION INCOME 1 3,999,262 - -INCOME BEFORE TAX 696,289,191 701,353,412 710,403,002TAX EXPENSE <strong>17</strong> 86,995,739 87,546,984 82,332,451NET INCOME P 609,293,452 P 613,806,428 P 628,070,551Attributable to:Equity holders of FEU P 585,200,755 P 600,693,262 P 612,666,167Minority interest 24,092,697 13,113,166 15,404,384P 609,293,452 P 613,806,428 P 628,070,551Earnings Per Share 20 P 69.61 P 85.74 P 104.93See Notes to Consolidated Financial Statements.
FAR EASTERN UNIVERSITY, INC. AND SUBSIDIARIESCONSOLIDATED STATEMENT OF CHANGES IN EQUITYFOR THE YEAR ENDED MARCH 31, 2009(With Comparative Figures for 2008 and 2007)(Amounts in <strong>Philippine</strong> Pesos)2008 2007(As restated - (As restated -Notes 2009 see Note 19) see Note 19)EQUITY ATTRIBUTABLE TO EQUITYHOLDERS OF FEUCAPITAL STOCK 19Balance at beginning of year P 704,369,900 P 704,369,900 P 470,847,300Issuance during the year 280,208,000 - 233,522,600Balance at end of year 984,577,900 704,369,900 704,369,900TREASURY STOCK - at cost 19 ( 3,733,100 ) ( 3,733,100 ) ( 3,733,100 )ACCUMULATED FAIR VALUE GAINS (LOSSES) 6Balance at beginning of year 1,233,243 5,571,316 ( 5,401,450 )Fair value gains (losses) ( 8,016,082 )1,<strong>17</strong>6,093 5,404,436Cumulative net fair value loss (gain)reclassified to profit and loss during the year ( 2,750,599 ) ( 5,514,166 )5,568,330Balance at end of year ( 9,533,437 )1,233,243 5,571,316RETAINED EARNINGS 19AppropriatedBalance at beginning of year 1,147,161,414 697,161,414 697,161,414Appropriations for the year - 450,000,000 -Reversal of appropriations ( <strong>17</strong>2,062,397 )- -Balance at end of year 975,099,0<strong>17</strong> 1,147,161,414 697,161,414UnappropriatedBalance at beginning of yearAs previously reported 873,954,674 1,028,997,472 825,051,055Prior period adjustments ( 30,293,467 ) ( 20,742,967 ) ( 20,742,967 )As restated 843,661,207 1,008,254,505 804,308,088Net income 585,200,755 600,693,262 612,666,167Cash dividends ( 252,268,960 ) ( 315,286,560 ) ( <strong>17</strong>5,197,150 )<strong>Stock</strong> dividends ( 280,208,000 )- ( 233,522,600 )Reversal of appropriations <strong>17</strong>2,062,397 - -Appropriations for the year - ( 450,000,000 )-Balance at end of year 1,068,447,399 843,661,207 1,008,254,505Total Retained Earnings 2,043,546,416 1,990,822,621 1,705,415,919Total Equity Attributable to EquityHolders of FEU 3,014,857,779 2,692,692,664 2,411,624,035MINORITY INTERESTBalance at beginning of year 295,973,<strong>17</strong>6 282,860,010 267,455,626Decrease in minority interest ( 5,120,862 )- -Share in net income 24,092,697 13,113,166 15,404,384Balance at end of year 314,945,011 295,973,<strong>17</strong>6 282,860,010TOTAL EQUITY P 3,329,802,790 P 2,988,665,840 P 2,694,484,045Net Gains (Losses) Recognized Directly in Equity 6 ( P 8,016,082 ) P 1,<strong>17</strong>6,093 P 5,404,436See Notes to Consolidated Financial Statements.
FAR EASTERN UNIVERSITY, INC. AND SUBSIDIARIESCONSOLIDATED CASH FLOW STATEMENTFOR THE YEAR ENDED MARCH 31, 2009(With Comparative Figures for 2008 and 2007)(Amounts in <strong>Philippine</strong> Pesos)2008 2007(As restated - (As restated -Notes 2009 see Note 19) see Note 19)CASH FLOWS FROM OPERATING ACTIVITIESIncome before income tax P 696,289,191 P 701,353,412 P 710,403,002Adjustments for:Interest income 15 ( 1<strong>17</strong>,819,106 ) ( 106,418,765 ) ( 111,293,760 )Depreciation 14 52,944,002 46,899,496 46,809,097Impairment loss on receivables 5 <strong>17</strong>,581,234 <strong>17</strong>,450,897 12,686,351Preacquisition income 1 ( 3,999,262 )- -Unrealized foreign exchange gains (losses) ( 3,037,732 )4,747,861 3,704,460Gain on disposal of property and equipment ( 726,424 )- ( 102,083 )Equity in net losses of associates 8 49,416 24,732 36,104Loss on sale of investment - 2,842,069 20,865,189Operating income before working capital changes 641,281,319 666,899,702 683,108,360Decrease (increase) in receivables ( 33,857,347 ) ( 20,511,779 )8,795,259Increase in real estate held for sale - ( 232,386 ) ( 7,264,452 )Decrease (increase) in other current assets 23,373,830 ( 27,603,716 ) ( 12,114,581 )Increase (decrease ) in accounts payableand other liabilities ( 13,086,542 )51,897,736 28,956,845Increase (decrease) in deferred income 52,267,522 16,722,873 ( 844,082 )Increase (decrease) in trust funds ( <strong>17</strong>,671,581 ) ( 25,109,062 )18,958,605Cash generated from operations 652,307,201 662,063,368 719,595,954Income taxes paid ( 86,924,696 ) ( 78,126,826 ) ( 74,422,131 )Net cash provided by operating activities 565,382,505 583,936,542 645,<strong>17</strong>3,823CASH FLOWS FROM INVESTING ACTIVITIESIncrease in available-for-sale investments - net 6 ( 258,189,235 ) ( 13,871,477 ) ( 433,489,139 )Acquisitions of property and equipment 10 ( 147,865,322 ) ( 48,697,844 ) ( <strong>17</strong>,685,700 )Interest received 109,929,197 87,525,308 87,387,246Acquisitions of investment property 9 ( 15,723,242 ) ( 96,147,971 ) ( 16,134,359 )Decrease (increase) in held-to-maturity investments 12,071,040 257,510 ( 19,703,753 )Decrease (increase) in other non-current assets ( 8,334,835 ) ( 2,160,606 )14,464,962Additional investment in a subsidiary ( 1,121,600 )- -Proceeds from disposal of property and equipment 726,424 - <strong>17</strong>5,000Net Cash Used in Investing Activities ( 308,507,573 ) ( 73,095,080 ) ( 384,985,743 )CASH FLOWS FROM FINANCING ACTIVITIESDividends paid 19 ( 309,875,665 ) ( 194,554,457 ) ( <strong>17</strong>1,265,921 )Payment of notes payable 10 ( 2,191,607 ) ( 1,753,954 ) ( 1,333,557 )Net Cash Used in Financing Activities ( 312,067,272 ) ( 196,308,411 ) ( <strong>17</strong>2,599,478 )Effect of <strong>Exchange</strong> Rate Changeson Cash and Cash Equivalents 3,037,732 ( 6,607,781 ) ( 3,703,946 )NET INCREASE (DECREASE) INCASH AND CASH EQUIVALENTS ( 52,154,608 )307,925,270 83,884,656CASH AND CASH EQUIVALENTSAT BEGINNING OF YEAR 1,283,504,611 975,579,341 891,694,685CASH AND CASH EQUIVALENTSAT END OF YEAR P 1,231,350,003 P 1,283,504,611 P 975,579,341Supplemental information on noncash investing and financing activities:1) The <strong>University</strong> declared and issued stock dividends amounting to P280.2 million in 2009 and P233.5 million in 2007 (see Note 19.2).2) In 2009, 2008 and 2007, the <strong>University</strong> declared cash dividends totaling P252.3 million, P315.3 million and P<strong>17</strong>5.2 million, respectively, of whichP24.6 million and P119.5 million remained unpaid as of March 31, 2009 and 2008, respectively (see Notes 11 and 19).3) In September 2008, a subsidiary acquired a condominium unit by applying P6.7 million advance payments made to the developer and issuing apromissory note for P13.4 million for the remaining cost of the unit (see Note 10).See Notes to Consolidated Financial Statements.
FAR EASTERN UNIVERSITY, INC. AND SUBSIDIARIESNOTES TO CONSOLIDATED FINANCIAL STATEMENTSMARCH 31, 2009(With Comparative Figures for 2008 and 2007)(Amounts in <strong>Philippine</strong> Pesos)1. CORPORATE INFORMATION<strong>Far</strong> <strong>Eastern</strong> <strong>University</strong>, Inc. (the <strong>University</strong> or parent company) is a domesticeducational institution founded in June of 1928 and incorporated on January 5, 1933.The <strong>University</strong> is a private, non-sectarian institution of learning comprising thefollowing different institutes that offer specific courses, namely, Institute of Arts andSciences; Institute of Accounts, Business and Finance; Institute of Education;Institute of Architecture and Fine Arts; Institute of Nursing; Institute of Engineering;Institute of Law; and Institute of Graduate Studies.The <strong>University</strong> became a listed corporation in the <strong>Philippine</strong> <strong>Stock</strong> <strong>Exchange</strong> onJuly 11, 1986.As of March 31, 2009, 2008 and 2007, the <strong>University</strong> holds interest in the followingsubsidiaries and associate which were all incorporated and operating in the<strong>Philippine</strong>s:Percentage of OwnershipCompany Name 2009 2008 2007Subsidiaries:East Asia ComputerCenter, Inc. (EACCI) 100% 100% 100%<strong>Far</strong> <strong>Eastern</strong> College-Silang,Inc. (FECSI) 100% - -Fern Realty Corporation (FRC) 37.52% 36.73% 36.73%Associate –Juliana Management Co.,Inc. (JMCI) 49% 49% 49%FECSI was incorporated on January 21, 2009 but has not yet started commercialoperations as of March 31, 2009. FECSI and EACCI, similar to the <strong>University</strong>, werealso established to operate as educational institutions. FRC, on the other hand,operates as a real estate company leasing most of its investment properties to the<strong>University</strong> and other related parties. The parent company and the subsidiaries arecollectively referred to as the Group.As of March 31, 2009 and 2008, the Group has only one significant segment asrevenues generated from the real estate transactions of FRC represent only about 2%to 3% of the total revenues of the Group; hence no segment information anddisclosures are presented in the Group’s financial statements.
- 2 -Although the <strong>University</strong> controls less than 50% of the voting shares of stock of FRC,it has the power to govern the financial and operating policies of the said entity. Also,the <strong>University</strong> has the power to cast the majority of votes at meetings of the board ofdirectors and elect officers of FRC. Accordingly, FRC is recognized as a subsidiary ofthe <strong>University</strong>.The registered office address and principal place of business of the <strong>University</strong> islocated at Nicanor Reyes Sr. Street, Sampaloc, Manila.The consolidated financial statements of the Group for the year endedMarch 31, 2009 (including the comparatives as restated for the years endedMarch 31, 2008 and 2007) were authorized for issue by the Board of Trustees (BOT)on June 19, 2009.2. SUMMARY OF SIGNIFICANT ACCOUNTING POLICIESThe significant accounting policies that have been used in the preparation of theseconsolidated financial statements are summarized below. These policies have beenconsistently applied to all the years presented, unless otherwise stated.2.1 Basis of Preparation of Financial Statementsa. Statement of Compliance with <strong>Philippine</strong> Financial Reporting StandardsThe consolidated financial statements of the Group have been prepared inaccordance with <strong>Philippine</strong> Financial Reporting Standards (PFRS). PFRS areadopted by the Financial Reporting Standards Council (FRSC) from thepronouncements issued by the International Accounting Standards Board.The consolidated financial statements have been prepared using themeasurement bases specified by PFRS for each type of asset, liability, incomeand expense. These financial statements have been prepared on the historicalcost basis, except for the revaluation of certain financial assets. Themeasurement bases are more fully described in the accounting policies thatfollow.b. Functional CurrencyThese consolidated financial statements are presented in <strong>Philippine</strong> pesos, theGroup’s functional currency, and all values represent absolute amounts exceptwhen otherwise indicated. Functional currency is the currency of the primaryeconomic environment in which the entity operates. Items included in theconsolidated financial statements of the Group are measured using its functionalcurrency.c. Reclassification of Certain AccountsCertain accounts in the 2008 and 2007 consolidated financial statements havebeen reclassified to conform with the 2009 presentation and classification.
- 3 -2.2 Impact of New Amendments and Interpretations to Existing Standards(a)Effective in fiscal year 2009 that are relevant to the GroupOf the amendments and interpretations that are effective for the fiscal year2009, only PAS 39 and PFRS 7 (Amendments), PAS 39, Financial Instruments:Recognition and Measurements and PFRS 7, Financial Instruments: Disclosures (effectivefrom July 1, 2008), are relevant to the Group. The amendments permit anentity to:(i)(ii)Reclassify non-derivative financial assets (other than those designated atfair value through profit or loss by the entity upon initial recognition) outof fair value through profit or loss category in particular circumstances;and,Transfer from the available for sale category to the loans and receivablecategory those financial assets that would have met the definition of loansand receivables, provided that the entity has the intention and the abilityto hold those financial assets for the foreseeable future.The amendments are applicable in a partially retrospective manner up toJuly 1, 2008 provided that the reclassification was made on or beforeNovember 15, 2008, the cut-off date set by the FRSC. After the cut-off date, allreclassifications will only take effect prospectively. As the Group did notexercise the option to reclassify its financial assets, the adoption of theseamendments has no impact on its 2009 consolidated financial statements.(b)Effective in fiscal year 2009 but not relevant to the Group<strong>Philippine</strong> InterpretationIFRIC 11 : PFRS 2 – Group and Treasury ShareTransactions<strong>Philippine</strong> InterpretationIFRIC 12 : Service Concession Agreements<strong>Philippine</strong> InterpretationIFRIC 14 : PAS 19 – The Limit on a DefinedBenefit Asset, Minimum FundingRequirements and their Interaction(c) Effective subsequent to fiscal year 2009There are new and amended standards and <strong>Philippine</strong> Interpretations that areeffective beginning on or after January 1, 2009 but not required to be adoptedby the Group until after fiscal year 2009. Of those new standards, the followingare relevant to the Group and which it will apply in accordance with theirtransitional provisions.PAS 1 (Revised 2007) : Presentation of Financial StatementsPAS 23 (Revised 2007) : Borrowing CostsPAS 27 (Amendments) : Consolidated and Separate FinancialStatementsPFRS 3 (Revised) : Business CombinationsPFRS 8 : Operating Segments
- 4 -<strong>Philippine</strong> InterpretationIFRIC 15 : Agreements for the Constructionof Real Estate<strong>Philippine</strong> InterpretationIFRIC <strong>17</strong> : Distribution of Non-cash Assets toOwnersVarious Standards : 2008 Annual Improvements to PFRSBelow is a discussion of the possible impact of these accounting standards onthe Group’s financial statements.(i)PAS 1 (Revised 2007), Presentation of Financial Statements (effective fromJanuary 1, 2009). The amendment requires an entity to present all items ofincome and expense recognized in the period in a single statement ofcomprehensive income or in two statements: a separate income statementand a statement of comprehensive income. The income statement shalldisclose income and expense recognized in profit and loss in the same wayas the current version of PAS 1. The statement of comprehensive incomeshall disclose profit or loss for the period, plus each component of incomeand expense recognized outside of profit and loss classified by nature(e.g., gains or losses on available-for-sale assets or translation differencesrelated to foreign operations). Changes in equity arising from transactionswith owners are excluded from the statement of comprehensive income(e.g., dividends and capital increase). An entity would also be required toinclude in its set of financial statements a statement showing its financialposition (or balance sheet) at the beginning of the previous period whenthe entity retrospectively applies an accounting policy or makes aretrospective restatement. The Group will apply PAS 1 (Revised 2007) inits 2010 consolidated financial statements.(ii) PAS 23 (Revised 2007), Borrowing Costs (effective from January 1, 2009).Under the revised PAS 23, all borrowing costs that are directly attributableto the acquisition, construction or production of a qualifying asset shall becapitalized as part of the cost of that asset. The option of immediatelyexpensing borrowing costs that qualify for asset recognition has beenremoved. The Group has initially determined that adoption of this newstandard will not have significant effects on the financial statements for2010, as well as for prior and future periods, as the Group’s currentaccounting policy is to capitalize all interest directly related to qualifyingassets.(iii) PAS 27 (Amendment), Consolidated and Separate Financial Statements(effective from July 1, 2009). The amendment mainly relates to changes inthe accounting for non-controlling interest and the loss of control of asubsidiary. The amendment to standard is not expected to havesignificant impact on the consolidated financial statements.
- 5 -(iv) PFRS 3 (Revised 2007), Business Combinations (effective from July 1, 2009).The revised standard includes in its scope business combinationsinvolving only mutual entities, and those in which separate entities orbusinesses are brought together to form a reporting entity by contractalone. All business combinations are accounted for by applying theacquisition method (referred to previously as the purchase method). Theadoption of this revised standard is not expected to have significantimpact on the consolidated financial statements.(v)PFRS 8, Operating Segments. Under this new standard, a reportableoperating segment is identified based on the information about thecomponents of the entity that management uses to make decisions aboutoperating matters. In addition, segment assets, liabilities and performance,as well as certain disclosures, are to be measured and presented based onthe internal reports prepared for and reviewed by the chief decisionmakers. The adoption of this new standard will not have a materialimpact on the Group’s financial statements, as currently, the Group hasonly one significant segment.(vi) <strong>Philippine</strong> Interpretation IFRIC 15, Agreements for the Construction of RealEstate (effective from January 1, 2012). This Interpretation providesguidance on how to determine whether an agreement for the constructionof real estate is within the scope of PAS 11, Construction Contracts, orPAS 18, Revenue, and accordingly, when revenue from construction shouldbe recognized. It is likely to result in PAS 18 being applied to a widerrange of transactions. IFRIC 15 is not expected to have a significanteffect on the Group’s operations as all real estate transactions areaccounted for under PAS 18 or PAS 11.(vii) <strong>Philippine</strong> Interpretation IFRIC <strong>17</strong>, Distribution of Non-cash Assets to Owners(effective from July 1, 2009). IFRIC <strong>17</strong> clarifies that a dividend payableshould be recognized when the dividend is appropriately authorized and isno longer at the discretion of the entity. Also, an entity should measurethe dividend payable at the fair value of the net assets to be distributedand the difference between the dividend paid and the carrying amount ofthe net assets distributed in profit or loss. The Group will apply thestandard prospectively starting April 1, 2010.(viii) 2008 Annual Improvements to PFRS. The FRSC has adopted theImprovements to International Financial Reporting Standards 2008. Theseamendments become effective in the <strong>Philippine</strong>s in annual periodsbeginning on or after January 1, 2009. The Group expects theamendments to the following standards to be relevant to the Group’saccounting policies:
- 6 -• PAS 16 (Amendment), Property, Plant and Equipment and consequentialamendment to PAS 7, Statement of Cash Flows. The amendmentclarifies that an entity in the course of ordinary activities, sellsproperty, plant and equipment that was held for rental transfers theproperty, plant and equipment to inventories at carrying amount whenthey ceased to be rented and are held for sale. A consequentialamendment to PAS 7 states that cash flows arising from purchase,rental and sale of those assets are classified as cash flows fromoperating activities. Also, the term “net selling price” has beenreplaced with “fair value less cost to sell” in the definition ofrecoverable amount so as to achieve consistency with the terminologyused in PFRS 5. The amendment is not expected to have a significantimpact on the Group’s consolidated financial statements.• PAS 23 (Amendment), Borrowing Costs. The amendment clarifies thedefinition of borrowing costs to include interest expense determinedusing the effective interest method under PAS 39. This amendmentwill be applied by the Group in 2010; however, management expectsits effect to be insignificant.• PAS 39 (Amendment), Financial Instruments: Recognition and Measurement.The definition of financial asset or financial liability at fair valuethrough profit or loss as it relates to items that are held for trading waschanged. A financial asset or liability that is part of a portfolio offinancial instruments managed together with evidence of an actualrecent pattern of short-term profit taking is included in such aportfolio on initial recognition. The Group initially determined thatadoption of this amendment will not have a material effect on its 2009consolidated financial statements.• PAS 40 (Amendment), Investment Property. PAS 40 is amended toinclude property under construction or development for future use asinvestment property in its definition of investment property. Thisresults in such property being within the scope of PAS 40; previously,it was within the scope of PAS 16. Also, if an entity’s policy is tomeasure investment property at fair value, but during construction ordevelopment of an investment property the entity is unable to reliablymeasure its fair value, then the entity would be permitted to measurethe investment property at cost until construction or development iscomplete. At such time, the entity would be able to measure theinvestment property at fair value.Minor amendments are made to several other standards; however, thoseamendments are not also expected to have a material impact on the Group’sconsolidated financial statements.
- 7 -2.3 Consolidation and Investment in an AssociateThe consolidated financial statements comprise the financial statements of the<strong>University</strong> and its subsidiaries as of March 31, 2009 and 2008 and for each of thethree years in the period ended March 31, 2009. The financial statements ofsubsidiaries are prepared for the same reporting year, except for EACCI whose fiscalyear ends at April 30, as the <strong>University</strong> using consistent accounting policies. Amountsreported in the financial statements of subsidiaries and associate have been adjustedwhere necessary to ensure consistency with the accounting policies adopted by theGroup.All intercompany balances and transactions with subsidiaries, including unrealizedgains and losses arising from intercompany transactions, have been eliminated in fullin consolidation. Intercompany losses, if any, that indicate impairment are recognizedin the consolidated financial statements.The Group accounts for its investments in subsidiaries, associate and minority interestas follows:(a) Investments in SubsidiariesSubsidiaries are all entities over which the <strong>University</strong> has the power to control thefinancial and operating policies. The <strong>University</strong> obtains and exercises controlthrough voting rights.Subsidiaries are consolidated from the date the <strong>University</strong> obtains control untilsuch time that such control ceases.Acquired subsidiaries are subject to application of the purchase method foracquisitions. This involves the revaluation at fair value of all identifiable assetsand liabilities, including contingent liabilities of the subsidiary, at the acquisitiondate, regardless of whether or not they were recorded in the financial statementsof the subsidiary prior to acquisition. On initial recognition, the assets andliabilities of the subsidiary are included in the consolidated balance sheet at theirrevalued amounts, which are also used as the bases for subsequent measurementin accordance with the Group’s accounting policies.Goodwill represents the excess of the cost of an acquisition of a subsidiary orassociate over the fair value of the Group’s share of the net identifiable assets ofthe acquired subsidiary or associate at the date of acquisition. Goodwill onacquisitions of subsidiaries is presented under Other Noncurrent Assets in theconsolidated balance sheet. Goodwill on acquisitions of associates is included inthe carrying value of investments in associates. Goodwill is tested annually forimpairment (see Note 2.13). Gains and losses on the disposal of an entity includethe carrying amount of goodwill relating to the entity sold.(b) Investment in an AssociateAssociate is an entity over which the Group is able to exercise significantinfluence but which is neither a subsidiary nor interest in a joint venture.Investments in associate is initially recognized at cost and subsequently accountedfor using the equity method.
- 8 -Acquired investment in associate is also subject to purchase accounting.However, any goodwill or fair value adjustment attributable to the share in theassociate is included in the amount recognized as investment in associate. Allsubsequent changes to the share in the equity of the associate are recognized inthe carrying amount of the Group’s investment. Changes resulting from theprofit or loss generated by the associate are reported within Equity in Net Lossesof an Associate in the Group’s consolidated income statements and thereforeaffect the net results of operations of the Group.In computing the Group’s share in net earnings or losses of its associate,unrealized gains or losses on transactions between the Group and its associate areeliminated to the extent of the Group’s interest in the associate. Where unrealizedlosses are eliminated, the underlying asset is also tested for impairment from agroup perspective.(c) Transactions with Minority InterestsThe Group applies a policy of treating transactions with minority interests astransactions with parties external to the Group. Disposals of shares to minorityinterests result in gains and losses for the Group that are recorded in theconsolidated income statement. Purchases of shares from minority interests resultin goodwill, being the difference between any consideration paid and the relevantshare acquired of the carrying value of net assets of the subsidiary.2.4 Financial AssetsFinancial assets include cash and other financial instruments. Financial assets, otherthan hedging instruments, are classified into the following categories: financial assetsat fair value through profit or loss, loans and receivables, held-to-maturity investmentsand available-for-sale financial assets. Financial assets are assigned to the differentcategories by management on initial recognition, depending on the purpose for whichthe investments were acquired. The designation of financial assets is re-evaluated atevery reporting date at which date a choice of classification or accounting treatment isavailable, subject to compliance with specific provisions of applicable accountingstandards.Regular purchase and sales of financial assets are recognized on their trade date. Allfinancial assets that are not classified as at fair value through profit or loss are initiallyrecognized at fair value, plus transaction costs. Financial assets carried at fair valuethrough profit or loss are initially recognized at fair value and transaction costs areexpensed in the consolidated income statement.Currently, the Group’s financial instruments are categorized as follows:(a)Loans and ReceivablesLoans and receivables are non-derivative financial assets with fixed ordeterminable payments that are not quoted in an active market. They arisewhen the Group provides money, goods or services directly to a debtor with nointention of trading the receivables. They are included in current assets, exceptfor maturities greater than 12 months after the balance sheet date which areclassified as non-current assets.
- 9 -Loans and receivables are subsequently measured at amortized cost using theeffective interest method, less any impairment losses. Any change in their valueis recognized in profit or loss. Impairment loss is provided when there isobjective evidence that the Group will not be able to collect all amounts due toit in accordance with the original terms of the receivables. The amount of theimpairment loss is determined as the difference between the assets’ carryingamount and the present value of estimated cash flows.The Group’s financial assets categorized as loans and receivables are presentedas Cash and Cash Equivalents and Receivables in the consolidated balancesheet.Cash and cash equivalents are defined as cash on hand, demand deposits andshort-term, highly liquid investments readily convertible to known amounts ofcash and which are subject to insignificant risk of changes in value.(b)Held-to-maturity InvestmentsThis includes non-derivative financial assets with fixed or determinablepayments and a fixed date of maturity. Investments are classified as held-tomaturity if the Group has the positive intention and ability to hold them untilmaturity which is presented as Held-to-maturity Investments in the non-currentsection of the consolidated balance sheet, except those maturing within 12months of the balance sheet date. Investments intended to be held for anundefined period are not included in this classification.Held-to-maturity investments are measured at amortized cost using the effectiveinterest method. In addition, if there is objective evidence that the investmenthas been impaired, the financial asset is measured at the present value ofestimated cash flows. Any changes to the carrying amount of the investmentare recognized in profit or loss.(c)Available-for-sale Financial AssetsThis include non-derivative financial assets that are either designated to thiscategory or do not qualify for inclusion in any of the other categories offinancial assets. These are presented as Available-for-sale Investments in thenon-current section of the consolidated balance sheet unless managementintends to dispose of the investment within 12 months from the balance sheetdate.All financial assets within this category are subsequently measured at fair value,unless otherwise disclosed, with changes in value recognized in equity, net ofany effects arising from income taxes. Gains and losses arising from securitiesclassified as available-for-sale are recognized in the income statement when theyare sold or when the investment is impaired.
- 10 -In the case of impairment, the cumulative loss previously recognized directly inequity is transferred to the consolidated income statement. If circumstanceschange, impairment losses on available-for-sale equity instruments are notreversed through the income statement. On the other hand, if in a subsequentperiod the fair value of a debt instrument classified as available-for-sale increasesand the increase can be objectively related to an event occurring after theimpairment loss was recognized in income statement, the impairment loss isreversed through the income statement.Impairment losses recognized on financial assets are presented as part of FinanceCosts in the consolidated income statement.For investments that are actively traded in organized financial markets, fair value isdetermined by reference to stock exchange-quoted market bid prices at the close ofbusiness on the balance sheet date. For investments where there is no quoted marketprice, fair value is determined by reference to the current market value of anotherinstrument which is substantially the same or is calculated based on the expected cashflows (such as dividend income) of the underlying net asset base of the investment.Non-compounding interest, dividend income and other cash flows resulting fromholding financial assets are recognized in profit or loss when earned, regardless ofhow the related carrying amount of financial assets is measured. All income andexpense relating to financial assets recognized in profit or loss are presented in theconsolidated income statement line item Finance Income and Finance Costs,respectively.Derecognition of financial assets occurs when the rights to receive cash flows fromthe financial instruments expire or are transferred and substantially all of the risks andrewards of ownership have been transferred.2.5 Real Estate Held for SaleAcquisition costs of raw land intended for future development, including other costsand expenses incurred to effect the transfer of title of the property as well as relatedproperty development costs are accumulated in this account.Real estate held for sale is carried at the lower of cost and net realizable value. Netrealizable value is the estimated selling price in the ordinary course of business, lessestimated costs to complete and the estimated costs necessary to make the sale.Real estate held for sale is expected to be sold within 2 to 10 years from the time ofacquisition and development, which is considered as the normal operating cycle of theGroup with respect to its development and sale of real estate properties.2.6 Property and EquipmentExcept for land, which is stated at cost less any impairment in value, property andequipment are stated at cost less accumulated depreciation and amortization, andimpairment in value, if any.
- 11 -The cost of an asset comprises its purchase price and directly attributable costs ofbringing the asset to working condition for its intended use. Expenditures foradditions, major improvements and renewals are capitalized; expenditures for repairsand maintenance are charged to expense as incurred. When assets are sold, retired orotherwise disposed of, their cost and related accumulated depreciation andimpairment losses are removed from the accounts and any resulting gain or loss isreflected in income for the period.Depreciation is computed on the straight-line basis over the estimated useful lives ofthe assets as follows:Building and improvementsLeasehold improvementsFurniture and equipmentMiscellaneous eqipment20 years20 years3-6 years5 yearsLeasehold improvements are amortized over 20 years regardless of the term of leasecontract which is usually shorter than the expected useful life of the improvementsbecause it is highly probable that the lease contract with FRC will be renewed beforethe end of such contract.Construction in progress represents a condominium unit acquired from a developerand is still under construction is stated at cost. This represents the cost of acquisitionincluding applicable finance cost and other direct costs. The account is notdepreciated until such time that the assets are completed and available for use.An asset’s carrying amount is written down immediately to its recoverableamount if the asset’s carrying amount is greater than its estimated recoverable amount(see Note 2.13).The residual values and estimated useful lives of property and equipment arereviewed, and adjusted if appropriate, at each balance sheet date.An item of property and equipment is derecognized upon disposal or when no futureeconomic benefits are expected to arise from the continued use of the asset. Any gainor loss arising on derecognition of the asset (calculated as the difference between thenet disposal proceeds and the carrying amount of the item) is included in theconsolidated income statement in the year the item is derecognized.2.7 Investment PropertyInvestment property is measured initially at acquisition cost. Subsequently,investment property, except land which is carried at cost less impairment in value, ifany, is carried at cost less accumulated depreciation and any impairment in value.Depreciation is computed on a straight line basis over the estimated useful lives of theassets as follows:Buildings and improvementsLand improvements20 to 50 years5 years
- 12 -An investment property’s carrying amount is written down immediately to itsrecoverable amount if the property’s carrying amount is greater than its estimatedrecoverable amount (see Note 2.13).Investment property is derecognized upon disposal or when permanently withdrawnfrom use and no future economic benefit is expected from its disposal. Any gain orloss on the retirement or disposal of an investment property is recognized in theconsolidated income statement in the year of retirement or disposal.Transfer are made to investment property when, and only when, there is a change inuse, evidence by the end of owner-occupation, commencement of an operating leaseto another party or by the end of construction or development. Transfers are madefrom investment property when and only when, there is a change in use, evidenced bycommencement of the owner-occupation or commencement of development with aview to sell.2.8 Financial LiabilitiesFinancial liabilities include accounts payable and other liabilities and notes payable,which are measured at amortized cost using the effective interest rate method.Financial liabilities are recognized when the Group becomes a party to the contractualagreements of the instrument. All interest related charges are recognized as anexpense in the consolidated income statement under the caption Finance Costs.The liabilities are initially recognized at their fair value and subsequently measured atamortized cost less settlement payments.Financial liabilities are derecognized from the balance sheet only when the obligationsare extinguished either through discharge, cancellation or expiration.2.9 ProvisionsProvisions are recognized when present obligations will probably lead to an outflowof economic resources and they can be estimated reliably even if the timing or amountof the outflow may still be uncertain. A present obligation arises from the presence ofa legal or constructive commitment that has resulted from past events.Provisions are measured at the estimated expenditure required to settle the presentobligation, based on the most reliable evidence available at the balance sheet date,including the risks and uncertainties associated with the present obligation. Anyreimbursement expected to be received in the course of settlement of the presentobligation is recognized, if virtually certain as a separate asset, not exceeding theamount of the related provision. Where there are a number of similar obligations, thelikelihood that an outflow will be required in settlement is determined by consideringthe class of obligations as a whole. In addition, where time value of money ismaterial, long-term provisions are discounted to their present values using a pretaxrate that reflects market assessments and the risks specific to the obligation.Provisions are reviewed at each balance sheet date and adjusted to reflect the currentbest estimate.
- 13 -In those cases where the possible outflow of economic resource as a result of presentobligations is considered improbable or remote, or the amount to be provided forcannot be measured reliably, no liability is recognized in the consolidated financialstatements.Probable inflows of economic benefits that do not yet meet the recognition criteria ofan asset are considered contingent assets, hence, are not recognized in theconsolidated financial statements.2.10 Revenue and Expense RecognitionRevenue is recognized to the extent that the revenue can be reliably measured, it isprobable that the economic benefits will flow to the Group, and the costs incurred orto be incurred can be measured reliably. In addition, the following specificrecognition criteria must also be met before revenue is recognized:(a) Tuition and Other Fees – Tuition and other fees are recognized as income over thecorresponding school term.(b) Rental – Revenue is recognized in the consolidated income statement over theterm of the lease using the straight-line method, and in certain cases, the amountdetermined using straight-line method or amount determined using a certainpercentage of the lessee’s gross annual revenue whichever is higher. Rentreceived in advance is initially recorded as Deferred Income in the consolidatedbalance sheet.(c)Interest – Revenue is recognized as the interest accrues (taking into account theeffective yield on the asset).Revenue is measured by reference to the fair value of consideration received orreceivable by the Group for services rendered, excluding value-added tax (VAT) andtrade discounts.Cost and expenses are recognized in the consolidated income statement upon receiptof goods, utilization of service or at the date such cost and expenses are incurred.2.11 LeasesThe Group accounts for its leases as follows:(a)Group as LesseeLeases which do not transfer to the Group substantially all the risks and benefits ofownership of the asset are classified as operating leases. Operating lease payments arerecognized as expense in the consolidated income statement on a straight-line basisover the lease term. Associated costs, such as maintenance and insurance, areexpensed as incurred.
- 14 -(b)Group as LessorLeases which do not transfer to the lessee substantially all the risks and benefits ofownership of the asset are classified as operating leases. Lease income from operatingleases is recognized as income in the consolidated income statement on a straight-linebasis over the lease term.2.12 Foreign Currency TransactionsThe accounting records of the Group are maintained in <strong>Philippine</strong> pesos. Foreigncurrency transactions during the year are translated into the functional currency atexchange rates which approximate those prevailing on transaction dates.Foreign currency gains and losses resulting from the settlement of such transactionsand from the translation at year-end exchange rates of monetary assets and liabilitiesdenominated in foreign currencies are recognized in the consolidated incomestatement.2.13 Impairment of Non-financial AssetsThe Group’s investments in an associate, property and equipment, investmentproperty and certain other non-current assets are subject to impairment testing. Allother individual assets or cash-generating units are tested for impairment wheneverevents or changes in circumstances indicate that the carrying amount may not berecoverable.For purposes of assessing impairment, assets are grouped at the lowest levels forwhich there are separately identifiable cash flows (cash-generating units). As a result,some assets are tested individually for impairment and some are tested atcash-generating unit level.An impairment loss is recognized for the amount by which the asset orcash-generating unit’s carrying amount exceeds its recoverable amount. Therecoverable amount is the higher of fair value, reflecting market conditions less coststo sell, and value in use, based on an internal evaluation of discounted cash flow.Impairment loss is charged pro-rata to the other assets in the cash-generating unit.All assets are subsequently reassessed for indications that an impairment losspreviously recognized may no longer exist and the carrying amount of the asset isadjusted to the recoverable amount resulting in the reversal of the impairment loss.
- 15 -2.14 Employee Benefits(a)Retirement Benefit ObligationsPension benefits are provided to employees through a defined contribution plan.A defined contribution plan is a pension plan under which the Group pays fixedcontributions into an independent entity. The Group has no legal or constructiveobligations to pay further contributions after payment of the fixed contribution. Thecontributions recognized in respect of defined contribution plans are expensed as theyfall due. Liabilities and assets may be recognized if underpayment or prepayment hasoccurred and are included in current liabilities or current assets as they are normally ofa short term nature.(b)Termination BenefitsTermination benefits are payable when employment is terminated by the Groupbefore the normal retirement date, or whenever an employee accepts voluntaryredundancy in exchange for these benefits. The Group recognizes terminationbenefits when it is demonstrably committed to either: (a) terminating the employmentof current employees according to a detailed formal plan without possibility ofwithdrawal; or (b) providing termination benefits as a result of an offer made toencourage voluntary redundancy. Benefits falling due more than 12 months after thebalance sheet date are discounted to present value.(c)Compensated AbsencesCompensated absences are recognized for the number of paid leave days (includingholiday entitlement) remaining at the balance sheet date. They are included inAccounts Payable and Other Liabilities account at the undiscounted amount that theGroup expects to pay as a result of the unused entitlement.2.15 Trust FundsThis represents restricted funds of the <strong>University</strong> that are intended for studentwelfare, development, loan, assistance and scholarship fund, and for other specificeducational purposes. The <strong>University</strong> administers the use of these funds based on thespecific purpose such funds are identified with.2.16 Borrowing CostsBorrowing costs are recognized as expenses in the period in which they are incurred,except to the extent that they are capitalized. Borrowing costs that are attributable tothe acquisition, construction or production of a qualifying asset (i.e., an asset thattakes a substantial period of time to get ready for its intended use or sale) arecapitalized as part of cost of such asset. The capitalization of borrowing costscommences when expenditures for the asset and borrowing costs are being incurredand activities that are necessary to prepare the asset for its intended use or sale are inprogress. Capitalization ceases when substantially all such activities are complete.
- 16 -2.<strong>17</strong> Income TaxesCurrent tax assets or liabilities comprise those claims from, or obligations to, fiscalauthorities relating to the current or prior reporting period, that are uncollected orunpaid at the balance sheet date. They are calculated according to the tax rates andtax laws applicable to the fiscal periods to which they relate, based on the taxableprofit for the year. All changes to current tax assets or liabilities are recognized as acomponent of tax expense in the consolidated income statement.Deferred tax is provided, using the balance sheet liability method on temporarydifferences at the balance sheet date between the tax base of assets and liabilities andtheir carrying amounts for financial reporting purposes.Under the balance sheet liability method, with certain exceptions, deferred taxliabilities are recognized for all taxable temporary differences and deferred tax assetsare recognized for all deductible temporary differences and the carryforward ofunused tax losses and unused tax credits to the extent that it is probable that taxableprofit will be available against which the deferred income tax asset can be utilized.The carrying amount of deferred tax assets is reviewed at each balance sheet date andreduced to the extent that it is probable that sufficient taxable profit will be availableto allow all or part of the deferred tax asset to be utilized.Deferred tax assets and liabilities are measured at the tax rates that are expected toapply to the period when the asset is realized or the liability is settled, based on taxrates and tax laws that have been enacted or substantively enacted at the balance sheetdate.Most changes in deferred tax assets or liabilities are recognized as a component of taxexpense in the consolidated income statement.2.18 Related PartiesParties are considered to be related if one party has the ability, directly or indirectly, tocontrol the other party or exercise significant influence over the other party in makingfinancial and operating decisions. Parties are also considered to be related if they aresubject to common control or common significant influence. Related parties may beindividuals or corporate entities. Transactions between related parties are based onterms similar to those offered to non-related parties.2.19 EquityCapital stock is determined using the nominal value of shares that have been issued.Treasury shares are stated at the cost of re-acquiring such shares.Accumulated fair value gains (losses) comprise gains and losses due to the revaluationof available-for-sale financial assets.Retained earnings include all current and prior period results as reported in theconsolidated income statement. The appropriated portion represents the amountwhich is not available for distribution.
- <strong>17</strong> -2.20 Earnings Per ShareBasic earnings per share are determined by dividing net income by the weightedaverage number of shares subscribed and issued during the year after givingretroactive effect to stock dividend declared, stock split and reverse stock split duringthe current year, if any.Diluted earnings per share are computed by adjusting the weighted average number ofordinary shares outstanding to assume conversion of dilutive potential shares. TheGroup does not have dilutive potential shares outstanding that would requiredisclosure of diluted earnings per share in the consolidated income statement.3. SIGNIFICANT ACCOUNTING JUDGMENTS AND ESTIMATESThe Group’s financial statements prepared in accordance with PFRS requiremanagement to make judgments and estimates that affect amounts reported in thefinancial statements and related notes. Judgments and estimates are continuallyevaluated and are based on historical experience and other factors, includingexpectations of future events that are believed to be reasonable under circumstances.Actual results may ultimately vary from these estimates.3.1 Critical Judgments in Applying Accounting PoliciesIn the process of applying the Group’s accounting policies, management has made thefollowing judgments, apart from those involving estimation, which have the mostsignificant effect on the amounts recognized in the consolidated financial statements:(a)Classification of Held-to-maturity InvestmentsIn classifying non-derivative financial assets with fixed or determinablepayments and fixed maturity, such as bonds, as held-to-maturity investments theGroup evaluates its intention and ability to hold such investments up tomaturity.If the Group fails to keep these investments to maturity other than for specificcircumstances as allowed under the standards, it will be required to reclassify thewhole class as available-for-sale financial assets. In such a case, the investmentswould therefore be measured at fair value, not amortized cost.As of March 31, 2009 and 2008, there are no held-to-maturity investmentsdisposed of before their maturity.(b)Distinction Between Investment Properties and Owner-managed PropertiesThe Group determines whether a property qualifies as investment property. Inmaking its judgment, the Group considers whether the property generates cashflows largely independent of the other assets held by an entity. Owner-occupiedproperties generate cash flows that are attributable not only to the property butalso to other assets used in the production or supply process.
- 18 -Some properties comprise a portion that is held to earn rental or for capitalappreciation and another portion that is held for use in the supply of services orfor administrative purposes. If portion can be sold separately (or leased outseparately under finance lease), the Group accounts for such portion separately.If the portion cannot be sold separately, the property is accounted for asinvestment property only if an insignificant portion is held for use in the supplyof services or for administrative purposes. Judgment is applied in determiningwhether ancillary services are so significant that a property does not qualify asinvestment property. The Group considers each property separately in makingits judgment.(c)Classification of LeasesThe Group has entered into various lease agreements as either a lessor or alessee. Critical judgment was exercised by management to distinguish each leaseagreement as either an operating or finance lease by looking at the transfer orretention of significant risk and rewards of ownership of the properties coveredby the agreements. Currently, all of the Group’s lease agreements aredetermined to be operating leases.Rental expense charged to operations amounted to P<strong>17</strong>.1 million in 2009,P11.3 million in 2008 and none in 2007 (see Note 14) while rental incomeearned in 2009, 2008 and 2007 are presented as Rental Income in theconsolidated income statements.(d)Provisions and ContingenciesJudgment is exercised by management to distinguish between provisions andcontingencies. Policies on recognition and disclosure of provision anddisclosure of contingencies are discussed in Note 2.9 and relevant disclosuresare presented in Note 21.3.2 Key Sources of Estimation UncertaintyThe following are the key assumptions concerning the future, and other key sourcesof estimation uncertainty at the balance sheet date, that have a significant risk ofcausing a material adjustment to the carrying amounts of assets and liabilities withinthe next financial year.(a)Allowance for Impairment of ReceivablesThe Group maintains an allowance for impairment loss on receivables at a levelconsidered adequate to cover probable uncollectible receivables. The level ofthis allowance is evaluated by management on the basis of factors that affect thecollectibility of the accounts. These factors include, but are not limited to,history of the students’ payment behavior, age of receivables and other externalfactors affecting the education industry. The Group constantly reviews the ageand status of receivables, and identifies accounts that should be provided withallowance. Analyses of net realizable value of receivables as of March 31, 2009and 2008 are presented in Note 5.
- 19 -Impairment losses recognized on receivables amounted to about P<strong>17</strong>.6 millionin 2009, P<strong>17</strong>.4 million in 2008 and P12.7 million in 2007 (see Note 5).(b)Valuation of Financial Assets Other than Loans and Other ReceivablesThe Group carries certain financial assets at fair value, which requires theextensive use of accounting estimates and judgment. In cases where activemarket quotes are not available, fair value is determined by reference to thecurrent market value of another instrument which is substantially the same or iscalculated based on the expected cash flows of the underlying net base of theinstrument. The amount of changes in fair value would differ if the Grouputilized different valuation methods and assumptions. Any change in fair valueof these financial assets would affect profit and loss and fund balance.Fair value gains and losses recognized on available-for-sale financial assets in2009, 2008 and 2007 are presented as Accumulated Fair Value Gains (Losses) inthe consolidated statements of changes in equity (see Note 6).(c)Impairment of Available-for-sale InvestmentsThe determination when an investment is other-than-temporarily impairedrequires significant judgment. In making this judgment, the Group evaluates,among other factors, the duration and extent to which the fair value of aninvestment is less than its cost, and the financial health of and near-termbusiness outlook for the investee, including factors such as industry and sectorperformance, changes in technology and operational and financing cash flows.Analyses of the carrying value of the available-for-sale investments as ofMarch 31, 2009 and 2008 are presented in Note 6.(d)Useful Lives of Investment Property and Property and EquipmentThe Group estimates the useful lives of investment property and property andequipment based on the period over which the assets are expected to beavailable for use. The estimated useful lives of these assets are reviewedperiodically and are updated if expectations differ from previous estimates dueto physical wear and tear, technical or commercial obsolescence and legal orother limits on the use of the assets. Analyses of the carrying amounts ofinvestment property and property and equipment are presented inNotes 9 and 10, respectively. Actual results, however, may vary due to changesin factors mentioned above. Based on management assessment as of March 31,2009 and 2008, no change in the estimated useful lives of the assets is necessary.
- 20 -(e)Impairment of Non-financial AssetsPFRS requires that an impairment review be performed when certainimpairment indicators are present. The Group’s policy on estimating theimpairment of non-financial assets is discussed in detail in Note 2.13. Thoughmanagement believes that the assumptions used in the estimation of fair valuesreflected in the financial statements are appropriate and reasonable, significantchanges in these assumptions may materially affect the assessment ofrecoverable values and any resulting impairment loss could have a materialadverse effect on the results of operations.The Group did not recognize any impairment loss on property and equipment,investment property and investments in an associate in 2009, 2008 and 2007.4. CASH AND CASH EQUIVALENTSCash and cash equivalents include the following components as of March 31:2009 2008Cash on hand and in banks P 157,747,5<strong>17</strong> P 197,126,244Short-term placements 1,073,602,486 1,086,378,367P 1,231,350,003 P 1,283,504,611Cash in banks generally earn interest at rates based on daily bank deposit rates.Short-term placements are made for varying periods of up to three months dependingon the immediate cash requirements of the Group and earn effective annual interestranging from 3.75% to 7.00% in 2009 and 3.75% to 5.25% in 2008 for pesoplacements and 1.75% to 4.00% in 2009 and 2.25% to 2.50% in 2008 for dollarplacements. Interest income earned from cash and cash equivalents were presented aspart of Finance Income in the consolidated income statements.Certain portions of cash and cash equivalents are set aside to cover for trust funds asdisclosed in Note 12.
- 21 -5. RECEIVABLESThis account is composed of the following:2008(As restated –Notes 2009 see Note 19.2)Tuition and other fees P 64,246,194 P 54,371,503Rental receivable 8,202,478 829,938Receivable from:FEU EducationalFoundation, Inc. 38,040,770 28,843,710East Asia EducationalFoundation, Inc. (EAEF) 18,165,787 14,116,055Advances to employees 11,479,722 9,145,859Accrued interest 4, 6, 19.2 8,472,078 14,821,789Others 3,691,162 3,<strong>17</strong>7,662152,298,191 125,306,516Allowance for impairment losseson tuition and other fees ( 14,146,263 ) ( 11,872,333 )P 138,151,928 P 113,434,183A reconciliation of the allowance for impairment loss on receivables at the beginningand end of 2009 and 2008 is shown below.2009 2008Balance at beginning of year P 11,872,333 P 11,436,501Impairment losses during the year <strong>17</strong>,581,234 <strong>17</strong>,450,897Receivables written off during the year ( 15,307,304 ) ( <strong>17</strong>,015,065 )Balance at end of year P 14,146,263 P 11,872,333All of the Group’s receivables have been reviewed for indicators of impairment.Certain tuition and other fees receivables were found to be impaired and allowancehas been recorded accordingly. The allowance for impairment loss on receivables asof March 31, 2009 and 2008 relates only to receivables from students which havebeen outstanding for more than one semester and specifically identified to beimpaired. Impairment loss recognized on receivables is presented as part of FinanceCosts in the consolidated income statements.No allowance for impairment loss on all other receivables was provided as ofMarch 31, 2009 and 2008 since management believes that those are collectible in full.The <strong>University</strong> provides management services to EAEF which agreed to paymanagement fee computed at a certain percentage of their gross revenue subject tocertain conditions. Management fees earned amounted to P11.5 million in 2009,P20.1 million in 2008 and nil in 2007 which are presented as part of the captionmiscellaneous under Other Income (Charges) in the consolidated income statements.
- 22 -The outstanding receivables arising from this transaction are presented above as partof Receivable from EAEF.6. AVAILABLE-FOR-SALE INVESTMENTSThis category of financial assets consists of the following:2009 2008Debt securities:Government P 792,260,802 P 706,326,539Corporate 276,110,403 109,258,5041,068,371,205 815,585,043Equity securities 19,738,752 25,102,359P1,088,109,957 P 840,687,402Interest income recognized in 2009, 2008 and 2007 are presented as part of FinanceIncome in the consolidated income statements (see Note 15).Certain AFS investments reached their maturity in 2009, 2008 and 2007 and were nolonger reinvested; thus reclassified to Cash and Cash Equivalents resulting in therecognition in the consolidated income statements of cumulative gain of P2.8 millionin 2009 and P5.5 million in 2008 and cumulative loss of P5.6 million in 2007,previously recognized in consolidated equity.Analyses of the movement in the carrying amounts of the Group’s investments heldby trustee banks are presented below.2009 2008Balance at beginning of year P 840,687,402 P 816,893,531Additions 707,948,490 312,503,139Withdrawals ( 467,769,330) ( 302,795,789 )Investment income - net 15,259,477 12,910,428Fair value gains (losses) ( 8,016,082) 1,<strong>17</strong>6,093Balance at end of year P 1,088,109,957 P 840,687,402
- 23 -7. REAL ESTATE HELD FOR SALEReal estate held for sale as of March 31, 2009 and 2008 represents certain lots at thefollowing locations:Silang, Cavite P 163,587,573Ferndale Homes, Quezon City 25,464,969P 189,052,542Currently, the Group’s real estate properties held for sale are still in the developmentphase and the Group has not made any sale during the years presented.Management has assessed that the net realizable value is higher than the cost of theseassets, hence, no impairment loss was recognized in both years.8. INVESTMENT IN AN ASSOCIATEThis account consists of the following as of March 31:2009 2008Acquisition cost P 7,878,121 P 7,878,121Accumulated equity in net losses:Balance at beginning of year ( 772,742) ( 748,010)Equity in net losses ( 49,416) ( 24,732)Balance at end of year ( 822,158) ( 772,742 )P 7,055,963 P 7,105,379JMCI’s summary of the financial information as of December 31, 2009 and 2008 areas follows:2009 2008Total assets P 14,824,762 P 14,826,831Total liabilities 424,840 326,060Total equity 14,399,923 14,500,771Net loss 100,849 50,474
- 24 -9. INVESTMENT PROPERTYThe gross carrying amounts and accumulated depreciation of investment property atthe beginning and end of 2009 and 2008 are shown below.Building and LandLand Improvements Improvements TotalMarch 31, 2009Cost P 138,676,925 P 306,970,521 P 2,941,664 P 445,589,110Accumulated depreciation - ( 81,673,204) ( 2,012,361 ) ( 83,685,565 )Net carrying amount P 138,676,925 P 225,297,3<strong>17</strong> P 929,303 P 364,903,545March 31, 2008Cost P 125,982,883 P 304,160,428 P 2,722,557 P 432,865,868Accumulated depreciation - ( 67,660,802) ( 1,467,850 ) ( 69,128,652 )Net carrying amount P 125,982,883 P 236,499,626 P 1,254,707 P 363,737,216April 1, 2007Cost P 91,893,657 P 242,559,966 P 2,1<strong>17</strong>,490 P 336,571,113Accumulated depreciation - ( 54,883,329) ( 1,020,911 ) ( 55,904,240 )Net carrying amount P 91,893,657 P 187,676,637 P 1,096,579 P 280,666,873A reconciliation of the carrying amounts at the beginning and end of 2009 and 2008,of investment property is shown below.Building and LandLand Improvements Improvements TotalBalance at April 1, 2008net of accumulateddepreciation P 125,982,883 P 236,499,626 P 1,254,707 P 363,737,216Additions 12,694,042 2,810,093 219,107 15,723,242Depreciation chargesfor the year - ( 14,012,402) ( 544,511 ) ( 14,556,913 )Balance at March 31, 2009net of accumulateddepreciation P 138,676,925 P 225,297,3<strong>17</strong> P 929,303 P 364,903,545Balance at April 1, 2007net of accumulateddepreciation P 91,893,657 P 187,676,637 P 1,096,579 P 280,666,873Additions 34,089,226 61,600,462 458,283 96,147,971Reclassification - - 146,784 146,784Depreciation chargesfor the year - ( 12,777,473) ( 446,939 ) ( 13,224,412 )Balance at March 31, 2008net of accumulateddepreciation P 125,982,883 P 236,499,626 P 1,254,707 P 363,737,216The total rental income earned from the investment property amounted toP50.4 million in 2009, P41.3 million in 2008, P47.8 million in 2007 and presented asRentals in the consolidated income statements. Depreciation expense and otherrelated expenses incurred from the asset such as real property taxes are presented aspart of General Operating Expenses in the consolidated income statements(see Note 14).
- 25 -The fair value of the investment property as of March 31, 2009 and 2008 was aboutP2.5 billion which was determined based on the most recent valuation performed byindependent appraisers immediately after the balance sheet dates except that portionpertaining to FRC’s investment property amounting to P2.1 billion which was basedon valuation in 2006.10. PROPERTY AND EQUIPMENTThe gross carrying amounts and accumulated depreciation at the beginning and endof 2009 and 2008 are shown below.Building and Furniture and Miscellaneous ConstructionLand Improvements Equipment Equipment in-Progress TotalMarch 31, 2009Cost P 197,383,724 P 654,637,049 P 115,455,954 P 13,515,759 P 23,914,725 P 1,004,907,211Accumulateddepreciation - ( 120,539,142 ) ( 88,841,105 ) ( 11,889,254 ) - ( 221,269,501 )Net carrying value P 197,383,724 P 534,097,907 P 26,614,849 P 1,626,505 P 23,914,725 P 783,637,710March 31, 2008Cost P 197,383,724 P 5<strong>17</strong>,435,343 P 107,580,928 P 12,409,148 P 9,084,363 P 843,893,507Accumulateddepreciation - ( 93,944,046 ) ( 77,305,432 ) ( 11,659,251 ) - ( 182,908,729 )Net carrying value P 197,383,724 P 423,491,298 P 30,275.496 P 749,897 P 9,084,363 P 660,984,778April 1, 2007Cost P 197,383,724 P 487,866,479 P 89,420,099 P 12,090,998 P 8,434,363 P 795,195,663Accumulateddepreciation - ( 70,575,246 ) ( 67,114,543 ) ( 11,543,856 ) - ( 149,233,645 )Net carrying value P 197,383,724 P 4<strong>17</strong>,291,233 P 22,305,556 P 547,142 P 8,434,363 P 645,962,018A reconciliation of the carrying amounts at the beginning and end of 2009 and 2008,of property and equipment is shown below.Building and Furniture and Miscellaneous ConstructionLand Improvements Equipment Equipment in-Progress TotalBalance at April 1, 2008,net of accumulateddepreciation P 197,383,724 P 423,491,298 P 30,275,496 P 749,897 P 9,084,363 P 660,984,778Additions - 137,201,705 7,906,080 1,106,611 23,914,725 <strong>17</strong>0,129,121Derecognition - - ( 4,737 ) - ( 9,048,363 ) ( 9,089,100 )Depreciation chargesfor the year - ( 26,595,096 ) ( 11,561,990 ) ( 230,003 ) - ( 38,387,089 )Balance at March 31, 2009,net of accumulateddepreciation P 197,383,724 P 534,097,907 P 26,614,849 P 1,626,505 P 23,914,725 P 783,637,710Balance at April 1, 2007,net of accumulateddepreciation P 197,383,724 P 4<strong>17</strong>,291,233 P 22,305,556 P 547,142 P 8,434,363 P 645,962,018Additions - 29,568,865 18,160,829 318,150 650,000 48,697,844Depreciation chargesfor the year - ( 23,368,800 ) ( 10190,889 ) ( 115,395 ) - ( 33,675,084 )Balance at March 31, 2008,net of accumulateddepreciation P 197,383,724 P 423,491,298 P 30,275,496 P 749,897 P 9,084,363 P 660,984,778
- 26 -In October 2005, FRC entered into a contract with Ayala Land, Inc. (ALI) to acquirea condominium unit which is still under construction and development. The contractrequired a 30% downpayment and monthly installment payments of P165,968 untilDecember 2008. In May 2008, FRC cancelled the said contract prior to its maturityand entered into a new one with ALI to acquire a condominium unit with a lot areasignificantly bigger than the previous contract. The new contract required a 25%downpayment and monthly installment payments of P341,975, which is covered by apromissory note issued in favor of ALI, starting September 2008 until January 2013.FRC has already made a total of P8.5 million, net of administrative fees to ALI,payments in the cancelled contract of which P6.8 million has been applied asdownpayment for the new contract while the remaining amount which pertains toinput taxes is presented as part of Other Current Assets in the 2009 consolidatedbalance sheet.As of March 31, 2009 and 2008, the net carrying amount of the property presented asConstruction in Progress under Property and Equipment amounts to P23.9 millionand P9.1 million, respectively. Interest expense representing amortization ofdiscounts on the notes payable, capitalized as part of construction in progressamounted to P0.9 million in 2009.The current portion of the liability arising from this transaction was P3.1 million andP1.9 million as of March 31, 2009 and 2008, respectively, while the non-currentportion was P10.3 million and nil as of March 31, 2009 and 2008, respectively,(see Note 21.1). These are presented in the consolidated balance sheets as NotesPayable.11. ACCOUNTS PAYABLE AND OTHER LIABILITIESThis account consists of:2008(As restated –Note 2009 see Note 18)Accounts payable P 41,670,926 P 35,781,894Dividends payable 19.2 58,499,156 140,701,054Accrued salaries and benefits 54,229,149 30,048,030Payable to FEU retirement plan 36,901,623 41,886,105Withholding and othertaxes payable 36,513,664 43,934,253Funds payable 34,361,963 27,339,985Amount due to students 33,746,306 46,555,113Accrued expenses 33,569,525 24,573,479Deposits payable 9,831,557 23,550,545Other current liabilities 10,333,508 5,980,166P 349,657,377 P 420,350,624
- 27 -12. TRUST FUNDSThis account consists of the following as of March 31:2009 2008Student welfare and development fund P 26,202,141 P 40,693,748Visual aid development fund 13,224,923 13,670,640FEU Central Student Organization:Student loan fund 12,777,129 10,502,842Student scholarship fund 3,902,308 3,919,602Student assistance fund - 2,653,039Others 2,384,140 4,722,351P 58,490,641 P 76,162,222These trust funds represent collections to defray expenses related to activities forspecific educational purposes. As discussed in Note 4, the amounts of cash and cashequivalents to the outstanding balances of these funds are set aside for such purposes.13. TUITION FEESDetails of net tuition fees presented in the consolidated income statements are asfollows:2009 2008 2007Tuition and other fees P 1,694,493,469 P 1,655,826,499 P 1,636,730,534Less discounts:Scholarship 63,723,848 57,508,745 52,764,930Cash 10,214,508 10,038,965 9,804,230Family 8,746,646 7,595,756 8,192,47282,685,002 75,143,466 70,761,632P 1,611,808,467 P 1,580,683,033 P 1,565,968,902Towards the end of the fiscal year, the <strong>University</strong> collected tuition fees from studentsfor the summer classes which start after the balance sheet date. Such collections areexcluded from tuition fees earned for the year and presented as part of DeferredIncome in the consolidated balance sheets and recognized as revenue in the followingyear.
- 28 -14. OPERATING EXPENSESOperating expenses consists of:2007(As Restated -Notes 2009 2008 see Note 19.2)Instructional and AcademicSalaries and allowances 18 P 527,192,891 P 495,587,597 P 468,906,339Employees benefits 16 164,350,335 150,395,234 135,098,784Related learningexperience 21,641,432 19,474,376 -Affiliation 9,960,332 11,418,036 -Others 21,503,871 <strong>17</strong>,370,504 46,134,305744,648,861 694,245,747 650,139,428AdministrativeSalaries and allowances 18 87,788,025 80,599,603 72,263,545Employees benefits 16 39,266,335 36,165,361 35,<strong>17</strong>5,975Rental <strong>17</strong>,136,041 11,345,139 -Directors’ bonus 11,750,000 10,500,000 8,250,000Others <strong>17</strong>,243,886 16,772,935 15,730,929<strong>17</strong>3,184,287 155,383,038 131,420,449Maintenance and <strong>University</strong> OperationsUtilities 68,074,983 61,619,734 68,929,086Salaries and allowances 23,490,070 24,196,975 23,049,555Janitorial services 16 12,808,640 11,707,163 13,052,135Employee benefits 11,296,291 11,772,106 10,492,989Repairs and maintenance 6,458,042 8,071,553 30,328,725Property insurance 1,160,749 564,594 1,487,187123,288,775 1<strong>17</strong>,932,125 147,339,677GeneralDepreciation 9, 10 52,944,002 46,899,496 46,809,097Security services 25,834,071 18,314,315 15,323,818Publicity and promotions 6,615,235 8,033,477 4,966,479Professional fees 6,306,848 5,416,097 1,510,752Maintenance of art works 6,<strong>17</strong>6,320 2,184,264 3,474,476Taxes and licenses 5,333,533 4,322,713 3,968,750Donation and charitablecontributions 1,358,909 1,471,938 1,672,229Others 2,896,715 5,582,852 10,903,716107,465,633 92,225,152 88,629,3<strong>17</strong>Total Operating Expenses P 1,148,587,556 P 1,059,786,062 P 1,0<strong>17</strong>,528,871
- 29 -15. FINANCE INCOMEThis account consists of:Notes 2009 2008 2007Interest income from:Cash and cashequivalents 4 P 69,502,580 P 65,795,215 P 55,<strong>17</strong>0,976AFS financial assets 6 45,180,490 37,943,665 53,455,661HTM 1,672,563 2,679,885 2,667,123Receivables 1,463,473 - -Foreign exchangegains – net 3,037,732 - -P 120,856,838 P 106,418,765 P 111,293,76016. EMPLOYEES’ HEALTH, WELFARE AND RETIREMENT FUNDThe Group maintains a funded and contributory retirement plan, which is a definedcontribution type of retirement plan since 1967, covering regular teaching and nonteachingpersonnel members.The retirement fund is under the administration of an organization, the FEU Health,Welfare and Retirement Fund, through its Retirement Board.Contributions to this fund are in accordance with the defined contribution establishedby the Retirement Board which is the sum of the employees’ and the Group’scontributions. Employees’ contribution is 5% of basic salary while the Group’scontribution is equivalent to 20% of the employees’ basic salary. Retirement expenserecognized in the <strong>University</strong>’s income statement amounted to P85.9million in 2009,P63.4 million in 2008 and P49.0 million in 2007 (see Note 14).The Fund’s balance sheets as of December 31, 2008 and 2007 showed the following:2008 2007AssetsMoney market placements P 643,050,000 P 555,853,116Receivables 38,547,269 40,186,159Cash in banks 10,784,913 4,628,136Others 185,654 208,505692,567,836 600,875,916Liabilities ( 50,395,960) ( 49,871,692 )P 642,<strong>17</strong>1,876 P 551,004,224
- 30 -<strong>17</strong>. INCOME TAXESThe components of the tax expense presented in the consolidated income statementsare as follows:2009 2008 2007Current tax expense:Special rate at 10% P 51,743,268 P 59,615,310 P 58,009,602Final tax 21,258,726 19,135,614 13,822,068Regular corporate incometax (RCIT) rate at 35%and 30% in 2009 and 35%in 2008 and 2007 10,812,275 10,675,348 7,342,84783,814,269 89,426,272 79,<strong>17</strong>4,5<strong>17</strong>Deferred tax expense (income):Deferred tax benefit arisingfrom origination and reversalof temporary differences 4,788,752 ( 1,879,288) 3,157,934Effect of change in RCIT rate ( 1,607,282) - -3,181,470 ( 1,879,288) 3,157,934P 86,995,739 P 87,546,984 P 82,332,451A reconciliation of tax on pretax income computed at the applicable statutory rates totax expense reported in the consolidated income statements is as follows:2009 2008 2007Tax on pretax income at 10% P 69,628,919 P 70,135,341 P 71,040,300Adjustments for incomesubjected to:RCIT rate 10,843,328 6,208,259 7,634,969Final tax 8,858,395 9,711,972 2,9<strong>17</strong>,309Excess of OSD overitemized deductions ( 3,289,439) - -Effect of change in RCIT rate ( 1,607,282) - -Others 2,561,818 1,491,412 739,873Tax expense P 86,995,739 P 87,546,984 P 82,332,451
- 31 -The deferred tax assets and liabilities relate to the following as of March 31:Consolidated Balance Sheets Consolidated Income Statements2009 2008 2009 2008 2007Deferred tax assets:Accrued rent expense P 4,591,002 P 3,543,085 (P 1,047,9<strong>17</strong>) (P 1,131,710) (P 272,458)Unearned rental income 3,223,163 2,601,432 ( 621,731) ( 2,601,432) -Allowance for impairmentof receivables 1,414,626 1,187,233 ( 227,393) ( 43,583) 683,357Unearned income - 1,685,492 1,685,492 ( 1,685,492) -Accrued donation - 1,700,000 1,700,000 - -NOLCO - 163,<strong>17</strong>6 163,<strong>17</strong>6 ( 50,143) 45,556MCIT - 2,115 2,115 - -Unrealized foreign currency loss - 474,786 474,786 ( 104,391) 824,760Deferred tax assets P 9,228,791 P 11,357,319Deferred tax liabilities:Accrued rent income (P 12,866,856) (P 12,1<strong>17</strong>,687) 749,169 3,737,463 ( 4,439,149)Unrealized foreign currency gains ( 303,773) - 303,773 - -Deferred tax liabilities (P 13,<strong>17</strong>0,629) (P 12,1<strong>17</strong>,687)Deferred tax expense (income) P 3,181,470 (P 1,879,288) (P 3,157,934)The <strong>University</strong> availed of the Tax Incentives Provisions of Republic Act (R.A.)No. 8525, Adopt-a-School Act of 1998. Total benefit from the availment of this taxincentives provided under the R.A. is the sum of the amount of contribution/donation that were actually, directly and exclusively incurred for the Adopt-a-SchoolProgram, with limitations, conditions and rules set forth in Section 34 (H) of the TaxCode and fifty percent (50%) of the amount of such contribution/donation.FRC is subject to the minimum corporate income tax (MCIT) which is computed at2% of gross income, as defined under the tax regulations. No MCIT was recognizedin 2009, 2008 and 2007 as RCIT was higher than MCIT in those years.On July 6, 2008, Republic Act (R.A.) No. 9504 became effective giving corporatetaxpayers an option to claim itemized deduction or optional standard deduction(OSD) equivalent to 40% of gross income which is relevant only to FRC. Once theoption to use OSD is made, it shall be irrevocable for the taxable year for which theoption was made. In 2009, FRC opted to use OSD instead of itemized deduction incomputing its RCIT.In accordance with Republic Act (R.A.)No. 9337, RCIT rate, which is applicable onlyto FRC, was reduced from 35% to 30% while nonallowable deductions for interestexpense from 42% to 33% of interest income subjected to final tax beginningJanuary 1, 2009.
- 32 -18. RELATED PARTY TRANSACTIONSTotal remunerations of the Group’s key management personnel presented as part ofsalaries and allowances and employees benefits under the Instructional and Academic,and Administrative Expenses caption (see Note 14) is as follows:2009 2008 2007Short-term benefits P 113,999,963 P 100,412,356 P 103,872,843Retirement benefits 18,063,955 16,321,494 13,592,380P 132,063,918 P 116,733,850 P 1<strong>17</strong>,465,22319. EQUITY19.1 Capital <strong>Stock</strong>The Group has 10 million shares of authorized capital stock, with P100 par value, ofwhich 9,845,779 shares are issued as of March 31, 2009 and 7,043,699 shares areissued as of March 31, 2008 and 2007. Total outstanding shares are 9,808,448 sharesas of March 31, 2009 and 7,006,368 shares as of March 31, 2008 and 2007 while37,331 shares costing P3.7 million are held in treasury as of those dates.19.2 Retained EarningsSignificant transactions affecting Retained Earnings, which is also restricted at anamount equivalent to the cost of treasury shares, are as follows:(a) Appropriation of Retained EarningsAppropriated Retained Earnings consists of appropriations for:2009 2008 2007Expansion of facilities P 899,333,335 P 1,010,000,000 P 610,000,000General retirement 57,000,000 57,000,000 7,000,000Contingencies 18,765,682 20,161,414 20,161,414Acquisition of laboratoryequipment - 20,000,000 20,000,000Purchase of equipment andimprovements - 30,000,000 30,000,000Repairs and improvements - 10,000,000 10,000,000P 975,099,0<strong>17</strong> P 1,147,161,414 P 697,161,414The BOT approved on June 26, 2007, P100 million and P50 million appropriationsfor expansion of facilities and general retirement, respectively, and again onMarch 25, 2008, an additional appropriation for school expansion of P300 million. In2009, the <strong>University</strong> made a reversal of appropriations amounting to P<strong>17</strong>2.1 millionpertaining to expansion of facilities, repairs and improvements, acquisition oflaboratory equipment and purchase of equipment and improvements.
- 33 -(b) Dividend DeclarationThe BOT approved the following dividend declarations in 2009, 2008 and 2007,respectively:Date ofDeclaration Record Payment Amount2009Cash dividend ofP15 per share June <strong>17</strong>, 2008 July 7, 2008 July 21, 2008 P 105,095,52040% stock dividendequivalent to2,802,547 shares August 23, 2008 September 15, 2008 October 9, 2008 280,208,000467 fractional sharespaid out in cash atP100 per share August 23, 2008 September 15, 2008 October 9, 2008 46,720Cash dividend ofP15 per share December 16, 2008 January 8, 2009 January 22, 2009 147,126,720P 532,476,9602008Cash dividend ofP15 per share June 26, 2007 July 11, 2007 July 23, 2007 P 105,095,520Cash dividend ofP 15 per share December 18, 2007 January 7, 2008 January <strong>17</strong>, 2008 105,095,520Cash dividend ofP15 per share March 25, 2008 April 10, 2008 April 24, 2008 105,095,520P 315,286,5602007Cash dividend ofP15 per share June 20, 2006 July <strong>17</strong>, 2006 July <strong>17</strong>, 2006 P 70,067,13050% stock dividendequivalent to2,335,226 shares March 21, 2006 September 6, 2006 October 2, 2006 233,522,600345 fractional sharespaid out in cash atP100 per share March 21, 2006 September 6, 2006 October 2, 2006 34,500Cash dividend ofP15 per share December 19, 2006 January 5, 2007 January 15, 2007 105,095,520P 408,719,750Unpaid dividends as of March 31, 2009 and 2008 are presented as dividends payableunder Accounts Payable and Other Liabilities in the consolidated balance sheets(see Note 11).(c) Prior Period AdjustmentsPrior period adjustments were recorded by the <strong>University</strong> to correct theoverstatement in the balances of Retained Earnings as of April 1, 2008, 2007 and2006 mainly because of accrued interest receivable amounting to P30.3 million thatwas not reversed in previous years. Also, in 2008 FRC’s management identifiedcertain accruals that should have been reversed in prior years amounting toP9.6 million. This adjustment was made in connection with FRC’s availment of theTax Amnesty Program under R.A. 9480.
- 34 -Shown below are the effects of these adjustments on Retained Earnings.April 1, April 1, April 1,2008 2007 2006Retained earningsas previously reported P 873,954,674 P 1,028,997,472 P 825,051,055Reversal of over accrualof accrued interestreceivable ( 30,293,467) ( 30,293,467) ( 30,293,467)Reversal of over accrualof expenses - 9,550,500 9,550,500( 30,293,467) ( 20,742,967) ( 20,742,967)Retained earningsas restated P 843,661,207 P 1,008,254,505 P 804,308,088These adjustments resulted in decrease in Receivables by P30.3 million as ofMarch 31, 2008.The other adjustments which affected income and expense in those years were merelyoffsetting, thus had no effect on Retained Earnings.20. EARNINGS PER SHAREEarnings per share amounts were computed as follows:2009 2008 2007Net income attributable to equityholders of the <strong>University</strong> P 585,200,755 P 600,693,262 P 612,666,167Divided by weighted averagenumber of outstandingshares, net of treasury stockof 37,331 shares 8,407,408 7,006,368 5,838,755Earnings per share P 69.61 P 85.74 P 104.93The weighted average number of shares outstanding as of March 31, 2009 iscomputed as follows:Number of Months Weighted numbershares Outstanding of sharesBalance at beginning of year 7,006,368 12 84,076,416Issuance on October 9, 2008 2,802,080 6 16,812,480Balance at end of year 9,808,448 100,888,896Divided by total monthsas of March 31, 2009 12Weighted average numberof shares outstanding 8,407,408
- 35 -The weighted average number of shares outstanding as of March 31, 2007 iscomputed as follows:Number of Months Weighted numbershares Outstanding of sharesBalance at beginning of year 4,671,142 12 56,053,704Issuance on October 2, 2006 2,335,226 6 14,011,356Balance at end of year 7,006,368 70,065,060Divided by total monthsas of March 31, 2007 12Weighted average numberof shares outstanding 5,838,755There were no stock issuance in 2008, hence, the weighted average number of sharesoutstanding is equivalent to the total outstanding shares as of March 31, 2008.Diluted earnings per share were not determined since the Group does not havedilutive shares as of March 31, 2009, 2008 and 2007.21. COMMITMENTS AND CONTINGENCIES21.1 Purchase of Condominium UnitAs discussed in Note 10, FRC has an existing contract with ALI for the acquisition ofa condominium unit which is still under construction. Future payments under thiscontract are as follows which is presented as Notes Payable in the consolidatedbalance sheets.2009 2008Within one year P 3,103,359 P 1,895,782After one year but not more than five years 10,327,238 -21.2 Operating Lease Commitments – <strong>University</strong> as LessorP 13,430,597 P 1,895,782The <strong>University</strong> leases out certain buildings to EAEF for a period of one to ten yearsuntil August 31, 20<strong>17</strong>. Total rent income recognized in the <strong>University</strong>’s consolidatedincome statements amounted to P22.9 million in 2009, P25.5 million in 2008 andP42.0 million in 2007.
- 36 -Future minimum rental receivables, excluding contingent rental, under these operatingleases as of March 31, 2009 and 2008 are as follows:2009 2008Within one year P 28,666,776 P <strong>17</strong>,483,208After one year but not morethan five years 114,667,104 69,932,832More than five years 86,000,328 69,932,83221.3 Legal ClaimsP 229,334,208 P 157,348,872FRC is a party to a case filed by World War II Veterans Legionaries of the<strong>Philippine</strong>s, which seeks the annulment of FRC’s title over approximately 15 to 25hectares of land that had been the subject matter of a joint development agreementwith ALI. The specific bounds of the claimed area were not specified by the plaintiff.The plaintiff also sought monetary damages in the amount of approximately P300,000and monthly rentals of P300,000, while the case is pending. FRC’s management andits legal counsel, however, are vigorously contesting the claims. The case was initiallydismissed by the Regional Trial Court and is currently pending on appeal before theCourt of Appeals.As of March 31, 2009 and 2008, the Group is also a defendant in certain civil caseswhich are pending in the local courts, certain illegal dismissal cases pending before thenational Labor Relations Commission, and a class suit for damages by certain studentswhich is pending before the Court of Appeals.The Group’s management and its legal counsel believe that the liabilities, if any, whichmay result from the outcome of these cases, will not materially affect the financialposition and results of operations of the Group. However, the Group hasappropriated portion of its retained earnings for these contingencies (see Note 19.2)21.4 OthersThere are other contingencies that arise in the normal course of business that are notrecognized in the Group’s financial statements. However, management believes thatlosses, if any, arising from these commitments and contingencies will not materiallyaffect its financial statements.22. RISK MANAGEMENT OBJECTIVES AND POLICIESThe Group is exposed to certain financial risks in relation to financial instruments. Itsmain purpose for its dealings in financial instruments is to fund operational andcapital expenditures. The BOT has overall responsibility for the establishment andoversight of the Group’s risk management framework. It has a risk managementcommittee headed by an independent trustee that is responsible for developing andmonitoring the Group’s policies, which address risk management areas.
- 37 -Management is responsible for monitoring compliance with the Group’s riskmanagement policies and procedures and for reviewing the adequacy of these policiesin relation to the risks faced by the Group.The Group does not actively engage in trading of financial assets for speculativepurposes nor does it write options. The most significant financial risks to which theGroup is exposed to are described below.22.1 Interest Rate SensitivityThe Group’s exposure to interest rate risk arises from the following interest-bearingfinancial instruments which are subject to variable interest rates. All other financialassets and liabilities have fixed rates.Notes 2009 2008Cash and cash equivalents 4 P 1,231,350,003 P 1,283,504,611AFS investments 6 1,068,371,205 815,585,043P2,299,721,208 P 2,099,089,654The following table illustrates the sensitivity of income before tax for the years inregards to the Group’s interest-bearing financial instruments. These percentages havebeen determined based on the average market volatility rates, using standarddeviation, in the previous 12 months, estimated at 68% level of confidence. Thesensitivity analysis is based on the Group’s financial instruments held atMarch 31, 2009 and 2008.2009 2008Reasonably Effect in Reasonably Effect inpossible change income before possible change income beforein rate tax in rate taxCash and cash equivalents +/- 2.67% P 32,788,553 +/- 1.35% P <strong>17</strong>,375,862AFS investments +/- 2.83% 28,547,356 +/- 1.54% 11,1<strong>17</strong>,53322.2 Credit RiskP 61,335,909 P 28,493,395Credit risk represents the loss the Group would incur if the counterparty failed toperform under its contractual obligations. The Group’s exposure to credit risk on itsreceivables related primarily to the inability of the debtors to pay and students to fullysettle the unpaid balance of tuition fees and other charges which are owed to theGroup based on installment payment schemes. The Group has established controlsand procedures in its credit policy to determine and to monitor the credit worthinessof the students based on relevant factors. Also, students are not allowed to enroll inthe following semester unless the unpaid balance in the previous semester has beenpaid. The Group also withholds the academic records and clearance of the studentswith unpaid balance, thus ensuring that collectibility is reasonably assured. TheGroup’s exposure to credit risk on its other receivable from debtors and relatedparties is managed through close account monitoring and setting limits.
- 38 -The Group neither has any significant exposure to any individual customer orcounterparty nor does it have any other concentration of credit risk arising fromcounterparties in similar business activities, geographic region or economic parties.With respect to credit risk arising from cash and cash equivalents, receivables, AFSinvestments and HTM investments, the Group’s exposure to credit risk arises fromdefault of the counterparty, with maximum exposure equal to the carrying amount ofthese instruments. The maximum exposure to credit risk at the balance sheet date isas follows:Notes 2009 2008Cash and cash equivalents 4 P 1,231,350,003 P 1,283,504,611Receivables 5 138,151,928 113,434,183AFS investments 6 1,088,109,957 840,687,402HTM investments 20,000,000 32,071,040P 2,477,611,888 P 2,269,697,236The table below shows the credit quality of the Group’s receivables which are theonly financial assets as of March 31, 2009 and 2008 (presented in ‘000) having pastdue but not impaired components.NeitherPast duepast due norNotimpaired Impaired impaired Total2009Tuition and other fees P 35,325 P 14,146 P 14,775 P 64,246Employees 11,480 - - 11,480Others 76,342 - - 76,342P 123,147 P 14,146 P 14,775 P 152,0682008Tuition and other fees P 15,808 P 11,872 P 26,692 P 54,372Employees 9,146 - - 9,146Others 61,789 - - 61,789P 86,743 P 11,872 P 26,692 P 125,307The age of past due but not impaired receivables is about six months for both years.The Group classifies tuition and other fee receivables from students based on thenumber of semesters the receivables have been outstanding. Receivables fromstudents that are outstanding for more than one semester are analyzed to determinewhether they are impaired. Those that are not outstanding for more than onesemester or are currently receivable are determined to be collectible, based onhistorical experience.
- 39 -The Group’s management considers that all the above financial assets are notimpaired, except those specifically provided with allowance for impairment, as of thebalance sheet dates and of good credit quality. Cash and cash equivalents, AFSinvestments and HTM investments are coursed through reputable financialinstitutions duly approved by the BOT. The balance due from a related party is froma profitable related party with good payment record; collections therefrom arereasonably assured.22.3 Liquidity RiskThe Group manages liquidity risk by maintaining a balance between continuity offunding and flexibility. Treasury controls and procedures are in place to ensure thatsufficient cash is maintained to cover daily operational and working capitalrequirements. Management closely monitors the Group’s future and contingentobligations and ensures that future cash collections are sufficient to meet them inaccordance with internal policies. The Group invests in cash placements when excesscash is obtained from operations.Financial liabilities of the Group at the balance sheet date comprise of accountspayable and accrued expenses, dividends payables and notes payable – current whichare all short-term in nature and have contractual maturities of less than 12 months.22.4 Other Price Risk SensitivityThe Group’s exposure to price risk arises from its investments in equity and debtsecurities, which are classified as AFS investments in the consolidated balance sheets.Management monitors its equity and debt securities in its investment portfolio basedon market indices. Material investments within the portfolio are managed on anindividual basis.AFS investments consist of publicly listed equity securities and government securitieswhich are carried at fair value and non-listed equity securities for which no fair valueinformation is available and that are therefore carried at cost.For equity securities listed in the <strong>Philippine</strong>s, an average volatility of 36.68% and56.14% has been observed during 2009 and 2008. If quoted price for these securitiesincreased or decreased by that amount income before tax would have changed byP7.1 million and P9.8 million in 2009 and 2008, respectively.The investments in listed equity securities are considered long-term strategicinvestments. In accordance with the Group’s policies, no specific hedging activitiesare undertaken in relation to these investments. The investments are continuouslymonitored and voting rights arising from these equity instruments are utilized in theGroup’s favor.
- 40 -23. CATEGORIES AND FAIR VALUES OF FINANCIAL ASSETS ANDLIABILITIESThe carrying amounts and fair values of the categories of financial assets and liabilitiespresented in the consolidated balance sheets are shown below.Financial assetsLoans and receivables:2009 2008Carrying Fair Carrying FairNotes Values Values Values ValuesCash and cash equivalents 4 P 1,231,350,003 P1,231,350,003 P 1,283,504,611 P1,283,504,611Receivables – net 5 138,151,928 138,151,928 113,434,183 113,434,183AFS investments: 61,369,501,931 1,369,501,931 1,396,938,794 1,396,938,794Debt securities 1,068,371,205 1,068,371,205 815,585,043 815,585,043Equity securities 19,738,752 19,738,752 25,102,359 25,102,359HTM investments –1,088,109,957 1,088,109,957 840,687,402 840,687,402Debt securities 20,000,000 20,000,000 32,071,040 32,071,040P 2,477,611,888 P2,477,611,888 P 2,269,697,236 P2,269,697,236Financial liabilitiesFinancial liabilities at amortized cost:Accounts payable andOther liabilities 12 P 349,657,377 P 349,657,377 P 420,350,624 P 420,350,624Notes payable – current 3,103,359 3,103,359 1,895,782 1,895,782Notes payable – non-current 10,327,238 10,327,238 - -Other liabilities 12 P 363,087,974 P 363,087,974 P 422,246,406 P 422,246,406See Notes 2.4 and 2.8 for a description of the accounting policies for each category offinancial instruments. A description of the Group’s risk management objectives andpolicies for financial instruments is provided in Note 22.24. CAPITAL MANAGEMENT OBJECTIVES, POLICIES ANDPROCEDURESThe Group aims to provide returns on equity to shareholders while managingoperational and strategic objectives. The Group manages its capital structure andmakes adjustments to it, in the light of changes in economic conditions. To maintainor adjust capital structure, the Group may adjust the dividend payment toshareholders, return capital to shareholders or issue new shares.The Group defines capital as paid-in capital stock and retained earnings, bothappropriated and unappropriated. Other components of equity such as treasurystock, accumulated fair value gains (losses) and minority interest are excluded fromcapital for purposes of capital management. The BOT has overall responsibility formonitoring of capital in proportion to risks. Profiles for capital ratios are set in thelight of changes in the Group’s external environment and the risks underlying theGroup’s business, operation and industry.
- 41 -The Group monitors capital on the basis of debt-to-equity ratio, which is calculated astotal debt divided by total equity. Capital for the reporting period March 31, 2009 and2008 under review is summarized as follows:2009 2008Total debt P 560,025,664 P 589,490,506Total equity 3,028,331,118 2,695,192,521Debt-to-equity ratio 0.18 : 1.00 0.22 : 1.00The Group is not subject to any externally-imposed capital requirements.There was no change in the Group’s approach to capital management during the year.
FAR EASTERN UNIVERSITY, INC. AND SUBSIDIARIESINDEX TO SUPPLEMENTARY SCHEDULESMARCH 31, 2009Statement of Management’s Responsibility for the Consolidated Financial StatementsIndependent Auditors’ Report on the <strong>SEC</strong> Supplementary SchedulesFiled Separately from the Basic Financial StatementsSupplementary Schedules to Consolidated Financial Statements(<strong>Form</strong> <strong>17</strong>-A, Item 7)Page No.A. Marketable Securities - (Current Marketable Equity Securities and OtherShort-term Cash Investments) 1B. Amounts Receivable from Directors, Officers, Employees, Related Partiesand Principal <strong>Stock</strong>holders (Other than Affiliates) 2C. Noncurrent Marketable Equity Securities, Other Long-term Investments in<strong>Stock</strong>s and Other Investments 3D. Indebtedness to Unconsolidated Subsidiaries and Related Parties NAE. Other Assets 4F. Long-term Debt NA*G. Indebtedness to Related Parties (Long-term Loansfrom Related Companies)NAH. Guarantees of Securities of Other IssuersI. Capital <strong>Stock</strong> 5Supplementary Schedule to Parent Financial Statements(<strong>SEC</strong> Circular No. 11)Reconciliation of Parent Company Retained Earnings for Dividend Declaration 6* Balance of account is less than 5% of the total liabilities of the Group.
FAR EASTERN UNIVERSITY, INC. AND SUBSIDIARIESSCHEDULE B - AMOUNTS RECEIVABLE FROM DIRECTORS, OFFICERS,EMPLOYEES, RELATED PARTIES, AND PRINCIPAL STOCKHOLDERS (OTHER THAN AFFILIATES)FOR THE YEAR ENDED MARCH 31, 2009ANNEX C.1.2Name and Designation of DebtorBeginningBalanceAdditionsDeductionsAmountAmountDeducted Written-OffCurrent Non-CurrentEndingAbala, Genelin G. 5,295.67 5,295.67 5,295.67Abellera, Evelyn C. 302.23 302.23 302.23Acab, Deborah A. 10,400.00 10,400.00 10,400.00Acosta, Venina Corazon S. 418.97 418.97 418.97Adolfo, Marlon (3,560.00) (3,560.00) (3,560.00)Africa, Dickenson Y. 200.00 200.00 200.00Agdalpen, Renato C. 2,000.00 2,000.00 2,000.00Agluba, Noreen 63.00 63.00 63.00Agorilla, Delia 660.00 660.00 660.00Aguirre, Estelita 200.00 200.00 200.00Alarde, Crispulo Jr. S. 22,532.51 22,231.51 301.00 - 301.00Albino, Maulynn 207.50 207.50 207.50Albiva, Merlyn T. 1,464.00 1,464.00 1,464.00Alcaraz, Nellie T. 8,200.00 8,200.00 8,200.00Alcazar, Nina Aiza 415.50 415.50 415.50Alfaro, Jennylyn G. (3,835.00) (3,835.00) (3,835.00)Alibania, Hazel J. 1,000.00 1,000.00 1,000.00Almalvez, Arlena C. 200.00 200.00 200.00Alo, James 600.00 600.00 600.00Alolor, Jacqueline G. (873.00) (873.00) (873.00)Amacan, Normita C. 15,113.55 13,608.00 1,505.55 - 1,505.55Amlog, Jocelyn A. 45,000.00 45,000.00 45,000.00Ampatin, Estrella V. 26,005.00 26,005.00 26,005.00Anastacio, Nanette V. (3,309.80) (3,309.80) (3,309.80)Anastacio, Teresita M. 89.74 89.74 89.74Andres, Jocelyn 90.00 90.00 90.00Anido, Cecilia I. 334,016.06 263,593.07 70,422.99 70,422.99An Lim, Jaime L. 97,711.02 99,166.74 (1,455.72) - (1,455.72)Arabia, Julieta S. 600.00 2,500.00 (1,900.00) - (1,900.00)Aragon, Lloyd Jeffrey 5,000.00 5,000.00 5,000.00Arbizo, Maria Sophia 3,695.57 3,695.57 3,695.57Arejola, Romeo 200.00 200.00 200.00Arig, Mellicent J. (300.00) (300.00) (300.00)Arquiza, Glenda S. 6,824.50 16,670.00 (9,845.50) - (9,845.50)Arreca, Edgardo C. (500.00) (500.00) (500.00)Arribe, Emma B. 245.00 245.00 245.00Asilo, Ma. Cecilia 50.00 50.00 50.00Ataat, Jose 200.00 200.00 200.00Atanque, Aurora L. 2,835.06 5,123.88 (2,288.82) - (2,288.82)Austria, Ryan 5,000.00 5,000.00 5,000.00Ayson, Rosalino P., Jr. 31,505.00 <strong>17</strong>,160.00 14,345.00 14,345.00Azor, Helen A. (1,528.<strong>17</strong>) (1,528.<strong>17</strong>) (1,528.<strong>17</strong>)Azucena, Cesario 1,339.20 1,339.20 1,339.20Babilonia, Jonathan 450.00 450.00 450.00Baconawa, Ma. Dorina M. 79.<strong>17</strong> 79.<strong>17</strong> 79.<strong>17</strong>Badiable, Charisma Mae 5,000.00 5,000.00 5,000.00
Baello, Christine N. (137.50) (137.50) (137.50)Balaoro, Maria Theresa 200.00 (200.00) - (200.00)Balaria, Dalmacio P. 7,500.00 7,500.00 7,500.00Balita, Paulita C. 9,436.50 1,750.00 7,686.50 - 7,686.50Bambico, Elma 311.00 311.00 311.00Banal, Enrico R. (22,<strong>17</strong>1.50) (22,<strong>17</strong>1.50) (22,<strong>17</strong>1.50)Banas, Gloria V. 24.20 24.20 24.20Barcellano, Francis (4,595.00) (4,595.00) (4,595.00)Barcelona, Samson V. 200.00 200.00 200.00Bartolome, Liezl DM. 764.00 822.00 (58.00) - (58.00)Batungbakal, Marisa <strong>17</strong>.50 <strong>17</strong>.50 <strong>17</strong>.50Bautista, Andres D. 3,000.00 3,000.00 3,000.00Bautista, Arlene Mae DG. 1,027.00 1,027.00 1,027.00Bautista, Christopher 588.40 588.40 588.40Bautista, Rosalinda 300.00 300.00 300.00Bayan, Alfred F. 3,457.64 3,457.64 3,457.64Bayan, Zenaida E. 585.50 585.50 585.50Bayona, Daniel G. 545.90 545.90 545.90Belardo, Ma. Jeanette 1,794.53 1,794.53 1,794.53Belleza, Asuncion L. 16,649.00 28,938.47 (12,289.47) - (12,289.47)Beltran, Charity J. <strong>17</strong>5.00 <strong>17</strong>5.00 <strong>17</strong>5.00Belza, Mercedes A. 7,060.00 7,060.00 7,060.00Bermudez, Israel 300.00 300.00 300.00Bermudez, Neil C. 1,600.00 1,600.00 1,600.00Bonaobra, Salvador B. (750.00) (750.00) (750.00)Brawner, Dalisay G. 40.00 40.00 40.00Briones, Domingo J. 10,079.00079 00 10,079.00079 00 10,079.00079 00Brocal, Cynthia M. 24.00 24.00 24.00Buenaventura, Alexander V. 7,060.00 7,060.00 7,060.00Buenaventura, Olga C. 27,213.00 27,213.00 27,213.00Buenavida, Amelia 165.00 165.00 165.00Bueno, Marivic 10,000.00 10,000.00 10,000.00Bulanhagui, Nida B. 620.00 620.00 620.00Bustamante, Ma. Christine H. 11,000.00 1,000.00 3,400.00 8,600.00 8,600.00Caagbay, Elpidio Z. (5,779.30) 3,974.30 3,500.00 (5,305.00) - (5,305.00)Cabaltica, Leilani A. 11,210.55 7,000.00 4,210.55 4,210.55Cabantac, Ricardo R. 7,060.00 7,060.00 7,060.00Cabulay, Danny A. 54.00 54.00 54.00Cadorna, Rosemarie S. 656.20 656.20 656.20Cagadas, Ruly 200.00 200.00 200.00Cajucom, Mary Grace A. 440.00 440.00 440.00Calizar, Dexter A. 3,126.10 3,126.10 3,126.10Calub, Mary Virginia Blesilda 10,000.00 10,000.00 10,000.00Camacho, Joseph C. 600.00 600.00 600.00Cando, Cromwell N. 1,248.00 1,248.00 1,248.00Canilao, Fe V. 663,200.47 303,408.43 359,792.04 359,792.04Canlas, Aurora V. 227.70 227.70 227.70Canobas, Ruel V. 33.00 33.00 33.00Cao, Marilou F. (2,769.00) 2,098.00 (2,098.00) (2,769.00) (4,867.00)Capacio, Glenn (7,300.00) (7,300.00) (7,300.00)Caramanza, Edward M. 9,000.00 9,000.00 9,000.00Cardona, Enrico 200.00 200.00 200.00Cariquitan, Daisy 308.00 308.00 308.00Carpio, Miguel M. (13,086.34) (13,086.34) (13,086.34)Casaclang, Editha Y. 11,796.00 11,796.00 11,796.00Castanas, Baby Theress 82.50 82.50 82.50Castro, Joeven R, 4,555.00 4,555.00 4,555.00Castro, Ma. Clara C. 566.36 566.36 566.36
Cauba, Harvey A. 10,000.00 5,635.22 4,364.78 4,364.78Cecilio, Ma. Elaine 3,795.89 3,795.89 3,795.89Cerrer, Redentor A. 200.00 200.00 200.00Chan, Jeffrei Allan (6,927.00) (6,927.00) (6,927.00)Chu, Connie 195.20 195.20 195.20Chua, Ryan Gilbert 5,000.00 5,000.00 5,000.00Clemente, Luisa DC. 3,615.90 3,615.90 3,615.90Clerigo, Bernard A. 1,000.00 1,080.00 (80.00) - (80.00)Clores, Roy 3,230.00 3,230.00 3,230.00Codinera, Virgilio B. 79.72 79.72 79.72Cometa, Ma. Victoria D. (7,775.00) (7,775.00) (7,775.00)Concepcion, Gerald G. 250.00 250.00 250.00Concepcion, Lourdes Q. 930.72 930.72 930.72Concha, Jhonalyn M. 10,900.00 10,900.00 10,900.00Copiaco, Ross Joseph 50.00 50.00 50.00Cordero, Nelma 1,195.00 1,195.00 1,195.00Cruz, Anita B. 25,000.00 25,000.00 25,000.00Cruz, Anna Lisa D. (944.00) (944.00) (944.00)Cruz, Christybel O. 928.75 928.75 928.75Cruz, Eloisa G. 3,362.50 3,362.50 3,362.50Cruz, Felipe T. 1,200.00 1,200.00 1,200.00Cruz, Janet R. 200.00 200.00 200.00Cruz, John Ross R. (4,500.00) (4,500.00) (4,500.00)Cruz, Jose Noel 200.00 200.00 200.00Cruz, Maricar 5,000.00 5,000.00 5,000.00Cruz, Maritess 9.16 9.16 9.16Cruz, Precita P. (1,400.00) 00) (1,400.00) 00) (1,400.00)00)Cruz, Reynaldo J. 934.05 934.05 934.05Cruz, Rosalie dela 6.68 6.68 6.68Cruz, Sandra Lyn D. 523.01 523.01 523.01Cuartero, Pacifico C. (1,700.00) (1,700.00) (1,700.00)Culala, Harold John D. (835.00) 5,000.00 (5,000.00) (835.00) (5,835.00)Cunanan, Fernando M. 3,309.80 3,309.80 3,309.80Cureg, Benedicto A. 5,522.64 5,522.64 5,522.64Custodio, Joselito 50.00 50.00 50.00Dado, Rorylyn H. (1,000.00) (1,000.00) (1,000.00)Dalton, Juanita C. 12,739.40 12,739.40 12,739.40Dapla, Walter 3,851.29 3,851.29 3,851.29Davalos, Zenaida R. (499.20) (499.20) (499.20)David, Melvira c. 300.00 300.00 300.00Dean, Victoriano P. 3,412.50 3,412.50 3,412.50Deatras, Jeffrey (2,861.29) (2,861.29) (2,861.29)Delloro, Evelyn 748.00 748.00 748.00Demagante, Rey Francis G. 50.00 50.00 50.00Destura, Blanca 224.56 224.56 224.56Diaz, Aeneas Eli (10,000.00) (10,000.00) (10,000.00)Diaz, Reynaldo 255.00 255.00 255.00Dingding, Quintin P. 70.00 70.00 70.00Dino, Kristopher 400.00 400.00 400.00Dizon, Mercy G. (800.00) (800.00) (800.00)Dones, Irene P. 600.00 600.00 600.00Doria, Jeanette V. (260.00) (260.00) (260.00)Duena, Teodoro C., Jr. (6,000.00) (6,000.00) (6,000.00)Dulay, Sofronio C. (10,636.95) (10,636.95) (10,636.95)Dumadag, Norma M. 27,015.20 27,015.20 27,015.20Dumas, Marvin C. 150.00 150.00 150.00Dumdumaya, Myline Marie P. (1,200.00) (1,200.00) (1,200.00)Duque, Ronald 50.00 50.00 50.00
Duran, Benedict James D. (47,271.57) (47,271.57) (47,271.57)Echauz, Lydia B. (20,362.80) (20,362.80) (20,362.80)EDSA- Shangrila Plaza 1,300.00 1,300.00 1,300.00Elman, Mario B. (1,800.00) (1,800.00) (1,800.00)Enriquez, Christian Jo C. (4,939.39) (4,939.39) (4,939.39)Enriquez, Emiliana 50.00 50.00 50.00Enriquez, Rex Cesar 200.00 200.00 200.00Escoltero, Emily (2,9<strong>17</strong>.93) (2,9<strong>17</strong>.93) (2,9<strong>17</strong>.93)Escosia, Aurora A. 25,899.77 2,200.00 23,699.77 23,699.77Eser, Myline S. 33,035.86 33,035.86 33,035.86Espino, Kristine 112.00 112.00 112.00Espinosa, William V. 6,431.00 6,431.00 6,431.00Espiritu, Christine Joy 300.00 300.00 300.00Esquibel, Elizabeth 5,000.00 5,000.00 5,000.00Estabillo, Ma. Luz 529.50 529.50 529.50Estacio, Ma. Vivian G. (1,625.01) (1,625.01) (1,625.01)Esteban, Alejandro L. 5,000.00 5,000.00 5,000.00Estonanto, Mark Ronald L. 374.85 374.85 374.85Estonanto, Mavi Issel L. 32,221.65 32,221.65 32,221.65Estrella, Gloria 1,460.37 1,460.37 1,460.37Estrella, Luisito P. (300.00) (300.00) (300.00)Fabito, Evelyn 2,163.00 2,163.00 2,163.00Fabros, Marietta 5,295.67 5,295.67 5,295.67Federigan, Melissa 946.25 946.25 946.25Felizardo, Dante A. 10,000.00 10,000.00 10,000.00Feraren, Mitchell 50.00 50.00 50.00Fernandez, Benedict T. III (4,400.00) 400 00) (4,400.00) 400 00) (4,400.00) 400 00)Fernandez, Dante Roel 699.00 699.00 699.00Fernandez, Roderick 588.40 588.40 588.40Fernando, Gerry V. 967.00 967.00 967.00Fesalbon, Hermond F. 7,729.34 7,729.34 7,729.34FEU Consumer's Coop. 3,295.85 3,295.85 3,295.85FEU Credit Union 1,560.92 1,560.92 1,560.92Fiesta, Erlinda P. 8,532.50 8,532.50 8,532.50Figer, Reggy C. 24,300.00 24,300.00 24,300.00Flojo, Flordeliza 168.50 168.50 168.50Flores, Hanonica S. 50.00 50.00 50.00Flores, Miguela T. (102.50) (102.50) (102.50)Flores, Raul 600.00 600.00 600.00Flores, Renato C. 2,000.01 2,000.01 2,000.01Flores, Roberto C. (32,250.00) (32,250.00) (32,250.00)Florida, Ma. Corazon M. (1,800.00) (1,800.00) (1,800.00)Foe, Jonathan 100.00 100.00 100.00Frades, Francisca B. 9,002.85 9,132.85 (130.00) - (130.00)Frias, Wilmer 5,000.00 5,000.00 5,000.00Fuentes, Ma. Leda J. 7,060.00 7,060.00 7,060.00Galang, Aurora C. 980.00 980.00 980.00Galiza, Miguela S. 45,000.00 45,000.00 45,000.00Gallardo, John 13,000.40 13,000.40 13,000.40Garcia, Dolores A. 50,000.00 50,000.00 50,000.00Garcia, Earl Jimson R. 6,000.00 6,000.00 6,000.00Garcia, Lourdes C. 16.41 16.41 16.41Garcia, Muriel B. (6,500.00) (6,500.00) (6,500.00)Garcia, Mylene M. 19,000.00 9,000.00 10,000.00 10,000.00Garcia, Severino M. 624,147.34 293,384.98 330,762.36 330,762.36Garin, May C. 29,900.00 4,900.00 25,000.00 25,000.00Genota, Jaime F. 822.32 822.32 822.32Gil, Aurora H. - PMSI 7,060.00 7,060.00 7,060.00
Go-Monilla, Ma. Joycelyn A. 280.31 280.31 280.31Gonzaga, Jemabel 505.00 505.00 505.00Gonzales, Fortune N. 397.50 397.50 397.50Guardame, Quintal Nilo 305.72 305.72 305.72Gubio, James B. (4,000.00) 2,000.00 (2,000.00) (4,000.00) (6,000.00)Guevarra, Remedios P. 10,297.00 6,000.00 4,297.00 4,297.00Gupit, Dolores S. (26,896.39) (26,896.39) (26,896.39)Gutang, Marco P. (2,353.33) (2,353.33) (2,353.33)Guzman, Jericho D. 8,460.00 8,460.00 8,460.00Guzman, Jimmy 150.00 150.00 150.00Guzman, Jose 300.00 300.00 300.00Hernandez, Alma R. (1,337.50) (1,337.50) (1,337.50)Hernandez, Angeline A. 7,491.70 7,491.70 7,491.70Hilario, Jacqueline E. 662.50 662.50 662.50Hore, Lelioso G. 300.00 300.00 300.00Ibasco, Lourdes 350.00 350.00 350.00Ignacio, Lourdes D. 6,983.00 4,900.00 12,233.00 (350.00) - (350.00)Iguas, Jose A. 2,997.00 3,977.00 (980.00) - (980.00)Imbang, Ma. Nathalie A. 3,772.50 3,772.50 3,772.50Inciong, Cherry Wyne E. 7,500.00 7,500.00 7,500.00Irabagon, Miramar 6,000.00 6,000.00 6,000.00Isidro, Rosalina B. (593.75) (593.75) (593.75)Israel, Marietta C. 19,700.00 14,700.00 5,000.00 5,000.00Jabile, Joel E. 50.00 50.00 50.00Jagnis, Neil 300.00 300.00 300.00Javier, Anabella G. 8,162.50 8,162.50 8,162.50Jesus, Angelita SD. 5,714.30 5,714.22 008 0.08 008 0.08Jimenez, Arsenia S. 5,970.00 5,970.00 5,970.00Jimenez, Marietta 2,290.86 2,290.86 2,290.86Jonson, Joyce Lisa B. (48,424.97) (48,424.97) (48,424.97)Jose, Corazon V. 5,409.20 3,350.63 2,058.57 2,058.57Jose, Haidee R. (1,446.80) (1,446.80) (1,446.80)Junio, Nenitha L. 767.00 767.00 767.00Kenny, Isabel 14,000.00 14,000.00 - 14,000.00Laboy, Michael C. 20,818.00 15,166.37 5,651.63 5,651.63Lagula, Janette 1<strong>17</strong>.50 1<strong>17</strong>.50 1<strong>17</strong>.50Lamboson, Roger C. (4,000.00) (4,000.00) (4,000.00)Lamorena, Juditha M. 44,893.20 24,000.00 20,893.20 20,893.20Lantin, Rommel 1,383.31 1,383.31 1,383.31Lapastora, Milagros P. 33,066.80 25,660.00 7,406.80 7,406.80Lapuebla, Alfredo N. 2,490.00 2,490.00 2,490.00Larano, Leonora 6,048.75 200.00 5,848.75 5,848.75Larda, Edmundo D. (1,500.00) (1,500.00) (1,500.00)Laudato, Emmanuel N. (1,200.00) (1,200.00) (1,200.00)Laurente, Jaime R. 1,650.25 1,650.25 1,650.25Lauro, Jocelyn P. 10,856.00 10,856.00 10,856.00Lazaro, Ma.Teresita A. 3,205.00 3,205.00 3,205.00Legaspi, Heidi 1,000.00 1,000.00 1,000.00Leon, Emma Rose H. 22,750.00 6,250.00 16,500.00 16,500.00Leonin, Clarito V. (200.00) (200.00) (200.00)Lewis, Salome 1,147.50 1,147.50 1,147.50Liggayu, Michael 200.00 200.00 200.00Lim, Nathaniel L. 3<strong>17</strong>.00 3<strong>17</strong>.00 3<strong>17</strong>.00Lintag, Graciel A. 1,180.16 1,180.16 1,180.16Listana, Mary Rose 1,012.50 1,012.50 1,012.50Lizaso, Marcelino N. Jr. 400.00 400.00 400.00Lopez, Anastacio, Jr. L. 7,966.00 8,196.00 (230.00) (230.00)Lopez, Antonio P., Jr. 15.34 15.34 15.34
Lopez, Fernando M. 250.00 250.00 250.00Lopez, Mercedita P. 252.50 252.50 252.50Loza, Luningning R. 748.00 748.00 748.00Lugtu, Blyth 5.00 5.00 5.00Luna, Lillian N. 967.14 967.14 967.14Macadangdang, Luzviminda (137.50) (137.50) (137.50)Macalaguing, Mateo D. Jr. 10,000.00 10,000.00 10,000.00Macalalad, Consuelo 150.00 150.00 150.00Macaraeg, Paul 30,000.00 23,563.77 6,436.23 6,436.23Macario, Christopher 50.00 50.00 50.00Magayaga, Lea Q. (7,059.99) (7,059.99) (7,059.99)Magtoto, Eliseo 200.00 200.00 200.00Malabag, Pastor B. 2,638.58 2,638.58 2,638.58Malinao, Marivic 110.00 110.00 110.00Maliwat, Herminia I. 861,567.51 253,815.36 607,752.15 607,752.15Malot, Edmund Francis 100.00 100.00 100.00Manalili, Golda P. 50.00 50.00 50.00Mananquil, Amado 1,800.00 1,800.00 1,800.00Manansala, Paolo 81.58 81.58 81.58Mangahas, Roser Benjamin 1,397.00 1,397.00 1,397.00Manicsic, Teresa B. 84.00 84.00 84.00Manigan, Alma C. 7.61 7.61 7.61Manlapaz, Divine Grace 5,000.00 5,000.00 5,000.00Manlapaz, Victor 1,200.00 1,200.00 1,200.00Manrique, Elenita <strong>17</strong>,000.00 <strong>17</strong>,000.00 <strong>17</strong>,000.00Matullano, Edgardo C. 1,248.86 1,248.86 1,248.86Mazo, Flaviano S. 780.0000 780.0000 780.0000MC Entee, Keneline M. 3,928.90 3,928.90 3,928.90Medina, Joy E. 2,419.52 0.33 2,829.37 (409.52) - (409.52)Medina, Ma. Ana Karina S. 25.94 25.94 25.94Medina, Merle S. (1,075.25) (1,075.25) (1,075.25)Medrano, Rosalinda 935.50 935.50 935.50Membrot, Ezitiel R. 2,150.00 2,150.00 2,150.00Mendoza, Cecilia H. (6,186.77) (6,186.77) (6,186.77)Mendoza, Florina M. 300.00 300.00 300.00Mendoza, Jobert 10,000.00 10,000.00 10,000.00Menez, Karren G. (550.00) (550.00) (550.00)Menorca, Emmanuel S. (282.00) 32.00 (250.00) (250.00)Mercado, Annabelle K. 3,758.55 3,758.55 3,758.55Miguel, Emmanuel C. 6,619.60 6,619.60 6,619.60Milarpis, Joel 4,000.00 4,000.00 4,000.00Minas, Geraldine C. 1,050.00 1,050.00 1,050.00Miranda, Dennis 4,100.00 4,100.00 4,100.00Mondares, Lailani D. (1,000.00) (1,000.00) (1,000.00)Monong, Cora 6,000.00 6,000.00 6,000.00Morimonte, Bonifacio D. 500.00 500.00 500.00Mortel, Honorardo M. (247.00) (247.00) (247.00)Mortell, Gideon 5,237.46 5,237.46 5,237.46Nagal, Glenn Z. 586,647.34 255,884.98 330,762.36 330,762.36Narval, Antonio G. 520.80 520.80 520.80Natera, Malvin G. 4,121.97 4,121.97 4,121.97Naui, Elizabeth S. 93.75 187.50 (93.75) (93.75)Nava, Delfin D. 767.00 767.00 767.00Nicer, Joselito C. (65,500.85) (65,500.85) (65,500.85)Nietes, Raymond G. 16,689.30 16,689.30 16,689.30Ninobla, Magnolia <strong>17</strong>0.00 <strong>17</strong>0.00 <strong>17</strong>0.00Ninubla, Shiela 1,018.53 1,018.53 1,018.53Nolasco, Maria Sylva 1,775.00 1,775.00 1,775.00
Noriega, Mariwilda I. (7,306.55) (7,306.55) (7,306.55)Nuestro, Sarah Joyce 15,000.00 4,052.03 10,947.97 10,947.97Nulla, Mila R. 21,433.75 21,433.75 21,433.75Oasan, Albert C. 750.00 750.00 750.00Ocampo, Wilfredo T. 1,150.00 1,150.00 1,150.00Olipas, Lorina L. 200.00 200.00 200.00Ong, Emil 4<strong>17</strong>.53 4<strong>17</strong>.53 4<strong>17</strong>.53Orjalo, Victoria G. 200.00 200.00 200.00Ortiz, Jose (4,882.00) (4,882.00) (4,882.00)Ortiz, Milixa Lourdes B. 5,000.00 5,000.00 5,000.00Oyzon, Gualberto J. 3,002.80 3,002.80 3,002.80Padilla, Maria Eleanor T. 1,430.50 1,430.50 1,430.50Pahutan, Ludivinia M. <strong>17</strong>,682.30 <strong>17</strong>,882.30 (200.00) - (200.00)Palparan, Karoline L. (900.00) (900.00) (900.00)Pamintuan, Jose Edmundo E. 100.00 100.00 100.00Pangilinan, Christopher 1,316.80 1,316.80 1,316.80Pangilinan, Genice R. 1,520.00 2,520.00 (1,000.00) - (1,000.00)Pantas, Felix Jr. (3,482.50) (3,482.50) (3,482.50)Pante, Ronald S. 600.00 600.00 600.00Paraiso, Lourdes Oliva C. 90,410.00 5,562.50 84,847.50 84,847.50Paras, Renato 50,000.00 50,000.00 50,000.00 50,000.00 50,000.00Pasag, Maribeth 315.00 315.00 315.00Pascua, Jennifer J. 44,977.91 4,000.00 40,977.91 40,977.91Pascual, Perfecto 350.00 350.00 350.00Pataunia, Ma. Cecilia 5.16 5.16 5.16Patricio, Natividad 598.75 598.75 598.75Paz, Rosalinda Z. 32,509.00 00 3,796.00 27,500.00 3,796.00 5,009.00 8,805.00805 00Pekson II, Enrique Arvin (43,488.12) (43,488.12) (43,488.12)Pelareja, Juanito Y. 213.00 213.00 213.00Perez, Crismin 10,591.34 10,591.34 10,591.34Perez, Jose R. Jr. 52.20 52.20 52.20Pimentel, Stephanie 285.00 285.00 285.00Pineda, Rodolfo G. 71.26 221.25 (149.99) - (149.99)Ponsaran, Levy C. 2,450.00 2,450.00 2,450.00Portiz, Ellen 207.50 207.50 207.50Pring, Melanie 5,000.00 5,000.00 5,000.00Publico, Hilario Q. 5,376.50 5,376.50 5,376.50Puertollano, Derek 250.00 250.00 250.00Pulmano, Zelmo 8,000.00 8,000.00 8,000.00Puro, Kristopher John 150.00 150.00 150.00Querijero, Glen Hilario M. 5,000.00 5,000.00 5,000.00Quiambao, Arlene 358.50 358.50 358.50Quijano, Virginia A. 7,220.00 7,220.00 7,220.00Quijencio, Wilfredo D. 666.00 666.00 666.00Quintanar, Janeth A. 5,366.56 5,366.56 5,366.56Quinto, Myrna P. 9,060.00 2,000.00 7,060.00 7,060.00Quirimit, Luzviminda 1,942.77 1,942.77 1,942.77Ragonjah, Homer Jay D. 15.00 15.00 15.00Ramon, Elizabeth A. de - PMSI 7,060.00 7,060.00 7,060.00Ramones, Rhozallino C. 5,000.00 5,000.00 5,000.00Ramos, Donna B. 11.50 (11.50) - (11.50)Ramos, Erlinda L. 10,000.00 10,000.00 10,000.00Ramos, Leonora A. 2,250.00 7<strong>17</strong>.11 1,532.89 1,532.89Ramos, Ma. Theresa L. 853.81 853.81 853.81Rana, Aurelio Y. 23,498.08 26,631.00 (3,132.92) - (3,132.92)Rapirap. Raquel T. 8,288.00 8,288.00 8,288.00Rasalan, Julia 772.50 772.50 772.50Redulla, Everjeann Christie R. 34.71 34.71 34.71
Remiendo, Noraliza A. 902.09 892.09 10.00 10.00Remigio, Warley 100.00 100.00 100.00Retardo, Victor C. (600.00) (600.00) (600.00)Reyes, Byron M. 200.00 200.00 200.00Reyes, Herbert D. 4,555.00 4,555.00 4,555.00Reyes, Melodia S. 6,834.00 6,834.00 6,834.00Reyes, Ruby 572.50 572.50 572.50Reymundo, Samuel 50.00 50.00 50.00Rivera, Myrna T. (1,420.25) (1,420.25) (1,420.25)Rizada, Ryan Joseph 9,159.80 9,159.80 9,159.80Ronda, Ma. Lea A. 300.00 300.00 300.00Rosa, Giovanni dela 551.63 551.63 551.63Rosario, Alma del 7,060.00 (7,060.00) (7,060.00)Rosario, Hilario - PMSI 14,120.00 14,120.00 14,120.00Rosete, Dwight Benedict N. 1,500.00 2,000.00 (500.00) (500.00)Roxas, Ronald L. 8,000.00 8,000.00 8,000.00Rubillos, Leonardo I. (600.00) (600.00) (600.00)Ruzol, Hipolito S. 300.00 300.00 300.00Sabaupan, Sylvette G. 23,364.75 23,364.75 23,364.75Sabaybay, Jocelyn L. 666.00 666.00 666.00Saldua, Eder John (5,000.00) (5,000.00) (5,000.00)Salonga, Lea 50.00 50.00 50.00Salud, Alann M. (520.00) (520.00) (520.00)Salvacion, Dennis C. (3,000.00) (3,000.00) (3,000.00)Salvador, Esther D. 18.00 18.00 18.00San Pablo, Ma.Cecilia A. 492.25 492.25 492.25Sansaet, Sheery O. (107.50) 53.75 (53.75) (53.75)Sante, Nova C. (981.25) (981.25) (981.25)Santiago, Christopher G. 9,638.<strong>17</strong> 9,638.<strong>17</strong> 9,638.<strong>17</strong>Santiago, Edwin B. 50.00 50.00 50.00Santiago, Genine 1,130.00 1,130.00 1,130.00Santillan, Vivian M. 190.00 190.00 190.00Santos, Arwind 49,990.00 49,990.00 49,990.00Santos, Carmelita C. (1,391.64) (1,391.64) (1,391.64)Santos, Danilo B. 2,645.25 2,645.25 2,645.25Santos, Dinia 251.25 251.25 251.25Santos, Florentino I. (1,788.00) (1,788.00) (1,788.00)Santos, Glecerio 200.00 200.00 200.00Santos, Jing 267.00 267.00 267.00Santos, Mary Lord 5,000.00 5,000.00 5,000.00Santos, Michelle R. 574.56 574.56 574.56Santuile, Aida M. 8,000.00 8,000.00 8,000.00Sapitula, Preciosa S. 1,586.57 1,586.57 1,586.57Sarita, Larry 50.00 50.00 50.00Sarmiento, Lina Q. 7,325.77 1,634.15 5,691.62 5,691.62Sauco, Carlos P. 5,206.14 5,206.14 5,206.14Sayco, Marjorie 206.50 206.50 206.50Sido, Ma. Victoria P. 6,125.80 6,000.00 125.80 125.80Sin, Glenda S. 7,060.00 7,060.00 7,060.00Sinang, Rolando R. 7,263.50 7,263.50 7,263.50Sincioco, Mary Ann 207.50 207.50 207.50Siongco, Ma. Teresita 2,000.00 2,000.00 2,000.00Sioson, Annabelle P. 60.00 60.00 60.00Sioson, Yolanda J. 57,480.00 57,480.00 57,480.00Soliman, Norma P. 7,060.00 7,060.00 7,060.00Sopoco, Anna Marie M. 1,890.00 1,890.00 1,890.00Soria, Eulegio E. 1,000.00 1,000.00 1,000.00Soronel, Rolando A. 1,<strong>17</strong>5.00 1,<strong>17</strong>5.00 1,<strong>17</strong>5.00
Sta. Ana, Noemi V. 311.00 311.00 311.00Tabaloc, Edgardo U. Jr. 51.58 51.58 51.58Tabaniag, Flordeliza 63.75 63.75 63.75Tablizo, Anne Margareth 206.50 206.50 206.50Tagle, Susan M. 5,051.41 5,051.41 5,051.41Tamay, Shariff M. 5,000.00 5,000.00 5,000.00Tamayao, Olivia E. 4,996.60 4,996.60 4,996.60Tan, Carolina M. - PMSI 7,060.00 7,060.00 7,060.00Tan, Cedrick - PMSI (4,875.00) (4,875.00) (4,875.00)Tan, Derrick - PMSI 15,187.00 15,187.00 15,187.00Tan, Mary Joyce P.- PMSI 7,060.00 7,060.00 7,060.00Tan, Ryanne 1<strong>17</strong>.50 1<strong>17</strong>.50 1<strong>17</strong>.50Tapalgo, Elyn M. Jr. (2,657.50) (2,657.50) (2,657.50)Tapit, Neila E. (672.00) (672.00) (672.00)Tecson, Rhenalyn 311.00 311.00 311.00Teoxon, Lucio 379.82 379.82 379.82Tibayan, Florencia C. 305.00 305.00 305.00Tiburcio, Jaime, Jr. 2,007.50 2,007.50 2,007.50Timbugan, Josefina - PMSI 7,060.00 7,060.00 7,060.00 7,060.00 - 7,060.00Tingcungco, Elizabeth G. 259.02 259.02 259.02Tirazona, Renato A. 1,989.92 3.00 3.00 1,989.92 1,992.92Tiu, Michael 200.00 200.00 200.00Togado, Illumar I. 5,250.00 1,250.00 4,000.00 4,000.00Tomas, Eden A. 943.00 943.00 943.00Torres, Irma R. (300.00) (300.00) (300.00)Torres, Maruja T. 206.50 206.50 206.50Trinidad, Alfredo D. 329.07 329.07 329.07Trinidad, Josefina <strong>17</strong>0.00 <strong>17</strong>0.00 <strong>17</strong>0.00Tuazon, Nino M. 356.25 356.25 356.25Unidad, Kim Ryan 100.00 100.00 100.00Ureta, Peter 9,397.10 9,397.10 9,397.10Usita, Laarni P. 23,069.00 23,069.00 23,069.00Utzurrum, Jonathan B. 7,<strong>17</strong>8.00 7,<strong>17</strong>8.00 7,<strong>17</strong>8.00Uy, Moira B. 4,000.00 4,000.00 4,000.00Uyson, Leslie Marie C. 15,372.00 15,372.00 15,372.00Valdez, Ferdinand 1,000.00 1,000.00 1,000.00Valdez, Gloria 1,237.50 1,237.50 1,237.50Valencia, Jean Pauline S. (5,198.00) (5,198.00) (5,198.00)Valencia, Ma. Theresa L. 3,195.00 2,665.00 530.00 530.00Valencia, Venancio 300.00 300.00 300.00Valente, Jovito S. (2,659.60) (2,659.60) (2,659.60)Valenzuela, Edwin E. 300.00 300.00 300.00Vallo, Mary Rose C. <strong>17</strong>5.00 <strong>17</strong>5.00 <strong>17</strong>5.00Valmonte, Alejandra Monica 205.25 205.25 205.25Varilla, Edglyn G. 5,140.61 5,140.61 5,140.61Vega, Jose Mario D. 300.00 300.00 300.00Velasco, Antonio Y. 650.10 650.10 650.10Vera, Antonio 25,813.45 25,813.42 0.03 0.03Vera, Jose Rizalito c. (5,400.00) (5,400.00) (5,400.00)Vera, Sebastian (2,300.00) (2,300.00) (2,300.00)Verances, Ma. Laline V. (841.50) (841.50) (841.50)Vergara, Flocerfida - PMSI (35,220.00) (35,220.00) (35,220.00)Vergara, Melchor - PMSI (7,060.00) (7,060.00) (7,060.00)Vergara, Oliver Francis - PMSI (7,060.00) (7,060.00) (7,060.00)Vergara, Regidor - PMSI (7,060.00) (7,060.00) (7,060.00)Vergara, Romeo - PMSI 21,180.00 21,180.00 21,180.00Verzosa, Bobby 100.00 100.00 100.00Vibar, Enrico B. 7,200.00 7,200.00 7,200.00
Vicera, Desmond M. 200.00 200.00 200.00Victoria, Michael S. (640.00) (640.00) (640.00)Villaceran, Eugenio V. (18,230.98) (18,230.98) (18,230.98)Villamiel, Carminda (29,288.90) (29,288.90) (29,288.90)Villanueva, Ace R. 26.98 26.98 26.98Villanueva, Jerome 400.00 400.00 400.00Villanueva, Jonas V. (13,073.00) (13,073.00) (13,073.00)Villanueva, Ma. Concepcion 5,330.00 330.00 5,000.00 5,000.00Villapando, Marimel A. 200.00 200.00 200.00Villar, Gerald 7,060.00 7,060.00 7,060.00Vinluan, Lourdes R. 41,328.00 42,000.00 (672.00) - (672.00)Vivas, Cherry Mae 300.00 300.00 300.00Woolsey, Nida B. 268.00 10.00 10.00 268.00 278.00Yabis, Geraldine 97.50 97.50 97.50Yang, Gloria 45,000.00 45,000.00 45,000.00Yanzon, Gina 500.00 500.00 500.00Yap, Caridad P. (4,841.00) (4,841.00) (4,841.00)Yatco, Ma. Carmen S. 29,320.00 29,320.00 29,320.00Zaldivar, Felicia P. (672.00) (672.00) (672.00)Zaldivar, Ramil P. 5,000.00 5,000.00 5,000.00Zara, Marc Vincez R. 2,500.00 2,500.00 2,500.00Zulueta, Michael R. 7,000.00 7,000.00 7,000.00- -4,830,040.90 84,829.38 2,023,033.70 (15,194.39) 2,907,030.97 2,891,836.58-FACULTY ADVANCES -Agoncillo, Divina Gracia O. 1,986.94 94 1,986.9494Aguilos, Susan S. 2,983.13 2,983.13Alona, Elizabeth V. (5,295.67) (5,295.67)Altares, Priscilla S. (37.62) (37.62)Anastacio, Nanette v. (5,295.67) (5,295.67)Ansano, Bela R. 11,590.42 11,590.42Austria, Rex S. (2,160.00) (2,160.00)Avengoza, Rosalie J. (6,518.64) (6,518.64)Badiola, Jose Luisito V. (0.52) (0.52)Bautista, Mary Grace S. (5,295.67) (5,295.67)Cano, Charito F. 847.27 847.27Castro, Lawrence Christopher 1,765.22 1,765.22Cruz, Sandra Lyn E. 44,290.05 44,290.05Dimalibot, Martina Geraldine Q. 1,926.98 1,926.98Estacio, Ma. Vivian G. 3,832.70 3,832.70Gariguez, Mariflor N. 10,591.34 10,591.34Garin, May C. 5,534.22 5,534.22Isip, Amando F. (1,323.91) (1,323.91)Javier, Nancy Joan M. 5,295.67 5,295.67Jose, Franco C. (6,619.59) (6,619.59)Malay, Ernesto B. 20,910.00 20,910.00Martinez, Zenaida S. (7,943.50) (7,943.50)Minas, Geraldine C. (3,150.00) (3,150.00)Narciso, Wilfrida B. 5,295.67 5,295.67Naui, Elizabeth S. (50.00) (50.00)Pacot, Marilou M. (7,943.50) (7,943.50)Permalino, Albert Emmanuel S. 7,060.89 7,060.89Sagarino, Gavino N. (5,295.67) (5,295.67)Salcedo, Liezel Donatila M <strong>17</strong>,190.24 <strong>17</strong>,190.24Salonga, Ma. Elena A. 147.16 147.16Salunga, Loida P. 14,960.54 14,960.54Salvado, Rowena E. 22,160.26 22,160.26
Santos, Buenvenida 3,971.75 3,971.75Santos, Katherine Vera A. (32.50) (32.50)Santos, Melody Christian R. 3,909.51 3,909.51Simo, Rickson Jay (21,182.72) (21,182.72)Tia, Christopher B. (0.03) (0.03)Trinidad, Josefina M. 1,690.82 1,690.82Villanueva, Rosalie R. (10,591.34) (10,591.34)Villegas, Ma. Marissa M. (10,591.34) (10,591.34)Villorente, Elizabeth F. 1,323.91 1,323.91Vinluan, Renato A. 2,028.62 2,028.62-Total 4,922,006.32 84,829.38 2,023,033.70 (15,194.39) 2,983,802.00---Ampatin, Estrella V. 560.00 (560.00) (560.00)Arquiza, Glenda S. 7,500.00 7,500.00Cabasada, Albert R. III 53,3<strong>17</strong>.71 28,629.64 55,848.00 26,099.35Caratao, Jinky Rosario 6,800.00 6,800.00Cruz, Reynaldo J. 5,000.00 (5,000.00)Diwa, Alvin S. 40,400.00 8,616.09 31,783.91Faustino, Jose V. 96,311.35 14,000.00 93,660.08 16,651.27Fernando, Gerry V. (1,282.30) 7,560.00 7,560.00 (1,282.30)Frades, Francisca B. (451.32) (451.32)Garin, May C. 66,130.23 20,000.00 46,130.23Leon, Jocelyn E. de (0.50) 9,984.46 3,643.80 6,339.66 6,340.16Molina, Mark Oliver P. (4,232.06) 79,950.00950 00 80,950.00 00 (1,000.00) 00) (5,232.06)Paraiso, Lourdes Oliva 0.20 0.20Pizaro, Arthur 1,200.00 1,200.00Salvador, Mary Grace C. 16,000.00 16,000.00Sarabia, Juliet S. 12,755.00 8,000.00 4,755.00Soria, Eulegio 1,777.00 1,777.00Tolentino, Rosula R. 8,646.70 24,620.03 24,620.03 8,646.70Villanueva, Romulo 5,212.00 5,212.00Villar, Gerald 20,388.77 20,388.77Yang, Gloria G. 94,260.00 82,169.20 164,669.20 11,760.00--5,346,739.10 331,742.71 2,496,160.90 (10,414.73) 3,182,320.91---------------APRIL 2008 - MARCH 2009 ---
JANUARY 2008- C/A --Abelardo, Luzviminda 9,404.00 40,484.38 33,888.38 16,000.00 16,000.00Abella, Bernard (5.68) 24.78 15.22 3.88 3.88Abellera, Evelyn C. 6,186.20 5,593.10 593.10 593.10Abello, Susan B. 6,119.00 5,003.00 - 1,116.00Acosta, Marizon Isabel R. 400.00 600.00 - (200.00)Adil, Mary Antoinette 200.00 200.00 200.00Advincula, Helen D. 20,250.00 250.00 20,000.00 20,000.00Aguila, Fitzgerald 11,000.00 - 11,000.00Ahmadzadeh, Teresita 16.00 15,521.25 14,826.63 - 710.62Alabarca, Wilma J. 8,167.50 5,0<strong>17</strong>.50 - 3,150.00Alagao, Ma. Cristina T. 1,844.25 1,660.57 - 183.68Alarde, Crispulo, Jr. 18,962.50 74,905.25 93,207.75 - 660.00Albano, Allan Rey 4,000.00 4,000.00Alcoberes, Philip Jay N. <strong>17</strong>0.00 10,850.25 12,020.25 - (1,000.00)Alcoriza, Jennifer M. 600.00 - (600.00)Alimuin, Sylvia A. 1,444.75 16,700.25 16,794.88 - 1,350.12Amlog, Jocelyn 300.00 200.00 - 100.00Anido, Cecilia I. 500.05 7,473.00 3,586.38 - 4,386.67An Lim, Jaime L. 115,649.75 45,060.00 41,209.75 19,500.00 119,500.00Anonuevo, Monica L. 300.00 14,<strong>17</strong>5.42 10,075.42 - 4,400.00Apostol, Esther S. 787.50 975.00 - (187.50)Arabia, Julieta S. 9,934.00 76,459.80 69,763.90 - 16,629.90Areola, Vina 15,200.00 7,500.00 - 7,700.00Arquiza, Glenda 150,624.00 77,624.00 - 73,000.00Arriola, Eric John C. 10,000.00000 00 10,200.00 00 - (200.00) 00)Artezuela, Marilou 39,414.00 414.00 - 39,000.00Artus, Liezel C. 200.00 650.00 997.50 (147.50) (147.50)Atanacio, Heidi C. 31,328.00 14,664.00 - 16,664.00Atanque, Aurora L. 82.00 79,403.80 64,696.40 - 14,789.40Ayson, Rosalino P. 5,042.50 <strong>17</strong>,342.38 12,357.25 - 10,027.63Ayson, Rozsano V. 14,865.00 13,378.50 - 1,486.50Baccay, Yolanda A. 1,650.00 49,838.53 31,488.53 - 20,000.00Badiola, Jose Luisito V. 200.00 - 200.00Balaoro, Maria Theresa 200.00 7,885.00 8,285.00 - (200.00)Balarosan, Edna G. 21,580.00 19,386.66 - 2,193.34Balita, Paulita C. 16,463.19 183,021.40 164,775.86 - 34,708.73Bantayan, Maria Emilia R. 10,000.00 1,650.00 - 8,350.00Baquiran, Leonidez 200.00 - 200.00Barroga, Junalyn 145.00 145.00Bartolome, Liezel M. 27,378.00 24,902.40 - 2,475.60Batan, Ericson S. 10,991.60 9,475.00 - 1,516.60Batang, Delia S. 37,578.00 27,578.00 - 10,000.00Batoon, Allen 850.00 - 850.00Bautista, Danilo B. 772.50 7,200.00 3,472.50 - 4,500.00Belardo, Amy G. 26,666.00 24,916.00 - 1,750.00Belaya, Vina Grace C. 1,862.40 - (1,862.40)Belleza, Asuncion L. 15,000.00 35,000.00 9,189.00 - 40,811.00Beltran, Edna M. 25,214.08 <strong>17</strong>,714.08 - 7,500.00Belza, Mercedes A. 998.00 85,073.80 71,488.00 - 14,583.80Bernardo, Rodrigo G. 8,389.25 75,412.00 62,389.25 - 21,412.00Bingculado, Roger B. 2,500.00 34,000.00 34,000.00 - 2,500.00Bontigao, Eli N. 1,200.00 9,856.00 9,056.00 - 2,000.00Borja, Sofriano A. 7,000.00 15,000.00 11,250.00 - 10,750.00Brigino, Frederick L. 800.00 825.00 - (25.00)Brillon, Cherish Aileen A. 31.00 23,800.00 23,856.00 - (25.00)Bueno, Marivie 370.75 370.75
Buot, Joseph 600.00 - 600.00Bustamante, Maria Christine H. 10,000.00 6,800.00 16,200.00 - 600.00Butcon, Vincent Edward R. 800.00 825.00 - (25.00)Cabaltica, Leilani A. 4,000.00 146,580.00 93,193.33 - 57,386.67Cabasada, Albert R. III 7.00 12,307.00 - (12,300.00)Cabebe, Lolita D. 65.00 791.00 921.00 - (65.00)Cabilto, Gerardo P. <strong>17</strong>,000.00 6,200.00 - 10,800.00Cajucom, Cherry H. 2,979.34 11,580.00 10,<strong>17</strong>2.67 - 4,386.67Cajucom, Marie Christine B. 850.00 - 850.00Calub, May Virginia Blesilda 200.00 - 200.00Camaclang, Merlita J. 749.00 12,890.86 7,070.24 - 6,569.62Camana, Love V. <strong>17</strong>,760.00 15,085.00 - 2,675.00Canare, Sabino C. 375.00 - (375.00)Cando, Cromwell N. 20,000.00 16,000.00 - 4,000.00Canilao, Fe V. 506,704.00 402,3<strong>17</strong>.33 - 104,386.67Canoza, Geraldine E. 48,661.30 46,780.30 - 1,881.00Capacio, Glenn 50,000.00 55,000.00 - (5,000.00)Capili, Regina R. 2,533.50 4,616.75 7,568.38 - (418.13)Caranguian, Reynaldo G. 9,836.00 37.00 - 9,799.00Carlos, Salome S. 1,<strong>17</strong>0.00 950.00 2,970.00 - (850.00)Carpio, Rustica 1,788.00 - 1,788.00Casaclang, Editha U. 65.00 <strong>17</strong>,244.01 15,133.35 - 2,<strong>17</strong>5.66Castillo, Carolina 45,000.00 21,000.00 - 24,000.00Castro, Bryan M. 2,472.00 1,800.00 - 672.00Castro, Joeven R. 23,124.25 <strong>17</strong>,965.46 - 5,158.79Castronuevo, Ellaine P. 15,028.50 13,778.50 - 1,250.00Casuco, Leonida S. 180.0000 28,614.40 40 43,408.80408 80 - (14,614.40)40)Cauba, Harvey A 200.00 - 200.00Cayetano, Lovella M. 36,813.25 30,813.25 - 6,000.00Chastein, Cherry R. 61,500.00 51,500.00 - 10,000.00Cinco, Concepcion R. 10,025.00 25.00 - 10,000.00Cinco, Estrella J. 10,356.65 12,456.65 - (2,100.00)Ciubal, Willie Y. 10,054.00 6,904.00 - 3,150.00Civil, Jerwin John Y. 14,000.00 15,933.20 - (1,933.20)Clerigo, Bernard A. 11,538.00 9,786.00 - 1,752.00Contreras, Jelina Joy S. 39,200.00 200.00 - 39,000.00Copiaco, Ross Joseph B. 2,979.34 6,580.00 5,222.67 - 4,336.67Cortez, Lina 88.76 (88.76) (88.76)Cruz, Benjamin F. 25,000.00 105,000.00 100,000.00 - 30,000.00Cruz, Noel L. 26,433.91 6,000.00 - 20,433.91Cruz, Reynaldo J. 167.15 167.00 - 0.15Cuevas, Romeo C. 1,459.72 1,459.00 - 0.72Cunanan, Manuel Luis 154,000.00 - 154,000.00Dacayanan, Marites G. 6,889.00 7,126.04 - (237.04)Daguman, Ian 650.00 - 650.00Davalos, Zenaida R. 800.00 548.00 1,098.00 - 250.00David, Melvira C. 15,037.00 15,372.00 - (335.00)Decena, May Celine 272.00 - 272.00Destura, Blanca 2,618.25 13,628.50 5497.<strong>17</strong> - 10,749.58Diaz, Joel 850.00 - 850.00Dimalibot, Ma. Martina Geraldine 200.00 - 200.00Dingding, Quintin P. 120.00 44,521.50 20,641.50 - 24,000.00Dios, Rolando Gerald 200.00 - 200.00Dizon, Kenneth Earl I. 400.00 200.00 - 200.00Dizon, Riza R. 100.00 200.00 - (100.00)Dominguez, Rex S. 4,992.00 81,307.07 61,959.41 - 24,339.66Dones, Irene P. 38,226.00 10,826.00 - 27,400.00Ducut, Mirela G. 48,714.45 11,549.85 - 37,164.60
Dulay, Sofronio A. Jr. 48,450.00 29,250.00 - 19,200.00Echauz, Lydia B. 50,000.00 - 50,000.00Eleazar, Glenda C. <strong>17</strong>,625.00 41,580.00 24,818.33 - 34,386.67Enriquez, Rex Cezar P. 837.50 1,037.50 - (200.00)Ermitano, Nolivienne C. 650.00 887.50 - (237.50)Escleto, Wilberto 10,800.00 10,825.00 - (25.00)Escosia, Aurora A. 2,257.95 46,582.30 42,971.19 - 5,869.06Esguerra, Anna Leah R. 200.00 - 200.00Espiritu, Elizabeth O. 2,380.00 842.66 - 1,537.34Estacio, Ma. Vivian G. 68,269.00 54,495.67 - 13,773.33Estrella, Luisito P. 5,000.00 26,352.00 25,652.00 - 5,700.00Evangelista, Rey M. 250.00 70,099.37 42,040.18 - 28,309.19Faustino, Jose V. 18,<strong>17</strong>3.86 102,087.65 107,152.32 - 13,109.19Ferareza, Rimar 250.00 250.00Fernando, Gerry V. 21,096.98 1,096.98 - 20,000.00Flora, Dolores 12,750.00 15,<strong>17</strong>1.00 <strong>17</strong>,146.67 - 10,774.33Flores, Cecilia D. 100.00 - 100.00Flores, Miguela T. 76,000.00 32,666.67 - 43,333.33Frades, Francisca B. 169.00 58,292.00 20,979.00 - 37,482.00Fronda, Adelaida C. 5,044.00 6,044.00 - (1,000.00)Galang, Lemery N. 5,477.00 5,000.00 - 477.00Galicia, Reynaldo M. 200.00 30,426.00 23,484.00 - 7,142.00Galo, Crispin L. 20,742.58 1,800.00 22,542.25 0.33Garcia, Dolores A. 100.00 - 100.00Garcia, Miriam 10,845.75 1,807.63 - 9,038.12Garcia, Severino M. 200,000.00 133,336.00 - 66,664.00Garin, May C. 15,011.75 30,011.77011 - (15,000.02)02)Gella, Delia D. 200.00 - 200.00Gella, Frederick S. 25,122.75 27,122.85 - (2,000.10)Gemzon, Elena F. 464.50 5,483.00 2,292.<strong>17</strong> - 3,655.33Gervacio, Ma. Cristina SJ. 240.00 5,328.00 5,808.00 - (240.00)Gilera, Enrico G. 213,790.15 145,474.41 - 68,315.74Golloso, Helen E. 14,745.50 10,245.51 - 4,499.99Gomez, Rhia A. 1,000.00 1,025.00 - (25.00)Grasparil, James Andrew 35,004.39 36,579.39 - (1,575.00)Guarin, Ellen G. 400.00 - 400.00Gubio, James B. 16,477.00 14,077.00 - 2,400.00Guevarra, Dorvin H. 9,163.71 5,775.00 11,545.91 - 3,392.80Guevarra, Ma. Theresa M. 425.00 104.00 954.00 - (425.00)Gurrea, Ruby 1,214.00 1,014.00 - 200.00Gusi, Rechilda D. 310.00 1,746.55 1,235.15 - 821.40Gutierrez, Maria Myrel M. 15,000.00 7,500.00 - 7,500.00Hernandez, Jan Joseph S. 5,957.25 4,770.80 - 1,186.45Hilario, Gilbert P. 10,991.60 9,474.80 - 1,516.80Hilario, Jose S. 1,466.93 1,466.50 - 0.43Ignacio, Lourdes D. 54,000.00 37,534.24 60,542.67 - 30,991.57Iguas, Jose A. 190.00 55,370.33 44,452.63 - 11,107.70Inciong, Cherry Wyne 15,551.00 15,074.00 - 477.00Indico, Julie Ann 348.50 2,776.96 2,776.96 348.50Isidro, Teresita L. 15,780.50 11,539.50 - 4,241.00Israel, Marietta C. 5,573.40 26,138.42 13,209.90 - 18,501.92Jamon, Romano M. 400.00 200.00 - 200.00Jarlos, Anna Liza 10,483.00 6,827.67 - 3,655.33Javier, Mary Jacquelou 200.00 - 200.00Jayme, Fatima Winniclare Q. 31.25 20,450.00 481.25 - 20,000.00Jerusalem, Violeta L. 70,502.00 196,789.76 221,554.48 - 45,737.28Jesus, Angelita SD. 502.50 10,436.00 6,551.83 - 4,386.67Jose, Angelina P. 341,383.87 - 341,383.87
Kenny Isabel 50,000.00 - 50,000.00Kuan, Robert 543,032.13 - 543,032.13Labartine, Elvira C. 10,250.00 7,750.00 - 2,500.00Lacsamana, Recuerdo G. 12,000.00 9,750.00 - 2,250.00Lakian, Teodosio 21,706.63 23,356.63 - (1,650.00)Lamorena, Juditha M. 120.00 127,000.00 85,120.00 - 42,000.00Lansang, Brenda 6,050.00 5,400.00 - 650.00Lapastora, Milagros 574.95 48,371.75 42,281.70 - 6,665.00Lauro, Jocelyn P. 68,199.00 58,400.00 - 9,799.00Lazaro, Maria Teresita A. 14,274.00 72,518.94 66,033.45 - 20,759.49Lee, Nestor 260.00 20,473.31 16,346.64 - 4,386.67Leon, Emma Rose H. 61,381.00 57,640.00 - 3,741.00Leon, Jocelyn E. 7,881.75 6,707.00 12,395.41 - 2,193.34Leonin, Clarito 200.00 200.00Lepon, Ma. Luisa M. 6,000.00 13,023.75 18,773.75 - 250.00Letrero, Bernard 14,325.00 12,775.00 - 1,550.00Liggayu, Michael 750.00 250.00 750.00 - 250.00Lim, Royce Randall 200.00 - 200.00Limon, Miguel Antonio P. 350.00 3,391.88 3,641.88 - 100.00Lindo, Alicia C. 3,952.50 45,748.80 34,077.30 - 15,624.00Lluz, Samarlita N. 7,378.75 6,189.38 - 1,189.37Lopez, Anastacio L. 454.00 10,000.00 6,954.00 - 3,500.00Lopez, Antonio C. 33,000.00 16,988.91 23,744.29 - 26,244.62Lopez, Jomelyn G. <strong>17</strong>,000.00 10,200.00 - 6,800.00Lopez, Ricardo S. 1,251.50 37,279.80 22,639.50 - 15,891.80Loyola, Voltaire 72.00 - 72.00Lumacad, Fernando B. 380.0000 32,939.00 65,858.00 - (32,539.00)Luyun, Teofilo P. Jr. 27,315.00 18,868.06 - 8,446.94Mabborang, Mishel T. 200.00 - 200.00Macapagal, Arnualdo B. 598.50 <strong>17</strong>2,850.00 127,498.00 - 45,950.50Macasaet, Grace Minerva 16,738.00 15,694.00 - 1,044.00Maclang, Edwin V. 5,477.00 5,000.00 - 477.00Madria, Emenvenciano 650.00 - 650.00Madriaga, Joventina D. 6,138.00 1,188.00 - 4,950.00Mahilum, Rosalinda S. 1,066.70 866.70 - 200.00Maliwat, Herminia I. 3,277.00 1<strong>17</strong>,436.63 8,568.32 - 112,145.31Manalansan, Paolo F. 19,546.00 13,296.00 - 6,250.00Manguerra, Laarni C. 32,000.00 31,000.00 - 1,000.00Manuel, Cynthia DR. 14,750.00 11,416.66 - 3,333.34Marcelo, Gerry A. 19,236.00 14,849.33 - 4,386.67Marcial, Johnny O. 63,156.60 46,026.13 - <strong>17</strong>,130.47Marcial, Maridel S. 5,311.00 34,838.00 25,704.49 - 14,444.51Maristela, Teresita 215.00 215.00Mazo, Flaviano S. 6,731.77 24,000.00 20,950.00 - 9,781.77Mazo, Reynaldo jr. S. 19,000.00 9,500.00 - 9,500.00Medina, Buenaventura Jr. 1,050.00 1,050.00Medina, Joy E. 11,151.00 10,551.00 - 600.00Melano, Petronio A. 14,506.00 8,665.20 - 5,840.80Mendoza, Cecilia H. 200.00 - 200.00Mendoza, Ferdinand M. 20,080.00 18,813.34 - 1,266.66Mendoza, Norberto M. 20,400.00 20,500.00 - (100.00)Menez, Karren G. 2,607.50 41,842.40 38,449.90 - 6,000.00Mesina, Karen T. 56,844.00 60,844.00 - (4,000.00)Mitra, Melvin P. 1,290.00 875.00 1,612.65 - 552.35Molina, Mark Oliver P. 9,830.00 3,250.00 - 6,580.00Monfero, Rowena A. 12,847.25 6,847.25 - 6,000.00Montano, Moses M. 5,441.67 4,500.00 - 941.67Montinola, Aurelio R. III 274,838.73 - 274,838.73
Montinola, Gianna R. 387,795.94 - 387,795.94Montinola, Lourdes R. 1,800,488.76 - 1,800,488.76Morilla, Toriana A. 850.00 - 850.00Mostajo, Esmeralda D. 10.00 28,404.50 16,414.50 - 12,000.00Nagal, Glenn Z. 298,190.00 298,189.67 - 0.33Nagtalon, Leo Angelo 640.00 640.00Najjar, Mary Chastine T. 10,815.50 7,684.70 - 3,130.80Naui, Elizabeth S. 5,384.75 5,478.50 - (93.75)Navarro, Lilibeth C. 200.00 - 200.00Nebril, Jonathan A. 12,400.00 7,400.00 - 5,000.00Nicdao, Lazaro B. 11,228.16 2,469.36 - 8,758.80Nicer, Joselito C. 2,655.00 59,238.70 39,620.98 - 22,272.72Nicolas, Crispinita 6,393.81 6,203.81 - 190.00Nieto, Rowena H. 180.00 672.00 628.00 - 224.00Nob, Rene M. 20,000.00 21,800.00 - (1,800.00)Noriega, Mariwilda 7,525.30 80,642.95 76,551.49 - 11,616.76Noveno, Ruena O. 30,200.00 30,400.00 - (200.00)Nuestro, Sarah A. 666.70 516.70 - 150.00Nulla, Mila R. 35,365.76 52,844.00 44,352.76 - 43,857.00Oaferina, Gemmalyn A. 10,721.00 11,721.04 - (1,000.04)Ocampo, Dhean R. 11,783.34 5,000.00 16,833.40 (50.00) (50.06)Odon, Luke Mark 45.00 90.00 - (45.00)Oliver, Michael 30,000.00 14,310.24 15,689.76Ondevilla, Miel Kristian 9,100.00 4,600.00 - 4,500.00Orias, Ronito B. 4,000.00 - 4,000.00Orolfo, Teodora C. 1,276.50 57,500.00 47,592.50 - 11,184.00Ortiz, Jose R. 59.38 - 59.38Ortiz, Milixa Lourdes B. <strong>17</strong>0.00 16,900.00 <strong>17</strong>,129.38 - (59.38)Pacquing, Elizabeth P. 694.50 26,713.34 23,021.<strong>17</strong> - 4,386.67Padilla, Leo A. 348.50 348.50Paguibitan, Rebecca V. 850.00 1,500.00 - (650.00)Paguio, Ernesto B. 290.00 51,972.00 51,590.00 - 672.00Pahutan, Ludivinia M. 9,882.30 10,882.30 - (1,000.00)Pal, Salvacion A. 930.00 10,000.00 930.00 - 10,000.00Palaje, Joseph M. 200.00 400.00 200.00 - 400.00Palencia, Marjueve M. 14,391.00 15,391.00 - (1,000.00)Palenzuela, Delia S. 19,200.00 526.75 19,200.00 - 526.75Palis, Fernando F. 770.05 7,500.00 6,020.05 - 2,250.00Pangilinan, Genice R. 10,023.50 35,672.00 27,471.50 - 18,224.00Pantas, Felix L. Jr. 4,063.00 13,350.00 11,920.99 - 5,492.01Panzo, Salome V. 1,087.50 362.50 - 725.00Paras, Renato 107,8<strong>17</strong>.84 - 107,8<strong>17</strong>.84Pascua, Jennifer J. 5,300.00 650.00 - 4,650.00Pascual, Danilo S. 10,825.00 1,650.00 - 9,<strong>17</strong>5.00Pataunia, Ma. Cecilia C. 200.00 1,783.50 - (1,583.50)Paulino, Oscar E. 200.00 92,005.25 22,725.44 - 69,479.81Paz, Rosalinda Z. 2,979.34 34,871.50 24,690.84 - 13,160.00Pening, Teodoro 12,786.50 2,131.08 - 10,655.42Perez, Hector 7,820.00 41,700.00 47,353.34 - 2,166.66Perez, Winnie E. 50.00 29.00 129.00 - (50.00)Pineda, Rodolfo G. 400.00 24,378.34 25,433.59 - (655.25)Pizaro, Arthur P. 9,000.00 4,500.00 - 4,500.00Polido, Angelita E. 42,922.34 40,969.54 - 1,952.80Ponsaran, Levy C. 12,250.00 10,750.00 - 1,500.00Presas, Heinrich G. 10,650.00 13,150.00 - (2,500.00)Prudencio, Philip I. 5,000.00 32,445.75 36,927.88 - 5<strong>17</strong>.87Rada, Nedi P. 30,224.00 25,224.00 - 5,000.00Ragasa, Samuel M. 45,050.05 37,040.08 - 8,009.97
Ramisan, Georgie R., 216.70 316.70 - (100.00)Ramones, Marigrace M. 33,367.00 1,625.00 36,335.66 - (1,343.66)Ramos, Bernadette 39,000.00 - 39,000.00Ramos, Henry C. 29,087.50 20,087.50 - 9,000.00Ramos, Norberto M. 100.00 250.00 250.00 - 100.00Rapirap, Raquel T. 107,140.00 48,003.33 - 59,136.67Remiendo, Nora Liza A. 2,333.33 29,826.50 29,826.49 - 2,333.34Resuello, Heidi 123.50 200.00 123.50 - 200.00Reyes, Cecil G. 200.00 - 200.00Reyes, Melodia S. 18,160.00 9,386.67 - 8,773.33Reyes, Mercedes C. 4,050.75 35,646.30 22,660.45 - <strong>17</strong>,036.60Reyes, Richard R. 200.00 1,831.50 2,243.50 - (212.00)Reyes, Rosa M. 1,627.25 1,627.00 - 0.25Rico, Edna S.A. 32,842.00 25,241.00 - 7,601.00Rimano, Joy S. 7,831.50 5,341.50 - 2,490.00Robinos, Josephine D. 1,492.00 1,037.50 - 454.50Roque, Nelson Leo O. 64,147.02 49,147.02 - 15,000.00Rosario, Enrico 450.00 150.00 - 300.00Rosario, Warly Evelyn 4,400.25 19,134.75 13,246.04 - 10,288.96Ruzol, Hipolito 850.00 - 850.00Sabas, Angel Francisco 210.10 2,075.60 1,672.90 - 612.80Salvador, Paulino 50.00 50.00Sanchez, Leilani D. 575.00 558.30 - 16.70San Pablo, Ma. Cecilia A. 4,077.00 4,479.25 - (402.25)Santos, Leonida 4,875.00 19,853.00 11,568.00 - 13,160.00Sanvictores, Cielito S. <strong>17</strong>,790.44 5,679.09 - 12,111.35Saplala, Mariano F. 6,580.00 00 2,193.33 33 - 4,386.6767Sarabia, Julieta 78,277.16 56,109.75 - 22,167.41Savella, Marilyn S. 975.00 600.00 - 375.00Sayat, Carmelo D. 15,042.00 9,042.00 - 6,000.00Sido, Ma. Victoria P. 1,200.00 7,107.50 1,7<strong>17</strong>.50 - 6,590.00Simo, Rickson Jay P. 200.00 - 200.00Sinang, Rolando R. 24,040.00 22,040.00 - 2,000.00Sison, Erlinda G. 13,935.70 8,070.93 - 5,864.77Sison, Roger Amadeo 290.00 40,450.00 41,030.00 - (290.00)Sison, Waltedrudes M. 1,862.40 - 1,862.40Songco, Dionisio L. 4,487.25 2,243.63 - 2,243.62Soreta, Loida R. 27,000.00 22,700.00 - 4,300.00Soriano, Carol Bongar 1,046.00 200.00 200.00 1,246.00Soriano, Myla Grace 200.00 200.00Sta.Cruz, Cinderella A. 62,581.40 66,781.40 - (4,200.00)Sta. Maria, Amelia M. 5,750.00 750.00 - 5,000.00Sta.Maria, Hipolito M. 42,000.00 29,400.00 - 12,600.00Suba, Sally Chua 90,907.54 38,240.89 - 52,666.65Tagle, Susan H. 3,837.55 207,325.21 180,962.74 - 30,200.02Talampas, Ma. Cristina J. 3,434.25 60,000.00 35,616.05 - 27,818.20Tamondong, Ivy 200.00 200.00Tampol, Eduardo 220.00 220.00Tan, Paulino 50,000.00 - 50,000.00Tapalgo, Elyn M. 6,770.00 6,180.00 - 590.00Tapit, Neila E. 51,140.00 45,060.00 - 6,080.00Taragua, Alma Trinidad R. 300.00 116,314.86 112,414.86 - 4,200.00Taruc, Pancho V. 1,673.32 1,489.98 - 183.34Tecson, Wilfrido 50,000.00 - 50,000.00Timogan, Raymundo P. <strong>17</strong>,300.00 37,789.55 46,098.26 - 8,991.29Tirazona, Renato L. 10,005.00 41,812.25 39,805.<strong>17</strong> - 12,012.08Tizon, Dolores J. <strong>17</strong>,455.00 15,261.66 - 2,193.34Togado, Illumar 13,252.05 11,252.05 - 2,000.00
Tolentino, Honey Chile 61,802.44 44,374.75 - <strong>17</strong>,427.69Torres, Maruja 414.00 - 414.00Trinidad, Aristotle R. 400.00 200.00 - 200.00Umpad, Mara 120,000.00 72,000.00 - 48,000.00Urquico, Ma. Luisa 666.00 666.00Valderrama, Ruth D. 22,811.75 21,400.88 - 1,410.87Valeza, Ariel R. 19,100.00 14,100.00 - 5,000.00Vallo, Mary Rose C. 24,763.75 24,938.75 - (<strong>17</strong>5.00)Vasquez, Vilma S. 15,374.00 12,224.00 - 3,150.00Velasco, Maria Luisa R. 200.00 - 200.00Velasquez, Damian D. 41,000.00 45,100.00 - (4,100.00)Velasquez, Ma. Charisma B. 30,999.80 29,999.80 - 1,000.00Velasquez, Willyn V. 5,253.50 1,253.50 - 4,000.00Vera, Alpher 10,200.00 35,523.60 35,723.60 10,000.00Vera, Brenda 10,100.00 100.00 - 10,000.00Vera, Michael R. 21,785.89 16,785.89 - 5,000.00Vergara, Febes 200.00 - 200.00Vicera, Reynante P. 20,000.00 21,300.00 (1,300.00) (1,300.00)Victortia, Michael S. 5,958.67 20,455.50 <strong>17</strong>,640.84 8,773.33 8,773.33Victoria, Wendelliza M. 6,426.80 24.00 6,402.80 6,402.80Villanueva, Ruth 650.00 - 650.00Villapando, Marimel A. 350.00 400.00 - (50.00)Villaroya, Robinson L. 20,000.00 24,000.00 - (4,000.00)Vinluan, Lourdes R. 2,371.90 9,790.75 10,209.31 - 1,953.34Vinluan, Renato A. 5,225.00 350.00 700.00 - 4,875.00Yap, Donato C. 200.00 200.00Yatco, Maria Carmen 47,700.00700 27,908.31 - 19,791.69Ymas, Sergio S. Jr. 8,367.41 8,567.41 - (200.00)Ysla, Mark Salvador 5,000.00 - 5,000.00Zaldivar, Felicia P. 63,460.45 59,338.11 - 4,122.34Zape, Vida Edna C. 6,676.00 52,449.25 39,707.55 - 19,4<strong>17</strong>.70-876,663.71 13,165,792.66 7,413,855.71 70,086.85 6,628,600.66--Alvarez, Alfredo 4,000.00 2,000.00 - 2,000.00Ampatin, Estrella V. 162,319.00 70,692.44 205,791.44 - 27,220.00Cabasada, Albert R. 22,038.00 107,700.00 121,623.64 - 8,114.36Faustino, Jose V. 14,360.00 224,701.73 185,820.00 - 53,241.73Mendoza, Malaya 7,650.00 - 7,650.00Molina, Mark Oliver P. 37,000.00 600,069.28 787,376.89 - (150,307.61)Quines, Dante P. 300.00 - 300.00Rapirap, Raquel T. 66,380.00 69,352.00 - (2,972.00)Rosal, Josefina T. 3,000.00 2,000.00 - 1,000.00Santos, Florentino I. 144,840.00 55,865.25 196,310.34 - 4,394.91Sinang, Rolando 2,000.00 2,000.00 3,000.00 - 1,000.00-382,557.00 1,142,358.70 1,573,274.31 - (48,358.61)--TOTAL - 1131012 1,259,220.71 14,308,151.36 8,987,130.02 70,086.85 6,580,242.05
FAR EASTERN UNIVERSITY, INC. AND SUBSIDIARIESSCHEDULE C - NONCURRENT MARKETABLE EQUITY <strong>SEC</strong>URITIES,OTHER LONG-TERM INVESTMENTS IN STOCKS AND OTHER INVESTMENTSFOR THE YEAR ENDED MARCH 31, 2009ANNEX C.1.3Name of Issuing Entity andDescription of Each InvestmentBEGINNING BALANCEADDITIONS (DEDUCTIONS)ENDING BALANCEDividendsNumber of Number of Number of Received/AccruedShares or Shares or Equity in Earnings Shares or from InvestmentsPrincipal Principal Dividends (Losses) of Principal Not AccountedAmount of Bonds Amount of Bonds Received/ Investees for the Amount of Bonds Percentage for by the Equityand Notes Amount in Pesos and Notes Amount in Pesos (Declared)Periodand Notes Amount in Pesos Ownership MethodInvestment - Juliana Mngt. (associate) 43,659 7,878,121 - - 43,659 7,878,121 49.00%P 7,878,121 P - P - P - P 7,878,121 --
FAR EASTERN UNIVERSITYSCHEDULE E - NON-CURRENT ASSETSFOR THE YEAR ENDED MARCH 31, 2009DescriptionBeginningBalanceAdditionsat CostCharged to Costsand ExpensesDeductionsCharged toOther AccountsOther Changes-Additions(Deductions)EndingBalanceGoodwill 12,352,684 12,352,684Surety Bond 2,833,600 2,833,600Marketable Securities 2,530,373 2,530,373Club membership shares 1,000,000 1,000,000Cash bond 134,833 134,835Long-term refundable deposit 100,000 100,000Other long-term investment 7,200,000 7,200,000P 2,630,373 P 7,200,000 P - P - P - P 26,151,492
FAR EASTERN UNIVERSITYSCHEDULE I - CAPITAL STOCKFOR THE YEAR ENDED MARCH 31, 2009Number of shares held byTitle of Issue 2 Number of sharesauthorizedNumber of shares issuedand outstanding asshown under the relatedbalance sheet captionNumber of sharesreserved for options,warrants, coversion andother rightsRelated parties 3Directors, officers and employees10,000,000 7,006,368 Board of trustees 598,697Issuance during the year 2,802,080 Officers 39,3199,808,448 Employees/Faculty 16,1591Indicate in a note any significant changes since the date of the last balance sheet filed.2Include in this column each type of issue authorized.3Affiliates referred to include affiliates for which separate financial statements are filed and those included in consolidated financial statements, other than the issuer of the particular security.5
- 21 -Item 8:Changes in and Disagreements with Accountants on Accounting andFinancial DisclosureThere has been no recent change in and disagreement withAccountants on accounting and financial disclosure.PART III - CONTROL AND COMPENSATIONItem 9.Trustees and Executive OfficersName Ages Citizenship PositionLourdes R. Montinola 81 Filipino Chair, Board ofTrusteesAurelio R. Montinola III 57 Filipino Vice Chair,Board of TrusteesLydia B. Echauz 61 Filipino President/TrusteeAngelina P. Jose 56 Filipino Corporate Secretary/TrusteePaulino Y. Tan 62 Filipino TrusteeGianna R. Montinola 51 Filipino TrusteeRenato L. Paras 82 Filipino TrusteeWilfrido C. Tecson 86 Filipino Independent TrusteeRobert F. Kuan 60 Filipino Independent TrusteeElizabeth P. Melchor 52 Filipino Vice President forPlanning andDevelopmentMiguel M. Carpio 54 Filipino Vice President forAcademic AffairsFe V. Canilao 63 Filipino Chief Financial OfficerHerminia I. Maliwat 60 Filipino TreasurerGlenn Z. Nagal 51 Filipino ComptrollerSeverino M. Garcia 60 Filipino Compliance Officer
TRUSTEES AND EXECUTIVE OFFICERS:- 22 -1. Lourdes R. Montinola, 81, Filipino: Chair of the Board of Trustees of <strong>Far</strong> <strong>Eastern</strong><strong>University</strong>, Inc. (June 1989 to present)Other Corporate Affiliations: Chair, Board of Directors, FERN Realty Corporation; Chairand President, FEU Educational Foundation, Inc.; Chair, Nicanor Reyes EducationalFoundation; Chair, Executive Committee, <strong>Far</strong> <strong>Eastern</strong> <strong>University</strong>, Inc.; Governor,Nicanor Reyes Memorial Foundation; Trustee, FEU-Dr. Nicanor Reyes MedicalFoundation; Trustee, AY Foundation, Inc.; Member, Museum Foundation of the<strong>Philippine</strong>s, Oriental Ceramic Society, Heritage Conservation Society, Asia Society, &<strong>Philippine</strong> Textile Society.Dr. Montinola holds a Bachelor of Arts degree (cum laude) from Marymount College,New York, U.S.A., and an M. A. in Cultural History from the Asean Graduate Institute ofArts. She completed the Management Development Program for College and <strong>University</strong>Administrators in the Institute for Educational Management, Graduate School ofEducation, Harvard <strong>University</strong>, U.S.A. She obtained her Ph. D. in English: CreativeWriting from the <strong>University</strong> of the <strong>Philippine</strong>s.2. Aurelio Montinola III, 57, Filipino: Vice Chairman of the Board of Trustees,<strong>Far</strong> <strong>Eastern</strong> <strong>University</strong>, Inc. (June 1989 to present)President and Chief Executive Officer of Bank of the <strong>Philippine</strong> Islands and President,Bankers Association of the <strong>Philippine</strong>s. His other affiliations, among others, include:Chairman of the Board of Directors of Amon Trading Corporation; Vice Chairman of theBoard of Directors of Republic Cement Corporation; Chairman of East Asia EducationalFoundation, Inc.; Regional Board of Advisers, MasterCard International; Director, AyalaLand, Inc.; President, BPI Foundation, Inc.; Member, Makati Business Club; andMember, Management Association of the <strong>Philippine</strong>s.He graduated with a BS Management Engineering degree at the Ateneo de Manila<strong>University</strong> in 1973, and received his MBA at Harvard Business School in 1977.3. Lydia B. Echauz, 61, Filipino: President (June 2003 to present) and Member ofthe Board of Trustees, <strong>Far</strong> <strong>Eastern</strong> <strong>University</strong>, Inc. (1999 to present)Appointed Acting President of <strong>Far</strong> <strong>Eastern</strong> <strong>University</strong> in October 2002. At present she isPresident, FEU-East Asia College; President, FEU-FERN College; President, East AsiaEducational Foundation, Inc.; Member, Board of Directors of FERN Realty Corporation;Governor, Nicanor Reyes Memorial Foundation; and Member, Executive Committee,<strong>Far</strong> <strong>Eastern</strong> <strong>University</strong>, Inc. She is immediate past President of the Association ofSoutheast Asian Institutes of Higher Learning – <strong>Philippine</strong> Council; Director of the<strong>Philippine</strong> Association of Colleges and Universities, and Member of the ManagementAssociation of the <strong>Philippine</strong>s. She was Dean of the Graduate School of Business,De La Salle <strong>University</strong> Professional Schools, Inc., from September 1986 to May 2002;former Associate Director of the MBA program, Ateneo de Manila <strong>University</strong> GraduateSchool of Business for seven years; also Associate Professor of the College of BusinessAdministration, <strong>University</strong> of the East, for twelve years.
- 23 -Dr. Echauz is a Bachelor of Arts, major in Economics and Mathematics fromSt. Theresa’s College, MBA from Ateneo de Manila <strong>University</strong>, and DBA fromDe La Salle <strong>University</strong>.4. Angelina Palanca Jose, 56, Filipino: Trustee (1990 to present) and CorporateSecretary, <strong>Far</strong> <strong>Eastern</strong> <strong>University</strong>, Inc. (1998 to present)Other Corporate Affiliations: Member, Board of Directors, FERN Realty Corporation;Secretary, Treasurer and Trustee, Nicanor Reyes Educational Foundation; CorporateSecretary and Trustee, FEU Educational Foundation Inc.; Corporate Secretary andGovernor, Nicanor Reyes Memorial Foundation; and member, Executive Committee, <strong>Far</strong><strong>Eastern</strong> <strong>University</strong>, Inc.Ms. Jose obtained her Bachelor of Science degree, major in Economics, from the<strong>University</strong> of the <strong>Philippine</strong>s (Dean’s Medal).5. Paulino Y. Tan, 63, Filipino: Trustee, <strong>Far</strong> <strong>Eastern</strong> <strong>University</strong>, Inc. (1991 to present)Other Business Experience: President of Asia Pacific College; IT Services Consultant,SM (Shoemart) Inc. At present, member of the Board of Directors/Trustees of thefollowing companies: Nicanor Reyes Educational Foundation, Inc., FEU EducationalFoundation, Inc., East Asia Educational Foundation, Inc., Lyceum of Batangas, Lyceumof Laguna, Foundation for Upgrading the Standard of Education (FUSE), SM (Shoemart)Foundation, Inc., Asia Pacific Technology Educational Foundation, and FERN RealtyCorporation.Dr. Tan obtained the Degree of Bachelor in Science in Chemical Engineering (summacum laude) from De La Salle <strong>University</strong>. He topped the Chemical Engineering BoardExamination and obtained both his M. S. and Ph.D. in Chemical Engineering from the<strong>University</strong> of Notre Dame, Indiana, U.S.A.6. Gianna R. Montinola, 51, Filipino: Trustee of <strong>Far</strong> <strong>Eastern</strong> <strong>University</strong>, Inc. (1989-1993 and 1996 to present)Concurrently Director and Corporate Secretary of FERN Realty Corporation andConsultant for Marketing and Communications of <strong>Far</strong> <strong>Eastern</strong> <strong>University</strong>. A lawyer byprofession, she was connected with the Quisumbing, Torres and Evangelista Law Office(an affiliate of the Baker & McKenzie Law Office, U.S.A.) from 1986 to 1992. She servedas <strong>Philippine</strong> Honorary Consul to the Republic of Peru from 1992 to 1996, and joinedthe Marketing and Business Development departments of Rockwell Land Corporationfrom 1996 to 1998. She is a member of the Board of Directors and Corporate Secretaryof Amon Trading Corporation and a Director of True Value Hardware Corporation. Sheis also a co-founder and member of the Board of Trustees of Hands On ManilaFoundation, Inc.She obtained her Bachelor of Arts degree in International Relations from Mount HolyokeCollege, USA and a Bachelor of Laws (Ll.B.) degree, with honors, from the Ateneo deManila College of Law.
- 24 -7. Renato L. Paras, 83, Filipino: Trustee of <strong>Far</strong> <strong>Eastern</strong> <strong>University</strong>, Inc. (1989-1991and 2002 to present)Other Corporate Affiliations: Chair of CHEMREZ Technologies and of <strong>Philippine</strong>Ratings; Vice Chair of CIBI Foundation and East Asia Educational Foundation, Inc. Heis also a member of the Board of Directors/Trustees of the following: FERN RealtyCorporation, CIBI Information, Inc., Insular Life Health Care, IBM <strong>Philippine</strong>s RetirementFund Committee and is Asia Pacific Regional Treasurer of the World Organization ofScout Movement. Dr. Paras was a member of the Central Bank Monetary Board, wasalso Board Director and CFO of Procter & Gamble <strong>Philippine</strong>s, and Consultant onInternal Auditing to CFO of San Miguel Corporation.Dr. Paras is a Certified Public Accountant. He topped the CPA Board Exam in 1948. Hefinished his Bachelor of Science in Accountancy in FEU in 1949 (summa cum laude),and earned his Master of Science in Accountancy at Columbia <strong>University</strong> in New York asan FEU scholar. He took up an Advanced Management Program conducted by theHarvard Graduate School of Business Faculty. In the year 2000, he was conferred anhonorary degree of Doctor of Humanities by FEU. He is listed in the Accountancy Hall ofFame.8. Wilfrido C. Tecson, 86, Filipino: Trustee (1989-2001) and Independent Trustee,<strong>Far</strong> <strong>Eastern</strong> <strong>University</strong> (2001 to present)Banking Experience: Co-founded Solid Bank and assumed positions of President, CEOand Vice Chairman until he retired; served as Vice President of China BankingCorporation and as President and Vice Chairman of Equitable Banking Corporation.At present, he is a Director of the Lepanto Mining Corporation. He is founding Treasurerof the Hero Foundation, Inc. and the Museong Pambata, and is a member of the Boardof Trustees of the YMCA.Dr. Tecson graduated with the degree of Bachelor of Science in Commerce, major inAccounting (summa cum laude) from FEU, and was conferred the degree of Doctor ofBusiness Management (honoris causa) by FEU in 1993.9. Robert F. Kuan, 60, Filipino: Independent Trustee of <strong>Far</strong> <strong>Eastern</strong> <strong>University</strong>, Inc.(2004 to present)Other Business Affiliations: Chairman, St. Luke’s Medical Center; Trustee, St. Luke’sCollege of Medicine–William H. Quasha Memorial; Trustee, BRENT International Schoolof Manila; Director, China Banking Corporation; Founder/President, Chowking FoodCorporation (1985 – 2000).Mr. Kuan graduated from the <strong>University</strong> of the <strong>Philippine</strong>s (1970) with a degree ofBachelor of Science in Business Administration. In 1975, he earned his Masters inBusiness Management from the Asian Institute of Management (AIM). In 1993, he tookup the Top Management Program at AIM, a program exclusively for company Presidentsand Chief Executive Officers. He was a TOFIL (The Outstanding Filipino) Awardee in2003 in the field of Business & Entrepreneurship; Agora Awardee for Entrepreneurship;Triple-A Awardee of AIM; and Outstanding Alumnus of the <strong>University</strong> of the <strong>Philippine</strong>s(UP) in the field of Business.
- 25 -10. Miguel M. Carpio, 54, Filipino: Vice-President for Academic Affairs, <strong>Far</strong> <strong>Eastern</strong><strong>University</strong>, Inc. (April 2008 to present)Other Professional Experience: Founding member and incorporator, UST College ofArchitecture Alumni Association and the Council of Architectural Researchers andEducators; Chairman, CHED Technical Committee on Architecture and Member,Regional Assessment Team for Architecture; Fellow, United Architects of the <strong>Philippine</strong>s(UAP); Director, UAP Sta. Mesa Chapter; Member, <strong>Philippine</strong> Institute of EnvironmentalPlanners; Executive Director, Commission on Education of the UAP (2002 to 2004);President of the Council of Deans and Heads of Architecture Schools in the <strong>Philippine</strong>sor CODHASP (2003 to 2005); Secretary, National Committee on Architecture and AlliedArts of the National Commission on Culture and the Arts (NCCA) (2003 to 2007);Member, National Real Estate Association, Inc.; Dean, FEU Institute of Architecture andFine Arts (November 2000 to March 2008); Executive Director, FEU Center for Studieson the Urban Environment or FEU-SURE (2000 to 2002).Arch./En.P. Carpio is a registered and licensed Architect and Environmental Planner.He graduated with the degree of Bachelor of Science in Architecture from the <strong>University</strong>of Santo Tomas and earned a Master of Environmental Management and Developmentdegree from the Australian National <strong>University</strong> in Canberra, Australia. He also earnedacademic units in the Master in Urban and Regional Planning from the <strong>University</strong> of the<strong>Philippine</strong>s. He is currently working on his dissertation in the Ph.D. in DevelopmentStudies at the <strong>University</strong> of Santo Tomas.11. Elizabeth P. Melchor, 52, Filipino: Vice President for Planning and Development,<strong>Far</strong> <strong>Eastern</strong> <strong>University</strong>, Inc. (April 2008 to present)Other Professional Experience: Trustee, FEU-Nicanor Reyes Medical Foundation;Governor, Nicanor Reyes Memorial Foundation; Trustee, East Asia EducationalFoundation, Inc.; Vice-President, Alejandro Melchor Jr. Memorial Foundation; Trusteeand Officer, Cradle of Joy Learning Center; Member, Commission on Tertiary Education,<strong>Philippine</strong> Accrediting Association of Schools, Colleges and Universities (PAASCU);Dean, Registrar and Outstanding Teacher Awardee, Assumption College, Makati;Visiting Professor, Huaqiao <strong>University</strong>, Quanzhou, China; Scholar, Beijing LanguageInstitute; Chapter Head, Haggai Institute of Advanced Leadership; Vice President forAcademic Affairs, <strong>Far</strong> <strong>Eastern</strong> <strong>University</strong>, Inc. (2004 to 2008).Dr. Melchor holds a Bachelor of Science degree, major in Physics (College Scholar),and a Master of Science, major in Physics, from the <strong>University</strong> of the <strong>Philippine</strong>s,Diliman. She earned her doctorate degree in Education from the California Coast<strong>University</strong> in Santa Ana, California, U.S.A.12. Fe V. Canilao, 63, Filipino: Chief Financial Officer, <strong>Far</strong> <strong>Eastern</strong> <strong>University</strong>, Inc.(1996 to present)Other Business Experience: Served as Vice President for Finance prior to her currentposition. At present, Vice President of FERN Realty Corporation; Alternate Member,Executive Committee, and Investor Relations Officer, <strong>Far</strong> <strong>Eastern</strong> <strong>University</strong>, Inc.;Trustee and Treasurer, East Asia Educational Foundation, Inc.; Assistant CorporateSecretary, Nicanor Reyes Educational Foundation and the FEU Educational Foundation,Inc.
- 26 -Ms. Canilao, a Certified Public Accountant, earned her Bachelor of Science in BusinessAdministration from the <strong>Philippine</strong> Women’s <strong>University</strong> and her MBA from FEU.13. Herminia I. Maliwat, 60, Filipino: Treasurer, <strong>Far</strong> <strong>Eastern</strong> <strong>University</strong>, Inc. (1998 topresent)Ms. Maliwat is a Certified Public Accountant. She obtained her BS in Accounting, cumlaude, from the <strong>University</strong> of the East.Before joining FEU, she worked as Chief Accountant for 10 years and Instructor for8 years at the College of the Holy Spirit, as Administrative and Finance Officer for16 years at the Asia Foundation, and as External Auditor for 10 years at theMother Edelwina Educational Foundation. She also served as Executive Director of theFEU Educational Foundation for three years and as 2007-08 Committee Chairperson onspecial projects of the <strong>Philippine</strong> Institute of Certified Public Accountants (PICPA).14. Glenn Z. Nagal, 51, Filipino: Comptroller, <strong>Far</strong> <strong>Eastern</strong> <strong>University</strong>, Inc. (1996 topresent)Work experience: External Auditor, Carlos J. Valdes and Company; Examiner, CentralBank of the <strong>Philippine</strong>s; Internal Audit Manager, <strong>Far</strong> <strong>Eastern</strong> <strong>University</strong>;Chief Accountant and Budget Director, <strong>Far</strong> <strong>Eastern</strong> <strong>University</strong>; Accounting Professor,<strong>Far</strong> <strong>Eastern</strong> <strong>University</strong>.A Certified Public Accountant by profession, Mr. Nagal graduated with the degree ofBachelor of Science in Commerce, major in Accounting from <strong>Far</strong> <strong>Eastern</strong> <strong>University</strong>.15. Severino M. Garcia, 60, Filipino: Compliance Officer, <strong>Far</strong> <strong>Eastern</strong> <strong>University</strong>, Inc.(January 21, 2003 to present)<strong>Form</strong>er Assistant Vice President – Audit.Mr. Garcia earned the degree of Bachelor of Science in Commerce, major in Accountingfrom FEU. A Certified Public Accountant, he worked in different companies as Auditor,Chief Accountant, Finance and Accounting Manager and Senior Financial Analyst.The members of the Board of Trustees of the Corporation are elected at the Annual <strong>Stock</strong>holders'Meeting to hold office until the next succeeding annual meeting, up to the time their respectivesuccessors shall have been elected and qualified.The officers are appointed or elected annually by the Board of Trustees at its organizationalmeeting, each to hold office until the corresponding meeting of the Board the following year or untila successor shall have been elected, appointed and qualified.Significant EmployeesThe corporation considers its entire work force as significant employees. Everyone is expected towork together as a team to achieve the corporation’s goals and objectives.
- 27 -Family RelationshipsThe Chair, Dr. Lourdes R. Montinola, is the mother of Mr. Aurelio R. Montinola III andAtty. Gianna R. Montinola, all of whom are members of the Board of Trustees.Item 10:Executive CompensationApril 1/2007 to April 1/2008 to April 1/2009 toMarch 31/2008 March 31/2009 March 31/2010NamePrincipal PositionLourdes R. Montinola Chair, Board of TrusteesLydia B. Echauz Trustee/PresidentAngelina P. Jose Trustee/Corporate SecretaryFe V. CanilaoChief Financial OfficerMiguel M. Carpio VP - Academic AffairsElizabeth P. Melchor VP - Planning and Development *Herminia I. Maliwat TreasurerSeverino M. Garcia Compliance Officer* Effective April 2008_____________ _____________ ____________P49,138,778.00 P62,797,434.00 P69,452,<strong>17</strong>7.00The compensation above presented are actual for the last two (2) completed fiscal years andthe estimate for the ensuing fiscal year ending March 31, 2010. Aggregate amount is P/181,388,389.00==============Compensation of DirectorsA. Standard ArrangementB. Other ArrangementThe members of the Board of Trustees of the corporation are receiving gasallowances for regular board/special board meetings attended. They are also entitledto bonuses at the end of the fiscal year at the discretion of the Board, while theofficers of the corporation are entitled to basic salaries, living allowance, specialfinancial assistance, fringe benefits, and also bonuses at the discretion of the Board.There are no other material terms or conditions of employment for contractualexecutive officers.Voting Trust HoldersThe Registrant is not a party to any voting trust agreement. No security holder of the Registrantholds a voting trust or other similar agreements.
- 28 -No information is available on all outstanding warrants or options held by the members of theBoard of Trustees and officers of the corporation.Summary Compensation TableSummary and Principal Position Year Salary Bonus Other AnnualCompensationLourdes R. MontinolaChair, Board of TrusteesLydia B. EchauzTrustee/PresidentAngelina P. JoseTrustee/Corporate SecretaryFe V. CanilaoChief Financial OfficerMiguel M. CarpioVP-Academic AffairsElizabeth P. MelchorVP-Planning and DevelopmentHerminia I. MaliwatTreasurerSeverino M. GarciaCompliance Officer- x - - x - - x - - x -- x - - x - - x - - x -- x - - x - - x - - x -- x - - x - - x - - x -- x - - x - - x - - x -- x - - x - - x - - x -- x - - x - - x - - x -- x - - x - - x - - x -Grand Total 2007-2008 P/ 34,155,384.21 P/ 14,983,394.18 - x -2008-2009 43,091,751.54 19,705,682.00 - x -2009-2010(est.)47,400,926.69 22,051,250.00 - x -
- 29 -Item 11:Security Ownership of Certain Beneficial Owners and ManagementBeneficial Owners of More Than 5% and 10% Securities as of March 31, 2009As of March 31, 2009, <strong>Far</strong> <strong>Eastern</strong> <strong>University</strong> does not have on record any person, party orentity who beneficially owns more than 5% and 10% of common stock except as set forth in thetable below:Title of ClassName, Address of RecordOwner and Relationship withIssuerCitizenshipNo. ofShares HeldPercentCommon Desrey, Incorporated 110 th Fl., Pacific Star Bldg.Cor. Makati & Gil Puyat Ave.Makati CityCommon Seyrel Investment andRealty Corporation 210 th Fl., Pacific Star Bldg.Cor. Makati & Gil Puyat Ave.Makati CityCommon Sysmart Corporation 3426 MKSE, Ayala AvenueMakati CityFilipino 784,800 8.0013Filipino 2,807,835 28.6267Filipino 2,068,068 21.0846All of the above are direct beneficial owners of the securities.1 Dr. Lourdes, R. Montinola as President is authorized to vote for the shares of the Corporation.2 Ibid3 Mr. Henry Sy Sr. as Chair of the Board will vote for the shares of the Corporation.
- 30 -Security Ownership of ManagementTitle of ClassCommonCommonCommonCommonCommonCommonCommonCommonCommonCommonCommonCommonCommonName of Beneficial OwnerLourdes R. MontinolaChair, Board of TrusteesLydia B. EchauzTrustee/PresidentAurelio R. Montinola IIIVice Chair, Board of TrusteesAngelina Palanca JoseTrustee/Corporate SecretaryWilfrido C. TecsonTrusteePaulino Y. TanTrusteeGianna R. MontinolaTrusteeRenato L. ParasTrusteeRobert F. KuanTrusteeElizabeth P. MelchorVP for Planning andDevelopmentFe V. CanilaoChief Financial OfficerHerminia I. MaliwatTreasurerGlenn Z. NagalComptrollerNumber ofShares andand Nature ofBeneficialOwnershipCitizenshipPercentOf Class115,404 - D Filipino 1.<strong>17</strong>665,919 - D Filipino 0.0603158,888 - D Filipino 1.6199311,374 - D Filipino 3.<strong>17</strong>4512 - I Filipino 0.0001212 - I Filipino 0.0001215,198 - D Filipino 0.154912 - I Filipino 0.000121 - I Filipino 0.00001<strong>17</strong>,862 - D Filipino 0.182120,997 - D Filipino 0.214156 - D Filipino 0.0057404 - D Filipino 0.0041Security of Ownership of Management as a GroupTotal Shares - 646,139Percentage - 6.5876%
- 31 -Item 12:Certain Relationship and Related TransactionsDuring the last two (2) years, the corporation or any of the members of the Board of Trusteeswas never a party or proposed to be a party in any related transaction.PART IV - Corporate GovernanceItem 13.Corporate Governance• The <strong>University</strong>’s compliance with <strong>SEC</strong> Memorandum Circular No. 2 datedApril 5, 2002, as well as all relevant circulars on Corporate Governancehas been monitored.• FAR EASTERN UNIVERSITY, its trustees, officers and employeescomplied with the leading practices and principles on good corporategovernance as embodied in the company’s Manual;• FAR EASTERN UNIVERSITY also complied with the appropriateperformance self-rating assessment and performance evaluation systemto determine and measure compliance with the Manual. Thecorporation’s evaluation system was approved by the Board of Trusteesat its meeting on March 16, 2004;• FAR EASTERN UNIVERSITY did not commit any major deviations fromthe provisions of its Manual. Our Corporate Governance ComplianceOfficer submitted his 2008 certification to the Securities and <strong>Exchange</strong>Commission on the extent of the company’s compliance with its manualon January 23, 2009.• All members of the Board of Trustees as well as Senior Managementofficers completed and were duly certified to have attended a specialseminar on Corporate Governance conducted by an entity accredited bythe Securities and <strong>Exchange</strong> Commission.• In October 2008, the university participated in the Corporate GovernanceSurvey using the Corporate Governance Scorecard prepared by theInstitute of Corporate Directors.• <strong>Far</strong> <strong>Eastern</strong> <strong>University</strong> shall continuously update our Manual onCorporate Governance in the form of supplements to incorporateadditional corporate governance related rules and regulations that arereleased, from time to time, by the Securities and <strong>Exchange</strong> Commissionand the <strong>Philippine</strong> <strong>Stock</strong> <strong>Exchange</strong>, Inc.
- 32 -PART V – EXHIBITS AND SCHEDULESItem 14 Exhibits and Reports on <strong>SEC</strong> <strong>Form</strong> <strong>17</strong>-C(a) ExhibitThe exhibits are not applicable to the company nor require any answer.(b) Report on <strong>SEC</strong> <strong>Form</strong> <strong>17</strong>-C1. Resolution approved at the Board of Trustees’ meeting held onApril 15, 2008:Appointment of Dean Miguel M. Carpio as Acting Vice-Presidentfor Academic Affairs, vice Dr. Elizabeth P. Melchor, who likewiseis appointed Acting Vice-President for Planning and Development.Report received on April 16, 2008.2. Resolution approved at the Board of Trustees’ meeting held onJune <strong>17</strong>, 2008:Declaration of P15.00/share cash dividend on record as ofJuly 7, 2008, payable on July 21, 2008.Report received on June 19, 2008.3. Resolutions approved at the Board of Trustees’ meeting held onAugust 19, 2008:<strong>Far</strong> <strong>Eastern</strong> <strong>University</strong>, Inc. associated itself with some of themembers of its Board of Trustees, Dr. Lourdes R. Montinola,Chair; Mr. Aurelio R. Montinola III, Vice Chair; Dr. Lydia B.Echauz, Trustee,; Ms. Angelina P. Jose, Trustee; Atty. Gianna R.Montinola, Trustee; Dr. Paulino Y. Tan, Trustee; Mr. Robert F.Kuan, Trustee and with Mr. Antonio R. Montinola, Consultant forSports and Dr. Elizabeth P. Melchor, Vice President for Planningand Development to form and establish a new educationalinstitution, the FAR EASTERN UNIVERSITY – SILANG, INC. withan authorized capital stock of One Hundred Million Pesos(P100,000,000.00) divided into One Million (1,000,000) shareswith a par value of P100.00 per share.<strong>Far</strong> <strong>Eastern</strong> <strong>University</strong> be designated one of its incorporators witha subscribed capital stock of P6,249,100.00 equivalent to 62,491shares of the paid-up capital stock of the new corporation.Report received on August 21, 2008.
- 33 -4. Resolutions approved at the Annual <strong>Stock</strong>holders’ meeting held onAugust 23, 2008:a. Minutes of the Annual Meeting on August 25, 2007;b. Academic Report of the President and Annual Report ofthe Chairman for fiscal year 2007-2008;c. Ratification and confirmation of the 40% stock dividendequivalent to 2,802,547 shares or P280,254,700.00approved by the Board of Trustees at its meeting held onMach 25, 2008, to all stockholders on record as ofSeptember 15, 2008 and payable on October 9, 2008.Fractional shares resulting from the aforementioned stockdividend shall be paid in cash by the corporation based onthe par value.d. Ratification and confirmation of the acts of the officers andtrustees in the furtherance of the matters covered by theannual report for fiscal year 2007-2008;e. Elected trustees and independent trustees for the fiscalyear 2008-2009;f. Appointment of Punongbayan and Araullo as ExternalAuditor for the fiscal year 2008-2009; andg. Vote of appreciation to the Board of Trustees, the officials,faculty and staff.Report received on August 27, 2008.5. Resolutions approved at the Organizational Meeting of the Board ofTrustees held on September 16, 2008:a. Elected Corporate and <strong>University</strong> Officials for the fiscalyear 2008-2009;b. Composition of the Executive Committee;c. Composition of the Audit and Corporate GovernanceCommittee;d. Composition of the Nomination Committee; ande. Composition of the Risk ManagementReport received on September <strong>17</strong>, 2008.
- 34 -6. Resolution approved at the Board of Trustees’ meeting held onDecember 16, 2008:Declaration of P15.00/share cash dividend on record as ofJanuary 08, 2009, payable on January 22, 2009.Report received on December 23, 2008.7. Resolution approved at the Board of Trustees’ meeting held onMarch <strong>17</strong>, 2009:Amendment of Article 1 of the Articles of Incorporation of<strong>Far</strong> <strong>Eastern</strong> <strong>University</strong> from:First. That the name of said corporation shall be –The <strong>Far</strong> <strong>Eastern</strong> <strong>University</strong>, IncorporatedTo henceforth read as follows:First. That the name of said corporation shall be –FAR EASTERN UNIVERSITY, INC. doing business under thename and style FAR EASTERN UNIVERSITYReport received on March 18, 2009.8. Resolution approved at the Board of Trustees’ meeting held on March <strong>17</strong>,2009:Designation of Atty. Gianna R. Montinola, Trustee, as ActingCorporate Secretary of the Corporation, for the duration of theleave of absence of Ms. Angelina P. Jose, Corporate Secretary,effective March 20, 2009.Report received on March 18, 2009.(c) Quarterly Reports:Ended June 30, 2008Received August 08, 2008Ended September 30, 2008Received November 13, 2008Ended September 30, 2008 (Amended)Received January 12, 2009Ended December 31, 2008Received February 13, 2009
- 35 -Business and General InformationI. Industry ProfileThe following are the dominant characteristics of the education industry:- The business of higher education in the country is in the hands of the privatesector.- There is an uneven distribution of colleges and universities across the regions.This connotes a problem of unequal access to higher education. This isevidenced by the high concentration of state and private colleges and universitiesin the National Capital Region and Southern Tagalog Regions.- Statistics show a high mismatch between education and occupation.- The number of graduates in fields like commerce and business administrationcontinues to increase even if unemployment among these graduates is on therise.<strong>Far</strong> <strong>Eastern</strong> <strong>University</strong>’s market is made up of the working class and the middle incomegroup. FEU is situated in Manila, particularly in the area popularly known as the<strong>University</strong> Belt. To be competitive, the university must continuously improve its productsand at the same time maintain reasonable tuition fees.II.Group of related services which contribute 10% or more to revenues1. Institute of Accounts, Business and Finance 23.50%2. Institute of Arts and Sciences 10.00%2. Associate in Health Science Education 20.75%3. Institute of Nursing 37.25%III. Teaching services are rendered to students who come and enroll.IV. No patents, trademarks, copyrights, licenses, franchises, concessions, and royaltyagreements are held by the company.V. All courses offered are with CHED recognition.VI Standard set by CHED encourages the <strong>University</strong> to continuously improve its quality ofteaching and its facilities.Operational and Financial InformationDividend payments are normally restricted by reserves and appropriations made by thecompany, and by the amount needed to ensure smooth and unhampered operationsduring the year.Control and Compensation InformationNo warrants or options are given by the corporation.
Control No.:<strong>Form</strong> Type:PHFS (rev 2006)SPECIAL FORM FOR FINANCIAL STATEMENTS OF PUBLICLY-HELD AND INVESTMENT COMPANIESNAME OF CORPORATION: FAR EASTERN UNIVERSITY, INC.CURRENT ADDRESS:Nicanor Reyes Sr. St., Sampaloc, ManilaTEL. NO.: 735-5621FAX NO.: 736-0039COMPANY TYPE : Educational InstitutionsPSIC:If these are based on consolidated financial statements, please so indicate in the caption.Table 1. Balance SheetF I N A N C I A L D A T A2008 2007( in P'000 ) ( in P'000 )A. ASSETS (A.1 + A.2 + A.3 + A.4 + A.5 + A.6 + A.7 + A.8 + A.9 + A.10)3,197,292 2,741,134A.1 Current Assets (A.1.1 + A.1.2 + A.1.3 + A.1.4 + A.1.5)2,268,683 1,860,003A.1.1 Cash and cash equivalents (A.1.1.1 + A.1.1.2 + A.1.1.3)1,206,776 875,928A.1.1.1 On hand<strong>17</strong>5,914 122,346A.1.1.2 In domestic banks/entities1,030,862 753,582A.1.1.3 In foreign banks/entitiesA.1.2 Trade and Other Receivables (A.1.2.1 + A.1.2.2)205,813 158,279A.1.2.1 Due from domestic entities (A.1.2.1.1 + A.1.2.1.2 + A.1.2.1.3 + A.1.2.1.4)205,813 158,279A.1.2.1.1 Due from customers (trade)81,924 57,583A.1.2.1.2 Due from related parties2,342 1,336A.1.2.1.3 Others, specify (A.1.2.1.3.1 + A.1.2.1.3.2)133,419 110,797A.1.2.1.3.1 Accrued interest receivable44,938 44,535A.1.2.1.3.2 Others88,481 66,262A.1.2.1.4 Allowance for doubtful accounts (negative entry)(11,872) (11,437)A.1.2.2 Due from foreign entities, specify(A.1.2.2.1 + A.1.2.2.2 + A.1.2.2.3 + A.1.2.2.4)A.1.2.2.1A.1.2.2.2A.1.2.2.3A.1.2.2.4 Allowance for doubtful accounts (negative entry)A.1.3 Inventories (A.1.3.1 + A.1.3.2 + A.1.3.3 + A.1.3.4 + A.1.3.5 + A.1.3.6)A.1.3.1 Raw materials and suppliesA.1.3.2 Goods in process (including unfinished goods, growing crops, unfinished seeds)A.1.3.3 Finished goodsA.1.3.4 Merchandise/Goods in transitA.1.3.5 Unbilled Services (in case of service providers)A.1.3.6 Others, specify (A.1.3.6.1 + A.1.3.6.2)A.1.3.6.1A.1.3.6.2A.1.4 Financial Assets other than Cash/Receivables/Equity investments (A.1.4.1 + A.1.4.2 + A.1.4.3840,687 816,893+ A.1.4.4 + A.1.4.5 + A.1.4.6)A.1.4.1 Financial Assets at Fair Value through Profit or Loss - issued by domestic entities:(A.1.4.1.1 + A.1.4.1.2 + A.1.4.1.3 + A.1.4.1.4 + A.1.4.1.5)A.1.4.1.1 National GovernmentA.1.4.1.2 Public Financial InstitutionsA.1.4.1.3 Public Non-Financial InstitutionsA.1.4.1.4 Private Financial InstitutionsA.1.4.1.5 Private Non-Financial InstitutionsA.1.4.2 Held to Maturity Investments - issued by domestic entities:(A.1.4.2.1 + A.1.4.2.2 + A.1.4.2.3 + A.1.4.2.4 + A.1.4.2.5)A.1.4.2.1 National GovernmentA.1.4.2.2 Public Financial InstitutionsA.1.4.2.3 Public Non-Financial InstitutionsA.1.4.2.4 Private Financial InstitutionsA.1.4.2.5 Private Non-Financial InstitutionsNOTE:This special form is applicable to Investment Companies and Publicly-held Companies (enumerated in Section <strong>17</strong>.2 of the Securities Regulation Code (SRC),except banks and insurance companies). As a supplemental form to PHFS, it shall be used for reporting Consolidated Financial Statements of Parent corporations andtheir subsidiaries.Domestic corporations are those which are incorporated under <strong>Philippine</strong> laws or branches/subsidiaries of foreign corporations that are licensed to do business inthe <strong>Philippine</strong>s where the center of economic interest or activity is within the <strong>Philippine</strong>s. On the other hand, foreign corporations are those that are incorporated abroad,including branches of <strong>Philippine</strong> corporations operating abroad.Financial Institutions are corporations principally engaged in financial intermediation, facilitating financial intermediation, or auxiliary financial services. Non-Financial institutions refer to corporations that are primarily engaged in the production of market goods and non-financial services.Page 1
Control No.:<strong>Form</strong> Type:PHFS (rev 2006)SPECIAL FORM FOR FINANCIAL STATEMENTS OF PUBLICLY-HELD AND INVESTMENT COMPANIESNAME OF CORPORATION: FAR EASTERN UNIVERSITY, INC.CURRENT ADDRESS:Nicanor Reyes Sr. St., Sampaloc, ManilaTEL. NO.: 735-5621FAX NO.: 736-0039COMPANY TYPE : Educational InstitutionsPSIC:If these are based on consolidated financial statements, please so indicate in the caption.Table 1. Balance SheetF I N A N C I A L D A T A2008 2007( in P'000 ) ( in P'000 )A.1.4.3 Loans and Receivables - issued by domestic entities:(A.1.4.3.1 + A.1.4.3.2 + A.1.4.3.3 + A.1.4.3.4 + A.1.4.3.5)A.1.4.3.1 National GovernmentA.1.4.3.2 Public Financial InstitutionsA.1.4.3.3 Public Non-Financial InstitutionsA.1.4.3.4 Private Financial InstitutionsA.1.4.3.5 Private Non-Financial InstitutionsA.1.4.4 Available-for-sale financial assets - issued by domestic entities:839,454 811,432(A.1.4.4.1 + A.1.4.4.2 + A.1.4.4.3 + A.1.4.4.4 + A.1.4.4.5)A.1.4.4.1 National Government466,819 501,707A.1.4.4.2 Public Financial InstitutionsA.1.4.4.3 Public Non-Financial InstitutionsA.1.4.4.4 Private Financial Institutions372,635 309,725A.1.4.4.5 Private Non-Financial InstitutionsA.1.4.5 Financial Assets issued by foreign entities: (A.1.4.5.1+A.1.4.5.2+A.1.4.5.3+A.1.4.5.4A.1.4.5.1 Financial Assets at fair value through profit or lossA.1.4.5.2 Held-to-maturity investmentsA.1.4.5.3 Loans and ReceivablesA.1.4.5.4 Available-for-sale financial assetsA.1.4.6 Allowance for decline in market value (negative entry)1,233 5,461A.1.5 Other Current Assets (state separately material items) (A.1.5.1 + A.1.5.2 + A.1.5.315,407 8,903A.1.5.1 Other current assets15,407 8,903A.1.5.2A.1.5.3A.2 Property, plant, and equipment (A.2.1 + A.2.2 + A.2.3 + A.2.4 + A.2.5 + A.2.6 + A.2.7+ A.2.8)549,904 534,116A.2.1 Land124,665 124,665A.2.2 Building and improvements including leasehold improvement484,222 454,730A.2.3 Furniture and Equipment107,012 88,895A.2.4 Construction in ProgressA.2.5 Others, specify (A.2.5.1 + A.2.5.2 + A.2.5.3 + A.2.5.4 + A.2.5.5)98212,409 12,091A..2.5.1 Miscellaneous Equipment 12,409 12,091A..2.5.2A..2.5.3A..2.5.4A..2.5.5A.2.6 Appraisal increase, specify (A.2.6.1 + A.2.6.2 + A.2.6.3 + A.2.6.4 + A.2.6.5)A..2.6.1A..2.6.2A..2.6.3A..2.6.4A..2.6.5A.2.7 Accumulated Depreciation (negative entry)(<strong>17</strong>9,386) (146,265)A.2.8 Impairment Loss or Reversal (if loss, negative entry)A.3 Investments accounted for using the equity method (A.3.1 + A.3.2 + A.3.3 + A.3.4A.3.1 Equity in domestic subsidiaries/affiliatesA.3.2 Equity in foreign branches/subsidiaries/affiliatesA.3.3 Others, specify (A.3.3.1 + A.3.3.2 + A.3.3.3 + A.3.3.4 + A.3.3.5)A.3.3.1A.3.3.2A.3.3.3A.3.3.4A.3.3.5A.4 Investment Property 143,637 153,676A.5 Biological AssetsA.6 Intangible AssetsA.6.1 Major item/s, specify (A.6.1.1 + A.6.1.2)A.6.1.1A.6.1.2A.6.2 Others, specify (A.6.2.1 + A.6.2.2)A.6.2.1A.6.2.2A.7 Assets Classified as Held for SaleA.8 Assets included in Disposal Groups Classified as Held for SalePage 2
Control No.:<strong>Form</strong> Type:PHFS (rev 2006)SPECIAL FORM FOR CONSOLIDATED FINANCIAL STATEMENTS OF PUBLICLY-HELD AND INVESTMENT COMPANIESNAME OF CORPORATION: FAR EASTERN UNIVERSITY, INC.CURRENT ADDRESS:Nicanor Reyes Sr. St., Sampaloc, ManilaTEL. NO.: 735-5621FAX NO.: 736-0039COMPANY TYPE : Educational InstitutionsPSIC:If these are based on consolidated financial statements, please so indicate in the caption.Table 1. Balance SheetF I N A N C I A L D A T A2008 2007( in P'000 ) ( in P'000 )A.9 Long-term receivables (net of current portion) (A.9.1 + A.9.2 + A.9.3) 100,000 65,000A.9.1 From domestic entities, specify (A.9.1.1 + A.9.1.2 + A.9.1.3)100,000 65,000A.9.1.1 Due from a related party100,000 65,000A.9.1.2A.9.1.3A.9.2 From foreign entities, specify (A.9.2.1 + A.9.2.2 + A.9.2.3)A.9.2.1A.9.2.2A.9.2.3A.9.3 Allowance for doubtful accounts, net of current portion (negative entry)A.10 Other Assets (A.10.1 + A.10.2 + A.10.3 + A.10.4 + A.10.5) 135,068 128,339A.10.1 Deferred charges - net of amortizationA.10.2 Deferred Income Tax8,591 5,625A.10.3 Advance/Miscellaneous depositsA.10.4 Others, specify (A.10.4.1 + A.10.4.2 + A.10.4.3 + A.10.4.4+A.10.4.5)126,477 122,714A.10.4.1 Equity investments88,942 88,942A.10.4.2 Held-to-maturity investments32,071 30,469A.10.4.3 Other assets 5,464 3,303A.10.4.4A.10.4.5A.10.5 Allowance for write-down of deferred charges/bad accounts (negative entry)B. LIABILITIES (B.1 + B.2 + B.3 + B.4 + B.5)581,740 398,973B.1 Current Liabilities (B.1.1 + B.1.2 + B.1.3 + B.1.4 + B.1.5 + B.1.6 + B.1.7)489,407 294,192B.1.1 Trade and Other Payables to Domestic Entities423,759 254,213(B.1.1.1 + B.1.1.2 + B.1.1.3 + B.1.1.4 + B.1.1.5 + B.1.1.6)B.1.1.1 Loans/Notes PayablesB.1.1.2 Trade Payables 60,050 50,513B.1.1.3 Payables to Related PartiesB.1.1.4 Advances from Directors, Officers, Employees and Principal <strong>Stock</strong>holdersB.1.1.5 Accruals, specify material items (B.1.1.5.1 + B.1.1.5.2 + B.1.1.5.3) 88,555 91,099B.1.1.5.1 Accrued retirement7,100 6,615B.1.1.5.2 Accrued expenses57,846 56,210B.1.1.5.3 Accrued bonus and benefits23,609 28,274B.1.1.6 Others, specify (B.1.1.6.1 + B.1.1.6.2 + B.1.1.6.3)275,154 112,601B.1.1.6.1 Dividends payable139,806 19,074B.1.1.6.2 Deposits payable1,326 1,326B.1.1.6.3 Other current liabilities134,022 92,201B.1.2 Trade and Other Payables to Foreign Entities (specify) (B.1.2.1 + B.1.2.2 + B.1.2.3B.1.2.1B.1.2.2B.1.2.3B.1.3 ProvisionsB.1.4 Financial Liabilities (excluding Trade and Other Payables and Provisions)(B.1.4.1 + B.1.4.2 + B.1.4.3 + B.1.4.4 + B.1.4.5)B.1.4.1B.1.4.2B.1.4.3B.1.4.4B.1.4.5B.1.5 Liabilities for Current Tax48,793 39,979B.1.6 Deferred Tax LiabilitiesB.1.7 Others, specify (If material, state separately; indicate if the item is payable to public/private or16,855financial/non-financial institutions) (B.1.7.1 + B.1.7.2 + B.1.7.3 + B.1.7.4 + B.1.7.5 + B.1.7.6B.1.7.1 Dividends declared and not paid at balance sheet dateB.1.7.2 Acceptances PayableB.1.7.3 Liabilities under Trust ReceiptsB.1.7.4 Portion of Long-term Debt Due within one yearB.1.7.5 Deferred Income 16,855B.1.7.6 Any other current liability in excess of 5% of Total Current Liabiilities, specifyB.1.7.6.1B.1.7.6.2B.1.7.6.3Page 3
Control No.:<strong>Form</strong> Type:PHFS (rev 2006)SPECIAL FORM FOR FINANCIAL STATEMENTS OF PUBLICLY-HELD AND INVESTMENT COMPANIESNAME OF CORPORATION: FAR EASTERN UNIVERSITY, INC.CURRENT ADDRESS: Nicanor Reyes Sr. St., Sampaloc, ManilaTEL. NO.: 735-5621 FAX NO.: 736-0039COMPANY TYPE : Educational InstitutionsPSIC:If these are based on consolidated financial statements, please so indicate in the caption.Table 1. Balance SheetF I N A N C I A L D A T A2008 2007( in P'000 ) ( in P'000 )B.2 Long-term Debt - Non-current Interest-bearing Liabilities (B.2.1 + B.2.2 + B.2.3 + B.2.4 + B.2.5)B.2.1 Domestic Public Financial InstitutionsB.2.2 Domestic Public Non-Financial InstitutionsB.2.3 Domestic Private Financial InstitutionsB.2.4 Domestic Private Non-Financial InstitutionsB.2.5 Foreign Financial InstitutionsB.3 Indebtedness to Affiliates and Related Parties (Non-Current)B.4 Liabilities Included in the Disposal Groups Classified as Held for SaleB.5 Other Liabilities (B.5.1 + B.5.2) 92,333 104,781B.5.1 Deferred TaxB.5.2 Others, specify (B.5.2.1 + B.5.2.2 + B.5.2.3 + B.5.2.4 + B.5.2.5)92,333 104,781B.5.2.1 Trust funds92,333 104,781B.5.2.2B.5.2.3B.5.2.4B.5.2.5C. EQUITY (C.3 + C.4 + C.5 + C.6 + C.7 + C.8 + C.9+C.10)2,615,552 2,342,161C.1 Authorized Capital <strong>Stock</strong> (no. of shares, par value and total value; show details) (C.1.1+C.1.2+C.1.3) 1,000,000 1,000,000C.1.1 Common shares 1,000,000 1,000,000C.1.2 Preferred SharesC.1.3 OthersC.2 Subscribed Capital <strong>Stock</strong> (no. of shares, par value and total value) (C.2.1 + C.2.2 + C.2.3 704,370 704,370C.2.1 Common shares 7,043,699 shares, P100 par value in 2008 and 2007704,370 704,370C.2.2 Preferred SharesC.2.3 OthersC.3 Paid-up Capital <strong>Stock</strong> (C.3.1 + C.3.2) 704,370 704,370C.3.1 Common shares 704,370 704,370C.3.2 Preferred SharesC.4 Additional Paid-in Capital / Capital in excess of par value / Paid-in SurplusC.5 Minority InterestC.6 Others, specify (C.6.1 + C.6.2 + C.6.3) 1,233 5,461C.6.1 Net Unrealized Gain on Available for Sale Investments1,233 5,461C.6.2C.6.3C.7 Appraisal Surplus/Revaluation Increment in Property/Revaluation SurplusC.8 Retained Earnings (C.8.1 + C.8.2) 1,913,682 1,636,063C.8.1 Appropriated 1,147,161 697,161C.8.2 Unappropriated 766,521 938,902C.9 Head / Home Office Account (for Foreign Branches only)C.10 Cost of <strong>Stock</strong>s Held in Treasury (negative entry) (3,733) (3,733)TOTAL LIABILITIES AND EQUITY (B + C)3,197,292 2,741,134Page 4
Control No.:<strong>Form</strong> Type:PHFS (rev 2006)SPECIAL FORM FOR FINANCIAL STATEMENTS OF PUBLICLY-HELD AND INVESTMENT COMPANIESNAME OF CORPORATION: FAR EASTERN UNIVERSITY, INC.CURRENT ADDRESS:Nicanor Reyes Sr. St., Sampaloc, ManilaTEL. NO.: 735-5621FAX NO.: 736-0039COMPANY TYPE : Educational InstitutionsPSIC:If these are based on consolidated financial statements, please so indicate in the caption.Table 2. Income StatementF I N A N C I A L D A T A2008 2007 2006( in P'000 ) ( in P'000 ) (in P'000)A. REVENUE / INCOME (A.1 + A.2 + A.3)1,743,748 1,715,740 1,559,404A.1 Net Sales or Revenue / Receipts from Operations (manufacturing,1,613,830 1,596,055 1,440,279mining,utilities, trade, services, etc.) (from Primary Activity)A.2 Share in the Profit or Loss of Associates and Joint Ventures accounted forA.3 Other Revenue (A.3.1 + A.3.2 + A.3.3 + A.3.4 + A.3.5)30,601 49,815 21,705A.3.1 Rental Income from Land and Buildings25,494 42,012 21,705A.3.2 Other Finance income on AFS5,107 7,803 -A.3.3A.3.4A.3.5 Others, specify (A.3.5.1 + A.3.5.2 + A.3.5.3 + A.3.5.4 + A.3.5.5 + A.3.5.6+ A.3.5.7 + A.3.5.8)A.3.5.1A.3.5.2A.3.5.3A.3.5.4A.3.5.5A.3.5.6A.3.5.7A.3.5.8A.4 Other Income (non-operating) (A.4.1 + A.4.2 + A.4.3 + A.4.4)99,3<strong>17</strong> 69,870 97,420A.4.1 Interest Income76,<strong>17</strong>4 63,729 84,618A.4.2 Dividend IncomeA.4.3 Gain / (Loss) from selling of Assets, specify(A.4.3.1 + A.4.3.2 + A.4.3.3 + A.4.3.4)A.4.3.1A.4.3.2A.4.3.3A.4.3.4A.4.4 Others, specify23,143 6,141 12,802(A.4.4.1 + A.4.4.2 + A.4.4.3 + A.4.4.4)A.4.4.1 Others23,143 6,141 12,802A.4.4.2A.4.4.3A.4.4.4B. COST OF GOODS SOLD (B.1 + B.2 + B.3)B.1 Cost of Goods Manufactured (B.1.1 + B.1.2 + B.1.3 + B.1.4 + B.1.5)B.1.1 Direct Material UsedB.1.2 Direct LaborB.1.3 Other Manufacturing Cost / OverheadB.1.4 Goods in Process, BeginningB.1.5 Goods in Process, End (negative entry)B.2 Finished Goods, BeginningB.3 Finished Goods, End (negative entry)C. COST OF SALES (C.1 + C.2 + C.3)C.1 PurchasesC.2 Merchandise Inventory, BeginningC.3 Merchandise Inventory, End (negative entry)D. GROSS PROFIT (A - B - C)1,743,748 1,715,740 1,559,404NOTE: Pursuant to SRC Rule 68.1 (as amended in Nov. 2005), for fiscal years ending December 31, 2005 up to November 30, 2006, acomparative format of only two (2) years may be filed to give temporary relief for covered companies as the more complex PFRSs willbe applied for the first time in these year end periods. After these first time applications, the requirement of three (3) year comparativesshall resume for year end reports beginning December 31, 2006 and onwards.Page 5
Control No.:<strong>Form</strong> Type:PHFS (rev 2006)SPECIAL FORM FOR FINANCIAL STATEMENTS OF PUBLICLY-HELD AND INVESTMENT COMPANIESNAME OF CORPORATION: FAR EASTERN UNIVERSITY, INC.CURRENT ADDRESS:Nicanor Reyes Sr. St., Sampaloc, ManilaTEL. NO.: 735-5621FAX NO.: 736-0039COMPANY TYPE : Educational InstitutionsPSIC:If these are based on consolidated financial statements, please so indicate in the caption.Table 2. Income StatementF I N A N C I A L D A T A2008 2007 2006( in P'000 ) ( in P'000 ) (in P'000)E. OPERATING EXPENSES (E.1 + E.2 + E.3 + E.4)1,094,192 1,055,439 934,775E.1 Selling or Marketing ExpensesE.2 Administrative Expenses 191,744 <strong>17</strong>1,743 180,063E.3 General Expenses 94,860 87,105 90,737E.4 Other Expenses, specify (E.4.1 + E.4.2 + E.4.3 + E.4.4 + E.4.5 + E.4.6 + E.4.7807,588 796,591 663,975+ E.4.8 + E.4.9 + E.4.10)E.4.1 Education-related expenditures694,246 650,139 567,228E.4.2 Maintenance and Company113,342 146,452 96,747E.4.3E.4.4E.4.5E.4.6E.4.7E.4.8E.4.9E.4.10F. FINANCE COSTS (F.1 + F.2 + F.3 + F.4 + F.5)F.1F.2F.3F.4F.5Interest on Short-Term Promissory NotesInterest on Long-Term Promissory NotesInterest on bonds, mortgages and other long-term loansAmortizationOther interests, specify (F.5.1 + F.5.2 + F.5.3 + F.5.4 + F.5.5)F.5.1F.5.2F.5.3F.5.4F.5.5G. NET INCOME (LOSS) BEFORE TAX (D - E - F)649,556 660,301 624,629H. INCOME TAX EXPENSE (negative entry) (56,650) (56,774) (55,719)I. INCOME(LOSS) AFTER TAX592,906 603,527 568,910J. Amount of (i) Post-Tax Profit or Loss of Discontinued Operations; and (ii) Post-Tax Gain or Loss Recognized on theMeasurement of Fair Value less Cost toSell or on the Disposal of the Assets or Disposal Group(s) constituting theDiscontinued Operation (if any)J.1J.2K.LM.PROFIT OR LOSS ATTRIBUTABLE TO MINORITY INTERESTPROFIT OR LOSS ATTRIBUTABLE TO EQUITY HOLDERS OF THE PARENTEARNINGS (LOSS) PER SHAREM.1 Basic84.63 103.37 121.79M.2 Diluted84.63 103.37 121.79Page 6
Control No.:<strong>Form</strong> Type:PHFS (rev 2006)SPECIAL FORM FOR FINANCIAL STATEMENTS OF PUBLICLY-HELD AND INVESTMENT COMPANIESNAME OFFAR EASTERN UNIVERSITY, INC.CURRENT ADDRESS: Nicanor Reyes Sr. St., Sampaloc, ManilaTEL. NO.: 735-5621FAX NO.: 736-0039COMPANY Educational InstitutionsPSIC:If these are based on consolidated financial statements, please so indicate in the caption.Table 3. Cash Flow StatementsF I N A N C I A L D A T A2008 2007 2006( in P'000 ) ( in P'000 ) (P'000)CASH FLOWS FROM OPERATING ACTIVITIESNet Income (Loss) Before Tax and Extraordinary Items649,556 660,301 624,629Adjustments to Reconcile Net Income to Net Cash Provided by Operating ActivitiesDepreciation43,160 44,048 28,071Amortization, specif Impairment losses on receivables<strong>17</strong>,451 12,686 10,940Unrealized foreign exchange (gain) loss(1,860) - 882Interest income(76,<strong>17</strong>4) (63,729) (84,618)Others, specify: Other finance income on AFS investments(5,107) (7,803) -Gain on disposal of property and equipmentImpairment losses on equity investments- (102) (1,190)13,373Write-down of Property, Plant, and EquipmentChanges in Assets and Liabilities:Decrease (Increase) in:Receivables (56,778) 12,692 (52,780)Inventories - - -Other Current Assets (6,504) (1,388) (9,399)Others, specify:Increase (Decrease) in:Trade and Other Payables 48,813 1,163 58,532Income and Other Taxes PayableOthers, specify: Deferred Income16,855 - (27,347)Interest received67,967 73,853 84,618Income taxes paid(50,801) (55,041) (45,776)A. Net Cash Provided by (Used in) Operating Activities (sum of above rows)646,578 676,680 599,935CASH FLOWS FROM INVESTING ACTIVITIES(Increase) Decrease in Long-Term Receivables(Increase) Decrease in Investment (22,657) (486,553) 18,936Reductions/(Additions) to Property, Plant, and Equipment (48,909) (2,565) (189,621)Others, specify Due from a related party(35,000) - -Other assets(2,161) 28,771 (29,613)Proceeds from disposal of property and equipment- <strong>17</strong>5 1,231B. Net Cash Provided by (Used in) Investing Activities (sum of above rows)(108,727) (460,<strong>17</strong>2) (199,067)CASH FLOWS FROM FINANCING ACTIVITIESProceeds from:LoansLong-term DebtIssuance of SecuritiesOthers, specify:Payments of:(Loans)(Long-term Debt)(<strong>Stock</strong> Subscriptions)Others, specify (negative entry):Dividends PaidIncrease in Trust Funds(194,554) (<strong>17</strong>5,163) (112,107)(12,448) 18,959 18,428C. Net Cash Provided by (Used in) Financing Activities (sum of above rows)(207,002) (156,204) (93,679)NET INCREASE IN CASH AND CASH EQUIVALENTS (A + B + C)330,849 60,304 307,189Cash and Cash EquivalentsBeginning of year875,928 815,624 508,435End of year1,206,777 875,928 815,624NOTE: Pursuant to SRC Rule 68.1 (as amended in Nov. 2005), for fiscal years ending December 31, 2005 up to November 30, 2006, acomparative format of only two (2) years may be filed to give temporary relief for covered companies as the more complex PFRSs will beapplied for the first time in these year end periods. After these first time applications, the requirement of three (3) year comparatives shallresume for year end reports beginning December 31, 2006 and onwards.Page 7
Control No.:<strong>Form</strong> Type:PHFS (rev 2006)SPECIAL FORM FOR FINANCIAL STATEMENTS OF PUBLICLY-HELD AND INVESTMENT COMPANIESNAME OF CORPORATION: FAR EASTERN UNIVERSITY, INC.CURRENT ADDRESS: Nicanor Reyes Sr. St., Sampaloc, ManilaTEL. NO.: 735-5621FAX NO.: 736-0039COMPANY TYPE : Educational InstitutionsIf these are based on consolidated financial statements, please so indicate in the caption.PSIC:F I N A N C I A L D A T ACapital <strong>Stock</strong>Table 4. Statement of Changes in Equity(Amount in P'000)AdditionalPaid-in CapitalRevaluationIncrementTranslationDifferencesRetainedEarningsTOTALA. Balance, 2006470,847 (5,536) 1,437,523 1,902,834A.1 Correction of Error(s)A.2 Changes in Accounting PolicyB. Restated Balance 470,847 (5,536) 1,437,523 1,902,834C. SurplusC.1 Surplus (Deficit) on Revaluation ofPropertiesC.2 Surplus (Deficit) on Revaluation of10,997 10,997InvestmentsC.3 Currency Translation DifferencesC.4 Other Surplus (specify)C.4.1C.4.2C.4.3C.4.4C.4.5D. Net Income (Loss) for the Period603,527 603,527E. Dividends (negative entry)(408,720) (408,720)F. Appropriation for (specify)F.1 Expansion of facilitiesF.2 Purchases of equipment and improvementsF.3F.4G. Issuance of Capital <strong>Stock</strong>G.1 Common <strong>Stock</strong>233,523 233,523G.2 Preferred <strong>Stock</strong>G.3 OthersH. Balance, 2007704,370 5,461 1,632,330 2,342,161H.1 Correction of Error (s)H.2 Changes in Accounting PolicyI. Restated Balance 704,370 5,461 1,632,330 2,342,161J. SurplusJ.1 Surplus (Deficit) on Revaluation ofPropertiesJ.2 Surplus (Deficit) on Revaluation of(4,228) (4,228)InvestmentsJ.3 Currency Translation DifferencesJ.4 Other Surplus (specify)J.4.1J.4.2J.4.3J.4.4J.4.5K. Net Income (Loss) for the Period592,906 592,906L. Dividends (negative entry)(315,287) (315,287)M. Appropriation for (specify)M.1 Expansion of facilitiesM.2 General retirementM.3M.4M.5N. Issuance of Capital <strong>Stock</strong>N.1 Common <strong>Stock</strong>N.2 Preferred <strong>Stock</strong>N.3 OthersO. Balance, 2008704,370 1,233 1,909,949 2,615,552Page 8
Control No.:<strong>Form</strong> Type:PHFS (rev 2006)SPECIAL FORM FOR FINANCIAL STATEMENTS OF PUBLICLY-HELD AND INVESTMENT COMPANIESNAME OF CORPORATION: FAR EASTERN UNIVERSITY, INC.CURRENT ADDRESS:Nicanor Reyes Sr. St., Sampaloc, ManilaTEL. NO.: 735-5621FAX NO.: 736-0039COMPANY TYPE : Educational InstitutionsPSIC:If these are based on consolidated financial statements, please so indicate in the caption.Table 5. Details of Income and Expenses, by source(applicable to corporations transacting with foreign corporations/entities)2008 2007 2006F I N A N C I A L D A T A( in P'000 ) ( in P'000 ) (in P'000)A. REVENUE / INCOME (A.1 + A.2)A.1 Net Sales or Revenue / Receipts from Operations (manufacturing, mining,utilities,trade, services, etc.) (from Primary Activity) (A.1.1 +A.1.2)A.1.1 DomesticA.1.2 ForeignA.2 Other Revenue (A.2.1 +A.2.2)A.2.1 DomesticA.2.2 Foreign, specify (A.2.2.1+A.2.2.2+ A.2.2.3+ A.2.2.4+ A.2.2.5+ A.2.2.6+A.2.2.7+ A.2.2.8+A.2.2.9+A.2.2.10)A.2.2.1A.2.2.2A.2.2.3A.2.2.4NOT APPLICABLEA.2.2.5A.2.2.6A.2.2.7A.2.2.8A.2.2.9A.2.2.10B. EXPENSES (B.1 + B.2)B.1 DomesticB.2 Foreign, specify(B.2.1+B.2.2+B.2.3+B.2.4+B.2.5+B.2.6+B.2.7+B.2.8+B.2.9+B.2.10)B.2.1B.2.2B.2.3B.2.4B.2.5B.2.6B.2.7B.2.8B.2.9B.2.10.Page 9
Control No.:<strong>Form</strong> Type:PHFS (rev 2006)SPECIAL FORM FOR FINANCIAL STATEMENTS OF PUBLICLY-HELD AND INVESTMENT COMPANIESNAME OF CORPORATION: FAR EASTERN UNIVERSITY, INC. AND SUBSIDIARIESCURRENT ADDRESS:Nicanor Reyes Sr. St., Sampaloc, ManilaTEL. NO.: 735-5621FAX NO.: 736-0039COMPANY TYPE : Educational InstitutionsPSIC:If these are based on consolidated financial statements, please so indicate in the caption.Table 1. Balance SheetF I N A N C I A L D A T A2008 2007( in P'000 ) ( in P'000 )A. ASSETS (A.1 + A.2 + A.3 + A.4 + A.5 + A.6 + A.7 + A.8 + A.9 + A.10)3,640,549 3,169,890A.1 Current Assets (A.1.1 + A.1.2 + A.1.3 + A.1.4 + A.1.5)2,558,834 2,190,006A.1.1 Cash and cash equivalents (A.1.1.1 + A.1.1.2 + A.1.1.3)1,265,6<strong>17</strong> 975,579A.1.1.1 On hand186,371 124,616A.1.1.2 In domestic banks/entities1,079,246 850,963A.1.1.3 In foreign banks/entitiesA.1.2 Trade and Other Receivables (A.1.2.1 + A.1.2.2)241,194 190,492A.1.2.1 Due from domestic entities (A.1.2.1.1 + A.1.2.1.2 + A.1.2.1.3 + A.1.2.1.4)241,194 190,492A.1.2.1.1 Due from customers (trade)81,924 57,583A.1.2.1.2 Due from related partiesA.1.2.1.3 Others, specify (A.1.2.1.3.1 + A.1.2.1.3.2)<strong>17</strong>1,142 144,346A.1.2.1.3.1 Accrued interest receivable45,115 45,389A.1.2.1.3.2 Others126,027 98,957A.1.2.1.4 Allowance for doubtful accounts (negative entry)(11,872) (11,437)A.1.2.2 Due from foreign entities, specify(A.1.2.2.1 + A.1.2.2.2 + A.1.2.2.3 + A.1.2.2.4)A.1.2.2.1A.1.2.2.2A.1.2.2.3A.1.2.2.4 Allowance for doubtful accounts (negative entry)A.1.3 Inventories (A.1.3.1 + A.1.3.2 + A.1.3.3 + A.1.3.4 + A.1.3.5 + A.1.3.6)A.1.3.1 Raw materials and suppliesA.1.3.2 Goods in process (including unfinished goods, growing crops, unfinished seeds)A.1.3.3 Finished goodsA.1.3.4 Merchandise/Goods in transitA.1.3.5 Unbilled Services (in case of service providers)A.1.3.6 Others, specify (A.1.3.6.1 + A.1.3.6.2)A.1.3.6.1A.1.3.6.2A.1.4 Financial Assets other than Cash/Receivables/Equity investments (A.1.4.1 + A.1.4.2 + A.1.4.3840,687 826,047+ A.1.4.4 + A.1.4.5 + A.1.4.6)A.1.4.1 Financial Assets at Fair Value through Profit or Loss - issued by domestic entities:(A.1.4.1.1 + A.1.4.1.2 + A.1.4.1.3 + A.1.4.1.4 + A.1.4.1.5)A.1.4.1.1 National GovernmentA.1.4.1.2 Public Financial InstitutionsA.1.4.1.3 Public Non-Financial InstitutionsA.1.4.1.4 Private Financial InstitutionsA.1.4.1.5 Private Non-Financial InstitutionsA.1.4.2 Held to Maturity Investments - issued by domestic entities:(A.1.4.2.1 + A.1.4.2.2 + A.1.4.2.3 + A.1.4.2.4 + A.1.4.2.5)A.1.4.2.1 National GovernmentA.1.4.2.2 Public Financial InstitutionsA.1.4.2.3 Public Non-Financial InstitutionsA.1.4.2.4 Private Financial InstitutionsA.1.4.2.5 Private Non-Financial InstitutionsNOTE:This special form is applicable to Investment Companies and Publicly-held Companies (enumerated in Section <strong>17</strong>.2 of the Securities Regulation Code (SRC),except banks and insurance companies). As a supplemental form to PHFS, it shall be used for reporting Consolidated Financial Statements of Parent corporations andtheir subsidiaries.Domestic corporations are those which are incorporated under <strong>Philippine</strong> laws or branches/subsidiaries of foreign corporations that are licensed to do business inthe <strong>Philippine</strong>s where the center of economic interest or activity is within the <strong>Philippine</strong>s. On the other hand, foreign corporations are those that are incorporated abroad,including branches of <strong>Philippine</strong> corporations operating abroad.Financial Institutions are corporations principally engaged in financial intermediation, facilitating financial intermediation, or auxiliary financial services. Non-Financial institutions refer to corporations that are primarily engaged in the production of market goods and non-financial services.Page 1
Control No.:<strong>Form</strong> Type:PHFS (rev 2006)SPECIAL FORM FOR FINANCIAL STATEMENTS OF PUBLICLY-HELD AND INVESTMENT COMPANIESNAME OF CORPORATION: FAR EASTERN UNIVERSITY, INC. AND SUBSIDIARIESCURRENT ADDRESS:Nicanor Reyes Sr. St., Sampaloc, ManilaTEL. NO.: 735-5621FAX NO.: 736-0039COMPANY TYPE : Educational InstitutionsPSIC:If these are based on consolidated financial statements, please so indicate in the caption.Table 1. Balance SheetF I N A N C I A L D A T A2008 2007( in P'000 ) ( in P'000 )A.1.4.3 Loans and Receivables - issued by domestic entities:(A.1.4.3.1 + A.1.4.3.2 + A.1.4.3.3 + A.1.4.3.4 + A.1.4.3.5)A.1.4.3.1 National GovernmentA.1.4.3.2 Public Financial InstitutionsA.1.4.3.3 Public Non-Financial InstitutionsA.1.4.3.4 Private Financial InstitutionsA.1.4.3.5 Private Non-Financial InstitutionsA.1.4.4 Available-for-sale financial assets - issued by domestic entities:839,454 820,476(A.1.4.4.1 + A.1.4.4.2 + A.1.4.4.3 + A.1.4.4.4 + A.1.4.4.5)A.1.4.4.1 National Government466,819 510,751A.1.4.4.2 Public Financial InstitutionsA.1.4.4.3 Public Non-Financial InstitutionsA.1.4.4.4 Private Financial Institutions372,635 309,725A.1.4.4.5 Private Non-Financial InstitutionsA.1.4.5 Financial Assets issued by foreign entities: (A.1.4.5.1+A.1.4.5.2+A.1.4.5.3+A.1.4.5.4A.1.4.5.1 Financial Assets at fair value through profit or lossA.1.4.5.2 Held-to-maturity investmentsA.1.4.5.3 Loans and ReceivablesA.1.4.5.4 Available-for-sale financial assetsA.1.4.6 Allowance for decline in market value (negative entry)1,233 5,571A.1.5 Other Current Assets (state separately material items) (A.1.5.1 + A.1.5.2 + A.1.5.3211,336 197,888A.1.5.1 Real Estate held for Sale189,053 188,967A.1.5.2 Other current assets22,283 8,921A.1.5.3 -- -A.2 Property, plant, and equipment (A.2.1 + A.2.2 + A.2.3 + A.2.4 + A.2.5 + A.2.6 + A.2.7+ A.2.8)559,333 542,900A.2.1 Land and Buildings and Improvements559,216 530,094A.2.2 Furniture and Equipment107,581 89,420A.2.3 Leasehold Improvements49,671 49,302A.2.4 Construction in Progress10,067 8,434A.2.5 Others, specify (A.2.5.1 + A.2.5.2 + A.2.5.3 + A.2.5.4 + A.2.5.5)12,409 12,091A..2.5.1 Miscellaneous Equipment 12,409 12,091A..2.5.2A..2.5.3A..2.5.4A..2.5.5A.2.6 Appraisal increase, specify (A.2.6.1 + A.2.6.2 + A.2.6.3 + A.2.6.4 + A.2.6.5)- -A..2.6.1A..2.6.2A..2.6.3A..2.6.4A..2.6.5A.2.7 Accumulated Depreciation (negative entry)(<strong>17</strong>9,611) (146,441)A.2.8 Impairment Loss or Reversal (if loss, negative entry)A.3 Investments accounted for using the equity method (A.3.1 + A.3.2 + A.3.3 + A.3.4- -A.3.1 Equity in domestic subsidiaries/affiliatesA.3.2 Equity in foreign branches/subsidiaries/affiliatesA.3.3 Others, specify (A.3.3.1 + A.3.3.2 + A.3.3.3 + A.3.3.4 + A.3.3.5)- -A.3.3.1A.3.3.2A.3.3.3A.3.3.4A.3.3.5A.4 Investment Property 465,389 383,729A.5 Biological AssetsA.6 Intangible AssetsA.6.1 Major item/s, specify (A.6.1.1 + A.6.1.2)- -A.6.1.1A.6.1.2A.6.2 Others, specify (A.6.2.1 + A.6.2.2) - -A.6.2.1A.6.2.2A.7 Assets Classified as Held for SaleA.8 Assets included in Disposal Groups Classified as Held for SalePage 2
Control No.:<strong>Form</strong> Type:PHFS (rev 2006)SPECIAL FORM FOR CONSOLIDATED FINANCIAL STATEMENTS OF PUBLICLY-HELD AND INVESTMENT COMPANIESNAME OF CORPORATION: FAR EASTERN UNIVERSITY, INC. AND SUBSIDIARIESCURRENT ADDRESS:Nicanor Reyes Sr. St., Sampaloc, ManilaTEL. NO.: 735-5621FAX NO.: 736-0039COMPANY TYPE : Educational InstitutionsPSIC:If these are based on consolidated financial statements, please so indicate in the caption.Table 1. Balance SheetF I N A N C I A L D A T A2008 2007( in P'000 ) ( in P'000 )A.9 Long-term receivables (net of current portion) (A.9.1 + A.9.2 + A.9.3)A.9.1 From domestic entities, specify (A.9.1.1 + A.9.1.2 + A.9.1.3)A.9.1.1A.9.1.2A.9.1.3A.9.2 From foreign entities, specify (A.9.2.1 + A.9.2.2 + A.9.2.3)A.9.2.1A.9.2.2A.9.2.3A.9.3 Allowance for doubtful accounts, net of current portion (negative entry)A.10 Other Assets (A.10.1 + A.10.2 + A.10.3 + A.10.4 + A.10.5) 56,993 53,255A.10.1 Investment in an Associate7,105 7,130A.10.2 Held-to-maturity investments32,071 30,469A.10.3A.10.4 Others, specify (A.10.4.1 + A.10.4.2 + A.10.4.3 + A.10.4.4+A.10.4.5)<strong>17</strong>,8<strong>17</strong> 15,656A.10.4.1 Other assets<strong>17</strong>,8<strong>17</strong> 15,656A.10.4.2A.10.4.3A.10.4.4A.10.4.5A.10.5 Allowance for write-down of deferred charges/bad accounts (negative entry)B. LIABILITIES (B.1 + B.2 + B.3 + B.4 + B.5)621,590.00 445,112.00B.1 Current Liabilities (B.1.1 + B.1.2 + B.1.3 + B.1.4 + B.1.5 + B.1.6 + B.1.7)528,497.00 335,795.00B.1.1 Trade and Other Payables to Domestic Entities447,636.00 283,099.00(B.1.1.1 + B.1.1.2 + B.1.1.3 + B.1.1.4 + B.1.1.5 + B.1.1.6)B.1.1.1 Accounts payable and accrued expenses 169,824.00 167,885.00B.1.1.2 Withholding and other taxes payable 16,930.00 30,079.00B.1.1.3 Funds Payable 34,910.00 25,115.00B.1.1.4 Salaries and benefits 41,243.00 27,323.00B.1.1.5 Accruals, specify material items (B.1.1.5.1 + B.1.1.5.2 + B.1.1.5.3) 7,100.00 6,615.00B.1.1.5.1 Accrued retirement7,100.00 6,615.00B.1.1.5.2B.1.1.5.3B.1.1.6 Others, specify (B.1.1.6.1 + B.1.1.6.2 + B.1.1.6.3)<strong>17</strong>7,629.00 26,082.00B.1.1.6.1 Dividends payable139,806.00 19,074.00B.1.1.6.2 Deposits payable30,097.00 1,326.00B.1.1.6.3 Other current liabilities7,726.00 5,682.00B.1.2 Trade and Other Payables to Foreign Entities (specify) (B.1.2.1 + B.1.2.2 + B.1.2.3B.1.2.1B.1.2.2B.1.2.3B.1.3 ProvisionsB.1.4 Financial Liabilities (excluding Trade and Other Payables and Provisions)(B.1.4.1 + B.1.4.2 + B.1.4.3 + B.1.4.4 + B.1.4.5)B.1.4.1B.1.4.2B.1.4.3B.1.4.4B.1.4.5B.1.5 Liabilities for Current Tax54,677.00 43,377.00B.1.6 Deferred Tax LiabilitiesB.1.7 Others, specify (If material, state separately; indicate if the item is payable to public/private or26,184.00 9,319.00financial/non-financial institutions) (B.1.7.1 + B.1.7.2 + B.1.7.3 + B.1.7.4 + B.1.7.5 + B.1.7.6B.1.7.1 Dividends declared and not paid at balance sheet dateB.1.7.2 Acceptances PayableB.1.7.3 Liabilities under Trust ReceiptsB.1.7.4 Portion of Long-term Debt Due within one year 1,896.00 1,754.00B.1.7.5 Deferred Income 24,288.00 7,565.00B.1.7.6 Any other current liability in excess of 5% of Total Current Liabiilities, specifyB.1.7.6.1B.1.7.6.2B.1.7.6.3Page 3
Control No.:<strong>Form</strong> Type:PHFS (rev 2006)SPECIAL FORM FOR FINANCIAL STATEMENTS OF PUBLICLY-HELD AND INVESTMENT COMPANIESNAME OF CORPORATION: FAR EASTERN UNIVERSITY, INC. AND SUBSIDIARIESCURRENT ADDRESS: Nicanor Reyes Sr. St., Sampaloc, ManilaTEL. NO.: 735-5621 FAX NO.: 736-0039COMPANY TYPE : Educational InstitutionsPSIC:If these are based on consolidated financial statements, please so indicate in the caption.Table 1. Balance SheetF I N A N C I A L D A T A2008 2007( in P'000 ) ( in P'000 )B.2 Long-term Debt - Non-current Interest-bearing Liabilities (B.2.1 + B.2.2 + B.2.3 + B.2.4 + B.2.5)B.2.1 Domestic Public Financial InstitutionsB.2.2 Domestic Public Non-Financial InstitutionsB.2.3 Domestic Private Financial InstitutionsB.2.4 Domestic Private Non-Financial InstitutionsB.2.5 Foreign Financial InstitutionsB.3 Indebtedness to Affiliates and Related Parties (Non-Current)B.4 Liabilities Included in the Disposal Groups Classified as Held for SaleB.5 Other Liabilities (B.5.1 + B.5.2) 93,093 109,3<strong>17</strong>B.5.1 Deferred Tax760 2,640B.5.2 Others, specify (B.5.2.1 + B.5.2.2 + B.5.2.3 + B.5.2.4 + B.5.2.5)92,333 106,677B.5.2.1 Trust funds92,333 104,781B.5.2.2 Obligation under finance lease - net of current portion1,896B.5.2.3B.5.2.4B.5.2.5C. EQUITY (C.3 + C.4 + C.5 + C.6 + C.7 + C.8 + C.9+C.10)3,018,959 2,724,778C.1 Authorized Capital <strong>Stock</strong> (no. of shares, par value and total value; show details) (C.1.1+C.1.2+C.1.3) 1,000,000 1,000,000C.1.1 Common shares 10,000,000 shares, P100 par value1,000,000 1,000,000C.1.2 Preferred SharesC.1.3 OthersC.2 Subscribed Capital <strong>Stock</strong> (no. of shares, par value and total value) (C.2.1 + C.2.2 + C.2.3 704,370 704,370C.2.1 Common shares 7,043,699 shares, P100 par value in 2008 and 2007704,370 704,370C.2.2 Preferred SharesC.2.3 OthersC.3 Paid-up Capital <strong>Stock</strong> (C.3.1 + C.3.2) 704,370 704,370C.3.1 Common shares 704,370 704,370C.3.2 Preferred SharesC.4 Additional Paid-in Capital / Capital in excess of par value / Paid-in SurplusC.5 Minority Interest 295,973 282,860C.6 Others, specify (C.6.1 + C.6.2 + C.6.3) 1,233 5,571C.6.1 Net Unrealized Gain on Available for Sale Investments1,233 5,571C.6.2C.6.3C.7 Appraisal Surplus/Revaluation Increment in Property/Revaluation SurplusC.8 Retained Earnings (C.8.1 + C.8.2) 2,021,116 1,735,710C.8.1 Appropriated 1,147,161 697,162C.8.2 Unappropriated 873,955 1,038,548C.9 Head / Home Office Account (for Foreign Branches only)C.10 Cost of <strong>Stock</strong>s Held in Treasury (negative entry) (3,733) (3,733)TOTAL LIABILITIES AND EQUITY (B + C)3,640,549 3,169,890Page 4
Control No.:<strong>Form</strong> Type:PHFS (rev 2006)SPECIAL FORM FOR FINANCIAL STATEMENTS OF PUBLICLY-HELD AND INVESTMENT COMPANIESNAME OF CORPORATION: FAR EASTERN UNIVERSITY, INC. AND SUBSIDIARIESCURRENT ADDRESS:Nicanor Reyes Sr. St., Sampaloc, ManilaTEL. NO.: 735-5621FAX NO.: 736-0039COMPANY TYPE : Educational InstitutionsPSIC:If these are based on consolidated financial statements, please so indicate in the caption.Table 2. Income StatementF I N A N C I A L D A T A2008 2007 2006( in P'000 ) ( in P'000 ) ( in P'000 )A. REVENUE / INCOME (A.1 + A.2 + A.3)1,748,109 1,726,796 1,583,250A.1 Net Sales or Revenue / Receipts from Operations (manufacturing,1,613,830 1,596,055 1,440,279mining,utilities, trade, services, etc.) (from Primary Activity)A.2 Share in the Profit or Loss of Associates and Joint Ventures accounted for(25) (36) (24)A.3 Other Revenue (A.3.1 + A.3.2 + A.3.3 + A.3.4 + A.3.5)35,051 55,598 38,069A.3.1 Rental Income from Land and Buildings29,944 47,795 38,069A.3.2 Other finance Income on AFS investments5,107 7,803 -A.3.3A.3.4A.3.5 Others, specify (A.3.5.1 + A.3.5.2 + A.3.5.3 + A.3.5.4 + A.3.5.5 + A.3.5.6- - -+ A.3.5.7 + A.3.5.8)A.3.5.1A.3.5.2A.3.5.3A.3.5.4A.3.5.5A.3.5.6A.3.5.7A.3.5.8A.4 Other Income (non-operating) (A.4.1 + A.4.2 + A.4.3 + A.4.4)99,253 75,<strong>17</strong>9 104,926A.4.1 Interest Income76,466 71,825 84,948A.4.2 Dividend IncomeA.4.3 Gain / (Loss) from selling of Assets, specify- - -(A.4.3.1 + A.4.3.2 + A.4.3.3 + A.4.3.4)A.4.3.1A.4.3.2A.4.3.3A.4.3.4A.4.4 Others, specify22,787 3,354 19,978(A.4.4.1 + A.4.4.2 + A.4.4.3 + A.4.4.4)A.4.4.1 Other Income22,787 3,354 19,978A.4.4.2 -A.4.4.3A.4.4.4B. COST OF GOODS SOLD (B.1 + B.2 + B.3)- - -B.1 Cost of Goods Manufactured (B.1.1 + B.1.2 + B.1.3 + B.1.4 + B.1.5)- - -B.1.1 Direct Material UsedB.1.2 Direct LaborB.1.3 Other Manufacturing Cost / OverheadB.1.4 Goods in Process, BeginningB.1.5 Goods in Process, End (negative entry)B.2 Finished Goods, BeginningB.3 Finished Goods, End (negative entry)C. COST OF SALES (C.1 + C.2 + C.3)- - -C.1 PurchasesC.2 Merchandise Inventory, BeginningC.3 Merchandise Inventory, End (negative entry)D. GROSS PROFIT (A - B - C)1,748,109 1,726,796 1,583,250NOTE: Pursuant to SRC Rule 68.1 (as amended in Nov. 2005), for fiscal years ending December 31, 2005 up to November 30, 2006, acomparative format of only two (2) years may be filed to give temporary relief for covered companies as the more complex PFRSs willbe applied for the first time in these year end periods. After these first time applications, the requirement of three (3) year comparativesshall resume for year end reports beginning December 31, 2006 and onwards.Page 5
Control No.:<strong>Form</strong> Type:PHFS (rev 2006)SPECIAL FORM FOR FINANCIAL STATEMENTS OF PUBLICLY-HELD AND INVESTMENT COMPANIESNAME OF CORPORATION: FAR EASTERN UNIVERSITY, INC. AND SUBSIDIARIESCURRENT ADDRESS:Nicanor Reyes Sr. St., Sampaloc, ManilaTEL. NO.: 735-5621FAX NO.: 736-0039COMPANY TYPE : Educational InstitutionsPSIC:If these are based on consolidated financial statements, please so indicate in the caption.Table 2. Income StatementF I N A N C I A L D A T A2008 2007 2006( in P'000 ) ( in P'000 ) ( in P'000 )E. OPERATING EXPENSES (E.1 + E.2 + E.3 + E.4)1,065,892 1,030,215 913,221E.1 Selling or Marketing ExpensesE.2 Administrative Expenses 149,454 131,421 153,020E.3 General Expenses 104,260 98,432 95,886E.4 Other Expenses, specify (E.4.1 + E.4.2 + E.4.3 + E.4.4 + E.4.5 + E.4.6 + E.4.7812,<strong>17</strong>8 800,362 664,315+ E.4.8 + E.4.9 + E.4.10)E.4.1 Education-related expendituresE.4.2 Instructional and Academic694,246 650,139 567,228E.4.3 Maintenance and Operations1<strong>17</strong>,932 147,340 97,087E.4.4 Marketing and Selling- 2,883 -E.4.5E.4.6E.4.7E.4.8E.4.9E.4.10F. FINANCE COSTS (F.1 + F.2 + F.3 + F.4 + F.5)F.1F.2F.3F.4F.5Interest on Short-Term Promissory NotesInterest on Long-Term Promissory NotesInterest on bonds, mortgages and other long-term loansAmortizationOther interests, specify (F.5.1 + F.5.2 + F.5.3 + F.5.4 + F.5.5)F.5.1F.5.2F.5.3F.5.4F.5.5G. NET INCOME (LOSS) BEFORE TAX (D - E - F)682,2<strong>17</strong> 696,581 670,029H. INCOME TAX EXPENSE (negative entry) (68,411) (68,510) (69,680)I. INCOME(LOSS) AFTER TAX613,806 628,071 600,349J. Amount of (i) Post-Tax Profit or Loss of Discontinued Operations; and (ii) Post-Tax Gain or Loss Recognized on theMeasurement of Fair Value less Cost toSell or on the Disposal of the Assets or Disposal Group(s) constituting theDiscontinued Operation (if any)J.1J.2K. PROFIT OR LOSS ATTRIBUTABLE TO MINORITY INTEREST13,113 15,404 18,402L PROFIT OR LOSS ATTRIBUTABLE TO EQUITY HOLDERS OF THE PARENT600,693 612,667 581,947M. EARNINGS (LOSS) PER SHAREM.1 Basic85.74 104.94 124.58M.2 Diluted85.74 104.94 124.58Page 6
Control No.:<strong>Form</strong> Type:PHFS (rev 2006)SPECIAL FORM FOR FINANCIAL STATEMENTS OF PUBLICLY-HELD AND INVESTMENT COMPANIESNAME OF CORPORATION: FAR EASTERN UNIVERSITY, INC. AND SUBSIDIARIESCURRENT ADDRESS: Nicanor Reyes Sr. St., Sampaloc, ManilaTEL. NO.: 735-5621FAX NO.: 736-0039COMPANY TYPE Educational InstitutionsPSIC:If these are based on consolidated financial statements, please so indicate in the caption.Table 3. Cash Flow StatementsF I N A N C I A L D A T A2008 2007 2006( in P'000 ) ( in P'000 ) (in P'000)CASH FLOWS FROM OPERATING ACTIVITIESNet Income (Loss) Before Tax and Extraordinary Items682,2<strong>17</strong> 696,581 670,029Adjustments to Reconcile Net Income to Net Cash Provided by Operating ActivitiesDepreciation47,805 46,809 31,105Amortization, specifyImpairment loss on real estate held for sale- (901) 11,034Impairment losses on receivables<strong>17</strong>,451 12,686 10,940Others, specify: Unrealized foreign exchange (gain) loss(1,860) - 882Interest income(76,467) (71,825) (84,948)Income on AFS investments (5,107) (7,803) -Gain on sale of real estate held for sale (129) - -Gain on disposal of property and equipment- (102) (1,190)Share in net losses of an associate25 36 24Write-down of Property, Plant, and EquipmentChanges in Assets and Liabilities:Decrease (Increase) in:Receivables (60,075) (9,565) (44,611)InventoriesOther Current Assets (13,363) 9,268 (9,399)Others, specify: Real estate held for sale(104) (6,364) (142)Increase (Decrease) in:Accounts payable and other current liabilities 43,804 28,957 5,794Deferred income 16,723 (844) 54,641Others, specify: Obliation under finance lease(1,754) (1,334) (25,838)Interest received68,390 73,565 84,948Income taxes paid(58,991) (60,600) (58,600)A. Net Cash Provided by (Used in) Operating Activities (sum of above rows)658,565 708,564 644,669CASH FLOWS FROM INVESTING ACTIVITIES(Increase) Decrease in long-term receivables(Increase) Decrease in investment and advances (13,871) (433,489) (4,672)Reductions/(Additions) to property, plant, and equipment (49,603) (<strong>17</strong>,686) (189,622)Others, specifyDisposal of property and equipment- <strong>17</strong>5 1,231(Increase) in other assets(2,161) 14,465 26(Increase) in investment property(96,148) (16,134) (10,205)(Increase) Decrease in held to maturity investments258 (19,704) 424B. Net Cash Provided by (Used in) Investing Activities (sum of above rows)(161,525) (472,373) (202,818)CASH FLOWS FROM FINANCING ACTIVITIESProceeds from:LoansLong-term DebtIssuance of SecuritiesOthers, specify: Increase (Decrease) in trust funds(12,448) 18,959 18,427Payments of:(Loans)(Long-term Debt) - - (20,000)(<strong>Stock</strong> Subscriptions)Others, specify (negative entry):Dividends(194,554) (<strong>17</strong>1,266) (112,107)C. Net Cash Provided by (Used in) Financing Activities (sum of above rows)NET INCREASE IN CASH AND CASH EQUIVALENTS (A + B + C)Cash and Cash EquivalentsBeginning of yearEnd of year(207,002) (152,307) (113,680)290,038 83,884 328,<strong>17</strong>1975,579 891,695 563,5241,265,6<strong>17</strong> 975,579 891,695Page 7
Control No.:<strong>Form</strong> Type:PHFS (rev 2006)SPECIAL FORM FOR FINANCIAL STATEMENTS OF PUBLICLY-HELD AND INVESTMENT COMPANIESNAME OF CORPORATION: FAR EASTERN UNIVERSITY, INC. AND SUBSIDIARIESCURRENT ADDRESS: Nicanor Reyes Sr. St., Sampaloc, ManilaTEL. NO.: 735-5621FAX NO.:-COMPANY TYPE : Educational InstitutionsPSIC:If these are based on consolidated financial statements, please so indicate in the caption.Table 4. Statement of Changes in Equity(Amount in P'000)F I N A N C I A L D A T ACapital <strong>Stock</strong>Additional Paid-inCapitalNet Unrealized Gain(Loss) on AFSRevaluationIncrementTranslationDifferencesRetainedEarningsMinority InterestTOTALA. Balance, 2006467,114 (5,401) 1,531,763 267,455 2,260,931A.1 Correction of Error(s)A.2 Changes in Accounting PolicyB. Restated Balance 467,114 1,531,763 267,455 2,266,332C. SurplusC.1 Surplus (Deficit) on Revaluation ofPropertiesC.2 Surplus (Deficit) on Revaluation ofInvestmentsC.3 Currency Translation DifferencesC.4 Other Surplus (specify)C.4.1 Net unrealized gain for the year5,404 5,404C.4.2 Cumulative net unrealized loss(gain) recognized in profit or lossduring the year5,568 5,568C.4.3C.4.4C.4.5D. Net Income (Loss) for the Period612,666 15,405 628,071E. Dividends (negative entry)(408,720) (408,720)F. Appropriation for (specify)F.1 Expansion of facilitiesF.2 Purchases of equipment and improvementsF.3F.4G. Issuance of Capital <strong>Stock</strong>G.1 Common <strong>Stock</strong>233,523 233,523G.2 Preferred <strong>Stock</strong>G.3 OthersH. Balance, 2007700,637 1,735,709 282,860 2,719,206H.1 Correction of Error (s)H.2 Changes in Accounting PolicyI. Restated Balance 700,637 5,571 1,735,709 282,860 2,724,777J. SurplusJ.1 Surplus (Deficit) on Revaluation ofPropertiesJ.2 Surplus (Deficit) on Revaluation ofInvestmentsJ.3 Currency Translation DifferencesJ.4 Other Surplus (specify)J.4.1 Net unrealized gain for the year1,<strong>17</strong>6 1,<strong>17</strong>6J.4.2 Cumulative net unrealized loss(gain) recognized in profit or lossduring the year(5,514) (5,514)J.4.3J.4.4J.4.5K. Net Income (Loss) for the Period600,693 13,113 613,806L. Dividends (negative entry)(315,286) (315,286)M. Appropriation for (specify)M.1 Expansion of facilitiesM.2 General retirementM.3M.4M.5N. Issuance of Capital <strong>Stock</strong>N.1 Common <strong>Stock</strong>N.2 Preferred <strong>Stock</strong>N.3 OthersO. Balance, 2008704,370 1,233 2,021,116 295,973 3,018,959Page 8
Control No.:<strong>Form</strong> Type:PHFS (rev 2006)SPECIAL FORM FOR FINANCIAL STATEMENTS OF PUBLICLY-HELD AND INVESTMENT COMPANIESNAME OF CORPORATION: FAR EASTERN UNIVERSITY, INC. AND SUBSIDIARIESCURRENT ADDRESS:Nicanor Reyes Sr. St., Sampaloc, ManilaTEL. NO.: 735-5621FAX NO.: 736-0039COMPANY TYPE : Educational InstitutionsPSIC:If these are based on consolidated financial statements, please so indicate in the caption.Table 5. Details of Income and Expenses, by source(applicable to corporations transacting with foreign corporations/entities)2008 2007 2006F I N A N C I A L D A T A( in P'000 ) ( in P'000 ) ( in P'000 )A. REVENUE / INCOME (A.1 + A.2)A.1 Net Sales or Revenue / Receipts from Operations (manufacturing, mining,utilities,trade, services, etc.) (from Primary Activity) (A.1.1 +A.1.2)A.1.1 DomesticA.1.2 ForeignA.2 Other Revenue (A.2.1 +A.2.2)A.2.1 DomesticA.2.2 Foreign, specify (A.2.2.1+A.2.2.2+ A.2.2.3+ A.2.2.4+ A.2.2.5+ A.2.2.6+A.2.2.7+ A.2.2.8+A.2.2.9+A.2.2.10)A.2.2.1A.2.2.2A.2.2.3A.2.2.4A.2.2.5Not ApplicableA.2.2.6A.2.2.7A.2.2.8A.2.2.9A.2.2.10B. EXPENSES (B.1 + B.2)B.1 DomesticB.2 Foreign, specify(B.2.1+B.2.2+B.2.3+B.2.4+B.2.5+B.2.6+B.2.7+B.2.8+B.2.9+B.2.10)B.2.1B.2.2B.2.3B.2.4B.2.5B.2.6B.2.7B.2.8B.2.9B.2.10.Page 9
FAR EASTERN UNIVERSITYP.O. BOX 609MANILA, PHILIPPINES<strong>SEC</strong>URITIES AND EXCHANGE COMMISSION<strong>SEC</strong> FORM <strong>17</strong> - AANNUAL REPORT PURSUANT TO <strong>SEC</strong>TION <strong>17</strong>OF THE <strong>SEC</strong>URITIES REGULATION CODEAND <strong>SEC</strong>TION 141 OF THE CORPORATION CODE1. For the fiscal year ended March 31, 20082. <strong>SEC</strong> Identification Number 5383. BIR Tax Identification No. 000-225-4424. Exact name of registrant as specified in its charter <strong>Far</strong> <strong>Eastern</strong> <strong>University</strong>, Inc.5. PHILIPPINESProvince, Country or other jurisdiction ofincorporation or organization6. ____________/ / (<strong>SEC</strong> use only)/____________/Industry Classification Code:7. Nicanor Reyes Street, Sampaloc, Manila 1008Address of principal officePostal Code8. (632) 735-56-21Issuer's telephone number including area code9. NOT APPLICABLE<strong>Form</strong>er name, former address, and former fiscal year, if changed since last report.10. Securities registered pursuant to Sections 8 and 12 of the SRC, or Sec. 4 and 8 of theRSATitle of Each ClassNumber of Shares of Common<strong>Stock</strong> Outstanding and Amountof Debt OutstandingCommon <strong>Stock</strong>, P100.00 par value 7,006,368Bond with Non-Detachable Warrant,P/ 1.00 per unitNot Applicable
- 2 -11. All securities (common shares) are listed with the <strong>Philippine</strong> <strong>Stock</strong> <strong>Exchange</strong>, Inc.12. Check whether the registrant:(a) has filed reports required to be filed by Section I7 of the SRC and SRC Rule <strong>17</strong>thereunder and Sections 26 and 141 of the Corporation Code of the <strong>Philippine</strong>sduring the preceding 12 months (or for such shorter period that the registrant wasrequired to file such reports);Yes [ x ] No [ ]13. The aggregate market value of the voting stock held by non-affiliates: None
- 3 -TABLE OF CONTENTSPART I - BUSINESS AND GENERAL INFORMATION NO. OF PAGESItem 1 - Business 5Item 2 - Properties 3Item 3 - Legal Proceedings 2Item 4 - Submission of Matters ToA Vote of Security Holders 1PART II -OPERATIONAL AND FINANCIAL INFORMATIONItem 5 -Item 6 -Market for Issuer’s CommonEquity and Related <strong>Stock</strong>holdersMatters 3Management’s Discussion andAnalysis or Plan Operation 9Item 7 - Financial Statements 73Item 8 - Changes in and Disagreements 1With Accountants on Accounting andFinancial DisclosurePART III -CONTROL AND COMPENSATION INFORMATIONItem 9 - Directors and Executive Officersof the Issuer 6Item 10- Executive Compensation 2Item 11- Security Ownership of CertainBeneficial Owners and Management 2Item 12- Certain Relationship and RelatedTransactions 1PART IVCORPORATE GOVERNANCEItem 13- Corporate Governance 1PART VEXHIBITS AND SCHEDULESItem 14- Exhibits and Reports on <strong>SEC</strong> <strong>Form</strong> <strong>17</strong>-Ca. Exhibits 1b. Reports on <strong>SEC</strong> FORM I7 - C 3c. Quarterly Reports 1
- 4 -PART I - BUSINESS AND GENERAL INFORMATIONItem 1. Business<strong>Far</strong> <strong>Eastern</strong> <strong>University</strong>, Inc. ("FEU or the "Corporation") was incorporated in1933Brief Discussion of Business<strong>Far</strong> <strong>Eastern</strong> <strong>University</strong>, Inc., founded in 1928, is a private non-sectarian institution of learningcommitted to the highest intellectual, moral and cultural standards. It strives to produceprincipled and competent graduates. It nurtures a service-oriented community which seeks tocontribute to the advancement of society. Tuition and other fees which are the main sources of itsfinancial stability are moderate, subject to government regulation. The <strong>University</strong> also provides fulland partial scholarships to deserving students. An FEU Foundation supplements the <strong>University</strong>scholarship program by providing special grants. The <strong>University</strong> maintains excellent facilities suchas an electronic library, various types of laboratory, auditorium, audio-visual and multimediarooms, clinic, technology-based gate security and enrollment system, gymnasiums, and spaciousair-conditioned classrooms to best serve the students. The <strong>University</strong> was granted deregulatedstatus for five years beginning second semester, SY 2001-2002. Per CHED Memorandum OrderNo. 59 series of 2007, FEU has been granted again the deregulated status effectiveNovember 15, 2007 to November 14, 2008.Product:The Corporation is an educational institution. A private, non-sectarian institution oflearning comprising the following different Institutes that offer specific courses:A) Institute of Arts and Sciences (IAS)Courses:Masteral:Baccalaureate:Master of Arts (MA) major in:• Mass Communication• Letters• PsychologyBachelor of Arts (AB) major in:• Mass Communication• English Language• Political Science• LiteratureGranted Government Permit to offer 1 st & 2 nd Year LevelsBachelor of Arts in:• English• Literature• Political Science• International Studies
- 5 -Bachelor of Science (BS) major in BiologyBachelor of Science (BS) in:• Psychology• Applied Mathematics with Information TechnologyB) Institute of Accounts, Business and FinanceCourses:Masteral:Baccalaureate:Certificate:Master in Business Administration (MBA) (Without Thesis Program)Bachelor of Science (BS) major in:• Accountancy• Hotel and Restaurant Management (Granted GovernmentPermit to offer 1 st and 2 nd Year Levels)• Commerce, major in Finance• Commerce, major in Financial Economics• Commerce, major in Internal Auditing• Commerce, major in Tourism Management• Commerce, major in Marketing Management• Commerce, major in Legal Management• Commerce, major in ManagementAssociate in Computer SecretarialC) Institute of EducationCourses:Doctoral:Masteral:Doctor of Education (Ed.D.) major in Educational AdministrationMaster of Arts in Education major in:• Educational Administration (Thesis Program)• Curriculum and Instruction (Thesis Program)• Curriculum and Instruction (Without Thesis Program)• Special Education (Thesis Program)
- 6 -Baccalaureate:Certificate:Bachelor of Elementary Education (B.E.Ed.) major in:• General Education• Special EducationBachelor of Secondary Education (B.S.Ed.) major in:• Mathematics• Sports & Recreational Management• English• Filipino• General Science• Music, Arts and Physical EducationCertificate in Teacher Education (Teacher Certificate Program)D) Institute of Architecture and Fine Arts (IARFA)Courses:Bachelor of Science in Architecture (B.S. Arch.)Bachelor of Fine Arts (BFA) major in:• Advertising Arts• PaintingE) Institute of Law (IL)Courses:Post-Baccalaureate:Bachelor of Laws (Ll.B.)Juris Doctor of LawsF) Institute of NursingCourses:Masteral:Master of Arts in NursingBaccalaureate:Bachelor of Science in Nursing (BSN)
- 7 -All courses offered in the <strong>University</strong> were granted approval/permits by CHED and other concernedgovernment institutions.Accreditation on CoursesThe <strong>Philippine</strong> Association of Colleges and Universities Commission on Accreditation(PACUCOA) granted Certificates of Level III Reaccredited Status, from April 24, 2006 toApril 2011 to Liberal Arts major in:1. Literature Program2. English Program3. English Language Program3. Mass Communication Program4. Economics Program5. Political Science ProgramSimilarly, effective March 06, 2006 to March 2011, PACUCOA granted a Level IIIReaccredited Status to Commerce, major in:1. Economics/Financial Economics Program2. Finance Program3. Financial Accounting Program4. Internal Auditing Program5. Legal Management Program6. Management Program7. Marketing / Marketing Management Program8. Tourism Management ProgramLikewise, the Bachelor in Elementary Education Program and Bachelor in SecondaryEducation Program were granted by PACUCOA Level II Reaccredited Status effectiveFebruary 16, 2004 until February 2009.The <strong>Philippine</strong> Accreditating Association of Schools, Colleges and Universities(PAASCU) issued a certificate of accreditation to the <strong>University</strong>’s Nursing Program from May31, 2005 valid until May 2010.Using quality management system, the <strong>University</strong> is also ISO (International StandardOrganization) certified through Certificate Registration No. TUV100 05 0416 TMS valid fromJanuary 18, 2006 to January <strong>17</strong>, 2009.
- 8 -Distribution methods of the products/services:Since this is an educational institution, its services are certainly focused on thestudents.The tuition fees of students in the following Institutes significantly contributed to the revenues ofthe <strong>University</strong>:InstitutePercentage to RevenuesInstitute of Accounts, Business 25%and FinanceInstitute of Arts and Sciences 12.5%Associate in Health Science Education 35.71%Institute of Nursing 16.07%Customers:StudentsPurchases of Raw Materials: NOT APPLICABLEDistribution methods of the products/services:Since this is an educational institution, its services are certainly focused on the students.Competition:Since the school which is the main core of the business is situated in the <strong>University</strong> Belt, thecompetitors are prestigious colleges and universities within the specified area. FEU caneffectively compete with these institutions of learning because of its well-modulated tuition feessubject to government regulations, air-conditioned classrooms, electronic library and continuousimprovement of physical plant and facilities. Diverse scholarships are also offered and amagnificent line-up of cultural performances for the whole year are presented, free for allstudents. Moreover, the <strong>University</strong> recently acquired the Level III re-accredited status formost of its Liberal Arts and Commerce programs.
Item 2. Properties- 9 -FEU owns Seventeen Thousand Nine Hundred Sixty-Seven (<strong>17</strong>,967) square meters of real properties with improvementsin Nicanor Reyes Street, Sampaloc, Manila, wherein its main campus is situated.The principal properties which include buildings, land improvements and equipments are as follows:Gross BookValueAccumulatedDepreciation Net Book Value Location Condition-L A N D 124,664,583.00 - 124,664,583.00 Manila Very GoodBUILDINGS & LAND IMPROVEMENTSNew Technology Building II 278,391,485.00 27,839,149.00 250,552,336.00 " "College of Engineering Bldg. (incl. Annex) 200,763,421.00 57,126,003.00 143,637,418.00 " "Alfredo Reyes Hall 60,210,000.00 22,277,700.00 37,932,300.00 " "Leasehold Improvement 49,670,926.00 12,325,394.00 37,345,532.00 " "New Technology Building-Idle Hosp. Bldg. 47,651,778.00 9,757,365.00 37,894,413.00 " "Science Building 20,135,659.00 8,849,368.00 11,286,291.00 " "Arts Building 7,081,207.00 5,166,887.00 1,914,320.00 " "Nicanor Reyes Hall 8,325,108.00 1,261,670.00 7,063,438.00 " "GEC & Educational Hall 456,183.00 - 456,183.00 " "Grade School 592,079.00 - 592,079.00 " "S B Covered Walk 6<strong>17</strong>,737.00 463,303.00 154,434.00 " "Covered Passage 536,592.00 430,271.00 106,321.00 " "Fence 715,360.00 475,121.00 240,239.00 " "Campus Pavilion 315,000.00 236,250.00 78,750.00 " "GSB Covered Walk 310,000.00 232,499.00 77,501.00 " "Powerhouse 296,196.00 296,196.00 - " "Chapel 123,205.00 - 123,205.00 " "Others 7,840,138.00 81,127.00 7,759,011.00 " "Grandstand 48,554.00 49,263.00 (709.00) " "684,080,628.00 146,867,566.00 537,213,062.00CONSTRUCTION IN PROGRESS 982,713.00 - 982,713.00 " "EQUIPMENTSFurnitures & Fixtures 14,483,812.00 8,756,986.00 5,726,826.00 " "Electrical & Mechanical 60,845,537.00 46,194,276.00 14,651,261.00 " "Information Technology 19,923,756.00 15,204,238.00 4,719,518.00 " "Transportation Equipment 11,758,843.00 6,924,799.00 4,834,044.00 " "Miscellaneous Fixed Assets 10,645,124.00 10,587,304.00 57,820.00 " "Instruments & Utensils 514,484.00 208,375.00 306,109.00 " "T o o l s 830,079.00 587,454.00 242,625.00 " "Linen 294,889.00 276,118.00 18,771.00 " "Museum Collection 124,573.00 - 124,573.00 " "119,421,097.00 88,739,550.00 30,681,547.00TOTAL 929,149,021.00 235,607,116.00 693,541,905.00The above-mentioned properties are not mortgaged, encumbered, or under any lien.
- 10 -Properties leased by the corporation from FERN Realty, Inc.MonthlyRental_ContractDate__Education Building – an eight (8) storey building P29,730656.19 July 1,made of concrete materials located on plus 2007Nicanor Reyes St., Manila applicable VAT toJune 30,2008Nursing Building – an eight (8) storey buildingmade of concrete materials located onNicanor Reyes St., ManilaLaw Building – a four (4) storey building madeof concrete materials located onNicanor Reyes St., ManilaAdministration Building – a four (4) storey building madeof concrete materials located onNicanor Reyes St., ManilaGymnasium - a two (2) storey building made of concrete materialslocated on R. Papa St., ManilaThe lease contract shall not be deemed extended by implication beyond the contract period forany cause or reason whatsoever, but only by negotiation and written agreement of the LESSORand the LESSEE.
- 11 -Employees:Number of EmployeesOfficials - 11Senior Staff - 46Non-Academic:Supervisor - 42Rank-and-File - 426Academic:Lecturer - 861Regular - 369With the economic condition prevailing in the country, the corporation has no plan of hiringemployees within the ensuing twelve months. It will make use of its present employees andfaculty members to meet its manpower requirements.Inclusive Dates of CBANon-Academic July 16, 2006 - July 15, 2009Academic Sept. 1, 2006 - August 31, 2009The labor unions of the employees and the faculty members have never been on strike in thelast ten years, and pose no threat to strike in the foreseeable future. Employees and facultymembers have a harmonious relationship with the Administration.Working Capital:All of the company's working capital for its existing operation forfiscal year April 1, 2007 to March 31, 2008 was internally generated.Item 3. Legal ProceedingsHereunder is the list of the legal proceedings involving the company which are beinghandled by Atty. Enrico G. Gilera, the <strong>University</strong>’s Legal Counsel:External CasesA. Pending Court Cases as of 31 March 20081. Melvira David, et al, vs. FEU, NLRC Case No. 00-11-09142-20062. Eric Casado vs. FEU et al, NLRC Case No. 09-010708-20073. FEU-ELU (PLAC) vs. FEU, Case No. CA GR No. CA GR No. SP NO. 1022494. Susana Lana vs. FEU, NLRC Case No. 00-07-08530-20045. Annabelle Mercado vs. FEU, NLRC Case No. 05-04546-20076. Delia Valenzuela, et al, vs. FEU, NLRC Case No. 00-06-06312-20077. Fina A. Gabonada vs. FEU et al, CA GR No. 042388-20048. Florante S. Quizon vs. Atty. Enrico G. Gilera, ADM Case No. 68<strong>17</strong>9. Jesus Fernando Dujua vs. FEU, NLRC Case No. 04-05603-200810. FEU-ELU (PLAC) vs, FEU, NCMB-NCR-NTA-05-010-2008
- 12 -B. Recently Dismissed cases1. Ma. Enolita Faustino, et al, vs. FEU NLRC Case No. 00-04-037<strong>17</strong>-2007,dismissed on 27 November 20072. Fina Gabonada vs. FEU, NLRC Case No. 00-01-00134-2007, dismissed on27 June 20073. Nora Gimpao vs. FEU, NLRC Case No. 00-04-03529-2007, dismissed on 30August 20074. Bernard Quizon vs. FEU, NLRC Case No. 01-262-200, dismissed on 16October 20075. Herbert Delos Reyes vs. FEU, NLRC Case No. 00-09-07303-2006,dismissed on 31 March 2008Involvement of Directors and Officers in Certain Legal ProceedingsNone of the directors and officers were involved during the past five (5) years in any bankruptcyproceeding. Neither have they been convicted by final judgment in any criminal proceeding orbeen subject to any order, judgment or decree of competent jurisdiction, permanently ortemporarily enjoining barring, suspending, or otherwise limiting their involvement in any type ofbusiness, securities, commodities, or banking activities, nor found by any court or administrativebody to have violated a securities or commodities law.The registrant or any of its subsidiaries or affiliates is not a party to any pending legal proceedingsin which any of their property is the subject.Item 4. Submission of Matters to a Vote of Security HoldersThe registrant is not a party to any voting trust agreement. No security holder of theRegistrant holds a voting trust or any other similar agreement.Part II - OPERATIONAL AND FINANCIAL INFORMATIONItem 5. Market for Registrants Common Equity and Related <strong>Stock</strong>holders MattersDividends During the Year:Cash Dividend:DIVIDENDS DECLARED FOR THE FISCAL YEAR ENDED MARCH 31, 2008Payment/IssuedOutstandingDate Particulars Amount SharesJuly 23, 2007 P 15.00/share P 105,095,520.00 7,006,368Jan. <strong>17</strong>, 2008 15.00/share 105,095,520.00 7,006,368P 210,191,040.00===============
- 13 -<strong>Stock</strong> Dividend:40% stock dividend declared by the Board of Trustees at its meeting held on March 25, 2008 subjectto confirmation by the stockholders at the regular annual stockholders’ meeting to be held onAugust 23, 2008. The record date of dividend shall be determined after said annual meeting, and tobe issued as soon thereafter the necessary <strong>SEC</strong> and PSE permits or authorization shall have beenreleased.All fractional shares resulting from said stock dividend shall be paid in cash by the Corporation at parvalue.Recent Sales of Unregistered SecuritiesNot a single common share is considered unregistered security. All shares are registered with the<strong>Philippine</strong> <strong>Stock</strong> <strong>Exchange</strong>, Inc. Thus, checklist of requirements for Sale of Unregistered Securities isnot applicable.The <strong>Philippine</strong> <strong>Stock</strong> <strong>Exchange</strong>, Inc. is the principal market where the corporation’s common equity istraded.Market Prices of Common <strong>Stock</strong>s: (Phil. <strong>Stock</strong> <strong>Exchange</strong>, Inc.)Herewith are the high, low, and closing prices of shares of stock traded from April 2007 to March 2008:Date High Low CloseApril 2007 P/ 850.00 810.00 810.00May “ 805.00 650.00 805.00June “ 850.00 800.00 850.00July “ 860.00 850.00 860.00Aug. “ 870.00 820.00 870.00Sept. “ 880.00 825.00 880.00Oct. “ 825.00 825.00 825.00Nov. “ 900.00 780.00 810.00Dec. “ 810.00 805.00 805.00Jan. 2008 900.00 830.00 900.00Feb. “ 920.00 830.00 920.00March “ 950.00 900.00 900.00High and low sale prices for each quarter are as follows:A) April 01, 2007 - March 31, 2008Period High Low CloseFirst Quarter P/ 835.00 P/ 753.33 P/ 821.67Second “ 870.00 831.67 870.00Third “ 845.00 803.33 813.33Fourth “ 923.33 853.33 906.67
- 14 -B) April 1, 2006 – March 31, 2007Period High Low CloseFirst Quarter P/ 905.00 P/ 771.67 P/ 886.67Second “ 1,116.67 933.33 1,050.00Third “ 820.00 793.33 803.33Fourth “ 886.67 806.67 826.67The number of shareholders on record as of March 31, 2008 was One Thousand Three HundredEighty-Three (1,383). Common shares issued and outstanding were 7,006,368.20 TOP FEU STOCKHOLDERS AS OF MARCH 31, 2008Title of ClassName of Beneficial OwnerNo. of Sharesand Nature ofBeneficialOwnershipCitizenshipPercentOf Class1. Common Seyrel Investment and2,005,597 – D Filipino 28.6253Realty Corporation2. Common Sysmart Corporation 1,461,529 – D Filipino 20.86003. Common Desrey, Incorporated 560,572 – D Filipino 8.00094. Common Sr. Victorina D. Palanca 321,119 – D Filipino 4.58325. Common Angelina D. Palanca 221,325 – D Filipino 3.15896. Common Aurelio R. Montinola III 108,280 – D Filipino 1.54547. Common Lourdes R. Montinola 103,279 – D Filipino 1.47418. Common Marco P. Gutang 89,344 – D Filipino 1.27529. Common Gonzaga-Lopez Enterprises, Inc 85,812 – D Filipino 1.224810. Common Jomibel Agricultural76,057 – D Filipino 1.0855Development Corporation11. Common PCD Nominee Corporation 69,860 – D Filipino 0.9971(Filipino)12. Common AMON Trading Corporation 45,438 – D Filipino 0.6485(Filipino)13. Common PCI Bank-Trust Banking FAO 37,867 – D Filipino 0.5405Estate of Pacita Roces TA #503-50902-714. Common ZARE, Inc. 35,443 – D Filipino 0.505915. Common Rosario P. Melchor 34,449 – D Filipino 0.49<strong>17</strong>16. Common Rosario Panganiban Melchor 31,273 – D Filipino 0.4464<strong>17</strong>. Common Mitos Sison 28,833 – D Filipino 0.411518. Common Consorcia P. Reyes 28,098 – D Filipino 0.401019. Common Vicente R. Icasiano 23,833 – D Filipino 0.340220. Common Caridad I. Santos 23,788 – D Filipino 0.3395
- 15 -Item 6.Management’s Discussion and Analysis or Plan of OperationFinancial Position :As of March 31, 2005, total assets amounted to P1,748 million which was 21% higherthan the previous year’s P1,448.6 million. Total liabilities amounted to P296.4 million whichwas 1.3% lower than the previous year’s P300.5 million. Equity amounted to P1,451.6 millionwhich was 26% higher than the previous year’s P1,148.1 million. Current ratio was 4.4:1 anddebt was 20% of equity.As of March 31, 2006, total assets reached P2,260.4 million which was 29% higher thanthe previous year’s P1,748 million while total liabilities amounted to P357.6 million which was21% higher than the previous year’s P296.4 million. Equity amounted to P1,902.8 million whichwas 31% higher than the previous year’s P1,451.6 million. Current ratio was 4.89:1 and debtwas 19% of equity.As of March 31, 2007, total assets amounted to P2,741.1 million which was 21% higherthan the previous year’s P2,260.4 million. Total liabilities amounted to P398.9 million whichwas 11.5% higher than the previous year’s P357.6 million. Equity amounted to P2,342.2 millionwhich was 23% higher than the previous year’s P1,902.8 million. Current ratio was 6.3:1 anddebt was <strong>17</strong>% of equity.As of March 31, 2008 total assets amounted to P3,197.2 million. Total liabilitiesamounted to P581.7 million while total stockholders’ equity reached P2,615.5 million.Compared to the previous year, assets, liabilities and stockholders’ equity increased by <strong>17</strong>%,46% and 12 % respectively. Current ratio was 4.6:1 and debt was 22% of equity.For the last 4 years, total assets increased at an average rate of 22% or P437.15 million ayear. Total liabilities also increased but at a lower average rate of 19% or P70.0 million a yearwhile equity increased at an average rate of 23% or P366.85 million a year. The increase inassets was due to the increase in liabilities and stockholders’ equity. The increase in liabilitieswas due to special funds and deposits collected from students which were intended for certainspecific purposes. The increase in equity was due to the continuous positive results of operationsfor the past 4 years which exceeded cash dividends paid over the same period of time.During the past four years, the company’s solvency steadily improved as shown by thefollowing figures in million Pesos:Excess of AssetsYear Total Assets Total Liabilities over LiabilitiesMarch 31, 2005 P1,748.0 296.4 1,451.6March 31, 2006 2,260.4 357.6 1,902.8March 31, 2007 2,741.1 398.9 2,342.2March 31, 2008 3,197.2 581.7 2,615.5
As of March 31, 2008, the company has P5.50 worth of assets to pay for every P1.00worth of liability.During the same period of time, the company’s liquidity also improved as shown by thefollowing statistics in million Pesos:Excess of Current AssetsYear Current Assets Current Liabilities over Current LiabilitiesMarch 31, 2005 P1,004.4 229.0 775.4March 31, 2006 1,327.8 271.8 1,056.0March 31, 2007 1,860.0 294.1 1,565.9March 31, 2008 2,268.6 489.4 1,779.2As of March 31, 2008, the company has P4.64 worth of current assets to pay for everyP1.00 worth of current liability.The constant and steady improvement in the company’s financial condition both insolvency and liquidity is largely attributed to the company’s net income each year over the pastfour years, net of cash dividends paid over the same period of time.Excess of NetCash DividendsIncome over CashNet Income Paid Dividends PaidYear ( in million ) ( in million ) % ( in million ) %2004 - 2005 P 384.6 93.4 24% 291.2 76%2005 - 2006 568.9 112.1 20% 456.8 80%2006 - 2007 603.5 <strong>17</strong>5.1 29% 428.4 71%2007 - 2008 592.9 315.2 53% 277.7 47%As a result and based on the above figures, around 68.5% of each year’s net income hasbeen retained by the company, thus, the steady increase in owners’ equity as follows:IncreaseOwner’s Equity(Decrease)Year ( in million ) ( in million ) %P1,148.1March 31, 2005 1,451.6 P 303.5 26%March 31, 2006 1,902.8 451.2 31%March 31, 2007 2,342.2 439.4 23%March 31, 2008 2,615.5 273.3 12%
As of March 31, 2008, owner’s equity accounts for 82% of total assets. Since 71% of thecompany’s total assets is current, the company can pay all its liabilities and still have 53%current assets and 29% non-current assets. In pesos, this would mean P1,686.9 million currentassets and P928.60million non-current assets after paying all liabilities amounting to P581.7million as of March 31, 2008.In Million %Owners’ Equity 2,615.5 82%Total Assets 3,197.2 100%Non-Current Assets 928.6 29%Current Assets 2,268.6 71%Total Liabilities 581.7 18%Current Assets after Total Liabilities 1,686.9 53%Results of OperationsFor the year 2004-2005, net income for the period amounted to P384.6 million which was38% higher than the previous year’s P278.5 million. This year’s figure consisted of 85% netoperating (educational) income and 15% other income. Net operating income increased byP119.3 million. Other income decreased by P1.1 million. As a result, net income after tax forthe year increased by P106.0 million.For the year 2005-2006, net income for the period amounted to P568.9 million which was48% higher than the previous year’s P384.6 million. This year’s figure consisted of 81% netoperating (educational) income and 19% other income. Net operating income increased byP145.2 million while other income increased by P57.3 million. As a result, net income after taxincreased again by P184.3 million.For the year 2006-2007, net income for the period was P603.5 million which was 6%higher than the previous year’s P568.9 million. This year’s figure consisted of 82% netoperating (educational) income and 18% other income. Net operating income increased byP35.1 million and other income by P.6 million. As a result, net income after tax for the yearincreased by P34.6 million.For the year 2007-2008, net income for the period amounted to P592.9 million which was1.75% lower than the previous year’s P603.5 million. This year’s figure consisted of 80% netoperating (educational) income and 20% other income. Net operating income decreased byP20.9 million while other income increased by P10.2 million. The combined effect resulted in adecrease in net income after tax by P10.6 million this year.
The company’s operating (educational) income steadily improved over the past 4 yearsdue to good enrollment and increasing tuition fee rates except in 2007-2008 when enrollmentdropped by approximately 8.8%.Average tuition feeEnrollmentYear rate per unit (1 st semester)2004 - 2005 818.00 24,3852005 - 2006 916.00 26,4112006 - 2007 976.00 26,2292007 - 2008 1,034.00 23,928Other income remained almost the same in 2004-2005 compared to 2003-2004 becausethe higher investment in the money market during the year was offset by lower interest rates.The increase in 2005-2006 was due to higher placements and better interest rates. Higher rentalincome was also a factor. The 2006-2007 figure was almost the same compared to the precedingyear but improved the following year due to relatively higher placements and ratesA Look of What Lies AheadDuring the past four years, the first semester enrollment ranged from 24,000 to 26,000students. Second semester enrolment would usually drop by an average of 10% to that of the firstsemester. Over the same period, tuition fee increased at an average rate of 11% a year for thefirst two years and 7% and 6% respectively for the succeeding two years. As a result, netoperating (educational) income improved except in 2007-2008 due to the 8.8% decrease inenrollment.This current school year, the further reduction in the first semester enrollment by about2.8% and the lower increase in tuition fees of 5% may affect the profitability of operations unlessoperating expenses are limited to the minimum.With the company’s total current assets amounting to P1,686.9 million and non-currentassets amounting to P928.6 million (net of all liabilities) as of March 31, 2008 and with theexpected net income, the company does not foresee any cash flow or liquidity problem in thenext 12 months or so despite the drop in enrollment and lower tuition fee increase. It is alsoexpected that the company shall easily meet all its commitments including those forimprovements in instructional and other facilities from its present reserves and from expectedfuture earnings.As for the years ahead, management will continue to uplift its academic standard bycontinuously updating its curriculum, strengthening its faculty, and further improving itsfacilities. With sustained improvements in all fronts and with reasonable tuition fee rates, the<strong>University</strong> is confident that it will still be able to maintain its market share in the industry.
Top Five (5) Key Performance IndicatorsI. Test of LiquidityLiquidity refers to the company’s ability to pay its short-term current liabilities asthey fall due. This is measured by any of the following:1. Current ratio measures the number of times that the current liabilities could bepaid with the available current assets (Adequate: at least 1.5:1)March 31, 2005 4.39:1March 31, 2006 4.89:1March 31, 2007 6.32:1March 31, 2008 4.64:12. Quick ratio measures the number of times that the current liabilities could bepaid with the available quick assets (Adequate: at least 1:1)March 31, 2005 4.35:1March 31, 2006 4.86:1March 31, 2007 6.29:1March 31, 2008 4.60:1II. Test of SolvencySolvency refers to the company’s ability to pay all its debts whether such liabilitiesare current or non-current. It is somewhat similar to liquidity, except that solvencyinvolves a longer time horizon. This is measured by any of the following:1. Debt to equity ratio measures the amount of assets provided by the creditorsrelative to that provided by the owner (Adequate : 100% or less)March 31, 2005 20%March 31, 2006 19%March 31, 2007 <strong>17</strong>%March 31, 2008 22%2. Debt to asset ratio measures the amount of assets provided by the creditorsrelative to the total amount of assets of the company. (Adequate: 50% or less)March 31, 2005 <strong>17</strong>%March 31, 2006 16%March 31, 2007 15%March 31, 2008 18%
3. Equity to asset ratio measures the amount of assets provided by the ownerrelative to the total assets of the company (Adequate: 50% or more)March 31, 2005 83%March 31, 2006 84%March 31, 2007 85%March 31, 2008 82%III. Test of ProfitabilityProfitability refers to the company’s earning capacity. It also refers to the company’sability to earn a reasonable amount of income in relation to its total investment. It ismeasured by any of the following:1. Return on total assets measures how well management has used its assetsunder its control to generate income (Adequate: at least equal to theprevailing industry rate).March 31, 2005 22%March 31, 2006 25%March 31, 2007 22%March 31, 2008 19%2. Return on owner’s equity measures how much was earned on the owners’or stockholders’ investment. (Adequate: at least equal to the prevailingindustry rate).March 31, 2005 26%March 31, 2006 30%March 31, 2007 26%March 31, 2008 23%3. Earnings per share measures the net income per share.March 31, 2005 P 82.34March 31, 2006 121.79March 31, 2007 103.37March 31, 2008 84.62IV.Product Standard1. Teaching performance in the <strong>University</strong> is constantly being monitored tomaintain a satisfactory level of excellence.
Teaching Excellence % toTotalYear Awardees Teaching force2004-2005 532 62%2005-2006 581 53%2006-2007 412 37%2007-2008 430 38%2. The <strong>Philippine</strong> Association of Colleges and Universities Commission onAccreditation (PACUCOA) has granted Certificates of Level III ReaccreditedStatus to our Commerce and Liberal Arts Programs. It has alsogranted Level II Re-accredited Status to our Elementary and SecondaryEducation Programs.The <strong>Philippine</strong> Accreditating Association of Schools, Colleges andUniversities (PAASCU), also issued a certificate of accreditation to the<strong>University</strong>’s Nursing Program.3. Performance of FEU graduates in the Board Exams surpassed the nationalpassing rate:FEU NationalPassing Rate Passing RateAccounting 47.7% 37%Law 32.69% 22.91%LET 42.35% 29.13%Nursing 61.8% 48%Architecture 30.4% 29.8%V. Market AcceptabilityBelow is a comparative schedule of first semester enrollment for the past 4 years:SYEnrollment2005-2006 26,4112006-2007 26,2292007-2008 23,9282008-2009 23,253Due to the worsening economic condition, it was estimated that the first semesterenrollment for SY 2008-2009 will be around 5% lower. Final figure was betterwith a decrease of only 2.8%. It also turned out that all institutes, except for theInstitute of Nursing, had a better enrollment.
The surge in the number of valedictorians, salutatorians and entrance meritscholars to more than 800 a year (833 in 2007-2008) during the past two schoolyears is an indication that FEU has become one of the better choices among thevarious colleges and universities in the metropolis.Facts:( In Million Pesos )March 31, 2005 March 31, 2006 March 31, 2007 March 31, 2008Quick Assets 996.6 1,321.6 1,851.1 2,253.2Current Assets 1,004.5 1,327.8 1,860.0 2,268.6Total Assets 1,748.0 2,260.4 2,741.1 3,197.2Current Liabilities 229.0 271.8 294.1 489.4Total Liabilities 296.4 357.6 398.9 581.7<strong>Stock</strong>holder’s Equity 1,451.6 1,902.8 2,342.2 2,615.5Net Income after Tax 384.6 568.9 603.5 592.9Total Outstanding shares(average) 4,671,142 shares 4,671,142 shares 5,838,440 shares 7,006,368 sharesOther Items1. There are no known trends, events or uncertainties which may have a material impact onliquidity.2. There are no known events that will trigger direct or contingent financial obligation thatmay be material to the company. There are also no known events that would result inany default or acceleration of an obligation.3. There are no material off-balance sheet transactions, arrangements, obligations(including contingent obligations), and other relationships of the company withunconsolidated entities or other persons created during the reporting period.4. There are no sales of Unregistered or Exempt Securities including Recent Issuance ofSecurities Constituting an Exempt Transaction.
<strong>Form</strong>ula1. Liquidity1. Current ratio = Current assetsCurrent Liabilities2. Acid test ratio = Quick assetsCurrent Liabilities2. Solvency1. Debt to Equity ratio = Total liabilitiesTotal <strong>Stock</strong>holder's Equity2. Debt to Asset ratio = Total liabilitiesTotal assets3. Equity to Asset ratio = Total <strong>Stock</strong>holder's EquityTotal assets3. Profitability1. Return on Assets = Net IncomeTotal assets2. Return on Owner's Equity = Net IncomeTotal <strong>Stock</strong>holder's Equity3. Earning per share = Net IncomeTotal Outstanding shares (average)
- 16 -FAR EASTERN UNIVERSITYSCHEDULE OF PROPERTY, PLANT & EQUIPMENTSCHOOL YEAR 2007 - 2008AccumulatedGross Book Value Depreciation Net Book Value Location Condition-L A N D 124,664,583.00 - 124,664,583.00 Manila Very GoodBUILDINGS & LAND IMPROVEMENTSNew Technology Building II 278,391,485.00 27,839,149.00 250,552,336.00 " "College of Engineering Bldg. (incl. Annex) 200,763,421.00 57,126,003.00 143,637,418.00 " "Alfredo Reyes Hall 60,210,000.00 22,277,700.00 37,932,300.00 " "Leasehold Improvement 49,670,926.00 12,325,394.00 37,345,532.00 " "New Technology Building-Idle Hosp. Bldg. 47,651,778.00 9,757,365.00 37,894,413.00 " "Science Building 20,135,659.00 8,849,368.00 11,286,291.00 " "Arts Building 7,081,207.00 5,166,887.00 1,914,320.00 " "Nicanor Reyes Hall 8,325,108.00 1,261,670.00 7,063,438.00 " "GEC & Educational Hall 456,183.00 - 456,183.00 " "Grade school 592,079.00 - 592,079.00 " "S B Covered Walk 6<strong>17</strong>,737.00 463,303.00 154,434.00 " "Covered Passage 536,592.00 430,271.00 106,321.00 " "Fence 715,360.00 475,121.00 240,239.00 " "Campus Pavilion 315,000.00 236,250.00 78,750.00 " "GSB Covered Walk 310,000.00 232,499.00 77,501.00 " "Powerhouse 296,196.00 296,196.00 - " "Chapel 123,205.00 - 123,205.00 " "Others 7,840,138.00 81,127.00 7,759,011.00 " "Grandstand 48,554.00 49,263.00 (709.00) " "Total 684,080,628.00 146,867,566.00 537,213,062.00CONSTRUCTION IN PROGRESS 982,713.00 - 982,713.00 " "EQUIPMENTSFurnitures & Fixtures 14,483,812.00 8,756,986.00 5,726,826.00 " "Electrical & Mechanical 60,845,537.00 46,194,276.00 14,651,261.00 " "Information Technology 19,923,756.00 15,204,238.00 4,719,518.00 " "Transportation Equipment 11,758,843.00 6,924,799.00 4,834,044.00 " "Miscellaneous Fixed Assets 10,645,124.00 10,587,304.00 57,820.00 " "Instruments & Utensils 514,484.00 208,375.00 306,109.00 " "T o o l s 830,079.00 587,454.00 242,625.00 " "Linen 294,889.00 276,118.00 18,771.00 " "Museum Collection 124,573.00 - 124,573.00 " "Total 119,421,097.00 88,739,550.00 30,681,547.00-GRAND TOTAL 929,149,021.00 235,607,116.00 693,541,905.00
2007- 2008 PERSONAL- <strong>17</strong> -BALANCE ATBALANCE ATBEGINNING SALARY AMOUNTS THE END OF NOTNAMES PERIOD ADDITIONS DEDUCTIONS WRITTEN OFF PERIOD CURRENT CURRENTAbala, Genelin G. P 5,295.67 5,295.67 5,295.67Abellera, Evelyn C. 302.23 5,054.75 5,054.75 302.23 302.23Acab, Deborah A. 55,400.00 45,000.00 10,400.00 10,400.00Acosta, Venina Corazon S. 418.97 418.97 418.97Adolfo, Marlon (3,560.00) 5,000.00 5,000.00 (3,560.00) (3,560.00)Africa, Dickenson Y. 200.00 200.00 200.00Agdalpen, Renato C. 2,000.00 2,000.00 2,000.00Agluba, Noreen 63.00 63.00 63.00Agorilla, Delia 660.00 660.00 660.00Aguila, Fitzgerald B. 14,585.00 13,585.00 1,000.00 1,000.00Aguirre, Estelita 200.00 200.00 200.00Alarde, Crispulo Jr. S. 7,244.09 59,463.01 44,<strong>17</strong>4.59 22,532.51 15,288.42 7,244.09Albino, Maulynn 207.50 207.50 207.50Albiva, Merlyn T. 1,464.00 1,464.00 1,464.00Alcaraz, Nellie T. 8,200.00 8,200.00 8,200.00Alcazar, Nina Aiza 415.50 415.50 415.50Alcoberes, Philip Jay N. 3,500.00 26,400.00 26,400.00 3,500.00 3,500.00Alfaro, Jennylyn G. (3,835.00) (3,835.00) (3,835.00)Alibania, Hazel J. 1,000.00 10,200.00 10,200.00 1,000.00 1,000.00Almalvez, Arlena C. 200.00 200.00 200.00Alo, James 600.00 600.00 600.00Alolor, Jacqueline G. (873.00) 24.50 24.50 (873.00) (873.00)Alvarado, Jesse Joey S. 667.00 15,883.00 15,883.00 667.00 667.00Alvarez, Jam Lychelle (63.00) (63.00) (63.00)Amlog, Jocelyn A. 45,000.00 45,000.00 45,000.00Ampatin, Estrella V. 26,005.00 26,005.00 26,005.00Anastacio, Nanette V. (3,309.80) (3,309.80) (3,309.80)Anastacio, Teresita M. 89.74 89.74 89.74Andres, Jocelyn 90.00 90.00 90.00
Anido, Cecilia I. 561,841.35 59.00 227,884.29 334,016.06 334,016.06An Lim, Jaime L. 7,152.75 631,519.05 540,960.78 97,711.02 97,711.02Antoni, Richel F. (33.00) (33.00) (33.00)Arabia, Julieta S. 600.00 41,244.00 41,244.00 600.00 600.00Aragon, Lloyd Jeffrey 5,000.00 5,000.00 5,000.00Arbizo, Maria Sophia 3,695.57 3,695.57 3,695.57Arejola, Romeo 200.00 200.00 200.00Arig, Mellicent J. (300.00) (300.00) (300.00)Arquiza, Glenda S. 5,484.00 52,052.50 50,712.00 6,824.50 6,824.50Arreca, Edgardo C. (500.00) (500.00) (500.00)Arribe, Emma B. 245.00 245.00 245.00Arroyo, Pilipinas C. 485.00 485.00 485.00Asilo, Ma. Cecilia 50.00 50.00 50.00Asis, Amelia B. 46,000.00 32,200.00 13,800.00 13,800.00Ataat, Jose 200.00 200.00 200.00Atanque, Aurora L. 16,568.32 53,675.00 67,408.26 2,835.06 2,835.06Austria, Ryan 5,000.00 5,000.00 5,000.00Ayson, Rosalino P., Jr. 48,690.00 54,235.75 71,420.75 31,505.00 31,505.00 .Aznar, Ma.Cynthia A. (400.00) (400.00) (400.00)Azor, Helen A. (76.51) 5,080.98 6,532.64 (1,528.<strong>17</strong>) (1,451.66) (76.51)Azucena, Cesario 1,339.20 1,339.20 1,339.20Babilonia, Jonathan 450.00 450.00 450.00Baconawa, Ma. Dorina M. 79.<strong>17</strong> 79.<strong>17</strong> 79.<strong>17</strong>Badiable, Charisma Mae 5,000.00 5,000.00 5,000.00Badua, Catherine T. (200.00) (200.00) (200.00)Baello, Christine N. 3,130.73 849.50 4,1<strong>17</strong>.73 (137.50) (137.50)Balaria, Dalmacio P. 7,500.00 7,500.00 7,500.00Balita, Paulita C. 45,466.47 77,049.47 113,079.44 9,436.50 9,436.50Bambico, Elma 311.00 311.00 311.00Banal, Enrico R. (22,<strong>17</strong>1.50) (22,<strong>17</strong>1.50) (22,<strong>17</strong>1.50)Banas, Gloria V. 24.20 24.20 24.20Banzon, Nilda 278.00 (278.00) (278.00)Barcarse, Abraham C. (7.00) (7.00) (7.00)Barcellano, Francis (4,595.00) (4,595.00) (4,595.00)Barcelona, Samson V. 200.00 200.00 200.00Barro, Liana M. 40,000.00 22,500.00 <strong>17</strong>,500.00 <strong>17</strong>,500.00Bartolome, Liezl DM. (40.00) <strong>17</strong>,982.75 <strong>17</strong>,<strong>17</strong>8.75 764.00 804.00 (40.00)
Basilio, Mary Joyce S. 11,186.00 4,586.00 6,600.00 6,600.00Batungbakal, Marisa <strong>17</strong>.50 <strong>17</strong>.50 <strong>17</strong>.50Bautista, Andres D. 3,000.00 3,000.00 3,000.00Bautista, Arlene Mae DG. 1,027.00 1,027.00 1,027.00Bautista, Christopher 588.40 588.40 588.40Bautista, Danilo 24,500.00 23,620.00 880.00 880.00Bautista, Rosalinda 300.00 300.00 300.00Bayan, Alfred F. 3,457.64 3,457.64 3,457.64Bayan, Zenaida E. 585.50 585.50 585.50Bayona, Daniel G. 545.90 545.90 545.90Bayot, Rosalinda R. 14,500.00 7,250.00 7,250.00 7,250.00Belardo, Ma. Jeanette 1,794.53 1,794.53 1,794.53Belleza, Asuncion L. 18,651.00 25,025.00 27,027.00 16,649.00 16,649.00Beltran, Charity J. <strong>17</strong>5.00 <strong>17</strong>5.00 <strong>17</strong>5.00Beltran, Edna M. 26,681.00 12,151.00 26,341.00 12,491.00 12,491.00Beltran, Manuel D. (2.00) 5,030.00 5,030.00 (2.00) (2.00)Belza, Mercedes A. 4,706.68 57,060.00 54,706.68 7,060.00 7,060.00Bermudez, Israel 300.00 300.00 300.00Bermudez, Neil C. 1,600.00 1,600.00 1,600.00Bona, Virginia B. 35.00 (35.00) (35.00)Bonaobra, Salvador B. (750.00) 5,030.00 5,030.00 (750.00) (750.00)Boyero, Jennifer Rose 551.45 551.45 551.45Brawner, Dalisay G. 40.00 40.00 40.00Briones, Domingo J. 10,079.00 1,394.00 1,394.00 10,079.00 10,079.00Brocal, Cynthia M. 24.00 24.00 24.00Buenaventura, Alexander V. 7,060.00 7,060.00 7,060.00Buenaventura, Olga C. 7,180.00 29,527.00 9,494.00 27,213.00 20,033.00 7,180.00Buenavida, Amelia 165.00 165.00 165.00Bueno, Marivic 20,000.00 10,000.00 10,000.00 10,000.00Bulanhagui, Nida B. 620.00 620.00 620.00Bumanglag, Alvin R. 48,815.98 37,565.98 11,250.00 11,250.00Buquid, Apolonio, Jr. 220.68 9,751.00 3,671.68 6,300.00 6,300.00Bustamante, Ma. Christine 3,660.00 12,000.00 4,660.00 11,000.00 11,000.00Butcon, Jesson V. (1,200.00) (1,200.00) (1,200.00)Caagbay, Elpidio Z. 40,374.40 31,350.00 77,503.70 (5,779.30) (5,779.30)Cabaltica, Leilani A. 72,210.55 39,527.15 100,527.15 11,210.55 11,210.55Cabantac, Ricardo R. 8,594.75 1,534.75 7,060.00 7,060.00
Cabilto, Gerardo P. 19,000.00 7,000.00 12,000.00 12,000.00Cabinta, Dolores B. 220,528.00 219,528.00 1,000.00 1,000.00Cabulay, Danny A. 54.00 54.00 54.00Cada, Leonardo F. Jr. 50,200.00 47,200.00 3,000.00 3,000.00Cadiz, Normita c. 28,349.55 10,204.00 23,440.00 15,113.55 15,113.55Cadorna, Rosemarie S. 656.20 656.20 656.20Cagadas, Ruly 200.00 200.00 200.00Cajucom, Mary Grace A. 440.00 440.00 440.00Calizar, Dexter A. 3,126.10 3,126.10 3,126.10Calub, Mary Virginia Blesilda 15,000.00 5,000.00 10,000.00 10,000.00Camacho, Joseph C. 600.00 600.00 600.00Camana, Love V. (35.00) 51,716.80 47,466.80 4,215.00 4,250.00 (35.00)Cando, Cromwell N. 10,251.50 5,000.00 14,003.50 1,248.00 1,248.00Canilao, Fe V. 919,930.68 57.50 256,787.71 663,200.47 663,200.47Canlas, Aurora V. 227.70 227.70 227.70Canobas, Ruel V. 33.00 33.00 33.00Cao, Marilou F. 11,450.00 47,552.00 61,771.00 (2,769.00) (2,769.00)Capacio, Glenn (7,300.00) (7,300.00) (7,300.00)Caramanza, Edward M. 9,000.00 9,000.00 9,000.00Cardona, Enrico 200.00 200.00 200.00Cariquitan, Daisy 308.00 308.00 308.00Carpio, Miguel M. (13,086.34) 1,540.00 1,540.00 (13,086.34) (13,086.34)Casaclang, Editha Y. 16,796.00 5,000.00 11,796.00 11,796.00Castanas, Baby Theress 82.50 82.50 82.50Castro, Joeven R, 4,555.00 4,935.00 4,935.00 4,555.00 4,555.00Castro, Ma. Clara C. 566.36 566.36 566.36Casuco, Leonida S. 10,683.00 7,683.00 3,000.00 3,000.00Catanghal, Rosalie I. 71.00 142.00 (71.00) (71.00)Cauba, Harvey A. 10,000.00 10,000.00 10,000.00Cayetano, Lovella M. 53,600.00 43,602.00 9,998.00 9,998.00Cecilio, Ma. Elaine 3,795.89 3,795.89 3,795.89Cerrer, Redentor A. 200.00 200.00 200.00Chan, Jeffrei Allan (6,927.00) (6,927.00) (6,927.00)Chu, Connie 195.20 195.20 195.20Chua, Ryan Gilbert 5,000.00 5,000.00 5,000.00Clarino, Robert V. 5,600.00 1,000.00 4,600.00 4,600.00Clemente, Luisa DC. 3,615.90 3,615.90 3,615.90
Clerigo, Bernard A. 14,100.00 13,100.00 1,000.00 1,000.00Clores, Roy 3,230.00 3,230.00 3,230.00Codinera, Virgilio B. 79.72 79.72 79.72Cometa, Ma. Victoria D. 200.00 7,975.00 (7,775.00) (7,775.00)Concepcion, Gerald G. 250.00 200.00 200.00 250.00 250.00Concepcion, Lourdes Q. 930.72 5,000.00 5,000.00 930.72 930.72Concha, Jhonalyn M. 38,900.00 28,000.00 10,900.00 10,900.00Copiaco, Ross Joseph 50.00 10,000.00 10,000.00 50.00 50.00Cordero, Nelma 1,195.00 1,195.00 1,195.00Cordero, Ronald G. 18,150.00 16,650.00 1,500.00 1,500.00Cortez, Lina L. (64.68) 5,373.37 5,373.37 (64.68) (64.68)Cruz, Abner M. 41,000.00 20,500.00 20,500.00 20,500.00Cruz, Anita B. 35,452.50 10,452.50 25,000.00 25,000.00Cruz, Anna Lisa D. 944.00 1,888.00 (944.00) (944.00)Cruz, Christybel O. (928.75) 27,193.75 25,336.25 928.75 928.75Cruz, Eloisa G. 3,362.50 3,362.50 3,362.50Cruz, Felipe T. 1,200.00 1,200.00 1,200.00Cruz, Janet R. 200.00 200.00 200.00Cruz, John Ross R. (4,500.00) (4,500.00) (4,500.00)Cruz, Jose Noel 200.00 200.00 200.00Cruz, Maricar 5,000.00 5,000.00 5,000.00Cruz, Maritess 9.16 11,000.00 11,000.00 9.16 9.16Cruz, Precita P. 16,000.00 15,310.00 32,710.00 (1,400.00) (1,400.00)Cruz, Reynaldo J. 9,734.58 8,800.53 934.05 934.05Cruz, Rosalie dela 6.68 6.68 6.68Cruz, Sandra Lyn D. 462.51 60.50 523.01 60.50 462.51Cuartero, Pacifico C. (1,700.00) (1,700.00) (1,700.00)Culala, Harold John D. (5,835.00) 5,000.00 (835.00) (835.00)Cunanan, Fernando M. 3,309.80 3,309.80 3,309.80Cureg, Benedicto A. 5,522.64 5,522.64 5,522.64Custodio, Joselito 50.00 50.00 50.00Dado, Rorylyn H. (1,000.00) 31,000.00 31,000.00 (1,000.00) (1,000.00)Dalton, Juanita C. 12,739.40 330.00 330.00 12,739.40 12,739.40Dapla, Walter 3,851.29 3,851.29 3,851.29Davalos, Zenaida R. 1,681.30 757.50 2,938.00 (499.20) (499.20)David, Melvira c. 300.00 300.00 300.00Dean, Victoriano P. 3,412.50 3,412.50 3,412.50
Deatras, Jeffrey (2,861.29) (2,861.29) (2,861.29)Delloro, Evelyn 748.00 748.00 748.00Demagante, Rey Francis G 50.00 50.00 50.00Destura, Blanca 7,562.96 6,460.00 13,798.40 224.56 224.56Diaz, Aeneas Eli <strong>17</strong>,302.00 27,302.00 (10,000.00) (10,000.00)Diaz, Reynaldo 255.00 255.00 255.00Dingding, Quintin P. 8,790.99 5,000.00 13,720.99 70.00 70.00Dino, Kristopher 400.00 400.00 400.00Dizon, Mercy G. 13,000.00 13,800.00 (800.00) (800.00)Dominguez, Rex S., Jr. (0.10) <strong>17</strong>,512.92 <strong>17</strong>,512.92 (0.10) (0.10)Dones, Irene P. 600.00 600.00 600.00Doria, Jeanette V. 260.00 (260.00) (260.00)Duena, Teodoro C., Jr. (6,000.00) 27,000.00 27,000.00 (6,000.00) (6,000.00)Dulay, Sofronio C. (10,636.95) 5,200.00 5,200.00 (10,636.95) (10,636.95)Dumadag, Norma M. 27,015.20 27,015.20 27,015.20Dumas, Marvin C. 150.00 150.00 150.00Dumdumaya, Myline Marie (1,200.00) (1,200.00) (1,200.00)Duque, Ronald 50.00 50.00 50.00Duran, Benedict James D. 670,086.69 7<strong>17</strong>,358.26 (47,271.57) (47,271.57)Echauz, Lydia B. 29,637.20 50,000.00 100,000.00 (20,362.80) (20,362.80)EDSA- Shangrila Plaza 1,300.00 1,300.00 1,300.00Elman, Mario B. 5,000.00 6,800.00 (1,800.00) (1,800.00)Enriquez, Christian Jo C. 4,939.39 (4,939.39) (4,939.39)Enriquez, Emiliana 50.00 50.00 50.00Enriquez, Rex Cesar 200.00 200.00 200.00Escoltero, Emily (2,864.73) 535.36 588.56 (2,9<strong>17</strong>.93) (53.20) (2,864.73)Escosia, Aurora A. 25,837.25 18,739.77 18,677.25 25,899.77 2,199.77 23,700.00Eser, Myline S. 33,035.86 33,035.86 33,035.86Espayos, Jose 150.00 150.00 150.00Espino, Kristine 112.00 112.00 112.00Espinosa, William V. 6,431.00 79,349.00 79,349.00 6,431.00 6,431.00Espiritu, Christine Joy 300.00 300.00 300.00Esquibel, Elizabeth 5,000.00 5,000.00 5,000.00Estabillo, Ma. Luz 529.50 529.50 529.50Estacio, Ma. Vivian G. 12,<strong>17</strong>5.00 28,482.00 42,282.01 (1,625.01) (1,625.01)Esteban, Alejandro L. 5,000.00 5,000.00 5,000.00Esteva, Eufrocina M. 30,000.00 20,000.00 10,000.00 10,000.00
Estocada, Donato Z. (66.50) 5,600.00 5,602.50 (69.00) (2.50) (66.50)Estonanto, Mark Ronald L. 374.85 21,311.86 21,311.86 374.85 374.85Estonanto, Mavi Issel L. 32,221.65 32,221.65 32,221.65Estrella, Gloria 1,460.37 1,460.37 1,460.37Estrella, Luisito P. 10,800.00 31,000.00 42,100.00 (300.00) (300.00)Fabito, Evelyn 2,163.00 2,163.00 2,163.00Fabros, Marietta 5,295.67 5,295.67 5,295.67Faustino, Jose V. 800.00 23,000.00 15,561.00 8,239.00 7,439.00 800.00Federigan, Melissa 946.25 946.25 946.25Felizardo, Dante A. 10,000.00 10,000.00 10,000.00Feraren, Mitchell 50.00 50.00 50.00Fernandez, Benedict T. III (4,400.00) 5,000.00 5,000.00 (4,400.00) (4,400.00)Fernandez, Dante Roel 699.00 699.00 699.00Fernandez, Roderick 588.40 588.40 588.40Fernando, Gerry V. 1,687.00 19,994.77 20,714.77 967.00 967.00Fesalbon, Hermond F. 7,729.34 7,729.34 7,729.34FEU Consumer's Coop. 3,295.85 3,295.85 3,295.85FEU Credit Union (3,247.94) 7,993.51 3,184.65 1,560.92 1,560.92FEU Educational Fdtn., Inc. 13,243.64 13,312.43 (68.79) (68.79)Fiesta, Erlinda P. 31,551.22 8,470.00 31,488.72 8,532.50 8,532.50Figer, Reggy C. 33,300.00 9,000.00 24,300.00 24,300.00Flojo, Flordeliza 168.50 168.50 168.50Flora, Dolores 42,0<strong>17</strong>.50 30,0<strong>17</strong>.50 12,000.00 12,000.00Flores, Hanonica S. 50.00 50.00 50.00Flores, Miguela T. 6,750.00 6,852.50 (102.50) (102.50)Flores, Raul 600.00 600.00 600.00Flores, Renato C. 2,000.01 2,000.01 2,000.01Flores, Roberto C. 22,150.00 54,400.00 (32,250.00) (32,250.00)Florida, Ma. Corazon M. 7,200.00 12,131.00 21,131.00 (1,800.00) (1,800.00)Foe, Jonathan 100.00 100.00 100.00Frades, Francisca B. 4,276.00 27,467.85 22,741.00 9,002.85 9,002.85Frias, Wilmer 5,000.00 5,000.00 5,000.00Fuentes, Ma. Leda J. 4,753.33 7,060.00 4,753.33 7,060.00 7,060.00Gaanan, Sonia B. 1,790.80 1,790.80 1,790.80Gabonada, Fina R. 5,600.00 11,191.00 11,191.00 5,600.00 5,600.00Gaddi, Ricardo, Jr. F. 300.00 300.00 300.00Galang, Aurora C. 980.00 980.00 980.00
Galiza, Miguela S. 45,000.00 45,000.00 45,000.00Gallardo, John 13,000.40 13,000.40 13,000.40Garcia, Dolores A. 200.00 50,000.00 200.00 50,000.00 50,000.00Garcia, Earl Jimson R. 6,000.00 6,000.00 6,000.00Garcia, Lourdes C. 16.41 16.41 16.41Garcia, Muriel B. (6,500.00) (6,500.00) (6,500.00)Garcia, Mylene M. 16,400.00 15,000.00 12,400.00 19,000.00 19,000.00Garcia, Severino M. 803,165.40 150,000.00 329,018.06 624,147.34 624,147.34Garin, May C. 29,900.00 29,900.00 29,900.00Genota, Jaime F. 822.32 822.32 822.32Gil, Aurora H. 7,060.00 7,060.00 7,060.00Golloso, Helen A. 300.00 300.00 300.00Go-Monilla, Ma. Joycelyn A 280.31 280.31 280.31Gonzaga, Jemabel 505.00 505.00 505.00Gonzales, Fortune N. 397.50 397.50 397.50Guardame, Quintal Nilo 305.72 305.72 305.72Gubio, James B. 10,892.75 9,050.00 23,942.75 (4,000.00) (4,000.00)Guevarra, Remedios P. 1,840.09 20,000.00 11,543.09 10,297.00 10,297.00Gupit, Dolores S. (26,896.39) (26,896.39) (26,896.39)Gutang, Marco P. 7,060.00 9,413.33 (2,353.33) (2,353.33)Guzman, Jericho D. 8,460.00 8,460.00 8,460.00Guzman, Jimmy 150.00 150.00 150.00Guzman, Joanne Lyn 15,000.00 (15,000.00) (15,000.00)Guzman, Jose 300.00 300.00 300.00Guzman, Joseph 15,000.00 92.00 92.00 15,000.00 15,000.00Hafalla, Juliana R. (434.00) (434.00) (434.00)Hernandez, Alma R. (1,337.50) 470.00 470.00 (1,337.50) (1,337.50)Hernandez, Angeline A. 7,491.70 7,491.70 7,491.70Hilario, Jacqueline E. 662.50 662.50 662.50Hore, Lelioso G. 300.00 300.00 300.00Ibasco, Lourdes 350.00 350.00 350.00Ignacio, Lourdes D. 2,341.21 54,000.00 49,358.21 6,983.00 6,983.00Iguas, Jose A. 24,273.00 26,000.00 47,276.00 2,997.00 2,997.00Imbang, Ma. Nathalie A. 3,772.50 3,772.50 3,772.50Inciong, Cherry Wyne E. 15,500.00 50.00 8,050.00 7,500.00 7,500.00Irabagon, Miramar 6,000.00 6,000.00 6,000.00Isidro, Rosalina B. (593.75) (593.75) (593.75)
Israel, Marietta C. 6,665.00 30,205.00 <strong>17</strong>,<strong>17</strong>0.00 19,700.00 19,700.00Israel, Wilfredo S. <strong>17</strong>0.00 340.00 (<strong>17</strong>0.00) (<strong>17</strong>0.00)Jabile, Joel E. 50.00 50.00 50.00Jagnis, Neil 300.00 300.00 300.00Javier, Anabella G. 26,987.50 7,368.00 26,193.00 8,162.50 8,162.50Jerusalem, Violeta L. 36,673.50 100,000.00 116,673.50 20,000.00 20,000.00Jesus, Angelita SD. 25,679.30 20,000.00 39,965.00 5,714.30 5,714.30Jimenez, Arsenia S. 5,970.00 5,194.00 5,194.00 5,970.00 5,970.00Jimenez, Luzviminda M. (0.20) (0.20) (0.20)Jimenez, Marietta 2,290.86 2,290.86 2,290.86Jolo, Melquiades A. 50,000.00 50,005.00 (5.00) (5.00)Joloya, Ma. Aura Christine (1,200.00) <strong>17</strong>3.00 <strong>17</strong>3.00 (1,200.00) (1,200.00)Jonson, Joyce Lisa B. (48,424.97) 32,247.26 32,247.26 (48,424.97) (48,424.97)Jose, Corazon V. 5,409.20 5,409.20 5,409.20Jose, Haidee R. 4,342.80 314.00 6,103.60 (1,446.80) (1,446.80)Junio, Nenitha L. 767.00 5,200.00 5,200.00 767.00 767.00Ko, Robert H. 6,294.20 4.00 6,299.00 (0.80) (0.80)Laboy, Michael C. 27,290.00 6,472.00 20,818.00 20,818.00Lagula, Janette 1<strong>17</strong>.50 1<strong>17</strong>.50 1<strong>17</strong>.50Lamboson, Roger C. (4,000.00) (4,000.00) (4,000.00)Lamorena, Juditha M. 47,893.20 73,037.00 76,037.00 44,893.20 44,893.20Lantin, Rommel 1,383.31 1,383.31 1,383.31Lapastora, Milagros P. 2,228.55 45,054.75 14,216.50 33,066.80 33,066.80Lapuebla, Alfredo N. 3,740.00 1,250.00 2,490.00 2,490.00Larano, Leonora 5,848.75 200.00 200.00 5,848.75 5,848.75Larda, Edmundo D. (1,500.00) 6,800.00 6,800.00 (1,500.00) (1,500.00)Laudato, Emmanuel N. (1,200.00) (1,200.00) (1,200.00)Laurente, Jaime R. 1,650.25 1,650.25 1,650.25Lauro, Jocelyn P. 9,945.34 77,741.50 73,034.84 14,652.00 14,652.00Laxamana, Rachel D. 26,880.00 22,400.00 4,480.00 4,480.00Laza, Benilda O. 14,572.00 11,<strong>17</strong>2.00 3,400.00 3,400.00Lazaro, Ma.Teresita A. 2,250.00 42,657.00 41,702.00 3,205.00 3,205.00Legaspi, Heidi 1,000.00 1,000.00 1,000.00Leon, Emma Rose H. 31,122.00 8,372.00 22,750.00 22,750.00Leonin, Clarito V. 10,300.00 10,500.00 (200.00) (200.00)Lepon, Luisa M. <strong>17</strong>,997.<strong>17</strong> 8,018.60 26,025.85 (10.08) (10.08)Lewis, Salome 1,147.50 1,147.50 1,147.50
Liggayu, Michael 200.00 200.00 200.00Lim, Nathaniel L. 942.00 329.00 954.00 3<strong>17</strong>.00 3<strong>17</strong>.00Lindo, Alicia C. 31,<strong>17</strong>6.80 5,146.00 33,846.00 2,476.80 2,476.80Lingat, Yolanda S. 3,487.20 30,000.00 30,157.20 3,330.00 3,330.00Lintag, Graciel A. 2,380.16 10,000.00 11,200.00 1,180.16 1,180.16Listana, Mary Rose 1,012.50 1,012.50 1,012.50Lizaso, Marcelino N. Jr. 400.00 400.00 400.00Lopez, Anastacio, Jr. L. (230.00) 27,250.00 19,054.00 7,966.00 7,966.00Lopez, Antonio P., Jr. 15.34 15.34 15.34Lopez, Fernando M. 250.00 250.00 250.00Lopez, Mercedita P. 252.50 5,632.00 5,632.00 252.50 252.50Lopez, Ricardo S. 24,000.00 11,200.00 12,800.00 12,800.00Loza, Luningning R. 748.00 748.00 748.00Lugtu, Blyth 5.00 5.00 5.00Luna, Lillian N. 967.14 967.14 967.14Luyun, Teofilo P., Jr. 60.00 9,492.00 7,970.00 1,582.00 1,582.00Macaalay, Nelson A. (1,200.00) (1,200.00) (1,200.00)Macadangdang, Luzviminda (137.50) (137.50) (137.50)Macalaguing, Mateo D. Jr. 40,000.00 30,000.00 10,000.00 10,000.00Macalalad, Consuelo 150.00 150.00 150.00Macapagal, Arnualdo B. 7,207.75 128,000.00 131,857.25 3,350.50 3,350.50Macaraeg, Paul 30,000.00 30,000.00 30,000.00Macario, Christopher 50.00 50.00 50.00Magayaga, Lea Q. 34,666.32 41,726.31 (7,059.99) (7,059.99)Magtoto, Eliseo 200.00 200.00 200.00Malabag, Pastor B. 2,638.58 2,638.58 2,638.58Malinao, Marivic 110.00 110.00 110.00Maliwat, Herminia I. 976,131.22 114,563.71 861,567.51 861,567.51Malong, Enrique P. 13,492.23 5,000.00 5,429.03 13,063.20 13,063.20Malonzo, Ella Margarita N. 4.15 3,412.00 3,412.00 4.15 4.15Malot, Edmund Francis 100.00 100.00 100.00Mamaid, Melanie P. 57,000.00 51,600.00 5,400.00 5,400.00Manalansan, Paolo F. 10,150.00 10,250.00 (100.00) (100.00)Manalili, Burton V. (400.00) 5,000.00 5,000.00 (400.00) (400.00)Manalili, Golda P. 50.00 50.00 50.00Mananquil, Amado 1,800.00 1,800.00 1,800.00Manansala, Paolo 81.58 81.58 81.58
Mangahas, Roser Benjamin 1,397.00 1,397.00 1,397.00Manicsic, Teresa B. 84.00 84.00 84.00Manigan, Alma C. 7.61 6,000.00 6,000.00 7.61 7.61Manlapaz, Divine Grace 5,000.00 5,000.00 5,000.00Manlapaz, Victor 1,200.00 1,200.00 1,200.00Manrique, Elenita <strong>17</strong>,000.00 <strong>17</strong>,000.00 <strong>17</strong>,000.00Martinez, Rodolfo M. Jr. 200.00 200.00 200.00Masahud, Helen 1,673.91 1,673.91 1,673.91Mateo, Jacinto C. Jr. 15,400.00 12,900.00 2,500.00 2,500.00Matullano, Edgardo C. 1,248.86 1,248.86 1,248.86Mazo, Flaviano S. 780.00 780.00 780.00MC Entee, Keneline M. 3,928.90 3,928.90 3,928.90Medina, Joy E. 8.39 11,524.60 9,113.47 2,419.52 2,419.52Medina, Ma. Ana Karina S. 25.94 25.94 25.94Medina, Merle S. (1,075.25) 1<strong>17</strong>.50 1<strong>17</strong>.50 (1,075.25) (1,075.25)Medrano, Rosalinda 935.50 935.50 935.50Membrot, Ezitiel R. 2,150.00 2,150.00 2,150.00Mendoza, Cecilia H. 6,186.77 (6,186.77) (6,186.77)Mendoza, Florina M. 300.00 300.00 300.00Mendoza, Jobert 10,000.00 10,000.00 10,000.00Mendoza, Simplicia A. 2.00 12,627.00 9,829.00 2,800.00 2,800.00Menez, Karren G. (550.00) 9,635.00 9,635.00 (550.00) (550.00)Menorca, Emmanuel S. 32.00 314.00 (282.00) (282.00)Mercado, Annabelle K. 3,758.55 3,758.55 3,758.55Mercado, Tom Michael A. (1,200.00) (1,200.00) (1,200.00)Miguel, Emmanuel C. 6,619.60 6,619.60 6,619.60Miguel, Raphael Gabriel L. (400.00) (400.00) (400.00)Milarpis, Joel 4,000.00 4,000.00 4,000.00Minas, Geraldine C. 35,040.00 33,990.00 1,050.00 1,050.00Mirador, Cresencio J. 9,492.80 6,650.00 2,842.80 2,842.80Miranda, Dennis 4,100.00 4,100.00 4,100.00Molina, Mark Oliver P. 8,513.71 8,513.71 8,513.71Mondares, Lailani D. (1,000.00) (1,000.00) (1,000.00)Monong, Cora 6,000.00 6,000.00 6,000.00Morabe, Babsie M. 50,000.00 32,500.00 <strong>17</strong>,500.00 <strong>17</strong>,500.00Morimonte, Bonifacio D. 500.00 500.00 500.00Mortel, Honorardo M. (247.00) (247.00) (247.00)
Mortell, Gideon 5,237.46 5,237.46 5,237.46Nagal, Glenn Z. 803,165.40 216,518.06 586,647.34 586,647.34Narval, Antonio G. 520.80 5,000.00 5,000.00 520.80 520.80Natera, Malvin G. 521.97 5,600.00 2,000.00 4,121.97 3,600.00 521.97Naui, Elizabeth S. 15,606.25 15,512.50 93.75 93.75Nava, Delfin D. 767.00 767.00 767.00Nicdao, Lazaro Jr. 13,388.00 3,346.98 10,041.02 10,041.02Nicer, Joselito C. (10,644.35) 54,856.50 (65,500.85) (54,856.50) (10,644.35)Nicolas, Crispinita S. 8,230.00 7,605.00 625.00 625.00Nietes, Raymond G. 16,689.30 16,689.30 16,689.30Ninobla, Magnolia <strong>17</strong>0.00 <strong>17</strong>0.00 <strong>17</strong>0.00Ninubla, Shiela 1,018.53 1,018.53 1,018.53Nolasco, Maria Sylva 1,775.00 1,775.00 1,775.00Noriega, Mariwilda I. 14,139.05 5,000.00 26,445.60 (7,306.55) (7,306.55)Nuestro, Sarah Joyce 15,000.00 15,000.00 15,000.00Nulla, Mila R. 57,261.75 5,146.00 40,974.00 21,433.75 21,433.75Oaferina, Gemmalyn A. 3,4<strong>17</strong>.<strong>17</strong> 14,040.00 <strong>17</strong>,457.97 (0.80) (0.80)Oasan, Albert C. 750.00 750.00 750.00Ocampo, Wilfredo T. 1,150.00 1,150.00 1,150.00Olipas, Lorina L. 200.00 200.00 200.00Oliver, Michael 200,000.20 111,766.88 88,233.32 88,233.32Ong, Ana Luz (300.00) <strong>17</strong>5.00 <strong>17</strong>5.00 (300.00) (300.00)Ong, Emil 4<strong>17</strong>.53 4<strong>17</strong>.53 4<strong>17</strong>.53Orias, Ronito B. 9,750.00 10,000.00 (250.00) (250.00)Orjalo, Victoria G. 200.00 200.00 200.00Orolfo, Teodora C. 55,880.00 41,996.00 13,884.00 13,884.00Ortiz, Jose 120.00 5,002.00 (4,882.00) (4,882.00)Ortiz, Milixa Lourdes B. 5,000.00 5,000.00 5,000.00Oyzon, Gualberto J. 3,002.80 3,002.80 3,002.80Padilla, Maria Eleanor T. 1,430.50 1,430.50 1,430.50Pahutan, Ludivinia M. 27,858.75 66,100.00 76,276.45 <strong>17</strong>,682.30 <strong>17</strong>,682.30Palparan, Karoline L. (900.00) 5,200.00 5,200.00 (900.00) (900.00)Pamintuan, Jose Edmundo 100.00 100.00 100.00Pangilinan, Christopher 1,316.80 1,316.80 1,316.80Pangilinan, Genice R. (18,400.00) 52,000.00 32,080.00 1,520.00 1,520.00Pantas, Felix Jr. 5,200.00 8,682.50 (3,482.50) (3,482.50)Pante, Ronald S. 600.00 600.00 600.00
Paraiso, Lourdes Oliva C. 90,410.00 <strong>17</strong>,919.97 <strong>17</strong>,919.97 90,410.00 90,410.00Paras, Renato 100,000.00 100,000.00 150,000.00 50,000.00 50,000.00Pasag, Maribeth 315.00 315.00 315.00Pascua, Jennifer J. 44,977.91 40,000.00 40,000.00 44,977.91 44,977.91Pascual, Perfecto 350.00 350.00 350.00Pataunia, Ma. Cecilia 5.16 1,383.50 1,383.50 5.16 5.16Patricio, Natividad 598.75 598.75 598.75Paulino, Oscar E. 4,350.00 4,350.00 4,350.00Paz, Ellen P. dela 45.50 30,084.50 130.00 30,000.00 30,000.00Paz, Rosalinda dela 3,289.67 46,800.00 <strong>17</strong>,580.67 32,509.00 32,509.00Pedro, Antoniette B. (1,200.00) (1,200.00) (1,200.00)Pekson II, Enrique Arvin (43,488.12) 114,757.27 114,757.27 (43,488.12) (43,488.12)Pelareja, Juanito Y. 213.00 213.00 213.00Pelobello, Gloria G. 422.00 844.00 (422.00) (422.00)Perez, Crismin 10,591.34 10,591.34 10,591.34Perez, Hector M. 15.00 20,000.00 20,030.00 (15.00) (15.00)Perez, Jose R. Jr. 52.20 52.20 52.20Pimentel, Stephanie 285.00 285.00 285.00Pineda, Robert G. 31,203.00 <strong>17</strong>,000.00 14,203.00 14,203.00Pineda, Rodolfo G. <strong>17</strong>,108.91 20,705.10 37,742.75 71.26 71.26Ponsaran, Levy C. 5,589.65 12,829.28 15,968.93 2,450.00 2,450.00Portiz, Ellen 207.50 207.50 207.50Pring, Melanie 5,000.00 5,000.00 5,000.00Publico, Hilario Q. 5,376.50 10,050.00 10,050.00 5,376.50 5,376.50Puertollano, Derek 250.00 250.00 250.00Pulmano, Zelmo 8,000.00 8,000.00 8,000.00Puro, Kristopher John 150.00 150.00 150.00Querijero, Glen Hilario M. 5,000.00 5,000.00 5,000.00Quiambao, Arlene 358.50 358.50 358.50Quijano, Virginia A. 7,220.00 7,220.00 7,220.00Quijencio, Wilfredo D. 884.76 218.76 666.00 666.00Quintanar, Janeth A. 6,946.56 5,000.00 6,580.00 5,366.56 5,366.56Quinto, Myrna P. 56,070.00 47,010.00 9,060.00 9,060.00Quirimit, Luzviminda 1,942.77 1,942.77 1,942.77Ragonjah, Homer Jay D. 15.00 15.00 15.00Ramon, Elizabeth A. de 7,060.00 7,060.00 7,060.00Ramones, Marigrace M. (546.02) 7,383.56 7,415.56 (578.02) (578.02)
Ramones, Rhozallino C. 5,000.00 5,000.00 5,000.00 5,000.00 5,000.00Ramos, Erlinda L. 10,000.00 10,000.00 10,000.00Ramos, Fegilyn F. 25.00 40,522.50 40,572.50 (25.00) (25.00)Ramos, Leonora A. 4,553.50 2,303.50 2,250.00 2,250.00Ramos, Ma. Theresa L. 8,348.81 210.00 7,705.00 853.81 853.81Ramos, Rose Marie R. 30,632.00 27,632.00 3,000.00 3,000.00Ramos, Teodorica L. 2,160.00 25,589.60 24,778.20 2,971.40 2,971.40Rana, Aurelio Y. 34,898.08 11,400.00 23,498.08 23,498.08Rapirap. Raquel T. 41,392.30 13,965.00 47,069.30 8,288.00 8,288.00Rasalan, Julia 772.50 772.50 772.50Redulla, Everjeann Christie 34.71 34.71 34.71Remiendo, Noraliza A. 10.00 38,726.<strong>17</strong> 37,834.08 902.09 892.09 10.00Remigio, Warley 100.00 100.00 100.00Retardo, Victor C. 5,600.00 6,200.00 (600.00) (600.00)Rey, Reyleen V. 12.50 12.50 12.50Reyes, Byron M. 200.00 200.00 200.00Reyes, Herbert D. 4,555.00 30,391.50 30,391.50 4,555.00 4,555.00Reyes, Maria Veronica S. 60,600.00 55,790.00 4,810.00 4,810.00Reyes, Melodia S. 21,834.00 80.00 15,080.00 6,834.00 6,834.00Reyes, Mercedes C. 2,353.32 9,750.00 8,853.34 3,249.98 3,249.98Reyes, Ruby 572.50 572.50 572.50Reymundo, Samuel 50.00 50.00 50.00Rimano, Joy S. 15,186.00 14,361.00 825.00 825.00Riparip, Rogelio L. Jr. (1,200.00) (1,200.00) (1,200.00)Rivera, Myrna T. (1,420.25) (1,420.25) (1,420.25)Rizada, Ryan Joseph 9,159.80 9,159.80 9,159.80Ronda, Ma. Lea A. 300.00 300.00 300.00Rosa, Giovanni dela 551.63 551.63 551.63Rosario, Alma del 7,060.00 (7,060.00) (7,060.00)Rosario, Hilario - PMSI 7,060.00 7,060.00 14,120.00 7,060.00 7,060.00Rosete, Dwight Benedict N 4,500.00 11,800.00 14,800.00 1,500.00 1,500.00Roxas, Ronald L. 8,000.00 5,000.00 5,000.00 8,000.00 8,000.00Rubillos, Leonardo I. (600.00) 5,030.00 5,030.00 (600.00) (600.00)Ruzol, Hipolito S. 300.00 300.00 300.00Sabaupan, Sylvette G. 57,524.75 28,287.50 62,447.50 23,364.75 23,364.75Sabaybay, Jocelyn L. 666.00 361.00 361.00 666.00 666.00Saldua, Eder John (5,000.00) (5,000.00) (5,000.00)
Salonga, Lea 50.00 50.00 50.00Salud, Alann M. (520.00) (520.00) (520.00)Salvacion, Dennis C. (3,000.00) (3,000.00) (3,000.00)Salvador, Esther D. 9,431.00 2,674.00 12,087.00 18.00 18.00San Pablo, Ma.Cecilia A. 90.00 8,502.25 8,100.00 492.25 402.25 90.00Sansaet, Sheery O. .. 53.75 161.25 (107.50) (107.50)Sante, Nova C. (981.25) (981.25) (981.25)Santiago, Christopher G. 9,638.<strong>17</strong> 9,638.<strong>17</strong> 9,638.<strong>17</strong>Santiago, Edwin B. 50.00 50.00 50.00Santiago, Genine 308.00 10,822.00 10,000.00 1,130.00 1,130.00Santillan, Vivian M. 190.00 190.00 190.00Santos, Arwind 49,990.00 49,990.00 49,990.00Santos, Carmelita C. 1,391.68 39.50 2,822.82 (1,391.64) (1,391.64)Santos, Danilo B. 22,812.58 5,000.00 25,167.33 2,645.25 2,645.25Santos, Dinia 251.25 251.25 251.25Santos, Florentino I. 5,013.25 5,000.00 11,801.25 (1,788.00) (1,788.00)Santos, Glecerio 200.00 200.00 200.00Santos, Jing 267.00 267.00 267.00Santos, Mary Lord 5,000.00 5,000.00 5,000.00Santos, Michelle R. 574.56 574.56 574.56Santos, Roselle V. 1,150.00 1,250.00 (100.00) (100.00)Santuile, Aida M. 8,000.00 8,000.00 8,000.00Sapitula, Preciosa S. 1,586.57 1,586.57 1,586.57Sarabia, Juliet C. 6,221.00 58,136.00 52,757.00 11,600.00 11,600.00Sarita, Larry 50.00 50.00 50.00Sarmiento, Lina Q. 1,387.35 15,545.81 9,607.39 7,325.77 7,325.77Sauco, Carlos P. 5,206.14 5,206.14 5,206.14Sayco, Marjorie 206.50 206.50 206.50Sido, Ma. Victoria P. 72.60 33,402.70 27,349.50 6,125.80 6,053.20 72.60Sierra, Robert M. (1,000.00) (1,000.00) (1,000.00)Siggaoat, Janine P. 821.<strong>17</strong> 821.<strong>17</strong> 821.<strong>17</strong>Sin, Glenda S. 2,353.34 7,060.00 2,353.34 7,060.00 7,060.00Sinang, Rolando R. 7,263.50 11,500.00 11,500.00 7,263.50 7,263.50Sincioco, Mary Ann 207.50 207.50 207.50Siongco, Ma. Teresita 2,000.00 260.00 260.00 2,000.00 2,000.00Sioson, Annabelle P. 60.00 60.00 60.00Sioson, Yolanda J. 57,480.00 10,500.00 10,500.00 57,480.00 57,480.00
Soliman, Norma P. 2,353.34 7,060.00 2,353.34 7,060.00 7,060.00Solomon, Romel M. 2,700.00 15,000.00 10,890.00 6,810.00 6,810.00Sopoco, Anna Marie M. 1,890.00 5,286.00 5,286.00 1,890.00 1,890.00Soria, Eulegio E. 1,000.00 5,050.00 5,050.00 1,000.00 1,000.00Soronel, Rolando A. 1,<strong>17</strong>5.00 1,<strong>17</strong>5.00 1,<strong>17</strong>5.00Sta. Ana, Noemi V. 311.00 311.00 311.00Suba, Sally 54,818.56 48,080.00 6,738.56 6,738.56Tabaloc, Edgardo U. Jr. 51.58 51.58 51.58Tabaniag, Flordeliza 63.75 63.75 63.75Tablizo, Anne Margareth 206.50 206.50 206.50Tagle, Susan M. 7,551.41 29,500.00 32,000.00 5,051.41 5,051.41Talampas, Ma. Cristina J. 20,000.00 53,024.00 45,024.00 28,000.00 28,000.00Tamay, Shariff M. 5,000.00 5,000.00 5,000.00Tamayao, Olivia E. 4,996.60 4,996.60 4,996.60Tampol. Eduardo B. 5,000.00 6,000.00 (1,000.00) (1,000.00)Tan, Carolina M. 7,060.00 7,060.00 7,060.00Tan, Cedrick 4,875.00 (4,875.00) (4,875.00)Tan, Derrick - PMSI 14,120.00 19,893.00 18,826.00 15,187.00 1,067.00 14,120.00Tan, Mary Joyce P. 7,060.00 7,060.00 7,060.00Tan, Ryanne 1<strong>17</strong>.50 1<strong>17</strong>.50 1<strong>17</strong>.50Tapalgo, Elyn M. Jr. 5,000.00 200.00 7,857.50 (2,657.50) (2,657.50)Tapit, Neila E. (672.00) 15,226.00 15,226.00 (672.00) (672.00)Taragua, Alma Trinidad 65,446.00 47,482.50 <strong>17</strong>,963.50 <strong>17</strong>,963.50Tecson, Rhenalyn 311.00 311.00 311.00Tecson, Wilfrido 50,000.00 53,000.00 (3,000.00) (3,000.00)Tenorio, Donnabel (130.00) (130.00) (130.00)Teoxon, Lucio 379.82 379.82 379.82Tibayan, Florencia C. 305.00 305.00 305.00Tiburcio, Jaime, Jr. 2,007.50 2,007.50 2,007.50Timbugan, Josefina - PMSI 7,060.00 7,060.00 7,060.00 7,060.00 7,060.00Tingcungco, Elizabeth G. 259.02 259.02 259.02Tirazona, Renato A. 3,582.00 38,472.92 40,065.00 1,989.92 1,989.92Tiu, Michael 200.00 200.00 200.00Togado, Illumar I. 1,000.00 10,500.00 6,250.00 5,250.00 5,250.00Tolentino, Honey Chile N. 52,571.56 47,783.12 4,788.44 4,788.44Tomas, Eden A. 943.00 320.00 320.00 943.00 943.00Torres, Irma R. 4,484.99 505.00 5,289.99 (300.00) (300.00)
Torres, Maruja T. 206.50 206.50 206.50Toyocan, Cherryl Anne 10,<strong>17</strong>0.00 10,370.00 (200.00) (200.00)Trinidad, Alfredo D. 329.07 329.07 329.07Trinidad, Josefina <strong>17</strong>0.00 <strong>17</strong>0.00 <strong>17</strong>0.00Tuazon, Nino M. 356.25 356.25 356.25Tumaliuan, Roberto J. 13,000.00 11,334.00 1,666.00 1,666.00Unidad, Kim Ryan 100.00 100.00 100.00Ureta, Peter 9,397.10 9,397.10 9,397.10Usita, Laarni P. 49,426.44 350.00 26,707.44 23,069.00 23,069.00Utzurrum, Jonathan B. 7,<strong>17</strong>8.00 7,<strong>17</strong>8.00 7,<strong>17</strong>8.00Uy, Moira B. 10,000.00 6,000.00 4,000.00 4,000.00Uyson, Leslie Marie C. 53,060.00 37,688.00 15,372.00 15,372.00Valderrama, Ruth D. 7,210.00 5,810.00 1,400.00 1,400.00Valdez, Ferdinand 1,000.00 1,000.00 1,000.00Valdez, Gloria 1,237.50 1,237.50 1,237.50Valencia, Jean Pauline S. (1,000.00) 37,616.32 41,814.32 (5,198.00) (4,198.00) (1,000.00)Valencia, Joy DG. (43.33) 5,000.00 5,006.67 (50.00) (50.00)Valencia, Ma. Theresa L. 530.00 33,332.00 30,667.00 3,195.00 2,665.00 530.00Valencia, Venancio 300.00 300.00 300.00Valente, Jovito S. 5,000.00 7,659.60 (2,659.60) (2,659.60)Valenzuela, Edwin E. 300.00 300.00 300.00Valenzuela, Rowena B. (6.00) 5,063.00 5,063.00 (6.00) (6.00)Vallo, Mary Rose C. 15,<strong>17</strong>5.00 15,000.00 <strong>17</strong>5.00 <strong>17</strong>5.00Valmonte, Alejandra Monica 205.25 205.25 205.25Varilla, Edglyn G. 5,140.61 5,140.61 5,140.61Vasquez, Vilma S. <strong>17</strong>0.00 340.00 (<strong>17</strong>0.00) (<strong>17</strong>0.00)Vega, Jose Mario D. 300.00 300.00 300.00Velasco, Antonio Y. 650.10 650.10 650.10Velasquez, Ma. Charisma B 465.00 5,054.75 5,609.75 (90.00) (90.00)Vera, Antonio 4,000.00 60,833.10 39,019.65 25,813.45 25,813.45Vera, Jose Rizalito c. (1,800.00) 200.00 3,800.00 (5,400.00) (3,600.00) (1,800.00)Vera, Sebastian (2,300.00) (2,300.00) (2,300.00)Verances, Ma. Laline V. 841.50 1,683.00 (841.50) (841.50)Vergara, Flocerfida 35,220.00 (35,220.00) (35,220.00)Vergara, Melchor 7,060.00 (7,060.00) (7,060.00)Vergara, Oliver Francis 7,060.00 (7,060.00) (7,060.00)Vergara, Regidor 7,060.00 (7,060.00) (7,060.00)
Vergara, Romeo - PMSI 21,180.00 21,180.00 21,180.00Verzosa, Bobby 100.00 100.00 100.00Vibar, Enrico B. 7,200.00 7,200.00 7,200.00Vicera, Desmond M. 200.00 200.00 200.00Victoria, Michael S. 9,252.60 5,000.00 14,892.60 (640.00) (640.00)Villaceran, Eugenio V. (25,290.98) 24,046.85 16,986.85 (18,230.98) (18,230.98)Villamiel, Carminda (29,288.90) (29,288.90) (29,288.90)Villanueva, Ace R. 26.98 26.98 26.98Villanueva, Jerome 400.00 400.00 400.00Villanueva, Jonas V. (13,073.00) (13,073.00) (13,073.00)Villanueva, Ma. Concepcion 5,000.00 35,120.00 34,790.00 5,330.00 5,330.00Villapando, Marimel A. 200.00 200.00 200.00Villar, Gerald 7,060.02 40,737.53 40,737.55 7,060.00 7,060.00Vinluan, Lourdes R. 1,968.75 85,087.50 45,728.25 41,328.00 41,328.00Vivas, Cherry Mae 300.00 300.00 300.00Woolsey, Nida B. 25,722.00 278.00 25,732.00 268.00 268.00Yabis, Geraldine 97.50 97.50 97.50Yang, Gloria 45,000.00 45,000.00 45,000.00Yanzon, Gina 500.00 500.00 500.00Yap, Caridad P. (4,841.00) 5,242.00 5,242.00 (4,841.00) (4,841.00)Yatco, Ma. Carmen S. 29,320.00 47,000.00 47,000.00 29,320.00 29,320.00Yoro, Jenny Rose L. 1,146.00 1,236.00 (90.00) (90.00)Zaldivar, Felicia P. 7,934.20 87.50 8,693.70 (672.00) (672.00)Zaldivar, Ramil P. 4,8<strong>17</strong>.80 6,195.00 6,012.80 5,000.00 5,000.00Zape, Vida Edna C. 12,474.60 30,148.40 35,601.20 7,021.80 7,021.80Zara, Marc Vincez R. 2,500.00 2,500.00 2,500.00Zorilla, Roland S. 20.00 20.00 20.00Zulueta, Michael R. 7,000.00 7,000.00 7,000.00P 5,432,003.88 8,645,525.39 8,718,971.83 5,358,557.44 2,646,498.87 2,712,058.57FACULTY ADVANCESAgoncillo, Divina Gracia O. 1,986.94 1,986.94 1,986.94Aguilos, Susan S. 2,983.13 2,983.13 2,983.13Alona, Elizabeth V. (5,295.67) (5,295.67) (5,295.67)Altares, Priscilla S. (37.62) (37.62) (37.62)Anastacio, Nanette v. (5,295.67) (5,295.67) (5,295.67)
Ansano, Bela R. 11,590.42 11,590.42 11,590.42Austria, Rex S. (2,160.00) (2,160.00) (2,160.00)Avengoza, Rosalie J. (6,518.64) (6,518.64) (6,518.64)Badiola, Jose Luisito V. (0.52) (0.52) (0.52)Bautista, Mary Grace S. (5,295.67) (5,295.67) (5,295.67)Cano, Charito F. 847.27 847.27 847.27Castro, Lawrence Christoph 1,765.22 1,765.22 1,765.22Cruz, Sandra Lyn E. 44,290.05 44,290.05 44,290.05Dimalibot, Martina Geraldin 1,926.98 1,926.98 1,926.98Estacio, Ma. Vivian G. 3,832.70 3,832.70 3,832.70Gariguez, Mariflor N. 10,591.34 10,591.34 10,591.34Garin, May C. 5,534.22 5,534.22 5,534.22Isip, Amando F. (1,323.91) (1,323.91) (1,323.91)Javier, Nancy Joan M. 5,295.67 5,295.67 5,295.67Jose, Franco C. (6,619.59) (6,619.59) (6,619.59)Malay, Ernesto B. 20,910.00 20,910.00 20,910.00Martinez, Zenaida S. (7,943.50) (7,943.50) (7,943.50)Minas, Geraldine C. (3,150.00) (3,150.00) (3,150.00)Narciso, Wilfrida B. 5,295.67 5,295.67 5,295.67Naui, Elizabeth S. (50.00) (50.00) (50.00)Pacot, Marilou M. (7,943.50) (7,943.50) (7,943.50)Permalino, Albert Emmanue 7,060.89 7,060.89 7,060.89Sagarino, Gavino N. (5,295.67) (5,295.67) (5,295.67)Salcedo, Liezel Donatila M <strong>17</strong>,190.24 <strong>17</strong>,190.24 <strong>17</strong>,190.24Salonga, Ma. Elena A. 147.16 147.16 147.16Salunga, Loida P. 14,960.54 14,960.54 14,960.54Salvado, Rowena E. 22,160.26 22,160.26 22,160.26Santos, Buenvenida 3,971.75 3,971.75 3,971.75Santos, Katherine Vera A. (32.50) (32.50) (32.50)Santos, Melody Christian R 3,909.51 3,909.51 3,909.51Simo, Rickson Jay (21,182.72) (21,182.72) (21,182.72)Tia, Christopher B. (0.03) (0.03) (0.03)Trinidad, Josefina M. 1,690.82 1,690.82 1,690.82Villanueva, Rosalie R. (10,591.34) (10,591.34) (10,591.34)Villegas, Ma. Marissa M. (10,591.34) (10,591.34) (10,591.34)Villorente, Elizabeth F. 1,323.91 1,323.91 1,323.91Vinluan, Renato A. 2,028.62 2,028.62 2,028.62
Total P 5,523,969.30 8,645,525.39 8,718,971.83 P 5,450,522.86 2,646,498.87 2,804,023.99Anagbogu, Ignatius 12,600.00 12,600.00 12,600.00Aranzanso, Lourdes 99,700.00 13,322.42 86,377.58 86,377.58Arquiza, Glenda S. 55,300.00 47,800.00 7,500.00 7,500.00Cabasada, Albert R. III 40,223.76 195,581.54 182,487.59 53,3<strong>17</strong>.71 53,3<strong>17</strong>.71Caratao, Jinky Rosario 6,800.00 6,800.00 6,800.00Cruz, Reynaldo J. 5,000.00 (5,000.00) (5,000.00)Diwa, Alvin S. 40,400.00 40,400.00 40,400.00Faustino, Jose V. 55,913.00 127,005.00 86,606.65 96,311.35 96,311.35Fernando, Gerry V. (1,282.30) 67,360.00 63,580.00 2,497.70 3,780.00 (1,282.30)Frades, Francisca B. 89,473.93 89,925.25 (451.32) (451.32)Garin, May C. 201,471.26 135,341.03 66,130.23 66,130.23Leon, Jocelyn E. de 197,640.00 197,640.50 (0.50) (0.50)Molina, Mark Oliver P. 1,162.74 933,476.51 938,871.31 (4,232.06) (4,232.06)Paraiso, Lourdes Oliva 3,699.95 7,300.00 10,999.75 0.20 0.20Pizaro, Arthur 1,200.00 1,200.00 1,200.00Salvador, Mary Grace C. 110,571.00 94,571.00 16,000.00 16,000.00Sarabia, Juliet S. 22,755.00 10,000.00 12,755.00 12,755.00Soria, Eulegio 1,777.00 1,777.00 1,777.00Tolentino, Rosula R. 49,130.00 40,483.30 8,646.70 8,646.70Villanueva, Romulo 5,212.00 5,212.00 5,212.00Villar, Gerald 1,888.77 18,500.00 20,388.77 18,500.00 1,888.77Yang, Gloria G. 106,020.00 11,760.00 94,260.00 94,260.00P 5,632,375.22 10,987,998.63 10,647,360.63 P 5,973,013.22 3,161,582.76 2,811,430.46
JANUARY 2008- C/AAbelardo, Luzviminda P 9,404.00 P 9,404.00 9,404.00Abella, Bernard 3.50 9.18 (5.68) (5.68)Absalon, Cecilia 150.00 150.00 150.00Acab, Deborah 156.00 156.00 156.00Agnes, Reynold 400.00 400.00 400.00Aguila, Fitzgerald 11,000.00 11,000.00 11,000.00Aguirre, Estrelita 125.00 125.00 125.00Agustin, Ma. Theresa 5,752.50 5,752.50 5,752.50Ahmadzadeh, Teresita 16.00 16.00 16.00Alarde, Crispulo 18,962.50 3,672.50 15,290.00 15,290.00Albano, Allan Rey 4,000.00 4,000.00 4,000.00Alcoberes, Philip Jay <strong>17</strong>0.00 <strong>17</strong>0.00 <strong>17</strong>0.00Alejandre, Ray Aldus 1,200.00 1,200.00 1,200.00Alejo, Teodoro 45.00 45.00 45.00Alforte, Juvy Irene 290.00 290.00 290.00Altares, Priscilla S. 2,250.00 2,250.00 2,250.00Alvarado, Jesse Joey S. 300.00 200.00 100.00 100.00Angeles, Jill 1,592.00 1,592.00 1,592.00Anido, Cecilia 500.05 500.05 500.05An Lim, Jaime Laid 140,900.55 25,250.80 115,649.75 115,649.75Anonuevo, Monica 300.00 300.00 300.00Apostol, Anita 855.00 855.00 855.00Arago, Teodulfo 220.00 220.00 220.00Arreca, Emma F. 5,944.00 2,200.00 3,744.00 3,744.00Artus, Liezel C. 200.00 200.00 200.00Atanacio, Fe 980.00 980.00 980.00Austria, Domingo 50.00 50.00 50.00Avengoza, Rosalie 735.00 735.00 735.00Ayson, Rosalino P. 5,042.50 447.50 4,595.00 4,595.00Azor, Helen 50,128.63 4,295.30 45,833.33 45,833.33Bacsafra, Zenaida 212.50 212.50 212.50Balita, Paulita 16,463.19 16,463.19 16,463.19
Baritugo, Mercedita 395.00 395.00 395.00Barroga, Junalyn 145.00 145.00 145.00Batin, Judith 250.00 250.00 250.00Bautista, Danilo B. 5,644.15 4,871.65 772.50 772.50Bautista, Juan Andres 200.00 200.00 200.00Bayot, Rosalinda 872.00 872.00 872.00Bejo, Noel 50.00 50.00 50.00Belleza, Asuncion 15,000.00 15,000.00 15,000.00Beltran, Manuel 454.00 454.00 454.00Belza, Mercedes 998.00 998.00 998.00Bernardo, Elena 150.00 150.00 150.00Bernardo, Norma 402.50 402.50 402.50Bernardo, Rodrigo G. 10,552.80 2,163.55 8,389.25 8,389.25Biescas, Jose B. 802.00 301.50 500.50 500.50Bilog, Manolo 100.00 100.00 100.00Binas, Marie Jean T. 10,000.00 10,000.00 10,000.00Bingculado, Roger B. 2,500.00 2,500.00 2,500.00Blanco, Lyra 637.50 637.50 637.50Blas, Maria Theresa B. 8,029.70 8,012.20 <strong>17</strong>.50 <strong>17</strong>.50Bongar, Carol 1,046.00 1,046.00 1,046.00Bontigao, Eli 1,200.00 1,200.00 1,200.00Borja, Sofriano 7,000.00 7,000.00 7,000.00Brillon, Cherish Aileen 231.00 200.00 31.00 31.00Briones, Domingo J. 4,246.80 3,701.80 545.00 545.00Briones, Ritchelle 1,497.50 1,497.50 1,497.50Bueno, Marivie 370.75 370.75 370.75Bugaring, Vladimir 350.00 350.00 350.00Burac, Joseph 454.00 454.00 454.00Bustamante, Maria Christine 10,000.00 10,000.00 10,000.00Cabaltica, Leilani A. 4,000.00 4,000.00 4,000.00Cabasada, Albert 300.00 300.00 300.00Cabebe, Lolita 65.00 65.00 65.00Cabinta, Ma. Dolores B. 3,390.00 3,150.00 240.00 240.00Cabrito, Romeo 50.00 50.00 50.00Cajucom, Cherry H. 4,469.00 1,489.66 2,979.34 2,979.34Calma, Rolando 4,876.75 4,876.75 4,876.75Camaclang, Merlita 749.00 749.00 749.00
Cambe, Dhonna 180.00 180.00 180.00Canizares, Nenita 775.00 775.00 775.00Capili, Regina 2,533.50 2,533.50 2,533.50Carlos, Salome 1,<strong>17</strong>0.00 1,<strong>17</strong>0.00 1,<strong>17</strong>0.00Carman, Diosaflor 755.00 755.00 755.00Casaclang, Editha 65.00 65.00 65.00Castillo, Carolina 12,000.00 12,000.00 12,000.00Castillo, Eunice Joan 482.00 482.00 482.00Castillo, Perlita 180.00 180.00 180.00Casuco, Leonida 180.00 180.00 180.00Celestino, Anna Consuelo 725.00 725.00 725.00Cheng, Jaime D. 200.00 200.00 200.00Chua, Wilson 100.00 100.00 100.00Concepcion, Benjamin 100.00 100.00 100.00Copiaco, Ross Joseph B. 4,469.00 1,489.66 2,979.34 2,979.34Cordel, Sonia 922.50 922.50 922.50Corpuz, Cristina R. 308.00 308.00 308.00Corpuz, Delia 102.50 102.50 102.50Cortez, Catherine 200.00 200.00 200.00Cruz, Anita dela 180.00 180.00 180.00Cruz, Benjamin F. 45,000.00 20,000.00 25,000.00 25,000.00Cruz, Noel L. dela 30,433.91 4,000.00 26,433.91 26,433.91Cruz, Semeon 200.00 200.00 200.00Cudiamat, Rosemary 39,000.00 39,000.00 39,000.00Culala, Harold John 375.00 375.00 375.00Dancil, Veronica 1,152.00 1,152.00 1,152.00Danofrata, Julie 240.00 240.00 240.00Davalos, Zenaida 800.00 800.00 800.00Denina, Marinela 15.00 15.00 15.00Destura, Blanca D. 8,934.50 6,316.25 2,618.25 2,618.25Dijamco, Grace L. 80.00 80.00 80.00Dingding, Quintin 120.00 120.00 120.00Diwa, Alvin S. <strong>17</strong>,445.85 15,803.35 1,642.50 1,642.50Doctolero, Priscila L. 2,253.75 1,750.00 503.75 503.75Domasian, Leonard 200.00 200.00 200.00Dominguez, Apolonio 1,200.00 1,200.00 1,200.00Dominguez, Rex 14,976.00 9,984.00 4,992.00 4,992.00
Dones, Irene 1,352.50 1,352.50 1,352.50Dublin, Marietta 65.00 65.00 65.00Duena, Teodoro 384.50 384.50 384.50Eleazar, Glenda C. 24,875.00 7,250.00 <strong>17</strong>,625.00 <strong>17</strong>,625.00Elimen, Alfredo S. 250.00 250.00 250.00Elimen, Fernando 30.00 30.00 30.00Era, Edilberto 120.00 120.00 120.00Erestain, Teresita 907.50 907.50 907.50Erum, Filju 50.00 50.00 50.00Escobia, Angelita 180.00 180.00 180.00Escosia, Aurora 6,358.85 4,100.90 2,257.95 2,257.95Espinosa, William V. 10,000.00 3,000.00 7,000.00 7,000.00Esteva, Eufrocina 1,745.95 1,745.95 1,745.95Estolas, Anthony 13,500.00 13,500.00 13,500.00Estrella, Luisito 5,000.00 5,000.00 5,000.00Evangelista, Rey 250.00 250.00 250.00Fajardo, Wilson 50.00 50.00 50.00Faustino, Jose V. 19,498.04 1,324.18 18,<strong>17</strong>3.86 18,<strong>17</strong>3.86Felices, Catherine 36,833.16 36,833.16 36,833.16Ferareza, Rimar 250.00 250.00 250.00Fernandez, Elizabeth 184.00 184.00 184.00Fernando, Rogelio 350.00 350.00 350.00Flora, Dolores 28,750.00 16,000.00 12,750.00 12,750.00Flores, Roberto C. 35,000.00 7,777.76 27,222.24 27,222.24Flores, Teresita 280.00 280.00 280.00Florida, Ma. Corazon 30,350.00 30,350.00 30,350.00Frades, Francisca B. 169.00 169.00 169.00Fuentes, Ma. Leda 960.00 960.00 960.00Fulgar, Ildefonso 200.00 200.00 200.00Gabonada, Fina 14,000.95 7,470.45 6,530.50 6,530.50Galang, Rowena O. 200.00 200.00 200.00Galicia, Reynaldo 200.00 200.00 200.00Galo, Crispin L. 25,276.00 4,533.42 20,742.58 20,742.58Garcia, Myllah 345.00 345.00 345.00Garcia, Rachelle 136.00 136.00 136.00Garcia, Sharon Jennifer 1,092.00 1,092.00 1,092.00Gardiner, Rosemarie 95.00 95.00 95.00
Gemzon, Elena 464.50 464.50 464.50Gener, Jocelyn 550.00 550.00 550.00Gervacio, Ma. Cristina 240.00 240.00 240.00Goce, Maricef 305.00 305.00 305.00Gordo, Flordeliza 300.00 300.00 300.00Grafilo, Rogelio 200.00 200.00 200.00Guevarra, Dorvin H. 10,011.65 847.94 9,163.71 9,163.71Guevarra, Ma. Theresa 425.00 425.00 425.00Gusi, Rechilda 310.00 310.00 310.00Gutierrez, Marie Ann 740.00 740.00 740.00Guzman, Anna Gay 3,150.00 3,150.00 3,150.00Guzman, Ma. Corazon 200.00 200.00 200.00Herrera, Rubie R. 5,246.50 5,066.50 180.00 180.00Ibarrientos, Ofelia 1,<strong>17</strong>0.00 1,<strong>17</strong>0.00 1,<strong>17</strong>0.00Ignacio, Lourdes D. 57,150.00 3,150.00 54,000.00 54,000.00Iguas, Jose 190.00 190.00 190.00Indico, Julie Ann 348.50 348.50 348.50Israel, Marietta C. 9,289.00 3,715.60 5,573.40 5,573.40Jacoba, Amormia Rhodora 40,136.50 20,000.00 20,136.50 20,136.50Javier, Annabella 240.00 240.00 240.00Jayme, Fatima Winnieclare Q. 231.25 200.00 31.25 31.25Jerusalem, John 50.00 50.00 50.00Jerusalem, Violeta L. 115,509.00 45,007.00 70,502.00 70,502.00Jesus, Angelita 502.50 502.50 502.50Jesus, Ma. Corazon 303.75 303.75 303.75Julio, Beata 6,333.70 6,333.70 6,333.70Ko, Robert 5,505.00 5,505.00 5,505.00Lagman, Benjamin 50.00 50.00 50.00Lamorena, Juditha M. 10,120.00 10,000.00 120.00 120.00Lapastora, Milagros 574.95 574.95 574.95Laxamana, Rachel 65.00 65.00 65.00Lazaro, Maria Theresa 16,860.00 2,586.00 14,274.00 14,274.00Lee, Nestor 260.00 260.00 260.00Leon, Arsenia de 108.00 108.00 108.00Leon, Jocelyn E. 8,972.50 1,090.75 7,881.75 7,881.75Leonin, Clarito 200.00 200.00 200.00Lepon, Maria Luisa M. 10,000.00 4,000.00 6,000.00 6,000.00
Liggayu, Michael 750.00 750.00 750.00Limon, Miguel Antonio 350.00 350.00 350.00Lindo, Alicia C. 10,304.49 6,351.99 3,952.50 3,952.50Lopez, Anastacio 454.00 454.00 454.00Lopez, Antonio C. 37,603.75 4,603.75 33,000.00 33,000.00Lopez, Joseph 470.00 470.00 470.00Lopez, Mercedita P. 13,611.85 9,6<strong>17</strong>.85 3,994.00 3,994.00Lopez, Ricardo S. 3,051.50 1,800.00 1,251.50 1,251.50Luansing, Ma. Emelita 77.00 77.00 77.00Lumacad, Fernando B. 2,330.00 1,950.00 380.00 380.00Lumanglas, Christopher 150.00 150.00 150.00Macalintal, Connie 75.00 75.00 75.00Macapagal, Arnualdo B. 64,598.50 64,000.00 598.50 598.50Magat, Wendell 200.00 200.00 200.00Magayaga, Lea Q. 6,400.00 640.00 5,760.00 5,760.00Magno, Grace 152.00 152.00 152.00Magno, Juanita 875.25 875.25 875.25Mahinay, Enriquito 150.00 150.00 150.00Maliwat, Herminia I. 4,685.01 1,408.01 3,277.00 3,277.00Mamaat, Jose Eduardo R. 400.00 400.00 400.00Manalili, Burton V. 19,000.00 1,900.00 <strong>17</strong>,100.00 <strong>17</strong>,100.00Marcelino, Nerissa 35.00 35.00 35.00Marcelo, Teresita 300.00 300.00 300.00Marcial , Maridel S. 6,639.00 1,328.00 5,311.00 5,311.00Marcos, Roberto 800.00 800.00 800.00Marinas, Luzviminda 3,270.00 3,150.00 120.00 120.00Maristela, Teresita 215.00 215.00 215.00Mazo, Flaiano S. 11,731.77 5,000.00 6,731.77 6,731.77Medina, Buenaventura 1,050.00 1,050.00 1,050.00Melchor, Elizabeth P. 132.50 132.50 132.50Mendoza, Gloria A. 14,277.96 7,119.98 7,157.98 7,157.98Menez, Johansen 10.00 10.00 10.00Menez, Karren 3,061.50 454.00 2,607.50 2,607.50Menorca, Emmanuel S. 11,650.20 11,450.20 200.00 200.00Miguel, Emmanuel 815.00 815.00 815.00Mina, Enrique N. 100.00 100.00 100.00Mintu, Cynthia 272.50 272.50 272.50
Mitra, Melvin 1,290.00 1,290.00 1,290.00Monderin, Victor 100.00 100.00 100.00Montaner, Lynette 420.00 200.00 220.00 220.00Montero, Susan 308.00 308.00 308.00Morano, Glenda T. <strong>17</strong>,543.00 <strong>17</strong>,325.00 218.00 218.00Mostajo, Esmeralda 10.00 10.00 10.00Nagtalon, Leo Angelo 640.00 640.00 640.00Nicer, Joselito C. 28,824.00 26,169.00 2,655.00 2,655.00Nicolas, Marietes 296.25 296.25 296.25Nieto, Rowena 180.00 180.00 180.00Noriega, Mariwilda 7,525.30 7,525.30 7,525.30Nulla, Mila R. 59,540.25 24,<strong>17</strong>4.49 35,365.76 35,365.76Ocampo, Dhean R. 12,850.00 1,066.66 11,783.34 11,783.34Odon, Luke Mark 45.00 45.00 45.00Oliver, Michael 30,000.00 30,000.00 30,000.00Omampo, Angelito 820.00 820.00 820.00Orolfo, Teodora C. 8,646.95 7,370.45 1,276.50 1,276.50Ortiz, Milixa Lourdes B. <strong>17</strong>0.00 <strong>17</strong>0.00 <strong>17</strong>0.00Pacquing, Elizabeth 694.50 694.50 694.50Pacquing, Patria 50.00 50.00 50.00Padilla, Leo A. 15,348.50 15,000.00 348.50 348.50Pagdilao, Catalina 35,000.00 35,000.00 35,000.00Pagdilao, Menchie 11.00 11.00 11.00Paguio, Ernesto 290.00 290.00 290.00Paguio, Haidee H. 200.00 200.00 200.00Pal, Salvacion 930.00 930.00 930.00Palaje, Joseph 200.00 200.00 200.00Palenzuela, Delia S. 32,000.00 12,800.00 19,200.00 19,200.00Palis, Fernando 770.05 770.05 770.05Pamittan, Generoso <strong>17</strong>2.50 <strong>17</strong>2.50 <strong>17</strong>2.50Pangilinan, Genice 10,023.50 10,023.50 10,023.50Pantas, Felix L. 4,063.00 4,063.00 4,063.00Paraiso, Jesus 150.00 150.00 150.00Pataunia, Ma. Cecilia C. 200.00 200.00 200.00Paulino, Oscar 200.00 200.00 200.00Paz, Rosalinda Z. 4,469.00 1,489.66 2,979.34 2,979.34Pelaez, Felimon P. 4,570.20 457.02 4,113.18 4,113.18
Peralta, Rosanna 1,420.00 1,420.00 1,420.00Perez, Hector M. 10,320.00 2,500.00 7,820.00 7,820.00Perez, Julie 360.00 360.00 360.00Perez, Winnie 50.00 50.00 50.00Pineda, Rodolfo G. 4,907.00 4,507.00 400.00 400.00Ponce, Elvin C. 15,454.00 454.00 15,000.00 15,000.00Posadas, Demetrio 290.00 290.00 290.00Prudencio, Philip I. 18,960.35 13,960.35 5,000.00 5,000.00Pugeda, Annie 21,068.85 21,068.85 21,068.85Punsalan, Angelita 395.00 395.00 395.00Quijencio, Wilfredo 30.00 30.00 30.00Quizzagan, Frida 180.00 180.00 180.00Raagas, Teresa 150.00 150.00 150.00Ramones, Marigrace M. 33,367.00 33,367.00 33,367.00Ramones, Rhozallino 200.00 200.00 200.00Ramos, Erlinda L. 290.00 200.00 90.00 90.00Ramos, Leonora A. 6,852.25 5,040.00 1,812.25 1,812.25Ramos, Norberto M. 1,290.50 1,190.50 100.00 100.00Rana, Aurelio Y. 50,903.30 10,000.00 40,903.30 40,903.30Raymundo, Samuel 1,<strong>17</strong>0.00 1,<strong>17</strong>0.00 1,<strong>17</strong>0.00Relente, Miguelito 50.00 50.00 50.00Remiendo, Nora Liza A. 3,500.00 1,166.67 2,333.33 2,333.33Remotin, Roberto 50.00 50.00 50.00Resuello, Heidee 123.50 123.50 123.50Reyes, Ma. Veronica S. 85.00 85.00 85.00Reyes, Mercedes C. <strong>17</strong>,895.95 13,845.20 4,050.75 4,050.75Reyes, Richard 200.00 200.00 200.00Reyes, Tommy 110.00 110.00 110.00Reyno, Marivic 125.00 125.00 125.00Rito, Estrellita S. 75.00 47.50 27.50 27.50Rivera, Dolores 1,<strong>17</strong>0.00 1,<strong>17</strong>0.00 1,<strong>17</strong>0.00Rivera, Myrna 1,016.00 1,016.00 1,016.00Romero, Horacio 200.00 200.00 200.00Romero, Susana <strong>17</strong>0.00 <strong>17</strong>0.00 <strong>17</strong>0.00Rosario, Lilinita 25,350.00 25,350.00 25,350.00Rosario, Ma. Theresa O. 2,043.50 535.00 1,508.50 1,508.50Rosario, Ruth 4,063.00 4,875.00 (812.00) (812.00)
Rosario, Warly Evelyn 6,326.75 1,926.50 4,400.25 4,400.25Sabas, Angel 210.10 210.10 210.10Sacdalan, Myrna 200.00 200.00 200.00Sacramento, Racquel 92.50 92.50 92.50Sales, Allan A. 200.00 200.00 200.00Salloman, Philip 8,489.25 4,791.75 3,697.50 3,697.50Salonga, Ma. Elena 7.50 7.50 7.50Salvador, Norina 423.75 423.75 423.75Salvador, Paulino 50.00 50.00 50.00Salvador, Reynaldo E. 200.00 200.00 200.00Samarita, Mercy Cristy 63.75 63.75 63.75Samin, Leonora 200.00 200.00 200.00Santiago, Alvin 750.00 750.00 750.00Santiago, Ma. Loisa 180.00 180.00 180.00Santos, Felipe 220.00 220.00 220.00Santos, Florentino I. 19,<strong>17</strong>2.00 15,376.00 3,796.00 3,796.00Santos, Leonida 14,625.00 9,750.00 4,875.00 4,875.00Santos, Marcelino W. <strong>17</strong>6.00 <strong>17</strong>6.00 <strong>17</strong>6.00Sarmiento, Lina 3,440.90 3,440.90 3,440.90Sasis, Florentino 200.00 200.00 200.00Sayat, Ruby G. 6,182.72 2,182.72 4,000.00 4,000.00Sido, Ma. Victoria P. 1,200.00 1,200.00 1,200.00Sin, Glenda 300.00 300.00 300.00Sipin, Grace 35.00 35.00 35.00Sison, Roger Amadeo 290.00 290.00 290.00Solano, Maria 180.00 180.00 180.00Sombilon, Imelda 80.50 80.50 80.50Somera, Aurelio 250.00 250.00 250.00Songco, Dionisio 13,440.00 13,440.00 13,440.00Sopoco, Anna Marie 852.75 852.75 852.75Soriano, Myla Grace 200.00 200.00 200.00Soronel, Rolando 100.00 100.00 100.00Sotto,Mario 200.00 200.00 200.00Tagle, Susan H. 7,675.05 3,837.50 3,837.55 3,837.55Talampas, Ma. Cristina 3,434.25 3,434.25 3,434.25Tamondong, Ivy 200.00 200.00 200.00Tampol, Eduardo 220.00 220.00 220.00
Tan, Maricar 310.00 310.00 310.00Tan, Melanie 180.00 180.00 180.00Tanafranca, Enrico 30.00 30.00 30.00Taragua, Alma Trinidad 300.00 300.00 300.00Timogan, Raymundo <strong>17</strong>,300.00 <strong>17</strong>,300.00 <strong>17</strong>,300.00Tiotangco, Angelina N. 6,416.00 4,277.32 2,138.68 2,138.68Tirazona, Renato 10,005.00 10,005.00 10,005.00Torres, Emmanuel 980.00 980.00 980.00Trajeco, Ma. Shirley 500.00 500.00 500.00Urquico, Ma. Luisa 666.00 666.00 666.00Uy, Moira 960.00 960.00 960.00Valencia, Eufracia 267.50 267.50 267.50Valencia, Jean Pauline 4,330.00 4,330.00 4,330.00Valencia, Joy 970.00 970.00 970.00Valimento, Ferdinand 150.00 150.00 150.00Vera, Alpher de 10,200.00 10,200.00 10,200.00Vera, Katherine A. 200.00 200.00 200.00Victoria, Francisco 220.00 220.00 220.00Victoria, Michael S. 8,938.00 2,979.33 5,958.67 5,958.67Villacorte, Liza 92.00 92.00 92.00Villahermosa, Maximino P. 1,082.00 837.00 245.00 245.00Villanueva, Romulo 495.00 495.00 495.00Villegas, John F. 350.00 350.00 350.00Vinluan, Lourdes R. 2,371.90 2,371.90 2,371.90Vinluan, Renato A. 12,073.25 6,848.25 5,225.00 5,225.00Vinoya, Aileen Gay 82.00 82.00 82.00Virtucio, Teresita 57.50 57.50 57.50Yap, Donato C. 200.00 200.00 200.00Ymas, Sergio S. 200.00 200.00 200.00Ymbol, Elsie V. 295.00 200.00 95.00 95.00Zaldivar, Ramil 400.00 400.00 400.00Zamudio, Rowena B. 200.00 200.00 200.00Zapanta, Sonny Peter 200.00 200.00 200.00Zape, Vida Edna C. 8,345.00 1,669.00 6,676.00 6,676.00P 2,035,399.53 606,252.05 P 1,429,147.48 1,429,147.48
Ampatin, Estrella V. 164,120.00 164,120.00 164,120.00Arquiza, Glenda S. 21,134.00 21,134.00 21,134.00Astanque, Aurora L. 1,130.00 1,130.00 1,130.00Bilog, Manolo 2,600.00 2,600.00 2,600.00Buenafe, Ma. Belinda 10,000.00 10,000.00 10,000.00Bumatay, Zymon 4,360.00 4,360.00 4,360.00Cabasada, Albert R. 24,000.00 24,000.00 24,000.00Cando, Cromwell 2,000.00 2,000.00 2,000.00Cotorno, Lorine 2,000.00 2,000.00 2,000.00Diwa, Alvin S. 2,000.00 2,000.00 2,000.00Espinosa, William V. 6,000.00 6,000.00 6,000.00Estacio, Ma. Vivian G. 15,800.00 15,800.00 15,800.00Faustino, Jose V. 14,360.00 14,360.00 14,360.00Fernandez, Barbara 39,640.00 39,640.00 39,640.00Flora, Dolores 40,345.00 40,345.00 40,345.00Fronda, Adelaida C. 12,100.00 12,100.00 12,100.00Guzman, Guillerma 29,400.00 29,400.00 29,400.00Lopez, Martin 22,000.00 22,000.00 22,000.00Manigan, Alma C. 11,500.00 11,500.00 11,500.00Molina, Mark Oliver P. 37,000.00 37,000.00 37,000.00Palparan, Karoline <strong>17</strong>,040.00 <strong>17</strong>,040.00 <strong>17</strong>,040.00Paraiso, Lourdes Oliva 12,360.00 12,360.00 12,360.00Salvador, Mary Grace C. 48,330.00 48,330.00 48,330.00Santos, Florentino I. 147,240.00 147,240.00 147,240.00Sinang, Rolando 2,000.00 2,000.00 2,000.00Tejada, Madonna 2,200.00 2,200.00 2,200.00Tolentino, Rosula R. 15,700.00 15,700.00 15,700.00P 706,359.00 P 706,359.00 706,359.00TOTAL - 1131012 P 2,741,758.53 606,252.05 P 2,135,506.48 2,135,506.48
- 18 -Item 7:Financial StatementsThe Financial Statements including the applicable schedules listed in theaccompanying index to financial statements and supplementary schedulesare filed as part of this form I7 - A.
- 20 -INDEX TO THE FINANCIAL STATEMENTSAND SUPPLEMENTARY SCHEDULESFINANCIAL STATEMENTSNO. OF PAGESSTATEMENT OF MANAGEMENT'S RESPONSIBILITYFOR FINANCIAL STATEMENTS 1I. PARENT CORPORATION FINANCIAL STATEMENTSREPORT OF INDEPENDENT PUBLIC ACCOUNTANTS 2REPORT OF INDEPENDENT AUDITORS TO ACCOMPANYFINANCIAL STATEMENTS FOR FILING W/ THE <strong>SEC</strong> 1BALANCE SHEETS AS OF MARCH 31, 2008 and 2007 1STATEMENTS OF INCOME FOR THE YEARS ENDEDMARCH 31, 2008, 2007 and 2006 1STATEMENTS OF CASH FLOWS FOR THE YEARSENDED MARCH 31, 2008, 2007 AND 2006 2STATEMENT OF CHANGES IN STOCKHOLDERS' EQUITYFOR THE YEARS ENDED MARCH 31, 2008, 2007 and2006 1SUPPLEMENTARY SCHEDULENOTES TO FINANCIAL STATEMENTS 25II.CONSOLIDATED FINANCIAL STATEMENTSREPORT OF INDEPENDENT PUBLIC ACCOUNTANTS 2REPORT OF INDEPENDENT AUDITORS TO ACCOMPANYFINANCIAL STATEMENTS FOR FILING WITH THE <strong>SEC</strong> 1STATEMENT OF MANAGEMENT'S RESPONSIBILITYFOR FINANCIAL STATEMENTS 1BALANCE SHEETS AS OF MARCH 31, 2008 and 2007 2STATEMENTS OF INCOME FOR THE YEARS ENDEDMARCH 31, 2008, 2007 and 2006 1STATEMENTS OF CASH FLOWS FOR THE YEARSENDED MARCH 31, 2008, 2007 AND 2006 2STATEMENT OF CHANGES IN STOCKHOLDERS' EQUITYFOR THE YEARS ENDED MARCH 31, 2008, 2007 and2006 2SUPPLEMENTARY SCHEDULENOTES TO FINANCIAL STATEMENTS 26
FAR EASTERN UNIVERSITY, INC.PARENT COMPANY FINANCIAL STATEMENTSMarch 31, 2008, 2007 and 2006
FAR EASTERN UNIVERSITY, INC.PARENT COMPANY BALANCE SHEETSASSETSMarch 31Note 2008 2007Current AssetsCash and cash equivalents 4, 21 P1,206,776,671 P875,927,694Available-for-sale investments 5, 21 840,687,402 816,893,531Receivables - net 6, 8, 21 205,812,372 158,278,935Other current assets 15,406,611 8,902,530Total Current Assets 2,268,683,056 1,860,002,690Noncurrent AssetsDeferred tax assets <strong>17</strong> 8,590,596 5,625,420Due from a related party 8, 21 100,000,000 65,000,000Equity investments 7 88,941,889 88,941,889Investment property - net 9 143,637,418 153,675,589Property and equipment - net 10 549,904,486 534,1<strong>17</strong>,133Held-to-maturity investments 21 32,071,040 30,468,630Other assets 5,463,973 3,303,367Total Noncurrent Assets 928,609,402 881,132,028P3,197,292,458P2,741,134,718LIABILITIES AND EQUITYCurrent LiabilitiesAccounts payable and other current liabilities 11, 21 P423,758,620 P254,213,647Deferred income 16,854,919 -Income tax payable 48,792,628 39,978,593Total Current Liabilities 489,406,167 294,192,240Noncurrent LiabilityTrust funds 12 92,333,480 104,781,284Total Liabilities 581,739,647 398,973,524EquityCapital stock 704,369,900 704,369,900Net unrealized gain on available-for-saleinvestments 5 1,233,243 5,461,069Appropriated retained earnings 19 1,147,161,414 697,161,414Unappropriated retained earnings 766,521,354 938,901,911Treasury stock (3,733,100) (3,733,100)Total Equity 2,615,552,811 2,342,161,194P3,197,292,458P2,741,134,718See Notes to the Parent Company Financial Statements.
FAR EASTERN UNIVERSITY, INC.PARENT COMPANY STATEMENTS OF INCOMEYears Ended March 31Note 2008 2007 2006EDUCATIONAL INCOMETuition fees - net 13 P1,580,683,033 P1,565,968,902 P1,418,213,350Miscellaneous 33,146,510 30,085,666 22,065,4221,613,829,543 1,596,054,568 1,440,278,772OPERATING EXPENSES 15 1,094,192,396 1,055,438,924 934,774,671INCOME FROM OPERATIONS 519,637,147 540,615,644 505,504,101OTHER INCOMEInterest income 76,<strong>17</strong>3,993 63,728,662 84,618,420Other finance income on availablefor-saleinvestments 5,106,956 7,803,472 -Rental 16 25,494,399 42,011,777 21,705,099Miscellaneous 23,143,642 6,141,440 12,801,823129,918,990 119,685,351 119,125,342INCOME BEFORE INCOMETAX 649,556,137 660,300,995 624,629,443INCOME TAX EXPENSE <strong>17</strong> 56,650,134 56,773,943 55,719,087NET INCOME P592,906,003 P603,527,052 P568,910,356EARNINGS PER SHAREBasic and diluted 20 P84.63 P103.37 P121.79See Notes to the Parent Company Financial Statements.
FAR EASTERN UNIVERSITY, INC.PARENT COMPANY STATEMENTS OF CHANGESIN EQUITYYears Ended March 31Note 2008 2007 2006CAPITAL STOCK - P100 par valueAuthorized - 10,000,000 sharesIssued - 7,043,699 shares in 2008 and2007 and 4,708,473 shares in 2006(of which 37,331 shares are in treasury)Balance at beginning of year P704,369,900 P470,847,300 P470,847,300Issuance during the year - 233,522,600 -Balance at end of year 704,369,900 704,369,900 470,847,300NET UNREALIZED GAIN(LOSS) ON AVAILABLE-FOR-SALE INVESTMENTSBalance at beginning of year 5,461,069 (5,536,147) -Net unrealized gain for the year 1,286,340 5,428,886 -Cumulative net unrealized loss(gain) recognized in profit or lossduring the year (5,514,166) 5,568,330 (5,536,147)Balance at end of year 5 1,233,243 5,461,069 (5,536,147)APPROPRIATED RETAINEDEARNINGSBalance at beginning of year 697,161,414 697,161,414 437,161,414Appropriations for:Expansion of facilities 400,000,000 - 240,000,000General retirement 50,000,000 - -Purchases of equipment andimprovements - - 20,000,000450,000,000 - 260,000,000Balance at end of year 19 1,147,161,414 697,161,414 697,161,414UNAPPROPRIATEDRETAINED EARNINGSBalance at beginning of year 938,901,911 744,094,609 547,291,661Net income during the year 592,906,003 603,527,052 568,910,356Appropriations for:Expansion of facilities (400,000,000) - (240,000,000)General retirement (50,000,000) - -Purchases of equipment andimprovements - - (20,000,000)(450,000,000) - (260,000,000)DividendsCash dividends 18 (315,286,560) (<strong>17</strong>5,197,150) (112,107,408)<strong>Stock</strong> dividends 18 - (233,522,600) -(315,286,560) (408,719,750) (112,107,408)Balance at end of year 766,521,354 938,901,911 744,094,609TREASURY STOCK - at cost(37,331 shares) (3,733,100) (3,733,100) (3,733,100)P2,615,552,811 P2,342,161,194 P1,902,834,076See Notes to the Parent Company Financial Statements.
FAR EASTERN UNIVERSITY, INC.PARENT COMPANY STATEMENTS OF CASH FLOWSYears Ended March 31Note 2008 2007 2006CASH FLOWS FROMOPERATING ACTIVITIESIncome before income tax P649,556,137 P660,300,995 P624,629,443Adjustments for:Depreciation and amortization 9, 10, 15 43,159,876 44,048,226 28,071,164Impairment losses on receivables 15, 21 <strong>17</strong>,450,897 12,686,351 10,939,753Unrealized foreign exchange(gain) loss 4,747,861 3,703,946 (4,543,651)Interest income (76,<strong>17</strong>3,993) (63,728,662) (84,618,420)Other finance income onavailable-for-sale investments (5,106,956) (7,803,472) -Gain on disposal of property andequipment - (102,083) (1,189,778)Impairment losses on equityinvestments - - 13,373,107Operating income before workingcapital changes 633,633,822 649,105,301 586,661,618Decrease (increase) in:Receivables (56,777,635) 12,692,473 (52,779,807)Other current asset (6,504,081) (1,387,663) (9,399,435)Increase (decrease) in:Accounts payable and othercurrent liabilities 48,812,870 1,162,734 58,531,810Deferred income 16,854,919 - (27,347,214)Cash generated from operations 636,019,895 661,572,845 555,666,972Interest received 67,967,294 73,852,691 84,618,420Income taxes paid (50,801,275) (55,041,312) (45,776,440)Net cash provided by operatingactivities 653,185,914 680,384,224 594,508,952CASH FLOWS FROMINVESTING ACTIVITIESAdditions to property and equipment 10 (48,909,058) (2,565,486) (189,621,582)Decrease (increase) in:Due from a related party 8 (35,000,000) - -Available-for-sale investments (22,914,741) (466,849,424) 18,512,459Other assets (2,160,606) 28,771,625 (29,612,764)Held-to-maturity investments 257,510 (19,703,753) 424,074Proceeds from disposal of propertyand equipment - <strong>17</strong>5,000 1,230,753Net cash used in investing activities (108,726,895) (460,<strong>17</strong>2,038) (199,067,060)CASH FLOWS FROMFINANCING ACTIVITIESDividends paid (194,554,457) (<strong>17</strong>5,162,650) (112,107,408)Increase (decrease) in trust funds (12,447,804) 18,958,605 18,427,630Net cash used in financing activities (207,002,261) (156,204,045) (93,679,778)Forward
Years Ended March 31Note 2008 2007 2006EFFECTS OF EXCHANGERATE CHANGES ON CASHAND CASH EQUIVALENTS (P6,607,781) (P3,703,946) P5,426,061NET INCREASE IN CASH ANDCASH EQUIVALENTS 330,848,977 60,304,195 307,188,<strong>17</strong>5CASH AND CASHEQUIVALENTS ATBEGINNING OF YEAR 875,927,694 815,623,499 508,435,324CASH AND CASHEQUIVALENTS ATEND OF YEAR 4 P1,206,776,671 P875,927,694 P815,623,499See Notes to the Parent Company Financial Statements.
FAR EASTERN UNIVERSITY, INC.NOTES TO THE PARENT COMPANY FINANCIAL STATEMENTS1. Reporting Entity<strong>Far</strong> <strong>Eastern</strong> <strong>University</strong>, Inc. (the Company) is a domestic educational institution foundedin June of 1928 and incorporated on January 5, 1933. The Company is a private, nonsectarianinstitution of learning comprising the following different institutes that offerspecific courses, namely: Institute of Arts and Sciences; Institute of Accounts, Businessand Finance; Institute of Education; Institute of Architecture and Fine Arts; Institute ofNursing; Institute of Engineering; Institute of Law; and Institute of Graduate Studies.The Company became a listed corporation in the <strong>Philippine</strong> <strong>Stock</strong> <strong>Exchange</strong> onJuly 11, 1986.The address of the Company’s registered office is located at Nicanor Reyes Sr. St.,Sampaloc, Manila.2. Basis of PreparationStatement of ComplianceThe parent company financial statements have been prepared in accordance with<strong>Philippine</strong> Financial Reporting Standards (PFRS).The financial statements of the Company as of and for the year ended March 31, 2008were authorized for issue by the Board of Trustees on July 14, 2008.Basis of MeasurementThe parent company financial statements have been prepared on a historical cost basis,except for available-for-sale investments which are stated at fair value.Functional and Presentation CurrencyThe parent company financial statements are presented in <strong>Philippine</strong> peso, which is alsothe Company’s functional currency.Use of Estimates and JudgmentsThe preparation of financial statements in conformity with PFRS requires management tomake judgments, estimates and assumptions that affect the application of accountingpolices and amounts reported in the financial statements. The estimates and assumptionsused in the financial statements are based upon management’s evaluation of relevantfacts and circumstances as of the balance sheet date. Actual results could differ from suchestimates.Estimates and underlying assumptions are reviewed on an ongoing basis and are based onhistorical experience and other factors, including expectations of future events that arebelieved to be reasonable under the circumstances. Revisions to accounting estimates arerecognized in the period in which the estimate is revised and in any future periodsaffected.
The following presents the summary of these judgments and estimates, which have themost significant effect on the amounts recognized in the parent company financialstatements:Functional CurrencyBased on the economic substance of the underlying circumstances relevant to theCompany, the functional currency has been determined to be the <strong>Philippine</strong> peso. It is thecurrency that mainly influences the normal operations of the Company.LeasesThe Company has entered into various lease agreements both as lessor and lessee.a. As LesseeFor the Company’s lease of buildings that the Company occupies within the campuspremises, the Company has determined that the lessor retains all significant risks andrewards of ownership of these properties which are leased out under an operatinglease agreement (see Note 8 for the related balances).b. As LessorThe Company carries investment property held to earn rentals. The Company hasdetermined that it retains all significant risks and rewards of ownership of theseproperties which are leased out under operating lease agreements (see Note 16 for therelated balances).Estimating Allowance for Impairment Losses on ReceivablesThe Company maintains an allowance for impairment losses on receivables at a levelconsidered adequate to provide for probable uncollectible receivables. The level of thisallowance is evaluated by management on the basis of factors that affect the collectibilityof the accounts. These factors include, but are not limited to, history of the students’payment behavior, age of receivables and other external factors affecting the educationindustry. The Company reviews the age and status of receivables, and identifies accountsthat are to be provided with an allowance on a continuous basis (see Notes 6 and 21 forthe related balances).Estimating Useful Lives of Investment Property and Property and EquipmentThe Company reviews annually the estimated useful lives of investment property andproperty and equipment based on the period over which the assets are expected to beavailable for use and are updated if expectations differ from previous estimates due tophysical wear and tear, technical or commercial obsolescence and legal or other limits onthe use of the assets. In addition, estimation of the useful lives of investment propertyand property and equipment is based on collective assessment of industry practice,internal technical evaluation and experience with similar assets. It is possible that futureresults of operations could be materially affected by changes in these estimates broughtabout by changes in the factors mentioned. A reduction in the estimated useful lives ofproperty and equipment and investment property would increase the recordeddepreciation and amortization expenses and decrease noncurrent assets (see Notes 9 and10 for the related balances).Determining the Realizability of Deferred Tax AssetsThe Company reviews its deferred tax assets at each balance sheet date and reduces thecarrying amount to the extent that it is no longer probable that sufficient taxable profitwill be available to allow all or part of the deferred tax assets to be utilized. TheCompany also reviews the expected timing and tax rates upon reversal of temporarydifferences and adjusts the impact of deferred tax accordingly (see Note <strong>17</strong> for the relatedbalances).- 2 -
Impairment of AssetsThe Company assesses impairment on assets whenever events or changes incircumstances indicate that the carrying amount of an asset may not be recoverable. Thefactors that the Company considers important which could trigger an impairment reviewinclude the following:Significant underperformance relative to the expected historical or projectedfuture operating results;Significant changes in the manner of use of the acquired assets or the strategy foroverall business; andSignificant negative industry or economic trends.In determining the present value of estimated future cash flows expected to be generatedfrom the continued use of the assets, the Company is required to make estimates andassumptions that can materially affect the parent company financial statements. Animpairment loss is recognized whenever the carrying amount of an asset exceeds itsrecoverable amount (see Note 7).ContingenciesThe Company is currently involved in certain legal proceedings. The estimate of theprobable costs for the resolution of these claims has been developed in consultation withoutside counsel handling the Company’s defense in these matters and is based upon ananalysis of potential results. The Company currently does not believe that theseproceedings will have a material adverse effect on its financial position (see Note 22).3. Significant Accounting PoliciesNew Standard, Amendment to Standard and Interpretation Adopted in 2008Effective April 1, 2007, the Company adopted the following new standard, amendment tostandard and interpretation:PFRS 7, Financial Instruments: Disclosures, which requires extensive disclosuresabout the significance of financial instruments for an entity’s financial position andperformance, and quantitative and qualitative disclosures on the nature and extent ofrisks. It replaces disclosure requirements in PAS 32, Financial Instruments:Disclosures and Presentation. It is applicable to all entities that report under PFRS.Additional disclosures required by this standard were included in the parent companyfinancial statements.The Company availed of the transitional relief available under Amendment to PFRS7 with respect to the presentation of certain comparative information for the new riskdisclosures about the nature and extent of risks arising from financial instruments.Accordingly, the Company did not present comparative information for these riskdisclosures, unless the disclosure was previously required under PAS 32, FinancialInstruments: Disclosure and Presentation.- 3 -
Amendment to <strong>Philippine</strong> Accounting Standard (PAS) 1, Presentation of FinancialStatements - Capital Disclosures, which adds requirements to disclose the entity’sobjectives, policies and processes for managing capital, quantitative data about whatthe entity regards as capital; whether the entity has complied with any capitalrequirements; and if it has not complied, the consequences of such non-compliance.Additional disclosures required by this amendment were included in the parentcompany financial statements.<strong>Philippine</strong> Interpretation - International Financial Reporting InterpretationsCommittee (IFRIC) 10, Interim Financial Reporting and Impairment. Thisinterpretation prohibits the reversal of impairment losses on goodwill and availablefor-saleinvestments recognized in interim financial reports even if the impairment isno longer present at the balance sheet date. The adoption of this interpretation had nosignificant impact on the parent company financial statements.Revised Standards Not Yet AdoptedThe following are the revised standards which are not yet effective for the year endedMarch 31, 2008, and have not been applied in preparing the parent company financialstatements:Effective 2009:Revised PAS 1, Presentation of Financial Statements. The revised standard will beeffective for annual periods beginning on or after January 1, 2009. This revisedstandard introduces “total comprehensive income” (i.e., changes in equity during aperiod, other than those changes resulting form transactions with owners in theircapacity as owners), which is presented either in: (a) one statement (i.e., a statementof comprehensive income); or (b) two statements (i.e., an income statement and astatement beginning with profit or loss and displaying components of othercomprehensive income). Certain requirements are also required by revised PAS 1that are not required by the original standard. The requirements of Revised PAS 1will be included in the parent company financial statements upon its adoption onApril 1, 2009.Revised PAS 23, Borrowing Costs. Revised PAS 23 will be effective for annualperiods beginning on or after January 1, 2009. This revised standard removes theoption to expense borrowing costs and requires that an entity to capitalize borrowingcosts directly attributable to the acquisition, construction or production of aqualifying asset as part of the cost of that asset. The adoption of the revised standardis not expected to have significant impact on the parent company financialstatements.Effective 2010:Revised PFRS 3, Business Combinations. The revised standard will be effective forannual periods beginning on or after July 1, 2009. The revised standard includes inits scope business combinations involving only mutual entities, and those in whichseparate entities or businesses are brought together to form a reporting entity bycontract alone. All business combinations are accounted for by applying theacquisition method (referred to previously as the purchase method). The adoption ofthis revised standard is not expected to have significant impact on the parentcompany financial statements.- 4 -
Amendments to PAS 27, Consolidated and Separate Financial Statements. Theseamendments will be effective for financial years beginning on or after July 1, 2009.These amendments mainly relate to changes in the accounting for non-controllinginterest and the loss of control of a subsidiary. These amendments to standard arenot expected to have significant impact on the parent company financial statements.The following are the accounting policies which have been applied consistently in thepreparation of these parent company financial statements.Revenue RecognitionRevenue is recognized to the extent that it is probable that the economic benefits willflow to the Company and the revenue can be reliably measured. The following specificrecognition criteria must also be met before revenue is recognized:Tuition and Other FeesTuition and other fees are recognized as income over the corresponding school term.InterestInterest income is recognized as the interest accrues.RentalRental income is accounted for over the term of the lease using the straight-line method.Financial instrumentsNonderivative financial instruments comprise cash and cash equivalents, receivables, duefrom a related party, available-for-sale (AFS) investments, held-to-maturity (HTM)investments and accounts payable and accrued expenses.Nonderivative financial instruments are recognized initially at fair value plus, forinstruments not at fair value through profit or loss, any directly attributable transactioncosts. Subsequent to initial recognition, nonderivative financial instruments are measuredas described below.A financial instrument is recognized if the Company becomes a party to the contractualprovisions of the instrument. Financial assets are derecognized when the Company’scontractual rights to the cash flows from the financial assets expire or when the Companytransfers the financial asset to another party without retaining control or substantially allrisks and rewards of the asset. Regular way purchases and sales of financial assets areaccounted for at trade date, i.e. the date that the Company commits itself to purchase orsell the asset. Financial liabilities are derecognized if the Company’s obligationsspecified in the contract expire or are discharged or cancelled.Cash and Cash EquivalentsCash includes cash on hand and in banks and is stated at its face value. Cash equivalentsare short-term, highly liquid investments that are readily convertible to known amountsof cash with original maturities of three months or less from the dates of acquisition andare subject to an insignificant risk of change in value.- 5 -
ReceivablesReceivables, which include receivables from students and other receivables, are nonderivativefinancial assets with determinable payments that are not quoted in an activemarket and for which the Company has no intention of trading. They are stated atamortized cost and reduced by an allowance for impairment losses, if any. An allowancefor impairment losses on receivables is maintained at a level considered adequate toprovide for probable uncollectible receivables. The level of allowance for impairmentlosses on receivables is evaluated by management on the basis of factors affecting thecollectibility of the receivables.AFS InvestmentsAFS investments are non-derivative investments that are designated in this category orare not classified in any other category of financial assets. Financial assets are classifiedas AFS when purchased and held indefinitely, but which the Company anticipates to sellin response to liquidity requirements or in anticipation of changes in market rates or otherfactors. AFS investments are initially measured at fair value plus incremental directtransaction costs and subsequently carried at fair value. Unquoted equity securities whosefair value cannot be reliably measured are carried at cost.Realized gains or losses on AFS investments are included in “Interest Income” and“Other Finance Income on AFS Investments” in the parent company statements ofincome. Unrealized gains or losses arising from marking-to-fair value of AFSinvestments are reported as “Net Unrealized Gain or Loss on AFS Investments” in theparent company statements of changes in equity, until such financial asset isderecognized or impaired at which time the cumulative gains or losses previouslyrecognized in equity should be recognized in the parent company statements of income.HTM InvestmentsHTM investments are debt securities which the Company has the positive intent andability to hold to maturity. These investments are initially measured at fair value plusincremental direct transaction costs and subsequently carried at cost, adjusted foramortization of premiums and accretion of discounts using the effective interest methodand reduced by impairment losses, if any.Other Financial InstrumentsOther non-derivative financial instruments such as due from a related party and accountspayable and accrued expenses are recognized initially at fair value and subsequentlymeasured at amortized cost using the effective interest method, less any impairmentlosses.Equity InvestmentsThe Company follows the cost method of accounting for its investments in subsidiariesand associate over which the Company exercises control or significant influence. Underthis method, the Company does not recognize its share in the earnings or losses of thesubsidiary or associate. Dividends received from the subsidiary or associate are reportedas income in the parent company statements of income. Other equity investments wherethe Company has no significant influence or where control is likely to be temporary arealso carried at cost. The following are the Company’s beneficial ownership interest overits subsidiaries and associate.Subsidiaries and AssociateOwnership InterestEast Asia Computer Center, Inc. (EACCI) 100.00%Juliana Management Co., Inc. (JMCI) 49.00%Fern Realty Corporation (FRC) 36.73%- 6 -
Although the Company controls less than 50% of the voting shares of stock of FRC, ithas the power to govern the financial and operating policies of the said entity. Also, theCompany has the power to cast the majority of votes at meetings of the board of directorsand elect officers of FRC. Accordingly, investment in FRC was accounted for under costmethod.Property and EquipmentProperty and equipment, except land, are carried at cost less accumulated depreciation,amortization and impairment losses, if any. Land is stated at cost less any impairment invalue.Initially, an item of property and equipment is measured at its cost, which comprises itspurchase price and any directly attributable cost of bringing the asset to the location andcondition for its intended use. Subsequent costs that can be measured reliably are addedto the carrying amount of the asset when it is probable that future economic benefitsassociated with the asset will flow to the Company. The costs of day-to-day servicing ofan asset are recognized as expenses in the year in which they are incurred.Construction in progress represents a building under construction and is stated at cost.This includes costs of construction and other direct costs. Construction in progress is notdepreciated until such time the relevant assets are completed and available foroperational use.Depreciation is recognized in the parent company statements of income on a straight-linebasis over the estimated useful lives of the assets. Leasehold improvements areamortized on a straight-line basis over the estimated useful life of the improvements orthe term of the lease, whichever is shorter. Land and construction in progress are notdepreciated. The estimated useful lives are as follows:Number of YearsBuildings and improvements 20Leasehold improvements 20Furniture and equipment 4 - 6Miscellaneous equipment 5The useful lives and depreciation and amortization method are reviewed at each balancesheet date to ensure that they are consistent with the expected pattern of economicbenefits from those assets.When an asset is disposed of, or is permanently withdrawn from use and no futureeconomic benefits are expected from its disposal, the cost and accumulated depreciation,amortization and impairment losses, if any, are removed from the accounts and anyresulting gain or loss arising from the retirement or disposal is recognized in the parentcompany statements of income.Investment PropertyInvestment property consists of the FEU East Asia Main Building and improvementsthereon, which is held either to earn rental income or for capital appreciation or for both.Investment property is initially measured at cost less accumulated depreciation,amortization and impairment losses, if any.- 7 -
Investment property is derecognized when it has either been disposed of or permanentlywithdrawn from use and no future benefit is expected from its disposals. Any gain orloss on derecognition of investment property is recognized in the parent companystatements of income in the year of derecognition.Transfers are made to investment property when, and only when, there is a change in use,evidenced by the end of owner-occupation, commencement of an operating lease toanother party or by the end of construction or development.Depreciation and amortization of investment property, which consists of building andimprovements, are computed using the straight-line method over its estimated useful lifeof 20 years.Impairment of AssetsFinancial AssetsA financial asset is considered to be impaired if objective evidence indicates that one ormore events have had a negative effect on the estimated future cash flows of that asset.An impairment loss in respect of a financial asset measured at amortized cost iscalculated as the difference between its carrying amount, and the present value of theestimated future cash flows discounted at the original effective interest rate.Significant financial assets are tested for impairment on an individual basis. Theremaining financial assets are assessed collectively in groups that share similar credit riskcharacteristics.All impairment losses are recognized in the parent company statements of income.Non-financial AssetsNon-financial assets are reviewed for impairment whenever events or changes incircumstances indicate that the carrying amount of an asset may not be recoverable. Ifany such indication exists and where the carrying amount of an asset exceeds itsrecoverable amount, the asset or cash-generating unit is written down to its recoverableamount. The estimated recoverable amount is the higher of an asset’s fair value lesscosts to sell and value in use. The fair value less costs to sell is the amount obtainablefrom the sale of an asset in an arm’s length transaction less the costs of disposal whilevalue in use is the present value of estimated future cash flows expected to arise from thecontinuing use of an asset and from its disposal at the end of its useful life. In assessingvalue in use, the estimated future cash flows are discounted to their present value using apre-tax discount rate that reflects current market assessments of time value of money andthe risks specific to the asset. For an asset that does not generate largely independentcash inflows, the recoverable amount is determined for the cash-generating unit to whichthe asset belongs. Impairment losses are recognized in the parent company statements ofincome.Recovery of impairment losses recognized in prior years is recorded when there is anindication that the impairment losses recognized for the asset no longer exist or havedecreased. The recovery is recognized in the parent company statements of income.However, the increase in carrying amount of an asset due to a recovery of an impairmentloss is recognized to the extent that it does not exceed the carrying amount that wouldhave been determined (net of depreciation and amortization) had no impairment loss beenrecognized for that asset in prior years.- 8 -
Related PartiesParties are considered to be related if one party has the ability, directly or indirectly, tocontrol the other party or exercise significant influence over the other party in makingfinancial and operating decisions. Parties are also considered to be related if they aresubject to common control or common significant influence. Related parties may beindividuals or corporate entities. Transactions between related parties are based on termssimilar to those offered to non-related parties.Restricted FundsThe Company uses the fund accounting method for funds held for specific purposes.Receipt and disbursement transactions of the funds are accounted for separately andconsumption of the fund’s assets is restricted.Retirement PlanThe Company has a contributory and defined contribution type of retirement benefit plan.Under this plan, the amount of a member's future benefits is determined by thecontributions paid by both the Company and the member and the operating efficiencyand investment earnings of the fund.Operating LeaseLeases in which a significant portion of the risks and rewards of ownership is retained bythe lessor are classified as operating leases. Payments made under operating leases arerecognized in the parent company statements of income on a straight-line basis over theterm of the lease.Finance Income and ExpensesFinance income comprises of interest income on bank deposits, cash equivalents, AFSinvestments and HTM investments, dividend income, foreign currency gains and otherincome on AFS investments. Interest income is recognized in the parent companystatements of income as it accrues, using the effective interest rate method. Dividendincome is recognized on the date that the Company’s right to receive payment isestablished. All other finance income are recognized in the parent company statementsof income as they accrue.Finance expenses comprise foreign currency losses, which is recognized in the parentcompany statements of income as it accrue.Income TaxesIncome tax expense for the year comprises of current and deferred tax. Income taxexpense is recognized in the parent company statements of income except to the extentthat it relates to items recognized directly in equity, in which case it is recognized inequity.Current TaxCurrent tax assets and liabilities for the current and prior periods are measured at theamount expected to be recovered from or paid to the tax authority. The tax rates and taxlaws used to compute the current tax are those that are enacted or substantively enactedas of the balance sheet date.Deferred TaxDeferred tax is provided using the liability method. Deferred tax assets and liabilities arerecognized for the future tax consequences attributable to temporary difference betweenthe carrying amounts of assets and liabilities for financial reporting purposes andamounts used for taxation on purposes and carryforward benefits of unused tax creditsfrom excess minimum corporate income tax (MCIT) over regular income tax and the net- 9 -
operating loss carryover (NOLCO). The amount of deferred tax provided is based on theexpected manner of realization or settlement of the carrying amount of assets andliabilities, carryforward benefits of MCIT and NOLCO, using the tax rates enacted orsubstantively enacted as of the balance sheet date. A deferred tax asset is recognizedonly to the extent that it is probable that future taxable profits will be available againstwhich the deductible temporary differences and carryforward benefits of MCIT andNOLCO can be utilized. Deferred tax assets are reviewed at each balance sheet date andare reduced to the extent that it is no longer probable that the related tax benefit will berealized.Provisions and Contingent LiabilitiesA provision is a liability of uncertain timing or amount. It is recognized when theCompany has a legal or constructive obligation as a result of a past event; it is probablethat an outflow of economic benefits will be required to settle the obligation and areliable estimate can be made.When it is not possible that an outflow of economic benefits will be required, or theamount cannot be estimated reliably, the obligation is disclosed as a contingent liability,unless the probability of outflow of economic benefits is remote. Possible obligations,those existences will only be confirmed by the occurrence or non-occurrence of one ormore future events are also disclosed as contingent liabilities unless the probability ofoutflow of economic benefits is remote.Earnings per ShareBasic earnings per share is computed by dividing net income for the year by the weightedaverage number of outstanding common stock during the year while diluted earnings pershare is computed by dividing net income by the weighted average number ofoutstanding common stock after adjusting the effect to both numbers of potential dilutivecommon stock.Foreign Currency TransactionsTransactions in foreign currencies are recorded in <strong>Philippine</strong> peso based on the exchangerates prevailing at the transaction dates. Foreign currency denominated monetary assetsand liabilities are translated into <strong>Philippine</strong> peso using the rates of exchange prevailing atbalance sheet date. <strong>Exchange</strong> gains or losses arising from translation of foreign currencydenominated items at rates different from those at which they were previously recordedare recognized in the parent company statements of income.Events After the Balance Sheet DatePost year-end events that provide additional information about the Company’s position atthe balance sheet date (adjusting events) are recognized in the parent company financialstatements. Post year-end events that are not adjusting events are disclosed in the notes tothe parent company financial statements when material.4. Cash and Cash EquivalentsThis account at March 31 consists of:2008 2007Cash on hand and in banks P<strong>17</strong>5,914,479 P122,345,981Short-term deposits 1,030,862,192 753,581,713P1,206,776,671P875,927,694- 10 -
Cash in banks earn interest at the prevailing bank deposit rates. Short-term depositsrepresent time deposits with local banks which are pre-terminable. These placements bearannual interest ranging from 3.75% to 5.25% in 2008 and 3.50% to 6.00% in 2007 forpeso placements and 2.25% to 2.5% in 2008 and 3.62% to 4.00% in 2007 for dollarplacements.Certain portions of cash and cash equivalents are restricted to fund activities for specificeducational purposes (see Note 12).5. Available-for-Sale InvestmentsThis account at March 31 consists of:2008 2007Government securities P466,818,731 P501,707,462Trust fund 372,635,428 309,725,000839,454,159 811,432,462Add net unrealized gain on AFS investments 1,233,243 5,461,069P840,687,402P816,893,531Certain AFS investments reached their maturity during the years ended March 31, 2008and 2007 and were converted into cash and cash equivalents, which resulted torecognition of cumulative gain of P5,514,166 in 2008 and cumulative loss of P5,568,330in 2007, previously recognized in equity, in the parent company statements of income.The Company’s exposures to credit and market risks are disclosed in Note 21.6. ReceivablesThis account consists of:Note 2008 2007Tuition and other fee receivables P81,923,719 P57,582,620Accrued interest receivable 44,938,392 44,535,165Advances to suppliers 36,121,662 21,814,381Receivable from FEU EducationalFoundation, Inc. 28,843,710 30,046,651Receivable from East Asia EducationalFoundation (EAEF) 14,116,055 4,638,949Advances to employees 9,145,859 9,548,058Receivable from FRC 8 2,341,650 1,336,314Others 253,658 213,2982<strong>17</strong>,684,705 169,715,436Less allowance for impairment losses ontuition and other fee receivables 11,872,333 11,436,501P205,812,372P158,278,935No allowance for impairment losses on all other receivables were provided as ofMarch 31, 2008 and 2007 since management believes that these are collectible.- 11 -
The Company’s exposure to credit risk is disclosed in Note 21.7. Equity InvestmentsThis account at March 31 consists of:2008 2007Acquisition cost of investments in shares ofstock:FRC (36.73% owned subsidiary) P63,297,699 P63,297,699EACCI (a wholly owned subsidiary) 20,104,999 20,104,999JMCI (49.00% owned associate) 7,878,121 7,878,12191,280,819 91,280,819Less allowance for impairment losses 2,338,930 2,338,930P88,941,889P88,941,889JMCI’s summary of the financial information as of December 31, 2007 and 2006follows:2007 2006Total assets P14,826,831 P14,749,245Total liabilities 326,060 198,000Total equity 14,500,771 14,551,245Net loss 50,474 73,6828. Related Party TransactionsIn the normal course of business, the Company has transactions with its related parties asfollows:a) The Company has outstanding advances to FRC with an aggregate principal amountof P100,000,000 and P65,000,000 as of March 31, 2008 and 2007, receivable ondemand. These advances, which bear interest due quarterly at 91-day Treasury Billrate ranging from 3.95% to 4.15% annually in 2008 and 3.00% to 6.63% annually in2007. Total interest income from these advances recognized in the parent companystatements of income amounted to P3,129,468 in 2008 and P7,051,084 in 2007.b) The Company has an existing lease contract with FRC which covers certain buildingsthat the Company occupies within the campus premises. The said contract wasrenewed on July 1, 2005 and will expire on June 30, 2015.The remaining future minimum rent payments are as follows:2008 2007More than five years P122,576,689 P131,575,959Between one and five years 163,161,321 <strong>17</strong>5,434,612Less than one year 31,960,455 43,858,653P3<strong>17</strong>,698,465P350,869,224- 12 -
Total rental expense recognized the parent company statements of income amountedto P50,504,658 in 2008 and P48,2<strong>17</strong>,745 in 2007, in accordance with PAS <strong>17</strong>.c) The Company leased out a building to FRC for a period of 10 years covering theperiod beginning on September 1, 2007 until August 31, 20<strong>17</strong>, renewable uponmutual consent of both parties. Rent income from FRC amounted to P560,000 in2008 (see Note 16).d) The Company grants non-interest bearing advances to certain related parties forworking capital purposes.Total outstanding advances to FRC, which are included in Receivables in the parentcompany balance sheets, as of March 31, 2008 and 2007 amounted to P2,341,650and P1,336,314, respectively (see Note 5).e) Total remunerations of the Company’s key management personnel presented underthe “Salaries, Allowances and Benefits” account is as follows:2008 2007Short-term benefits P100,412,356 P103,872,843Retirement benefits 16,321,494 13,592,380P116,733,850P1<strong>17</strong>,465,223The Company’s exposures to credit and market risks are disclosed in Note 21.9. Investment PropertyThe movements in this account are as follows:2008 2007Gross carrying amount P200,763,421 P200,763,421Accumulated depreciation and amortization:Balance at beginning of year 47,087,832 37,049,661Depreciation and amortization 10,038,<strong>17</strong>1 10,038,<strong>17</strong>1Balance at end of year 57,126,003 47,087,832Carrying amount P143,637,418 P153,675,589This property pertains to the FEU East Asia Main Building including its buildingimprovements rented by EACCI and EAEF.The fair value of investment property amounted to P114,027,000. This was determinedbased on the most recent valuation performed by independent appraisers in 2003. Thedifference between the fair value and the carrying amount as of March 31, 2008 and 2007pertains to additions made to investment property from the date of the last independentappraisal.- 13 -
10. Property and EquipmentThe movements in this account are as follows:Land andBuildings andImprovementsFor the Years Ended March 31, 2008 and 2007FurnitureandEquipmentLeaseholdImprovementsMiscellaneousEquipmentConstructionin ProgressGross carrying amount:March 31, 2006 P538,412,933 P78,658,672 P49,301,578 P11,943,025 P - P678,316,208Additions 6,681,129 10,736,384 - 147,973 - <strong>17</strong>,565,486Disposals/write-offs - (500,000) - - - (500,000)Reclassifications (15,000,000) - - - - (15,000,000)March 31, 2007 530,094,062 88,895,056 49,301,578 12,090,998 - 680,381,694Additions 29,121,955 18,116,891 369,348 318,151 982,713 48,909,058March 31, 2008 559,216,0<strong>17</strong> 107,011,947 49,670,926 12,409,149 982,713 729,290,752Accumulated depreciationand amortization:March 31, 2006 37,262,186 56,581,944 7,395,237 11,442,222 - 112,681,589Depreciation andamortization 20,659,963 10,783,379 2,465,079 101,634 - 34,010,055Disposals/write-offs - (427,083) - - - (427,083)March 31, 2007 57,922,149 66,938,240 9,860,316 11,543,856 - 146,264,561Depreciation andamortization 20,399,<strong>17</strong>1 10,142,060 2,465,079 115,395 - 33,121,705March 31, 2008 78,321,320 77,080,300 12,325,395 11,659,251 - <strong>17</strong>9,386,266Carrying amount:March 31, 2007 P472,<strong>17</strong>1,913 P21,956,816 P39,441,262 P547,142 P - P534,1<strong>17</strong>,133March 31, 2008 P480,894,697 P29,931,647 P37,345,531 P749,898 P982,713 P549,904,486Total11. Accounts Payable and Other Current LiabilitiesThis account at March 31 consists of:2008 2007Accounts payable and accrued expenses P141,505,198 P134,997,669Dividends Payable 139,805,663 19,073,560Accrued retirement 7,099,700 6,614,691Deposits payable 1,326,485 1,326,485Other current liabilities 134,021,574 92,201,242P423,758,620P254,213,647The accounts payable and accrued expenses account is further itemized as follows:2008 2007Accounts payable - trade P60,050,<strong>17</strong>3 P50,513,265Accrued expenses 57,845,983 56,209,925Accrued bonus and benefits 23,609,042 28,274,479P141,505,198The Company’s exposure to liquidity risk is disclosed in Note 21.P134,997,669- 14 -
12. Trust FundsThis account at March 31 consists of:2008 2007Student welfare and development fund P40,693,748 P40,693,748Visual aid development fund 26,331,899 23,686,114FEU Central Student Organization:Student loan fund 10,502,842 8,354,034Student scholarship fund 3,919,602 3,792,576Student assistance fund 2,653,039 3,011,565Others 8,232,350 25,243,247P92,333,480P104,781,284These trust funds represent collections to defray expenses related to activities for specificeducational purposes wherein cash equivalent to the outstanding balances of these fundsare restricted from use for other purposes (see Note 4).13. Tuition FeesThis account consists of:2008 2007 2006Tuition and other feesP1,655,826,499 P1,636,730,534 P1,475,070,326Less: Scholarship discounts (57,508,745) (52,764,930) (40,892,082)Cash discounts (10,038,965) (9,804,230) (9,312,478)Family discounts (7,595,756) (8,192,472) (6,652,416)P1,580,683,033 P1,565,968,902 P1,418,213,35014. Employees’ Health, Welfare and Retirement FundThe Company maintains a funded and contributory retirement plan, which is a definedcontribution type of retirement plan since 1967, covering regular teaching and nonteachingpersonnel members.Contributions to this fund are in accordance with the defined contribution established bythe Retirement Board which is the sum of the employees’ and the Company’scontributions. Employees’ contribution is 5.00% of basic salary while the Company’scontribution is equivalent to 20.00% of the employees’ basic salary. Retirement expenserecognized in the parent company statements of income amounted to P63,446,825 in2008, P48,976,768 in 2007 and P48,649,476 in 2006.The retirement fund is under the administration of an organization, FEU Health, Welfareand Retirement Fund through its Retirement Board.- 15 -
The Fund’s balance sheets as of December 31, 2007 and 2006 showed the following:2007 2006AssetsMoney market placements P555,853,116 P469,330,668Receivables 40,186,159 39,495,746Cash in banks 4,628,136 5,121,742Others 208,505 157,398600,875,916 514,105,554Liabilities 49,871,692 45,330,630P551,004,224P468,774,92415. Operating ExpensesThis account consists of:Note 2008 2007 2006Instructional and AcademicSalaries and allowances 8 P495,587,597 P468,906,339 P298,970,355Employees benefits 14 150,395,234 135,098,784 231,109,260Related Learning Experience 19,474,376 19,959,589 2,770,600Affiliation 11,418,035 11,265,056 3,205,809Others <strong>17</strong>,370,504 14,909,660 31,<strong>17</strong>2,190694,245,746 650,139,428 567,228,214AdministrativeSalaries and allowances 8 77,655,820 70,511,646 62,270,613Rental 8 50,504,658 48,2<strong>17</strong>,745 36,767,634Employees benefits 14 36,165,361 35,<strong>17</strong>5,975 58,596,699Others 27,418,627 <strong>17</strong>,837,157 22,427,426191,744,466 <strong>17</strong>1,742,523 180,062,372Maintenance and CompanyOperationsUtilities 60,771,052 68,929,086 61,921,693Salaries and allowances 8 24,196,975 23,049,555 8,734,742Employees benefits 14 11,772,106 10,492,989 9,858,257Janitorial services 11,707,163 13,052,135 10,506,279Repairs and maintenance 4,330,271 29,441,<strong>17</strong>5 5,076,787Property insurance 564,594 1,487,187 649,521113,342,161 146,452,127 96,747,279GeneralDepreciation and amortization 9, 10 43,159,876 44,048,226 28,071,164Security services 18,314,315 15,323,818 14,185,307Impairment losses onreceivables 21 <strong>17</strong>,450,897 12,686,351 10,939,753Publicity and promotions 8,033,477 4,966,479 3,886,531Donation and charitablecontributions 533,888 818,470 <strong>17</strong>,672,293Taxes and licenses 445,275 1,041,292 282,306Others 6,922,295 8,220,210 15,699,45294,860,023 87,104,846 90,736,806P1,094,192,396 P1,055,438,924 P934,774,671- 16 -
16. Operating LeasesThe Company leases out certain buildings to several parties for a period of one (1) toten (10) years until August 31, 20<strong>17</strong>.Total rent income recognized in the parent company statements of income amounted toP25,494,399 in 2008, P42,011,777 in 2007 and P21,705,099 in 2006.The remaining future minimum rent receivables are as follows:2008 2007More than five years P4,400,000 P -Between one and five years 142,477,280 137,828,526Less than one year 38,104,829 37,239,314P184,982,109P<strong>17</strong>5,067,840<strong>17</strong>. Income TaxesThe components of the Company’s income tax expense are as follows:2008 2007 2006Current tax expense P59,615,310 P58,009,602 P57,408,347Deferred tax benefit arising fromorigination and reversal oftemporary differences (2,965,<strong>17</strong>6) (1,235,659) (1,689,260)P56,650,134 P56,773,943 P55,719,087Deferred tax assets are attributable to the following:2008 2007Deferred income P1,685,492 P -Non-deductible accruals 5,243,085 4,111,375Impairment losses on receivables 1,187,233 1,143,650Others 474,786 370,395P8,590,596P5,625,420- <strong>17</strong> -
The reconciliation of the income tax expense computed at applicable statutory income taxrate of 10% to the income tax expense shown in the parent company statements ofincome follows:2008 2007 2006Income before income tax P649,556,137 P660,300,995 P624,629,443Income tax at 10% P64,955,614 P66,030,100 P62,462,944Additions to (reductions in)income tax resulting from thetax effects of:Income subjected to final tax (8,412,302) (9,239,732) (8,081,167)Provision for probable losses - - 1,103,4<strong>17</strong>Others 106,822 (16,425) 233,893P56,650,134 P56,773,943 P55,719,087The Company availed the Tax Incentives Provisions of Republic Act (R.A.) No. 8525,Adopt-a-School Act of 1998. The amount of contribution/donation that were actually,directly and exclusively incurred for the Adopt-a-School Program, with limitations,conditions and rules set forth in Section 34 (H) of the Tax Code, is subject to anadditional amount equivalent to fifty percent (50%).On October 10, 2007, the BIR issued Revenue Regulation No. 12-2007, which amendedthe timing of the calculation and payment of minimum corporate income tax (MCIT)from an annual basis to a quarterly basis, i.e., excess MCIT from a previous quarterduring the current taxable year may be applied against subsequent quarterly or currentannual income tax due, whether MCIT or regular corporate income tax (RCIT).However, excess MCIT from the previous taxable year/s are not creditable against MCITdue for a subsequent quarter and are only creditable against quarterly and annual RCIT.On May 24, 2005, Republic Act No. 9337 entitled “An Act Amending the NationalInternal Revenue Code, as Amended, with Salient Features” (the “Act”) was passed intoa law effective November 1, 2005. Among others, the Act provides for the increase inunallowable interest rate from 38% to 42% with a reduction thereof to 33% beginning onJanuary 1, 2009.- 18 -
18. Dividend DeclarationsThe Board of Trustees approved the following dividend declarations in 2008, 2007 and2006, respectively:Date of Declaration Date of Record Date of Payment Amount2008Cash dividend ofP15.00 per share June 26, 2007 July 11, 2007 July 23, 2007 P105,095,520Cash dividend ofP15.00 per share December 18, 2007 January 7, 2008 January <strong>17</strong>, 2008 105,095,520Cash dividend ofP15.00 per share March 25, 2008 April 10, 2008 April 24, 2008 105,095,520P315,286,5602007Cash dividend ofP15.00 per share June 20, 2006 July <strong>17</strong>, 2006 July <strong>17</strong>, 2006 P70,067,13050% <strong>Stock</strong> dividendequivalent to2,335,226 shares March 21, 2006 September 6, 2006 October 2, 2006 233,522,600345 fractional sharespaid out in cash atP100.00 per share March 21, 2006 September 6, 2006 October 2, 2006 34,500Cash dividend ofP15.00 per share December 19, 2006 January 5, 2007 January 15, 2007 105,095,520P408,719,7502006Cash dividend ofP12.00 per share June 21, 2005 July 08, 2005 July 18, 2005 P56,053,704Cash dividend ofP12.00 per share December 13, 2005 January 10, 2006 January 20, 2006 56,053,704P112,107,40819. Appropriated Retained EarningsThis account consists of:2008 2007 2006Appropriations for:Expansion of facilities P1,010,000,000 P610,000,000 P610,000,000Purchases of equipment andimprovements 30,000,000 30,000,000 30,000,000Contingencies 20,161,414 20,161,414 20,161,414Acquisition of laboratoryequipment 20,000,000 20,000,000 20,000,000Repairs and improvements 10,000,000 10,000,000 10,000,000General retirement 57,000,000 7,000,000 7,000,000P1,147,161,414 P697,161,414 P697,161,414- 19 -
The Board of Trustees approved the following appropriations:a. On July 19, 2005, P200 million for school facilities expansions;b. On March 21, 2006, additional P40 million and P20 million for school facilitiesexpansions and purchase of equipment, respectively;c. On June 26, 2007, P100 million and P50 million for improvement of facilitiesand general retirement, respectively; andd. On March 25, 2008, additional P300 million for school expansion.20. Earnings Per ShareBasic and diluted earnings per share are computed as follows:2008 2007 2006Outstanding number of shares -net of treasury stock of 37,331shares 7,005,738 7,005,738 4,671,142Net income for the year P592,906,003 P603,527,052 P568,910,443Divided by average outstandingshares 7,005,738 5,838,440 4,671,142P84.63 P103.37 P121.7921. Financial Risk ManagementThe Company has exposure to the following risks from its use of financial instruments:1. Credit risk2. Liquidity risk3. Market riskThis note presents information about the Company’s exposure to each of the above risks,the Company’s objectives, policies and processes for measuring and managing risk, andthe Company’s management of capital.The main purpose of the Company’s dealings in financial instruments is to fund itsoperational and capital expenditures. The Board of Trustees (BOT) has overallresponsibility for the establishment and oversight of the Company’s risk managementframework. The BOT has delegated to the senior management the responsibility fordeveloping and monitoring the Company’s policies, which address risk managementareas.Management is responsible for monitoring compliance with the Company’s riskmanagement policies and procedures and for reviewing the adequacy of these policies inrelation to the risks faced by the Company.- 20 -
1. Credit RiskCredit risk represents the loss the Company would incur if counterparty failed toperform under its contractual obligations. The Company’s exposure to credit risk onits receivables relates primarily to the inability of the debtors and students to pay andfully settle the unpaid balance of tuition fees and other charges, respectively, whichare owed to the Company based on the installment payment schemes. The Companyhas established controls and procedures in its credit policy to determine and tomonitor the credit worthiness of the students based on relevant factors. Also,students are not allowed to enroll in the following semester unless the unpaid balancein the previous semester has been paid. The Company also withholds the academicrecords and clearance of the students with unpaid balance, thus ensuring thatcollectibility is reasonably assured. The Company’s exposure to credit risk on itsother receivables from debtors and related parties is managed through close accountmonitoring and setting limits.The Company neither has any significant exposure to any individual customer orcounterparty nor any other concentration of credit risk arising from counterparties issimilar business activities, geographic region or economic parties.With respect to credit risk arising from cash and cash equivalents, receivables, duefrom a related party, AFS investments and HTM investments, the Company’sexposure to credit risk arises from default of the counterparty, with maximumexposure equal to the carrying amount of these instruments. The maximum exposureto credit risk at the balance sheet date is as follows:Note 2008Cash in bank and cash equivalents 4 P1,206,629,763AFS investments 5 840,687,402Receivables 6 205,812,372Due from a related party 4, 8 100,000,000HTM investments 32,071,040P2,385,200,577The analysis of the Company’s receivables as of March 31, 2008 according to creditquality is as follows:(In ‘000s)Neither pastdue norimpairedImpairedPast DueNotimpairedTotalTuition and other fees P43,360 P11,872 P26,692 P81,924Related party 102,342 - - 102,342Suppliers 36,122 - - 36,122Employees 9,146 - - 9,146Others 43,213 - - 43,213The Company classifies tuition and other fee receivables from students based on thenumber of semesters the receivables have been outstanding. Receivables fromstudents that are outstanding for more than one semester are analyzed to determinewhether they are impaired. Those that are not outstanding for more than onesemester or are currently receivable are determined to be collectible, based onhistorical experience.- 21 -
The movements in allowance for impairment losses in respect of receivables duringthe year ended March 31, 2008 are as follows:Balance at April 1, 2007P11,436,501Impairment loss recognized during the year <strong>17</strong>,450,897Receivables written-off during the year (<strong>17</strong>,015,065)Balance at March 31, 2008P11,872,333The allowance for impairment losses on receivables as of March 31, 2008 relates toreceivables from students which have been outstanding for more than one semesterand specifically identified to be impaired.No impairment loss on the rest of the Company’s financial assets have been providedsince none of them were identified to be impaired as of March 31, 2008. Cash andcash equivalents, AFS investments and HTM investments are coursed throughreputable financial institutions duly approved by the BOT. The balance due from arelated party is from a profitable related party with good payment records; collectionstherefrom are reasonably assured.2. Liquidity RiskThe Company manages liquidity risk by maintaining a balance between continuity offunding and flexibility. Treasury controls and procedures are in place to ensure thatsufficient cash is maintained to cover daily operational and working capitalrequirements. Management closely monitors the Company’s future and contingentobligations and ensures that future cash collections are sufficient to meet them inaccordance with internal policies. The Company invests in cash placements whenexcess cash is obtained from operations.Financial liabilities of the Company at the balance sheet date comprise of accountspayable and accrued expenses which are all short term in nature and have contractualmaturities of less than 12 months.3. Market RiskMarket risk is the risk of loss to future earnings, to fair values or to future cash flowsthat may result from changes in the price of a financial instrument. The value of afinancial instrument may change as a result of changes in interest rates, foreigncurrency exchange rates, commodity prices, equity prices and other market changes.The objective of market risk management is to manage and control risk exposureswithin acceptable parameters, while optimizing the return on risk. The Company issubject to various market risks, including risks from changes in interest rates andcurrency exchange rates.Price Risk Sensitivity AnalysisThe Company’s exposure to price risk arises from its investments in equity and debtsecurities, which are classified as AFS investments in the balance sheets.Management monitors its equity and debt securities in its investment portfolio basedon market indices. Material investments within the portfolio are managed on anindividual basis.- 22 -
AFS investments consist of publicly listed equity securities and governmentsecurities which are carried at fair value and non-listed equity securities for which nofair value information is available and that are therefore carried at cost.Increase (decrease) in market priceEffect onEquity+10% P84,068,740-10% (84,068,740)A 10% increase in the market values of the Company’s AFS investments at year-endwould have increased equity by the amounts shown above. This analysis assumesthat all other variables, in particular interest rates, remain constant.A 10% decrease in the market values of the AFS investments at year-end would havean equal but opposite effect to the amounts shown above, on the basis that all othervariables remain constant.Interest Rate Risk Sensitivity AnalysisThe Group’s exposure to interest rate risk arises from the following interest-bearingfinancial instruments:Note 2008Cash in bank and cash equivalents4 P1,206,629,763Available-for-sale investments 5 469,678,961Due from a related party 4, 8 100,000,000Held-to-maturity investments 32,071,040P1,808,379,764The sensitivity of the Company’s profit before tax to a reasonably possible change ininterest rates, with all variables held constant, are demonstrated as follows:Increase/Decrease inInterest RateEffect on Profitbefore TaxCash in bank and cash equivalents +2% P24,132,595-2% (24,132,595)Available-for-sale investments +2% 9,393,579-2% (9,393,579)Due from a related party +2% 2,000,000-2% (2,000,000)Held-to-maturity investments +2% 641,421-2% (641,421)- 23 -
Fair ValuesThe fair values together with the carrying amounts of the financial assets and liabilitiesshown in the interim balance sheet are as follows:2008NoteCarryingAmount Fair ValueCash and cash equivalents4 P1,206,776,671 P1,206,776,671Available-for-sale investments 5 840,687,402 840,687,402Receivables 6 205,812,372 205,812,372Due from a related party 8 100,000,000 100,000,000Held-to-maturity investments 32,071,040 32,071,040Accounts payable and accrued expenses 11 423,758,620 423,758,620A number of the Company’s accounting policies and disclosures require thedetermination of fair value, for both financial and non-financial assets and liabilities. Fairvalues have been determined for measurement and disclosure purposes based on themethods described below.The following methods and assumptions are used to estimate the fair value of each classof financial instruments:Cash and Cash EquivalentsThe carrying amount approximates the fair value primarily due to the relatively shorttermmaturity of these financial instruments.Receivables/Due from a Related Party/Accounts Payable and Accrued ExpensesCurrent receivables are reported at their net realizable values, at total amounts lessallowances for impairment losses. Current liabilities are stated at amounts reasonablyexpected to be paid within the next twelve months or within the Company’s operatingcycle.AFS InvestmentsThe fair values of certain AFS investments, which are traded in active markets at thebalance sheet date, are determined by reference to their quoted market price at thereporting date. Other equity instruments classified as AFS are carried at cost due tounavailability of fair market value.HTM InvestmentsThe fair value of HTM investments that are not quoted in an active market is estimated asthe present value of future cash flows, discounted at the market rate of interest at thereporting date.Capital ManagementThe Company aims to provide returns on equity to shareholders while managingoperational and strategic objectives.The BOT has overall responsibility for monitoring of capital in proportion to risks. TheCompany manages its capital structure and makes adjustments to it, in the light ofchanges in economic conditions. To maintain or adjust capital structure, the Companymay adjust the dividend payment to shareholders, return capital to shareholders or issuenew shares.- 24 -
The Company defines capital as total equity, which is equivalent to the total of capitalstock, retained earnings and recognized income and expenses.The Company is not subject to any externally-imposed capital requirements.There was no change in the Company’s approach to capital management during the year.22. Contingent LiabilitiesThe Company is a defendant in certain civil cases which are pending in the local courtsand certain illegal dismissal cases pending before the National Labor RelationsCommission. As of March 31, 2008, the said cases have not yet been resolved.The Company’s management and its legal counsel believe that the liabilities, if any,which may result from the outcome of these cases, will not materially affect the financialposition and results of operations of the Company.- 25 -
COVER SHEETP W 5 3 8 - 0 0 0 0 0 0S.E.C. Registration NumberF A R E A S T E R N U N I V E R S I T Y , I N C .(Company's Full Name)N i c a n o r R e y e s , S r . S t .S a m p a l o c , M a n i l a(Business Address : No. Street Company / Town / Province)Ms. Fe V. Canilao 735-5621 up to 5630Contact PersonCompany Telephone Number0 3 3 1 A A F SMonth Day FORM TYPE Month DayAnnual MeetingSecondary License Type, If ApplicableDept. Requiring this Doc.Amended Articles Number/SectionTotal Amount of BorrowingsTotal No. of <strong>Stock</strong>holders Domestic ForeignTo be accomplished by <strong>SEC</strong> Personnel concernedFile NumberLCUDocument I.D.CashierS T A M P SRemarks = pls. use black ink for scanning purposes.
FAR EASTERN UNIVERSITY, INC.AND SUBSIDIARIESFINANCIAL STATEMENTSMarch 31, 2008, 2007 and 2006
FAR EASTERN UNIVERSITY, INC. AND SUBSIDIARIESCONSOLIDATED BALANCE SHEETSASSETSMarch 312007(As Restated -Note 2008 Note 23)Current AssetsCash and cash equivalents 4, 21 P1,265,6<strong>17</strong>,284 P975,579,341Available-for-sale investments 5, 21 840,687,402 826,047,042Receivables - net 6, 21 241,193,553 190,492,145Real estate held for sale 7 189,052,542 188,966,941Other current assets 22,283,556 8,921,048Total Current Assets 2,558,834,337 2,190,006,5<strong>17</strong>Noncurrent AssetsInvestment in an associate 8 7,105,379 7,130,111Investment property - net 9 465,389,297 383,728,654Property and equipment - net 10 559,332,698 542,900,236Held-to-maturity investments 21 32,071,040 30,468,630Other assets <strong>17</strong>,816,657 15,656,051Total Noncurrent Assets 1,081,715,071 979,883,682P3,640,549,408P3,169,890,199LIABILITIES AND EQUITYCurrent LiabilitiesAccounts payable and other current liabilities 11, 21 P447,636,280 P283,100,138Deferred income 24,287,583 7,564,710Income tax payable 54,676,608 43,377,163Current portion of obligation under finance lease 8, 21 1,895,782 1,753,954Total Current Liabilities 528,496,253 335,795,965Noncurrent LiabilitiesObligation under finance lease - net of currentportion 8, 21 - 1,895,782Trust funds 12 92,333,480 104,781,284Deferred tax liabilities - net <strong>17</strong> 760,368 2,639,656Total Noncurrent Liabilities 93,093,848 109,316,722Total Liabilities 621,590,101 445,112,687Forward
March 312007(As Restated -Note 2008 Note 23)EquityCapital stock P704,369,900 P704,369,900Net unrealized gain on available-for-saleinvestments 5 1,233,243 5,571,316Appropriated retained earnings 19 1,147,161,414 697,161,414Unappropriated retained earnings 23 873,954,674 1,038,547,972Treasury stock (3,733,100) (3,733,100)Total Equity Attributable to the EquityHolders of the Parent 2,722,986,131 2,441,9<strong>17</strong>,502Minority Interest 295,973,<strong>17</strong>6 282,860,010Total Equity 3,018,959,307 2,724,777,512P3,640,549,408P3,169,890,199See Notes to the Consolidated Financial Statements.
FAR EASTERN UNIVERSITY, INC. AND SUBSIDIARIESCONSOLIDATED STATEMENTS OF INCOMEYears Ended March 31Note 2008 2007 2006EDUCATIONAL INCOMETuition fees - net 13 P1,580,683,033 P1,565,968,902 P1,418,213,350Miscellaneous 33,146,510 30,085,666 22,065,4221,613,829,543 1,596,054,568 1,440,278,772OPERATING EXPENSES 15 1,065,891,820 1,030,215,222 913,221,476INCOME FROM OPERATIONS 547,937,723 565,839,346 527,057,296OTHER INCOMEInterest income 76,466,549 71,824,712 84,947,770Other finance income on availablefor-saleinvestments 5,106,956 7,803,472 -Rental 16 29,944,396 47,795,0<strong>17</strong> 38,068,867Miscellaneous 22,786,906 3,354,491 19,978,656134,304,807 130,777,692 142,995,293INCOME BEFORE SHARE INNET LOSSES OF ANASSOCIATE 682,242,530 696,6<strong>17</strong>,038 670,052,589SHARE IN NET LOSSES OFAN ASSOCIATE 8 (24,732) (36,104) (23,596)INCOME BEFORE INCOMETAX 682,2<strong>17</strong>,798 696,580,934 670,028,993INCOME TAX EXPENSE <strong>17</strong> 68,411,370 68,510,383 69,679,802NET INCOME P613,806,428 P628,070,551 P600,349,191Attributable to:Equity holders of the parent P600,693,262 P612,666,167 P581,947,210Minority interest 13,113,166 15,404,384 18,401,981NET INCOME P613,806,428 P628,070,551 P600,349,191EARNINGS PER SHAREBasic and diluted 20 P85.74 P104.94 P124.58See Notes to the Consolidated Financial Statements.
FAR EASTERN UNIVERSITY, INC. AND SUBSIDIARIESCONSOLIDATED STATEMENTS OF CHANGESIN EQUITYEQUITY ATTRIBUTABLE TOEQUITY HOLDERS OF THEPARENTYears Ended March 312007 2006(As Restated - (As Restated -Note 2008 Note 23) Note 23)CAPITAL STOCK - P100 par valueAuthorized - 10,000,000 sharesIssued - 7,043,699 shares in 2008and 2007 and 4,708,473 shares in2006 (of which 37,331 shares are intreasury)Balance at beginning of year P704,369,900 P470,847,300 P470,847,300Issuance during the year - 233,522,600 -Balance at end of year 704,369,900 704,369,900 470,847,300NET UNREALIZED GAIN(LOSS) ON AVAILABLE-FOR-SALE INVESTMENTSBalance at beginning of year 5,571,316 (5,401,450) -Net unrealized gain for the year 1,<strong>17</strong>6,093 5,404,436 -Cumulative net unrealized loss (gain)recognized in profit or loss duringthe year (5,514,166) 5,568,330 (5,401,450)Balance at end of year 5 1,233,243 5,571,316 (5,401,450)APPROPRIATED RETAINEDEARNINGSBalance at beginning of year 697,161,414 697,161,414 437,161,414Appropriations for:Expansion of facilities 400,000,000 - 240,000,000General retirement 50,000,000 - -Purchases of equipment andimprovements - - 20,000,000450,000,000 - 260,000,000Balance at end of year 19 1,147,161,414 697,161,414 697,161,414UNAPPROPRIATED RETAINEDEARNINGSBalance at beginning of year, aspreviously reported - - 621,253,854Prior period adjustment 23 - - 3,507,899Balance at beginning of year, asrestated 1,038,547,972 834,601,555 624,761,753Net income attributable to equityholders of parent during the year 600,693,262 612,666,167 581,947,210Forward
Years Ended March 312007 2006(As Restated - (As Restated -Note 2008 Note 23) Note 23)Appropriations for:Expansion of facilities (P400,000,000) P - (P240,000,000)General retirement (50,000,000) - -Purchases of equipment andimprovements - - (20,000,000)19 (450,000,000) - (260,000,000)DividendsCash dividends 18 (315,286,560) (<strong>17</strong>5,197,150) (112,107,408)<strong>Stock</strong> dividends 18 - (233,522,600) -(315,286,560) (408,719,750) (112,107,408)Balance at end of year 873,954,674 1,038,547,972 834,601,555TREASURY STOCK - at cost(37,331 shares) (3,733,100) (3,733,100) (3,733,100)2,722,986,131 2,441,9<strong>17</strong>,502 1,993,475,719MINORITY INTERESTBalance at beginning of year, aspreviously reported 282,860,010 267,455,626 243,011,044Prior period adjustment 23 - - 6,042,601Balance at end of year, as restated 282,860,010 267,455,626 249,053,645Equity earnings during the year 13,113,166 15,404,384 18,401,981Balance at end of year 295,973,<strong>17</strong>6 282,860,010 267,455,626P3,018,959,307 P2,724,777,512 P2,260,931,345See Notes to the Consolidated Financial Statements.
FAR EASTERN UNIVERSITY, INC. AND SUBSIDIARIESCONSOLIDATED STATEMENTS OF CASH FLOWSYears Ended March 312007 2006(As Restated - (As Restated -Note 2008 Note 23) Note 23)CASH FLOWS FROMOPERATING ACTIVITIESIncome before income tax P682,2<strong>17</strong>,798 P696,580,934 P670,028,993Adjustments for:Depreciation and amortization 10, 11 47,804,647 46,809,097 31,104,875Impairment losses on receivables 21 <strong>17</strong>,450,897 12,686,351 10,939,753Unrealized foreign exchange(gain) loss 4,747,861 3,703,946 (4,543,651)Share in net losses of an associate 8 24,732 36,104 23,596Interest income (76,466,549) (71,824,712) (84,947,770)Other finance income onavailable-for-sale investments (5,106,956) (7,803,472) -Loss (gain) on sale of real estateheld for sale (128,812) - -Gain on disposal of property andequipment - (102,083) (1,189,778)Impairment loss on real estate heldfor sale - (900,554) 11,034,<strong>17</strong>7Operating income before workingcapital changes 670,543,618 679,185,611 632,450,195Decrease (increase) in:Receivables (60,075,451) (9,565,102) (44,611,132)Real estate held for sale (103,574) (6,363,898) (141,681)Other current assets (13,362,508) 9,267,975 (9,399,324)Increase (decrease) in:Accounts payable and othercurrent liabilities 43,804,039 28,956,845 5,793,695Deferred income 16,722,873 (844,082) 54,640,934Obligation under finance lease (1,753,954) (1,333,557) (25,837,801)Cash generated from operations 655,775,043 699,303,792 612,894,886Interest received 68,389,695 73,565,<strong>17</strong>8 84,947,770Income taxes paid (58,991,213) (60,600,063) (58,600,254)Net cash provided by operating activities 665,<strong>17</strong>3,525 712,268,907 639,242,402CASH FLOWS FROMINVESTING ACTIVITIESIncrease in investment property 9 (96,147,971) (16,134,359) (10,205,328)Acquisitions of property andequipment 10 (49,602,996) (<strong>17</strong>,685,700) (189,621,582)Decrease (increase) in:Available-for-sale investments (13,871,477) (433,489,139) (6,987,514)Other assets (2,160,606) 14,464,962 26,164Held-to-maturity investments 257,510 (19,703,753) 424,074Advances to a related party - - 2,315,334Proceeds from disposal of propertyand equipment - <strong>17</strong>5,000 1,230,753Net cash used in investing activities (161,525,540) (472,372,989) (202,818,099)Forward
Years Ended March 312007 2006(As Restated - (As Restated -Note 2008 Note 23) Note 23)CASH FLOWS FROMFINANCING ACTIVITIESDividends paid (P194,554,457) (P<strong>17</strong>1,265,921) (P112,107,408)Increase in trust funds (12,447,804) 18,958,605 18,427,630Payment to a related party - - (20,000,000)Net cash used in financing activities (207,002,261) (152,307,316) (113,679,778)EFFECTS OF EXCHANGERATE CHANGES ON CASHAND CASH EQUIVALENTS (6,607,781) (3,703,946) 5,426,061NET INCREASE IN CASH ANDCASH EQUIVALENTS 290,037,943 83,884,656 328,<strong>17</strong>0,586CASH AND CASHEQUIVALENTS ATBEGINNING OF YEAR 975,579,341 891,694,685 563,524,099CASH AND CASHEQUIVALENTS ATEND OF YEAR 4 P1,265,6<strong>17</strong>,284 P975,579,341 P891,694,685See Notes to the Consolidated Financial Statements.
FAR EASTERN UNIVERSITY, INC. AND SUBSIDIARIESNOTES TO THE CONSOLIDATED FINANCIAL STATEMENTS1. Reporting Entity<strong>Far</strong> <strong>Eastern</strong> <strong>University</strong>, Inc. (“FEU” or the “Parent Company”) is a domestic educationalinstitution founded in June of 1928 and incorporated on January 5, 1933. The ParentCompany is a private, non-sectarian institution of learning comprising the followingdifferent institutes that offer specific courses, namely: Institute of Arts and Sciences;Institute of Accounts, Business and Finance; Institute of Education; Institute ofArchitecture and Fine Arts; Institute of Nursing; Institute of Engineering; Institute ofLaw; and Institute of Graduate Studies.All of the Parent Company’s shares of stock are listed and traded in the <strong>Philippine</strong> <strong>Stock</strong><strong>Exchange</strong>. The Parent Company became a listed corporation on July 11, 1986.The consolidated financial statements as at and for the year ended March 31, 2008comprise the accounts of the Parent Company and its Subsidiaries. The subsidiaries ofFEU are the following:a. East Asia Computer Center, Inc. (EACCI) is a domestic corporation incorporated onApril 27, 1992 with the primary purpose of providing and selling services for the useof computers and related paraphernalia and to engage in research and development inareas related to the above activities. EACCI also offers short term computer courses.b. Fern Realty Corporation (FRC) was incorporated and registered with the Securitiesand <strong>Exchange</strong> Commission on June 15, 1984. FRC is primarily engaged in real estateactivities, including sale and leasing of certain property.The registered offices of the Group are located at Nicanor Reyes Sr. St., Sampaloc,Manila.2. Basis of PreparationStatement of ComplianceThe consolidated financial statements have been prepared in accordance with <strong>Philippine</strong>Financial Reporting Standards (PFRS).The consolidated financial statements of <strong>Far</strong> <strong>Eastern</strong> <strong>University</strong> Inc. and its Subsidiariesas of and for the year ended March 31, 2008 were authorized for issue by the ParentCompany’s Chief Finance Officer, on behalf of the Board of Trustees, on July 14, 2008.Basis of MeasurementThe consolidated financial statements have been prepared on a historical cost basis,except for available-for-sale investments which are stated at fair value.Functional and Presentation CurrencyThe consolidated financial statements are presented in <strong>Philippine</strong> peso, which is also thefunctional currency of the entities within the Group.
Use of Estimates and JudgmentsThe preparation of consolidated financial statements in conformity with PFRS requiresmanagement to make judgments, estimates and assumptions that affect the application ofaccounting polices and amounts reported in the financial statements. The estimates andassumptions used in the consolidated financial statements are based upon management’sevaluation of relevant facts and circumstances as of the balance sheet date. Actual resultscould differ from such estimates.Estimates and underlying assumptions are reviewed on an ongoing basis and are based onhistorical experience and other factors, including expectations of future events that arebelieved to be reasonable under the circumstances. Revisions to accounting estimates arerecognized in the period in which the estimate is revised and in any future periodsaffected.The following presents the summary of these judgments and estimates, which have themost significant effect on the amounts recognized in the consolidated financialstatements:Functional CurrencyBased on the economic substance of the underlying circumstances relevant to the entitieswithin the Group, the functional currency has been determined to be the <strong>Philippine</strong> peso.It is the currency that mainly influences the normal operations of the entities within theGroup.Operating LeasesThe Group entered into lease agreements as lessor. The Group carries investmentproperty held to earn rentals. The Group has determined that it retains all significantrisks and rewards of ownership of these properties which are leased out under operatinglease agreements (see Note 16 for the related balances).Finance LeasesThe lease of a property, which transfers to the Group substantially all the risks andbenefits incidental to ownership of the property is classified as finance lease (see Note 10for the related balances).Estimating Allowance for Impairment Losses on ReceivablesThe Group maintains an allowance for impairment losses on receivables at a levelconsidered adequate to provide for probable uncollectible receivables. The level of thisallowance is evaluated by management on the basis of factors that affect the collectibilityof the accounts. These factors include, but are not limited to, history of the students’payment behavior, age of receivables and other external factors affecting the educationand real estate industry. The Group reviews the age and status of receivables, andidentifies accounts that are to be provided with an allowance on a continuous basis (seeNotes 5 and 21 for the related balances).Estimating Useful Lives of Investment Property and Property and EquipmentThe Group reviews annually the estimated useful lives of investment property andproperty and equipment based on the period over which the assets are expected to beavailable for use and are updated if expectations differ from previous estimates due tophysical wear and tear, technical or commercial obsolescence and legal or other limits onthe use of the assets. In addition, estimation of the useful lives of investment propertyand property and equipment is based on collective assessment of industry practice,internal technical evaluation and experience with similar assets. It is possible that futureresults of operations could be materially affected by changes in these estimates broughtabout by changes in the factors mentioned. A reduction in the estimated useful lives of- 2 -
property and equipment and investment property would increase the recordeddepreciation and amortization expenses and decrease noncurrent assets (see Notes 9and 10 for the related balances).Determining the Realizability of Deferred Tax AssetsThe Group reviews its deferred tax assets at each balance sheet date and reduces thecarrying amount to the extent that it is no longer probable that sufficient taxable profitwill be available to allow all or part of the deferred tax assets to be utilized. The Groupalso reviews the expected timing and tax rates upon reversal of temporary differences andadjusts the impact of deferred tax accordingly (see Note <strong>17</strong> for the related balances).Impairment of AssetsThe Group assesses impairment on assets whenever events or changes in circumstancesindicate that the carrying amount of an asset may not be recoverable. The factors that theGroup considers important which could trigger an impairment review include thefollowing:Significant underperformance relative to the expected historical or projectedfuture operating results;Significant changes in the manner of use of the acquired assets or the strategy foroverall business; andSignificant negative industry or economic trends.In determining the present value of estimated future cash flows expected to be generatedfrom the continued use of the assets, the Group is required to make estimates andassumptions that can materially affect the consolidated financial statements. Animpairment loss is recognized whenever the carrying amount of an asset exceeds itsrecoverable amount.ContingenciesThe Group is currently involved in certain legal proceedings. The estimate of theprobable costs for the resolution of these claims has been developed in consultation withoutside counsel handling the Group’s defense in these matters and is based upon ananalysis of potential results. The Group currently does not believe that these proceedingswill have a material adverse effect on its financial position (see Note 22).3. Significant Accounting PoliciesNew Standard, Amendment to Standard and Interpretation Adopted in 2008Effective April 1, 2007, the Group adopted the following new standard, amendment tostandard and interpretation:PFRS 7, Financial Instruments: Disclosures, which requires extensive disclosuresabout the significance of financial instruments for an entity’s financial position andperformance, and quantitative and qualitative disclosures on the nature and extent ofrisks. It replaces disclosure requirements in PAS 32, Financial Instruments:Disclosures and Presentation. It is applicable to all entities that report under PFRS.Additional disclosures required by this standard were included in the consolidatedfinancial statements.- 3 -
The Group availed of the transitional relief available under Amendment to PFRS 7with respect to the presentation of certain comparative information for the new riskdisclosures about the nature and extent of risks arising from financial instruments.Accordingly, the Group did not present comparative information for these riskdisclosures, unless the disclosure was previously required under PAS 32, FinancialInstruments: Disclosure and Presentation.Amendment to <strong>Philippine</strong> Accounting Standard (PAS) 1, Presentation of FinancialStatements - Capital Disclosures, which adds requirements to disclose the entity’sobjectives, policies and processes for managing capital, quantitative data about whatthe entity regards as capital; whether the entity has complied with any capitalrequirements; and if it has not complied, the consequences of such non-compliance.Additional disclosures required by this amendment were included in the consolidatedfinancial statements.<strong>Philippine</strong> Interpretation - International Financial Reporting InterpretationsCommittee (IFRIC) 10, Interim Financial Reporting and Impairment. Thisinterpretation prohibits the reversal of impairment losses on goodwill and availablefor-saleinvestments recognized in interim financial reports even if the impairment isno longer present at the balance sheet date. The adoption of this interpretation had nosignificant impact on the consolidated financial statements.Revised Standards Not Yet AdoptedThe following are the revised standards which are not yet effective for the year endedMarch 31, 2008, and have not been applied in preparing the consolidated financialstatements:Effective 2009:Revised PAS 1, Presentation of Financial Statements. The revised standard will beeffective for annual periods beginning on or after January 1, 2009. This revisedstandard introduces “total comprehensive income” (i.e., changes in equity during aperiod, other than those changes resulting from transactions with owners in theircapacity as owners), which is presented either in: (a) one statement (i.e., a statementof comprehensive income); or (b) two statements (i.e., an income statement and astatement beginning with profit or loss and displaying components of othercomprehensive income). Certain requirements are also required by revised PAS 1that are not required by the original standard. The requirements of Revised PAS 1will be included in the consolidated financial statements upon its adoption on April 1,2009.Revised PAS 23, Borrowing Costs. Revised PAS 23 will be effective for annualperiods beginning on or after January 1, 2009. This revised standard removes theoption to expense borrowing costs and requires that an entity to capitalize borrowingcosts directly attributable to the acquisition, construction or production of aqualifying asset as part of the cost of that asset. The adoption of the revised standardis not expected to have significant impact on the consolidated financial statements.- 4 -
Effective 2010:Revised PFRS 3, Business Combinations. The revised standard will be effective forannual periods beginning on or after July 1, 2009. The revised standard includes inits scope business combinations involving only mutual entities, and those in whichseparate entities or businesses are brought together to form a reporting entity bycontract alone. All business combinations are accounted for by applying theacquisition method (referred to previously as the purchase method). The adoption ofthis revised standard is not expected to have significant impact on the consolidatedfinancial statements.Amendments to PAS 27, Consolidated and Separate Financial Statements. Theseamendments will be effective for financial years beginning on or after July 1, 2009.These amendments mainly relate to changes in the accounting for non-controllinginterest and the loss of control of a subsidiary. These amendments to standard arenot expected to have significant impact on the consolidated financial statements.The following are the accounting policies which have been applied consistently in thepreparation of these consolidated financial statements.Basis of ConsolidationThe consolidated financial statements include the financial statements of the ParentCompany and the following subsidiaries:Name of SubsidiaryOwnership InterestEACCI 100.0%FRC 36.73%The financial statements of the subsidiaries are prepared for the same reporting years asthe Parent Company, using consistent accounting policies.Subsidiaries are entities controlled by the Group. Control exists when the Group has thepower, directly, or indirectly, to govern the financial and operating policies of an entityso as to obtain benefits from its activities. In assessing control, potential voting rights thatpresently are exercisable or convertible are taken into account. The financial statementsof the subsidiaries are included in the consolidated financial statements from the date thatcontrol commences until the date control ceases.Although the Parent Company controls less than 50% of the voting shares of stock ofFRC, it has the power to govern the financial and operating policies of the said entity.Also, the Parent Company has the power to cast the majority of votes at meetings of theboard of directors and elect officers of FRC. Accordingly, the consolidated financialstatements include the accounts of FRC.Associates are those entities in which the Group has significant influence, but not control,over the financial and operating policies. Significant influence is presumed to exist whenthe Group holds between 20 and 50 percent of the voting power of another entity.Associates are accounted for using the equity method and are initially recognized at cost.- 5 -
The consolidated financial statements include the Group’s share of the total recognizedearnings and losses of associates on an equity accounting basis, from the date thatsignificant influence commences until the date that significant influence ceases. Whenthe Group’s share of losses exceeds its interest in an associate, the carrying amount ofthat interest is reduced to nil and recognition of further losses is discontinued except tothe extent that the Group has incurred legal or constructive obligations or made paymentson behalf of the associate.Intra-group balances and any unrealized gains and losses or income and expenses arisingfrom intra-group transactions are eliminated in preparing the consolidated financialstatements. Unrealized gains arising from transactions with associates are eliminated tothe extent of the Group’s interest in the entity. Unrealized losses are eliminated in thesame way as unrealized gains, but only to the extent that there is no evidence ofimpairment.Minority interest represent the interest not held by the Group in FRC and EACCI.Revenue RecognitionRevenue is recognized to the extent that it is probable that the economic benefits willflow to the Group and the revenue can be reliably measured. The following specificrecognition criteria must also be met before revenue is recognized:Tuition and Other FeesTuition and other fees are recognized as income over the corresponding school term.InterestInterest income is recognized as the interest accrues.RentalRent income from operating lease of investment property is recognized in theconsolidated statements of income over the term of the lease using the straight-linemethod.Sale of Real EstateRevenue from sale of real estate where the Group has no obligation to complete thedevelopment of the property and where collectibility of the sales price is reasonablyassured is accounted for using the full accrual method.Revenue from sale of real estate where the Group has material obligations to completethe development of the property is accounted for using the percentage of completionmethod. Under this method, the gross profit from sale is recognized as the relatedobligation is fulfilled. Unrealized gross profit from sale of real estate is deferred andshown under Deferred Income in the consolidated balance sheets.Cost of real estate sold before the completion of the development is determined on thebasis of the acquisition cost of the land plus its full estimated development costs, asdetermined by the construction manager. These estimates are reviewed periodically totake into consideration the changes in scope of development and cost estimates includingthe effects of changes in foreign exchange and interest rates.Financial instrumentsNonderivative financial instruments comprise cash and cash equivalents, receivables,available-for-sale (AFS) investments, held-to-maturity (HTM) investments and accountspayable and other liabilities and finance lease obligation.- 6 -
Nonderivative financial instruments are recognized initially at fair value plus, forinstruments not at fair value through profit or loss, any directly attributable transactioncosts. Subsequent to initial recognition, nonderivative financial instruments are measuredas described below.A financial instrument is recognized if the Group becomes a party to the contractualprovisions of the instrument. Financial assets are derecognized when the Group’scontractual rights to the cash flows from the financial assets expire or when the Grouptransfers the financial asset to another party without retaining control or substantially allrisks and rewards of the asset. Regular way purchases and sales of financial assets areaccounted for at trade date, i.e. the date that the Group commits itself to purchase or sellthe asset. Financial liabilities are derecognized if the Group’s obligations specified in thecontract expire or are discharged or cancelled.Cash and Cash EquivalentsCash includes cash on hand and in banks and is stated at its face value. Cash equivalentsare short-term, highly liquid investments that are readily convertible to known amountsof cash with original maturities of three months or less from the dates of acquisition andare subject to an insignificant risk of change in value.ReceivablesReceivables, which include receivables from students, receivables from real estate buyersand other receivables, are non-derivative financial assets with determinable paymentsthat are not quoted in an active market and for which the Group has no intention oftrading. They are stated at amortized cost and reduced by an allowance for impairmentlosses, if any. An allowance for impairment losses on receivables is maintained at a levelconsidered adequate to provide for probable uncollectible receivables. The level ofallowance for impairment losses on receivables is evaluated by management on the basisof factors affecting the collectibility of the receivables.AFS InvestmentsAFS investments are non-derivative investments that are designated in this category orare not classified in any other category of financial assets. Financial assets are classifiedas AFS when purchased and held indefinitely, but which the Group anticipates to sell inresponse to liquidity requirements or in anticipation of changes in market rates or otherfactors. AFS investments are initially measured at fair value plus incremental directtransaction costs and subsequently carried at fair value. Unquoted equity securities whosefair value cannot be reliably measured are carried at cost.Realized gains or losses on AFS investments are included in “Interest Income” and“Other Finance Income on AFS Investments” in the consolidated statements of income.Unrealized gains or losses arising from marking-to-fair value of AFS investments arereported as “Net Unrealized Gain or Loss on AFS Investments” in the consolidatedstatements of changes in equity, until such financial asset is derecognized or impaired atwhich time the cumulative gains or losses previously recognized in equity should berecognized in the consolidated statements of income.HTM InvestmentsHTM investments are debt securities which the Group has the positive intent and abilityto hold to maturity. These investments are initially measured at fair value plusincremental direct transaction costs and subsequently carried at cost, adjusted foramortization of premiums and accretion of discounts using the effective interest methodand reduced by impairment losses, if any.- 7 -
Other Financial InstrumentsOther non-derivative financial instruments such as accounts payable and other liabilitiesand finance lease obligation are recognized initially at fair value and subsequentlymeasured at amortized cost using the effective interest method, less any impairmentlosses.Investment in an AssociateInvestment in an associate where the Parent Company exercises significant influence isaccounted for under the equity method. Under the equity method, the cost of theinvestment is increased or decreased by the Parent Company’s share in the net earningsor losses of the associate since the date of acquisition. Dividends declared by theassociate are treated as a reduction in the carrying value of the investment.Real Estate Held for SaleReal estate for held sale is carried at cost which is not in excess of estimated netrealizable value. Cost includes acquisition cost of land plus development costs.Real estate held for sale is expected to be sold within 2 to 10 years from the time ofacquisition, which is considered the normal operating cycle of the Group.Investment PropertyInvestment property consists of land and building and improvements thereon, which areheld either to earn rental income or for capital appreciation or for both.The Group uses the cost model to account for its investment property. An item ofinvestment property, except land, is carried at cost less accumulated depreciation,amortization and impairment losses, if any.Investment property is derecognized when it has either been disposed of or permanentlywithdrawn from use and no future benefit is expected from its disposals. Any gain orloss on derecognition of investment property is recognized in the consolidated statementsof income in the year of derecognition.Transfers are made to investment property when, and only when, there is a change in use,evidenced by the end of owner-occupation, commencement of an operating lease toanother party or by the end of construction or development.Depreciation and amortization are computed using the straight-line method over theestimated useful lives of the assets as follows:Number of YearsBuilding and improvements 20 - 50Land improvements 5Property and EquipmentProperty and equipment, except land, are carried at cost less accumulated depreciation,amortization and impairment losses, if any. Land is stated at cost less any impairment invalue.- 8 -
Initially, an item of property and equipment is measured at its cost, which comprises itspurchase price and any directly attributable cost of bringing the asset to the location andcondition for its intended use. Subsequent costs that can be measured reliably are addedto the carrying amount of the asset when it is probable that future economic benefitsassociated with the asset will flow to the Group. The costs of day-to-day servicing of anasset are recognized as expenses in the year in which they are incurred.Construction in progress represents a building under construction and is stated at cost.This includes costs of construction and other direct costs. Construction in progress is notdepreciated until such time the relevant assets are completed and available for operationaluse.Depreciation is recognized in the consolidated statements of income on a straight-linebasis over the estimated useful lives of the assets. Leasehold improvements areamortized on a straight-line basis over the estimated useful life of the improvements orthe term of the lease, whichever is shorter. Land and construction in progress are notdepreciated. The estimated useful lives are as follows:Number of YearsBuildings and improvements 20Leasehold improvements 20Furniture and equipment 4 - 6Miscellaneous equipment 5The useful lives and depreciation and amortization method are reviewed at each balancesheet date to ensure that they are consistent with the expected pattern of economicbenefits from those assets.When an asset is disposed of, or is permanently withdrawn from use and no futureeconomic benefits are expected from its disposal, the cost and accumulated depreciation,amortization and impairment losses, if any, are removed from the accounts and anyresulting gain or loss arising from the retirement or disposal is recognized in theconsolidated statements of income.Impairment of AssetsFinancial AssetsA financial asset is considered to be impaired if objective evidence indicates that one ormore events have had a negative effect on the estimated future cash flows of that asset.An impairment loss in respect of a financial asset measured at amortized cost iscalculated as the difference between its carrying amount, and the present value of theestimated future cash flows discounted at the original effective interest rate.Significant financial assets are tested for impairment on an individual basis. Theremaining financial assets are assessed collectively in groups that share similar credit riskcharacteristics.All impairment losses are recognized in the consolidated statements of income.- 9 -
Non-financial AssetsNon-financial assets are reviewed for impairment whenever events or changes incircumstances indicate that the carrying amount of an asset may not be recoverable. Ifany such indication exists and where the carrying amount of an asset exceeds itsrecoverable amount, the asset or cash-generating unit is written down to its recoverableamount. The estimated recoverable amount is the higher of an asset’s fair value lesscosts to sell and value in use. The fair value less costs to sell is the amount obtainablefrom the sale of an asset in an arm’s length transaction less the costs of disposal whilevalue in use is the present value of estimated future cash flows expected to arise from thecontinuing use of an asset and from its disposal at the end of its useful life. In assessingvalue in use, the estimated future cash flows are discounted to their present value using apre-tax discount rate that reflects current market assessments of time value of money andthe risks specific to the asset. For an asset that does not generate largely independentcash inflows, the recoverable amount is determined for the cash-generating unit to whichthe asset belongs. Impairment losses are recognized in the consolidated statements ofincome.Recovery of impairment losses recognized in prior years is recorded when there is anindication that the impairment losses recognized for the asset no longer exist or havedecreased. The recovery is recognized in the consolidated statements of income.However, the increase in carrying amount of an asset due to a recovery of an impairmentloss is recognized to the extent that it does not exceed the carrying amount that wouldhave been determined (net of depreciation and amortization) had no impairment loss beenrecognized for that asset in prior years.Restricted FundsThe Group uses the fund accounting method for funds held for specific purposes. Receiptand disbursement transactions of the funds are accounted for separately and consumptionof the fund’s assets is restricted.Retirement PlanThe Group has a contributory and defined contribution type of retirement benefit plan.Under this plan, the amount of a member's future benefits is determined by thecontributions paid by both the Group and the member and the operating efficiency andinvestment earnings of the fund.Operating LeaseLeases in which a significant portion of the risks and rewards of ownership is retained bythe lessor are classified as operating leases. Revenues from operating leases arerecognized in the consolidated statements of income on a straight-line basis over the termof the lease.Finance Income and ExpensesFinance income comprises of interest income on bank deposits, cash equivalents, AFSinvestments and HTM investments, foreign currency gains and other income on AFSinvestments. Interest income is recognized in the consolidated statements of income as itaccrues, using the effective interest rate method. All other finance income are recognizedin the consolidated statements of income as they accrue.Finance expenses comprise bank charges, interest expenses on obligations under financelease and foreign currency losses. All finance expenses are recognized in theconsolidated statements of income as they accrue.- 10 -
Income TaxesIncome tax expense for the year comprises of current and deferred tax. Income taxexpense is recognized in the consolidated statements of income except to the extent that itrelates to items recognized directly in equity, in which case it is recognized in equity.Current TaxCurrent tax assets and liabilities for the current and prior periods are measured at theamount expected to be recovered from or paid to the tax authority. The tax rates and taxlaws used to compute the current tax are those that are enacted or substantively enactedas of the balance sheet date.Deferred TaxDeferred tax is provided using the liability method. Deferred tax assets and liabilities arerecognized for the future tax consequences attributable to temporary difference betweenthe carrying amounts of assets and liabilities for financial reporting purposes andamounts used for taxation on purposes and carryforward benefits of unused tax creditsfrom excess minimum corporate income tax (MCIT) over regular income tax and the netoperating loss carryover (NOLCO). The amount of deferred tax provided is based on theexpected manner of realization or settlement of the carrying amount of assets andliabilities, carryforward benefits of MCIT and NOLCO, using the tax rates enacted orsubstantively enacted as of the balance sheet date. A deferred tax asset is recognizedonly to the extent that it is probable that future taxable profits will be available againstwhich the deductible temporary differences and carryforward benefits of MCIT andNOLCO can be utilized. Deferred tax assets are reviewed at each balance sheet date andare reduced to the extent that it is no longer probable that the related tax benefit will berealized.Provisions and Contingent LiabilitiesA provision is a liability of uncertain timing or amount. It is recognized when the Grouphas a legal or constructive obligation as a result of a past event; it is probable that anoutflow of economic benefits will be required to settle the obligation and a reliableestimate can be made.When it is not possible that an outflow of economic benefits will be required, or theamount cannot be estimated reliably, the obligation is disclosed as a contingent liability,unless the probability of outflow of economic benefits is remote. Possible obligations,those existences will only be confirmed by the occurrence or non-occurrence of one ormore future events are also disclosed as contingent liabilities unless the probability ofoutflow of economic benefits is remote.Earnings per ShareBasic earnings per share is computed by dividing net income for the year by the weightedaverage number of outstanding common stock during the year while diluted earnings pershare is computed by dividing net income by the weighted average number ofoutstanding common stock after adjusting the effect to both numbers of potential dilutivecommon stock.Foreign Currency TransactionsTransactions in foreign currencies are recorded in <strong>Philippine</strong> peso based on the exchangerates prevailing at the transaction dates. Foreign currency denominated monetary assetsand liabilities are translated into <strong>Philippine</strong> peso using the rates of exchange prevailing atbalance sheet date. <strong>Exchange</strong> gains or losses arising from translation of foreign currencydenominated items at rates different from those at which they were previously recordedare recognized in the consolidated statements of income.- 11 -
Segment ReportingA segment is a distinguishable component of the Group that is engaged either inproviding related products or services (business segment), or in providing products orservices within a particular economic environment (geographical segment), which issubject to risks and returns that are different from those of other segments. The Group’soperating business is organized and managed according to the nature of the products andservices provided, with each segment representing a strategic business unit that offersdifferent products and serves different markets. For purposes of financial reporting, theGroup has only one reportable business segment, which is to offer educational services.Events After the Balance Sheet DatePost year-end events that provide additional information about the Group’s position atthe balance sheet date (adjusting events) are recognized in the consolidated financialstatements. Post year-end events that are not adjusting events are disclosed in the notes tothe consolidated financial statements when material.4. Cash and Cash EquivalentsThis account at March 31 consists of:2008 2007Cash on hand and in banks P186,371,378 P124,616,103Short-term deposits 1,079,245,906 850,963,238P1,265,6<strong>17</strong>,284P975,579,341Cash in banks earn interest at the prevailing bank deposit rates. Short-term depositsrepresent time deposits with local banks which are pre-terminable. These placements bearannual interest ranging from 3.75% to 5.25% in 2008 and 3.50% to 6.00% in 2007 forpeso placements and 2.25% to 2.5% in 2008 and 3.62% to 4.00% in 2007 for dollarplacements.Certain portions of cash and cash equivalents are restricted to fund activities for specificeducational purposes (see Note 12).5. Available-for-Sale InvestmentsThis account at March 31 consists of:2008 2007Government securities P466,818,731 P510,750,726Trust fund 372,635,428 309,725,000839,454,159 820,475,726Add net unrealized gain on AFS investments 1,233,243 5,571,316P840,687,402P826,047,042Certain AFS investments reached their maturity during the years ended March 31, 2008and 2007 and were converted into cash and cash equivalents, which resulted torecognition of cumulative gain of P5,514,166 in 2008 and cumulative loss of P5,568,330in 2007, previously recognized in equity, in the consolidated statements of income.The Group’s exposures to credit and market risks are disclosed in Note 21.- 12 -
6. ReceivablesThis account consists of:2008 2007Tuition and other fee receivables P81,923,719 P57,582,620Accrued interest receivable 45,115,256 45,388,638Advances to suppliers 36,121,662 21,814,381Rent receivable 34,621,963 23,943,497Receivable from FEU EducationalFoundation, Inc. 28,843,710 30,046,651Receivable from East Asia EducationalFoundation (EAEF) 14,116,055 4,638,949Advances to employees 9,145,859 9,548,058Receivable from real estate buyers 2,136,188 6,9<strong>17</strong>,712Others 1,041,474 2,048,140253,065,886 201,928,646Less allowance for impairment losses ontuition and other fee receivables 11,872,333 11,436,501Receivable from real estate buyers represent the following:P241,193,553P190,492,145a. Receivable from real estate buyers whose down payment exceed 25% of the totalselling price and are collectible within 2 years; andb. Installment contracts receivable from real estate buyers whose down paymentsdo not exceed 25% of the total selling price and are collectible over an extendedperiod of time ranging from 5 to 10 years.No allowance for impairment losses on all other receivables were provided as ofMarch 31, 2008 and 2007 since management believes that these are collectible.The Group’s exposure to credit risk is disclosed in Note 21.7. Real Estate Held for SaleReal estate held for sale at March 31 represents certain lots as follows:2008 2007Silang, Cavite P163,587,573 P163,501,972Ferndale Homes, Quezon City 25,464,969 25,464,969P189,052,542P188,966,941- 13 -
8. Investment in an AssociateThis consists of the investment in Juliana Management Co., Inc., (JMCI), an entityincorporated in the <strong>Philippine</strong>s, which is 49% owned by the Parent Company:2008 2007Cost P7,878,121 P7,878,121Add accumulated share in net losses:Balance at beginning of year (748,010) (711,906)Share in net losses during the year (24,732) (36,104)Balance at end of year (772,742) (748,010)P7,105,379P7,130,111JMCI’s summary of the financial information as of December 31, 2007 and 2006follows:2007 2006Total assets P14,826,831 P14,749,245Total liabilities 326,060 198,000Total stockholders’ equity 14,500,771 14,551,245Net loss 50,474 73,6829. Investment PropertyThe movements in this account are as follows:LandLandImprovementsBuilding andImprovementsTotalGross carrying amount:April 1, 2006 P89,323,571 P2,103,690 P313,870,916 P405,298,<strong>17</strong>7Additions 16,120,559 13,800 - 16,134,359Transfer from real estate held forsale 31,980,960 - - 31,980,960March 31, 2007 137,425,090 2,1<strong>17</strong>,490 313,870,916 453,413,496Additions 34,089,226 458,283 61,600,462 96,147,971Transfer from real estate held forsale - 146,785 - 146,785March 31, 2008 <strong>17</strong>1,514,316 2,722,558 375,471,378 549,708,252Accumulated depreciation andamortization:April 1, 2006 - 597,413 56,337,216 56,934,629Depreciation and amortization forthe year - 423,498 12,326,715 12,750,213March 31, 2007 - 1,020,911 68,663,931 69,684,842Depreciation and amortization forthe year - 446,939 14,187,<strong>17</strong>4 14,634,113March 31, 2008 - 1,467,850 82,851,105 83,318,955Carrying amount:March 31, 2007 P137,425,090 P1,096,579 P245,206,985 P383,728,654March 31, 2008 P<strong>17</strong>1,514,316 P1,254,708 P292,620,273 P465,389,297The fair value of investment property amounted to P2,238,066,347. This was determinedbased on the most recent valuation performed by independent appraisers in 2003.- 14 -
10. Property and EquipmentThe movements in this account are as follows:Land andBuildings andImprovementsFurnitureandEquipmentLeasehold MiscellaneousImprovements EquipmentConstructionin ProgressGross carrying amount:April 1, 2006 P538,412,933 P79,063,501 P49,301,578 P11,943,025 P8,434,363 P687,155,400Additions 6,681,129 10,856,598 - 147,973 - <strong>17</strong>,685,700Disposals/write-offs - (500,000) - - - (500,000)Reclassifications (15,000,000) - - - - (15,000,000)March 31, 2007 530,094,062 89,420,099 49,301,578 12,090,998 8,434,363 689,341,100Additions 29,121,955 18,160,829 369,348 318,151 1,632,713 49,602,996March 31, 2008 559,216,0<strong>17</strong> 107,580,928 49,670,926 12,409,149 10,067,076 738,944,096Accumulated depreciationand amortization:April 1, 2006 37,262,186 56,709,418 7,395,237 11,442,222 - 112,809,063Depreciation andamortization for theyear 20,659,963 10,832,208 2,465,079 101,634 - 34,058,884Disposals/write-offs - (427,083) - - - (427,083)March 31, 2007 57,922,149 67,114,543 9,860,316 11,543,856 - 146,440,864Depreciation andamortization for theyear 20,399,<strong>17</strong>1 10,190,889 2,465,079 115,395 - 33,<strong>17</strong>0,534March 31, 2008 78,321,320 77,305,432 12,325,395 11,659,251 - <strong>17</strong>9,611,398Carrying amount:March 31, 2007 P472,<strong>17</strong>1,913 P22,305,556 P39,441,262 P547,142 P8,434,363 P542,900,236March 31, 2008 P480,894,697 P30,275,496 P37,245,531 P749,898 P10,067,076 P559,332,698TotalOn October 18, 2005, the Group entered into a finance lease agreement with Ayala Land,Inc. covering the lease of one condominium unit under development. This leaseagreement required for a 30% downpayment and minimum lease payment of P165,968payable in monthly installments and will mature at various dates up toDecember 18, 2008. As of March 31, 2008 and 2007, the net carrying amount of theleased property recognized in the consolidated balance sheets amounted to P9,084,363and P8,434,363, respectively.As of March 31, 2008, the minimum lease payments under finance lease are as follows:FutureMinimumLeasePaymentsInterestPresentValue ofMinimumLeasePaymentsFutureMinimumLeasePaymentsInterest2008 2007PresentValue ofMinimumLeasePaymentsLess than one year P1,976,419 P80,637 P1,895,782 P1,991,622 P237,668 P1,753,954Between one and five years - - - 1,976,419 80,637 1,895,782P1,976,419 P80,637 P1,895,782 P3,968,041 P318,305 P3,649,73611. Accounts Payable and Other Current Liabilities- 15 -
This account at March 31 consists of:2008 2007Accounts payable and accrued expenses P169,824,462 P167,884,609Accrued retirement 7,099,700 6,614,691Deposits payable 30,097,347 1,326,485Dividends payable 139,805,663 19,073,560Withholding and other taxes payable 16,930,469 30,079,185Funds payable 34,909,377 25,114,815Salaries and benefits 41,243,336 27,323,747Other current liabilities 7,725,926 5,683,046P447,636,280The Company’s exposure to liquidity risk is disclosed in Note 21.P283,100,13812. Trust FundsThis account at March 31 consists of:2008 2007Student welfare and development fund P40,693,748 P40,693,748Visual aid development fund 26,331,899 23,686,114FEU Central Student Organization:Student loan fund 10,502,842 8,354,034Student scholarship fund 3,919,602 3,792,576Student assistance fund 2,653,039 3,011,565Others 8,232,350 25,243,247P92,333,480P104,781,284These trust funds represent collections to defray expenses related to activities for specificeducational purposes wherein cash equivalent to the outstanding balances of these fundsare restricted from use for other purposes (see Note 4).13. Tuition FeesThis account consists of:2008 2007 2006Tuition and other feesP1,655,826,499 P1,636,730,534 P1,475,070,326Less: Scholarship discounts (57,508,745) (52,764,930) (40,892,082)Cash discounts (10,038,965) (9,804,230) (9,312,478)Family discounts (7,595,756) (8,192,472) (6,652,416)P1,580,683,033 P1,565,968,902 P1,418,213,350- 16 -
14. Employees’ Health, Welfare and Retirement FundThe Parent Company maintains a funded and contributory retirement plan, which is adefined contribution type of retirement plan since 1967, covering regular teaching andnon-teaching personnel members.Contributions to this fund are in accordance with the defined contribution established bythe Retirement Board which is the sum of the employees’ and the Parent Company’scontributions. Employees’ contribution is 5.00% of basic salary while the ParentCompany’s contribution is equivalent to 20.00% of the employees’ basic salary.Retirement expense recognized in the consolidated statements of income amounted toP63,446,825 in 2008, P48,976,768 in 2007 and P48,649,476 in 2006.The retirement fund is under the administration of an organization, FEU Health, Welfareand Retirement Fund through its Retirement Board.The Fund’s balance sheets as of December 31, 2007 and 2006 showed the following:2007 2006AssetsMoney market placements P555,853,116 P469,330,668Receivables 40,186,159 39,495,746Cash in banks 4,628,136 5,121,742Others 208,505 157,398600,875,916 514,105,554Liabilities 49,871,692 45,330,630P551,004,224P468,774,92415. Operating ExpensesThis account consists of:Note 2008 2007 2006Instructional and AcademicSalaries and allowances P495,587,597 P468,906,339 P298,970,355Employees benefits 14 150,395,234 135,098,784 231,109,260Related Learning Experience 19,474,376 - -Affiliation 11,418,035 - -Others <strong>17</strong>,370,504 46,134,305 37,148,599694,245,746 650,139,428 567,228,214AdministrativeSalaries and allowances 80,599,603 72,263,545 64,152,937Employees benefits 14 36,165,361 3,148,756 5,137,556Professional Fees 3,697,241 - -Rental - 35,<strong>17</strong>5,975 58,596,699Others 28,991,792 20,832,<strong>17</strong>3 25,132,920Forward149,453,997 131,420,449 153,020,112- <strong>17</strong> -
Note 2008 2007 2006Maintenance and OperationsUtilities P61,619,734 P68,929,086 P61,921,693Salaries and allowances 24,196,975 23,049,555 8,734,742Employees benefits 14 11,772,106 10,492,989 9,858,257Janitorial services 11,707,163 13,052,135 10,506,279Repairs and maintenance 8,071,553 30,328,725 5,416,999Property insurance 564,594 1,487,187 649,5211<strong>17</strong>,932,125 147,339,677 97,087,491GeneralDepreciation and amortization 9, 10 47,804,647 46,809,097 31,104,875Security services 18,314,315 15,323,818 14,185,307Impairment losses onreceivables 21 <strong>17</strong>,450,897 12,686,351 10,939,753Publicity and promotions 8,033,477 4,966,479 3,886,531Taxes and licenses 4,262,383 3,968,750 3,690,522Donation and charitablecontributions 1,471,938 1,672,229 18,269,906Others 6,922,295 13,005,612 13,808,765104,259,952 98,432,336 95,885,659Marketing and Selling - 2,883,332 -P1,065,891,820 P1,030,215,222 P913,221,476Total remunerations of the Group’s key management personnel presented under the“Salaries, Allowances and Benefits” account is as follows:2008 2007Short-term benefits P100,412,356 P105,<strong>17</strong>6,843Post-employment benefits 16,321,494 13,592,380P116,733,850P118,769,22316. Operating LeasesThe Group leases out certain land and buildings to several parties for a period of one (1)to ten (10) years.Total rent income recognized in the consolidated statements of income amounted toP29,944,396 in 2008, P47,795,0<strong>17</strong> in 2007 and P38,068,867 in 2006.The remaining future minimum rent receivables are as follows:2008 2007Less than one year P37,144,829 P37,239,314Between one and five years 137,677,280 137,828,526More than five years 1,120,000 -P<strong>17</strong>5,942,109P<strong>17</strong>5,067,840- 18 -
<strong>17</strong>. Income TaxesThe components of the Group’s income tax expense are as follows:2008 2007 2006Current tax expense P70,290,658 P65,352,449 P67,497,579Deferred tax expense (benefit)arising from origination andreversal of temporarydifferences (1,879,288) 3,157,934 2,182,223P68,411,370 P68,510,383 P69,679,802Net deferred tax liabilities are attributable to the following:2008 2007Deferred income P4,286,924 P -Impairment losses on receivables 1,187,233 1,143,650NOLCO 163,<strong>17</strong>6 113,033MCIT 2,115 2,115Accrued expenses - net (6,874,602) (4,268,849)Others 474,786 370,395(P760,368)(P2,639,656)The reconciliation of the income tax expense computed at applicable statutory income taxrates to the income tax expense shown in the consolidated statements of income follows:2008 2007 2006Income before income tax P682,2<strong>17</strong>,798 P696,580,934 P670,028,993Applicable income tax rates P76,395,851 P78,740,714 P76,788,523Additions to (reductions in)income tax resulting from thetax effects of:Nondeductible interest expenses 1,346,892 874,139 721,025Nondeductible tax amnestypayment <strong>17</strong>5,000 - -Interest income subjected tofinal tax (9,526,036) (11,015,760) (9,641,451)Impairment losses oninvestments - - 233,893Provision for probable losses - - 1,103,4<strong>17</strong>Change in tax rate - - 194,592Others 19,663 (88,710) 279,803P68,411,370 P68,510,383 P69,679,802The Group availed the Tax Incentives Provisions of Republic Act (R.A.) No. 8525,Adopt-a-School Act of 1998. The amount of contribution/donation that were actually,directly and exclusively incurred for the Adopt-a-School Program, with limitations,conditions and rules set forth in Section 34 (H) of the Tax Code, is subject to anadditional amount equivalent to fifty percent (50%).- 19 -
On October 10, 2007, the BIR issued Revenue Regulation No. 12-2007, which amendedthe timing of the calculation and payment of minimum corporate income tax (MCIT)from an annual basis to a quarterly basis, i.e., excess MCIT from a previous quarterduring the current taxable year may be applied against subsequent quarterly or currentannual income tax due, whether MCIT or regular corporate income tax (RCIT).However, excess MCIT from the previous taxable year/s are not creditable against MCITdue for a subsequent quarter and are only creditable against quarterly and annual RCIT.On May 24, 2005, Republic Act No. 9337 entitled “An Act Amending the NationalInternal Revenue Code, as Amended, with Salient Features” (the “Act”) was passed intoa law effective November 1, 2005. Among others, the Act provides for the increase inunallowable interest rate from 38% to 42% with a reduction thereof to 33% beginning onJanuary 1, 2009.18. Dividend DeclarationsThe Board of Trustees approved the following dividend declarations in 2008, 2007 and2006, respectively:Date of Declaration Date of Record Date of Payment Amount2008Cash dividend ofP15.00 per share June 26, 2007 July 11, 2007 July 23, 2007 P105,095,520Cash dividend ofP15.00 per share December 18, 2007 January 7, 2008 January <strong>17</strong>, 2008 105,095,520Cash dividend ofP15.00 per share March 25, 2008 April 10, 2008 April 24, 2008 105,095,520P315,286,5602007Cash dividend ofP15.00 per share June 20, 2006 July <strong>17</strong>, 2006 July <strong>17</strong>, 2006 P70,067,13050% <strong>Stock</strong> dividendequivalent to2,335,226 shares March 21, 2006 September 6, 2006 October 2, 2006 233,522,600345 fractional sharespaid out in cash atP100.00 per share March 21, 2006 September 6, 2006 October 2, 2006 34,500Cash dividend ofP15.00 per share December 19, 2006 January 5, 2007 January 15, 2007 105,095,520P408,719,7502006Cash dividend ofP12.00 per share June 21, 2005 July 08, 2005 July 18, 2005 P56,053,704Cash dividend ofP12.00 per share December 13, 2005 January 10, 2006 January 20, 2006 56,053,704P112,107,408- 20 -
19. Appropriated Retained EarningsThis account consists of:2008 2007 2006Appropriations for:Expansion of facilities P1,010,000,000 P610,000,000 P610,000,000Purchases of equipment andimprovements 30,000,000 30,000,000 30,000,000Contingencies 20,161,414 20,161,414 20,161,414Acquisition of laboratoryequipment 20,000,000 20,000,000 20,000,000Repairs and improvements 10,000,000 10,000,000 10,000,000General retirement 57,000,000 7,000,000 7,000,000P1,147,161,414 P697,161,414 P697,161,414The Board of Trustees approved the following appropriations:a. On July 19, 2005, P200 million for school facilities expansions;b. On March 21, 2006, additional P40 million and P20 million for school facilitiesexpansions and purchase of equipment, respectively;c. On June 26, 2007, P100 million and P50 million for improvement of facilitiesand general retirement, respectively; andd. On March 25, 2008, additional P300 million for school expansion.20. Earnings Per ShareBasic and diluted earnings per share are computed as follows:2008 2007 2006Outstanding number of shares -net of treasury stock of 37,331shares 7,005,738 7,006,388 4,671,142Net income for the year P600,693,262 P612,666,167 P581,947,210Divided by average outstandingshares 7,005,738 5,838,440 4,671,142P85.74 P104.94 P124.58- 21 -
21. Financial Risk ManagementThe Group has exposure to the following risks from its use of financial instruments:1. Credit risk2. Liquidity risk3. Market riskThis note presents information about the Group’s exposure to each of the above risks, theGroup’s objectives, policies and processes for measuring and managing risk, and theGroup’s management of capital.The main purpose of the Group’s dealings in financial instruments is to fund itsoperational and capital expenditures. The Board of Trustees (BOT) has overallresponsibility for the establishment and oversight of the Group’s risk managementframework. The BOT has delegated to the senior management the responsibility fordeveloping and monitoring the Group’s policies, which address risk management areas.Management is responsible for monitoring compliance with the Group’s riskmanagement policies and procedures and for reviewing the adequacy of these policies inrelation to the risks faced by the Group.1. Credit RiskCredit risk represents the loss the Group would incur if counterparty failed toperform under its contractual obligations. The Group’s exposure to credit risk on itsreceivables relates primarily to the inability of the debtors and students to pay andfully settle the unpaid balance of tuition fees and other charges, respectively, whichare owed to the Group based on the installment payment schemes. The Group hasestablished controls and procedures in its credit policy to determine and to monitorthe credit worthiness of the students and other debtors based on relevant factors.Also, students are not allowed to enroll in the following semester unless the unpaidbalance in the previous semester has been paid. The Group also withholds theacademic records and clearance of the students with unpaid balance, thus ensuringthat collectibility is reasonably assured. The Group’s exposure to credit risk on itsother receivables from debtors is managed through close account monitoring andsetting limits.The Group neither has any significant exposure to any individual customer orcounterparty nor any other concentration of credit risk arising from counterparties issimilar business activities, geographic region or economic parties.With respect to credit risk arising from cash and cash equivalents, receivables, AFSinvestments and HTM investments, the Group’s exposure to credit risk arises fromdefault of the counterparty, with maximum exposure equal to the carrying amount ofthese instruments. The maximum exposure to credit risk at the balance sheet date isas follows:Note 2008Cash in bank and cash equivalents 4 P1,265,466,876Available-for-sale investments 5 840,687,402Receivables 6 241,193,553Held-to-maturity investments 32,071,040P2,379,418,871- 22 -
The analysis of the Group’s receivables as of March 31, 2008 according to creditquality is as follows:(In ‘000s)Neither pastdue norimpairedImpairedPast DueNotimpairedTotalTuition and other fees P43,360 P11,872 P26,692 P81,924Suppliers 36,122 - - 36,122Lessees 34,622 - - 34,622Employees 9,146 - - 9,146Real estate buyers 2,136 - - 2,136Others 89,116 - - 89,116The Group classifies tuition and other fee receivables from students based on thenumber of semesters the receivables have been outstanding. Receivables fromstudents that are outstanding for more than one semester are analyzed to determinewhether they are impaired. Those that are not outstanding for more than onesemester or are currently receivable are determined to be collectible, based onhistorical experience.The outstanding balance due from lot buyers are payable in equal monthlyinstallments until 2010. Several post dated checks were received to cover thecollection of the said receivable.The movements in allowance for impairment losses in respect of receivables duringthe year ended March 31, 2008 are as follows:Balance at April 1, 2007P11,436,501Impairment loss recognized during the year <strong>17</strong>,450,897Receivables written-off during the year (<strong>17</strong>,015,065)Balance at March 31, 2008P11,872,333The allowance for impairment losses on receivables as of March 31, 2008 relates toreceivables from students which have been outstanding for more than one semesterand specifically identified to be impaired.No impairment loss on the rest of the Group’s financial assets have been providedsince none of them were identified to be impaired as of March 31, 2008. Cash andcash equivalents, AFS investments and HTM investments are coursed throughreputable financial institutions duly approved by the BOT.2. Liquidity RiskThe Group manages liquidity risk by maintaining a balance between continuity offunding and flexibility. Treasury controls and procedures are in place to ensure thatsufficient cash is maintained to cover daily operational and working capitalrequirements. Management closely monitors the Group’s future and contingentobligations and ensures that future cash collections are sufficient to meet them inaccordance with internal policies. The Group invests in cash placements whenexcess cash is obtained from operations.- 23 -
Financial liabilities of the Group at the balance sheet date comprise of accounts payableand accrued expenses which are all short term in nature and have contractual maturitiesof less than 12 months.3. Market RiskMarket risk is the risk of loss to future earnings, to fair values or to future cash flowsthat may result from changes in the price of a financial instrument. The value of afinancial instrument may change as a result of changes in interest rates, foreigncurrency exchange rates, commodity prices, equity prices and other market changes.The objective of market risk management is to manage and control risk exposures withinacceptable parameters, while optimizing the return on risk. The Group is subject tovarious market risks, including risks from changes in interest rates and currencyexchange rates.Price Risk Sensitivity AnalysisThe Group’s exposure to price risk arises from its investments in equity and debtsecurities, which are classified as AFS investments in the consolidated balance sheets.Management monitors its equity and debt securities in its investment portfolio based onmarket indices. Material investments within the portfolio are managed on an individualbasis.AFS investments consist of publicly listed equity securities and government securitieswhich are carried at fair value and non-listed equity securities for which no fair valueinformation is available and that are therefore carried at cost.Increase (decrease) in market priceEffect onEquity+10% P84,068,740-10% (84,068,740)A 10% increase in the market values of the Group’s AFS investments at year-end wouldhave increased equity by the amounts shown above. This analysis assumes that all othervariables, in particular interest rates, remain constant.A 10% decrease in the market values of the AFS investments at year-end would have anequal but opposite effect to the amounts shown above, on the basis that all other variablesremain constant.Interest Rate Risk Sensitivity AnalysisThe Group’s exposure to interest rate risk arises from the following interest-bearingfinancial instruments:Note 2008Cash in bank and cash equivalents4 P1,265,466,876Available-for-sale investments 5 469,678,961Held-to-maturity investments 32,071,040P1,767,216,877- 24 -
The sensitivity of the Group’s profit before tax to a reasonably possible change ininterest rates, with all variables held constant, are demonstrated as follows:Increase/Decrease inInterest RateEffect on Profitbefore TaxCash in bank and cash equivalents +2% P25,309,338-2% (25,309,338)Available-for-sale investments +2% 9,393,579-2% (9,393,579)Held-to-maturity investments +2% 641,421-2% (641,421)Fair ValuesThe fair values together with the carrying amounts of the financial assets and liabilitiesshown in the consolidated balance sheet are as follows:2008NoteCarryingAmount Fair ValueCash in bank and cash equivalents4 P1,265,6<strong>17</strong>,284 P1,265,6<strong>17</strong>,284Available-for-sale investments 5 840,687,402 840,687,402Receivables 6 241,193,553 241,193,553Held-to-maturity investments 32,071,040 32,071,040Accounts payable and accrued expenses 11 447,636,280 447,636,280Obligation under finance lease 8 1,895,782 1,895,782A number of the Group’s accounting policies and disclosures require the determination offair value, for both financial and non-financial assets and liabilities. Fair values havebeen determined for measurement and disclosure purposes based on the methodsdescribed below.The following methods and assumptions are used to estimate the fair value of each classof financial instruments:Cash and Cash EquivalentsThe carrying amount approximates the fair value primarily due to the relatively shorttermmaturity of these financial instruments.Receivables/Accounts Payable and Accrued Expenses/Obligation under Finance LeaseCurrent receivables are reported at their net realizable values, at total amounts lessallowances for impairment losses. Current liabilities are stated at amounts reasonablyexpected to be paid within the next twelve months or within the Group’s operating cycle.AFS InvestmentsThe fair values of certain AFS investments, which are traded in active markets at thebalance sheet date, are determined by reference to their quoted market price at thereporting date. Other equity instruments classified as AFS are carried at cost due tounavailability of fair market value.HTM InvestmentsThe fair value of HTM investments that are not quoted in an active market is estimated asthe present value of future cash flows, discounted at the market rate of interest at thereporting date.- 25 -
Capital ManagementThe Group aims to provide returns on equity to shareholders while managing operationaland strategic objectives.The BOT has overall responsibility for monitoring of capital in proportion to risks. TheGroup manages its capital structure and makes adjustments to it, in the light of changes ineconomic conditions. To maintain or adjust capital structure, the Group may adjust thedividend payment to shareholders, return capital to shareholders or issue new shares.The Group defines capital as total equity, which is equivalent to the total of capital stock,retained earnings and recognized income and expenses.The Group is not subject to any externally-imposed capital requirements.There was no change in the Group’s approach to capital management during the year.22. Contingent LiabilitiesThe Group is a defendant in certain civil cases which are pending in the local courts andcertain illegal dismissal cases pending before the National Labor Relations Commission(NLRC). As of March 31, 2008, the said cases have not yet been resolved.The Group’s management and its legal counsel believe that the liabilities, if any, whichmay result from the outcome of these cases, will not materially affect the financialposition and results of operations of the Group.23. Prior Period AdjustmentManagement identified certain accruals that should have been reversed in prior years.Consequently, adjustments have been made which increased FRC’s balance of retainedearnings as of April 1, 2006 and decreased accounts payable and other current liabilitiesby P9,550,500. This adjustment was made in connection with FRC’s availment of theTax Amnesty Program under Republic Act 9480.- 26 -
- 21 -Item 8:Changes in and Disagreements with Accountants on Accounting andFinancial DisclosureThere has been no recent change in and disagreement withAccountants on accounting and financial disclosure.PART III - CONTROL AND COMPENSATIONItem 9.Trustees and Executive OfficersName Ages Citizenship PositionLourdes R. Montinola 80 Filipino Chair, Board ofTrusteesAurelio R. Montinola III 56 Filipino Vice Chair,Board of TrusteesLydia B. Echauz 60 Filipino President/TrusteeAngelina P. Jose 55 Filipino Corporate Secretary/TrusteePaulino Y. Tan 62 Filipino TrusteeGianna R. Montinola 50 Filipino TrusteeRenato L. Paras 82 Filipino TrusteeWilfrido C. Tecson 85 Filipino Independent TrusteeRobert F. Kuan 59 Filipino Independent TrusteeFe V. Canilao 62 Filipino Chief Financial OfficerElizabeth P. Melchor 51 Filipino Vice President forAcademic AffairsHerminia I. Maliwat 59 Filipino TreasurerGlenn Z. Nagal 50 Filipino ComptrollerSeverino M. Garcia 59 Filipino Compliance Officer
TRUSTEES AND EXECUTIVE OFFICERS:- 22 -1. Lourdes R. Montinola, 80, Filipino: Chair of the Board of Trustees of <strong>Far</strong> <strong>Eastern</strong><strong>University</strong>, Inc. (June 1989 to present)Other Corporate Affiliations: Chair, Board of Directors, FERN Realty Corporation; Chairand President, FEU Educational Foundation, Inc.; Chair, Nicanor Reyes EducationalFoundation; Chair, Executive Committee, <strong>Far</strong> <strong>Eastern</strong> <strong>University</strong>, Inc.; Governor, NicanorReyes Memorial Foundation; Trustee, FEU-Dr. Nicanor Reyes Medical Foundation;Director, Museum Foundation of the <strong>Philippine</strong>s and Trustee, AY Foundation, Inc.;President, Seyrel Investment & Realty Corporation, and Desrey, Inc.Dr. Montinola holds a Bachelor of Arts degree (cum laude) from Marymount College,New York, U.S.A., and an M. A. in Cultural History from the Asean Graduate Institute ofArts. She completed the Management Development Program for College and <strong>University</strong>Administrators in the Institute for Educational Management, Graduate School ofEducation, Harvard <strong>University</strong>, U.S.A. She obtained her Ph. D. in English: CreativeWriting from the <strong>University</strong> of the <strong>Philippine</strong>s.2. Aurelio Montinola III, 56, Filipino: Vice Chairman of the Board of Trustees,<strong>Far</strong> <strong>Eastern</strong> <strong>University</strong>, Inc. (June 1989 to present)President and Chief Executive Officer of Bank of the <strong>Philippine</strong> Islands. His otheraffiliations, among others, include: Chairman of the Board of Directors of Amon TradingCorporation; Vice Chairman of the Board of Directors of Republic Cement Corporation;Chairman of East Asia Educational Foundation, Inc.; Regional Board of Advisers,MasterCard International; Director, Ayala Land, Inc.; Director, Manila Water Company;President, BPI Foundation, Inc.; Member, Makati Business Club; and Member,Management Association of the <strong>Philippine</strong>s.He graduated with a BS Management Engineering degree at the Ateneo de Manila<strong>University</strong> in 1973, and received his MBA at Harvard Business School in 1977.3. Lydia B. Echauz, 60, Filipino: President (June 2003 to present) and Member ofthe Board of Trustees, <strong>Far</strong> <strong>Eastern</strong> <strong>University</strong>, Inc. (1999 to present)Appointed Acting President of <strong>Far</strong> <strong>Eastern</strong> <strong>University</strong> in October 2002. At present she isPresident, FEU-East Asia College; President, FEU-FERN College; President, East AsiaEducational Foundation, Inc.; Member, Board of Directors of FERN Realty Corporation;Governor, Nicanor Reyes Memorial Foundation; and Member, Executive Committee,<strong>Far</strong> <strong>Eastern</strong> <strong>University</strong>, Inc. She is immediate past President of the Association ofSoutheast Asian Institutes of Higher Learning – <strong>Philippine</strong> Council; Director of the<strong>Philippine</strong> Association of Colleges and Universities, and Member of the ManagementAssociation of the <strong>Philippine</strong>s. She was Dean of the Graduate School of Business, DeLa Salle <strong>University</strong> Professional Schools, Inc., from September 1986 to May 2002;former Associate Director of the MBA program, Ateneo de Manila <strong>University</strong> GraduateSchool of Business for seven years; also Associate Professor of the College of Business
Administration, <strong>University</strong> of the East, for twelve years.- 23 -Dr. Echauz is a Bachelor of Arts, major in Economics and Mathematics fromTheresa’s College, MBA from Ateneo de Manila <strong>University</strong> and DBA fromSalle <strong>University</strong>.St.De La4. Angelina Palanca Jose, 55, Filipino: Trustee (1990 to present) and CorporateSecretary, <strong>Far</strong> <strong>Eastern</strong> <strong>University</strong>, Inc. (1998 to present)Other Corporate Affiliations: Member, Board of Directors, FERN Realty Corporation;Secretary, Treasurer and Trustee, Nicanor Reyes Educational Foundation; CorporateSecretary and Trustee, FEU Educational Foundation Inc.; Corporate Secretary andGovernor, Nicanor Reyes Memorial Foundation; and member, Executive Committee, <strong>Far</strong><strong>Eastern</strong> <strong>University</strong>, Inc.Ms. Jose obtained her Bachelor of Science degree, major in Economics, from the<strong>University</strong> of the <strong>Philippine</strong>s (Dean’s Medal).5. Paulino Y. Tan, 62, Filipino: Trustee, <strong>Far</strong> <strong>Eastern</strong> <strong>University</strong>, Inc. (1991 to present)Other Business Experience: President of Asia Pacific College; IT Services Consultant,SM (Shoemart) Inc. At present, member of the Board of Directors/Trustees of thefollowing companies: Nicanor Reyes Educational Foundation, Inc., FEU EducationalFoundation, Inc., East Asia Educational Foundation, Inc., Lyceum of Batangas, LyceumInstitute of Technology, Foundation for Upgrading the Standard of Education (FUSE),SM (Shoemart) Foundation, Inc., SM E-Ventures, Inc., Asia Pacific TechnologyEducational Foundation, and FERN Realty Corporation.Dr. Tan obtained the Degree of Bachelor in Science in Chemical Engineering (summacum laude) from De La Salle <strong>University</strong>. He topped the Chemical Engineering BoardExamination and obtained both his M. S. and Ph.D. in Chemical Engineering from the<strong>University</strong> of Notre Dame, Indiana, U.S.A.6. Gianna R. Montinola, 50, Filipino: Trustee of <strong>Far</strong> <strong>Eastern</strong> <strong>University</strong>, Inc. (1989-1993 and 1996 to present)Concurrently Director and Corporate Secretary of FERN Realty Corporation andConsultant for Marketing and Communications of <strong>Far</strong> <strong>Eastern</strong> <strong>University</strong>. A lawyer byprofession, she was connected with the Quisumbing, Torres and Evangelista Law Office(an affiliate of the Baker & McKenzie Law Office, U.S.A.) from 1986 to 1992. She servedas <strong>Philippine</strong> Honorary Consul to the Republic of Peru from 1992 to 1996, and joinedthe Marketing and Business Development departments of Rockwell Land Corporationfrom 1996 to 1998. She is a member of the Board of Directors and Corporate Secretaryof Amon Trading Corporation and as Director of True Value Robinsons Corporation.She obtained a Bachelor of Arts degree in International Relations from Mount HolyokeCollege, USA and a Bachelor of Laws (Ll.B.) degree, with honors, from the Ateneo deManila College of Law.
- 24 -7. Renato L. Paras, 82, Filipino: Trustee of <strong>Far</strong> <strong>Eastern</strong> <strong>University</strong>, Inc. (1989-1991and 2002 to present)Other Corporate Affiliations: Chair of CHEMREZ Technologies and of <strong>Philippine</strong>Ratings; Vice Chair of CIBI Foundation and East Asia Educational Foundation, Inc. Heis also a member of the Board of Directors/Trustees of the following: FERN RealtyCorporation, CIBI Information, Inc., Insular Life Health Care, IBM <strong>Philippine</strong>s RetirementFund. Dr. Paras was a member of the Central Bank Monetary Board.Dr. Paras is a Certified Public Accountant. He topped the CPA Board Exam in 1948. Hefinished his Bachelor of Science in Accountancy in FEU in 1949 (summa cum laude),and earned his Master of Science in Accountancy at Columbia <strong>University</strong> in New Yorkas an FEU scholar. He took up an Advanced Management Program conducted by theHarvard Graduate School of Business Faculty. In the year 2000, he was conferred anhonorary degree of Doctor of Humanities by FEU. He is listed in the Accountancy Hall ofFame.8. Wilfrido C. Tecson, 85, Filipino: Trustee (1989-2001) and Independent Trustee,<strong>Far</strong> <strong>Eastern</strong> <strong>University</strong> (2001 to present)Banking Experience: Co-founded Solid Bank and assumed positions of President, CEOand Vice Chairman until he retired; served as Vice President of China BankingCorporation and as President and Vice Chairman of Equitable Banking Corporation.At present, he is a Director of the Lepanto Mining Corporation. He is founding Treasurerof the Hero Foundation, Inc. and the Museong Pambata, and is a member of the Boardof Trustees of the YMCA.Dr. Tecson graduated with the degree of Bachelor of Science in Commerce, major inAccounting (summa cum laude) from FEU, and was conferred the degree of Doctor ofBusiness Management (honoris causa) by FEU in 1993.9. Robert F. Kuan, 59, Filipino: Independent Trustee of <strong>Far</strong> <strong>Eastern</strong> <strong>University</strong>, Inc.(2004 to present)Other Business Affiliations: Chairman, St. Luke’s Medical Center; Trustee, St. Luke’sCollege of Medicine–William H. Quasha Memorial; Trustee, BRENT International Schoolof Manila; Director, China Banking Corporation; Founder/President, Chowking FoodCorporation (1985 – 2000).Mr. Kuan graduated from the <strong>University</strong> of the <strong>Philippine</strong>s (1970) with a degree ofBachelor of Science in Business Administration. In 1975, he earned his Masters inBusiness Management from the Asian Institute of Management (AIM). In 1993, he tookup the Top Management Program at AIM, a program exclusively for company Presidentsand Chief Executive Officers. He was a TOFIL (The Outstanding Filipino) Awardee in2003 in the field of Business & Entrepreneurship; Agora Awardee for Entrepreneurship;Triple-A Awardee of AIM; and Outstanding Alumnus of the <strong>University</strong> of the <strong>Philippine</strong>s(UP) in the field of Business.
- 25 -10. Elizabeth P. Melchor, 51, Filipino: Vice President for Academic Affairs, <strong>Far</strong><strong>Eastern</strong> <strong>University</strong>, Inc. (2004 to present)Other Professional Experience: Trustee, FEU-Nicanor Reyes Medical Foundation;Governor, Nicanor Reyes Memorial Foundation; Trustee, East Asia EducationalFoundation, Inc.; Vice-President, Alejandro Melchor Jr. Memorial Foundation; Trusteeand Officer, Cradle of Joy Learning Center; Member, Commission on Tertiary Education,<strong>Philippine</strong> Accrediting Association of Schools, Colleges and Universities (PAASCU);Dean, Registrar and Outstanding Teacher Awardee, Assumption College, Makati;Visiting Professor, Huaqiao <strong>University</strong>, Quanzhou, China; Scholar, Beijing LanguageInstitute; Chapter Head, Haggai Institute of Advanced Leadership.Dr. Melchor holds a Bachelor of Science degree, major in Physics (College Scholar),and a Master of Science, major in Physics, from the <strong>University</strong> of the <strong>Philippine</strong>s,Diliman. She earned her doctorate degree in Education from the California Coast<strong>University</strong> in Santa Ana, California, U.S.A.11. Fe V. Canilao, 62, Filipino: Chief Financial Officer, <strong>Far</strong> <strong>Eastern</strong> <strong>University</strong>, Inc.(1996 to present)Other Business Experience: Served as Vice President for Finance prior to her currentposition. At present, Vice President of FERN Realty Corporation; member, ExecutiveCommittee, and Investor Relations Officer, <strong>Far</strong> <strong>Eastern</strong> <strong>University</strong>, Inc.; Trustee andTreasurer, East Asia Educational Foundation, Inc.; Assistant Secretary of the NicanorReyes Educational Foundation and the FEU Educational Foundation, Inc.Ms. Canilao, a Certified Public Accountant, earned her Bachelor of Science in BusinessAdministration from the <strong>Philippine</strong> Women’s <strong>University</strong> and her MBA from FEU.12. Herminia I. Maliwat, 58, Filipino: Treasurer, <strong>Far</strong> <strong>Eastern</strong> <strong>University</strong>, Inc. (January1998 to present)Ms. Maliwat is a Certified Public Accountant. Before joining FEU, she worked for10 years as Chief Accountant and Instructor for 8 years at the College of the Holy Spirit,as Administrative and Finance Officer for 16 years at the Asia Foundation, and asExternal Auditor for 10 years at he Mother Edelwina Educational Foundation. She alsoserved as Executive Director of the FEU Educational Foundation for three years.She obtained her BS in Accounting, cum laude, from the <strong>University</strong> of the East.13. Glenn Z. Nagal, 50, Filipino: Comptroller, <strong>Far</strong> <strong>Eastern</strong> <strong>University</strong>, Inc. (1996 topresent)Work experience: External Auditor, Carlos J. Valdes and Company; Examiner, CentralBank of the <strong>Philippine</strong>s; Internal Audit Manager, <strong>Far</strong> <strong>Eastern</strong> <strong>University</strong>;Chief Accountant and Budget Director, <strong>Far</strong> <strong>Eastern</strong> <strong>University</strong>; Accounting Professor,<strong>Far</strong> <strong>Eastern</strong> <strong>University</strong>.A Certified Public Accountant by profession, Mr. Nagal graduated with the degree ofBachelor of Science in Commerce, major in Accounting from <strong>Far</strong> <strong>Eastern</strong> <strong>University</strong>.
- 26 -14. Severino M. Garcia, 59, Filipino: Compliance Officer, <strong>Far</strong> <strong>Eastern</strong> <strong>University</strong>, Inc.(January 21, 2003 to present)<strong>Form</strong>er Assistant Vice President – Audit.Mr. Garcia earned the degree of Bachelor of Science in Commerce, major in Accountingfrom FEU. A Certified Public Accountant, he worked in different companies as Auditor,Chief Accountant, Finance and Accounting Manager and Senior Financial Analyst.The members of the Board of Trustees of the Corporation are elected at the Annual <strong>Stock</strong>holders'Meeting to hold office until the next succeeding annual meeting, up to the time their respectivesuccessors shall have been elected and qualified.The officers are appointed or elected annually by the Board of Trustees at its organizationalmeeting, each to hold office until the corresponding meeting of the Board the following year or untila successor shall have been elected, appointed and qualified.Significant EmployeesThe corporation considers its entire work force as significant employees. Everyone is expected towork together as a team to achieve the corporation’s goals and objectives.Family RelationshipsThe Chair, Dr. Lourdes R. Montinola, is the mother of Mr. Aurelio R. Montinola III andAtty. Gianna R. Montinola, all of whom are members of the Board of Trustees.
- 27 -Item 10:Executive CompensationApril 1/2006 to April 1/2007 to April 1/2008 toMarch 31/2007 March 31/2008 March 31/2009NameLourdes R. MontinolaLydia B. EchauzAngelina P. JoseFe V. CanilaoElizabeth P. MelchorHerminia I. MaliwatSeverino M. GarciaPrincipal PositionChair, Board of TrusteesTrustee/PresidentTrustee/Corporate SecretaryChief Financial OfficerVP - Academic AffairsTreasurerCompliance Officer_____________ _____________ ____________P40,162,456.36 P49,138,778.39 P59,949,309.00The compensation above presented are actual for the last two (2) completed fiscal years andthe estimate for the ensuing fiscal year ending March 31, 2009. Aggregate amount is P/149,250,543.75==============Compensation of DirectorsA. Standard ArrangementB. Other ArrangementThe members of the Board of Trustees of the corporation are receiving gasallowances for regular board/special board meetings attended. They are also entitledto bonuses at the end of the fiscal year at the discretion of the Board, while theofficers of the corporation are entitled to basic salaries, living allowance, specialfinancial assistance, fringe benefits, and also bonuses at the discretion of the Board.There are no other material terms or conditions of employment for contractualexecutive officers.Voting Trust HoldersThe Registrant is not a party to any voting trust agreement. No security holder of the Registrantholds a voting trust or other similar agreements.
- 28 -No information is available on all outstanding warrants or options held by the members of theBoard of Trustees and officers of the corporation.Summary Compensation TableSummary and Principal Position Year Salary Bonus Other AnnualCompensationLourdes R. MontinolaChair, Board of TrusteesLydia B. EchauzTrustee/PresidentAngelina P. JoseTrustee/Corporate SecretaryFe V. CanilaoChief Financial OfficerElizabeth P. MelchorVP-Academic AffairsHerminia I. MaliwatTreasurerSeverino M. GarciaCompliance Officer- x - - x - - x - - x -- x - - x - - x - - x -- x - - x - - x - - x -- x - - x - - x - - x -- x - - x - - x - - x -- x - - x - - x - - x -- x - - x - - x - - x -Grand Total 2006-2007 P/ 29,615,770.27 P/ 10,546,686.09 - x -2007-2008 34,155,384.21 14,983,394.18 - x -2008-2009(est.)41,669,568.29 18,279,740.71 - x -
- 29 -Item 11:Security Ownership of Certain Beneficial Owners and ManagementBeneficial Owners of More Than 5% and 10% Securities as of March 31, 2008As of March 31, 2008, <strong>Far</strong> <strong>Eastern</strong> <strong>University</strong> does not have on record any person, party orentity who beneficially owns more than 5% and 10% of common stock except as set forth in thetable below:Title of ClassName, Address of RecordOwner and Relationship withIssuerCitizenshipNo. ofShares HeldPercentCommon Desrey, Incorporated 110 th Fl., Pacific Star Bldg.Cor. Makati & Gil Puyat Ave.Makati CityCommon Seyrel Investment andRealty Corporation 210 th Fl., Pacific Star Bldg.Cor. Makati & Gil Puyat Ave.Makati CityCommon Sysmart Corporation 3426 MKSE, Ayala AvenueMakati CityFilipino 560,572 8.0009Filipino 2,005,597 28.6253Filipino 1,461,529 20.8600All of the above are direct beneficial owners of the securities.1 Dr. Lourdes, R. Montinola as President is authorized to vote for the shares of the Corporation.2 Ibid3 Mr. Henry Sy Sr. as Chair of the Board will vote for the shares of the Corporation.
- 30 -Security Ownership of ManagementTitle of ClassCommonCommonCommonCommonCommonCommonCommonCommonCommonCommonCommonName of Beneficial OwnerLourdes R. MontinolaChair, Board of TrusteesLydia B. EchauzTrustee/PresidentAurelio R. Montinola IIIVice Chair, Board of TrusteesAngelina Palanca JoseTrustee/Corporate SecretaryWilfrido C. TecsonTrusteePaulino Y. TanTrusteeGianna R. MontinolaTrusteeRenato L. ParasTrusteeRobert F. KuanTrusteeFe V. CanilaoChief Financial OfficerElizabeth P. MelchorVP for Planning andDevelopmentNumber ofShares andand Nature ofBeneficialOwnershipCitizenshipPercentOf Class103,279 - D Filipino 1.47414,228 - D Filipino 0.0603108,280 - D Filipino 1.5454221,325 - D Filipino 3.15899 - I Filipino 0.000139 - I Filipino 0.000135,644 - D Filipino 0.080569 - I Filipino 0.000131 - I Filipino 0.0000114,970 - D Filipino 0.213712,759 - D Filipino 0.1821Security of Ownership of Management as a GroupTotal Shares - 470,513Percentage - 6.7155%
- 31 -Item 12:Certain Relationship and Related TransactionsDuring the last two (2) years, the corporation or any of the members of the Board of Trusteeswas never a party or proposed to be a party in any related transaction.PART IV - Corporate GovernanceItem 13.Corporate Governance• The <strong>University</strong>’s compliance with <strong>SEC</strong> Memorandum Circular No. 2 datedApril 5, 2002, as well as all relevant circulars on Corporate Governancehas been monitored.• FAR EASTERN UNIVERSITY, its trustees, officers and employeescomplied with the leading practices and principles on good corporategovernance as embodied in the company’s Manual;• FAR EASTERN UNIVERSITY also complied with the appropriateperformance self-rating assessment and performance evaluation systemto determine and measure compliance with the Manual. Thecorporation’s evaluation system was approved by the Board of Trusteesat its meeting on March 16, 2004;• FAR EASTERN UNIVERSITY did not commit any major deviations fromthe provisions of its Manual. Our Corporate Governance ComplianceOfficer submitted his 2007 certification to the Securities and <strong>Exchange</strong>Commission on the extent of the company’s compliance with its manualon January 29, 2008.• All members of the Board of Trustees as well as Senior Managementofficers completed and were duly certified to have attended a specialseminar on Corporate Governance conducted by an entity accredited bythe Securities and <strong>Exchange</strong> Commission. In September 2007, theuniversity participated in the Corporate Governance Survey using theCorporate Governance Scorecard prepared by the Institute of CorporateDirectors.
- 32 -PART V – EXHIBITS AND SCHEDULESItem 14 Exhibits and Reports on <strong>SEC</strong> <strong>Form</strong> <strong>17</strong>-C(a) ExhibitThe exhibits are not applicable to the company nor require any answer.(b) Report on <strong>SEC</strong> <strong>Form</strong> <strong>17</strong>-C1. Resolutions approved at the Board of Trustees’ meeting held onJune 26, 2007:Declaration of P15.00/share cash dividend on record as of11, 2007, payable on July 23, 2007.JulyAppropriation from the retained earnings the amount ofOne Hundred Million Pesos (P100,000,000.00) for repairs andimprovement of facilities and another Fifty Million Pesos(P50,000,000.00) for general retirement.Report received on June 29, 20072. Resolutions approved at the Annual <strong>Stock</strong>holders’ meeting held onAugust 25, 2007:a. Minutes of the Annual Meeting on August 26, 2006;b. Academic Report of the President and Annual Report ofthe Chairman for fiscal year 2006-2007;c. Ratification and confirmation of the acts of the officers andtrustees in the furtherance of the matters covered by theannual report for fiscal year 2006-2007;d. Elected trustees and independent trustees for the fiscalyear 2007-2008;e. Re-appointment of KPMG Manabat Sanagustin andCompany as External Auditor for the fiscal year 2007-2008; andf. Vote of appreciation to the Board of Trustees, the officials,faculty and staff.Report received on August 28, 2007.
- 33 -3. Resolutions approved at the Organizational Meeting of the Board ofTrustees held on September 18, 2007:a. Elected Corporate and <strong>University</strong> Officials for the fiscalyear 2007-2008;b. Composition of the Executive Committee;c. Composition of the Audit Committee; andd. Composition of the Nomination Committeee. Composition of the Risk ManagementReport received on September 19, 2007.4. Resolution approved at the Board of Trustees’ meeting held on November20, 2007:Designation of Atty. Gianna R. Montinola, Trustee, as ActingCorporate Secretary of the Corporation, for the duration of the leave ofabsence of Ms. Angelina P. Jose, Corporate Secretary.Report received on November 21, 2007.5. Resolution approved at the Board of Trustees’ meeting held on December18, 2007:Declaration of P15.00/share cash dividend on record as ofJanuary 07, 2008, payable on January <strong>17</strong>, 2008.Report received on December 19, 2007.6. Resolutions approved at the Board of Trustees’ meeting held onMarch 25, 2008:Declaration of P15.00/share cash dividend on record as of10, 2008, payable on April 24, 2008.AprilDeclaration of 40% stock dividend subject to confirmation by thestockholders at the regular stockholders’ meeting to be held on August23, 2008. The record date of the dividend shall be determined after saidannual meeting and to be issued as soon thereafter the necessary <strong>SEC</strong>and PSE permits or authorization shall have been released. All fractionalshares resulting from said stock dividend shall be paid in cash by theCorporation at par value.
- 34 -Appropriation from the retained earnings the amount ofOne Hundred Fifty Million Pesos (P150,000,000.00) for the SilangCampus and another One Hundred Fifty Million Pesos (P150,000,000.00)for the Quezon City Campus.Acquisition of <strong>Far</strong> <strong>Eastern</strong> <strong>University</strong> of 1,402 FERN RealtyCorporation shares of stock.(c) Quarterly Reports:Report received on March 26, 2008.Ended June 30, 2007Received August 14, 2007Ended September 30, 2007Received November 14, 2007Ended December 31, 2007Received February 14, 2008
- 35 -Business and General InformationI. Industry ProfileThe following are the dominant characteristics of the education industry:- The business of higher education in the country is in the hands of the privatesector.- There is an uneven distribution of colleges and universities across the regions.This connotes a problem of unequal access to higher education. This isevidenced by the high concentration of state and private colleges and universitiesin the National Capital Region and Southern Tagalog Regions.- Statistics show a high mismatch between education and occupation.- The number of graduates in fields like commerce and business administrationcontinues to increase even if unemployment among these graduates is on therise.<strong>Far</strong> <strong>Eastern</strong> <strong>University</strong>’s market is made up of the working class and the middle incomegroup. FEU is situated in Manila, particularly in the area popularly known as the<strong>University</strong> Belt. To be competitive, the university must continuously improve its productsand at the same time maintain reasonable tuition fees.II.Group of related services which contribute 10% or more to revenues1. Institute of Accounts, Business and Finance 25%2. Associate in Health Science Education 35.71%3. Institute of Nursing 16.07%III. Teaching services are rendered to students who come and enroll.IV. No patents, trademarks, copyrights, licenses, franchises, concessions, and royaltyagreements are held by the company.V. All courses offered are with CHED recognition.VI Standard set by CHED encourages the <strong>University</strong> to continuously improve its quality ofteaching and its facilities.Operational and Financial InformationDividend payments are normally restricted by reserves and appropriations made by thecompany, and by the amount needed to ensure smooth and unhampered operationsduring the year.Control and Compensation InformationNo warrants or options are given by the corporation.