PLAXIS LIQUEFACTION MODEL UBC3D-PLM - Knowledge Base
PLAXIS LIQUEFACTION MODEL UBC3D-PLM - Knowledge Base
PLAXIS LIQUEFACTION MODEL UBC3D-PLM - Knowledge Base
- No tags were found...

You also want an ePaper? Increase the reach of your titles
YUMPU automatically turns print PDFs into web optimized ePapers that Google loves.
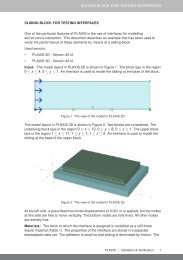
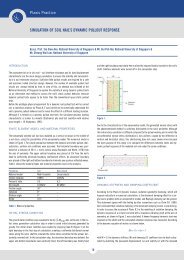
stress ratio (CSR) is applied. The numerical simulations are carried out ata single stress point using <strong>UBC3D</strong>-<strong>PLM</strong> in <strong>PLAXIS</strong> Soil Test facility. Theinitial stress conditions for the stress point are described in Table 2.2. Theparameters are summarized in Table 2.3. Isotropic consolidation is studiedin the first calculation and the influence of a lower K 0 is presented later.Test σyy(kP 0 a) τyx 0 ∆ɛ xx ∆σ yy ∆ɛ zz ∆τ yx (kP a) K 0 CSR1 -100 0 0 0 0 8 1 0.082 -100 0 0 0 0 10 1 0.13 -100 0 0 0 0 12 1 0.12Table 2.2: Boundary values for simulating a cyclic simple shear testin a single stress point. Compression negative. Stresses in kPa.Table 2.3:φ p ( ◦ ) φ c ( ◦ ) KB e KG e Kp G me ne np R f33.8 33 607 867 266 0.5 0.5 0.4 0.81Input parameters for modelling the undrained cyclicbehaviour of loose Fraser sand. For <strong>UBC3D</strong>-<strong>PLM</strong>U7, N1 60 = 8and fac post = 0.6.In Figure 2.3 both the predicted and the experimental stress paths forTest 1 (CSR = 0.08) are presented. The <strong>UBC3D</strong>-<strong>PLM</strong> model gives adequateaccuracy for the specific stress path. The primary loading and the secondaryloading with densification can be distinguished, as well as the transition tothe liquefied state. Moreover, the post-liquefaction factor which was introducedensures a much more realistic behaviour of the soil after liquefaction.Figure 2.4 presents the evolution of the excess pore pressure during theexperiment. The <strong>UBC3D</strong>-<strong>PLM</strong> predicts the liquefaction of the soil after 15cycles, whereas in the experiment it occurs after 17 cycles.In Figure 2.5 the shear stress-strain relationship for the same sand ispresented. It can be seen that the use of the post-liquefaction factor fac postgives an accurate approximation of the maximum shear strain during the26