Children with Disabilities
Children with Disabilities
Children with Disabilities
- No tags were found...

Create successful ePaper yourself
Turn your PDF publications into a flip-book with our unique Google optimized e-Paper software.
THE STATE OF THE WORLD’S CHILDREN 2013<strong>Children</strong> <strong>with</strong><strong>Disabilities</strong>
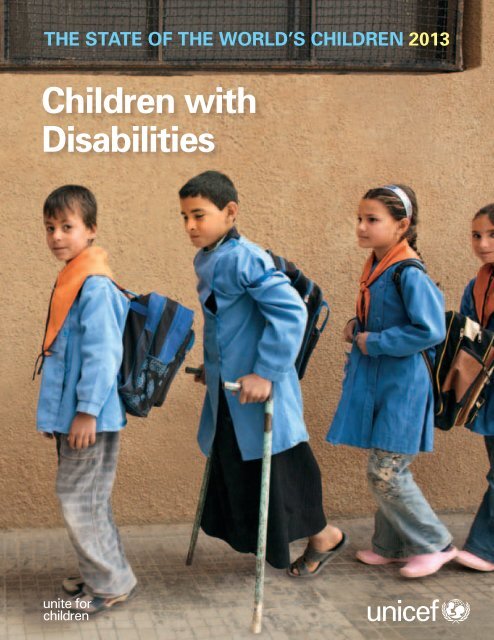
© United Nations <strong>Children</strong>’s Fund (UNICEF)May 2013Permission is required to reproduce any part of this publication. Permission will befreely granted to educational or non-profit organizations. Others will be requestedto pay a small fee. Please contact:Division of Communication, UNICEFAttn: Permissions H6F3 United Nations Plaza, New York, NY 10017, USATel: +1 (212) 326-7434Email: nyhqdoc.permit@unicef.orgThis report and additional online content are available at . Perspective and Focus essays represent the personal views ofthe authors and do not necessarily reflect the position of the United Nations<strong>Children</strong>’s Fund.For corrigenda subsequent to printing, please see .For latest data, please visit .ISBN: 978-92-806-4656-6eISBN: 978-92-806-4662-7United Nations publication sales no.: E.13.XX.1Cover photo:Schoolchildren queue to enter their classroom in this 2007 photograph from theSyrian Arab Republic. © UNICEF/HQ2007-0745/Noorani
THE STATE OF THEWORLD’S CHILDREN 2013
ACKNOWLEDGEMENTSThis report is the result of collaboration among too many individuals and institutions to acknowledge here. The editorial and research teamthanks all who gave so willingly of their time, expertise and energy, in particular:Vesna Bosnjak (International Social Services); Shuaib Chalklen (UN Special Rapporteur on Disability); Maureen Durkin (University of Wisconsin); Nora Groce and Maria Kett(Leonard Cheshire Disability and Inclusive Development Centre, University College London); Nawaf Kabbara (Arab Organization of Disabled People); Lisa Jordan (Bernardvan Leer Foundation); Connie Laurin-Bowie (International Disability Alliance); Barbara LeRoy (Wayne State University); Charlotte McClain-Nhlapo (United States Agency forInternational Development); Helen Meekosha (Women <strong>with</strong> <strong>Disabilities</strong> Australia); Peter Mittler (University of Manchester); Roseweter Mudarikwa (Secretariat of the AfricanDecade on Persons <strong>with</strong> <strong>Disabilities</strong>); David Mugawe (African Child Policy Forum); Ghulam Nabi Nizamani (Pakistan Disabled Peoples’ Organization); Victor Santiago Pineda(Victor Pineda Foundation); Tom Shakespeare (World Health Organization); Aleksandra Posarac (World Bank); Shantha Rau Barriga (Human Rights Watch); Eric Rosenthal(Disability Rights International); Albina Shankar (Mobility India); and Armando Vásquez (Pan American Health Organization) for serving on the External Advisory Board.Judith Klein (Open Society Foundations); Gerrison Lansdown (independent); Malcolm MacLachlan and Hasheem Mannan (Trinity College Dublin); Susie Miles (independent);Daniel Mont (Leonard Cheshire Disability); and Diane Richler (International Disability Alliance) for authoring background papers.Sruthi Atmakur (City University of New York); Parul Bakshi and Jean-Francois Trani (Washington University in St. Louis); Nazmul Bari and Amzad Hossain (Centre for Disabilityin Development); Simone Bloem and Mihaylo Milovanovitch (Organization for Economic Co-operation and Development); Johan Borg (Lund University); Megan Burke,Stephane De Greef and Loren Persi Vicentic (Landmine and Cluster Munition Monitor); James Conroy (Center for Outcome Analysis); Audrey Cooper, Charles Reilly and AmyWilson (Gallaudet University); Alexandre Cote (International Disability Alliance); Marcella Deluca, Sunanda Mavillapalli, Alex Mhando, Kristy Mitchell, Hannah Nicolls andDiana Shaw (Leonard Cheshire Disability/Young Voices); Avinash De Souza (De Souza Foundation); Catherine Dixon (Handicap International); Fred Doulton (Secretariat of theConvention on the Rights of Persons <strong>with</strong> <strong>Disabilities</strong>); Natasha Graham (Global Partnership for Education); Jean Johnson (University of Hawaii); Chapal Khasnabis and AlanaOfficer (World Health Organization); Darko Krznaric (Queen’s University); Gwynnyth Llewellyn (University of Sydney); Mitch Loeb (Centers for Disease Control and Prevention/National Center for Health Statistics); Rosemay McKay (Australian Agency for International Development); Amanda McRae (Human Rights Watch); Sophie Mitra (FordhamUniversity); David Morissey, Sherzodbek Sharipoo and Andrea Shettle (United States International Council on <strong>Disabilities</strong>); Zelda Mycroft (The Chaeli Campaign); EmmaPearce (Women’s Refugee Commission); Natalia Raileanu (Keystone Human Services); Richard Rieser (World of Inclusion); Marguerite Schneider (Stellenbosch University);Morsheda Akter Shilpi (Organization for the Poor Community Advancement); Silje Vold (Plan Norway) for writing background material or providing advice and information.Tracy Achieng; Grace Okumu Akimi; Sophia Rose Akoth; Abeida Onica Anderson; Washinton Okok Anyumba; Beatrice Atieno; Ssentongo Deo; Ivory Duncan; Argie Ergina;Mary Charles Felix; Michael Salah Hosea; Amna Hissein Idris; Tiffany Joseph; Hannah Wanja Maina; Saitoti Augustin Maina; Dianne Mallari; Modesta Mbijima; ShidaMganga; Nicole Mballah Mulavu; Joseph Kadiko Mutunkei; Ann Napaashu Nemagai; Rachael Nyaboke Nyabuti; Alice Akoth Nyamuok; Sarah Omanwa; Benson Okoth Otieno;Nakafu Phiona; Shalima Ramadhani; Rosemarie Ramitt; Nambobi Sadat; Veronicah Shangutit Sampeke; Ladu Michel Seme; Josephine Kiden Simon; Muhammad Tarmizi binFauzi; Elizabeth Mamunyak Tikami; Shemona Trinidad; and the 20 other young people who participated anonymously in surveys and focus groups conducted specially for thisreport by facilitators from the Leonard Cheshire Disability Young Voices network.Bora Shin and Matthew Manos (veryniceDesign) for the infographic on universal design published online at .UNICEF country and regional offices and headquarters divisions contributed to this report or to related online content or advocacy materials by submitting findings or photographs,taking part in formal reviews or commenting on drafts. Many UNICEF offices and national committees arranged to translate or adapt the report for local use.Programme, policy, communication and research advice and support were provided by Yoka Brandt, Deputy Executive Director; Geeta Rao Gupta, Deputy Executive Director;Gordon Alexander, Director, Office of Research and colleagues; Nicholas Alipui, Director, Programme Division and colleagues; Ted Chaiban, Director, Office of EmergencyOperations and colleagues; Colin Kirk, Director, Office of Evaluation and colleagues; Jeffrey O’Malley, Director, Division of Policy and Strategy and colleagues; and EdwardCarwardine, Deputy Director, Division of Communication and colleagues. This edition also benefited from the close cooperation of Rosangela Berman-Bieler, Chief, andcolleagues in the Disability Section of UNICEF’s Programme Division.Special thanks to David Anthony, Chief, Policy Advocacy Section; Claudia Cappa, Statistics and Monitoring Specialist; Khaled Mansour, Director of Communication untilJanuary 2013; and Julia Szczuka, deputy editor of this report until September 2012, for their generosity of intellect and spirit.REPORT TEAMEDITORIAL AND RESEARCHAbid Aslam, EditorChristine Mills, Project ManagerNikola Balvin, Sue Le-Ba, Ticiana Maloney, Research OfficersAnna Grojec, Perspectives EditorMarc Chalamet, French EditorCarlos Perellon, Spanish EditorHirut Gebre-Egziabher (Lead), Lisa Kenney, Ami Pradhan, Research AssistantsCharlotte Maitre (Lead), Carol Holmes, Pamela Knight, Natalie Leston,Kristin Moehlmann, Copy EditorsAnne Santiago, Nogel S. Viyar, Judith Yemane, Editorial supportPUBLISHING AND DISSEMINATIONCatherine Langevin-Falcon, Chief, Publications Section; Jaclyn Tierney, ProductionOfficer; Germain Ake; Christine Kenyi; Maryan Lobo; Jorge Peralta-Rodriguez;Elias SalemSTATISTICAL TABLESTessa Wardlaw, Associate Director, Statistics and Monitoring Section, Divisionof Policy and Strategy; David Brown; Claudia Cappa; Liliana Carvajal; ArchanaDwivedi; Anne Genereux; Elizabeth Horn-Phathanothai; Priscilla Idele; ClaesJohansson; Rouslan Karimov; Rolf Luyendijk; Colleen Murray; Jin Rou New;Holly Newby; Khin Wityee Oo; Nicole Petrowski; Tyler Porth; Chiho Suzuki;Andrew Thompson; Danzhen YouDesign by Prographics, Inc.Printed by Hatteras Press, Inc.iiTHE STATE OF THE WORLD’S CHILDREN 2013: <strong>Children</strong> <strong>with</strong> <strong>Disabilities</strong>
FOREWORDIs there a child who does not dream of being counted and having her or his giftsand talents recognized? No. All children have hopes and dreams – including children<strong>with</strong> disabilities. And all children deserve a fair chance to make their dreams real.This edition of The State of the World’s <strong>Children</strong> includes contributions byyoung people and parents who show that, when given that chance, children <strong>with</strong>disabilities are more than capable of overcoming barriers to their inclusion, of taking their rightful placeas equal participants in society and of enriching the life of their communities.But for far too many children <strong>with</strong> disabilities, the opportunity to participate simply does not exist. Fartoo often, children <strong>with</strong> disabilities are among the last in line for resources and services, especiallywhere these are scarce to begin <strong>with</strong>. Far too regularly, they are the objects simply of pity or, worse,discrimination and abuse.The deprivations faced by children and adolescents <strong>with</strong> disabilities are violations of their rights and theprinciple of equity, at the heart of which lies a concern for the dignity and rights of all children – includingthe most vulnerable and marginalized members of society.As this report documents, the inclusion of children <strong>with</strong> disabilities in society is possible – but it requiresfirst a change of perception, a recognition that children <strong>with</strong> disabilities hold the same rights as others;that they can be agents of change and self-determination, not merely the beneficiaries of charity; thattheir voices must be heard and heeded in our policymaking and programmes.We contribute to their exclusion by failing to gather enough data to inform our decisions. When we failto count these children, we are failing to help them count for all they should in their societies.Fortunately, progress is being made – albeit unevenly. This report not only examines the challengesinvolved in ensuring that children <strong>with</strong> disabilities have the fair access to services that is their right. Italso explores initiatives that show promise in such areas as health, nutrition, education and emergencyprogramming – and in the data collection and analysis needed to improve policies and operations in allthese fields. Other chapters also discuss principles and approaches that can be adapted to advance thesechildren’s inclusion.Somewhere, a child is being told he cannot play because he cannot walk, or another that she cannotlearn because she cannot see. That boy deserves a chance to play. And we all benefit when that girl,and all children, can read, learn and contribute.The path forward will be challenging. But children do not accept unnecessary limits. Neither should we.Anthony LakeExecutive Director, UNICEFiii
CONTENTSACKNOWLEDGEMENTS.................................................. iiFOREWORDAnthony Lake, Executive Director, UNICEF............................... iiiCHAPTER 1INTRODUCTION................................................................. 1From exclusion to inclusion......................................................... 1On the numbers............................................................................. 3A framework for action................................................................ 3CHAPTER 2FUNDAMENTALS OF INCLUSION.................... 11Changing attitudes...................................................................... 12It’s about ability........................................................................... 13Supporting children and their families..................................... 13Community-based rehabilitation............................................... 16Assistive technology................................................................... 18Universal design.......................................................................... 18CHAPTER 3A STRONG FOUNDATION....................................... 23Inclusive health............................................................................ 23Immunization............................................................................... 23Nutrition....................................................................................... 24Water, sanitation and hygiene.................................................... 25Sexual and reproductive health and HIV/AIDS......................... 26Early detection and intervention................................................ 26Inclusive education..................................................................... 27Starting early............................................................................... 29Working <strong>with</strong> teachers................................................................ 32Involving parents, communities and children ......................... 33Lines of responsibility................................................................. 36CHAPTER 4ESSENTIALS OF PROTECTION............................ 41Abuse and violence..................................................................... 41Institutions and inappropriate care........................................... 42Inclusive justice........................................................................... 43CHAPTER 5HUMANITARIAN RESPONSE................................ 49CHAPTER 6MEASURING CHILD DISABILITY........................ 63Evolving definitions.................................................................... 63Putting disability in context ...................................................... 64Data collection............................................................................. 65Questionnaire design.................................................................. 66Purpose and consequences........................................................ 67A way forward............................................................................. 68CHAPTER 7AN AGENDA FOR ACTION..................................... 75Ratify and implement the Conventions.................................... 75Fight discrimination.................................................................... 75Dismantle barriers to inclusion.................................................. 77End institutionalization.............................................................. 80Support families.......................................................................... 81Move beyond minimum standards........................................... 81Coordinate services to support the child................................. 81Involve children <strong>with</strong> disabilities in making decisions............ 84Global promise, local test.......................................................... 85ivTHE STATE OF THE WORLD’S CHILDREN 2013: <strong>Children</strong> <strong>with</strong> <strong>Disabilities</strong>
FOCUSViolence against children <strong>with</strong> disabilities............................... 44Risk, resilience and inclusive humanitarian action.................. 52Explosive remnants of war........................................................ 54Lessons learned........................................................................... 69From screening to assessment.................................................. 70PERSPECTIVEFrom pioneer to advocate for inclusionNancy Maguire.............................................................................. 4Living <strong>with</strong> albinism, discrimination and superstitionMichael Hosea............................................................................... 6I want good memoriesNicolae Poraico.............................................................................. 8For deaf young people, language is the keyKrishneer Sen.............................................................................. 20My son HanifMohammad Absar ...................................................................... 30The new normalClaire Halford............................................................................... 34Adjusting, adapting and empoweringYahia J. Elziq................................................................................ 38Segregation and abuse in institutionsEric Rosenthal and Laurie Ahern............................................... 46One bite of the elephant at a timeChaeli Mycroft.............................................................................. 60From invisibility to inclusion forindigenous children <strong>with</strong> disabilitiesOlga Montufar Contreras............................................................ 72Open the doors to education – and employmentIvory Duncan................................................................................ 78End the ‘book famine’ <strong>with</strong> bettertechnology, attitudes and copyright lawKartik Sawhney............................................................................ 82<strong>Children</strong> <strong>with</strong> disabilities anduniversal human rightsLenín Voltaire Moreno Garcés.................................................... 86Additional Focus and Perspective essays are available online at.FIGURESEstimated rates of primary schoolcompletion........................ 12Community-based rehabilitation............................................... 16Assistive technology products................................................... 19<strong>Children</strong> <strong>with</strong> disabilities and secondary education............... 42Last to benefit.............................................................................. 43Child casualties in countries heavily affected bymines and explosive remnants of war, 2011............................ 56Child casualties in the most affectedcountries (1999–2011)................................................................. 57Child casualties by type of explosive........................................ 59Four case studies: Percentage of populationreporting some form of disability.............................................. 64Convention on the Rights of Persons <strong>with</strong> <strong>Disabilities</strong>and Optional Protocol: Signatures and ratifications............... 76REFERENCES........................................................................ 88STATISTICAL TABLES................................................. 93Overview...................................................................................... 94Under-five mortality rankings.................................................... 99Table 1. Basic indicators........................................................... 100Table 2. Nutrition....................................................................... 104Table 3. Health........................................................................... 108Table 4. HIV/AIDS...................................................................... 112Table 5. Education..................................................................... 116Table 6. Demographic indicators............................................. 120Table 7. Economic indicators................................................... 124Table 8. Women......................................................................... 128Table 9. Child protection........................................................... 132Table 10. The rate of progress................................................. 136Table 11. Adolescents............................................................... 140Table 12. Disparities by residence........................................... 144Table 13. Disparities by household wealth............................. 148Table 14. Early childhood development.................................. 152A NOTE ON TERMSConventions, optional protocols, signatures andratifications................................................................................ 154v
Victor, a 13-year-old <strong>with</strong> cerebral palsy, has fun in the water in Brazil. © Andre Castro/2012
CHAPTER 1INTRODUCTIONReports such as this typically begin <strong>with</strong> a statisticdesigned to highlight a problem. The girls and boys towhom this edition of The State of the World’s <strong>Children</strong>is dedicated are not problems.Rather, each is a sister, brother or friend who hasa favourite dish, song or game; a daughter or son<strong>with</strong> dreams and the desire to fulfil them; a child<strong>with</strong> a disability who has the same rights as anyother girl or boy.Given opportunities to flourish as others might,children <strong>with</strong> disabilities have the potential tolead fulfilling lives and to contribute to thesocial, cultural and economic vitality of theircommunities – as the personal essays in thisvolume attest.Yet surviving and thriving can be especiallydifficult for children <strong>with</strong> disabilities. They areat greater risk of being poor than peers <strong>with</strong>outdisabilities. Even where children share the samedisadvantages – of poverty or membership in aminority group, say – children <strong>with</strong> disabilitiesconfront additional challenges as a result of theirimpairments and the many barriers that societythrows in their way. <strong>Children</strong> living in poverty areamong the least likely to enjoy the benefits of educationand health care, for example, but childrenwho live in poverty and have a disability are evenless likely to attend their local school or clinic.In many countries, responses to the situationof children <strong>with</strong> disabilities are largely limitedto institutionalization, abandonment or neglect.These responses are the problem, and they arerooted in negative or paternalistic assumptionsof incapacity, dependency and difference that areperpetuated by ignorance. Unless this changes,children <strong>with</strong> disabilities will continue to have theirrights neglected; to experience discrimination,violence and abuse; to have their opportunitiesrestricted; to be excluded from society.What is needed is a commitment to thesechildren’s rights and their futures, giving priorityto the most disadvantaged – as a matter of equityand for the benefit of all.From exclusion to inclusion<strong>Children</strong> <strong>with</strong> disabilities encounter differentforms of exclusion and are affected by them tovarying degrees, depending on factors such asthe type of disability they have, where they liveand the culture or class to which they belong.Gender is also a crucial factor: Girls are lesslikely than boys to receive care and food and aremore likely to be left out of family interactionsand activities. Girls and young women <strong>with</strong>disabilities are ‘doubly disabled’. They confrontnot only the prejudice and inequities encounteredby many persons <strong>with</strong> disabilities, but are alsoconstrained by traditional gender roles andbarriers. 1 Girls <strong>with</strong> disabilities are also less likelyto get an education, receive vocational training orfind employment than are boys <strong>with</strong> disabilitiesor girls <strong>with</strong>out disabilities. 2INTRODUCTION1
At the heart of these differing forms and degreesof exclusion, however, lies the shared experienceof being defined and judged by what one lacksrather than by what one has. <strong>Children</strong> <strong>with</strong> disabilitiesare often regarded as inferior, and this exposesthem to increased vulnerability: Discriminationbased on disability has manifested itself in marginalizationfrom resources and decision-making, andeven in infanticide. 3Exclusion is often the consequence of invisibility.Few countries have reliable information on howmany of their citizens are children <strong>with</strong> disabilities,what disabilities they have or how thesedisabilities affect their lives. In some countries,families raising children <strong>with</strong> disabilities faceostracism. Because of this, even loving parentsand family members can be reluctant to reportthat a child of theirs has a disability – whetherbecause they are trying to avoid being shunned,because they are being overprotective of thechild, or both. If the child is born <strong>with</strong> an impairment,its birth might not even be registered.<strong>Children</strong> excluded in this way are unknown to,and therefore cut off from, the health, educationand social services to which they are entitled.Childhood deprivations can have lasting effects– by limiting access to gainful employment orparticipation in civic affairs later in life, forexample. Conversely, access to and use ofsupportive services and technology can positiona child <strong>with</strong> a disability to take her or hisplace in the community and contribute to it.Indeed, the future is far from grim. Effectivemeans are available to build inclusive societiesin which children <strong>with</strong> and <strong>with</strong>out disabilitiescan enjoy their rights equally. Physical, attitudinaland political barriers are being dismantled,although the process is uneven and has farto go.Rahmatuallah, 14, who lost his leg in a landmine explosion, takes part in a training workshop for electricians at a centre forwar-affected children in Kandahar, Afghanistan. © UNICEF/AFGA2007-00420/Noorani2THE STATE OF THE WORLD’S CHILDREN 2013: <strong>Children</strong> <strong>with</strong> <strong>Disabilities</strong>
Under the Convention on the Rights of theChild (CRC) and the Convention on the Rights ofPersons <strong>with</strong> <strong>Disabilities</strong> (CRPD), governmentsaround the world have taken upon themselvesthe responsibility of ensuring that all children,irrespective of ability or disability, enjoy theirrights <strong>with</strong>out discrimination of any kind. As ofFebruary 2013, 193 countries had ratified the CRCand 127 countries and the European Union hadratified the CRPD.These two Conventions bear witness to a growingglobal movement dedicated to the inclusionof children <strong>with</strong> disabilities in community life.Concern for inclusion is rooted in the recognitionthat all children are full members of society: thateach child is a unique individual who is entitledto be respected and consulted, who has skillsand aspirations worth nurturing and needs thatdemand fulfilment and whose contributions areto be valued and encouraged. Inclusion requiressociety to make physical infrastructure, informationand the means of communication accessibleso all can use them, to eliminate discriminationso none is forced to suffer it and to provide protection,support and services so every child <strong>with</strong>a disability is able to enjoy her or his rights asdo others.Inclusion goes beyond ‘integration’. The latterimplies that children <strong>with</strong> disabilities are to bebrought into a pre-existing framework of prevailingnorms and standards. In the context ofeducation, for example, integration might beattempted simply by admitting children <strong>with</strong>disabilities to ‘regular’ schools. This would fallshort of inclusion, which is possible only whenschools are designed and administered so thatall children can experience quality learning andrecreation together. This would entail providingstudents <strong>with</strong> disabilities <strong>with</strong> such neededaccommodations as access to Braille, signlanguage and adapted curricula that allowthem equal opportunity to learn and interact.Inclusion benefits everyone. To continue <strong>with</strong> theexample of education, ramps and wide doorwaysOn the numbersBy one widely used estimate, some 93 million children– or 1 in 20 of those aged 14 or younger – live <strong>with</strong> amoderate or severe disability of some kind.Such global estimates are essentially speculative. Theyare dated – this one has been in circulation since 2004– and derived from data of quality too varied and methodstoo inconsistent to be reliable. In order to providea context for and illustrate the issues under discussion,this report presents the results of national surveys andindependent studies, but even these must be interpreted<strong>with</strong> caution and should not be compared to oneanother. This is because definitions of disabilitydiffer by place and time, as do study design, methodologyand analysis. These issues, and promising initiativesaimed at improving the quality and availabilityof data, are discussed in Chapter 6 of this report.can enhance access and safety for all children,teachers, parents and visitors in a school, notjust those who use wheelchairs. And an inclusivecurriculum – one that is child-centred and thatincludes representations of persons <strong>with</strong> disabilitiesin order to reflect and cater to a true crosssection of society – can broaden the horizons notonly of children whose disabilities would otherwiselimit their ambitions or options, but also ofthose <strong>with</strong>out disabilities who stand to gain anappreciation of diversity and of the skills and preparednessnecessary to build a society inclusiveof all. Where educational attainment leads to a jobor other means of earning a living, the child <strong>with</strong>a disability is able to advance and to take her orhis place as a full and equal member of the adultworld, one who produces as well as consumes.A framework for action<strong>Children</strong> <strong>with</strong> disabilities should not be treated orregarded simply as the recipients of charity. Theyhave the same rights as others – among these,the right to life and to the opportunities that flowfrom good health care, nutrition and education,(continued on p. 9)INTRODUCTION 3
PERSPECTIVEFrom pioneer to advocatefor inclusionBy Nancy MaguireNancy Maguire is a disabilityactivist from the United Kingdom.She is a qualified social worker but,after travelling abroad, decided tocampaign for the rights of people<strong>with</strong> disabilities, especially youngwomen. She has worked <strong>with</strong>disabled people’s organizationsin Asia and Southern Africa, andhopes to obtain a Master’s degreein policy and development.I was born in London in 1986and have a condition calledosteogenesis imperfecta, commonlyknown as brittle bones.Many children <strong>with</strong> brittle bonesgrow up protected – overprotected,some might say – fromany possibility of hurting themselves.My parents wanted meto be safe, but they also wantedme to have the opportunity toplay, make friends and lead asnormal a childhood as possible.In the 1980s, inclusive educationwas still a fairly new concept.Like most parents of a disabledchild, mine were advised tosend me to a special school.My mother is a teacher, andafter visiting the recommendedschool she was convinced thatit would provide a substandardeducation. My parents havealways used my older sisterKaty, who did not have a disability,to gauge what is acceptablefor me: If they thoughtsomething wasn’t good enoughfor Katy, then it wasn’t goodenough for me.I was the first child <strong>with</strong> a disabilityto attend my primaryschool, and in many ways I feltlike a guinea pig for inclusion.For example, despite having apositive attitude towards includingme in all aspects of schoollife, my teachers lacked experiencein how to adapt physicaleducation so that I could getinvolved in a meaningful way.Like most childhoods, minewasn’t always easy. I spent alot of time in hospital, and even<strong>with</strong>in an ‘inclusive’ mainstreameducation system, there weretimes when I was excluded.For example, I wasn’t allowedto go to my nursery Christmasparty because the teachers wereworried I would break a bone.Also, at high school they had aseparate table in the canteen forchildren <strong>with</strong> disabilities and theteachers could not understandwhy I refused to sit at it. Despitesetbacks and obstacles, however,I managed to flourish botheducationally and socially.I was always encouraged to trynew things. My extracurricularactivities included swimming,ballet, wheelchair tennis, dramaand singing. In many of these,I was also the only child <strong>with</strong> adisability. Interestingly, I oftenfound these groups more inclusivethan school in terms ofhow much I could participateand contribute. I felt wantedand people found creativeways for me to get involved.Nonetheless, there were manythings I found difficult to dobecause of my limited mobility.I would sometimes feel upsetbecause I couldn’t do things aswell as the other children, andas I grew older and more selfconscious,I became reluctant toput myself in situations wheremy difficulties were on show.In my teenage years a lot of myfriends went through phasesof being a ‘goth’ or a ‘rudegirl’, which involved dressingor behaving in ways designedto attract attention. Whilst theywere doing everything they4THE STATE OF THE WORLD’S CHILDREN 2013: <strong>Children</strong> <strong>with</strong> <strong>Disabilities</strong>
People <strong>with</strong> disabilities are becoming more visible in many walksof life – in politics and the media, for example. This is instrumentalin improving children’s perceptions of what they can achieve.could to stand out and be different,I was desperate to be‘normal’ and fit in. Growing up<strong>with</strong> a disability, I received a lotof attention. People in the streetwould often stare at me, makecomments and ask my parents,“What’s wrong <strong>with</strong> her?” I haddays when I was able to brush itoff, but no amount of resilienceor family support can stop thatfrom affecting you.I developed extremely low selfesteemand poor body image,made worse because I wassignificantly overweight. I foundexercise difficult, and like manygirls my age, I ate to comfortmyself. I had also internalizedthe medical terminology thatwas used to describe me – inparticular the word ‘deformed’(I had a curvature of the spine,since corrected). When I was 14,I developed an eating disorder,partly because I wanted to loseweight – but also because myweight felt like one aspect of myphysical appearance that I couldactually control.Although I had incrediblysupportive family and friends,being disabled was never somethingI viewed as a positivething. I thought I had to overcomeit, like adversity. I becameobsessed <strong>with</strong> being as ‘undisabled’as possible, and I wasconvinced that if I could walk,my life would be a lot better.Ironically, although I no longeruse a wheelchair, in many waysI feel more aware of my disabilitythan ever. People still make commentsabout me because I havesmall stature, and make assumptionsabout my life and ability;I always have to prove myself,particularly in the workplace.Though I am not defined by mydisability, it has been pivotal inshaping who I am and whatI have achieved. Having a disabilityis now something I embrace:I no longer see it as a negativething or something I should beembarrassed about. In manyways being disabled has workedto my advantage and createdopportunities that might neverhave been available to me –like writing this article.Every child’s experience isdifferent. I come from a lowermiddle-classfamily in the UnitedKingdom, where I had accessto free health care and a goodeducation. But I strongly believethat the issues of belonging,self-esteem and aspirationtranscend such distinctions asgender, class and nationality.To develop a greater sense ofself-worth, children <strong>with</strong>disabilities need the opportunityto participate and contribute inall aspects of their lives.People <strong>with</strong> disabilities arebecoming more visible in manywalks of life – in politics andthe media, for example. Thisis instrumental in improvingchildren’s perceptions of whatthey can achieve. When I wasgrowing up, the only role modelI had was Stevie Wonder.I admired him because he wasa successful and respectedmusician despite being blind.However, it would have helpedme to see people <strong>with</strong> disabilitiesdoing everyday jobs – asteachers, doctors or shopkeepers.I think that would also havehelped my parents. My mumsaid that when I was a child,she tried not to think aboutmy future because it made herscared. She knew that I wascapable but feared that myoptions would be limited.As it turns out, my disability hasnot prevented me from achievingany of the important things.I am a qualified social worker,passed my driving test whenI was 16, left home when I was19 and have lived and workedin Asia and Africa. In the futureI hope to be an advocate forchildren <strong>with</strong> disabilities on aninternational level, as I passionatelybelieve in the inalienablehuman rights and untappedpotential of these children.INTRODUCTION5
PERSPECTIVELiving <strong>with</strong> albinism,discrimination and superstitionBy Michael Hoseato protect my eyes. I also havetroubles at school. SometimesI can’t see the blackboard, andI always have to sit in theshade. This country doesnot have sufficient visionenhancingtechnology, suchas glasses, magnifiers andspecial computer equipment,and <strong>with</strong>out it children <strong>with</strong>albinism have a hard timegraduating from school andfinding employment. My familyis poor, so getting money forschool fees is also difficult.Michael Hosea was born in 1995.He is the eldest of six children andone of three persons <strong>with</strong> albinismin his immediate family. He livesin Dodoma, United Republic ofTanzania, and is about to graduatefrom school. He advocates forthe rights of young people <strong>with</strong>disabilities, particularly those <strong>with</strong>albinism, through the LeonardCheshire Disability Young Voicesnetwork.I was born in Mwanza, thesecond largest city in theUnited Republic of Tanzania.I am the eldest son and live<strong>with</strong> my siblings and parents inDodoma, the capital. There aresix children in our family; oneof my sisters and one of mybrothers are also albinos.The impairments caused bymy condition make life verydifficult. I always have trouble<strong>with</strong> the sun and have to coverup <strong>with</strong> heavy, long-sleevedclothing and wear sunglassesLife is complicated even moreby the way people treat us.There is a lot of discriminationagainst people <strong>with</strong> albinism,and I sometimes lack the companyof friends. Some peoplealso believe horrible mythsabout us: that we are nothuman and never die, thatalbinism is a curse from thegods and that anyone whotouches us will be cursed.Worst of all, practitioners ofwitchcraft hunt and kill us touse our hair, body parts andorgans in charms and potions.For centuries some peoplehave believed that if they goto a witch doctor <strong>with</strong> albino6THE STATE OF THE WORLD’S CHILDREN 2013: <strong>Children</strong> <strong>with</strong> <strong>Disabilities</strong>
Education is the key to stopping the murder, abuse anddiscrimination. It is important that others – even members ofmy extended family – learn that we are people just like them.body parts, they will becomerich and prosperous. Eventhough it is illegal to kill people<strong>with</strong> albinism, it still happens –it’s greed that makes peopledo it. But it’s all based on lies:There are people who havedone these terrible things, yettheir lives have remainedthe same.A few months ago, thanks to afriend of my father, my siblingsand I escaped being the victimsof murder for witchcraft. Myfather’s friend came to warn himthat his three albino childrenwere in danger of being hunted,and he begged my father toleave Mwanza. This wasn’t easybecause my parents’ financialsituation was not good, but wepacked up everything and leftat 3 a.m. that night.We travelled over 500 kilometresto Dodoma and after twodays received news from homethat people had broken into ourhouse in Mwanza looking tokill us.When these people found thatwe had escaped, they wentto our next-door neighbour’shouse. He was our local albinorepresentative and had done somuch to help us and advocatefor albino rights in our community.They cut off his genitalsand arms, and left him there todie. We later received a phonecall from another neighbourtelling us what they did to him.This news hurt me so muchthat I cried a lot, but whatcould I do? This is the waythings are.I don’t understand why peopledo such things to fellow humanbeings. But I think education isthe key to stopping the murder,abuse and discrimination. It isimportant that others – evenmembers of my extendedfamily – learn that we arepeople just like them. Weare all the same.To escape life’s difficulties, I loveto write songs and sing. I havejust written a song about albinosand our struggle. My dream isto one day be able to record mymusic in a studio and spreadmy message. I pray that peoplearound the world can one dayunderstand that albinos are nodifferent from them. We are allhuman beings and deserve to betreated <strong>with</strong> love and respect.Note:Albinism is a rare, geneticallyinherited condition found in allethnicities. People <strong>with</strong> albinismhave little or no pigmentation intheir eyes, hair and skin owing to alack of melanin. They are sensitive tobright light and have a higher thanaverage risk of skin cancer from sunexposure. Most people <strong>with</strong> albinismare also visually impaired. Underthe Same Sun, a Canadian nongovernmentalorganization, estimatesthat albinism affects 1 in 2,000Tanzanians. Although the medicalcondition itself does not affect lifeexpectancy, in the United Republicof Tanzania the average lifespanof a person <strong>with</strong> albinism is around30 years.INTRODUCTION 7
PERSPECTIVEI want good memoriesBy Nicolae PoraicoNicolae Poraico and his brotherGrisha spent several years in aresidential home for children <strong>with</strong>mental disabilities in the Republicof Moldova. Nicolae was diagnosed<strong>with</strong> a moderate intellectualdisability and his brother <strong>with</strong> asevere intellectual disability. In2010 Nicolae and Grisha reunited<strong>with</strong> their mother in the villageof Lapusna. This was madepossible <strong>with</strong> the assistance ofthe Community for All – Moldovaprogramme, which is implementedby the Keystone Human ServicesInternational Moldova Association<strong>with</strong> financial support from theOpen Society Mental HealthInitiative and the Soros FoundationMoldova.I was 11 when I went to the institution<strong>with</strong> my brother Grisha. Iam now 16. Our mother sent usthere because we did not haveenough money to buy or renta house, and she had to worknights. She came to see us often.I do not remember the day Iwent to the institution. I evenforgot some of my memories ofbeing there, and I hope in time Iwill forget the other ones. I wantnew memories, good memories.At holidays the food was good. Itwas also good on other days; wewere fed four times a day. Aftereating I cleaned the kitchen.The teachers taught us to recitepoems and sing songs andshowed us different games.I know a poem about Gigeland two about Mother.We had naptime from 1 to4 p.m. I would not sleep:I laughed, talked to other boys.I put my head on the pillow, keptmy eyes open and looked at theboys. We were all living in oneroom, all 16 boys from my class.There was one boy, Victor. Heworked in the kitchen. We wentto the stadium nearby. He tookjust me to the stadium; he hadbread and sour milk, and we atetogether. When my mother tookme and my brother home, Victordid not know as he was sleeping.He gave me his picture so Iwould not forget him, but I forgotit there.Sometimes the staff beat us. Ido not know why. They beat meso much <strong>with</strong> different sticksthat my back was injured. I wasnot the only one. Other boyswere injured, too. And someboys had knives. Some boys hitothers, and sometimes I fought<strong>with</strong> them, <strong>with</strong> fists. Whatcould I do? If I did not defendmyself, they could kill me. Theybeat Grisha, but I defended him.I didn’t want to stay there. If mymother had left us there, theadministration could have sentus to different families and mymother would never find us. ButI want to visit the institution, justto see Victor and take his phonenumber.At home, it is very good.I now play <strong>with</strong> Colea, Igorand Dima. Here, nobody beatsme. Sometimes we discussproblems <strong>with</strong> our motherand ask for advice. We getalong very well and I go toschool every day. I like physicaleducation and Romanianlanguage classes. I am gladI came here. I am happy thatI am in Lapusna.8THE STATE OF THE WORLD’S CHILDREN 2013: <strong>Children</strong> <strong>with</strong> <strong>Disabilities</strong>
(continued from p. 3)the right to express their views and participatein making decisions, and the right to enjoy equalprotection under the law. They belong at thecentre of efforts to build inclusive and equitablesocieties – not only as beneficiaries, but asagents of change. After all, who is in a betterposition to comprehend their needs and evaluatethe response?In any effort to promote inclusion and fairness,children <strong>with</strong> disabilities should be able to enlistthe support of their families, disabled people’sorganizations, parents’ associations and communitygroups. They should also be able tocount on allies further afield. Governments havethe power to help by aligning their policies andprogrammes <strong>with</strong> the spirit and stipulations ofthe CRPD, CRC and other international instrumentsthat address or affect child disability.International partners can provide assistancecompatible <strong>with</strong> the Conventions. Corporationsand other entities in the private sector canadvance inclusion – and attract the best talent– by embracing diversity in hiring.The research community is working to improvedata collection and analysis. Their work will helpto overcome ignorance and the discriminationthat often stems from it. Furthermore, becausedata help to target interventions and gauge theireffects, better collection and analysis helps inensuring an optimal allocation of resources andservices. But decision-makers need not wait forbetter data to begin building more inclusive infrastructureand services: As some have alreadyfound, inclusion involves and benefits entirecommunities, and its elements can be applied tonew projects across the board. All that is neededis for these efforts to remain flexible so they canbe adapted as new data come to light.promise – are dedicated to specific aspects ofthe lives of children <strong>with</strong> disabilities. Chapter 3examines the health, nutritional and educationalservices that can provide a strong foundationon which children <strong>with</strong> disabilities can buildfull and fulfilling lives. Chapter 4 explores theopportunities and challenges of ensuring legalrecognition and protection against exploitationor abuse. Chapter 5 discusses inclusion in thecontext of humanitarian crises.Many of the deprivations endured by children<strong>with</strong> disabilities stem from and are perpetuatedby their invisibility. Research on child disabilityis woefully inadequate, especially in low- andmiddle-income countries. The resulting lack ofevidence hinders good policymaking and servicedelivery for children who are among the mostvulnerable. Therefore, Chapter 6 of this reportexamines the challenges and opportunitiesconfronting researchers – and ways in whichchildren <strong>with</strong> disabilities can be rendered visiblethrough sound data collection and analysis.Chapter 7, which concludes this edition of TheState of the World’s <strong>Children</strong>, outlines necessaryand feasible actions that will enable governments,their international partners, civil societyand the private sector to advance equity throughthe inclusion of children <strong>with</strong> disabilities.The next chapter of this report discusses exclusionand the factors that propagate it, along <strong>with</strong>some philosophical and practical fundamentalsof inclusion. Subsequent chapters – each ofwhich applies the same approach of exploringbarriers as well as solutions that showWenjun, 9, walks <strong>with</strong> her foster mother in China.© UNICEF/China/2010/LiuINTRODUCTION9
<strong>Children</strong> <strong>with</strong> and <strong>with</strong>out disabilities participate in school festivities in Bangladesh. © UNICEF/BANA2007-00655/Siddique
CHAPTER 2FUNDAMENTALS OFINCLUSIONAdopting an approach grounded in respect for the rights,aspirations and potential of all children can reduce thevulnerability of children <strong>with</strong> disabilities to discrimination,exclusion and abuse.The Convention on the Rights of the Child (CRC)and the Convention on the Rights of Persons <strong>with</strong><strong>Disabilities</strong> (CRPD) challenge charitable approachesthat regard children <strong>with</strong> disabilities as passiverecipients of care and protection. Instead, theConventions demand recognition of each childas a full member of her or his family, communityand society. This entails a focus not on traditionalnotions of ‘rescuing’ the child, but on investmentin removing the physical, cultural, economic, communication,mobility and attitudinal barriers thatimpede the realization of the child’s rights – includingthe right to active involvement in the makingof decisions that affect children’s daily lives.It is often said that when you change, the worldchanges. Underestimation of the abilities ofpeople <strong>with</strong> disabilities is a major obstacle totheir inclusion. It exists not only in society atlarge but also in the minds of professionals,politicians and other decision-makers. It can alsooccur in families, among peers and in individuals<strong>with</strong> a disability, especially in the absence of evidencethat they are valued and supported in theirdevelopment. Negative or ill-informed attitudes,from which stem such deprivations as the lack ofreasonable accommodation for children <strong>with</strong>disabilities, remain among the greatest obstaclesto achieving equality of opportunity.Negative social perceptions may result in children<strong>with</strong> disabilities having fewer friends andbeing isolated or bullied, their families experiencingadditional stress, and their communitiestreating them as outsiders. Early studiesof the way children <strong>with</strong> disabilities are treatedby their peers have found that even at the preschoollevel, they may be overlooked as friendsor playmates, sometimes because other childrenbelieve that they are not interested or ableto play and interact. 4 A survey of families ofchildren <strong>with</strong> disabilities in the United Kingdomfound that 70 per cent thought that understandingand acceptance of disability among theircommunity was poor or unsatisfactory, andalmost half encountered problems in accessingsuch support services as childcare. 5 Accordingto a 2007 UK study involving children <strong>with</strong> specialeducational needs, 55 per cent said thatthey had been treated unfairly because of theirdisability. 6 In Madagascar, one study found thatignorance about disability was common amongparents – and that even among the presidentsof parents’ associations, 48 per cent believed,mistakenly, that disability is contagious. 7 A2009 study in the Vietnamese city of Da Nangreported that although the community adoptedgenerally tolerant attitudes towards children<strong>with</strong> disabilities and their families, instancesof stigmatization and discrimination persisted.The appearance of children <strong>with</strong> disabilities inpublic on such holidays as Tet, which marks thenew lunar year, was considered detrimental togood fortune. 8FUNDAMENTALS OF INCLUSION11
It is no wonder, then, that children <strong>with</strong> disabilitiesare among the most vulnerable to low selfesteemand feelings of isolation. No child shouldbe defined by a disability. Each child is uniqueand has the right to be respected as such. Whensocieties embrace inclusive principles and demonstratethis support for equity in practice, children<strong>with</strong> disabilities are able to enjoy the samerights and choices as other children. Enablingparticipation in the community and providingeducational, cultural and recreational options isof paramount importance for the healthy physicaland intellectual development of every child.Where specialized support – for communicationsor mobility, for example – is needed to facilitateinteraction and promote self-reliant participationin everyday activities, access should be free andavailable to all.Changing attitudesLittle will change in the lives of children <strong>with</strong>disabilities until attitudes among communities,professionals, media and governments begin toEstimated rates of primaryschool completion<strong>with</strong>disability<strong>with</strong>outdisability<strong>with</strong>disability<strong>with</strong>outdisability42%51%53%Source: World Health Organization, based on surveys in 51 countries.61%change. Ignorance about the nature and causesof impairments, invisibility of the children themselves,serious underestimation of their potentialand capacities, and other impediments to equalopportunity and treatment all conspire to keepchildren <strong>with</strong> disabilities silenced and marginalized.Major public awareness campaigns thatare sponsored by governments, include childrenas key presenters and are supported by all civilsociety stakeholders can inform, challenge andexpose these barriers to the realization of rights.Furthermore, parents and disabled persons’ organizationscan – and often do – play pivotal rolesin campaigning for acceptance and inclusion.Bringing disability into political and social discoursecan help to sensitize decision-makers andservice providers, and demonstrate to society atlarge that disability is ‘part of the human condition’.9 The importance of involving children <strong>with</strong>disabilities cannot be overstated. Prejudice canbe effectively reduced through interaction, andactivities that bring together children <strong>with</strong> and<strong>with</strong>out disabilities have been shown to fostermore positive attitudes. 10 Social integration benefitseveryone. It follows that if societies seekto reduce inequalities, they should start <strong>with</strong>children who are best fitted to build an inclusivesociety for the next generation. <strong>Children</strong> whohave experienced inclusive education, forexample, can be society’s best teachers.Inclusive media also have a key part to play.When children’s literature includes children andadults <strong>with</strong> disabilities, it sends out positive messagesthat they are members of families andneighbourhoods. It is important for membersof all groups, and especially those that may bediscriminated against on the grounds of race,gender, ethnicity or disability, to be included instories and textbooks for children – not necessarilyas the main protagonists but simply tonote their presence and participation. Books, filmand media portrayal play an important role inteaching children about social norms. Just as theportrayal of girl characters in mainstream children’smedia carries implicit notions of gender12THE STATE OF THE WORLD’S CHILDREN 2013: <strong>Children</strong> <strong>with</strong> <strong>Disabilities</strong>
hierarchy and traditional expectations of gender,so the routine absence, misrepresentation orstereotyping of people <strong>with</strong> disabilities createsand reinforces social prejudices and leads to theunderestimation of the roles and place of people<strong>with</strong> disabilities in society.Similarly, participation in social activities helpsto promote a positive view of disability. Sport, inparticular, has helped overcome many societalprejudices. Physical activity can be a powerfulmeans of promoting respect – it is inspirationalto see a child surmount the physical and psychologicalbarriers to participation, including lackof encouragement and support or limited adaptiveequipment. In one study, physically activechildren <strong>with</strong> disabilities were rated as morecompetent than their non-disabled counterparts. 11However, care must be taken not to create anartificial atmosphere in which children <strong>with</strong> disabilitieswho demonstrate physical heroism aredeemed worthy and those who do not are madeto feel inferior.Sport has also been helpful in campaigns toreduce stigma. Athletes <strong>with</strong> disabilities areoften among the most recognized representativesof people <strong>with</strong> disabilities, and many usesuch platforms as the Paralympics and SpecialOlympics to campaign and to become rolemodels for children <strong>with</strong> physical or intellectualimpairments. Moreover, experiences in Bosniaand Herzegovina, the Lao People’s DemocraticRepublic, Malaysia and the Russian Federationshow that access to sport and recreation is notonly of direct benefit to children <strong>with</strong> disabilitiesbut also helps to raise their standing in the communityas they are seen to participate alongsideother children in activities valued by society. 12Encouraging children <strong>with</strong> disabilities to takepart in sport and recreation in company <strong>with</strong> alltheir peers is more than a matter of changingattitudes. It is a right and a specific requirementof the CRPD, which instructs States parties to“ensure that children <strong>with</strong> disabilities have equalaccess <strong>with</strong> other children to participation in play,It’s about abilityMontenegro’s ‘It’s About Ability’ campaign waslaunched in September 2010 and has had an impact onthe public’s knowledge of and attitudes and practicestowards children <strong>with</strong> disabilities. The campaign bringstogether a broad coalition of 100 national and internationalorganizations ranging from the Governmentof Montenegro to the European Union, the Council ofEurope, the Organization for Security and Co-operationin Europe, United Nations agencies, embassies, associationsof parents of children <strong>with</strong> disabilities, printand electronic media, the private sector, local officialsand children <strong>with</strong> and <strong>with</strong>out disabilities. One of thecampaign’s strategies involved the use of billboards allover the country to show children <strong>with</strong> disabilities asactive members of society, portraying them as athletes,friends, musicians, dancers, students, daughters, sons,brothers and sisters.A November 2011 survey measuring the impact of thecampaign reported that it contributed to an 18 percent increase in the number of people who considerchildren <strong>with</strong> disabilities as equal members of society.Behaviour toward children <strong>with</strong> disabilities andcommunication between them and people <strong>with</strong>outdisabilities were also seen to improve.recreation and leisure and sporting activities,including those activities in the school system.”Supporting children andtheir familiesThe CRPD underlines the role of the family as thenatural unit of society and the role of the Statein supporting the family. It says that “persons<strong>with</strong> disabilities and their family members shouldreceive the necessary protection and assistanceto enable families to contribute towards the fulland equal enjoyment of the rights of persons<strong>with</strong> disabilities.” 13The process of fulfilling the rights of a child <strong>with</strong>a disability – of including that child in communityFUNDAMENTALS OF INCLUSION13
Social protection for children <strong>with</strong> disabilitiesand their families is especially important becausethese families often face a higher cost of livingand lost opportunities to earn income.Estimates of the additional costs of disabilityborne by families range from 11–69 per centof income in the United Kingdom to 29–37 percent in Australia, 20–37 per cent in Ireland, 9 percent in Viet Nam and 14 per cent in Bosnia andHerzegovina. 14 Costs associated <strong>with</strong> disabilityinclude such direct expenses as medical treatment,travel, rehabilitation or assistance <strong>with</strong>care, and such opportunity costs as the incomeforgone when parents or family members giveup or limit their employment to care for a child orchildren <strong>with</strong> disabilities. 15Marmane, 8, looks over her shoulder in a rehabilitationcentre run by the international non-governmentalorganization Médecins sans Frontières in Port-au-Prince,Haiti. © UNICEF/HQ2005-1970/LeMoynelife – begins <strong>with</strong> establishing a home settingconducive to early intervention. It involves stimulationand interaction <strong>with</strong> parents and caregiversfrom the first days and weeks of life through thedifferent stages of the child’s educational andrecreational development. Inclusion is importantat all ages but the earlier children <strong>with</strong> disabilitiesare given the chance to interact <strong>with</strong> peers andthe larger society, the greater the likely benefitsfor all children.Under the CRPD, children <strong>with</strong> disabilities andtheir families have the right to an adequate standardof living, including adequate food, clothingand housing. <strong>Children</strong> <strong>with</strong> disabilities and thoseresponsible for their care are also entitled to suchsubsidized or free support services as day care,respite care and access to self-help groups.The International Labour Organization has estimatedthat in 10 low- and middle-income countries,the economic costs of disability amount to3–5 per cent of gross domestic product. 16 A reviewof 14 developing countries found that people<strong>with</strong> disabilities were more likely to experiencepoverty than those <strong>with</strong>out disabilities. 17 People<strong>with</strong> disabilities tended to be less well off in termsof education, employment, living conditions,consumption and health. In Malawi and Uganda,households <strong>with</strong> members who have disabilitieshave been found more likely to be poorer thansimilar households <strong>with</strong>out disabled members. 18Households <strong>with</strong> members <strong>with</strong> disabilities generallyhave lower incomes than other householdsand are at greater risk of living below the povertyline. 19 In developing countries, households <strong>with</strong> amember or members who have disabilities spendconsiderably more on health care. 20 This meansthat even a household that technically standsabove the poverty line but includes a memberor members <strong>with</strong> disabilities can actually havea standard of living equivalent to that of a householdbelow the poverty line but <strong>with</strong>out members<strong>with</strong> disabilities.The evidence is clear that childhood disabilitydiminishes a person’s life chances. <strong>Children</strong> <strong>with</strong>disabilities grow up poorer, have less access14THE STATE OF THE WORLD’S CHILDREN 2013: <strong>Children</strong> <strong>with</strong> <strong>Disabilities</strong>
to education and health-care services, and areworse off on a host of measures including thelikelihood of family break-up and abuse.States can tackle the consequent, increased risk ofchild poverty <strong>with</strong> such social protection initiativesas cash transfer programmes. These programmesare relatively easy to administer and provide forflexibility in meeting the particular needs of parentsand children. They also respect the decisionmakingrights of parents and children.Cash transfer programmes have been shownto benefit children, 21 although it can be difficultto gauge the extent to which they are usedby and useful to children <strong>with</strong> disabilities andthose who care for them. 22 A growing number oflow- and middle-income countries are buildingon promising results from these broader effortsand have launched targeted social protectioninitiatives that include cash transfers specificallyfor children <strong>with</strong> disabilities. These countriesinclude Bangladesh, Brazil, Chile, India, Lesotho,Mozambique, Namibia, Nepal, South Africa,Turkey and Viet Nam, among others. The typeof allowances and criteria for receiving themvary greatly. Some are tied to the severity ofthe child’s impairment. Routine monitoring andevaluation of the transfers’ effects on the health,educational and recreational attainment of children<strong>with</strong> disabilities will be essential to makesure these transfers achieve their objectives.Another tool governments can use is disabilityspecificbudgeting. For instance, a governmentthat has committed to ensuring that all childrenreceive free, high-quality education would includespecific goals regarding children <strong>with</strong> disabilitiesfrom the outset and take care to allocate a sufficientportion of the available resources to coveringsuch things as training teachers, making infrastructureand curricula accessible, and procuringand fitting assistive devices.Effective access to services including education,health care, habilitation (training and treatmentto carry out the activities of daily living), rehabilitation(products and services to help restoreA young boy <strong>with</strong> albinism reads Braille at school in the town of Moshi, United Republic of Tanzania.© UNICEF/HQ2008-1786/PirozziFUNDAMENTALS OF INCLUSION15
function after an impairment is acquired) andrecreation should be provided free of charge andbe consistent <strong>with</strong> promoting the fullest possiblesocial integration and individual development ofthe child, including cultural and spiritual development.Such measures can promote inclusion insociety, in the spirit of Article 23 of the CRC, whichstates that a child <strong>with</strong> a disability “should enjoya full and decent life, in conditions which ensuredignity, promote self-reliance and facilitate thechild’s active participation in the community.” 23States parties to the CRPD have obligatedthemselves to take action to eliminate discriminationagainst children <strong>with</strong> disabilities andto make their inclusion in society a priority.Comprehensive national strategies <strong>with</strong> measurableoutcomes will make it more likely forall children to realize their rights. Internationalcooperation and exchange of information andtechnical assistance – including advances inteaching or community-based approaches toearly intervention – could further these aims.Development assistance programmes focusingon children can help by taking into account theneeds of children <strong>with</strong> disabilities and their families,particularly in low-income settings wheresystems to protect and promote the rights ofchildren <strong>with</strong> disabilities may be weak.Services for children <strong>with</strong> disabilities aredelivered by a range of government andnon-governmental institutions. Appropriatemulti-sectoral coordination involving familymembers would help to avoid gaps in provisionand should be attuned to changes in the child’scapacities and needs as she or he grows andexperiences life.Community-based rehabilitationCommunity-based rehabilitation (CBR) programmesare designed and run by local communities.CBR seeks to ensure that people <strong>with</strong>Community-based rehabilitationCBRMATRIXHEALTH EDUCATION LIVELIHOOD SOCIAL EMPOWERMENTPROMOTIONEARLYCHILDHOODSKILLSDEVELOPMENTPERSONALASSISTANCEADVOCACY &COMMUNICATIONPREVENTIONPRIMARYSELF-EMPLOYMENTRELATIONSHIPSMARRIAGE &FAMILYCOMMUNITYMOBILIZATIONMEDICAL CARESECONDARY &HIGHERWAGEEMPLOYMENTCULTURE &ARTSPOLITICALPARTICIPATIONREHABILITATIONASSISTIVEDEVICESNON-FORMALLIFELONGLEARNINGFINANCIALSERVICESSOCIALPROTECTIONRECREATION,LEISURE &SPORTSJUSTICESELF-HELPGROUPSRECREATION,LEISURE &SPORTSSource: World Health Organization.16THE STATE OF THE WORLD’S CHILDREN 2013: <strong>Children</strong> <strong>with</strong> <strong>Disabilities</strong>
An inclusive kindergarten in Nizhny Novgorod, Russian Federation. © UNICEF/RUSS/2011/Kochinevadisabilities have equal access to rehabilitationand other services and opportunities – health,education, livelihoods. Developed by the WorldHealth Organization (WHO) in the late 1970s andearly 1980s, it is practised in more than 90 countriesand represents a move away from the concentrationof care in institutions and at the handsof specialists towards community self-reliance,collaboration and ownership in addressing theparticular needs of people <strong>with</strong> disabilities –critically, <strong>with</strong> their own active participation. 24CBR can prove effective in addressing multipledeprivations. <strong>Children</strong> <strong>with</strong> disabilities who livein rural and indigenous communities contend<strong>with</strong> multiple disadvantages: They have disabilities,they belong to a marginalized groupand they live in remote locations. They havelittle or no access to services that could ensuretheir development, protection and participationin community life. 25 An outreach initiative ledby the Centre for Research and Post-SecondaryStudies in Social Anthropology (CIESAS) inOaxaca, Mexico, provides an example of CBRfor indigenous children <strong>with</strong> disabilities, theirfamilies and community. In collaboration <strong>with</strong>UNICEF and <strong>with</strong> financing from the state welfareagency DIF-Oaxaca, CIESAS used CBR to advancethe inclusion of children <strong>with</strong> disabilities in fourremote rural communities 26 <strong>with</strong> large indigenouspopulations and low Human Development Indexscores. Teams – made up of a doctor, a physicalor occupational therapist, an educator and twocommunity activists fluent in local indigenouslanguages – were trained and sent into the communitiesto conduct workshops on discrimination,inclusion and children’s rights. They promotedthe formation of local support networksamong the families of children <strong>with</strong> disabilitiesand, where appropriate, provided referrals to medicaltreatment or therapy. During the three-yearperiod 2007–2010, the initiative led to increasedFUNDAMENTALS OF INCLUSION17
acceptance of indigenous children <strong>with</strong> disabilitiesby their own families and communities. Benefitsalso included improved provision of social services,community-led construction of wheelchairramps to make public spaces accessible, agreementby state and federal hospitals to provideservices free of charge to children <strong>with</strong> disabilitiesreferred by the project – and 32 new enrolments ofchildren <strong>with</strong> disabilities in mainstream schools. 27Assistive technologyDepending on the type of disability, a child mayneed any of a number of assistive devices andservices (see next page). According to the WorldHealth Organization, however, in many lowincomecountries only 5–15 per cent of the peoplewho need assistive technology are able to obtainit. 28 Reasons for this include costs, which can beespecially prohibitive in the case of children, whoneed their assistive devices replaced or adjustedfrom time to time as they grow. 29 <strong>Children</strong> areoften less likely than adults to access assistivetechnology. 30 The provision and uses of assistivetechnology are discussed in a Focus article publishedonline at .Universal designInclusive approaches are built around the conceptof accessibility, <strong>with</strong> the aim of making themainstream work for everyone rather than creatingparallel systems. An accessible environmentis essential if children <strong>with</strong> disabilities are toenjoy their right to participate in the community.For instance, access to all schools is necessaryif children <strong>with</strong> disabilities are to take part ineducation. <strong>Children</strong> who are educated alongsidetheir peers have a much better chance ofbecoming productive members of their societiesand of being integrated in the lives of theircommunities. 31Accessibility can refer to the design of anenvironment, product or structure. Universaldesign is defined as the design of productsLiban, 8, uses crutches after losing a leg to a bomb explosion in Mogadiscio, Somalia. © UNICEF/HQ2011-2423/Grarup18THE STATE OF THE WORLD’S CHILDREN 2013: <strong>Children</strong> <strong>with</strong> <strong>Disabilities</strong>
Assistive technology productsCategoryMobilityVisionHearingCommunicationCognitionExamples of products• Walking stick, crutch, walking frame, manual and powered wheelchair, tricycle• Artificial leg or hand, caliper, hand splint, club foot brace• Corner chair, special seat, standing frame• Adapted cutlery and cooking utensils, dressing stick, shower seat, toilet seat, toilet frame, feeding robot• Eyeglasses, magnifier, magnifying software for computer• White cane, GPS-based navigation device• Braille systems for reading and writing, screen reader for computer, talking book player, audio recorder and player• Braille chess, balls that emit sound• Headphone, hearing aid• Amplified telephone, hearing loop• Communication cards <strong>with</strong> texts, communication board <strong>with</strong> letters, symbols or pictures• Electronic communication device <strong>with</strong> recorded or synthetic speech• Task lists, picture schedule and calendar, picture-based instructions• Timer, manual or automatic reminder, smartphone <strong>with</strong> adapted task lists, schedules, calendars and audio recorder• Adapted toys and gamesSource: Johan Borg; International Organization for Standardization (2008), .and environments to be usable by all people,to the greatest extent possible, <strong>with</strong>out theneed for adaptation or specialized design.The approach focuses on design that worksfor all people regardless of age, ability orsituation.The principles of universal design were developedby architects, product designers, engineersand environmental design researchers.They cut across design disciplines and may beapplied to guide the design process or evaluateexisting designs. There are seven principles:equitable use; flexibility in use; simple andintuitive use; perceptible information; tolerancefor error; low physical effort; and sizeand space for approach and use.In practice, universal design can be found inthe form of curb cuts or sidewalk ramps, audiobooks, Velcro fastenings, cabinets <strong>with</strong> pull-outshelves, automatic doors and low-floor buses.The cost of integrating accessibility into newbuildings and infrastructure can be negligible,amounting to less than 1 per cent of the capitaldevelopment cost. 32 However, the cost of makingadaptations to completed buildings can be muchhigher, especially for smaller buildings, whereit can reach 20 per cent of the original cost. 33 Itmakes sense to integrate accessibility considerationsinto projects at the early stages of thedesign process. Accessibility should also be aconsideration when funding developmentprojects.FUNDAMENTALS OF INCLUSION19
PERSPECTIVEFor deaf young people,language is the keyBy Krishneer SenKrishneer Sen, a deaf youth activistfrom Suva, Fiji, and recipient of theWorld Deaf Leadership scholarship,is studying information technologyat Gallaudet University, UnitedStates. In 2012, he served as anintern <strong>with</strong> UNICEF Fiji.Access to information andmeans of communication areessential for anyone to realizetheir rights as a citizen. Withoutways to gather knowledge,express opinions and voicedemands, it is impossible toobtain an education, find a jobor participate in civic affairs.In my country, Fiji, lack ofaccess to information andmeans of communication arethe biggest issue facing deafchildren. Information andcommunication technology(ICT), which I am studyingat university, is helping deafpeople around the world, creatingopportunities that simplywould not have been possiblea generation ago. Where available,ICT provides deaf people<strong>with</strong> the chance to communicateand connect <strong>with</strong> friends,reduces their isolation andopens up avenues for their participationin political, economic,social and cultural life. Thosewho lack access – because theylive in rural areas, are poor orlack education, or for whomappropriately adapted devicesare not yet available – experiencefrustration and exclusion.Deaf Fijians like me havelimited access to the media,emergency services – and evensimple telephone conversations.In the absence of suchassistive technology as captionedtelephones, we mustrely on people who can hear toserve as interpreters, or resortto text messaging. This will notchange until ICT and mediapolicy for people <strong>with</strong> disabilitiesbecome a top governmentpriority.Deaf people can succeed andcontribute to society just likehearing people. Developingtheir abilities begins <strong>with</strong> educationand language. Becausedeaf children grow up in ahearing world, quality educationnecessarily means bilingualeducation. In Fiji, deafchildren should be taught FijiSign Language in additionto the languages commonlytaught to hearing Fijian children(English, Fijian and Hindi),and this should start at birth.Bilingual education helps deafchildren develop their abilityto communicate using the languagesof hearing people: Deafchildren who can communicateeffectively in sign language willfind it easier to learn other languages,like English. I believethat bilingualism will give deafchildren better access to the20THE STATE OF THE WORLD’S CHILDREN 2013: <strong>Children</strong> <strong>with</strong> <strong>Disabilities</strong>
We need to make media more accessible to deaf childrenby captioning or interpreting television programmes anddeveloping children’s programmes that use sign language.education they need to functionas equal citizens.As a kid, I used to watch cartoonprogrammes on Fijian TV<strong>with</strong> no subtitles or sign languageinterpreters. My familydidn’t know sign language well.Later on, I realized that the reasonI was still struggling <strong>with</strong>my English was that I had notbeen exclusively taught usingsigns at home. Parents havean important role in facilitatingdeaf children’s ability to communicateand access information;along <strong>with</strong> other peoplewho interact <strong>with</strong> deaf children,they need to take the initiativeand use sign language to communicatein their daily lives, athome and school.We need to make media moreaccessible to deaf children bycaptioning or interpreting televisionprogrammes and developingchildren’s programmesthat use sign language. Weneed an environment freeof communication barriers. Iwould like to see Fijian SignLanguage used in a range ofprogrammes, from news tocartoons. In addition to television,social media can providepowerful tools to enhanceknowledge about Fiji andinternational affairs and ensurethat everyone, including people<strong>with</strong> disabilities, has access toinformation about the politicalsituation and can cast aninformed vote during elections.Making ICT available to deafchildren can facilitate theirsocial and emotional development,help them learn inmainstream schools and preparethem for future employment.I took a basic computerclass at a special school, andit changed my life for the better:It was through the Internetthat I learned about GallaudetUniversity, where I now study.In addition to enhancing education,ICT provides deaf andother young people <strong>with</strong> disabilitiesto learn about theirrights and band together tocampaign for their realization.By facilitating activism, ICTmay thus help increase theprofile of persons <strong>with</strong> disabilities<strong>with</strong>in society at largeand allow them to participateactively.My dream is to see deaf peoplecommunicate freely <strong>with</strong> hearingpeople through the use ofassistive technologies. OnceI graduate, I plan to start aproject to set up communicationtechnologies in Fiji in orderto facilitate communicationbetween hearing and deaf people,using sign language interpretersas well as video calling.I will be working <strong>with</strong> the FijiAssociation for the Deaf, ofwhich I have been a memberfor many years, to advocatefor human rights, opportunitiesand equality.If the government is to considerthe needs of deaf peoplea priority, deaf people mustadvocate on our own behalf.To facilitate activism amongdeaf people, we must educatedeaf children to use both signlanguage and the languages ofthe hearing communities theylive in, and we must work toexpand access to technologiesthrough which they can findinformation and communicate<strong>with</strong> others, deaf and hearing.FUNDAMENTALS OF INCLUSION21
A teacher <strong>with</strong> a hearing impairment teaches a class of hearing-impaired children in Gulu, Uganda. © UNICEF/UGDA2012-00108/Sibiloni
CHAPTER 3A STRONGFOUNDATIONGood health, nutrition and a solid education: These arethe building blocks of life that children and their parentswant, and to which all children are entitled.Inclusive healthUnder the Convention on the Rights of theChild (CRC) and the Convention on the Rightsof Persons <strong>with</strong> <strong>Disabilities</strong> (CRPD), all childrenhave the right to the highest attainable standardof health. It follows that children <strong>with</strong> disabilitiesare equally entitled to the full spectrum of care– from immunization in infancy to proper nutritionand treatment for the ailments and injuriesof childhood, to confidential sexual and reproductivehealth information and services duringadolescence and into early adulthood. Equallycritical are such basic services as water,sanitation and hygiene.Ensuring that children <strong>with</strong> disabilities actuallyenjoy these rights on a par <strong>with</strong> others is theobjective of an inclusive approach to health. Thisis a matter of social justice and of respecting theinherent dignity of all human beings. It is alsoan investment in the future: Like other children,those <strong>with</strong> disabilities are tomorrow’s adults.They need good health for its own sake, forthe crucial role it plays in facilitating a happychildhood and for the boost it can give theirprospects as future producers and parents.ImmunizationImmunizations are a critical component ofglobal efforts to reduce childhood illness anddeath. They are among the most successful andcost-effective of all public health interventions,<strong>with</strong> the strong potential to reduce the burden ofmorbidity and mortality, particularly for childrenunder 5 years of age. For this reason, immunizationhas been a cornerstone of national and internationalhealth initiatives. More children than everbefore are being reached. One consequence hasbeen that the incidence of polio – which can leadto permanent muscle paralysis – fell from morethan 350,000 cases in 1988 to 221 cases in 2012. 34There is still a considerable way to go. In 2008,for example, over a million children under5 died from pneumococcal disease, rotavirusdiarrhoea and Haemophilus influenzae type B.Vaccination can actually prevent a large numberof these deaths. 35The inclusion of children <strong>with</strong> disabilities inimmunization efforts is not only ethical butimperative for public health and equity: Goalsof universal coverage can only be achieved ifchildren who have disabilities are included inimmunization efforts. 36While immunization is an important means ofpre-empting diseases that lead to disabilities, itis no less important for a child who already has adisability to be immunized. Unfortunately, manychildren <strong>with</strong> disabilities are still not benefitingfrom increased immunization coverage, thoughthey are at the same risk of childhood diseasesas all children. If they are left unimmunized orA STRONG FOUNDATION23
only partially immunized, the results can includedelays in reaching developmental milestones,avoidable secondary conditions and, at worst,preventable death. 37It will help to bring children <strong>with</strong> disabilitiesinto the immunization fold if efforts to promoteimmunization include them. Showing children<strong>with</strong> disabilities alongside others on campaignposters and promotional materials, for example,can help to promote awareness. Enhancingpopular understanding of the importance ofimmunizing each child also involves reachingout to parents through public health campaigns,civil society and disabled peoples’ organizations,schools and mass media.NutritionAbout 870 million people worldwide are thoughtto be undernourished. Among them, some 165million under-fives are believed to be stunted,or chronically malnourished, and more than 100million are considered underweight. Insufficientfood or a poorly balanced diet short of certainvitamins and minerals (iodine, vitamin A, ironand zinc, for example) can leave infants andchildren vulnerable to specific conditions ora host of infections that can lead to physical,sensory or intellectual disabilities. 38Between 250,000 and 500,000 children are consideredto be at risk of becoming blind each yearfrom vitamin A deficiency, a syndrome easilyprevented by oral supplementation costing justa few cents per child. 39 For a similarly minuteamount – five cents per person per year – saltiodization remains the most cost-effective wayof delivering iodine and preventing cognitiondamage in children in iodine-deficient areas. 40These low-cost measures help not only children<strong>with</strong> disabilities but also their mothers as theylabour to raise infants and children in strainedcircumstances.Doing homework in Bangladesh. © Broja Gopal Saha/Centre for Disability in Development24THE STATE OF THE WORLD’S CHILDREN 2013: <strong>Children</strong> <strong>with</strong> <strong>Disabilities</strong>
Early childhood stunting, which is measured aslow height for age, is caused by poor nutritionand diarrhoea. A multi-country study showedthat each episode of diarrhoea in the first twoyears of life contributes to stunting, 41 which isestimated to affect some 28 per cent of childrenyounger than 5 in low- and middle-incomecountries. 42 The consequences of stunting, suchas poor cognitive and educational performance,begin when children are very young but affectthem through the rest of their lives. However,community-based efforts to improve basic healthpractices have been shown to reduce stuntingamong young children. 43A combination of physical factors and attitudesmay adversely affect child nutrition. In somesocieties, mothers may not be encouraged tobreastfeed a disabled child. Stigma and discriminationmay also result in a child <strong>with</strong> a disabilitybeing fed less, denied food or provided <strong>with</strong> lessnutritious food than siblings <strong>with</strong>out disabilities.49 <strong>Children</strong> <strong>with</strong> some types of physical orintellectual disabilities may also have difficultyin feeding themselves, or need additional timeor assistance to eat. It is probable that in somecases what is assumed to be disability-associatedill health and wasting may in fact be connected<strong>with</strong> feeding problems. 50Malnutrition in mothers can lead to a number ofpreventable childhood disabilities. Approximately42 per cent of pregnant women in low- andmiddle-income countries are anaemic, and morethan one in two pregnant women in these countriessuffer iron deficiency anaemia. 44 Anaemiaalso affects more than half of pre-school agedchildren in developing countries. It is one of themost prevalent causes of disability in the world– and therefore a serious global public healthproblem. 45 Malnutrition in lactating mothers canalso contribute to poorer infant health, 46 increasingthe risk of diseases that can cause disability.Healthy mothers can help reduce the incidenceof some disabilities and are better prepared tominister to their children’s needs.While malnutrition can be a cause of disability,it can also be a consequence. Indeed, children<strong>with</strong> disabilities are at heightened risk of malnutrition.For example, an infant <strong>with</strong> cleft palatemay not be able to breastfeed or consumefood effectively. <strong>Children</strong> <strong>with</strong> cerebral palsymay have difficulty chewing or swallowing. 47Certain conditions, such as cystic fibrosis, mayimpede nutrient absorption. Some infants andchildren <strong>with</strong> disabilities may need specific dietsor increased calorie intake in order to maintain ahealthy weight. 48 Yet they may be hidden awayfrom community screening and feeding initiatives.<strong>Children</strong> <strong>with</strong> disabilities who do not attendschool miss out on school feeding programmes.Water, sanitation and hygieneIt is a widely acknowledged but little documentedfact that throughout the developing world, persons<strong>with</strong> disabilities routinely face particulardifficulties in accessing safe drinking water andbasic sanitation. <strong>Children</strong> <strong>with</strong> physical impairmentsmay be unable to collect water or carryit for long distances; others may find well wallsand water taps too high. Hardware and washroomdoors can be difficult to manipulate andthere may be nowhere to rest the water containerwhile filling it, or there may be nothing to holdon to for balance to avoid falling into a well,pond or toilet. Long or slippery paths and poorlighting also limit the use of latrines by children<strong>with</strong> disabilities.Barriers to persons <strong>with</strong> disabilities extend beyondphysical and design issues. Social barriers vary indifferent cultures. <strong>Children</strong> <strong>with</strong> disabilities oftenface stigma and discrimination when using householdand public facilities. Wholly inaccurate fearsthat children <strong>with</strong> disabilities will contaminatewater sources or soil latrines are frequently reported.When children or adolescents, and particularlygirls, <strong>with</strong> disabilities are forced to use differentfacilities than other members of their households,or are compelled to use them at different times,they are at increased risk of accidents and physicalattack, including rape. Issues preventing disabledchildren from accessing water and sanitation inA STRONG FOUNDATION25
such settings may vary depending on cultural andgeographical context, as well as by the type ofdisability a child may have: A child <strong>with</strong> a physicalimpairment may face significant difficulties inusing a hand pump or an outdoor latrine; a childwho is deaf or who has an intellectual disabilitymay have little physical difficulty but be vulnerableto teasing or abuse, which can render thesefacilities inaccessible.<strong>Children</strong> <strong>with</strong> disabilities might not attend schoolfor want of an accessible toilet. <strong>Children</strong> <strong>with</strong> disabilitiesoften report that they try to drink and eatless to cut down the number of times they needto go to the toilet, especially if they have to asksomeone to help them. This adds to the risk thatthese children will be poorly nourished. It is alsocause for concern that in some places, new water,sanitation and hygiene (WASH) facilities are stillbeing designed and built <strong>with</strong>out adequate concernfor children <strong>with</strong> disabilities. Low-tech, lowcostinterventions for persons <strong>with</strong> disabilitiesare increasingly available – new step latrinesand easy-to-use water pumps, for example. Thisinformation has yet to be widely disseminatedamong WASH professionals or incorporated intoWASH policies and practice. 51Sexual and reproductive health andHIV/AIDS<strong>Children</strong> and young people who live <strong>with</strong> aphysical, sensory, intellectual or psychosocialdisability have been almost entirely overlookedin sexual and reproductive health and HIV/AIDSprogrammes. They are often – and incorrectly –believed to be sexually inactive, unlikely to usedrugs or alcohol, and at less risk of abuse, violenceor rape than their non-disabled peers, andtherefore to be at low risk of HIV infection. 52In consequence, children and young peoplewho have disabilities are at increased risk ofbecoming HIV-positive.People <strong>with</strong> disabilities of all ages who areHIV-positive are less likely to receive appropriateservices than peers <strong>with</strong>out disabilities.Treatment, testing and counselling centres arevery rarely adapted to their needs, and healthcarepersonnel are seldom trained to deal <strong>with</strong>children and adolescents <strong>with</strong> disabilities. 53Many young people <strong>with</strong> disabilities do notreceive even basic information about how theirbodies develop and change. Structured educationabout sexual and reproductive health and relationshipsis seldom a part of the curriculum andeven where it is, children <strong>with</strong> disabilities maybe excluded. Many have been taught to be silentand obedient and have no experience of settinglimits <strong>with</strong> others regarding physical contact. 54The risk of abuse is thus increased, as illustratedby a study in South Africa that suggests deafyouth are at heightened risk of HIV infection. 55Early detection and interventionBeatriz, a 10-year-old girl <strong>with</strong> cerebral palsy, blows soapbubbles in Brazil. © Andre Castro/2012<strong>Children</strong> develop rapidly during the first threeyears of life, so early detection and intervention26THE STATE OF THE WORLD’S CHILDREN 2013: <strong>Children</strong> <strong>with</strong> <strong>Disabilities</strong>
are particularly important. Developmentalscreening is an effective means of detecting disabilityin children. 56 It can take place in primaryhealth-caresettings, for example, during immunizationvisits or growth monitoring check-upsat community health centres. The purpose ofscreening is to identify children at risk, to referthem for further assessment and interventionas needed, and to provide family members <strong>with</strong>vital information on disability. Screening involvesvision and hearing examinations as well asassessments of children’s progress against suchdevelopmental milestones as sitting, standing,crawling, walking, talking or handling objects.Health-care systems in high-income countriesprovide numerous opportunities to identify andmanage developmental difficulties early in achild’s life. But interventions to improve youngchildren’s development are becoming increasinglyavailable in low- and middle-income countries.These include such interventions as treating irondeficiency, training caregivers and providingcommunity-based rehabilitation. 57Recent studies in high- and low-income countrieshave shown that up to 70 per cent of childrenand adults newly diagnosed <strong>with</strong> epilepsycan be successfully treated (i.e., their seizurescompletely controlled) <strong>with</strong> anti-epileptic drugs.After two to five years of successful treatment,drugs can be <strong>with</strong>drawn <strong>with</strong>out danger ofrelapse in about 70 per cent of children and60 per cent of adults. However, approximatelythree quarters of people <strong>with</strong> epilepsy in lowincomecountries do not get the treatmentthey need. 58 The treatments exist – efficientdissemination is often lacking.The detection and treatment of impairments isnot a separate area of medicine but an integralaspect of public health. Nevertheless, policymakersand researchers typically characterize thesemeasures as being in competition for resources<strong>with</strong> measures to promote the health of people<strong>with</strong>out disabilities. 59 This merely serves toperpetuate discrimination and inequity.<strong>Children</strong> <strong>with</strong> disabilities who overcome thediscrimination and other obstacles that standbetween them and health care may yet find thatthe services they access are of poor quality.<strong>Children</strong>’s feedback should be invited so facilitiesand services can be improved to meet theirneeds. In addition, health workers and other professionalsdealing <strong>with</strong> children stand to benefitfrom being educated about the multiple issuesof child development and child disability andfrom being trained to deliver integrated services– where possible, <strong>with</strong> the participation of theextended family. International cooperation canplay an important role in efforts to make higherqualityservices available to children identified ashaving or at risk of developing disabilities, and inchanging the competitive approach to allocatingresources described in the preceding paragraph.Inclusive educationEducation is the gateway to full participationin society. It is particularly important for children<strong>with</strong> disabilities, who are often excluded.Many of the benefits of going to school accrueover the long run – securing a livelihood inadult life, for example – but some are almostimmediately evident. Taking part at school is animportant way for children <strong>with</strong> disabilities tocorrect misconceptions that prevent inclusion.And when these children are able to attendschool, parents and caregivers are able to findtime for other activities including earning aliving and resting.In principle, all children have the same right toeducation. In practice, children <strong>with</strong> disabilitiesare disproportionately denied this right. In consequence,their ability to enjoy the full rightsof citizenship and take up valued roles in society– chiefly, through gainful employment – isundermined.Household survey data from 13 low- and middleincomecountries show that children <strong>with</strong> disabilitiesaged 6–17 years are significantly lesslikely to be enrolled in school than peers <strong>with</strong>outA STRONG FOUNDATION27
disabilities. 60 A 2004 study in Malawi found thata child <strong>with</strong> a disability was twice as likely tohave never attended school as a child <strong>with</strong>out adisability. Similarly, a 2008 survey in the UnitedRepublic of Tanzania found that children <strong>with</strong> disabilitieswho attended primary school progressedto higher levels of education at only half the rateof children <strong>with</strong>out disabilities. 61As long as children <strong>with</strong> disabilities are deniedequal access to their local schools, governmentscannot reach the Millennium Development Goalof achieving universal primary education (MDG2), and States parties to the Convention on theRights of Persons <strong>with</strong> <strong>Disabilities</strong> cannot fulfiltheir responsibilities under Article 24. 62 A recentmonitoring report of the Convention on the Rightsof the Child acknowledged that “the challengesfaced by children <strong>with</strong> disabilities in realizing theirright to education remain profound” and that theyare “one of the most marginalized and excludedgroups in respect of education.” 63Although the Conventions make a powerful casefor inclusive education, they can also sometimesbe misused to justify the perpetuation of segregatededucation. For example, children in residentialspecial schools may be said to be accessingtheir right to be ‘included’ in education – eventhough their right to live <strong>with</strong> their families andto be a part of their own community is beingviolated.Inclusive education entails providing meaningfullearning opportunities to all students <strong>with</strong>in theregular school system. Ideally, it allows children<strong>with</strong> and <strong>with</strong>out disabilities to attend the sameage-appropriate classes at the local school, <strong>with</strong>additional, individually tailored support as needed.It requires physical accommodation – rampsinstead of stairs and doorways wide enough forwheelchair users, for example – as well as a new,child-centred curriculum that includes representationsof the full spectrum of people found in society(not just persons <strong>with</strong> disabilities) and reflectsStudents learning mathematics use Braille in West Bengal, India. © UNICEF/INDA2009-00026/Khemka28THE STATE OF THE WORLD’S CHILDREN 2013: <strong>Children</strong> <strong>with</strong> <strong>Disabilities</strong>
the needs of all children. In an inclusive school,students are taught in small classes in whichthey collaborate and support one another ratherthan compete. <strong>Children</strong> <strong>with</strong> disabilities are notsegregated in the classroom, at lunchtime or onthe playground.Studies across countries show a strong linkbetween poverty and disability 64 – one that is inturn linked to gender, health and employmentissues. <strong>Children</strong> <strong>with</strong> disabilities are often caughtin a cycle of poverty and exclusion: Girls becomecaregivers to their siblings rather than attendschool, for example, or the whole family may bestigmatized, leading to their reluctance to reportthat a child has a disability or to take the childout in public. 65 The education of those who areexcluded or marginalized, however, brings aboutpoverty reduction. 66Inclusive approaches to education have receivednumerous global endorsements, including atthe 1994 World Conference on Special NeedsEducation 67 and, since 2002, through the globalEducation for All initiative on the right to educationfor persons <strong>with</strong> disabilities. 68 Theseapproaches are by no means luxuries availableonly to the privileged or in high-income countries.Examples of inclusion in education are tobe found in all regions of the world. To optimizethe potential to include the excluded, all suchefforts should apply the principles of universaldesign to learning systems and environments.An example of this is provided by the infographicpublished online at .Starting earlyThe first steps towards inclusion are taken athome during the early years. If children <strong>with</strong> disabilitiesdo not receive the love, sensory stimulation,health care and social inclusion to whichthey are entitled, they can miss important developmentalmilestones and their potential may beunfairly limited, <strong>with</strong> significant social and economicimplications for themselves, their familiesand the communities in which they live.Ashiraff plays <strong>with</strong> friends at school in Togo after alocal disabled people’s organization and internationalpartners helped to realize his right to education.© UNICEF/Togo/2012/BrisnoA child whose disability or developmental delayis identified at an early stage will have a muchbetter chance of reaching her or his full capacity.Early childhood education, whether it is public,private or provided by the community, shouldbe designed to respond to the child’s individualneeds. Early childhood is important preciselybecause approximately 80 per cent of the brain’scapacity develops before the age of 3 andbecause the period between birth and primaryschool provides opportunities to tailor developmentaleducation to the child’s needs. Studiessuggest that the children who are at greatestdisadvantage stand to benefit the most. 69Early childhood education is not limited to preschoolsand other childcare facilities – the homeenvironment plays a fundamental role in stimulatingand facilitating the development of thechild. Studies from Bangladesh, 70 China, 71 India 72and South Africa 73 have shown that enhancedinteraction between mother and child andincreased developmental activities benefit cognitivedevelopment in young children across avariety of settings, from home to health centre. 74(continued on p. 32)A STRONG FOUNDATION29
PERSPECTIVEMy son HanifBy Mohammad AbsarMohammad Absar lives in thevillage of Maddhyam Sonapahar inMirershorai Province, Bangladesh.He has three sons and threedaughters and supports his familyby running a small tea stall.My son Hanif is 9 years oldand attends the second grade.When he was 4, he got injuredwhile playing. He started complainingabout pain in his leg,which became red and swollen.We took him to ChittagongMedical Hospital. The doctorsthere tried to save Hanif’s leg,but it was severely infected,and eventually they decided toamputate it.After Hanif lost his leg, otherchildren used to torment him:They called him ‘lame’ or ‘leglesscreep’ and pushed him tothe ground when he tried toplay <strong>with</strong> them. They also usedto tease his brother, who suffersfrom mental illness. This alwaysmade me sad, and it used todrive my wife crazy. She wouldquarrel <strong>with</strong> people who said badthings about her children. As forHanif – he became very reluctantto go out. He was miserable.Things began to improve afterthe local, non-governmentalOrganization for the PoorCommunity Advancement(OPCA) started conducting meetingsin our area to raise awarenessabout disability and encouragepeople to have a positiveapproach towards those <strong>with</strong>special needs.A rehabilitation worker fromOPCA visited our home along<strong>with</strong> a teacher from the primaryschool. They encouraged us toenrol Hanif in school. Becausethe local primary school is half akilometre away from our home,I had to carry my son to schoolevery morning. I started a smallshop near the school so I couldbe there to carry him home atthe end of the day. At first, Hanifhad a lot of trouble at school. Hisclassmates, just like his peers inthe neighbourhood, mocked himand called him names.One day, the rehabilitation workerinformed us that the Centrefor Disability in Development(CDD), a nationwide nongovernmentalorganizationbased in Dhaka, would providemy son <strong>with</strong> an artificial leg.We travelled to the capital,where Hanif was fitted forthe prosthesis and given severaldays of training. He alsoreceived a pair of crutches. Hisstump is quite small and thismakes it a bit difficult for him toclimb stairs. Other than that, hecan now do almost everythingon his own.When he first got the new leg,people stared – it was verysurprising to see him walkingagain. I myself had never imaginedit would be possible. Someof our neighbours came tovisit our home just to see theprosthesis.Now that my son can walkagain and participate in all sortsof activities, other children havestopped calling him names.They don’t push him to theground anymore. I no longerhave to carry Hanif to school –he walks himself, and his classmatesare eager to walk <strong>with</strong>him. The most important thingis that Hanif is happier andmore confident. His artificial legallows him to be independent,and he no longer feels inferiorto the other children. He isdoing better in his classes and30THE STATE OF THE WORLD’S CHILDREN 2013: <strong>Children</strong> <strong>with</strong> <strong>Disabilities</strong>
Look at Hanif and you will see that <strong>with</strong> proper supportand encouragement, people <strong>with</strong> disabilities can beeffective in society.can now enjoy sports like cricketand soccer along <strong>with</strong> his peers.A rehabilitation worker hasvisited Hanif’s school severaltimes to conduct awarenessmeetings on disability and theimportance of inclusive education.Hanif’s surroundingenvironment is more disabilityfriendlythan ever before. Hisschool works to accommodatehis needs. For example, Hanifhas trouble climbing stairs, sowhen one of his classes wasscheduled on the first floor,the principal agreed to move itdownstairs to make it easier forHanif to attend.home and take care of it. AsHanif has grown, they haveadjusted his artificial limb.Hanif also receives a disabilityallowance of 300 Bangladeshtaka each month from ourdistrict’s Department of SocialServices. I take him to the localbank to receive his allowance.Hanif will need additional supportto ensure that he cancontinue his education <strong>with</strong>outinterruption.Above all, I want my son to bewell educated. An educationwill empower him and helpguide him so that he can build ameaningful life. I think it wouldbe best for Hanif to get a deskjob so he doesn’t have to walkor stand too much. Perhaps hemight work in an organizationlike CDD, where the environmentis very disability-friendly.I saw people <strong>with</strong> various disabilitiesworking there. Suchan environment would helpmy son work to the best of hiscapacity, while at the same timesecuring an honourable positionfor him. He can becomean example: Look at Hanif andyou will see that <strong>with</strong> propersupport and encouragement,people <strong>with</strong> disabilities can beeffective in society.While he’s in school, Hanifenjoys drawing pictures.Outside of school and duringbreaks, he loves to play. Hewants to be a teacher whenhe grows up, just like his rolemodels – his schoolteachers Mr.Arup and Mr. Shapan. They loveHanif very much and supporthim in every way they can.Because our family is verypoor, my son’s artificial limband associated expenses wereprovided by CDD through thePromoting Rights for Persons<strong>with</strong> <strong>Disabilities</strong> project fundedby the Manusher JonnoFoundation. If Hanif has anyproblem <strong>with</strong> the prosthesis,rehabilitation workers visit ourHanif taking part in class. © Centre for Disability in DevelopmentA STRONG FOUNDATION31
(continued from p. 29)Age-old biases and low expectations <strong>with</strong> regardto children <strong>with</strong> disabilities should not stand inthe way of early childhood development. It isclear that <strong>with</strong> family and community supportfrom the earliest days of their lives, children <strong>with</strong>disabilities are better placed to make the most oftheir school years and to prepare themselves foradulthood.Working <strong>with</strong> teachersTeachers are a – and perhaps the – key elementin a child’s learning environment, so it is importantthat they have a clear understanding ofinclusive education and a strong commitmentto teaching all children.All too often, however, teachers lack appropriatepreparation and support in teaching children<strong>with</strong> disabilities in regular schools. This is afactor in the stated unwillingness of educatorsin many countries to support the inclusion ofchildren <strong>with</strong> disabilities in their classes. 75 Forexample, one study of prospective teachersof special education in Israel found they heldunhelpful preconceptions about people <strong>with</strong> disabilities,and that some discriminated betweendifferent types of disability. 76 Resources forchildren <strong>with</strong> disabilities tend to be allocated tosegregated schools rather than to an inclusivemainstream education system. This can provecostly as well as inappropriate: In Bulgaria, thebudget per child educated in a special schoolcan be up to three times higher than that for asimilar child in a regular school. 77A review of the situation of children <strong>with</strong> intellectualdisabilities in 22 European countrieshighlighted the lack of training of regular teachersto work <strong>with</strong> children <strong>with</strong> disabilities as amajor concern. Most of the time, these studentswere taught by support staff rather than certifiedteachers. Teacher training has proved effective infostering commitment to inclusion. A 2003 studyfound that school principals who had taken morecourses on disability expressed more inclusiveviews. And shifting attitudes benefit students:Positive views on inclusion translated into lessrestrictive placements for specific students <strong>with</strong>disabilities. 78 Another study from 2001 found thata course on inclusion for those studying to beteachers was effective in changing their attitudes,so that they favoured including children <strong>with</strong>mild disabilities in the classroom. 79The greatest opportunity appears to exist amongteachers who are still fresh in the profession. Arecent systematic literature review of countries asdiverse as China, Cyprus, India, Iran, the Republicof Korea, the State of Palestine, the United ArabEmirates and Zimbabwe found that teachers <strong>with</strong>the least general teaching experience had morepositive attitudes than those <strong>with</strong> longer service.Teachers who had received training in inclusiveeducation had more positive attitudes than thosewho had received no training, and those who hadthe most positive attitudes were those <strong>with</strong> actualexperience of inclusion. 80Yet pre-service training rarely prepares teachersto teach inclusively. Where training exists,it is of variable quality. Although numeroustoolkits exist, these are not always geared to aspecific context, and so will frequently containforeign concepts. Group learning is one example.Teachers have responded negatively to picturesof children <strong>with</strong> and <strong>with</strong>out disabilities seated ingroups, as this is at odds <strong>with</strong> the way studentsinteract in more traditional classrooms. 81Another challenge is the lack of diversity amongteaching personnel. Teachers <strong>with</strong> disabilitiesare quite rare and in some settings considerableobstacles exist for adults <strong>with</strong> disabilities to qualifyas teachers. In Cambodia, for example, the lawstates that teachers must be “free of disabilities.” 82Partnerships <strong>with</strong> civil society are providingencouraging examples of ways to enhanceteacher training and diversity. In Bangladesh, theCentre for Disability in Development (CDD), anational non-governmental organization (NGO),employs a group of inclusive education trainerswho run 10-day training sessions during school32THE STATE OF THE WORLD’S CHILDREN 2013: <strong>Children</strong> <strong>with</strong> <strong>Disabilities</strong>
terms for 20 schools at a time, <strong>with</strong> training providedto one teacher from each school. 83 Severalof the CDD trainers are visually impaired or haveother disabilities, so they are important rolemodels for teachers and students <strong>with</strong> and <strong>with</strong>outdisabilities. And in Mozambique, Ajuda deDesenvolvimento de Povo para Povo, a nationalNGO, has worked closely <strong>with</strong> the national disabledpeople’s organization known as ADEMO totrain student teachers to work <strong>with</strong> children <strong>with</strong>disabilities and to train student teachers whohave disabilities. 84Teachers tend to work in isolation, which meansthey are often unsupported in the classroom,and are often under pressure to complete a narrowsyllabus imposed from above. Inclusiveeducation requires a flexible approach to schoolorganization, curriculum development and pupilassessment. Such flexibility would allow forthe development of a more inclusive pedagogy,shifting the focus from teacher-centred to childcentredto embrace diverse learning styles.Parents can play many roles, from providingaccessible transport to raising awareness, gettinginvolved in civil society organizations andliaising <strong>with</strong> the health sector so that childrenhave access to appropriate equipment and supportand <strong>with</strong> the social sectors to access grantsand credit schemes to reduce poverty. In manycountries, schools have community committeesthat are engaged in a wide range of activitiesto support inclusion. For example, in Viet Nam,Community Steering Committees have beeninvolved in advocacy, local training, securingassistive devices, providing financial supportand developing accessible environments. 87 It isimportant that parents and community membersrealize that they have contributions to make andthat their contributions are used.Although the importance of child participationand child agency is well documented, they situncomfortably <strong>with</strong>in the existing structures and(continued on p. 36)Teachers need to be able to call on specialist helpfrom colleagues who have greater expertise andexperience of working <strong>with</strong> children <strong>with</strong> disabilities,especially children <strong>with</strong> sensory or intellectualimpairments. For example, specialists canadvise on the use of Braille or computer-basedinstruction. 85 Where such specialists are relativelyfew, they can travel between schools as needed.Even these itinerant specialist teachers can be inshort supply in such low-income areas as sub-Saharan Africa. 86 This presents an opportunity forappropriate support from providers of financialand technical assistance from the internationalto the local level.Involving parents, communitiesand childrenInclusive education programmes that focus onlyon classroom practices fail to harness parents’potential to contribute to inclusive education –and to prevent such violations as the confinementof children <strong>with</strong> disabilities to separate rooms.Boys play football at the Nimba Centre in Conakry, Guinea.The centre provides training for people <strong>with</strong> physicaldisabilities. © UNICEF/HQ2010-1196/AsselinA STRONG FOUNDATION33
PERSPECTIVEThe new normalBy Claire HalfordClaire Halford lives in Melbourne,Australia, <strong>with</strong> her partner andtheir two children. She worked infashion and the visual arts beforebecoming a full-time caregiver forher son Owen.Everybody hopes for a healthybaby when expecting a child.When asked, “What are you having?”expectant mums and dadsrespond, “Oh, we don’t mind, aslong as it’s healthy.”I remember the first-trimestermilestone <strong>with</strong> my first-born son,Owen: I told the midwife that Ihad stopped smoking and drinking,ate a healthy diet, exercisedmoderately and felt pretty goodabout carrying a child. “That’sgreat,” she said in a reassuringtone. “After all, what can gowrong <strong>with</strong> a healthy female ina first-world country in professionalmedical care?” Little didI know that in about six monthsI would find out exactly whatcould go wrong.My son’s birth, at full term, wasincredibly traumatic. When hefinally entered the world, hecould not breathe. His brain wasdeprived of oxygen. He wasresuscitated and ventilated, andfor two weeks he was swappedbetween intensive care andspecial care. He had his firstseizure at 1 day old. Until he was2 years old, epilepsy invaded ourlives all day, every day.My son was diagnosed <strong>with</strong>cerebral palsy (CP) at 5 months.Cerebral palsy is a broad termdescribing a brain injury that canoccur in utero, during birth or inearly childhood. In Australia, CPis the most common cause ofphysical disability in childhood,and it is a disability that affectschildren in all countries whetherthey are affluent or poor. Thecondition mostly affects movementand muscle tone. Owenhas severe CP: He cannot sit,roll, walk or speak.Following his diagnosis, correspondencefrom doctors arrivedin the post on an almost weeklybasis. Initial letters deliveredbrutal realities, using medicalspeaklike ‘spastic quadriplegic’,‘cortical visual impairment’and ‘globally developmentallydelayed’ – terms that were completelyforeign. Every onlinesearch ended in ‘prognosis poor’.In those early days, the onlyshining light in all this shockingdarkness was Owen’s beautifulpersonality, infectious laugh,obvious engagement <strong>with</strong> theworld around him and emerginghandsome looks.The first year was very hard.Anger – no, rage – and disappointment,devastation, lonelinessand disbelief lurked atevery corner. As the midwife hadsuggested, this wasn’t supposedto happen to me, to him, tous – this was a mistake! Friendsand family could say or do nothingright, so I sought out otherswho were in a similar position,through support groups in myarea and on the Internet.Around the time of Owen’s diagnosis,I received a phone callfrom the university at whichI had once worked, asking if I’dlike to return to teach life drawingand design part-time. Thisjob was to have been my ticketout of employment in retail; itwas to have been somethingmeaningful I could sink my teethinto. I declined. I had new work:Now I was a full-time caregiver.It turned out that Owen hadintractable seizures that did notrespond to epilepsy medication.So we started 2-year-oldOwen on a medical diet for34THE STATE OF THE WORLD’S CHILDREN 2013: <strong>Children</strong> <strong>with</strong> <strong>Disabilities</strong>
epilepsy. The ketogenic diet isan incredibly strict high-fat, lowcarbohydratediet. In a bizarre,unexpected stroke of grace, itworked. My poor suffering sonwent from having up to 200seizures a day to almost nonein the first three months. He hasbeen virtually seizure-free since.My partner and I have since hadanother son, a healthy toddlerwhom we love as dearly as wedo Owen. He has brought usanother perspective on life. Ourfamily life has come to defineus. The connection we havemakes us stronger – to us, ourlifestyle is normal; we carry on.It’s normal to drive all over townto do physical therapy manytimes a week; it’s normal to haulheavy equipment like standingframes and bath chairs fromroom to room every day. Weknow the children’s hospital likethe backs of our hands and arefamiliar <strong>with</strong> many of the topspecialists in various fields ofpaediatric medicine.I call myself my son’s‘personal assistant’ becausehe has a never-endingstream of paperwork,funding applications, doctor’sappointments, therapy sessions,check-ups and blood tests. Ido most of his personal care,such as feeding and bathing.My partner helps when he can,but he works very long hours tokeep us all afloat financially – sothat I can care for Owen andwe can have a comfortablelife. We try to keep busy on theweekends, doing family thingslike visiting the farmer’s market,going out for Vietnamese foodor checking out a kids’ show.Owen has a pretty fun andbusy life for a 5-year-old. Yetno matter how good things canbe, he has a long and difficultjourney ahead of him.We are hoping to place Owenin a mainstream primary school<strong>with</strong> the support of the CerebralPalsy Education Centre, an earlyintervention programme. Owenhas shown vast improvementin communication and movementsince he started goingthere. He also attends activitiesat the Riding for the DisabledAssociation, which we bothlove. Over the years we havespent so much money and timeon therapies and services –some of them good, others notthat helpful. We’re learning aswe go, and we’re getting betterat making practical rather thanemotional decisions. It’s stillhard for us, though; I’m alwaysfighting or waiting for somethinghe desperately needs,sometimes for years.The hardest battles have to do<strong>with</strong> people’s perceptions ofOwen. I just want him to betreated and spoken to like aregular kid – but I also want himto receive special attention, andfor people to be more patient.I want my friends and family tohelp him and engage <strong>with</strong> himmore. Many of them tend tofocus on how I am doing or onsomething else that’s less challengingthan Owen’s very realproblems. It’s hard for them,too – <strong>with</strong> everything he hasgoing on, I sometimes thinkhe should come <strong>with</strong> aninstruction manual.I’ve often feared that thethings that defined me beforeI became a caregiver – work,creative interests and a sociallife – have been lost down awell of grief and exhaustion.More often than not, however,I feel like my life before Owenwas born was comparativelysuperficial. Becoming a caregiverfor my own child has beenan overwhelmingly profoundand joyful experience. We celebratesmall accomplishmentsfeverishly, and my expectationsof what success entails havebeen smashed and rebuilt intosomething beautifully simple:Owen sitting unaided for fiveseconds, or, as he watches theParalympics on television, hearingthe words ‘cerebral palsy’and ‘champion’ in the samesentence. I have grown throughcaring for Owen – above all,perhaps, in my ability toempathize.I have learned that no matterwhat a child can’t do, she or hewill still always have an identityand a character that will leavea distinctive brushstroke onthis world. If we want to be anenlightened society, our job isto believe and encourage. Onlythen can children who havesuch difficult limitations grow.And then we can all come tosee that things that ‘go wrong’are sometimes just different –and often amazing.A STRONG FOUNDATION35
(continued from p. 33)system of education. This is true for all children,<strong>with</strong> or <strong>with</strong>out disabilities: Few are involvedin making decisions about their education andlives. Involving children <strong>with</strong> disabilities in suchdecisions can be particularly challenging, notleast because of ingrained thinking and behaviourthat perceives them as passive victims. Asthe 2011 Report of the Secretary-General on theStatus of the Convention on the Rights of theChild noted, “It remains difficult for children <strong>with</strong>disabilities to have their voices heard. Initiativessuch as school councils and children’s parliaments,consultative processes to elicit children’sviews, as well as judicial proceedings, commonlyfail to ensure the inclusion of children <strong>with</strong> disabilities,or acknowledge their capacities forparticipation.” 88The most underused resource in schools andcommunities all over the world is the childrenthemselves. The Child-to-Child Trust in the UnitedKingdom has worked for many years to promotechildren’s involvement in health education, andin some countries this approach has been usedto good effect as part of inclusive education andcommunity-based rehabilitation programmes. 89In participatory research, for example, childrenfrequently highlight the importance of a cleanenvironment and hygienic toilets, and for children<strong>with</strong> disabilities, the issues of privacy andaccessibility are paramount. 90 It stands to reasonthat children <strong>with</strong> disabilities can and must guideand evaluate efforts to advance accessibility andinclusion. After all, who better to understand themeans and impact of exclusion?Lines of responsibilityAs in other fields of endeavour, it will help torealize aspirations for inclusive education if governmentsand their partners are clear about whois to do what and how, and to whom they areexpected to report. Otherwise, the promise ofinclusion risks becoming a matter of lip service.One study of countries engaged in what wasonce known as the Education For All Fast TrackInitiative (FTI) and is now called the GlobalPartnership for Education found that ‘‘a numberof FTI-endorsed countries, particularly thosewhich are approaching universal primary education,do now have national education sectorplans which address the inclusion of disabledchildren. […] However, in a number of countries,policies and provision for disabled childrenremain cursory or have not been implemented.”91 The report notes that in five FTI-endorsedcountries there was no mention at all of children<strong>with</strong> disabilities.Sometimes, the problem is one of divided orunclear mandates: In Bangladesh there is someconfusion about which ministries are responsiblefor children <strong>with</strong> disabilities of school age. Themandate for implementing Education For All lies<strong>with</strong> the Ministry of Education and the Ministry ofPrimary and Mass Education, but the educationof children <strong>with</strong> disabilities is managed by theMinistry of Social Welfare and is seen as amatter of charity, not a human rights issue. 92Since 2002, children <strong>with</strong> disabilities and those<strong>with</strong> special educational needs have been includedin primary education through the PrimaryEducation Development Programme 93 underthe Ministry of Education. But managing integratededucational provision for children <strong>with</strong>visual impairments and running primary schoolsfor children <strong>with</strong> hearing, visual or intellectualimpairments remains the responsibility theMinistry of Social Welfare. 94Ministries of Education should be encouraged totake responsibility for all children of school age.Coordination <strong>with</strong> partners and stakeholders canplay a strong supporting role in this process. InBangladesh, the National Forum of OrganizationsWorking <strong>with</strong> the Disabled promotes networkingbetween the government and NGOs, andhas been instrumental in encouraging greatereducational inclusion as well as a gradual shiftof ministerial responsibility from social welfareto education. As a consequence, the Campaignfor Popular Education, a national network, hascommitted to ensuring that all children <strong>with</strong>36THE STATE OF THE WORLD’S CHILDREN 2013: <strong>Children</strong> <strong>with</strong> <strong>Disabilities</strong>
Reading Braille at a school in Uganda. © UNICEF/UGDA2012-00112/Sibilonidisabilities have access to basic and quality education,and the non-governmental BangladeshRural Advancement Committee, which is committedto achieving Education For All and povertyreduction, now includes learners <strong>with</strong> disabilitiesin its schools.Exclusion denies children <strong>with</strong> disabilities thelifelong benefits of education: a better job, socialand economic security, and opportunities forfull participation in society. In contrast, investmentin the education of children <strong>with</strong> disabilitiescan contribute to their future effectiveness asmembers of the labour force. Indeed, a person’spotential income can increase by as much as 10per cent <strong>with</strong> each additional year of schooling. 95But inclusive education can also reduce currentand future dependence, freeing other householdmembers from some of their caring responsibilities,and allowing them to resume productiveactivity – or simply to rest. 96Basic reading and writing skills also improvehealth: A child born to a mother who can read is50 per cent more likely to survive past the age of5. 97 Lower maternal education has been linkedto higher rates of stunting among children inthe urban slums of Kenya, 98 Roma settlementsin Serbia, 99 and in Cambodia. 100 Better-educatedBangladeshi parents decreased their child’s riskof stunting by up to 5.4 per cent (4.6 per cent inthe case of mothers, and between 2.9 and 5.4 percent for fathers), and better-educated Indonesianparents accounted for up to a 5 per cent decrease(between 4.4 and 5 per cent for mothers, and 3 percent for fathers) in their child’s odds of stunting. 101Education is both a useful instrument and a right,the purpose of which, as stated in the Conventionon the Rights of the Child, is to promote “thedevelopment of the child’s personality, talentsand mental and physical abilities to theirfullest potential.” 102A STRONG FOUNDATION37
PERSPECTIVEAdjusting, adapting and empoweringBy Yahia J. ElziqYahia J. Elziq is a Technical Advisorfor Handicap International inRamallah, State of Palestine.Saja was 7 years old whenI met her.At that time I was workingin one of the three nationalrehabilitation centres in theWest Bank as an occupationaltherapist. Although this centreis not set up to handle Saja’sneeds and demands as a child<strong>with</strong> cerebral palsy, we wereable to provide therapy sessionsto prevent deteriorationin her condition. The two mainobstacles that still preventher from reaching appropriaterehabilitation servicesare the absence of referralmechanisms and coordinationbetween services in the WestBank, and the restrictions onmovement that are imposedon Palestinians under occupation.The specialized rehabilitationcentre for such conditionsis based in East Jerusalem, butSaja’s family was refused permissionto enter the city.In addition, children <strong>with</strong> disabilitiesin the West Bank, aselsewhere, confront a generallack of knowledge and skillsabout disability throughoutthe public and private sectors.They are also faced <strong>with</strong>a dominant perspective thatregards people <strong>with</strong> disabilitiesas pitiable and as worthyto receive charity – but not asindividuals <strong>with</strong> rights whohave the same entitlements asothers, and who can and docontribute to society.In this context Saja has beenlucky. After an extensive evaluation,our team developed aplan to support and improveher participation in the community.The priority for herand her family was to haveher enrolled in regular school.However, in order to attenda mainstream school, sheneeded various environmentalchanges – among them,the school premises had tobe physically accessible, andshe needed to have a suitablewheelchair. Full collaborationfrom her family, schooland community were absolutenecessities. Saja neededintegrated activities involvingmany stakeholders, startingfrom her own parents,who tended to use availableresources in favour of herbrother, who has the same38THE STATE OF THE WORLD’S CHILDREN 2013: <strong>Children</strong> <strong>with</strong> <strong>Disabilities</strong>
Saja opened my eyes to my own ability to adjust and adapt asa professional – and to the positive impact that we therapeuticprofessionals can have if we adopt empowering attitudes.condition, leaving her <strong>with</strong>outthe opportunity to develop toher full potential.Tackling all these issues wasmade difficult because of theabsence of adequate nationalpolicy. There is no inclusiveeducation programme forchildren <strong>with</strong> disabilities, forexample, and disabilityinclusivepolicies are not prioritiesfor decision-makers.For these reasons, the fate ofchildren <strong>with</strong> disabilities reliesheavily on the willingness ofcommunity members to recognizethat these children havethe same rights as all children.When these rights arerecognized, many issues canbe solved – often simply bymobilizing existing communityresources.Fortunately, in Saja’s case,negotiations <strong>with</strong> the schoolprincipal succeeded and herclassroom was moved fromthe second to the ground floor.The teachers accepted the ideaof having her in their class.By using our own networksof professional and personalcontacts, we were able to gether a suitable wheelchair and,thanks to some local doctorsand a health centre, her familywas able to obtain free treatmentto improve her eyesight.Social workers helped raiseawareness of her particularsituation <strong>with</strong>in her family, anda psychologist supported herin overcoming her experienceof discrimination.Over just a couple of years,Saja’s situation improveddramatically as some of herhealth issues were addressed,her mobility improved and herself-esteem and confidenceimproved along <strong>with</strong> her socialinteractions, knowledge andlife skills. As a person, I wasoverjoyed at seeing Saja’sprogress. As a rehabilitationprofessional, it was highlyrewarding.Saja opened my eyes to myown ability to adjust and adaptas a professional – and to thepositive impact that we therapeuticprofessionals can haveif we adopt empowering attitudes.More importantly, shehelped me to understand thevalue and importance of takinga holistic view of the individualchild and of taking a comprehensiveapproach in working<strong>with</strong> persons <strong>with</strong> disabilitiesand their community. This isthe only way to ensure thatchildren <strong>with</strong> disabilities canhave the same opportunitiesas other children to participatein community life.I want to share this realization<strong>with</strong> policymakers so theycan take a more empowering,holistic approach to their work.Good policies – made <strong>with</strong> theinvolvement of children <strong>with</strong>disabilities and disabled persons’organizations, and properlyimplemented – will helpto ensure that when the nextSaja comes to us, she and herfamily will know what she isentitled to, and what she mightexpect to achieve – which iswhat every other girl of herage in her community canexpect to achieve. This is themessage that the Conventionon the Rights of Persons <strong>with</strong><strong>Disabilities</strong> and the Conventionon the Rights of the Childgive us, and that we wantto promote every day.A STRONG FOUNDATION39
A teacher trained in inclusive education checks on 5-year-old Sok Chea, who is deaf and mute, at a preschool in Cambodia.© UNICEF/Cambodia/2011/Mufel
CHAPTER 4ESSENTIALS OFPROTECTION<strong>Children</strong> <strong>with</strong> disabilities are among the most vulnerablemembers of society. They stand to benefit the most frommeasures to count them, protect them against abuseand guarantee them access to justice.Obtaining protection can be a particular challengefor children <strong>with</strong> disabilities. In societieswhere they are stigmatized and their familiesare exposed to social or economic exclusion,many children <strong>with</strong> disabilities are not even ableto obtain an identity document. Their births gounregistered: They might not be expected tosurvive, 103 their parents might not want to admitto them, or they might be considered a potentialdrain on public resources. This is a flagrant violationof these children’s human rights and a fundamentalbarrier to their participation in society.It can seal their invisibility and increase their vulnerabilityto the many forms of exploitation thatresult from not having an official identity.States parties to the Convention on the Rights ofPersons <strong>with</strong> <strong>Disabilities</strong> (CRPD) have given themselvesthe clear obligation to guarantee effectivelegal protection for children <strong>with</strong> disabilities. Theyhave also embraced the principle of ‘reasonableaccommodation’, which requires that necessaryand appropriate adaptations be made so thatchildren <strong>with</strong> disabilities can enjoy their rights onan equal basis <strong>with</strong> others. For resulting legislationand efforts to change discriminatory socialnorms to be meaningful, it is also necessary tomake certain that laws are enforced and children<strong>with</strong> disabilities are informed about their right toprotection from discrimination and about how toexercise this right. Separate systems for children<strong>with</strong> disabilities would be inappropriate. As <strong>with</strong>the other aspects of life and society discussed inthis report, equity through inclusion is the goal.Abuse and violenceDiscrimination against and exclusion of children<strong>with</strong> disabilities renders them disproportionatelyvulnerable to violence, neglect and abuse. Studiesfrom the United States have shown that children<strong>with</strong> disabilities who are in preschool or youngerare more likely to be abused than peers <strong>with</strong>outdisabilities. 104 A national survey of deaf adults inNorway found that girls were twice as likely toexperience sexual abuse, and boys three times aslikely, as peers who had no disability. 105 <strong>Children</strong>who may already be suffering stigma and isolationhave also been shown to be more likely tosuffer physical abuse.Some forms of violence are specific to children<strong>with</strong> disabilities. For example, they may be subjectto violence administered under the guise of treatmentfor behaviour modification, including electroconvulsivetreatment, drug therapy or electricshocks. 106 Girls <strong>with</strong> disabilities endure particularabuses, and in many countries are subject to forcedsterilization or abortion. 107 Such procedures aredefended on grounds of avoidance of menstruationor unwanted pregnancy, or even ascribed to amistaken notion of ‘child protection’, given the disproportionatevulnerability of girls <strong>with</strong> disabilitiesto sexual abuse and rape. 108 As of the beginning ofESSENTIALS OF PROTECTION41
2013, the World Health Organization was developingguidance designed to combat the humanrights abuse of forced sterilization.Institutions and inappropriate careIn many countries, children <strong>with</strong> disabilities continueto be placed in institutions. It is rare forthese facilities to provide the individual attentionthat children need to develop to their full capacity.The quality of educational, medical and rehabilitativecare provided in institutions is often insufficientbecause standards of appropriate care forchildren <strong>with</strong> disabilities are lacking or, wheresuch standards exist, because they are not monitoredand enforced.Under the Convention on the Rights of the Child(CRC), children <strong>with</strong> and <strong>with</strong>out disabilities havethe right to be cared for by their parents (Article7) and to not be separated from their parentsunless this is deemed by a competent authorityto be in the child’s best interest (Article 9). TheCRPD reinforces this in Article 23, which statesthat where the immediate family is unable to carefor a child <strong>with</strong> disabilities, States parties musttake every measure to provide alternative care<strong>with</strong>in the extended family or community.In many countries, foster families are a frequentform of alternative care. Foster families may feelreluctant to take on the care of a child <strong>with</strong> a disabilitybecause of the perceived extra burden ofcare and additional physical and psychologicaldemands. Organizations tasked <strong>with</strong> placing childrenin families can encourage them to considerfostering children <strong>with</strong> disabilities, and providethem <strong>with</strong> appropriate training and support.Where authorities have come to see the perilsof institutional care and have moved to returnchildren to their families or communities, children<strong>with</strong> disabilities have been among the lastto be removed from institutions and transferredto alternative care. In many countries of Centraland Eastern Europe and the Commonwealth of<strong>Children</strong> <strong>with</strong> disabilities and secondary educationuArmenia, 2011<strong>Children</strong> <strong>with</strong> disabilities who live <strong>with</strong> their familiesgenerally obtain their secondary education inmainstream schools. <strong>Children</strong> <strong>with</strong> disabilities wholive in orphanages tend to not attend secondaryschool at all.The main reason children <strong>with</strong> disabilities who arein the care of their families do not attend school isbecause their parents think their children cannotstudy at school.Total Male Female Total Male Female70% 71%67%72% 72% 72%48%47% 57%Generalschool12% 12% 12%Specialschool18%21%17%Noschool<strong>Children</strong> <strong>with</strong> disabilities in thecare of families5%8%2%Generalschool23% 21% 21%SpecialschoolNoschool<strong>Children</strong> <strong>with</strong> disabilities in thecare of orphanages4% 4% 3%Refusedadmission6% 4%9% 7% 8% 4%Distance/transportationParents seeno needfor school19%14%26%Insufficientconditionsat school34% 37% 29%HealthconditionParents thinkchild cannotstudy at schoolSource: Ministry of Labour and Social Issues of the Republic of Armenia and UNICEF, It’s About Inclusion: Access to education, health and social protection servicesfor children <strong>with</strong> disabilities in Armenia. UNICEF/Yerevan, 2012, .Sample sizes: 5,707 children in total sample; 5,322 children <strong>with</strong> disabilities in the care of families; 385 children <strong>with</strong> disabilities in the care of orphanages.Age range: Total sample: 0–18 years old. Secondary education questions: 6–18 years old.42THE STATE OF THE WORLD’S CHILDREN 2013: <strong>Children</strong> <strong>with</strong> <strong>Disabilities</strong>
Independent States, institutionalized care is beingreformed and children are being moved fromlarge facilities to smaller group homes or familybasedcare. Serbia, for example, began wholesalereforms in 2001. Deinstitutionalization was givenpriority and fostering, which had an establishedhistory in the country, was given a boost. A newfamily law was adopted and a fund was establishedto help develop community-based socialservices. Progress ensued, but close examinationrevealed that children <strong>with</strong>out disabilities hadbeen released from institutions at a much fasterrate than children <strong>with</strong> disabilities – about 70per cent of whom had been committed to caredirectly from a maternity ward. This revelationserved to demonstrate the importance of ensuringthat reforms are designed and implementedso no children are excluded from progress, andit has since led to a renewed commitment todeinstitutionalization. 109Inclusive justiceA State’s responsibility to protect the rights of allchildren under its jurisdiction extends equally tochildren <strong>with</strong> disabilities who are in contact <strong>with</strong>the law – whether as victims, witnesses, suspectsor convicts. Specific measures can help: <strong>Children</strong><strong>with</strong> disabilities can be interviewed in appropriatelanguages, whether spoken or signed. Lawenforcement officers, social workers, lawyers,judges and other relevant professionals can betrained to work <strong>with</strong> children who have disabilities.Systematic and continuous training of allprofessionals involved in the administration ofjustice for children is vital, as is the establishmentof regulations and protocols that enhanceequal treatment of children <strong>with</strong> disabilities.Last to benefitUnder Serbia’s welfare reforms, children <strong>with</strong>disabilities were released from institutions at aslower rate than children <strong>with</strong>out disabilities.37%DECREASE 63%100% 100%DECREASE91%83%79%63%2000 2005 2008 2011 2000 2005 2008 2011<strong>Children</strong> and youth (0–26 years old)<strong>with</strong> disabilities in institutions49%37%<strong>Children</strong> and youth (0–26 years old)<strong>with</strong>out disabilities in institutionsSource: Republican Institute for Social Protection, Serbia.Sample sizes: <strong>Children</strong> and youth (0–26 years old) <strong>with</strong> disabilities: 2,020 in2000, 1,280 in 2011. <strong>Children</strong> and youth (0–26 years old) <strong>with</strong>out disabilities:1,534 in 2000, 574 in 2011.<strong>Children</strong> <strong>with</strong> disabilities should not be placed inregular juvenile detention facilities, neither whenawaiting nor following a trial. Any decisions resultingin deprivation of liberty should be aimed atappropriate treatment to address the issues that ledthe child to commit a crime. Such treatment shouldbe carried out in the context of appropriate facilities<strong>with</strong> adequately trained staff, <strong>with</strong> human rightsand legal safeguards fully respected. 110It is also important to develop alternative solutionsto formal judicial proceedings, taking intoaccount the range of individual capacities ofchildren who have disabilities. Formal legalprocedures should only be used as a measureof last resort, where this is in the interest ofpublic order, and care should be taken toexplain the process and the child’s rights.A child learns the Dutch alphabet at a school for children<strong>with</strong> learning disabilities in Curaçao, Netherlands.© UNICEF/HQ2011-1955/LeMoyneESSENTIALS OF PROTECTION43
FOCUSViolence against children<strong>with</strong> disabilitiesBy Lisa Jones, Mark A. Bellis, SaraWood, Karen Hughes, Ellie McCoy,Lindsay Eckley, Geoff BatesCentre for Public Health, LiverpoolJohn Moores UniversityChristopher Mikton, Alana Officer,Tom ShakespeareDepartment of Violence and InjuryPrevention and Disability, WorldHealth Organization<strong>Children</strong> <strong>with</strong> disabilities arethree to four times more likelyto be victims of violence.<strong>Children</strong> and adults <strong>with</strong> disabilitiesoften face a widerange of physical, social andenvironmental barriers to fullparticipation in society, includingreduced access to healthcare, education and other supportservices. They are alsothought to be at significantlygreater risk of violence thantheir peers <strong>with</strong>out disabilities.Understanding the extent ofviolence against children <strong>with</strong>disabilities is an essential firststep in developing effective programmesto prevent them frombecoming victims of violenceand to improve their healthand the quality of their lives.To this end, research teamsat Liverpool John MooresUniversity and the World HealthOrganization conducted the firstsystematic review, includingmeta-analysis, of existing studieson violence against children<strong>with</strong> disabilities (aged 18 yearsand under).Seventeen studies, all fromhigh-income countries, metthe criteria for inclusion in thereview. Prevalence estimatesof violence against children<strong>with</strong> disabilities ranged from26.7 per cent for combinedmeasures of violence to 20.4per cent for physical violenceand 13.7 per cent for sexualviolence. Estimates of riskindicated that children <strong>with</strong> disabilitieswere at a significantlygreater risk of experiencingviolence than peers <strong>with</strong>outdisabilities: 3.7 times morelikely for combined measuresof violence, 3.6 times morelikely for physical violenceand 2.9 times more likely forsexual violence. The type ofdisability appeared to affect theprevalence and risk of violence,although the evidence on thispoint was not conclusive. Forinstance, children <strong>with</strong> mentalor intellectual disabilities were4.6 times more likely to bevictims of sexual violence thantheir non-disabled peers.This review demonstrated thatviolence is a major problemfor children <strong>with</strong> disabilities. Italso highlighted the absence ofhigh-quality studies on the topicfrom low- and middle-incomecountries, which generally havehigher population rates of disability,higher levels of violenceand fewer support services forthose living <strong>with</strong> a disability.This gap in the research urgentlyneeds to be filled.A number of explanations havebeen put forward to account44THE STATE OF THE WORLD’S CHILDREN 2013: <strong>Children</strong> <strong>with</strong> <strong>Disabilities</strong>
<strong>Children</strong> <strong>with</strong> disabilities are at greater risk of experiencing physicalor sexual violence than peers <strong>with</strong>out disabilities.for why children <strong>with</strong> disabilitiesare at much greater risk ofviolence than children <strong>with</strong>outdisabilities. Having to care fora child <strong>with</strong> a disability canput extra strain on parentsor households and increasethe risk of abuse. Significantnumbers of children <strong>with</strong> disabilitiescontinue to be placedinto residential care, which isa major risk factor for sexualand physical abuse. <strong>Children</strong><strong>with</strong> disabilities that affectcommunication may be particularlyvulnerable to abuse, sincecommunication barriers canhamper their ability to discloseabusive experiences.The Convention on the Rightsof Persons <strong>with</strong> <strong>Disabilities</strong>aims to protect the rights ofindividuals <strong>with</strong> disabilitiesand guarantee their full andequal participation in society.In the case of children <strong>with</strong> disabilities,this includes ensuringa safe and stable progressionthrough childhood and intoadulthood. As <strong>with</strong> all children,a safe and secure childhoodprovides the best chance ofachieving a healthy, welladjustedadulthood. Adversechildhood experiences, includingviolence, are known tobe related to a wide range ofnegative health and social outcomesin later life. The extrademands placed on children<strong>with</strong> disabilities – who mustcope <strong>with</strong> their disabilities andovercome societal barriers thatincrease their risk of pooreroutcomes in later life – meanthat a safe and secure childhoodis particularly important.<strong>Children</strong> placed away fromhome need increased care andprotection, and institutionalcultures, regimes and structuresthat exacerbate the riskof violence and abuse shouldbe addressed as a matter ofurgency. Whether they livein institutions or <strong>with</strong> theirfamilies or other caregivers,all children <strong>with</strong> disabilitiesshould be viewed as a highriskgroup in which it is criticalto identify violence. Theymay benefit from interventionssuch as home visitingand parenting programmes,which have been demonstratedto be effective for preventingviolence and mitigating its consequencesin children <strong>with</strong>outdisabilities. The effectiveness ofsuch interventions for children<strong>with</strong> disabilities should be evaluatedas a matter of priority.ESSENTIALS OF PROTECTION45
PERSPECTIVESegregation and abusein institutionsBy Eric Rosenthal and Laurie AhernEric Rosenthal, JD, is founder andExecutive Director of Disability RightsInternational (DRI). Laurie Ahern is itsPresident. Through investigations oforphanages and other institutions inmore than two dozen countries, DRIhas brought international attentionto the human rights of people <strong>with</strong>disabilities.Throughout the world, millionsof children <strong>with</strong> disabilities areseparated from their familiesand placed in orphanages,boarding schools, psychiatricfacilities and social carehomes. <strong>Children</strong> who surviveinstitutions face the prospectof lifetime segregation fromsociety in facilities for adults.According to the Conventionon the Rights of Persons <strong>with</strong><strong>Disabilities</strong> (CRPD), segregatingchildren on the basis of theirdisability violates the rights ofevery such child. Article 19 ofthe Convention requires governmentsto establish the laws,social policies and communitysupport services needed to preventisolation or segregationfrom the community.Over the course of 20 years,Disability Rights International(DRI) has documented theconditions of children <strong>with</strong>disabilities in institutions in 26countries around the world. Ourfindings are surprisingly consistent.We have interviewedheartbroken mothers and fatherswho wish to keep their childrenat home but receive inadequatesupport from governments andcannot afford to stay home fromwork to take care of a child.Doctors often tell parents toplace their daughter or son in anorphanage before they becometoo attached to the child.Raising children in congregatesettings is inherently dangerous.Even in clean, well-managed andwell-staffed institutions, childrenencounter greater risks to theirlife and health compared tothose who grow up in families.<strong>Children</strong> who grow up in institutionsare likely to acquire developmentaldisabilities, and theyoungest among them also facepotentially irreversible psychologicaldamage.Even in institutions <strong>with</strong> adequatefood, we often observechildren who are emaciatedbecause they simply stop eating– a condition called ‘failure tothrive’. Infants and children <strong>with</strong>disabilities may starve or lackadequate nutrients because staffdo not or cannot take the extratime to feed them. Sometimesstaff will prop a bottle on thechest of a bedridden child, intheory allowing her to grasp itand drink – but in practice, thechild may be unable to pick it up.Many children are left to languish.A DRI investigator cameto the horrific realization, in2007, that a child who looked tobe 7 or 8 years old was, accordingto a nurse, 21 years old andhad never been out of his crib in11 years.Without any movement, physicaldisabilities worsen, and childrencan develop life-threateningmedical complications. Somechildren’s arms and legs atrophyand have to be amputated.Without emotional attentionand support, many childrenbecome self-abusive, rockingback and forth, banging theirheads against walls, biting themselvesor poking their own eyes.Most facilities lack trained staffwho can help children stop suchbehaviour. Instead, children aresometimes tied permanently to46THE STATE OF THE WORLD’S CHILDREN 2013: <strong>Children</strong> <strong>with</strong> <strong>Disabilities</strong>
It is much harder to protect children and provide them <strong>with</strong> anopportunity for a life in society when their ties to family havealready been broken.beds or held in cages – whetherto prevent self-abuse or to helpoverwhelmed staff cope <strong>with</strong>the demands of the many childrenin their care. The UnitedNations Committee againstTorture and the United NationsSpecial Rapporteur on Torturehave said that the prolongeduse of restraints may constitutetorture.For a child who has alreadybeen institutionalized, falling illcan be a death sentence. Staffmembers at facilities in morethan one country have saidthat children <strong>with</strong> disabilitiesare routinely denied medicaltreatment. Institution staff havealso told us – incorrectly – thatchildren <strong>with</strong> developmentaldisabilities lack the ability tofeel pain. So, in some cases,medical procedures are conducted<strong>with</strong>out anaesthesia.In one facility, children’s teethwere extracted <strong>with</strong> pliers;elsewhere, children receivedelectro-convulsive therapy<strong>with</strong> no anaesthesia ormuscle relaxants.<strong>Children</strong> have been given electricshocks, physically restrainedfor long periods and isolated<strong>with</strong> the express purpose ofcausing pain, on the theory thatthis ‘aversive therapy’ wouldextinguish behaviour deemedinappropriate. A teacher in theUnited States described one girl– blind, deaf and non-verbal –who was shocked for moaning.It turned out she had a brokentooth.Without oversight and humanrights protections, children have,in effect, disappeared in institutions.Human rights monitoringand enforcement programmes toprotect against violence, exploitationand abuse – as required byArticle 16 of CRPD – are absent inmost of the facilities we have visited.In some cases, authoritiesdo not keep track of the namesor numbers of children detainedin these places.Official statistics are unreliableand often understate relianceupon segregated service systems.The numbers are oftenlimited to orphanages and donot include children detained inother types of institutions, suchas boarding schools, health-careor psychiatric facilities, criminaljustice systems or homelessshelters. Private or religiousinstitutions, which may be muchlarger than government orphanages,are often not counted.The entrances to some orphanagesand other institutions areemblazoned <strong>with</strong> the logos ofgovernments, corporate donors,churches or private charities.Even when financial assistancefrom international donors ortechnical assistance agenciesmakes up a small portion of aninstitution’s operating budget,this support can provide anapparent ‘seal of approval’. DRIhas found bilateral and multilateralsupport – both officialand from voluntary donationsby staff – for such amenitiesas playgrounds at orphanageswhere children die for want ofmedical care and where theyare tied to beds. These donorsmay be well intentioned butthis support runs counter to theintent of the CRPD and otherrights instruments that protectpeople from segregation.No child should ever be takenaway from her or his family onthe basis of disability. DRI iscalling on every governmentand international donor agencyto commit to preventing anynew placements in orphanages.It is much harder to protect childrenand provide them <strong>with</strong> anopportunity for a life in societywhen their ties to family havealready been broken. The detentionof children in institutionsis a fundamental human rightsviolation. We can bring it toan end, on a worldwide scale,through a moratorium on newplacements.ESSENTIALS OF PROTECTION47
Fadi, 12, walks past houses destroyed by airstrikes in Rafah, State of Palestine, where ongoing violence hashad substantial psychological impact, especially on children. © UNICEF/HQ2012-1583/El Baba
CHAPTER 5HUMANITARIANRESPONSEHumanitarian crises, such as those stemming fromwarfare or natural disasters, pose particular risks forchildren <strong>with</strong> disabilities. Inclusive humanitarian responseis urgently needed – and feasible.Armed conflict and war affect children in directand indirect ways: directly in the form of physicalinjuries from attack, artillery fire and landmineexplosions or in the form of psychologicalconditions derived from these injuries or fromwitnessing traumatic events; indirectly through,for example, the breakdown of health services,which leaves many illnesses untreated, andfood insecurity, which leads to malnutrition. 111<strong>Children</strong> are also separated from their families,their homes or their schools, sometimesfor years.The nature of armed conflict, a major causeof disabilities among children, is changing.Fighting is increasingly taking the form of recurringcivil wars and fragmented violence characterizedby the indiscriminate use of force andweapons. At the same time, natural disastersare expected to affect increasing numbers ofchildren and adults in coming years, especiallyin hazardous regions such as low-lying coastalzones, particularly as climate change-relateddisasters grow in frequency and severity. 112<strong>Children</strong> <strong>with</strong> disabilities face particular challengesin emergencies. They may be unable toescape during a crisis because of inaccessibleevacuation routes; for example, a child in awheelchair may be unable to flee a tsunami orgunfire and may be abandoned by her or hisfamily. They may be dependent on assistivedevices or caregivers, and in the face of the lossof a caregiver, may be extremely vulnerable tophysical violence or to sexual, emotional andverbal abuse. <strong>Children</strong> <strong>with</strong> disabilities mayalso be made invisible by family and communitybeliefs – for example, a child <strong>with</strong> a mentalimpairment might be kept in the house becauseof stigma surrounding her or his condition.In addition, children <strong>with</strong> disabilities may beexcluded from or unable to access mainstreamsupport services and assistance programmessuch as health services or food distributionbecause of the physical barriers posed by inaccessiblebuildings or because of negative attitudes.Or they may be forgotten in the establishmentof targeted services. For example, landminesurvivors may not be able to access physicalrehabilitation services because of distance, thehigh cost of transport or criteria for admission totreatment programmes. Furthermore, children<strong>with</strong> disabilities may be disregarded in earlywarning systems, which often do not take intoaccount the communication and mobility requirementsof those <strong>with</strong> disabilities.Disability-inclusive humanitarian action isinformed by and grounded in:• A rights-based approach, based on theConvention on the Rights of the Child (CRC)and the Convention on the Rights of Persons<strong>with</strong> <strong>Disabilities</strong> (CRPD). Article 11 of the CRPDHUMANITARIAN RESPONSE49
specifically calls on duty bearers to take all necessarymeasures to ensure the protection andsafety of persons <strong>with</strong> disabilities in situationsof conflict, emergency and disaster, signifyingthe importance of the issue.• An inclusive approach that recognizes thatchildren <strong>with</strong> disabilities, in addition to theirdisability-specific needs, have the same needsas other children, disability being only oneaspect of their situation: They are children whohappen to have disabilities. Such an inclusiveapproach also addresses the social, attitudinal,informational and physical barriers that impedeparticipation and decision-making by children<strong>with</strong> disabilities in regular programmes.• Ensuring accessibility and universal design ofinfrastructure and information. This includesmaking the physical environment, all facilities,health centres, shelters and schools, andthe organization of health and other services,including communication and information systems,accessible for children <strong>with</strong> disabilities.• Promoting independent living so that children<strong>with</strong> disabilities can live as independently aspossible and participate as fully as possiblein all aspects of life.• Integrating age, gender and diversity awareness,including paying special attention tothe double or triple discrimination faced bywomen and girls <strong>with</strong> disabilities.Disability-inclusive humanitarian responseensures that children and adults <strong>with</strong> disabilities,as well as their families, survive and live<strong>with</strong> dignity, even as it benefits the populationas a whole. This approach calls for holistic andinclusive programmes, rather than just isolatedprojects and policies targeting disabilities. KeyVijay, 12, survived a landmine explosion and has gone on to become a mine risk educator in Sri Lanka.© UNICEF/Sri Lanka/2012/Tuladar50THE STATE OF THE WORLD’S CHILDREN 2013: <strong>Children</strong> <strong>with</strong> <strong>Disabilities</strong>
Explosive remnants of war (ERW) on display at a school in Ajdabiya, Libya. Students collected the objects from aroundthe city. © UNICEF/HQ2011-1435/Diffidentiintervention areas for disability-inclusive humanitarianaction include:• Improving data and assessments in order tohave an evidence base for the distinct needsand priorities of children <strong>with</strong> disabilities.• Making mainstream humanitarian servicesaccessible for children <strong>with</strong> disabilities andinvolving them in planning and design.• Designing specialized services for children <strong>with</strong>disabilities and ensuring that recovery and reintegrationproceed in environments that fosterwell-being, health, self-respect and dignity.• Putting measures in place to prevent injuriesand abuse and promote accessibility.• Partnering <strong>with</strong> community, regional andnational actors, including disabled persons’organizations, to challenge discriminatoryattitudes and perceptions and promote equity.• Promoting participation of children <strong>with</strong>disabilities by consulting them and creatingopportunities for their voices to be heard.Parties to conflict have an obligation to protectchildren from the effects of armed violenceand to provide them <strong>with</strong> access to appropriatehealth and psychosocial care to aid their recoveryand reintegration. The Committee on the Rightsof the Child has recommended that States partiesto the CRC add explicit reference to children<strong>with</strong> disabilities as part of their broader commitmentnot to recruit children into armed forces. 113Governments should also take care to addressthe recovery and social reintegration of childrenwho acquire disabilities as a result of armedconflict. This is explored in greater detail in thefollowing Focus article.HUMANITARIAN RESPONSE51
FOCUSRisk, resilience and inclusivehumanitarian actionBy Maria KettAssistant Director, Department ofEpidemiology and Public Health,Leonard Cheshire Disability andInclusive Development Centre,University College LondonArticle 11 of the Conventionon the Rights of Persons <strong>with</strong><strong>Disabilities</strong> compels Statesparties to “ensure the protectionand safety of persons <strong>with</strong>disabilities in situations of risk,including situations of armedconflict, humanitarian emergenciesand the occurrenceof natural disasters.”In an emergency – whetherarmed conflict or a natural orhuman-made disaster – childrenare among those mostvulnerable to the loss of food,shelter, health care, educationand age-appropriate psychosocialsupport services. Thisvulnerability can be even moreacute for children <strong>with</strong> disabilities:Even where basic suppliesand relief services are available,they may not be inclusiveor accessible.Knowing how many children<strong>with</strong> disabilities live in an areaaffected by an emergency isextremely challenging, becauseaccurate numbers may nothave existed even before theemergency. Parents or communitiesmay hide such childrenbecause of stigma, for example.The resulting exclusion is of particularconcern because even themost rudimentary reporting systemscan unravel in humanitariansituations, since registrationand reporting points or centresmay not be accessible.At the same time, increasingnumbers of children may sustaindisabling injuries as a result ofchronic or sudden emergencies.In an earthquake, children maybe disabled by falling objects orwhen buildings collapse. Theymay receive crushing injuriesand undergo psychologicaltrauma during floods and landslides.Conflict increases the likelihoodthat children will becomedisabled as a result of fighting,because of landmines, orthrough exposure to other explosiveremnants of war (ERW).Because children are smaller andat earlier stages in their development,they often sustain moreseriously disabling injuries thanadults and require continuingphysiotherapy, prostheses andpsychological support.The challenges facing children<strong>with</strong> disabilities and their familiesare rarely acknowledgedwhen the impact of an emergencyis assessed. These challengesinclude new environmental barrierssuch as collapsed ramps;damaged or lost assistivedevices; and the loss of previouslyestablished services (signlanguage interpreters or visitingnurses) or support systems(social security payments orsocial protection schemes).There are other risks. If familymembers die, there may beno one left who knows how tocare for a child <strong>with</strong> a physicaldisability or who can communicate<strong>with</strong> a child <strong>with</strong> asensory impairment. If familiesare forced to flee, especially ifthey face a long journey by foot,they may leave behind childrenwho are unable to walk or arein frail health. Families mayalso leave behind children <strong>with</strong>disabilities because they fearthey will be refused asylum inanother country if one of theirfamily members has a disability.Several countries practise suchdiscrimination. Institutions andresidential schools may close orbe abandoned by staff, leavingfew people – or no one – to helpthe children in their charge.<strong>Children</strong> <strong>with</strong> disabilities, especiallythose <strong>with</strong> learning disabilities,can also be directlyinvolved in conflict. They maybe pressed into service as fighters,cooks or porters preciselybecause they are considered tobe less valuable, or less likely to52THE STATE OF THE WORLD’S CHILDREN 2013: <strong>Children</strong> <strong>with</strong> <strong>Disabilities</strong>
esist, than children <strong>with</strong>out disabilities.In theory disarmament,demobilization and reintegrationprogrammes include all childex-combatants, but resourcesor programmes for children<strong>with</strong> disabilities are often nonexistent.These children thereforeremain marginalized andexcluded, leaving them poor,vulnerable and often having tobeg, as has been the case inLiberia and Sierra Leone.The risk of violence, includingsexual violence, increases whenfamily protection and socialstructures break down as theydo during conflict and disasters.While girls <strong>with</strong> disabilities areat particular risk in such situations,boys <strong>with</strong> disabilitiesare also at risk and are evenless likely to be helped in theaftermath of violence.Recovery and reconstructioncome <strong>with</strong> their own challengesfor children <strong>with</strong> disabilities. Asis the case <strong>with</strong> all crisis-affectedchildren, those <strong>with</strong> disabilitiesrequire a range of services,including but not limited to targetedones. Disability-specificneeds are extremely important,but they are only part of the picture.During recovery operationsafter the 2004 Indian Ocean tsunami,for example, one girl <strong>with</strong>a disability was given five wheelchairs– but no one asked her ifshe needed food or clothes.Resilience and inclusion<strong>Children</strong> have repeatedlydemonstrated their resilience.Measures can be taken tosupport their participation andinclusion. These measuresshould be specific to particulargroups and contexts: Boys andgirls have different experiencesof conflict, as do young childrenand adolescents. Similarly,emergencies can affect urbanand rural areas differently.As a starting point, children <strong>with</strong>disabilities should be given theopportunity to take part in theplanning and implementation ofdisaster risk reduction and peacebuildingstrategies as well as inrecovery processes. Ignoranceand incorrect assumptions thatthey are unable to contributehave often barred them fromdoing so, but this has begun tochange. In Bangladesh, for example,Plan International learnedto challenge such misconceptionsthrough partnerships <strong>with</strong>disability organizations and byworking directly <strong>with</strong> communitiesin undertaking child-centreddisaster risk reduction.Similarly, provision for children<strong>with</strong> disabilities is increasing indisaster response. In Pakistan,Handicap International (HI) andSave the <strong>Children</strong> built childfriendlyinclusive spaces anddeveloped sector-wide guidanceon inclusion of persons <strong>with</strong> disabilities,especially in protectionprojects. In Haiti, HI and the faithbaseddevelopment organizationCBM lobbied the government toincrease the inclusion of persons<strong>with</strong> disabilities in food distributionand other efforts. The UnitedNations often uses emergenciesas an opportunity to ‘build backbetter’, an approach that canyield opportunities for children<strong>with</strong> disabilities because itoffers all stakeholders achance to work together.Disability is also being mainstreamedin such guidelinesas the Sphere Project’sHumanitarian Charter andMinimum Standards inHumanitarian Response,framed by a group of internationalorganizations to improvethe quality and accountabilityof humanitarian response.The availability of emergencyguidelines on how to includepeople <strong>with</strong> disabilities – andchildren in particular – isincreasing. These gains need tobe consolidated and extendedto such areas as child nutritionand protection.Also needed is a unifiedapproach to data collection.Collaboration <strong>with</strong> local andnational disabled people’sorganizations should beemphasized, and these groups’capacity to address issuesspecific to children should bebuilt up where necessary. Andthe extent to which children<strong>with</strong> disabilities are included inhumanitarian response mustbe audited to monitor andimprove results.Clear standards and inclusionchecklists that can be appliedacross the range of emergencieswill be essential – but tobe put into practice, they mustbe accompanied by resourceallocations.HUMANITARIAN RESPONSE53
FOCUSExplosive remnants of warBy the Victim Assistance EditorialTeam at the Landmine and ClusterMunition Monitor.The Landmine and Cluster MunitionMonitor provides research for theInternational Campaign to BanLandmines and the Cluster MunitionCoalition. It is the de facto monitoringregime for the Mine Ban Treatyand the Convention on ClusterMunitions.Explosive remnants of war(ERW) and anti-personnellandmines have a devastatingimpact on children and representa significant contributingfactor to child disability. Sincethe signing of the 1997 MineBan Treaty, however, vast tractsof land have been cleared ofthese munitions and returnedto productive use.The 1997 treaty; the 1996Amended Protocol II and2003 Protocol V to the 1980Convention on CertainConventional Weapons; andthe 2008 Convention on ClusterMunitions have all had a positiveimpact in terms of protectingthe lives of people livingin areas contaminated by ERWand landmines. The globalmovement to ban landminesand cluster munitions is a testamentto the importance ofstrong political will amongkey stakeholders in fosteringglobal change.Mine action programming,which seeks to address theimpact of landmines and ERW,is understood to be made upof five pillars – clearance, ERW/mine risk education, victimassistance, stockpile destructionand advocacy. Despite thegreat successes in many ofthese pillars, as indicated bya significant global decline inERW and landmine casualties,victim assistance continuesto stand out as a key area ofweakness. This is especially soin the case of children affectedby ERW or landmines.In contrast <strong>with</strong> the other fourpillars of mine action, victimassistance requires a crosscuttingresponse that includesmedical and paramedical interventionsto ensure physicalrehabilitation, as well as socialand economic interventions topromote reintegration and thelivelihood of victims.To date the bulk of mineaction assistance and fundinghas been dedicated to clearanceactivities. In 2010, 85 percent of global funds relatedto mine action were allocatedto clearance, while only 9 percent were allocated to victimassistance interventions. Whilethe International Mine ActionStandards – the standards inforce for all UN mine actionoperations – address the mineaction programming pillars ofclearance, ERW/mine risk educationand stockpile destruction,they do not tackle the issue ofvictim assistance. Moreover, theright to age- and gender-appropriatephysical rehabilitationand social and economic reintegrationfor survivors of landminesand ERW is enshrined ininternational human rights andhumanitarian law. However,few survivor assistance programmeshave taken into considerationthe specific needsof children, whether they aredirect survivors or victims in thebroader sense.The impact on childrenThere has been a significantdecrease in the numbers ofpeople killed or injured bylandmine blasts. Between 2001and 2010, the number of newlandmine and ERW casualtiesreported through the Landmineand Cluster Munitions Monitor,the monitoring arm of the MineBan Treaty and the Conventionon Cluster Munitions, fell from7,987 to 4,191. The chart onthe next page demonstratesa significant reduction in thetotal number of civilian deathsand injuries from landminesand ERW in the five-year periodbetween 2005 and 2010.54THE STATE OF THE WORLD’S CHILDREN 2013: <strong>Children</strong> <strong>with</strong> <strong>Disabilities</strong>
Since monitoring began in 1999, there have been at least 1,000child casualties every year. Many casualties go unrecorded, so thereal number is likely much higher.Nevertheless, the percentageof total casualties representedby child casualtieshas increased. Annually, since2005, children have accountedfor approximately 20–30 percent of all casualties fromlandmines, remnants of clustermunitions and other ERW.Since monitoring began in1999, there have been at least1,000 child casualties everyyear. The number of childcasualties of landmines andERW in 2010 surpassed 1,200,and children accounted for 55per cent of all civilian deaths– children are now the civiliangroup for whom landminesand ERW are most deadly.Given that numerous casualtiesgo unrecorded in manycountries, the total numberof child casualties annuallyis likely much higher, andin some of the world’s mostmine-affected countries, thepercentage of casualties representedby children is higherstill: In 2011, children constituted61 per cent of all civiliancasualties in Afghanistan. Inthe same year, they were 58per cent of civilian casualtiesin the Lao People’s DemocraticRepublic, 50 per cent in Iraqand 48 per cent in the Sudan.by landmines, remnants ofcluster munitions and otherERW, since 2008, boys havemade up the single largestcasualty group, approximately50 per cent of all civilian casualties.In 2006, the first year inwhich the Landmine Monitorbegan disaggregating casualtydata by both age and gender,boys represented 83 per centof child casualties and madeup the largest single casualtygroup among civilians in 17countries. In 2008, boys represented73 per cent of childcasualties, and were the largestcasualty group in 10 countries.In many contaminated countries,boys are more likely thangirls to come across mines orERW, because they are moreinvolved in outdoor activitiessuch as herding livestock, gatheringwood and food, or collectingscrap metal. <strong>Children</strong> ingeneral are more likely to deliberatelyhandle explosive devicesthan adults, often unknowingly,out of curiosity or by mistakingthem for toys. Boys aremore likely than girls to tamper<strong>with</strong> the explosive devices theycome across. These factors,If children now constitute themajority of casualties causedMonica and Luis, both 14 in this 2004 photograph from Colombia, sit at poolside.Monica lost a foot when a younger cousin brought home a grenade. It exploded,killing the cousin. © UNICEF/HQ2004-0793/DeCesareHUMANITARIAN RESPONSE55
FOCUS(continued)as well as a tendency towardsengaging in risk-taking behaviour,make well-planned riskeducation especially importantfor children.Assistance for childsurvivorsERW and landmine incidentsaffect children differently thanthey do adults, whether theyare directly killed or injured,or become victims as a resultof the death or injury of familyand community members.Child survivors who are injuredhave specific needs that mustbe taken into consideration, interms of both physical rescueand rehabilitation and socialand economic reintegration.Smaller than adults, childrenare more likely to die or sufferserious injuries from a blast,including severe burns, shrapnelwounds, damaged limbsand other injuries that canlead to blindness or deafness.Child casualties in countries heavilyaffected by mines and explosiveremnants of war, 2011*CountryTotal civiliancasualtiesTheir height means that theirvital organs are closer to thedetonation, and children havea lower threshold for substantialblood loss than adults. Ifan anti-personnel landmine isstepped on, its blast will invariablycause foot and leg injuries,<strong>with</strong> secondary infections thatusually result in amputation,causing lifelong disabilities andrequiring long-term rehabilitationsupport.More than one third of allsurvivors require amputation,and while data concerning theexact percentage of affectedchildren requiring amputationare lacking, the percentage canbe expected to be higher forchildren, given their smallersize. When children survivetheir injuries, their physicalrehabilitation is more complexthan that of adult survivors.<strong>Children</strong> whose injuries resultin amputated limbs requireChildcasualtiesChild casualtiesas percentageof totalcasualtiesAfghanistan 609 373 61%Democratic Republic of the Congo 22 15 68%Iraq 100 50 50%Lao People’s Democratic Republic 97 56 58%Sudan 62 30 48%* Includes only casualties for which the civilian/security status and the age was known.Source: Landmine and Cluster Munition Monitor.more complicated rehabilitationand, because their bones growmore quickly than their softtissue, several re-amputationsmay be required. They alsoneed to have prostheses madeas they grow. Few countriesaffected by landmines andERW have the capacity necessaryto address the specific,complex medical and physicalrehabilitation needs of childsurvivors.In addition to the physicaltrauma, the psychologicalconsequences of survivingan ERW or landmine blastare often devastating for thedevelopment of the child. Theyinclude a sense of guilt, lossof self-esteem, phobias andfear, sleep disorders, inabilityto speak and trauma that if leftuntreated can result in longtermmental disorder. Suchpsychological effects of war onchildren are difficult to document,and they are not limitedto children who have sustainedphysical injuries.The social and economicreintegration needs of childsurvivors also vary considerablyfrom the needs of adults.Addressing the psychosocialimpacts outlined above reliesheavily on age-appropriatepsychosocial support andaccess to education. In manycountries, child survivors areforced to cut short their educationbecause of the time neededfor recovery, and because56THE STATE OF THE WORLD’S CHILDREN 2013: <strong>Children</strong> <strong>with</strong> <strong>Disabilities</strong>
FOCUS(continued)Child casualties in the most affected countries*Percentage of children among civilian casualties (1999–2011)100%90%80%70%AfghanistanCambodiaColombia60%50%40%30%20%10%0%1999 2000 2001 2002 2003 2004 2005 2006 2007 2008 2009 2010 2011* The three States parties to the Mine Ban Treaty <strong>with</strong> the highest annual casualty rates.Source: Landmine and Cluster Munition Monitor.rehabilitation represents afinancial burden for families.Access to free education forchildren <strong>with</strong> disabilities as aresult of a landmine or ERWinjury is necessary both topromote a sense of normalcyin their lives, enabling them torecover from the psychosocialdistress of their injury, and toreintegrate them <strong>with</strong> theirpeer group and allow them tofully participate in society. Yetchildren left <strong>with</strong> a disabilityfollowing a landmine or ERWblast are more vulnerable thanothers to the denial of thisright: They may no longer beable to walk to school, andother transportation alternativesare seldom in place. Evenwhen they are able to get toschool, classrooms may not beaccessible for children <strong>with</strong> disabilities,and their teachers maynot be trainedin adapting to the needs ofchildren <strong>with</strong> disabilities.Opportunities for incomegeneration and livelihoodsupport are especially necessaryto support children andadolescents left <strong>with</strong> a disabilityas a result of landminesor ERW. Unfortunately, suchopportunities seldom if evertake age considerations intoaccount. Where age has beenconsidered, as it was during a2008–2010 project in Cambodia,the challenges to ensuring ageappropriateinterventions forchildren and adolescents weresuch as to exclude those under18 from victim assistance livelihoodinterventions altogether.This failure to address thespecific needs of and risks tochildren and adolescents isreflected in the livelihood andeconomic strengthening sectormore generally: A 2011 reviewHUMANITARIAN RESPONSE57
FOCUS(continued)of 43 studies on the impact ofeconomic strengthening programmesin crisis contexts inlow-income countries foundthat some of these efforts had,paradoxically, increased the riskthat children would be pulledout of school and put to workor that girls would be subjectto violence. The programmesstudied featured such initiativesas microcredit, skills training,and agricultural interventions.The review called on economicstrengthening practitioners to“build children’s protectionand well-being into the assessment,design, implementation,monitoring and evaluation ofeconomic strengthening programs.”In addition, livelihoodand income generation opportunitiesfor children and adolescentsmust take into accountnot only their age but also theirsex and the cultural contextin which they live. Becausechildren <strong>with</strong> disabilities areamong those most vulnerableto deprivation, violence, abuseand exploitation, there is anurgent need to ensure thatvictim assistance programmestake the specific needs of childsurvivors into consideration.Meanwhile, children who arevictims of landmines and otherERW as a result of the death orinjury of caregivers and familymembers, including familybreadwinners, also have needsthat differ from those of adults.Like child survivors, they toomay be more vulnerable to theloss of education opportunities,separation from their families,child labour and other forms ofexploitation or neglect.Despite the particular victimassistance needs of children,few victim assistanceprogrammes take age- andgender-specific considerationsinto account. While researchhas been conducted on victimassistance in general, and guidancehas been developed onwhat such programmes shouldlook like, to date there has beenlittle if any focus on childrenand adolescents. Meanwhile,while States parties to the MineBan Treaty, Protocols II and Vof the Convention on CertainConventional Weapons, andthe Convention on ClusterMunitions must regularly reporton national-level implementationof these internationalinstruments, they do not reporton their efforts to address thespecific needs of survivorsaccording to their age. It is notsurprising then that in a 2009survey of more than 1,600 survivorsfrom 25 affected countriesconducted by HandicapInternational, almost two thirdsof respondents reported thatservices for children were“never” or “almost never”adapted to address their specificneeds or ensure that serviceswere age appropriate.Child victims, including thosedirectly and indirectly affected,have specific and additionalneeds in all aspects of assistance.However, the informationavailable about efforts toaddress these needs is limited.Most children involved in mineor ERW incidents are injured.Yet most data collection systemsdo not record their needs.As children account for anincreasing percentage of thetotal civilian casualties fromERW and landmines, it isessential to implement specificpolicy and programmatic recommendationson victim assistancethat meets the needs ofchild survivors. These recommendationsinclude:• Supporting and promotingthe establishment ofnational injury surveillancesystems able to providesystematic and continuousinformation on the magnitudeand nature of ERW andlandmine injuries (and othertypes of injuries if appropriate),including age- andgender-disaggregated dataabout child casualties.• Integrating a victim assistancecomponent into theInternational Mine ActionStandards, including throughtechnical notes and bestpracticesguidelines, <strong>with</strong>specific guidance and considerationson child-specific survivorand victim assistance.• Developing and promotingthe establishment of victimassistance databases ableto provide systematic data58THE STATE OF THE WORLD’S CHILDREN 2013: <strong>Children</strong> <strong>with</strong> <strong>Disabilities</strong>
Child casualties by type of explosive*Undefined mine5%ERW/Clustersubmunitions67%ERW, 65%Clustersubmunition, 2%Anti-personnel mine21%Anti-vehicle mine4%Victim-activated improvisedexplosive device3%*Not including unknown explosive item types.Source: Landmine and Cluster Munition Monitor.to monitor the rehabilitation,psychosocial and socioeconomicneeds of each childand adult survivor appropriatelyand across time.• Sensitizing governments,mine action actors, donorsand other relevant stakeholders,through both internationaland national forums, onthe importance of prioritizingvictim assistance (includingfor child survivors and thechildren of people killed byvictim-activated explosives)as a key pillar of mine actionand international laws.• Making government, humanitarianand developmentalactors and service providersaware of the importanceof ensuring the availabilityof age- and gender-specifichealth and physical rehabilitation,psychosocial support,protection, education andlivelihood support servicesfor child survivors and victimsof ERW and landmines.• Training health professionals,including emergencyresponse personnel, surgeonsand ortho-prostheticservice providers, in thespecific considerationsand special needs ofchild survivors.• Training education serviceproviders, including schoolmanagement, teachers andeducators, in providingaccessible and appropriateeducation for child survivorsand victims.• Formulating national laws,plans and policies respondingto the needs of survivorsand victims of ERW and landmines,or of persons <strong>with</strong>disabilities in general, so thatthey integrate and respond tothe age- and gender-specificneeds of child survivorsand victims.• Integrating a strong victimassistance component intothe draft UN Inter-AgencyMine Action Strategy, includingspecific child-survivorassistance considerations.HUMANITARIAN RESPONSE59
PERSPECTIVEOne bite of the elephantat a timeBy Chaeli MycroftChaeli Mycroft, recipient of the2011 International <strong>Children</strong>’sPeace Prize, is an ability activistand avid wheelchair dancer. Sheis preparing to study politics andphilosophy at the University ofCape Town, South Africa.Some people see disability asa burden, others as a gift. Mydisability has given me veryunique opportunities and experiencesthat would not havehappened if I were not disabled.I am happy and gratefulfor my disability because it hasmoulded me into the personthat I am today.I am in no way saying thathaving a disability is an easything to deal <strong>with</strong>. It is a verycomplex situation, and it affectsalmost every aspect of yourlife. But I hope, throughoutmy life, to inspire other youngpeople to see their disabilitiesas an opportunity to focuson ability, not just on theirlimitations.My family has always challengedme to focus on myabilities and has never viewedor treated me <strong>with</strong> pity. Forthis, I will be eternally gratefulbecause it made me see myselfas equal to any able-bodiedperson. I was also raised knowingthat my contribution is ofequal importance to anyoneelse’s, and to stand up (metaphorically)for my rights. Myfriends view me as an equaland accept that my disabilitysometimes makes it difficult forme to do things in the samemanner as they do, so we justhave to be slightly more creativeto include me in whateverwe’re doing – playing cricketwhen we were younger, forexample. I would be the scorer.The incredible support Ireceived enabled me to work<strong>with</strong> children <strong>with</strong> disabilitiesin South Africa. For this I wonthe International <strong>Children</strong>’sPeace Prize in 2011 – an eventthat has changed my life in anamazing way. The KidsRightsFoundation, which awards thisprize annually, has given methe opportunity to spread mymessage through a worldwideplatform and to meet peopleI would otherwise never meet.They also pay for my educationand are making it possible60THE STATE OF THE WORLD’S CHILDREN 2013: <strong>Children</strong> <strong>with</strong> <strong>Disabilities</strong>
If people <strong>with</strong> disabilities can’t believe in themselves or if othersdon’t believe in them, I will believe in them – and hopefully mypositivity will spread and encourage more positivity.for me to go to university nextyear <strong>with</strong> all the adjustmentsI need.So many children <strong>with</strong> disabilitiesare not celebrated for theircapabilities and are hiddenaway from the world becauseof fear and ignorance. We needto realize that people <strong>with</strong> disabilitiesare crucial in our population.People <strong>with</strong> disabilitiesare often the ones who thinkoutside the box – because wehave to. We have to make ourdisabilities work for us and notagainst us, and teach othersto be caring and empathetic.Empathy, something the worlddesperately needs.I believe that there are twomain issues to be tackled on aworldwide level – accessibilityand attitudes. These issuesare interconnected and cannotbe dealt <strong>with</strong> one by one. Ifpeople can change the worldwideattitude towards disabilityfrom one of pity, shame andinferiority to one of abundance,acceptance and equality, thenwe will see amazing progress.Positive attitudes can lead toimproved accessibility – just asinaccessibility is an expressionof the view that the needs ofpeople <strong>with</strong> disabilities are lessimportant than those of ablebodiedpeople, an attitude thathas negative consequencesfor people <strong>with</strong> and <strong>with</strong>outdisabilities.Improved attitudes shouldalso help address other majorissues, such as our experiencesof education. I have been inevery form of education thata person <strong>with</strong> a disability cando: special needs school, mainstreamstate primary and highschool, mainstream privatehigh school. I wouldn’t say I’man expert, but there’s a lot tobe said for experience. It wascertainly not always easy andsimple. Often it was a struggle,and at times I was incrediblyunhappy. I worked really hardto be included and to make iteasier for the people who aregoing to come after me. I amfinishing my school career in aplace where I am fully includedand accepted. When I thinkabout it, all I feel is relief –relief that I don’t have to fightso hard for my own happinessanymore. Now I can fightharder for other people <strong>with</strong>disabilities and their right tohappiness.It may seem that I am alwaysa super-positive person. Thisis not the case. I have had mystruggles, and I am sure thatthey are not over. The thingthat tips the scale towards positivityis the fact that I am surroundedby people who believein my ability and are positiveabout my contribution to society– people who counter mynegative days. I really lovethem for that.My lifetime goal is to have disabilitybecome something thatis completely accepted andembraced by the global community.It may be a big task,and it may have many facets,but I believe it’s entirelypossible.It starts <strong>with</strong> believing. I believein my abilities; I believe wholeheartedlythat I can makechange happen – that I canchange lives. If people <strong>with</strong> disabilitiescan’t believe in themselvesor if others don’t believein them, I will believe in them –and hopefully my positivity willspread and encourage morepositivity. This might seeminsignificant to some but it’sstill change.One bite of the elephant ata time.HUMANITARIAN RESPONSE61
A health worker assesses a boy at the Atfaluna Society for Deaf <strong>Children</strong>, State of Palestine. The organization offers educationand vocational training, free health care, psychosocial services and job placement. © UNICEF/HQ2008-0159/Davey
CHAPTER 6MEASURING CHILDDISABILITYA society cannot be equitable unless all children areincluded, and children <strong>with</strong> disabilities cannot beincluded unless sound data collection and analysisrender them visible.Measuring child disability presents a unique setof challenges. Because children develop andlearn to perform basic tasks at different speeds,it can be difficult to assess function and distinguishsignificant limitations from variations innormal development. 114 The varying nature andseverity of disabilities, together <strong>with</strong> the need toapply age-specific definitions and measures, furthercomplicate data collection efforts. In addition,the poor quality of data on child disabilitystems, in some cases, from a limited understandingof what disability is in children and, inother cases, from stigma or insufficient investmentin improving measurement. The lack ofevidence that results from such difficulties hindersthe development of good policies and thedelivery of vital services. As discussed below,however, efforts to improve data collection areunder way – and the very act of gathering informationis sparking positive change.Evolving definitionsWhile there is general agreement that definitionsof disability should incorporate bothmedical and social determinants, the measurementof disability is still predominantly medical,<strong>with</strong> a focus on specific physical ormental impairments.Estimates of disability prevalence vary dependingon what definition of disability is used.Narrow, medical definitions are likely to yieldlower estimates than broader ones that takeinto account social barriers to functioning andparticipation. 115One framework for seeing health and disability<strong>with</strong>in a broader context of social barriers isthe International Classification of Functioning,Disability and Health (ICF), developed by theWorld Health Organization. 116 This classificationregards disability in two main ways: as a matterof the body’s structure and functions, and interms of the person’s activity and participation.Disability, as defined by the ICF, is an ordinarypart of human existence. ICF’s definition effectivelymainstreams disability, shifting the focusfrom cause to effect and acknowledging thatevery person can experience some degree ofdisability. The ICF definition also recognizes thatfunctioning and disability occur in context, andtherefore it is meaningful to assess not only bodilybut also societal and environmental factors.While the ICF was principally designed foradult disability, a classification derived from it,the International Classification of Functioning,Disability and Health for <strong>Children</strong> and Youth(ICF-CY) takes a step towards incorporatingthe social dimension by capturing not only theimpairment but also its effect on children’s functioningand participation in their environment.The classification covers four main areas: bodyMEASURING CHILD DISABILITY63
structures (e.g., organs, limbs and structures ofthe nervous, visual, auditory and musculoskeletalsystems), body functions (physiological functionsof body systems, such as listening or remembering),limitations on activity (e.g., walking, climbing,dressing) and restrictions on participation(e.g., playing <strong>with</strong> caregivers or other children,performing simple chores). 117Putting disability in contextData should be interpreted in context. Estimatesof disability prevalence are a function of bothincidence and survival, and the results shouldbe interpreted <strong>with</strong> caution, particularly in countrieswhere infant and child mortality rates arehigh. 118 A low reported prevalence of disabilitymay be the consequence of low survival ratesfor young children <strong>with</strong> disabilities, or it mayreflect the failure to count children <strong>with</strong>disabilities who are confined to institutions,who are hidden away by families fearful ofdiscrimination, or who live and work onthe streets.Culture also plays an important role. The interpretationof what may be considered ‘normal’functioning varies across contexts and influencesmeasurement outcomes. The attainmentof certain milestones may not only vary amongchildren, but differ also by culture. <strong>Children</strong> maybe encouraged to experiment <strong>with</strong> new activitiesat different stages of development. For instance,in one study, 50 per cent of children were ‘ableto use a cup’ at about 35 months of age in urbanIndia, while the corresponding milestone wasreached around 10 months of age in Thailand. 119It is therefore important to assess childrenagainst reference values appropriate to localcircumstances and understanding.For these reasons, assessment tools developedin high-income countries, such as the WechslerIntelligence Scale for <strong>Children</strong> and Griffith’sFour case studies:Percentage of populationreporting some form of disability6 questions asked,including:Does (name) havedifficulty seeing,even if he/she iswearing glasses?uUgandaOne questionasked:Is anyone whowas in thehousehold oncensus nightdisabled?One questionasked:Does (name)have anydifficulty inmoving, seeing,hearing,speaking orlearning, whichhas lasted or isexpected to last6 months ormore?One questionasked:Do you have(serious)difficulty inmoving, seeing,hearing,speaking orlearning whichhas lasted oris expected tolast 6 monthsor more?20%7%4%1%Census1991Census2002Source: UNICEF, from surveys and censuses identified above.Uganda NationalHousehold Survey2005/2006Demographic andHealth Survey(DHS) 200664THE STATE OF THE WORLD’S CHILDREN 2013: <strong>Children</strong> <strong>with</strong> <strong>Disabilities</strong>
Mental Development Scale, 120 cannot be indiscriminatelyapplied in other countries or communities,as their capacity to detect and accurately measuredisability in different sociocultural contextsis often untested. Frames of reference may vary,and survey tools may fail to sufficiently capturelocal customs, cultural understanding, languagesor expressions. For example, questionnaires thatevaluate child development on the basis of such‘standard’ activities as preparing breakfast cerealor playing board games may be appropriate insome places but not in those where children donot routinely engage in these activities. 121Data collectionThe specific objectives of the data collection arelikely to influence the definition of what constitutes‘disability’, the questions asked and theresulting figures. The measurement of disabilitytype and prevalence is frequently tied to specificpolitical initiatives, such as social protectionschemes. Results may be used to determinebenefit entitlement or to plan and determine supportprovision. For example, the criteria used todefine eligibility for a disability benefit are likelyto be more restrictive than criteria for a surveyconducted to identify all persons <strong>with</strong> a functionallimitation, yielding dramatically differentnumbers. 122Many children are identified as having a disabilitywhen they come into contact <strong>with</strong> educationor health-care systems. However, in low-incomecountries or communities, school and clinic staffmay not be able to routinely recognize or registerthe presence of children <strong>with</strong> disabilities. Theresulting paucity of information about children<strong>with</strong> disabilities in low-income countries has contributedto a misconception that disability doesnot merit global priority. 123Where schooling or other formal services for children<strong>with</strong> disabilities are lacking, other methodsuAustraliaOne question asked:Is this personhandicapped by aserious long-termillness or physicalor mentalcondition?5%12 questionsasked, including:Is thereanyone inthe householdwho has anyloss of sight?Does everyonehave full use oftheir arms andfingers?Is anyonereceivingtreatment fornerves or anyemotionalcondition?Is anyone havinglong-termtreatment ortaking anymedicine ortablets for acondition orailment?4%13 questions asked, including:Does anyone have any loss of hearing?Does anyone have any condition that makes themslow at learning or understanding things?Does anyone have any condition that restricts themin physical activities, or in doing physical work?Does anyone have any disfigurement or deformity?Does anyone ever need to be helped or supervisedin doing things because of any mental illness?18%4 questions asked,including:Does the person everneed someone to help<strong>with</strong>, or be <strong>with</strong> themfor, self-care activities?Does the person everneed someone to help<strong>with</strong>, or be <strong>with</strong> themfor, communicationactivities?4%19%17 questionsasked, including:Do you/doesanyone in thehousehold haveanything wrong<strong>with</strong> your/theirspeech?Do you/doesanyone in thehousehold haveshortness ofbreath ordifficultybreathing?Do you/doesanyone in thehousehold havechronic orrecurrent pain ordiscomfort?Do you/doesanyone in thehousehold havea nervous oremotionalcondition?CONTINUED uCensus1976Survey ofHandicappedPersons 1981Survey ofDisability, Ageingand Carers 1993Census2006Survey ofDisability, Ageingand Carers 2009MEASURING CHILD DISABILITY65
of enumeration, such as censuses, general andtargeted household surveys, and interviews <strong>with</strong>key informants, have been used to estimatedisability prevalence.General data collection instruments are likely tounderestimate the number of children <strong>with</strong> disabilities.124 They typically employ a generic orfilter question, such as whether anyone in thehousehold ‘is disabled’, or use the same questionsfor all household members regardless oftheir age. <strong>Children</strong> in particular are likely to beoverlooked in surveys that do not specifically askabout them. 125Targeted household surveys that specificallyaddress the issue of child disability or includemeasures specifically designed to evaluate disabilityin children have produced more accurateresults than household surveys or censuses thatask about disability in general. 126 Such surveystend to report higher prevalence rates becausethey usually include more numerous anddetailed questions.Questionnaire designEven well-designed surveys can misreport disabilityif a single set of questions is applied tochildren across the age spectrum. The choiceof questions must be tailored to a child’s age inorder to reflect the developmental stages andevolving capacities of children. 127 Some domains,such as self-care (e.g., washing and dressing),will not be appropriate for very young children.Given the complexity of developmental processesthat take place over the first two years of life,it can be difficult to distinguish disability fromvariations in normal development <strong>with</strong>out specializedtools or assessment. 128Questions designed to assess disability in theadult population are not always applicable tochildren, yet many survey instruments use aFOUR CASE STUDIES (Continued)uCambodia3 questions asked:Does (name) haveany disability?If yes, what type?What was thecause?2 questions asked:Is there a personwho usually lives inyour householdwho has any typeof physicalimpairment?2 questions asked:Does (name) haveany disability?What was thecause?One question asked:If the person isphysically/mentallydisabled, giveappropriate codefrom the list1: in seeing;2: in speech;3: in hearing;4: in movement;5: mentalOne question asked:Does (name) haveany of the following:Difficulty seeing,difficulty hearing,difficulty speaking,difficulty moving,difficulties in feelingor sensing,psychological orbehaviouraldifficulties, learningdifficulties, fits, other(specify)?Impaired sincebirth or due to anaccident?2%2%4%1%5%Socio-EconomicSurvey 1999Demographic andHealth Survey 2000Socio-EconomicSurvey 2003–2004Census2008Socio-EconomicSurvey 201066THE STATE OF THE WORLD’S CHILDREN 2013: <strong>Children</strong> <strong>with</strong> <strong>Disabilities</strong>
single set of questions for both groups. Examplesof questions <strong>with</strong> limited relevance to childreninclude those about falling down or memoryloss, as well as questions about tasks childrenmay be too young to accomplish independently.Questions that link disability <strong>with</strong> anelderly population are not only irrelevant to childassessment but may also introduce a bias in therespondent’s mind as to which should be considereddisability and thus affect the nature andquality of the response. 129 In order to accuratelyassess disability in children, care must be takento use questionnaires specifically designed forthe purpose.Many data collection instruments, includinghousehold surveys and censuses, are basedon parental responses only, <strong>with</strong> caregiversnormally expected to assess and report the disabilitystatus of children under their care. Whileparents and other caregivers are often very wellplaced to identify difficulties that their childrenuTurkey3 questionsasked:Do you have avisible physicaldisability, mentaldisorder orpsychologicaldefect?What is itsnature?What was thecause?1%Census19852 questionsasked:Do you haveany physicalor mentaldisability?What kind?2%Census200012%Turkey Disability Survey20025 questionsasked,including:Do youhave anydisfigurement;restriction ofmovement;bone disease;muscularweakness; lack,shortness orexcess of yourhands, arms,feet, legs,fingers orbackbone?Are you able tospeak, do youhave a speechimpediment,do youspeak <strong>with</strong> astammer?may experience in performing specific tasks,their responses alone are not sufficient to diagnosedisabilities or establish a prevalence ofdisability. Accurate assessment of disability ina child requires a thorough understanding ofage-appropriate behaviours. Survey respondentsmay have limited knowledge of specific benchmarksused for evaluating children at each stageof development and may not be in a position toadequately detect manifestations of particulartypes of disability. Certain temporary conditions,such as an ear infection, may cause acute difficultiesin performing certain tasks and be reportedas a form of disability. At the same time, parentsmay overlook certain signs, or hesitate to reportthem, because of a lack of acceptance or stigmasurrounding disability in their culture. The choiceof terminology used in questionnaires can eitherreinforce or correct such statistically distortingand socially discriminatory phenomena.Purpose and consequencesEfforts to measure child disability represent anopportunity to link assessment <strong>with</strong> interventionstrategies. Often an assessment providesthe first chance for a child <strong>with</strong> a disability to beidentified and referred to or receive some formof immediate care. Unfortunately, capacity andresources for follow-up assessment and supportfor those children who screen positive for disabilityare often scarce. 130 Recognizing the criticalrole of early intervention, the possibility of linkingscreening and assessment <strong>with</strong> simple interventionsshould be explored, especially in low- andmiddle-income settings.Data that capture the type and severity of children’sdisabilities as well as the barriers to thefunctioning and community participation of children<strong>with</strong> disabilities, when combined <strong>with</strong> relevantsocio-economic indicators, help to informdecisions about how to allocate resources,eliminate barriers, design and provide servicesand meaningfully evaluate such interventions.For instance, data can be used to map whetherincome, gender or minority status affects accessMEASURING CHILD DISABILITY67
to education, immunization or nutritionalsupplementation for children <strong>with</strong> disabilities.Regular monitoring makes it possible to assesswhether initiatives designed to benefit childrenare meeting their goals.There is a clear need to harmonize child disabilitymeasurement in order to produce estimatesthat are reliable, valid and internationally comparable.This would facilitate appropriate policyand programmatic responses by governmentsand their international partners, and thus fulfila requirement of the Convention on the Rightsof Persons <strong>with</strong> <strong>Disabilities</strong>. However, the currentlyfragmented state of child disability datacollection is no excuse to defer meaningful actiontowards inclusion. As new data and analysesemerge, they will present opportunities to adaptexisting and planned programmes for children<strong>with</strong> disabilities and their families.A way forwardUNICEF is holding consultations to improve the methodology used to measure child disability in MultipleIndicator Cluster Surveys and other data collection efforts. This work is taking place in partnership <strong>with</strong> theWashington Group on Disability Statistics, national statistical offices and data collection agencies, academics,practitioners, disabled people’s organizations and other stakeholders. Partnership is seen as essential to achievinga reliable and globally relevant monitoring and reporting system on child disability.The Washington Group was established in 2001 under United Nations sponsorship to improve the quality andinternational comparability of disability measures. It has developed or endorsed questions on disability in adultsthat have been used by several countries in censuses and surveys and, in 2010, began work on developing a setof questions to measure functioning and disability among children and youth.Work by UNICEF and the Washington Group to develop a screening tool that reflects current thinking onchild functioning and disability is based on the conceptual framework of the World Health Organization’sInternational Classification of Functioning, Disability and Health for <strong>Children</strong> and Youth. The screening toolunder development focuses on limitations to activity and is intended to serve the purposes of any individualcountry in identifying those children at risk of social exclusion and reduced social participation in family lifeor education, for example. The collaborative effort aims to develop a survey module on child functioning anddisability that would produce nationally comparable figures and promote the harmonization of data on childfunctioning and disability internationally. The module covers children aged 2–17 years and assesses speech andlanguage, hearing, vision, learning (cognition and intellectual development), mobility and motor skills, emotionsand behaviours. In addition to these relatively basic types of activity, the screening tool also includes aspects ofchildren’s ability to participate in a range of activities and social interactions. Rather than rely on a simple yes/no approach, these aspects are to be assessed against a rating scale, to better reflect the degree of disability.Also in development is a standardized overall methodology for a more in-depth assessment of disability in children.This will consist of data collection protocols and assessment tools, as well as a framework for the analysisof findings. Recognizing that specialists may be in short supply in some areas, a toolkit is being designed toenable teachers, community workers and other trained professionals to administer the new methodology. Thiswill serve to strengthen local capacity to identify and assess children <strong>with</strong> disabilities.68THE STATE OF THE WORLD’S CHILDREN 2013: <strong>Children</strong> <strong>with</strong> <strong>Disabilities</strong>
FOCUSLessons learnedSince 1995, UNICEF has supportedcountries in trackingprogress in key areas of children’sand women’s wellbeingthrough the MultipleIndicator Cluster Surveys(MICS). These nationallyrepresentative householdsurveys have been conductedin more than 100 low- andmiddle-income countries, andsome have included a moduledesigned to screen child disability.This information is nowbeing built upon to design animproved measurement toolto assess child disability.Disability became part of theMICS questionnaires in 2000–2001 (MICS2). Since then, dataon disability have been collectedthrough more than 50surveys, making the MICS thelargest source of comparabledata on child disability in lowandmiddle-income countries.The standard disability moduleincluded in MICS surveysconducted between 2000 and2010 is the Ten QuestionsScreen (TQ), which wasdeveloped as part of theInternational Pilot Study ofSevere Childhood Disability in1984. Its design reflects howdisability was understood andmeasured at the time.The TQ process starts <strong>with</strong>an interview <strong>with</strong> the primarycaregivers of children aged2–9 years, who are asked toprovide a personal assessmentof the physical and mentaldevelopment and functioningof the children under their care.Questions include whether thechild appears to have difficultyhearing; whether she or heseems to understand instructions,has fits or loses consciousness;and whether sheor he was delayed in sitting,standing or walking comparedto other children. Response categoriesdo not accommodatenuances, and children are classifiedas screening positive ornegative to each question.The validity of the TenQuestions approach has beenwidely tested, but results mustbe interpreted <strong>with</strong> caution.The TQ is a screening tool, andrequires follow-up medical anddevelopmental assessment inorder to yield a reliable estimateof the number of childrenin a given population who havedisabilities. <strong>Children</strong> who havea serious disability are verylikely to screen positive, butsome who screen positive maybe found to have no disabilityon further evaluation. Somechildren who screen positivemay do so because of temporaryhealth conditions that canbe easily treated. Although theTQ comes <strong>with</strong> a recommendationthat it be followed by anin-depth assessment, few countrieshave had the budgets orcapacity to conduct the secondstageclinical assessment tovalidate results, and they havebeen further hampered by thelack of a standardized methodologyfor conducting theassessment.Applying the Ten QuestionsScreen during the 2005–2006MICS yielded a wide rangeof results across participatingcountries: The percentage ofchildren who screened positivefor disability ranged from3 per cent in Uzbekistan to 48per cent in the Central AfricanRepublic. It was not clearwhether this variance reflectedtrue differences among thepopulations sampled or additionalfactors. For instance, thelow reported rate in Uzbekistanmight have reflected, amongother things, a large populationof children <strong>with</strong> disabilitiesliving in institutions, whichare not subject to householdsurveys.MEASURING CHILD DISABILITY69
FOCUSFrom screeningto assessmentChild disability measurementexperts agree that screeningefforts, such as interviewsusing the Ten Questions Screen(TQ), need to be followed byin-depth assessments. Theseallow the initial screeningresults to be validated, andmake possible a better understandingof the extent andnature of child disability in acountry. Cambodia, Bhutan andthe former Yugoslav Republicof Macedonia are three countriesto have undertaken suchassessments. Their experiencesprovide important lessons forthe measurement of child disabilityand adaptation of methodologyto local context. Theyalso testify to the transformativepower of data collection.In Cambodia, all childrenwho screened positive underthe Ten Questions and a randomlyselected 10 per centwho screened negative werereferred for further assessmentby a multi-professionalteam consisting of doctors,hearing and vision specialists,and psychologists. The teamwas trained and dispatchedaround the country to conductchild disability assessments inlocal health centres and similarfacilities. The decision to usea mobile team of specialistswas made to ensure consistentquality of screening across thecountry and to minimize thelag between screening andassessment.The same sampling approachwas employed in Bhutan,where the screening stageidentified 3,500 children at risk,out of a sample of 11,370 children.A core team of seven professionalsreceived two weeksof training in how to conductthe assessment. In turn, theywere responsible for traininganother 120 health and educationprofessionals. These professionalswere then split intotwo groups. The first consistedof 30 supervisors recruitedfrom among general-practicephysicians, paediatricians, eyespecialists, physiotherapistsand special educators. The secondgroup of 90 field surveyorsand assessors was madeup largely of primary schoolteachers and health workers.The methodology used in theformer Yugoslav Republic ofMacedonia was derived fromthat used in Cambodia, <strong>with</strong>some adaptations shaped bythe technical expertise andtools available in the localcontext. Two studies wereconducted: a national studyand one focusing on the Romapopulation. The assessmentconsisted of one hour <strong>with</strong> aphysician and psychologist anda 10–15 minute assessment<strong>with</strong> an ophthalmologist andaudiologist.Experiences in all threecountries demonstrate theimportance of partnerships inmobilizing limited resourcesand ensuring high responserates, which in turn provide forrobust findings. These partnershipsinvolved governmentagencies and their internationalpartners, disabled people’sorganizations and other civilsociety organizations. In theformer Yugoslav Republicof Macedonia, for example,partners made it possibleto conduct assessments inlocal kindergartens during70THE STATE OF THE WORLD’S CHILDREN 2013: <strong>Children</strong> <strong>with</strong> <strong>Disabilities</strong>
A strategy for intervention on behalf of children identified ashaving a disability should be incorporated in the assessmentfrom the earliest stages of planning.weekends, which was convenientfor children and theirfamilies.It is also important to adaptthe composition of the coreassessment team and the typeof tools used to local capacity.At the time of the study, bothCambodia and Bhutan faced ashortage of qualified assessors.In Cambodia this was overcomeby employing a mobile assessmentteam, while in Bhutanemphasis was put on trainingmid-level professionals. Theavailability of specialists cannotbe taken for granted – inthe case of Cambodia, the leadhearing specialist was broughtin from abroad.Assessment tools – questionnairesand tests – should belocally validated and culturallyappropriate. Careful attentionmust be paid to language. Oneof the challenges encounteredin Cambodia pertained totranslating assessment instrumentsfrom English to Khmer,and especially finding linguisticequivalents for the conceptsof impairment and disability.The diagnostic assessmentform used in the Cambodianstudy was revised to suit theformer Yugoslav Republicof Macedonia and the localChuturich test was utilized forthe psychological componentof the assessment.Assessment leadsto actionWith assessment comes thepotential for immediate intervention.In Cambodia, somechildren who screened positivefor hearing impairment werefound to have an ear infectionor a build-up of ear wax.This limited their hearing andin many cases also their participationin school, but, onceidentified, their conditions wereeasily treated and more serioussecondary infections andlonger-term impairments werethus prevented.Assessment can also aidawareness raising and sparkchange even while the processesof collecting and analysingdata are still under way. Whenclinical assessments in Bhutanshowed a higher incidenceof mild cognitive disabilitiesamong children from poorerhouseholds and those whosemothers had less education,the government decided tofocus on early childhood developmentand childcare servicesin rural areas, where incomeand education levels are lower.And in the former YugoslavRepublic of Macedonia, findingsthat revealed unequalaccess to education havespurred plans to improveschool participation and fightdiscrimination against children<strong>with</strong> disabilities.A strategy for intervention onbehalf of children identified ashaving a disability should beincorporated in the assessmentfrom the earliest stages of planning.Such a strategy shouldinclude a mapping of the availableservices, the developmentof referral protocols and thepreparation of informativematerials for families on howto adjust children’s surroundingsto enhance functioningand participation in home andcommunity life.MEASURING CHILD DISABILITY71
PERSPECTIVEFrom invisibility to inclusion forindigenous children <strong>with</strong> disabilitiesBy Olga Montufar ContrerasOlga Montufar Contreras is thepresident of the Step by StepFoundation, a multiculturalorganization that promotesthe social mainstreaming ofindigenous people <strong>with</strong> disabilitiesin Mexico. The daughter of adeaf woman, she was trained asan engineer and has a Master’sdegree in development andsocial policy.Indigenous people have longhad to live <strong>with</strong> extremepoverty, discrimination andexclusion from society andsocial services. Within ourcommunities, girls and boys<strong>with</strong> disabilities are the mostvulnerable and fare the worst.Their marginalization persistseven though three internationalhuman rights instruments – theConvention on the Rights ofPersons <strong>with</strong> <strong>Disabilities</strong>, theUnited Nations Declarationon the Rights of IndigenousPeoples and the Convention onthe Rights of the Child – affordus a historic opportunity toaddress the challenges facedby indigenous children <strong>with</strong>disabilities.I grew up <strong>with</strong> physical disability,brought on by poliomyelitis,in an indigenous communityand I have seen that despite thepassing of the years, the situationhas changed little – if at all.Today, just as when I was little,children <strong>with</strong> disabilities areostracized and their rejectionby the community extends toparents and siblings, becausethe disability is considered asdivine punishment and a child<strong>with</strong> a disability is seen as aliability for the community.Now as then, it is extremelydifficult to access services andmeet the additional expensesgenerated by a family member<strong>with</strong> a disability. Grinding poverty,geographic isolation andpolitical marginalization sustainand are reinforced by discriminationand prejudice. The consequencescan be severe: Manymothers, weak and lacking thepower to change things, remainsilent about our condition orresort to infanticide.My family is one of few thatshow solidarity towards theirsons and daughters who havedisabilities. In our case, thiswas partly because we hadmigrated to the city and couldobtain housing closer to services.But in the desperate circumstancesunder which mostof our families live, violationsof our human rights are commonand fail to spark concernamong others. This is why itis necessary to mobilize thewill and resources to takemeaningful action.One of the most pressingproblems to be addressed isthe lack of data on indigenouscommunities in general andour children <strong>with</strong> disabilities inparticular. Data can behard to gather: Indigenous72THE STATE OF THE WORLD’S CHILDREN 2013: <strong>Children</strong> <strong>with</strong> <strong>Disabilities</strong>
Data can be hard to gather: Indigenous households can bescattered, often in remote areas. There might not be enoughinterviewers who speak indigenous languages.households can be scattered,often in remote areas. Theremight not be enough interviewerswho speak indigenous languages.In many cases, familiesdeny our existence to the peoplewho conduct surveys. Evenwhere parents acknowledgeand want to support us, theycan end up providing insufficientinformation because theyhave little of it to begin <strong>with</strong>, asthere are few if any screeningor diagnostic services. Becausethe lack of such services contributesto our invisibility, it isa threat to our physical andintellectual condition. Addingto the problems, girls and boys<strong>with</strong> disabilities often go unregisteredat birth, and this is oneof the main obstacles to therecognition of our citizenshipand our right to public services.This should motivate researchinto disability among indigenouspopulations – and theresults can serve as a startingpoint for developing public policiesand services that addressour needs and guarantee ourrights.The lack of access to the mainstreameducation system mustalso be corrected. The inclusionof indigenous children <strong>with</strong> disabilitiesis required under theConvention on the Rights ofPersons <strong>with</strong> <strong>Disabilities</strong>, butin practice, inclusion is oftenbeyond the reach of childrenfrom our communities: Thedistances they must travel dailyto get to school can be prohibitive.Few schools have theminimum services and facilitiesto make learning accessible.And again, traditional communitypractices contribute to thelack of educational inclusion.Clan chiefs determine the rolesof boys and girls from birth andif a child has a disability, it isgenerally thought that sendingher or him to school is a wasteof time as well as an undueeconomic burden on the family.Many people think that thoseof us who have a disability arebroken objects that will not beuseful even if we are patchedup. The situation is even worsefor girls, as it is harder for us toobtain permission to study thanit is for boys <strong>with</strong> disabilities.Even when the community’sstigmas are overcome and wemanage to attend school, ourteachers face two obstacles:insufficient knowledge ofindigenous languages andinadequate teacher training ininclusive education. This lack oftraining makes it more difficultto include children <strong>with</strong> disabilities.As a consequence, we areforced to rely on the goodwillof individual teachers to acceptthe challenge of includingindigenous children <strong>with</strong> disabilitiesin their classrooms.In Mexico as elsewhere, governments,international agenciesand community groups arestriving to eliminate the gapbetween what is ideal and whatis currently possible. We mustcontinue to work together toensure more just and equitablechildhoods, to transform thelives of indigenous girls andboys <strong>with</strong> disabilities <strong>with</strong> hopeand opportunity – so they, too,can be free to let their dreamstake flight.MEASURING CHILD DISABILITY73
Nguyen, who has autism, attends a class specifically tailored to his needs at the Da Nang Inclusive Education Resource Centre in Viet Nam.Such centres were set up to help children prepare for admission to inclusive mainstream schools. © UNICEF/Viet Nam/2012/Bisin
CHAPTER 7AN AGENDAFOR ACTIONThe nations of the world have repeatedly affirmed theircommitment to building more inclusive societies. As a result,the situation of many children <strong>with</strong> disabilities and theirfamilies has improved.Progress has varied between and <strong>with</strong>in countries,however. Too many children <strong>with</strong> disabilitiescontinue to face barriers to their participationin the civic, social and cultural affairs of theircommunities. This is true in situations that maybe considered normal as well as during humanitariancrises. The following recommendationsapply equally urgently in humanitarian situations,and their application in that context is detailedin Chapter 5. Realizing the promise of equitythrough inclusion will require action in theareas and by the actors identified below andthroughout this report.Ratify and implement theConventionsThe Convention on the Rights of Persons <strong>with</strong><strong>Disabilities</strong> (CRPD) and the Convention on theRights of the Child (CRC) provide detailed guidancefor the development of inclusive societies. Asthis year began, 127 countries and the EuropeanUnion had ratified the CRPD and 193 had ratifiedthe CRC. They have thus shown a commitment toall their citizens. Others have yet to join the globalmovement that these countries represent.Ratification alone will not be enough. The processof honouring commitments in practice willrequire effort on the part of national governments,local authorities, employers, disabled people’sorganizations and parents’ associations. Inaddition, international organizations and donorscan align their assistance <strong>with</strong> these internationalinstruments. Making good on the promises ofthe Conventions will require not only diligentenforcement but also rigorous monitoring and anunflagging commitment by all to accountabilityand adaptation.Fight discriminationDiscrimination lies at the root of many of thechallenges confronted by children <strong>with</strong> disabilitiesand their families. The principles of equalrights and non-discrimination should be reflectedin law and policy and need to be complementedby efforts to enhance awareness of disabilityamong the general public, starting <strong>with</strong> thosewho provide essential services for children insuch fields as health, education and protection.To this end, international agencies and their governmentand community partners can increaseefforts to provide officials and public servants atall levels of seniority <strong>with</strong> a deeper understandingof the rights, capacities and challenges ofchildren <strong>with</strong> disabilities so that policymakersand service providers are able to prevail againstprejudice – be it society’s or their own.When communities are accepting of disability aspart of human diversity, when generic systemslike education and recreation are available andinclusive, and when parents are not forced toAN AGENDA FOR ACTION75
carry the entire additional costs associated <strong>with</strong>disability, the families of children <strong>with</strong> disabilitiescan cope and thrive much like other families.Parents’ organizations can play a pivotal role andshould be reinforced so that children <strong>with</strong> disabilitiesare valued, cherished and supported bytheir families and communities.States parties to the CRPD and the UnitedNations and its agencies have committed themselvesto conducting awareness-raising campaignsto change attitudes towards children<strong>with</strong> disabilities and their families. Among otherthings, this will involve highlighting their abilitiesand capacities, and promoting communityengagement <strong>with</strong> and by children <strong>with</strong> disabilities.States parties are also required to provideinformation to families on how to avoid, recognizeand report instances of exploitation, violenceand abuse.Discrimination on the grounds of disability isa form of oppression. The establishment ofa clear, legal entitlement to protection fromConvention on the Rights of Persons <strong>with</strong> <strong>Disabilities</strong> andOptional Protocol: Signatures and ratifications155128917627COUNTRIES HAVESIGNED THECONVENTION*COUNTRIES HAVERATIFIED THECONVENTION*COUNTRIES HAVESIGNED THEPROTOCOLCOUNTRIES HAVERATIFIED THEPROTOCOLCOUNTRIES HAVENOT SIGNEDAfghanistanBolivia (Plurinational State of)Costa RicaEthiopiaAlbaniaBosnia and HerzegovinaCôte d’IvoireFijiAlgeriaBotswanaCroatiaFinlandAndorraBrazilCubaFranceAngolaBrunei DarussalamCyprusGabonAntigua and BarbudaBulgariaCzech RepublicGambiaArgentinaBurkina FasoDemocratic People’sGeorgiaArmeniaBurundiRepublic of KoreaGermanyAustraliaCambodiaDemocratic RepublicGhanaAustriaCameroonof the CongoGreeceAzerbaijanCanadaDenmarkGrenadaBahamasCape VerdeDjiboutiGuatemalaBahrainCentral African RepublicDominicaGuineaBangladeshChadDominican RepublicGuinea-BissauBarbadosChileEcuadorGuyanaBelarusChinaEgyptHaitiBelgiumColombiaEl SalvadorHondurasBelizeComorosEquatorial GuineaHungaryBeninCongoEritreaIcelandBhutanCook IslandsEstoniaIndia*Includes the European Union.Source: UN Enable; United Nations Treaty Collection. For notes on terms used, see p.154.76THE STATE OF THE WORLD’S CHILDREN 2013: <strong>Children</strong> <strong>with</strong> <strong>Disabilities</strong>
discrimination is vital in reducing the vulnerabilityof children <strong>with</strong> disabilities. Legislation is mademore meaningful when children <strong>with</strong> disabilitiesare informed of their right to protection from discriminationand are shown how to exercise thisright. Where legislation banning discriminationon the basis of disability does not exist, disabledpeople’s organizations and civil society as awhole will continue to have a crucial role to playin pressing for such laws – as they do in providingservices and promoting transparencyand accountability.Dismantle barriers to inclusionAll children’s environments – early childhoodcentres, schools, health facilities, public transport,playgrounds and so on – can be built tofacilitate access and encourage the participationof children <strong>with</strong> disabilities alongside their peers.Universal design – the idea that all products, builtenvironments, programmes and services shouldbe usable to the greatest extent possible by allpeople, regardless of their ability, age or socialstatus – should be applied in the construction of(continued on p. 80)Signed Convention Ratified Convention Signed Protocol Ratified Protocol Not signedIndonesiaMauritiusRomaniaThe former Yugoslav RepublicIran (Islamic Republic of)MexicoRussian Federationof MacedoniaIraqMicronesia (Federated States of)RwandaTimor-LesteIrelandMonacoSaint Kitts and NevisTogoIsraelMongoliaSaint LuciaTongaItalyMontenegroSaint Vincent and theTrinidad and TobagoJamaicaMoroccoGrenadinesTunisiaJapanMozambiqueSamoaTurkeyJordanMyanmarSan MarinoTurkmenistanKazakhstanNamibiaSao Tome and PrincipeTuvaluKenyaNauruSaudi ArabiaUgandaKiribatiNepalSenegalUkraineKuwaitNetherlandsSerbiaUnited Arab EmiratesKyrgyzstanNew ZealandSeychellesUnited KingdomLao People’sNicaraguaSierra LeoneUnited Republic of TanzaniaDemocratic RepublicNigerSingaporeUnited StatesLatviaNigeriaSlovakiaUruguayLebanonNiueSloveniaUzbekistanLesothoNorwaySolomon IslandsVanuatuLiberiaOmanSomaliaVenezuela (BolivarianLibyaPakistanSouth AfricaRepublic of)LiechtensteinPalauSouth SudanδViet NamLithuaniaPanamaSpainYemenLuxembourgPapua New GuineaSri LankaZambiaMadagascarParaguaySudanδZimbabweMalawiPeruSurinameMalaysiaPhilippinesSwazilandMaldivesPolandSwedenMaliPortugalSwitzerlandMaltaQatarSyrian Arab RepublicMarshall IslandsRepublic of KoreaTajikistanMauritaniaRepublic of MoldovaThailandAN AGENDA FOR ACTION77
PERSPECTIVEOpen the doors toeducation – and employmentBy Ivory DuncanBorn in 1991, Ivory Duncanis pursuing a degree inCommunications Studies fromthe University of Guyana. Sheadvocates for the rights of youth<strong>with</strong> disabilities through theLeonard Cheshire Disability YoungVoices network and volunteersat the National Commission onDisability in Guyana.Like me, countless other youngpeople <strong>with</strong> disabilities arestriving towards a future thatcannot be taken for granted.Will we overcome the physicaland financial barriers tohigher education? If we makeit through to graduation fromuniversity or vocational school,what jobs await us? Will wehave equal opportunity, or facediscrimination? Will we getthe chance to prove ourselvesin the competitive world ofemployment? And if not, howare we to be full citizens andproducers, members of societyin equal standing <strong>with</strong> thosewho do not have disabilities?I lost my right leg following atraffic accident when I was 15years old. My parents, peopleof humble means, persevere inhelping to meet my expensesso I can pursue a universityeducation, even as they try toraise two other children <strong>with</strong>disabilities. Life can be hard,but I am grateful for my goodfortune: I have a loving familyand am working to accomplishmy dream of getting a degreeand having a career.Fulfilling our dreams takeseffort not required of youngpeople <strong>with</strong>out disabilities. Toget from home to the university,I have no option but to goby taxi because the only otherway would be to take a boat orcross the Demerara HarbourBridge, neither of which I cando in my wheelchair. Payingfor a taxi is expensive, and myparents struggle to make endsmeet. Attending universityis also a physical challenge.It is difficult making my wayto classes because the classroomsare often not accessibleto wheelchair users. There arelong flights of stairs, and whenI finally manage to get to aclass, I am tired and frustratedand find it hard to focus onthe lectures. But I am tryingbecause I know it is better totry and fail than to fail to try.The challenges begin longbefore reaching higher education.<strong>Children</strong> <strong>with</strong> disabilitiescan easily become shut-ins,hidden away from society andunable to attend school ormake a meaningful contributionto society. They should beencouraged to attend mainstreamschools if possible,while special schools thatinclude vocational trainingand support services shouldalso be available. Specialneedsschools should offer a78THE STATE OF THE WORLD’S CHILDREN 2013: <strong>Children</strong> <strong>with</strong> <strong>Disabilities</strong>
I would like to be confident that when I graduate and look for ajob, I will not be discriminated against because of my disability,but instead be recognized for my abilities, qualifications andpotential.complete curriculum for students<strong>with</strong> disabilities, to helpto develop their minds and givethem opportunities to achieveacademic excellence. Manychildren and young people <strong>with</strong>disabilities want to go on tohigher education, so it is veryimportant that they be includedin schools and other learninginstitutions and given the sameoptions as other students interms of choosing courses andactivities. It is up to educationalinstitutions and governmentsto accommodate and supportstudents like me, so that we areable to pursue the educationwe need to achieve whatevergoals we may have.Accommodating children andyoung people <strong>with</strong> disabilitiesincludes things like adjustingthe entry requirements andcriteria for passing, and makingsure that learning materials,examinations and classschedules take our needs intoaccount. Teachers need to beproperly trained and given achance to pursue additionaloverseas instruction in orderto improve the quality of education.Schools should teachBraille and other forms of communicationwhere necessary,and there is also a great needfor special equipment, whichmany schools in Guyana donot have. Making educationalinstitutions disability-friendlyalso means setting up facilitiesand transportation services thatpersons <strong>with</strong> disabilities canuse; there should be ramps forwheelchair users, accessibletoilets and elevators for peoplewho cannot take the stairs. Allaspects and all levels of education,from elementary schoolto university, need to be madeaccessible.The ministries for educationand public service should alsowork together to assist academicallyinclined students<strong>with</strong> disabilities who wish togo beyond secondary school.Because financial difficultiesare a major reason why youngpeople <strong>with</strong> disabilities areunable to continue their education,this assistance shouldinclude grants, loans andscholarships.Governments also need tomake sure that educationopens the same doors for students<strong>with</strong> disabilities as foreverybody else. My parentshave put in a lot of effort andmore money than they canreally afford to help me to getthrough school and to university– and now I am workinghard, in spite of the challenges,to come to classes and learn,because I know that is what Ineed to do to get the best outof life. So I would also like tobe confident that when I graduateand look for a job, I willnot be discriminated againstbecause of my disability, butinstead be recognized for myabilities, qualifications andpotential. As a young person<strong>with</strong> a disability who hasworked hard to educate herself,I deserve as much as anyoneelse the opportunity to fulfillmy dreams, make a good livingfor myself and contributeto our society.AN AGENDA FOR ACTION79
(continued from p. 77)public and private infrastructure. When childreninteract and understand each other across levelsof ability, they all benefit.The principles of universal design also apply tothe development of inclusive school curricula andvocational training programmes as well as childprotection laws, policies and services. <strong>Children</strong>need access to systems designed to equip them<strong>with</strong> the educational and life skills to see theminto and through their adult years, and those thatprotect them from neglect, abuse and violenceon their way to adulthood. If protection fails, theyneed to be able to make complaints and seek justice.Governments have the decisive role to playin introducing and implementing the legislative,administrative and educational measures necessaryto protect children <strong>with</strong> disabilities from allforms of exploitation, violence and abuse in allsettings. It is not appropriate to create separatesystems for children <strong>with</strong> disabilities – the goalmust be inclusive, high-quality child protectionmechanisms suitable for and accessibleto all children. One such mechanism is birthregistration. Although not a guarantee in itself,it is an essential element of protection. Efforts toregister children <strong>with</strong> disabilities – and therebyrender them visible – deserve priority.End institutionalizationAll too often, invisibility and abuse are the fateof children and adolescents <strong>with</strong> disabilitieswho are confined to institutions. Facilities arepoor substitutes for a nurturing home life even ifthey are well run, responsive to children’s needsand subject to inspection. Immediate measuresto reduce overreliance on institutions couldinclude a moratorium on new admissions. Thisshould be accompanied by the promotion ofand increased support for family-based care andcommunity-based rehabilitation. Additionally,there is a need for broader measures that reducethe pressure for children to be sent away inthe first place. These include the developmentof public services, schools and health systemsaccessible and responsive to children <strong>with</strong> disabilitiesand their families.<strong>Children</strong> <strong>with</strong> hearing and visual impairments learn the craft of pottery at an orphanage in Moscow Oblast, RussianFederation. © UNICEF/RUSS/2011/Kochineva80THE STATE OF THE WORLD’S CHILDREN 2013: <strong>Children</strong> <strong>with</strong> <strong>Disabilities</strong>
Support familiesThe CRC states that children should grow up ina family environment. It follows that the familiesof children and adolescents <strong>with</strong> disabilities mustbe adequately supported to provide the bestpossible environment and quality of life for theirchildren. Support for families and caregivers –subsidized day care, for example, or by grants tooffset the increased costs and reduced incomethat come <strong>with</strong> caring for a child <strong>with</strong> a disability– can prove critical in reducing the pressure toadmit children <strong>with</strong> disabilities to institutions inthe first place. Such support can also improve theprospects for children who return to the communityafter living in an institution.Disability in the family is often associated <strong>with</strong>higher costs of living and lost opportunities toearn income, and thus may increase the risk ofbecoming or remaining poor. <strong>Children</strong> <strong>with</strong> disabilitieswho live in poverty can find it especiallydifficult to obtain such services as rehabilitationand assistive technology. To leave them and theirfamilies to fend for themselves would be to danglethe promise of inclusion just beyond their reach.Social policies should take into account the monetaryand time costs associated <strong>with</strong> disability.These costs can be offset <strong>with</strong> social grants,subsidies for transportation or funding for personalassistants or respite care. Cash benefits areeasier to administer and more flexible at meetingthe particular needs of children <strong>with</strong> disabilitiesand their families. They also respect the decisionmakingrights of parents and children. Wherecash transfer programmes for families living indifficult circumstances already exist, they can beadapted so that the families of children <strong>with</strong> disabilitiesare not unintentionally left out or offeredinadequate support. These recommendationswould be urgent under any circumstances butare especially so in these straitened times: Aidand social budgets are being cut, unemploymentremains high, goods and services grow increasinglyexpensive. Families around the world facean increased risk of poverty.Move beyond minimum standardsExisting supports and services should be continuouslyassessed <strong>with</strong> a view to achieving thebest possible quality. The aim must be to movebeyond minimum standards. Attention needs tobe focused on serving the individual child <strong>with</strong>a disability as well as on transforming entiresystems or societies. The ongoing involvementof children <strong>with</strong> disabilities and their familiesin evaluating services will help to guaranteeadequate and appropriate provision as childrengrow and their needs change. The importance ofthis participation cannot be overstated. <strong>Children</strong>and young people <strong>with</strong> disabilities are amongthe most authoritative sources of informationon what they need and whether their needs arebeing met.Coordinate services to supportthe childBecause the effects of disability cut across sectors,services can be coordinated to take intoaccount the full range of challenges confrontingchildren <strong>with</strong> disabilities and their families.A coordinated programme of early interventionacross the health, education and welfare sectorswould help to promote the early identificationand management of childhood disabilities.Across all sectors, early childhood interventionsshould be strengthened. Studies have shown thatgains in functional capacity can be largest wheninterventions occur early in a child’s development.When barriers are removed earlier in life,the compounding effect of the multiple barriersfaced by children <strong>with</strong> disabilities is lessened.As children advance through their early years,their ability to function can be enhanced throughrehabilitation. Improvements in ability will havegreater impact if school systems are willing andable to accept them and meet their educationalneeds. Moreover, acquiring an education wouldbe more meaningful if there were also inclusiveschool-to-work transition programmes andeconomy-wide efforts to promote the employmentof people <strong>with</strong> disabilities.(continued on p. 84)AN AGENDA FOR ACTION81
PERSPECTIVEEnd the ‘book famine’ <strong>with</strong> bettertechnology, attitudes and copyright lawBy Kartik SawhneyKartik Sawhney is a nationalaward-winninghigh school studentin New Delhi, India. He is activein advocating for the rights ofpersons <strong>with</strong> disabilities and is amember of the Leonard CheshireDisability Young Voices network.Visually impaired peopleface what at least one writerhas called a ‘book famine’.This is not news to us: Thevisually challenged and printimpairedhave been strugglingfor accessibility for along time. ‘Accessibility’ is anall-encompassing term thatincludes access to the physicalenvironment, transportation,information and communicationtechnology, education andother facilities. In my view, itis crucial that accessible materialbe readily available. Theurgency is even greater whenwe consider the situation indeveloping nations.When I conducted an informalsurvey of nearly 60 visuallychallenged students in primaryand secondary grades inmainstream schools in India,I found that less than 20 percent of them had access tomaterial in their preferredformat, and less than 35 percent to material in any format.Being visually challenged, I’vehad several experiences wherelack of accessibility has impededme from availing myselfof the same opportunities asothers. The effort needed tomake reading material accessibleis monumental. Thanksto advances in optical characterrecognition (OCR) – a technologythat converts printed,handwritten or typewritten textinto machine-encoded text,making it possible for computerizedvoices to read the textaloud – there has been someimprovement. However, technicalcontent remains inaccessible.I spend around two hoursa day typing out the printedmaterial from my science andmath classes, for example,because OCR software cannotread diagrams and special symbols<strong>with</strong> sufficient accuracy.The plight of rural students iseven worse: They depend onhumans to read volumes ofinformation aloud to them. Forinstance, my friends in a smallvillage have no option but torely completely on volunteerswho come by weekly.Even much online content cannotbe read by standard screenreading utilities, primarily as aresult of the varying standardsand platforms used by authorsand designers. Although theWorld Wide Web Consortium(W3C) has produced guidelinesfor websites to follow inorder to ensure a wonderful82THE STATE OF THE WORLD’S CHILDREN 2013: <strong>Children</strong> <strong>with</strong> <strong>Disabilities</strong>
Being visually challenged, I’ve had several experiences wherelack of accessibility has impeded me from availing myself ofthe same opportunities as others.experience for all, this visionis far from achieved. I comeacross websites daily that arenot W3C-standard compliant.This calls for greater scrutinyby not only governments, butalso civil society, academia andinternational organizations. TheGovernment of India has takensteps to bring about a positivechange on this front; it nowoffers a National Award for theEmpowerment of Persons <strong>with</strong><strong>Disabilities</strong> in the category of‘Best Accessible Website’. Thisincentive drives organizationsto make their websites accessible.If applied by enoughcountries, such measurescould usher in a revolution.This is not just a matter forgovernments: Anyone canmake a positive difference.I recall a historic achievementmade in 2011 by a group ofvisually challenged youth inBangalore, India. Preparing forthe entrance exams to prestigiousbusiness schools in thecountry, they contacted thewell-known educational publisherPearson Education andrequested that they publishtheir material in an accessibleformat. Pearson agreed andhas since then made much oftheir material available for thevisually challenged. However,not all publishers are as sensitiveand understanding. Lack ofawareness and insensitivity aretwo of the biggest challenges.Unless – until – there is a paradigmshift in attitudes towardspeople who are visually challenged,it will be difficult toovercome the challenges thatplague the print-impairedcommunity today.But there is another barrier toaccess – a political and legal,not technical or attitudinal, one.Currently, only 57 countrieshave amended their copyrightlaws to provide concessionsfor people <strong>with</strong> visual impairments.Thus, providing e-booksfor the visually challenged isunfortunately still consideredan infringement of copyrightin many countries – and thisprevents local publishers fromhelping out <strong>with</strong>in the community.For a young student, thesefacts are extremely disturbing:Since most countries havepledged to provide maximumsupport and cooperation for thewelfare and empowerment ofpersons <strong>with</strong> disabilities, thereturns out to be a vast differencebetween the laws on paper andactual, real-world implementation.The need of the hour is totranslate words into action.I suggest an international bodyto oversee implementation ofinternational disability legislation,to the extent that it doesnot violate national sovereignty.Copyright law must beamended. I hope that countrieswill continue to work on thelegal framework, and that theUnited Nations will take actiontowards a referendum on thisissue. With concerted effort,I believe we will secure thisinalienable right for all people<strong>with</strong> disabilities, everywhere:the right to access all material!AN AGENDA FOR ACTION83
(continued from p. 81)Involve children <strong>with</strong> disabilities inmaking decisions<strong>Children</strong> and adolescents <strong>with</strong> disabilities belongat the centre of efforts to build inclusive societies– not just as beneficiaries, but as agents ofchange. States parties to the CRPD have affirmedthe right of children <strong>with</strong> disabilities to expresstheir views freely on all matters affecting them. Inso doing, governments have reaffirmed the principlesof the CRC and have obligated themselvesto consult children <strong>with</strong> disabilities when developingand implementing legislation and policiesthat concern them. This is in States’ interest, forchildren and young people <strong>with</strong> disabilities canenrich policymaking and service provision <strong>with</strong>their daily experiences and are uniquely qualifiedto provide information on whether their needsare being met and their contributions utilizedacross the full spectrum of issues and interventions:from health and nutrition to sexual andreproductive health, education and services forthe transition to adulthood.The right to be heard applies to all children,regardless of type or degree of disability, andeven children <strong>with</strong> profound disabilities can besupported to express their choices and desires.A child who is able to express herself or himselfis a child who is much less likely to be abusedor exploited. Conversely, abuse and exploitationthrive where children lack the means to challengetheir oppression. Participation is especiallyimportant for such marginalized groups aschildren who live in institutions.To recognize that children and adolescents <strong>with</strong>disabilities are the holders of rights, not the recipientsof charity, is not to eliminate the need forappropriate rehabilitation, medical treatment oraids and appliances. It does mean, however, thatchildren’s rights, perspectives and choices mustbe respected. In turn, this will entail decision-makerscommunicating in ways and by means thatare easily accessed and used by children <strong>with</strong> disabilities,so their views can be incorporated in the<strong>Children</strong> play netball at Ojwina Primary School in Lira, Uganda. © UNICEF/UGDA2012-00120/Sibiloni84THE STATE OF THE WORLD’S CHILDREN 2013: <strong>Children</strong> <strong>with</strong> <strong>Disabilities</strong>
Six-year-old Nemanja (far left) sits <strong>with</strong> classmates in Novi Sad, Serbia. His primary school was the first to integratechildren <strong>with</strong> disabilities under a law aimed at reducing institutionalization. © UNICEF/HQ2011-1156/Holtdesign, implementation and evaluation of policiesand services.Global promise, local testIn order to fulfil the promises of the CRPD andCRC, international agencies and donors and theirnational and local partners can include children<strong>with</strong> disabilities in the objectives, targets andmonitoring indicators of all development programmes.Reliable and objective data are importantto assist in planning and resource allocation,and to place children <strong>with</strong> disabilities more clearlyon the development agenda. The necessary statisticalwork will take time but would be given vitalimpetus were international donors to promote aconcerted global research agenda on disability. Inthe meanwhile, planning and programming willhave to continue; denying or delaying services tochildren <strong>with</strong> disabilities because more data areneeded would be unacceptable. Rather, plans,programmes and budgets can be designed toallow for modifications as additional informationis made available.The ultimate proof of all global and nationalefforts will be local, the test being whether everychild <strong>with</strong> a disability enjoys her or his rights –including access to services, support and opportunities– on a par <strong>with</strong> other children, evenin the most remote settings and the mostdeprived circumstances.AN AGENDA FOR ACTION85
PERSPECTIVE<strong>Children</strong> <strong>with</strong> disabilities anduniversal human rightsBy Lenín Voltaire Moreno GarcésThere can be no such thingas the universal exercise ofhuman rights unless theserights are enjoyed by all people– including the most vulnerable.Spurred by this conviction,the Office of the Vice-Presidentof the Republic of Ecuador hasfocused on ascertaining andimproving the situation of people<strong>with</strong> disabilities – starting<strong>with</strong> children.technical assistance donationsconsisting of such itemsas wheelchairs, walkers, antibedsoremattresses, walkingsticks, hearing aids and visualkits, depending on the needor needs identified. Three newprosthetics shops were establishedand expected to deliver1,960 prosthetic and orthopaedicdevices to the country’schildren in 2012 alone.Lenín Voltaire Moreno Garcés,Vice-President of the Republic ofEcuador from 2007 until May 2013,was Latin America’s only holderof high office <strong>with</strong> a physicaldisability. The statistics in thisessay were drawn from nationalprogramme documents.Beginning in July 2009, weconducted surveys throughoutEcuador under a projectknown as the Manuela EspejoSolidarity Mission. By visiting1,286,331 households in thecountry’s 24 provinces and 221cantons, we were able to identify293,743 persons <strong>with</strong> disabilities.Of this total, some 24per cent had intellectual disabilitiesand the remaining 76 percent had physical or sensorydisabilities. We estimated theprevalence of major disabilitiesat over 2 per cent of the nationalpopulation, as measured bythe 2010 census.We found that about 55,000boys and girls under 18 yearsof age had disabilities, accountingfor about 19 per cent ofall persons <strong>with</strong> disabilities inEcuador. As of June 2012, thesechildren had received 87,629We also found that many familieslive in extremely difficultcircumstances. The care ofchildren <strong>with</strong> severe disabilitiescan be particularly expensive,forcing mothers to abandonthem in order to earn money.So the Joaquín Gallegos LaraSubsidy was established andprovides the equivalent ofUS$240 per month in financialassistance to the primary caregiverof a child or adult <strong>with</strong> adisability. Training in first-aidservices, hygiene and rehabilitationis also provided. Ecuadoris thus recognizing, for the firsttime, the labour of love performedby families who carefor persons <strong>with</strong> disabilities.As of June 2012, the subsidieshad benefited 6,585 children,43 per cent of them girls.In addition to support, ourapproach attaches importance86THE STATE OF THE WORLD’S CHILDREN 2013: <strong>Children</strong> <strong>with</strong> <strong>Disabilities</strong>
We [in government] must understand that disability is not aproblem but rather a circumstance. . . . [We must] assist ouryoungest citizens in entering the mainstream.to early detection and intervention.By 2012, some 1.1 millionchildren under age 9 had beenscreened to detect hearingimpairments and promote earlyintervention. To this end, 1,401diagnostic and aural screeningservice units were set upin the Ministry of Public Healthnetwork; 1,500 health professionalswere trained; 30 speechtherapy service units wereestablished; and 1,508 hearingaids were provided.In 2013, 714,000 children willhave been screened at 24impaired-sight service centresand we expect that some 2,500children will receive aids tohelp them improve their visionor function <strong>with</strong> blindness.We have also set up a nationalprogramme to screen newbornsfor congenital conditionsthat can be treated. ByDecember 2011, this effort,known as ‘Right Foot Forward:The Footprint of the Future’,had screened 98,034 newbornsand found 30 cases of congenitalhypothyroidism, galactosaemia,congenital adrenalhyperplasia or phenylketonuria.Each of these 30 girls and boyshas received treatment forconditions that, if left untreatedin the first few weeks ormonths of life, place children atincreased risk of low cognition,speech impairment and tremors,among other impairments.Beyond bio-social support andearly intervention, we are pursuingsocial and cultural inclusion.Under the banner of ‘AnEcuador of Joy and Solidarity’,70,000 children and young people<strong>with</strong> and <strong>with</strong>out disabilitieshave participated in inclusivefairs held throughout the country.Play and games are beingpromoted as means of creatingspace for integration. At thesefairs, persons <strong>with</strong> disabilitiestake the lead as instructorsin physical exercise, arts andcrafts, games and storytelling.Some 7,700 marginalized orvulnerable children and youngpeople are advancing their personaldevelopment, self-esteemand social integration throughsuch pursuits as dance, music,painting and literature. Theyinclude 1,100 children andyoung people who are involvedin the Social Circus, an initiativerun in collaboration <strong>with</strong>the Canadian entertainmentcompany Cirque du Soleil.These innovations have awakenedinterest among Ecuador’sneighbours, a number of whomare seeking to learn more aboutour experience. The first thingto note is that there is no timeto lose. No child should have towait for the services and supportsthat are rightfully hers orhis, but this is especially thecase for children <strong>with</strong> disabilities,because their vulnerabilitycan increase <strong>with</strong> age.We in government must tacklethe tasks at hand <strong>with</strong>outdelay. We must understandthat disability is not a problembut rather a circumstance. Itis up to us, regardless of theplace or the role we haveto play, to assist our youngestcitizens in entering themainstream. We cannot evendream of a country <strong>with</strong> socialjustice, one that abides bythe principles of good living,unless we guarantee thatpersons <strong>with</strong> disabilities,especially children andadolescents, can fullyexercise their rights.Disability does not meanincapability: It is the wonderfuldiversity that enricheshumankind.AN AGENDA FOR ACTION87
REFERENCESChapter 1 Introduction1 World Health Organization, ‘CommunitybasedRehabilitation Guidelines’, WHO,Geneva, 2010, , accessed31 January 2013.2 Groce, Nora Ellen, ‘Adolescents and Youth<strong>with</strong> <strong>Disabilities</strong>: Issues and challenges’,Asia Pacific Disability RehabilitationJournal, vol. 15, no. 2, July 2004,pp. 13–32.3 Committee on the Rights of the Child,Convention on the Rights of the ChildGeneral Comment No. 9 (2006): The rightsof children <strong>with</strong> disabilities, CRC/C/GC/9,Geneva, 27 February 2007, pp. 2, 9; Jones,Lisa, et al., ‘Prevalence and Risk of Violenceagainst <strong>Children</strong> <strong>with</strong> <strong>Disabilities</strong>: A systematicreview and meta-analysis of observationalstudies’, The Lancet, vol. 380,no. 9845, 8 September 2012, pp. 899–907;World Health Organization and the WorldBank, World Report on Disability, WHO,Geneva, 2011, p. 59.BOX: On the numbersWorld Health Organization, The Global Burdenof Disease: 2004 update, WHO, Geneva, 2008;United Nations, Department of Economic andSocial Affairs, Population Division, WorldPopulation Prospects: The 2010 revision,United Nations, New York, 2011.Chapter 2 Fundamentals of inclusion4 Bruce Marks, Susan, ‘Reducing Prejudiceagainst <strong>Children</strong> <strong>with</strong> <strong>Disabilities</strong> inInclusive Settings’, International Journalof Disability, Development and Education,vol. 44, no. 2, 1997, pp. 119–120.5 Contact a Family, ‘What Makes My FamilyStronger: A report into what makesfamilies <strong>with</strong> disabled children stronger– socially, emotionally and practically’,London, May 2009, , accessed 31 January 2013.6 United Kingdom Government, ‘TheConsolidated 3rd and 4th Periodic Reportto UN Committee on the Rights of theChild’, United Kingdom, July 2007, p. 31,,accessed 31 January 2013.7 D’Aiglepierre, Rohen, Focus DevelopmentAssociation and United Nations<strong>Children</strong>’s Fund, ‘Exclusion Scolaire etMoyens D’Inclusion au Cycle Primaire aMadagascar’, February 2012, p. 67,,accessed 31 January 2013.8 TNS and United Nations <strong>Children</strong>’sFund, ‘Research Report on <strong>Children</strong> <strong>with</strong><strong>Disabilities</strong> and their Families in Da Nang:Knowledge – attitudes – practices’,Viet Nam, November 2009, p. 14.9 World Health Organization and the WorldBank, World Report on Disability, 2011, p. 3.10 Maras, Pam, and Rupert Brown, ‘Effects ofContact on <strong>Children</strong>’s Attitudes TowardsDisability: A longitudinal study’, Journalof Applied Social Psychology, vol. 26, no.23, December 1996, pp. 2113–2134, citedin Maras, Pam, and Rupert Brown, ‘Effectsof Different Forms of School Contact on<strong>Children</strong>’s Attitudes toward Disabled andNon-Disabled Peers’, British Journal ofEducational Psychology, vol. 70, no. 3,September 2000, p. 339.11 Barg, Carolyn J., et al., ‘Physical Disability,Stigma, and Physical Activity in <strong>Children</strong>’,International Journal of Disability,Development and Education, vol. 57, no. 4,December 2010, p. 378.12 International Disability in Sport WorkingGroup and the United Nations Office of theSpecial Advisor to the Secretary-General onSport for Development and Peace, ‘Sportin the United Nations Convention on theRights of Persons <strong>with</strong> <strong>Disabilities</strong>’, IDSWG,Northeastern University, Boston, 2007.13 Convention on the Rights of Persons <strong>with</strong><strong>Disabilities</strong> (CRPD) Preamble.14 World Health Organization and the WorldBank, World Report on Disability, 2011,p. 43.15 Mont, Daniel M., and Nguyen Viet Cuong,‘Disability and Poverty in Vietnam’, WorldBank Economic Review, vol. 25, no. 2,2011, pp. 323–359.16 Buckup, Sebastian, ‘The Price of Exclusion:The economic consequences of excludingpeople <strong>with</strong> disabilities from the worldof work’, International Labour OfficeEmployment Working Paper No. 43,International Labour Organization,Geneva, 2009.17 Mitra, Sophie, Aleksandra Posarac andBrandon Vick, ‘Disability and Poverty inDeveloping Countries: A snapshot fromthe World Health Survey’, Social ProtectionDiscussion Paper No. 1109, The WorldBank, Washington, D.C., April 2011.18 Groce, Nora, et al., ‘Disability and Poverty:The need for a more nuanced understandingof implications for development policyand practice’, Third World Quarterly,vol. 32, no. 8, 2011, pp. 1493–1513.19 Loeb, M. E., and Arne H. Eide, eds.,‘Living Conditions among People <strong>with</strong>Activity Limitations in Malawi: A nationalrepresenta tive study’, SINTEF HealthResearch, Oslo, 26 August 2004,, accessed31 January 2013; Hoogeveen, JohannesG., ‘Measuring Welfare for Small butVulnerable Groups: Poverty and disabilityin Uganda’, Journal of African Economies,vol. 14, no. 4, 1 August 2005, pp. 603–631.20 World Health Organization and the WorldBank, World Report on Disability, 2011,pp. 10, 39–40.21 Gertler, Paul J., and Lia C. Fernald, ‘TheMedium Term Impact of Oportunidades onChild Development in Rural Areas’, InstitutoNacional de Salud Pública, Cuernavaca,Mexico, 30 November 2004; Behrman,Jere R., and John Hoddinott, ‘ProgrammeEvaluation <strong>with</strong> Unobserved Heterogeneityand Selective Implementation: The MexicanPROGRESA impact on child nutrition’,Oxford Bulletin of Economics and Statistics,vol. 67, no. 4, August 2005, pp. 547–569;Hoddinott, John, and Emmanuel Skoufias,‘The Impact of PROGRESA on FoodConsumption’, Economic Developmentand Cultural Change, vol. 53, no. 1,October 2004, pp. 37–61; Maluccio, JohnA., et al., ‘The Impact of an ExperimentalNutritional Intervention in Childhood onEducation among Guatemalan Adults’,Food Consumption and Nutrition DivisionDiscussion Paper 207, International FoodPolicy Research Institute, Washington, D.C.,June 2006.22 Groce, Nora, et al., ‘Poverty and Disability:A critical review of the literature in low andmiddle-income countries’, Working PaperSeries No. 16, Leonard Cheshire Disabilityand Inclusive Development Centre,University College London, London,September 2011.23 Office of the United Nations HighCommissioner for Human Rights,Convention on the Rights of the Child,article 23.24 World Health Organization, ‘Community-Based Rehabilitation’, WHO, Geneva,,accessed 31 January 2013.25 Allen-Leigh, Betania, et al., IniciativaEvaluation: Evaluación externa de diseñoy resultados del proyecto piloto‘Atención Integral a Niños y Niñas conDiscapacidad en Comunidades Ruralesen Oaxaca’, Instituto Nacional de SaludPública, Cuernavaca, Mexico, 2010, ascited in Secretariat for the Conventionon the Rights of Persons <strong>with</strong> <strong>Disabilities</strong>(SCRPD), ’Compilation of best practicesfor including persons <strong>with</strong> disabilitiesin all aspects of development efforts’,Working document in response to GeneralAssembly Resolution A/65/186 and <strong>with</strong>the intention of facilitating the discussionsleading up to the envisaged High LevelMeeting on disability and development atthe 67th session of the General Assemblyin 2012.26 Municipalities of Santa Maria Guienagati,San Martín Peras, Coicoyan de las Floresand San José Tanago.27 Allen-Leigh, Betania, et al., IniciativaEvaluation: Evaluación externa de diseñoy resultados del proyecto piloto ‘AtenciónIntegral a Niños y Niñas con Discapacidaden Comunidades Rurales en Oaxaca’, 2010.28 World Health Organization, ‘AssistiveDevices/Technologies: What WHO is doing’,WHO, Geneva, , accessed31 January 2013.29 Borg, Johan, Anna Lindström andStig Larsson,‘Assistive Technology inDeveloping Countries: National and internationalresponsibilities to implement theConvention on the Rights of Persons <strong>with</strong><strong>Disabilities</strong>’, The Lancet, vol. 374, no. 9704,28 November 2009, pp. 1863–1865.30 François, Isabelle, et al., ‘Causes ofLocomotor Disability and Need forOrthopaedic Devices in a HeavilyMined Taliban-Controlled Province ofAfghanistan: Issues and challenges forpublic health managers’, Tropical Medicine& International Health, vol. 3, no. 5, May1998, pp. 391–396; Matsen, S. L., ‘A CloserLook at Amputees in Vietnam: A fieldsurvey of Vietnamese using prostheses’,Prosthetics and Orthotics International,vol. 23, no. 2, August 1999, pp. 93–101;May-Teerink, Teresa Lynn, ‘A Survey ofRehabilitative Services and People Coping<strong>with</strong> Physical <strong>Disabilities</strong> in Uganda, EastAfrica’, pp. 311–316; Bigelow, Jeffrey,et al., ‘A Picture of Amputees and theProsthetic Situation in Haiti’, Disability& Rehabilitation, vol. 26, no. 4, 2004,pp. 246–252; Lindsay, Sally, and IrinaTsybina, ‘Predictors of Unmet Needs forCommunication and Mobility AssistiveDevices among Youth <strong>with</strong> a Disability: Therole of socio-cultural factors’, Disability andRehabilitation: Assistive Technology, vol. 6,no. 1, January 2011, pp. 10–21.31 Steinfeld, Edward, ‘Education for All: Thecost of accessibility’, Education Notes, TheWorld Bank, Washington, D.C., August2005, , accessed31 January 201332 Based on evaluations by the Departmentof Public Works in South Africa, AccessibleDesign Case Studies, 2004, in Metts,Robert, ‘Disability and Development’,Background paper prepared for the disabilityand development research agendameeting, 16 November 2004, The WorldBank, Washington, D.C., pp. 15–45.88THE STATE OF THE WORLD’S CHILDREN 2013: <strong>Children</strong> <strong>with</strong> <strong>Disabilities</strong>
33 South African Disability Institute, SpecialHousing for Disabled People, data providedby Philip Thompson, Africa Chair,International Commission on Technologyand Accessibility, as cited in Metts, Robert,‘Disability and Development’, p. 17; Metts,Robert, ‘Disability and Development’,pp. 15–45.BOX: It’s about abilityUnited Nations <strong>Children</strong>’s Fund Montenegro,‘“It’s about Ability” Campaign Honoured forthe Best Humanitarian Action in Montenegro’,UNICEF Montenegro, Podgorica, Montenegro,15 February 2011, , accessed 31 January 2013.Perovic, Jelena, ‘Survey: It’s about abilitycampaign results in positive change for children<strong>with</strong> disability in Montenegro’, UNICEFMontenegro, Podgorica, Montenegro, 14December 2011, ,accessed 31 January2013.Chapter 3 A strong foundation34 World Health Organization, ‘Fact Sheet:Poliomyelitis’, WHO, Geneva, 2011; PolioNews, Global Polio Eradication Initiative,January 2013.35 World Health Organization, ‘GlobalImmunization Data’, WHO, Geneva,October 2012.36 United Nations Department of Economicand Social Affairs, ‘Disability and theMillennium Development Goals: A reviewof the MDG process and strategies forinclusion of disability issues in MillenniumDevelopment Goal efforts’, United Nations,New York, December 2011.37 World Health Organization and the WorldBank, World Report on Disability, 2011,pp. 58–60.38 Gakidou, Emmanuela, et al., ‘ImprovingChild Survival through Environmental andNutritional Interventions: The importanceof targeting interventions toward thepoor’, Journal of the American MedicalAssociation, vol. 298, no. 16, October 2007,pp. 1876–1887.39 World Health Organization, Nutrition forHealth and Development: A global agendafor combating malnutrition – Progressreport, WHO, Geneva, 2000, pp. 14–15.40 World Health Organization, ‘Micronutrientdeficiencies: Iodine deficiency disorders’,WHO, Geneva, 2012, , accessed31 January 201341 Checkley William, et al., ‘Multi-CountryAnalysis of the Effects of Diarrhoea onChildhood Stunting’, International Journalof Epidemiology, vol. 37, no. 4, August2008, pp. 816–830.42 Walker, Susan P., et al., ‘Inequality in EarlyChildhood: Risk and protective factorsfor early child development’, The Lancet,vol. 378, no. 9799, 8 October 2011,pp. 1325–1338.43 United Nations <strong>Children</strong>’s Fund, TrackingProgress on Child and Maternal Nutrition:A survival and development priority’,UNICEF, New York, November 2009, p. 16.44 Walker, Susan P., et al., ‘Inequality in EarlyChildhood: Risk and protective factors forearly child development’, pp. 1325–1338.45 World Health Organization, ‘MedicalDevices: Anaemia prevention and control’,WHO, Geneva, 2012, , accessed 31 January 2013.46 Scholl, Theresa O., ‘Maternal Iron Status:Relation to fetal growth, length of gestation,and iron endowment of the neonate’,Nutrition Reviews, vol. 69, no. 11,November 2011, S23–S29; Vaughan, OwenR., et al., ‘Environmental Regulation ofPlacental Phenotype: Implications forfetal growth’, Reproduction, Fertility andDevelopment, vol. 24, no. 1, 6 December2011, pp. 80–96.47 Adams, Melanie S., et al., ‘FeedingDifficulties in <strong>Children</strong> <strong>with</strong> Cerebral Palsy:Low-cost caregiver training in Dhaka,Bangladesh’, Child: Care, Health andDevelopment, vol. 38, no. 6, November2012, pp. 878–888.48 National Institutes for Health (NIH),MedlinePlus, ‘Cystic Fibrosis – NutritionalConsiderations’, ,accessed 31 January 2013; O’Brien, S., etal., ‘Intestinal Bile Acid Malabsorption inCystic Fibrosis’, Gut, vol. 34, no. 8, August1993, pp. 1137–1141.49 United Nations <strong>Children</strong>’s Fund, ‘Violenceagainst Disabled <strong>Children</strong>: UN Secretary-General’s report on violence against children– Summary report’, UNICEF, New York,28 July 2005, pp. 6–7; World Bank, May2004, “Disability in Bangladesh: A situationanalysis” The Danish Bilharziasis Laboratoryfor the World Bank, People’s Republic ofBangladesh ,p. 15, accessed 31 January 201350 World Health Organization, DevelopmentalDifficulties in Early Childhood: Prevention,early identification, assessment andintervention in low- and middle-incomecountries – A review, WHO, Geneva,2012; Thommessen, M., et al., ‘FeedingProblems, Height and Weight inDifferent Groups of Disabled <strong>Children</strong>’,ActaPaediatrica, vol. 80, no. 5, May 1991,pp. 527–533; Sullivan, Peter B., ed.,Feeding and Nutrition in <strong>Children</strong> <strong>with</strong>Neurodevelopmental Disability, Mac KeithPress, London, 2009, p. 61; Adams, MelanieS., et al., ‘Feeding Difficulties in <strong>Children</strong><strong>with</strong> Cerebral Palsy’, pp. 878–888.51 Groce, N., et al., ‘Water and SanitationIssues for Persons <strong>with</strong> <strong>Disabilities</strong> in LowandMiddle-Income Countries: A literaturereview and discussion of implications forglobal health and international development,’Journal of Water and Health, vol. 9,no. 4, 2011, pp. 617–627.52 Human Rights Watch, ‘Fact Sheet: HIVand disability’, Human Rights Watch,New York, June 2011. Also, see WorldHealth Organization and the World Bank,World Report on Disability, 2011, p. 77 formisconceptions on sexual activity, p. 59for drug/alcohol use and p. 147 for riskof abuse.53 United Nations <strong>Children</strong>’s Fund, ‘Towardsan AIDS-Free Generation: Promotingcommunity-based strategies for and <strong>with</strong>children and adolescents <strong>with</strong> disabilities’,UNICEF, July 2012.54 World Health Organization and UnitedNations Population Fund, PromotingSexual and Reproductive Health forPersons <strong>with</strong> <strong>Disabilities</strong>: WHO/UNFPAguidance note, WHO, 2009, pp. 5–9, 12,, accessed 31 January 2013; UnitedNations Educational, Scientific andCultural Organization, Sexuality Educationin Asia and the Pacific: Review of policiesand strategies to implement andscale up, UNESCO Bangkok, Bangkok,2012, p. 2, ,accessed 31 January 2013.55 Willemse, Karin, Ruth Morgan and JohnMeletse, ‘Deaf, Gay, HIV Positive, andProud: Narrating an alternative identity inpost-Apartheid South Africa’, CanadianJournal of African Studies, vol. 43, no. 1,April 2009, pp. 83–104.56 Sices, Laura, ‘Developmental Screeningin Primary Care: The effectiveness ofcurrent practice and recommendationsfor improvement’, The CommonwealthFund, New York, December 2007, pp. vand 6; Johnson-Staub, Christine, ‘ChartingProgress for Babies in Child Care Project:Promote access to early, regular, and comprehensivescreening’, CLASP, Washington,D.C., February 2012, p. 1.57 Ertem, Ilgi O., et al., ’A Guide forMonitoring Child Development in Low- andMiddle-Income Countries’, Pediatrics, vol.121, no. 3, March 2008, pp. e581–e589;World Health Organization, DevelopmentalDifficulties in Early Childhood: Prevention,Early Identification, Assessment andIntervention in low-and middle incomecountries, WHO 2012pp.158 World Health Organization, ‘Epilepsy: Factsheet No. 999’, WHO, Geneva, October2012, , accessed31 January 2013.59 Metts, Robert, ‘Disability andDevelopment’, pp. 15–45.60 Filmer, Deon, ‘Disability, Poverty, andSchooling in Developing Countries: Resultsfrom 14 household surveys’, World BankEconomic Review, vol. 22, no. 1, 2008,pp. 141–163, as cited in World HealthOrganization and the World Bank, WorldReport on Disability, 2011.61 United Nations Educational, Scientificand Cultural Organization, EFA GlobalMonitoring Report 2010: Reaching themarginalized, UNESCO and OxfordUniversity Press, Paris and Oxford,UK, 2010, ,accessed 31 January 2013; Loeb, M. E.,and Arne H. Eide, eds., ‘Living Conditionsamong People <strong>with</strong> Activity Limitations inMalawi: A national representative study’,SINTEF Health Research, Oslo, 26 August2004, ,31 January 2013; Government of theUnited Republic of Tanzania, ‘2008Tanzania Disability Survey’, UnitedRepublic of Tanzania National Bureau ofStatistics, Dar es Salaam, United Republicof Tanzania, 2009, p. 19, ,31 January 2013.62 World Health Organization and the WorldBank, World Report on Disability, 2011,p. 206.63 United Nations, Report of the Secretary-General on the Status of the Conventionon the Rights of the Child, A/66/230, UnitedNations, New York, 3 August 2011, p. 8.64 For review, see World Health Organizationand the World Bank, World Report onDisability, 2011, pp. 39–40; Filmer, Deon,‘Disability, Poverty, and Schooling inDeveloping Countries: Results from14 household surveys’, pp. 141–163;Sundrum, Ratna, et al., ‘Cerebral Palsyand Socioeconomic Status: A retrospectivecohort study’, Archives of Disease inChildhood, vol. 90, no. 1, January 2005,pp. 15–18; Newacheck, Paul W., et al.,‘Disparities in the Prevalence of Disabilitybetween Black and White <strong>Children</strong>’,Archives of Pediatrics & AdolescentMedicine, vol. 157, no. 3, March 2003,pp. 244–248.REFERENCES89
65 United Nations <strong>Children</strong>’s Fund, Promotingthe Rights of <strong>Children</strong> <strong>with</strong> <strong>Disabilities</strong>,Innocenti Digest No. 13, UNICEF InnocentiResearch Centre, Florence, October 2007,p. 15, box 5.1, , accessed 31 January 2013.66 van der Berg, Servaas, Poverty andEducation, United Nations Educational,Scientific and Cultural Organization, Paris,2008.67 United Nations <strong>Children</strong>’s Fund, Promotingthe Rights of <strong>Children</strong> <strong>with</strong> <strong>Disabilities</strong>,Innocenti Digest No. 13, p. 27, box 5.1.68 UNICEF, The Right of <strong>Children</strong> <strong>with</strong><strong>Disabilities</strong> to Education: A rights-basedapproach to inclusive education, 2012, p.8; United Nations Educational, Scientificand Cultural Organization, ‘The Right toEducation for Persons <strong>with</strong> <strong>Disabilities</strong>:Towards inclusion – An Education for Allflagship’, Paris, ,accessed 31 January 2013.69 United Nations Educational, Scientificand Cultural Organization, ‘Inclusion of<strong>Children</strong> <strong>with</strong> <strong>Disabilities</strong>: The early childhoodimperative’, UNESCO Policy Brief onEarly Childhood No. 46, UNESCO, Paris,April–June 2009, ,accessed 31 January 2013.70 Nahar, Baitun, et al., ‘Effects ofPsychosocial Stimulation on Growth andDevelopment of Severely Malnourished<strong>Children</strong> in a Nutrition Unit in Bangladesh’,European Journal of Clinical Nutrition, vol.63, no. 6, June 2009, pp. 725–731.71 Jin, X., et al., ‘”Care for Development”Intervention in Rural China: A prospectivefollow-up study’, Journal of Developmentaland Behavioral Pediatrics, vol. 28, no. 3,2007, pp. 213–218.72 Nair, M. K., et al., ’Effect of ChildDevelopment Centre Model EarlyStimulation among At Risk Babies: Arandomized controlled trial’, IndianPediatrics, vol. 46, supplement, January2009, pp. s20–s26.73 Potterton, Joanne, et al., ‘The Effect of aBasic Home Stimulation Programme on theDevelopment of Young children Infected<strong>with</strong> HIV’, Developmental Medicine & ChildNeurology, vol. 52, no. 6, June 2010,pp. 547–551.74 Walker, Susan P., et al., ’Inequality in EarlyChildhood: Risk and protective factors forearly child development’, pp. 1325–1338.75 Forlin, Chris, et al., ‘DemographicDifferences in Changing Pre-ServiceTeachers’ Attitudes, Sentiments andConcerns about Inclusive Education’,International Journal of Inclusive Education,vol. 13, no. 2, March 2009, pp. 195–209.Felicia Wilczenski’s ‘Attitudes towardInclusive Education Scale’ (ATIES),developed in 1992, has been particularlyinfluential in studies of teacher attitudes:Wilczenski, Felicia L., ‘Measuring Attitudestoward Inclusive Education’, Psychology inthe Schools, vol. 29, no. 4, October 1992,pp. 306–312. For a review, see Kuyini,Ahmed Bawa, and Ishwar Desai, ‘Principals’and Teachers’ Attitudes and Knowledgeof Inclusive Education as Predictors ofEffective Teaching Practices in Ghana’,Journal of Research in Special EducationalNeeds, vol. 7, no. 2, June 2007, pp. 104–113.76 Tur-Kaspa, Hana, Amatzia Weisel and TovaMost, ‘A Multidimensional Study of SpecialEducation Students’ Attitudes towardsPeople <strong>with</strong> <strong>Disabilities</strong>: A focus on deafness’,European Journal of Special NeedsEducation, vol. 15, no. 1, March 2000,pp. 13–23.77 Latimier, Camille, and Jan Šiška, ‘<strong>Children</strong>’sRights for All!: Implementation of theUnited Nations Convention on the Rightsof the Child for children <strong>with</strong> intellectualdisabilities’, Inclusion Europe, Brussels,October 2011, p. 21.78 Praisner, Cindy L., ‘Attitudes of ElementarySchool Principals toward the Inclusion ofStudents <strong>with</strong> <strong>Disabilities</strong>’, Exceptional<strong>Children</strong>, vol. 69, no. 2, 2003, pp. 135–145.79 Shade, Richard A., and Roger Stewart,‘General Education and Special EducationPreservice Teachers’ Attitudes towardsInclusion’, Preventing School Failure,vol. 46, no. 1, 2001, pp. 37–41.80 de Boer, Anke, Sip Jan Pijl and AlexanderMinnaert, ‘Regular Primary Schoolteachers’Attitudes towards Inclusive Education:A review of the literature’, InternationalJournal of Inclusive Education, vol. 15,no 3, April 2011, pp. 345–346.81 Miles, Susie, and Ian Kaplan, ‘UsingImages to Promote Reflection: An actionresearch study in Zambia and Tanzania’,Journal of Research in Special EducationalNeeds, vol. 5, no. 2, June 2005, pp. 79–80.82 Kalyanpur, Maya, ‘Paradigm and Paradox:Education for All and the inclusion ofchildren <strong>with</strong> disabilities in Cambodia’,International Journal of InclusiveEducation, vol. 15, no. 10, December2011, p. 1058.83 Miles, Susie, et al., ‘Education for Diversity:The role of networking in resisting disabledpeople’s marginalisation in Bangladesh’,Compare: A Journal of Comparative andInternational Education, vol. 42, no. 2,2012, p. 293.84 Schurmann, Erik, ‘Training DisabledTeachers in Mozambique’, EnablingEducation No. 10, Enabling EducationNetwork, Manchester, UK, 2006,, accessed31 January 2013.85 United Nations <strong>Children</strong>’s Fund, Promotingthe Rights of <strong>Children</strong> <strong>with</strong> <strong>Disabilities</strong>,Innocenti Digest No. 13, p. 30.86 Lynch, Paul, et al., ‘Inclusive EducationalPractices in Uganda: Evidencing practice ofitinerant teachers who work <strong>with</strong> children<strong>with</strong> visual impairment in local mainstreamschools’, International Journal of InclusiveEducation, vol. 15, no. 10, December 2011,pp. 1119–1134; Miles, Susie, and SueStubbs, ‘Inclusive Education and <strong>Children</strong><strong>with</strong> <strong>Disabilities</strong>’, UNICEF background discussionpaper written for The State of theWorld’s <strong>Children</strong> 2013, 2012, p. 23.87 Prag, Anat, ‘Fostering Partnerships forEducation Policy and Reform: Vietnam’,Enabling Education No. 8, EnablingEducation Network, Manchester, UK,2004, , accessed 31 January2013.88 Report of the Secretary-General on theStatus of the Convention on the Rightsof the Child, 3 August 2011.89 Stubbs, Sue, ‘Inclusive Education: Wherethere are few resources’, The AtlasAlliance, Oslo, September 2008, p. 36,, accessed 31 January 2013; Fosere,Mamello, ‘Mamello’s Story’, EnablingEducation No. 5, Enabling EducationNetwork, Manchester, UK, 2001, p. 10,.90 Lewis, Ingrid, ‘Water, Sanitation, Hygiene(WASH) and Inclusive Education’, EnablingEducation No. 14, Enabling EducationNetwork, Manchester, UK, 2010, pp.9–13, , accessed 31 January 2013.91 Bines, Hazel, ‘Education’s Missing Millions:Including disabled children in educationthrough EFA FTI processes and nationalsector plans – Main report of study findings’,World Vision UK, Milton Keynes,UK, September 2007, p. 3.92 Munir, Shirin Z., and Sultana S. Zaman,‘Models of Inclusion: Bangladesh experience’,ch. 19 in Inclusive Education acrossCultures: Crossing boundaries, sharingideas, edited by Mithu Alur and VianneTimmons, Sage Publications India,New Delhi, 2009, p. 292.93 Ahsan, Mohammad Tariq, and LindsayBurnip, ‘Inclusive Education inBangladesh’, Australasian Journalof Special Education, vol. 31, no. 1,April 2007, p. 65.94 Miles, Susie, et al., ‘Education for Diversity:The role of networking in resisting disabledpeople’s marginalisation in Bangladesh’,Compare: A Journal of Comparative andInternational Education, vol. 42, no. 2,2012, pp. 283–302.95 United Nations Educational, Scientific andCultural Organization, Building HumanCapacities in Least Developed Countriesto Promote Poverty Eradication andSustainable Development, UNESCO,Paris, 2011, p. 8.96 Lansdown, Gerison, ‘Vulnerability of<strong>Children</strong> <strong>with</strong> <strong>Disabilities</strong>’, UNICEF backgroundresearch paper written for The Stateof the World’s <strong>Children</strong> 2013, 2012, p. 8.97 United Nations Educational, Scientific andCultural Organization, Education Counts:Towards the Millennium DevelopmentGoals, UNESCO, Paris, 2011, p. 17.98 Abuya, Benta A., James Ciera andElizabeth Kimani-Murage, ‘Effect ofMother’s Education on Child’s NutritionalStatus in the Slums of Nairobi’, BMCPediatrics, vol. 12, no. 80, June 2012.99 Janevic, Teresa, et al., ‘Risk Factorsfor Childhood Malnutrition in RomaSettlements in Serbia’, BMC Public Health,vol. 10, August 2010.100 Miller, Jane E., and Yana V. Rodgers,‘Mother’s Education and <strong>Children</strong>’sNutritional Status: New evidence fromCambodia’, Asian Development Review,vol. 26, no. 1, 2009, pp. 131–165.101 Semba, Richard D., et al., ‘Effect of PaternalFormal Education on Risk of Child Stuntingin Indonesia and Bangladesh: A crosssectionalstudy’, The Lancet, vol. 371,no. 9609, January 2008, pp. 322–328.102 Convention on the Rights of the Child,article 29.Chapter 4 Essentials of protection103 Cody, Clare, Count Every Child: The rightto birth registration, Plan Ltd., Woking,UK, 2009.104 Algood, C. L., et al., ’Maltreatment of<strong>Children</strong> <strong>with</strong> Developmental <strong>Disabilities</strong>:An ecological systems analysis,’ <strong>Children</strong>and Youth Services Review, vol. 33, no. 7,July 2011, pp. 1142–1148; Stalker, K., andK. McArthur, ’Child Abuse, Child Protectionand Disabled <strong>Children</strong>: A review of recentresearch,’ Child Abuse Review, vol. 21,no. 1, January/February 2012, pp. 24–40.105 Kvam, Marit Hoem, ‘Sexual Abuse of Deaf<strong>Children</strong>: A retrospective analysis of theprevalence and characteristics of childhoodsexual abuse among deaf adults inNorway’, Child Abuse & Neglect, vol. 28,no. 3, March 2004, pp. 241–251; Lansdown,Gerison, ‘Vulnerability of <strong>Children</strong> <strong>with</strong><strong>Disabilities</strong>’, p. 6.90THE STATE OF THE WORLD’S CHILDREN 2013: <strong>Children</strong> <strong>with</strong> <strong>Disabilities</strong>
106 Mental Disability Rights International,‘Behind Closed Doors: Human rights abusesin the psychiatric facilities, orphanagesand rehabilitation centers of Turkey’, MDRI,Washington, D.C., 28 September 2005,pp. 1, 23, 72, ,accessed 31 January2013; Mental Disability Rights International,‘Torture Not Treatment: Electric shock andlong-term restraint in the United Stateson children and adults <strong>with</strong> disabilitiesat the Judge Rotenberg Center’, MDRI,Washington, D.C., 2010, pp. 1–2,,accessed 31 January 2013.107 Human Rights Watch, Open SocietyFoundations, Women <strong>with</strong> <strong>Disabilities</strong>Australia, International DisabilityAlliance and Stop Torture in Health Care,‘Sterilization of Women and Girls <strong>with</strong><strong>Disabilities</strong>: A briefing paper’, November2011, ,accessed 31 January 2013.108 Dowse, Leanne, ‘Moving Forward or LosingGround?: The sterilisation of women andgirls <strong>with</strong> disabilities in Australia’, Paperprepared for Women <strong>with</strong> <strong>Disabilities</strong>Australia and presented at the DisabledPeoples’ International World Summit,Winnipeg, Canada, 8–10 September 2004.109 Information obtained from UNICEFSerbia; United Nations <strong>Children</strong>’s Fundand Serbian Government Ministry ofLabour and Social Policy, ‘TransformingResidential Institutions for <strong>Children</strong> andDeveloping Sustainable Alternatives’,Belgrade, 2011, pp. 4–8.110 Convention on the Rights of the ChildGeneral Comment No. 9 (2006), p. 21.FOCUSViolence against children <strong>with</strong> disabilitiesJones, Lisa, et al., ‘Prevalence and Risk ofViolence against <strong>Children</strong> <strong>with</strong> <strong>Disabilities</strong>’,pp. 899–907.World Health Organization and the World Bank,World Report on Disability, 2011, pp. 29, 59 and137, pp. 29, 59 and 137.Pinheiro, Paulo Sérgio, World Report onViolence against <strong>Children</strong>, United NationsSecretary-General’s Study on Violence against<strong>Children</strong>, Geneva, 2006.Krug, Etienne G., et al., eds., World Reporton Violence and Health, World HealthOrganization, Geneva, 2002.Hibbard, Roberta A., et al., ‘Maltreatment of<strong>Children</strong> <strong>with</strong> <strong>Disabilities</strong>’, Pediatrics, vol. 119,no. 5, 1 May 2007, pp. 1018–1025.Ammerman, Robert T., et al., ‘Maltreatmentin Psychiatrically Hospitalized <strong>Children</strong> andAdolescents <strong>with</strong> Developmental <strong>Disabilities</strong>:Prevalence and correlates’, Journal of theAmerican Academy of Child & AdolescentPsychiatry, vol. 33, no. 4, May 1994,pp. 567–576.Sullivan, Patricia M., ‘Violence Exposure among<strong>Children</strong> <strong>with</strong> <strong>Disabilities</strong>’, Clinical Child andFamily Psychology Review, vol. 12, no. 2,June 2009, pp. 196–216.Ammerman, Robert T., and Nora J. Baladerian,Maltreatment of <strong>Children</strong> <strong>with</strong> <strong>Disabilities</strong>,National Committee to Prevent Child Abuse,Chicago, 1993.United Nations, Convention on the Rights ofPersons <strong>with</strong> <strong>Disabilities</strong>, A/RES/61/106,United Nations, New York, 2008.Gilbert, Ruth, et al., ‘Burden and Consequencesof Child Maltreatment in High-IncomeCountries’, The Lancet, vol. 373, no. 9657,3 January 2009, pp. 68–81.Felitti, Vincent J., et al., ‘Relationship ofChildhood Abuse and Household Dysfunctionto Many of the Leading Causes of Death inAdults: The adverse childhood experiences(ACE) study’, American Journal of PreventiveMedicine, vol. 14, no. 4, May 1998, pp. 245–258.MacMillan, Harriet L., et al., ‘Interventions toPrevent Child Maltreatment and AssociatedImpairment’, The Lancet, vol. 373, no. 9659,17 January 2009, pp. 250–266.Chapter 5 Humanitarian Response111 Von der Assen, Nina, Mathijs Euwema andHuib Cornielje, ‘Including Disabled <strong>Children</strong>in Psychological Programmes in AreasAffected by Armed Conflict’, Intervention,vol. 8, no. 1, March 2010, pp. 29–39.112 Bartlett, Sheridan, ‘The Implications ofClimate Change for <strong>Children</strong> in Lower-Income Countries’, <strong>Children</strong>, Youth andEnvironments, vol. 18, no. 1, 2008,pp. 71–98.113 Convention on the Rights of the ChildGeneral Comment No. 9 (2006), p. 22.FOCUSRisk, resilience and inclusivehumanitarian actionAfrican Child Policy Forum, ‘Violence against<strong>Children</strong> in Africa: A compilation of the mainfindings of the various research projectsconducted by the African Child Policy Forum(ACPF) since 2006’, ACPF, Addis Ababa,March 2011.Handicap International, ‘MainstreamingDisability into Disaster Risk Reduction:A training manual’, HandicapInternational, Kathmandu, January 2009,,accessed 31 January 2013.International Committee of the Red Cross,‘Promotion and Protection of the Rights of<strong>Children</strong>: ICRC statement to the United Nations,2011’, ICRC, Geneva, 17 October 2011,,accessed31 January 2013.IRIN, ‘DRC: Child disability, the forgottencrisis’, IRIN, Goma, Democratic Republic ofthe Congo, 23 October 2009, ,accessed 2 October 2012.Kett, Maria, and Mark van Ommeren,‘Disability, Conflict and Emergencies’, TheLancet, vol. 374, no. 9704, 28 November 2009,pp. 1801–1803, , accessed 31 January 2013.Kett, Maria, and Jean-François Trani,‘Vulnerability and Disability in Darfur’, ForcedMigration Review, vol. 35, July 2010, pp. 12–14.Nelson, Brett D., et al., ‘Impact of SexualViolence on <strong>Children</strong> in the Eastern DemocraticRepublic of Congo’, Medicine, Conflict andSurvival, vol. 27, no. 4, October–December2011, pp. 211–225.Pearn, John H., ‘The Cost of War: Childinjury and death’, in Contemporary Issues inChildhood Diarrhoea and Malnutrition, 1stedition, edited by Zulfigar Ahmed Bhutta,Oxford University Press, Karachi, Pakistan,pp. 334–343.Penrose, Angela, and Mie Takaki, ‘<strong>Children</strong>’sRights in Emergencies and Disasters’, TheLancet, vol. 367, no. 9511, 25 February 2006,pp. 698–699.Plan International, ‘Child-Centred Disaster RiskReduction: Building resilience through participation– Lessons from Plan International’,Plan UK, London, 2010.Handicap International and Save the <strong>Children</strong>,Out from the Shadows: Sexual Violence against<strong>Children</strong> <strong>with</strong> <strong>Disabilities</strong>, Save the <strong>Children</strong>UK, London, 2011.Tamashiro, Tami, ‘Impact of Conflict on<strong>Children</strong>’s Health and Disability’, Backgroundpaper prepared for the Education for AllGlobal Monitoring Report 2011: The hiddencrisis – Armed conflict and education, UnitedNations Educational, Scientific and CulturalOrganization, Paris, June 2010,,accessed 31 January 2013.Trani, Jean-François, et al., ‘Disability,Vulnerability and Citizenship: To what extentis education a protective mechanism for children<strong>with</strong> disabilities in countries affected byconflict?’, International Journal of InclusiveEducation, vol. 15, no. 10, 2011, pp. 1187–1203.United Nations <strong>Children</strong>’s Fund, ‘Violenceagainst Disabled <strong>Children</strong>: UN Secretary-General’s Report on Violence against <strong>Children</strong>– Summary report’, UNICEF, New York, 28 July2005, pp. 4–5, ,accessed 31 January 2013.United Nations General Assembly, Report ofthe Special Representative of the Secretary-General for <strong>Children</strong> and Armed Conflict,A/62/228, United Nations, New York,13 August 2007.Women’s Commission for Refugee Womenand <strong>Children</strong>, <strong>Disabilities</strong> among Refugeesand Conflict-Affected Populations: Resourcekit for fieldworkers, Women’s Commission forRefugee Women and <strong>Children</strong>, New York, June2008, ,accessed 31 January 2013.World Health Organization and the World Bank,World Report on Disability, 2011, pp. 34–37.FOCUSExplosive remnants of warUnder the Mine Ban Treaty, victims are definedas those who are directly impacted and thereforehave been killed by a landmine blast orsurvived one, as well as the surviving familymembers of those killed and injured. Under theConvention on Cluster Munitions, victims alsoinclude affected family members and affectedcommunities. Throughout this document,‘victims’ refers to survivors, family membersof those affected and affected communities;‘casualties’ refers to those directly killed orinjured by blasts; while ‘survivors’ specificallyrefers to those who have been directly impactedand survived landmines/Explosive Remnantsof War blasts.Landmine and Cluster Munition Monitor,Landmine Monitor 2011, Mines Action Canada,October 2011, p. 51.‘Mines’ include victim-activated anti-personnelmines, anti-vehicle mines and improvisedexplosive devices; 2010 is the most recent yearfor which verified casualty totals were availablefor all countries at the time of publication.Please see , accessed31 January 2013, for a full definition of casualtiesand devices as presented here and forupdated casualty data.REFERENCES91
The Landmine Monitor identified more than1,500 child casualties in 1999 and more than1,600 in 2001.This includes only the casualties for which thecivilian/security status and the age were known.Boys accounted for 1,371 of the 2,735 civiliancasualties caused by explosive remnants of war(ERW) between 2008 and 2010.Landmine and Cluster Munition Monitor,Landmine and Cluster Munition Monitor FactSheet: Impact of mines/ERW on children– November 2011, Landmine and ClusterMunition Monitor, Geneva, p. 2.Landmine and Cluster Munition Monitor FactSheet: Impact of mines/ERW on children –November 2010, pp. 1–3.Landmine and Cluster Munition Monitor FactSheet: Landmines and children – March 2010,pp. 2, 3.Percentages are of civilian casualties forwhich the age was known. <strong>Children</strong> madeup 30 per cent of casualties from all typesof mines.Landmine and Cluster Munition Monitor, ‘TheIssues: Landmines’, Landmine and ClusterMunition Monitor, Geneva, ,accessed 31 January 2013.Walsh, Nicolas E., and Wendy S. Walsh,‘Rehabilitation of Landmine Victims: The ultimatechallenge’, Bulletin of the World HealthOrganization, vol. 81, no. 9, 2003, pp. 665–670.International Save the <strong>Children</strong> Alliance, ‘ChildLandmine Survivors: An inclusive approachto policy and practice’, International Save the<strong>Children</strong> Alliance, London, 2000.Watts, Hugh G., ‘The Consequences for<strong>Children</strong> of Explosive Remnants of War: Landmines, unexploded ordnance, improvisedexplosive devices and cluster bombs’, Journalof Pediatric Rehabilitation Medicine: AnInterdisciplinary Approach, vol. 2, 2009,pp. 217–227.Landmine and Cluster Munition Monitor FactSheet: Impact of mines/ERW on children –November 2010, pp. 1–3.Watts, Hugh G., ‘The Consequences for<strong>Children</strong> of Explosive Remnants of War’,pp. 217–227.Landmine and Cluster Munition Monitor FactSheet: Landmines and children – June 2009,pp. 1–4.Munoz, Wanda, Ulrike Last and Teng Kimsean,Good Practices from the Project: Towards sustainableincome generating activities for minevictim and other persons <strong>with</strong> disabilities inCambodia, Handicap International Federation(HIC) Cambodia, Phnom Penh, Cambodia, 2010.Child Protection in Crisis (CPC) Network,Livelihoods and Economic Strengthening TaskForce, The Impacts of Economic StrengtheningPrograms on <strong>Children</strong>: a review of the evidence,CPC Network, August 2011, pp. ii, 1, 18.Landmine and Cluster Munition Monitor FactSheet: Impact of mines/ERW on children –November 2010, pp. 1–3.Handicap International, Voices from theGround: Landmine and explosive remnants ofwar survivors speak out on victim assistance,Handicap International, Brussels, September2009, p. 210.Chapter 6 Measuring child disability114 United Nations <strong>Children</strong>’s Fund and theUniversity of Wisconsin, MonitoringChild Disability in Developing Countries:Results from the Multiple Indicator ClusterSurveys, UNICEF, New York, 2008, p. 9.115 Mont, Daniel, ‘Measuring DisabilityPrevalence’, Social Protection DiscussionPaper No. 0706, The World Bank,Washington, D.C., March 2007, p. 35;Maulik, Pallab K., and Gary L. Darmstadt,‘Childhood Disability in Low- and Middle-Income Countries: Overview of screening,prevention, services, legislation, andepidemiology’, Pediatrics, vol. 120,Supplement 1, July 2007, p. S21.116 World Health Organization, Towards aCommon Language for Functioning,Disability and Health: ICF – The internationalclassification of functioning, disabilityand health, WHO, Geneva, 2002.117 Msall, Michael E., and Dennis P. Hogan,‘Counting <strong>Children</strong> <strong>with</strong> Disability in Low-Income Countries: Enhancing prevention,promoting child development, and investingin economic well-being’, Pediatrics,vol. 120, no. 1, July 2007, p. 183.118 Durkin, Maureen, S., ‘The Epidemiologyof Developmental <strong>Disabilities</strong> in Low-Income Countries’, Mental Retardationand Developmental <strong>Disabilities</strong> ResearchReview, vol. 8, no. 3, 2002, p. 211; UnitedNations <strong>Children</strong>’s Fund and the Universityof Wisconsin, Monitoring Child Disability inDeveloping Countries, p. 8.119 Lansdown, R. G., et al., ‘CulturallyAppropriate Measures for Monitoring ChildDevelopment at Family and CommunityLevel: A WHO collaborative study’, Bulletinof the World Health Organization, vol. 74,no. 3, 1996, p. 287120 See appendix 2 of Maulik and Darmstadt,2007.121 Robertson, Janet, Chris Hatton and EricEmerson, ‘The Identification of <strong>Children</strong><strong>with</strong> or at Significant Risk of Intellectual<strong>Disabilities</strong> in Low and Middle IncomeCountries: A review’, CeDR ResearchReport, no. 3, Centre for DisabilityResearch, Lancaster University, Lancaster,UK, July 2009, p. 22; United Nations<strong>Children</strong>’s Fund and the University ofWisconsin, Monitoring Child Disability inDeveloping Countries, pp. 9, 58; Gladstone,M. J., et al., ‘Can Western DevelopmentalScreening Tools Be Modified for Use ina Rural Malawian Setting?’, Archives ofDiseases in Childhood, vol. 93, no. 1,January 2008, pp. 23–29.122 Mont, Daniel, ‘Measuring DisabilityPrevalence’, p. 35; Washington Group onDisability Statistics, ‘Understanding andInterpreting Disability as Measured Usingthe WG Short Set of Questions’, 20 April2009, p. 2.123 United Nations <strong>Children</strong>’s Fund and theUniversity of Wisconsin, Monitoring ChildDisability in Developing Countries, p. 8.124 Durkin, Maureen S., ‘Population-BasedStudies of Childhood Disability inDeveloping Countries: Rationale and studydesign’, International Journal of MentalHealth, vol. 20, no. 2, 1991, pp. 47–60;United Nations <strong>Children</strong>’s Fund and theUniversity of Wisconsin, Monitoring ChildDisability in Developing Countries, p. 8.125 Durkin, Maureen S., ‘Population-BasedStudies of Childhood Disability inDeveloping Countries’, pp. 47–60.126 Ibid.; United Nations <strong>Children</strong>’s Fund and theUniversity of Wisconsin, Monitoring ChildDisability in Developing Countries, p. 9.127 World Health Organization and the UnitedNations Economic and Social Commissionfor Asia and the Pacific, Training Manualon Disability Statistics, Bangkok, 2008, pp.107–108.128 United Nations <strong>Children</strong>’s Fund and theUniversity of Wisconsin, Monitoring ChildDisability in Developing Countries, pp.8–9; Nair, M. K., et al., ‘DevelopmentalScreening Chart’, Indian Pediatrics, vol. 28,no. 8, 1991, pp. 869–872.129 United Nations <strong>Children</strong>’s Fund and theUniversity of Wisconsin, MonitoringChild Disability in Developing Countries,p. 9; Durkin, Maureen S., ‘Population-Based Studies of Childhood Disability inDeveloping Countries’, pp. 47–60.130 Robertson, Janet, Chris Hatton and EricEmerson, ‘The Identification of <strong>Children</strong><strong>with</strong> or at Significant Risk of Intellectual<strong>Disabilities</strong> in Low and Middle IncomeCountries: A review’, p. 20.FOCUSLessons learnedUnited Nations <strong>Children</strong>’s Fund and theUniversity of Wisconsin, Monitoring ChildDisability in Developing Countries: Resultsfrom the Multiple Indicator Cluster Surveys,p. 9; Thorburn Marigold, et al., ‘Identificationof Childhood Disability in Jamaica: The tenquestion screen’, International Journal ofRehabilitation Research, vol. 15, no. 2,June 1992, pp. 115–127.United Nations <strong>Children</strong>’s Fund and theUniversity of Wisconsin, Monitoring ChildDisability in Developing Countries: Results fromthe Multiple Indicator Cluster Surveys, p. 9.Durkin, Maureen S., ‘Population-BasedStudies of Childhood Disability in DevelopingCountries’, pp. 47–60; United Nations <strong>Children</strong>’sFund and the University of Wisconsin,Monitoring Child Disability in DevelopingCountries, pp. 9–10.Zaman, Sultana S., et al., ‘Validity of the ‘TenQuestions’ for Screening Serious ChildhoodDisability: Results from urban Bangladesh’,International Journal of Epidemiology, vol. 19,no. 3, 1990, p. 613.Previous UNICEF publications reported that thenumber of participating countries was 20. Thisnumber was correct when those publicationswere printed, but the final number of countriesthat administered the Ten Questions as part ofMICS3 was 25.United Nations <strong>Children</strong>’s Fund and Universityof Wisconsin, Monitoring Child Disability inDeveloping Countries, p. 23.FOCUSFrom screening to assessmentMaulik, Pallab K., and Gary L. Darmstadt,‘Childhood Disability in Low- and Middle-Income Countries’, July 2007, p. S6; UnitedNations <strong>Children</strong>’s Fund and the Universityof Wisconsin, Monitoring Child Disability inDeveloping Countries, p. 58.92THE STATE OF THE WORLD’S CHILDREN 2013: <strong>Children</strong> <strong>with</strong> <strong>Disabilities</strong>
Statistical TablesEconomic and social statistics on the countries and areasof the world, <strong>with</strong> particular reference to children’s well-being.Overview ..............................................................................................94General note on the data ....................................................................94Child mortality estimates ....................................................................94Notes on specific tables ......................................................................95Explanation of symbols .......................................................................98Regional classification .........................................................................98Under-five mortality rankings .............................................................99TABLES1 Basic indicators ...........................................................................1002 Nutrition .......................................................................................1043 Health ...........................................................................................1084 HIV/AIDS ......................................................................................1125 Education .....................................................................................1166 Demographic indicators .............................................................1207 Economic indicators ...................................................................1248 Women .........................................................................................1289 Child protection ...........................................................................13210 The rate of progress ....................................................................13611 Adolescents .................................................................................14012 Disparities by residence .............................................................14413 Disparities by household wealth ...............................................14814 Early childhood development ....................................................152STATISTICAL TABLES 93
STATISTICAL TABLESOVERVIEWThis reference guide presents the most recent key statistics on child survival, development andprotection for the world’s countries, areas and regions. It includes, for the first time, a table on earlychildhood development.The statistical tables in this volume also support UNICEF’s focus on progress and results towardsinternationally agreed-upon goals and compacts relating to children’s rights and development.UNICEF is the lead agency responsible for monitoring the child-related goals of the MillenniumDeclaration as well as the Millennium Development Goals (MDGs) and indicators. UNICEF is alsoa key partner in the United Nations’ work on monitoring these targets and indicators.Efforts have been made to maximize the comparability of statistics across countries and time.Nevertheless, data used at the country level may differ in terms of the methods used to collect dataor arrive at estimates, and in terms of the populations covered. Furthermore, data presented hereare subject to evolving methodologies, revisions of time series data (e.g., immunization, maternalmortality ratios) and changing regional classifications. Also, data comparable from one year tothe next are unavailable for some indicators. It is therefore not advisable to compare data fromconsecutive editions of The State of the World’s <strong>Children</strong>.The numbers presented in this reference guide are available online at and via the UNICEF global statistical databases at . Please refer to these websitesfor the latest tables and for any updates or corrigenda subsequent to printing.General note on the dataData presented in the following statistical tables arederived from the UNICEF global databases and are accompaniedby definitions, sources and, where necessary,additional footnotes. The tables draw on inter-agencyestimates and nationally representative household surveyssuch as Multiple Indicator Cluster Surveys (MICS) andDemographic and Health Surveys (DHS). In addition, datafrom other United Nations organizations have been used.Data presented in this year’s statistical tables generally reflectinformation available as of August 2012. More detailedinformation on methodology and data sources is availableat .This volume includes the latest population estimates andprojections from World Population Prospects: The 2010 revisionand World Urbanization Prospects: The 2011 revision(United Nations Department of Economic and Social Affairs,Population Division). Data quality is likely to be adverselyaffected for countries that have recently suffered disasters,especially where basic country infrastructure has beenfragmented or where major population movementshave occurred.Multiple Indicator Cluster Surveys (MICS): UNICEF supportscountries in collecting reliable and globally mappeddata through MICS. Since 1995, around 240 surveys havebeen conducted in over 100 countries and areas. The fifthround of MICS, involving around 60 countries, is under way.MICS are among the largest sources of data for monitoringprogress towards internationally agreed-upon developmentgoals for children, including the MDGs. More information isavailable at .Child mortality estimatesEach year, in The State of the World’s <strong>Children</strong>, UNICEFreports a series of mortality estimates for children – includingthe annual infant mortality rate, the under-five mortalityrate and the number of under-five deaths – for at least tworeference years. These figures represent the best estimatesavailable at the time of printing and are based on the workof the United Nations Inter-agency Group for Child MortalityEstimation (IGME), which includes UNICEF, the World HealthOrganization (WHO), the World Bank and the United NationsPopulation Division. IGME mortality estimates are updatedannually through a detailed review of all newly availabledata points, which often results in adjustments to previouslyreported estimates. As a result, consecutive editionsof The State of the World’s <strong>Children</strong> should not be used foranalysing mortality trends over time. Comparable global andregional under-five mortality estimates for the period 1970–2011 are presented on page 95. Country-specific mortalityindicators for 1970–2011, based on the most recent IGME estimates,are presented in Table 10 (for the years 1970, 1990,2000 and 2011) and are available at and .94THE STATE OF THE WORLD’S CHILDREN 2013: <strong>Children</strong> <strong>with</strong> <strong>Disabilities</strong>
under-five mortality rate (per 1,000 live births)uNICEF Region 1970 1975 1980 1985 1990 1995 2000 2005 2010 2011Sub-Saharan Africa 236 212 197 184 178 170 154 133 112 109Eastern and Southern Africa 214 191 183 170 162 155 135 112 88 84West and Central Africa 259 237 215 202 197 190 175 155 135 132Middle East and North Africa 190 157 122 90 72 61 52 44 37 36South Asia 195 175 154 135 119 104 89 75 64 62East Asia and Pacific 120 92 75 62 55 49 39 29 22 20Latin America and Caribbean 117 100 81 65 53 43 34 26 22 19CEE/CIS 88 75 68 56 48 45 35 28 22 21Least developed countries 238 223 206 186 171 156 136 118 102 98World 141 123 111 96 87 82 73 63 53 51under-five deaths (millions)uNICEF Region 1970 1975 1980 1985 1990 1995 2000 2005 2010 2011Sub-Saharan Africa 3.1 3.2 3.4 3.5 3.8 4.0 4.0 3.8 3.4 3.4Eastern and Southern Africa 1.3 1.4 1.5 1.6 1.7 1.7 1.6 1.5 1.2 1.2West and Central Africa 1.6 1.7 1.8 1.9 2.1 2.2 2.2 2.2 2.1 2.1Middle East and North Africa 1.2 1.1 1.0 0.8 0.7 0.5 0.4 0.4 0.4 0.4South Asia 5.3 5.1 5.0 4.6 4.3 3.9 3.3 2.7 2.4 2.3East Asia and Pacific 5.2 3.5 2.3 2.4 2.2 1.6 1.3 0.9 0.6 0.6Latin America and Caribbean 1.2 1.1 0.9 0.8 0.6 0.5 0.4 0.3 0.2 0.2CEE/CIS 0.5 0.6 0.5 0.4 0.4 0.2 0.2 0.1 0.1 0.1Least developed countries 3.3 3.4 3.5 3.5 3.5 3.5 3.3 3.0 2.7 2.6World 16.9 14.8 13.1 12.7 12.0 10.8 9.6 8.2 7.1 6.9Notes on specific tablesTABLE 1. BASIC INdICATORSUnder-five mortality rate by gender: For the first time, IGMEhas produced gender-specific estimates of the under-fivemortality rate. Details on the estimation methods areavailable in the annex of the latest IGME report, at.Share of household income: The percentage share ofhousehold income received by the wealthiest 20 per centand the poorest 40 per cent of households has been movedfrom Table 1 to Table 7, where it is now presented alongsideother economic indicators.TABLE 2. NuTRITIONUnderweight, stunting, wasting and overweight: UNICEFand WHO have initiated a process to harmonize anthropometricdata used for computation and estimation ofregional and global averages and trend analysis. As partof this process, regional and global averages for underweight(moderate and severe), stunting, wasting andoverweight prevalences are derived from a modeldescribed in M. de Onis et al., ‘Methodology for EstimatingRegional and Global Trends of Child Malnutrition’(International Journal of Epidemiology, vol. 33, 2004,pp. 1260–1270). Owing to differences in data sources(i.e., new empirical data are incorporated as made available)and estimation methodology, these regional averageprevalence estimates may not be comparable to the averagespublished in previous editions of The State of theWorld’s <strong>Children</strong>.Vitamin A supplementation: Emphasizing the importancefor children of receiving two annual doses of vitamin A(spaced 4–6 months apart), this report presents only fullcoverage of vitamin A supplementation. In the absence ofa direct method to measure this indicator, full coverageis reported as the lower coverage estimate from rounds1 and 2 in a given year.TABLE 3. HEALTHDiarrhoea treatment: For the first time, the table includesdiarrhoea treatment <strong>with</strong> oral rehydration salts (ORS). ORSis a key commodity for child survival and therefore it is crucialto monitor its coverage. This replaces the indicator usedin previous years, diarrhoea treatment <strong>with</strong> oral rehydrationtherapy and continued feeding, which will continue to beavailable at .STATISTICAL TABLES 95
STATISTICAL TABLESWater and sanitation: The drinking water and sanitationcoverage estimates in this report come from theWHO/UNICEF Joint Monitoring Programme for WaterSupply and Sanitation (JMP). These are the official UnitedNations estimates for measuring progress towards the MDGtarget for drinking water and sanitation. Full details of theJMP methodology can be found at and . As the JMP estimates use linearregression applied to data from all available householdsample surveys and censuses, and additional data becomeavailable between each issue of estimates, subsequentJMP estimates should not be compared.Immunization: This report presents WHO and UNICEFestimates of national immunization coverage. These areofficial United Nations estimates for measuring progresstowards the MDG indicator for measles-containingvaccine coverage. Since 2000, the estimates are updatedonce annually in July, following a consultation processwherein countries are provided draft reports for reviewand comment. As the system incorporates new empiricaldata, each annual revision supersedes prior data releases,and coverage levels from earlier revisions are notcomparable. A more detailed explanation of the processcan be found at .Regional averages for the six reported antigens are computedas follows:• For BCG, regional averages include only those countrieswhere BCG is included in the national routine immunizationschedule.• For DPT, polio, measles, HepB and Hib vaccines, regionalaverages include all countries.• For protection at birth (PAB) from tetanus, regional averagesinclude only the countries where maternal and neonataltetanus is endemic.TABLE 4. HIV/AIdSIn 2012, the Joint United Nations Programme on HIV/AIDS(UNAIDS) released new global, regional and country levelHIV and AIDS estimates for 2011 that reflect key changes inWHO HIV treatment guidelines for adults and children andfor prevention of mother-to-child transmission of HIV as wellas improvements in assumptions of the probability of HIVtransmission from mother to child and net survival rates forinfected children. In addition, there are also more reliabledata available from population-based surveys, expandednational sentinel surveillance systems and programme servicestatistics in a number of countries. Based on the refinedmethodology, UNAIDS has retrospectively generated newestimates of HIV prevalence, the number of people living<strong>with</strong> HIV and those needing treatment, AIDS-related deaths,new HIV infections and the number of children whose parentshave died due to all causes including AIDS for pastyears. Only new estimates should be used for trend analysis.The new HIV and AIDS estimates included in this table willalso be published in the forthcoming UNAIDS Global AIDSReport, 2012.Overall, the global and regional figures published in TheState of the World’s <strong>Children</strong> 2013 are not comparable to estimatespreviously published. More information on HIV andAIDS estimates, methodology and updates can be found at.TABLE 8. WOmENMaternal mortality ratio (adjusted): The table presents the‘adjusted’ maternal mortality ratios for the year 2010, asproduced by the Maternal Mortality Estimation Inter-agencyGroup (MMEIG), composed of WHO, UNICEF, the UnitedNations Population Fund (UNFPA) and the World Bank, together<strong>with</strong> independent technical experts. To derive theseestimates, the inter-agency group used a dual approach:making adjustments to correct misclassification and underreportingin existing estimates of maternal mortality fromcivil registration systems, and using a model to generateestimates for countries <strong>with</strong>out reliable national-level estimatesof maternal mortality. These ‘adjusted’ estimatesshould not be compared to previous inter-agency estimates.The full report – <strong>with</strong> complete country and regional estimatesfor the years 1990, 1995, 2000, 2005 and 2010, aswell as details on the methodology – can be found at.TABLE 9. CHILd pROTECTIONViolent discipline: Estimates used in UNICEF publicationsand in MICS country reports prior to 2010 were calculatedusing household weights that did not take into account thelast-stage selection of children for the administration of thechild discipline module in MICS surveys. (A random selectionof one child aged 2–14 is undertaken for the administrationof the child discipline module.) In January 2010, itwas decided that more accurate estimates are produced byusing a household weight that takes the last-stage selectioninto account. MICS 3 data were recalculated using thisapproach. All UNICEF publications produced after 2010,including The State of the World’s <strong>Children</strong> 2013, use therevised estimates.Child labour: New data from the fourth round of MICS(MICS4, 2009–2012) included in the table have been recalculatedaccording to the indicator definition used in MICS3surveys, to ensure cross-country comparability. In thisdefinition, the activities of fetching water or collecting firewoodare classified as household chores rather than as aneconomic activity. Under this approach, a child between theages of 5–14 years old would have to be engaged in fetchingwater or collecting firewood for at least 28 hours perweek to be considered as a child labourer.96THE STATE OF THE WORLD’S CHILDREN 2013: <strong>Children</strong> <strong>with</strong> <strong>Disabilities</strong>
TABLE 10. THE RATE OF pROGRESSThe under-five mortality rate (U5MR) is used as theprincipal indicator of progress in child well-being. In 1970,around 16.9 million children under 5 years old were dyingevery year. In 2011, by comparison, the estimated numberof children who died before their fifth birthday stood at6.9 million – highlighting a significant long-term declinein the global number of under-five deaths.u5mR has several advantages as a gauge of childwell-being:• First, U5MR measures an end result of the developmentprocess rather than an ‘input’ such as school enrolmentlevel, per capita calorie availability or number of doctorsper thousand population – all of which are means toan end.• Second, U5MR is known to be the result of a wide varietyof inputs: for example, antibiotics to treat pneumonia;insecticide-treated mosquito nets to prevent malaria;the nutritional well-being and health knowledge ofmothers; the level of immunization and oral rehydrationtherapy use; the availability of maternal and child healthservices, including antenatal care; income and foodavailability in the family; the availability of safe drinkingwater and basic sanitation; and the overall safety of thechild’s environment.• Third, U5MR is less susceptible to the fallacy of the averagethan, for example, per capita gross national income(GNI). This is because the natural scale does not allowthe children of the rich to be one thousand times morelikely to survive, even if the human-made scale does permitthem to have one thousand times as much income.In other words, it is much more difficult for a wealthyminority to affect a nation’s U5MR, and this indicatortherefore presents a more accurate, if far from perfect,picture of the health status of the majority of childrenand of society as a whole.The speed of progress in reducing U5MR can be assessedby calculating its annual rate of reduction (ARR). Unlikethe comparison of absolute changes, ARR measuresrelative changes that reflect differences compared to thestarting value.As lower levels of under-five mortality are reached, thesame absolute reduction represents a greater percentagereduction. ARR therefore shows a higher rate of progressfor a 10-point absolute reduction, for example, if thatreduction happens at a lower level of under-five mortalityversus a higher level over the same time period. A 10-pointdecrease in U5MR from 100 in 1990 to 90 in 2011 representsa reduction of 10 per cent, corresponding to an ARR ofabout 0.5 per cent, whereas the same 10-point decreasefrom 20 to 10 over the same period represents a reductionof 50 per cent or an ARR of 3.3 per cent. (A negative valuefor the percentage reduction indicates an increase in U5MRduring the period specified.)When used in conjunction <strong>with</strong> gross domestic product(GDP) growth rates, U5MR and its rate of reduction cantherefore give a picture of the progress being made by anycountry, area or region, over any period of time, towardsthe satisfaction of some of the most essentialhuman needs.As Table 10 shows, there is no fixed relationship betweenthe annual reduction rate of U5MR and the annual rate ofgrowth in per capita GDP. Comparing these two indicatorshelps shed light on the relationship between economicadvances and human development.Finally, the table gives the total fertility rate for each countryand area and the corresponding ARR. It is clear thatmany of the nations that have achieved significant reductionsin their U5MR have also achieved significant reductionsin fertility.TABLES 12–13. EquITyDiarrhoea treatment: For the first time, these tables includediarrhoea treatment <strong>with</strong> oral rehydration salts. This replacesthe indicator used in previous years, diarrhoea treatment<strong>with</strong> oral rehydration therapy and continued feeding.STATISTICAL TABLES 97
STATISTICAL TABLESExplanation of symbolsThe following symbols are common across all tables:– Data are not available.x Data refer to years or periods other than those specified in the column heading. Such data are not included in thecalculation of regional and global averages, <strong>with</strong> the exception of 2005–2006 data from India.y Data differ from the standard definition or refer to only part of a country. If they fall <strong>with</strong>in the noted referenceperiod, such data are included in the calculation of regional and global averages.* Data refer to the most recent year available during the period specified in the column heading.** Excludes China.Sources and years for specific data points are available at . Symbols that appear in specific tablesare explained in the footnotes to those tables.Regional classificationAverages presented at the end of each of the 14 statistical tables are calculated using data from countries and areas asclassified below.Sub-Saharan AfricaEastern and Southern Africa; West and Central Africa;Djibouti; Sudan 1Eastern and Southern AfricaAngola; Botswana; Burundi; Comoros; Eritrea; Ethiopia;Kenya; Lesotho; Madagascar; Malawi; Mauritius;Mozambique; Namibia; Rwanda; Seychelles; Somalia; SouthAfrica; South Sudan 1 ; Swaziland; Uganda; United Republic ofTanzania; Zambia; ZimbabweWest and Central AfricaBenin; Burkina Faso; Cameroon; Cape Verde; Central AfricanRepublic; Chad; Congo; Côte d’Ivoire; Democratic Republicof the Congo; Equatorial Guinea; Gabon; Gambia; Ghana;Guinea; Guinea-Bissau; Liberia; Mali; Mauritania; Niger;Nigeria; Sao Tome and Principe; Senegal; Sierra Leone; Togomiddle East and North AfricaAlgeria; Bahrain; Djibouti; Egypt; Iran (Islamic Republicof); Iraq; Jordan; Kuwait; Lebanon; Libya; Morocco; Oman;Qatar; Saudi Arabia; State of Palestine; Sudan 1 ; Syrian ArabRepublic; Tunisia; United Arab Emirates; YemenSouth AsiaAfghanistan; Bangladesh; Bhutan; India; Maldives; Nepal;Pakistan; Sri LankaEast Asia and pacificBrunei Darussalam; Cambodia; China; Cook Islands;Democratic People’s Republic of Korea; Fiji; Indonesia;Kiribati; Lao People’s Democratic Republic; Malaysia;Marshall Islands; Micronesia (Federated States of);Mongolia; Myanmar; Nauru; Niue; Palau; Papua NewGuinea; Philippines; Republic of Korea; Samoa; Singapore;Solomon Islands; Thailand; Timor-Leste; Tonga; Tuvalu;Vanuatu; Viet NamLatin America and CaribbeanAntigua and Barbuda; Argentina; Bahamas; Barbados;Belize; Bolivia (Plurinational State of); Brazil; Chile;Colombia; Costa Rica; Cuba; Dominica; Dominican Republic;Ecuador; El Salvador; Grenada; Guatemala; Guyana; Haiti;Honduras; Jamaica; Mexico; Nicaragua; Panama; Paraguay;Peru; Saint Kitts and Nevis; Saint Lucia; Saint Vincent andthe Grenadines; Suriname; Trinidad and Tobago; Uruguay;Venezuela (Bolivarian Republic of)CEE/CISAlbania; Armenia; Azerbaijan; Belarus; Bosnia andHerzegovina; Bulgaria; Croatia; Georgia; Kazakhstan;Kyrgyzstan; Montenegro; Republic of Moldova; Romania;Russian Federation; Serbia; Tajikistan; the former YugoslavRepublic of Macedonia; Turkey; Turkmenistan; Ukraine;UzbekistanLeast developed countries/areas[Classified as such by the United Nations HighRepresentative for the Least Developed Countries,Landlocked Developing Countries and Small IslandDeveloping States (UN-OHRLLS)]. Afghanistan; Angola;Bangladesh; Benin; Bhutan; Burkina Faso; Burundi;Cambodia; Central African Republic; Chad; Comoros;Democratic Republic of the Congo; Djibouti; EquatorialGuinea; Eritrea; Ethiopia; Gambia; Guinea; Guinea-Bissau;Haiti; Kiribati; Lao People’s Democratic Republic;Lesotho; Liberia; Madagascar; Malawi; Mali; Mauritania;Mozambique; Myanmar; Nepal; Niger; Rwanda; Samoa;Sao Tome and Principe; Senegal; Sierra Leone; SolomonIslands; Somalia; South Sudan 1 ; Sudan 1 ; Timor-Leste; Togo;Tuvalu; Uganda; United Republic of Tanzania; Vanuatu;Yemen; Zambia98THE STATE OF THE WORLD’S CHILDREN 2013: <strong>Children</strong> <strong>with</strong> <strong>Disabilities</strong>
under-five mortality rankingsThe following list ranks countries and areas in descending order of their estimated 2011 under-five mortalityrate (U5MR), a critical indicator of the well-being of children. Countries and areas are listed alphabetically inthe tables on the following pages.Under-5mortalityrate (2011)Countries and areasValue RankSierra Leone 185 1Somalia 180 2Mali 176 3Chad 169 4Democratic Republic of the Congo 168 5Central African Republic 164 6Guinea-Bissau 161 7Angola 158 8Burkina Faso 146 9Burundi 139 10Cameroon 127 11Guinea 126 12Niger 125 13Nigeria 124 14South Sudan 1 121 15Equatorial Guinea 118 16Côte d’Ivoire 115 17Mauritania 112 18Togo 110 19Benin 106 20Swaziland 104 21Mozambique 103 22Afghanistan 101 23Gambia 101 23Congo 99 25Djibouti 90 26Uganda 90 26Sao Tome and Principe 89 28Lesotho 86 29Sudan 1 86 29Malawi 83 31Zambia 83 31Comoros 79 33Ghana 78 34Liberia 78 34Ethiopia 77 36Yemen 77 36Kenya 73 38Pakistan 72 39Haiti 70 40Eritrea 68 41United Republic of Tanzania 68 41Zimbabwe 67 43Gabon 66 44Senegal 65 45Tajikistan 63 46Madagascar 62 47Myanmar 62 47India 61 49Papua New Guinea 58 50Bhutan 54 51Rwanda 54 51Timor-Leste 54 51Turkmenistan 53 54Bolivia (Plurinational State of) 51 55Uzbekistan 49 56Nepal 48 57Kiribati 47 58South Africa 47 58Bangladesh 46 60Azerbaijan 45 61Cambodia 43 62Lao People’s Democratic Republic 42 63Micronesia (Federated States of) 42 63Namibia 42 63Nauru 40 66Under-5mortalityrate (2011)Countries and areasValue RankIraq 38 67Guyana 36 68Democratic People’s Republic of Korea 33 69Morocco 33 69Indonesia 32 71Kyrgyzstan 31 72Mongolia 31 72Algeria 30 74Guatemala 30 74Suriname 30 74Tuvalu 30 74Kazakhstan 28 78Trinidad and Tobago 28 78Botswana 26 80Marshall Islands 26 80Nicaragua 26 80Dominican Republic 25 83Iran (Islamic Republic of) 25 83Philippines 25 83Ecuador 23 86State of Palestine 22 87Paraguay 22 87Solomon Islands 22 87Viet Nam 22 87Cape Verde 21 91Egypt 21 91Georgia 21 91Honduras 21 91Jordan 21 91Niue 21 91Saint Vincent and the Grenadines 21 91Barbados 20 98Panama 20 98Palau 19 100Samoa 19 100Armenia 18 102Colombia 18 102Jamaica 18 102Peru 18 102Belize 17 106Bahamas 16 107Brazil 16 107Fiji 16 107Libya 16 107Mexico 16 107Republic of Moldova 16 107Saint Lucia 16 107Tunisia 16 107China 15 115El Salvador 15 115Mauritius 15 115Syrian Arab Republic 15 115Tonga 15 115Turkey 15 115Venezuela (Bolivarian Republic of) 15 115Albania 14 122Argentina 14 122Seychelles 14 122Grenada 13 125Romania 13 125Vanuatu 13 125Bulgaria 12 128Dominica 12 128Russian Federation 12 128Sri Lanka 12 128Thailand 12 128Under-5mortalityrate (2011)Countries and areasValue RankKuwait 11 133Maldives 11 133Bahrain 10 135Cook Islands 10 135Costa Rica 10 135The former Yugoslav Republic of Macedonia 10 135Ukraine 10 135Uruguay 10 135Chile 9 141Lebanon 9 141Oman 9 141Saudi Arabia 9 141Antigua and Barbuda 8 145Bosnia and Herzegovina 8 145Latvia 8 145Qatar 8 145Slovakia 8 145United States 8 145Brunei Darussalam 7 151Malaysia 7 151Montenegro 7 151Saint Kitts and Nevis 7 151Serbia 7 151United Arab Emirates 7 151Belarus 6 157Canada 6 157Cuba 6 157Hungary 6 157Lithuania 6 157Malta 6 157New Zealand 6 157Poland 6 157Australia 5 165Croatia 5 165Republic of Korea 5 165United Kingdom 5 165Austria 4 169Belgium 4 169Czech Republic 4 169Denmark 4 169Estonia 4 169France 4 169Germany 4 169Greece 4 169Ireland 4 169Israel 4 169Italy 4 169Monaco 4 169Netherlands 4 169Spain 4 169Switzerland 4 169Andorra 3 184Cyprus 3 184Finland 3 184Iceland 3 184Japan 3 184Luxembourg 3 184Norway 3 184Portugal 3 184Singapore 3 184Slovenia 3 184Sweden 3 184San Marino 2 195Holy See – –Liechtenstein – –1Due to the cession in July 2011 of the Republic of South Sudan by the Republic of the Sudan, and its subsequent admission to the United Nations on 14 July 2011, disaggregated data for theSudan and South Sudan as separate States are not yet available for all indicators. Aggregated data presented are for the Sudan pre-cession, and these data are included in the averages for theEastern and Southern Africa, Middle East and North Africa, and sub-Saharan Africa regions as well as the least developed countries/areas category. For the purposes of this report, South Sudanis designated as a least developed country.STATISTICAL TABLES 99
TABLE 1: BASIC INdICATORSCountriesand areasUnder-5mortalityrankUnder-5 mortality rate(U5MR)U5MR by sex2011Infant mortality rate(under 1)1990 2011 male female 1990 2011Afghanistan 23 192 101 103 99 129 73 36 32,358 1,408 128 410 x 49 – –Albania 122 41 14 15 14 36 13 7 3,216 41 1 3,980 77 96 80Algeria 74 66 30 32 28 54 26 17 35,980 712 21 4,470 73 73 97Andorra 184 8 3 4 3 7 3 1 86 − 0 41,750 x – – 79Angola 8 243 158 165 150 144 96 43 19,618 803 120 4,060 51 70 86Antigua and Barbuda 145 27 8 9 7 23 6 4 90 − 0 12,060 – 99 88Argentina 122 28 14 16 13 24 13 8 40,765 693 10 9,740 76 98 –Armenia 102 47 18 19 15 40 16 11 3,100 47 1 3,360 74 100 –Australia 165 9 5 5 4 8 4 3 22,606 307 1 46,200 x 82 – 97Austria 169 9 4 5 4 8 4 3 8,413 74 0 48,300 81 – –Azerbaijan 61 95 45 47 43 75 39 19 9,306 184 8 5,290 71 100 85Bahamas 107 22 16 17 15 18 14 7 347 5 0 21,970 x 76 – 98Bahrain 135 21 10 10 10 18 9 4 1,324 23 0 15,920 x 75 92 –Bangladesh 60 139 46 48 44 97 37 26 150,494 3,016 134 770 69 57 –Barbados 98 18 20 22 18 16 18 10 274 3 0 12,660 x 77 – 95Belarus 157 17 6 6 5 14 4 3 9,559 107 1 5,830 70 100 92Belgium 169 10 4 5 4 9 4 2 10,754 123 1 46,160 80 – 99Belize 106 44 17 19 15 35 15 8 318 8 0 3,690 76 – 97Benin 20 177 106 109 103 107 68 31 9,100 356 36 780 56 42 94Bhutan 51 138 54 57 50 96 42 25 738 15 1 2,070 67 53 x 90Bolivia (PlurinationalState of) 55 120 51 54 48 83 39 22 10,088 264 13 2,040 67 91 –Bosnia and Herzegovina 145 19 8 9 7 17 7 5 3,752 32 0 4,780 76 98 87Botswana 80 53 26 28 24 41 20 11 2,031 47 1 7,480 53 84 87Brazil 107 58 16 17 14 49 14 10 196,655 2,996 44 10,720 73 90 –Brunei Darussalam 151 12 7 8 7 9 6 4 406 8 0 31,800 x 78 95 –Bulgaria 128 22 12 13 11 19 11 7 7,446 75 1 6,550 73 98 100Burkina Faso 9 208 146 151 142 105 82 34 16,968 730 101 570 55 29 58Burundi 10 183 139 145 133 110 86 43 8,575 288 39 250 50 67 –Cambodia 62 117 43 47 37 85 36 19 14,305 317 13 830 63 74 96Cameroon 11 145 127 135 120 90 79 33 20,030 716 88 1,210 52 71 94Canada 157 8 6 6 5 7 5 4 34,350 388 2 45,560 81 – –Cape Verde 91 58 21 23 20 45 18 10 501 10 0 3,540 74 84 93Central African Republic 6 169 164 170 157 112 108 46 4,487 156 25 470 48 56 71Chad 4 208 169 177 160 113 97 42 11,525 511 79 690 50 34 –Chile 141 19 9 10 8 16 8 5 17,270 245 2 12,280 79 99 94China 115 49 15 15 14 39 13 9 1,347,565 16,364 249 4,930 73 94 100 zColombia 102 34 18 20 16 28 15 11 46,927 910 16 6,110 74 93 92Comoros 33 122 79 85 74 86 59 32 754 28 2 770 61 75 –Congo 25 119 99 103 94 75 64 32 4,140 145 14 2,270 57 – 91Cook Islands 135 19 10 11 8 16 8 5 20 − 0 − – – 98Costa Rica 135 17 10 11 9 15 9 6 4,727 73 1 7,660 79 96 –Côte d’Ivoire 17 151 115 125 105 104 81 41 20,153 679 75 1,100 55 56 61Croatia 165 13 5 6 5 11 4 3 4,396 43 0 13,850 77 99 96Cuba 157 13 6 6 5 11 5 3 11,254 110 1 5,460 x 79 100 100Cyprus 184 11 3 3 3 10 3 1 1,117 13 0 29,450 x 80 98 99Czech Republic 169 14 4 4 4 13 3 2 10,534 116 0 18,520 78 – –Democratic People’sRepublic of Korea 69 45 33 35 32 23 26 18 24,451 348 12 d 69 100 –Democratic Republicof the Congo 5 181 168 178 158 117 111 47 67,758 2,912 465 190 48 67 –Denmark 169 9 4 4 3 7 3 2 5,573 64 0 60,390 79 – 96Djibouti 26 122 90 95 84 94 72 33 906 26 2 1,270 x 58 – 45Dominica 128 17 12 13 11 14 11 8 68 − 0 7,090 – – 98Dominican Republic 83 58 25 27 23 45 21 14 10,056 216 5 5,240 73 90 93Ecuador 86 52 23 25 21 41 20 10 14,666 298 7 4,140 76 92 98Egypt 91 86 21 22 20 63 18 7 82,537 1,886 40 2,600 73 72 96El Salvador 115 60 15 17 14 47 13 6 6,227 126 2 3,480 72 84 95Equatorial Guinea 16 190 118 124 112 118 80 37 720 26 3 14,540 51 94 56Eritrea 41 138 68 74 61 86 46 22 5,415 193 13 430 62 68 35Estonia 169 20 4 4 3 16 3 2 1,341 16 0 15,200 75 100 96Ethiopia 36 198 77 82 72 118 52 31 84,734 2,613 194 400 59 39 82Fiji 107 30 16 18 15 25 14 8 868 18 0 3,680 69 – 99Finland 184 7 3 3 3 6 2 2 5,385 61 0 48,420 80 – 98France 169 9 4 5 4 7 3 2 63,126 792 3 42,420 82 – 99Gabon 44 94 66 72 59 69 49 25 1,534 42 3 7,980 63 88 –Neonatalmortalityrate2011Totalpopulation(thousands)2011Annual no.of births(thousands)2011Annual no.of under-5deaths(thousands)2011GNI percapita (US$)2011Lifeexpectancyat birth(years)2011Total adultliteracy rate(%)2007–2011*Primaryschool netenrolmentratio (%)2008–2011*100THE STATE OF THE WORLD’S CHILDREN 2013: <strong>Children</strong> <strong>with</strong> <strong>Disabilities</strong>
TABLE 1BASIC INdICATORSCountriesand areasUnder-5mortalityrankUnder-5 mortality rate(U5MR)U5MR by sex2011Infant mortality rate(under 1)1990 2011 male female 1990 2011Gambia 23 165 101 107 94 78 58 34 1,776 67 6 610 58 50 69Georgia 91 47 21 23 18 40 18 15 4,329 51 1 2,860 74 100 100Germany 169 9 4 4 4 7 3 2 82,163 699 3 43,980 80 – 100Ghana 34 121 78 83 72 76 52 30 24,966 776 60 1,410 64 67 84Greece 169 13 4 5 4 12 4 3 11,390 117 1 25,030 80 97 –Grenada 125 21 13 13 12 17 10 7 105 2 0 7,220 76 – 97Guatemala 74 78 30 33 28 56 24 15 14,757 473 14 2,870 71 75 99Guinea 12 228 126 128 123 135 79 39 10,222 394 48 440 54 41 77Guinea-Bissau 7 210 161 174 147 125 98 44 1,547 59 9 600 48 54 75Guyana 68 63 36 40 32 48 29 20 756 13 0 2,900 x 70 – 84Haiti 40 143 70 74 66 99 53 25 10,124 266 19 700 62 49 x –Holy See – – – – – – – – 0 – – – – – –Honduras 91 55 21 23 20 43 18 11 7,755 205 4 1,970 73 85 96Hungary 157 19 6 7 6 17 5 4 9,966 100 1 12,730 74 99 98Iceland 184 6 3 3 2 5 2 1 324 5 0 35,020 82 – 99India 49 114 61 59 64 81 47 32 1,241,492 27,098 1,655 1,410 65 63 98Indonesia 71 82 32 34 29 54 25 15 242,326 4,331 134 2,940 69 93 99Iran (Islamic Republic of) 83 61 25 25 25 47 21 14 74,799 1,255 33 4,520 x 73 85 –Iraq 67 46 38 41 35 37 31 20 32,665 1,144 42 2,640 69 78 –Ireland 169 9 4 4 4 8 3 2 4,526 72 0 38,580 81 – 100Israel 169 12 4 5 4 10 4 2 7,562 156 1 28,930 82 – 97Italy 169 10 4 4 3 8 3 2 60,789 557 2 35,330 82 99 99Jamaica 102 35 18 21 16 28 16 11 2,751 50 1 4,980 73 87 82Japan 184 6 3 4 3 5 2 1 126,497 1,073 4 45,180 83 – 100Jordan 91 37 21 22 19 31 18 12 6,330 154 3 4,380 73 93 91Kazakhstan 78 57 28 32 24 48 25 14 16,207 345 11 8,220 67 100 100Kenya 38 98 73 78 67 64 48 27 41,610 1,560 107 820 57 87 84Kiribati 58 88 47 50 45 64 38 19 101 – 0 2,110 – – –Kuwait 133 17 11 12 10 14 9 5 2,818 50 1 48,900 x 75 94 98Kyrgyzstan 72 70 31 34 28 58 27 16 5,393 131 4 920 68 99 95Lao People’sDemocratic Republic 63 148 42 44 39 102 34 18 6,288 140 6 1,130 67 73 x 97Latvia 145 21 8 9 8 17 7 5 2,243 24 0 12,350 73 100 96Lebanon 141 33 9 10 9 27 8 5 4,259 65 1 9,110 73 90 93Lesotho 29 88 86 93 79 71 63 39 2,194 60 5 1,220 48 90 74Liberia 34 241 78 83 74 161 58 27 4,129 157 12 240 57 61 –Libya 107 44 16 17 16 33 13 10 6,423 144 2 12,320 x 75 89 –Liechtenstein – – – – – – – – 36 – – 137,070 x – – 99Lithuania 157 17 6 6 5 14 5 3 3,307 35 0 12,280 72 100 96Luxembourg 184 8 3 3 3 7 2 2 516 6 0 78,130 80 – 97Madagascar 47 161 62 65 58 98 43 23 21,315 747 45 430 67 64 –Malawi 31 227 83 87 79 134 53 27 15,381 686 52 340 54 75 97Malaysia 151 17 7 7 6 15 6 3 28,859 579 4 8,420 74 93 –Maldives 133 105 11 12 10 76 9 7 320 5 0 6,530 77 98 x 97Mali 3 257 176 182 169 132 98 49 15,840 728 121 610 51 31 66Malta 157 11 6 7 5 10 5 4 418 4 0 18,620 x 80 92 x 94Marshall Islands 80 52 26 29 23 41 22 12 55 − 0 3,910 – – 99Mauritania 18 125 112 120 104 81 76 40 3,542 118 13 1,000 59 58 74Mauritius 115 24 15 16 14 21 13 9 1,307 16 0 8,240 73 89 93Mexico 107 49 16 17 14 38 13 7 114,793 2,195 34 9,240 77 93 100Micronesia(Federated States of) 63 56 42 47 36 44 34 17 112 3 0 2,900 69 – –Monaco 169 8 4 4 3 6 3 2 35 − 0 183,150 x – – –Mongolia 72 107 31 35 26 76 26 12 2,800 65 2 2,320 68 97 99Montenegro 151 18 7 8 7 16 7 5 632 8 0 7,060 75 98 83Morocco 69 81 33 35 30 64 28 19 32,273 620 21 2,970 72 56 94Mozambique 22 226 103 107 99 151 72 34 23,930 889 86 470 50 56 92Myanmar 47 107 62 69 56 77 48 30 48,337 824 53 d 65 92 –Namibia 63 73 42 45 38 49 30 18 2,324 60 2 4,700 62 89 86Nauru 66 40 40 56 24 32 32 22 10 − 0 − – – –Nepal 57 135 48 49 47 94 39 27 30,486 722 34 540 69 60 –Netherlands 169 8 4 4 4 7 3 3 16,665 181 1 49,730 81 – 100New Zealand 157 11 6 7 5 9 5 3 4,415 64 0 29,350 x 81 – 99Nicaragua 80 66 26 29 22 50 22 13 5,870 138 4 1,170 74 78 x 94Niger 13 314 125 127 122 133 66 32 16,069 777 89 360 55 29 x 58Neonatalmortalityrate2011Totalpopulation(thousands)2011Annual no.of births(thousands)2011Annual no.of under-5deaths(thousands)2011GNI percapita (US$)2011Lifeexpectancyat birth(years)2011Total adultliteracy rate(%)2007–2011*Primaryschool netenrolmentratio (%)2008–2011*STATISTICAL TABLES 101
TABLE 1BASIC INdICATORSCountriesand areasUnder-5mortalityrankUnder-5 mortality rate(U5MR)U5MR by sex2011Infant mortality rate(under 1)1990 2011 male female 1990 2011Nigeria 14 214 124 129 119 127 78 39 162,471 6,458 756 1,200 52 61 58Niue 91 14 21 21 21 12 18 10 1 – 0 – – – –Norway 184 8 3 3 3 7 3 2 4,925 61 0 88,890 81 – 99Oman 141 48 9 9 8 36 7 5 2,846 50 0 19,260 x 73 87 98Pakistan 39 122 72 76 68 95 59 36 176,745 4,764 352 1,120 65 55 74Palau 100 32 19 23 14 27 14 9 21 – 0 7,250 – – –Panama 98 33 20 21 18 26 17 9 3,571 70 1 7,910 76 94 99Papua New Guinea 50 88 58 60 55 64 45 23 7,014 208 12 1,480 63 61 –Paraguay 87 53 22 25 20 41 19 13 6,568 158 3 2,970 72 94 86Peru 102 75 18 20 17 54 14 9 29,400 591 11 5,500 74 90 98Philippines 83 57 25 29 22 40 20 12 94,852 2,358 57 2,210 69 95 89Poland 157 17 6 6 5 15 5 4 38,299 410 2 12,480 76 100 96Portugal 184 15 3 4 3 11 3 2 10,690 97 0 21,250 79 95 99Qatar 145 20 8 8 7 17 6 4 1,870 21 0 80,440 78 96 96Republic of Korea 165 8 5 5 4 6 4 2 48,391 479 3 20,870 81 – 99Republic of Moldova 107 35 16 17 15 29 14 8 3,545 44 1 1,980 69 99 90Romania 125 37 13 14 11 31 11 8 21,436 221 3 7,910 74 98 88Russian Federation 128 27 12 13 10 23 10 7 142,836 1,689 20 10,400 69 100 96Rwanda 51 156 54 57 51 95 38 21 10,943 449 23 570 55 71 99Saint Kitts and Nevis 151 28 7 8 6 22 6 5 53 – 0 12,480 – – 86Saint Lucia 107 23 16 17 14 18 14 9 176 3 0 6,680 75 – 90Saint Vincent andthe Grenadines 91 27 21 23 19 21 20 13 109 2 0 6,100 72 – 98Samoa 100 30 19 21 16 25 16 8 184 4 0 3,190 72 99 95San Marino 195 12 2 2 2 11 2 1 32 – 0 50,400 x – – 92Sao Tome and Principe 28 96 89 92 86 62 58 29 169 5 0 1,360 65 89 99Saudi Arabia 141 43 9 10 8 34 8 5 28,083 605 6 17,820 74 87 90Senegal 45 136 65 69 60 69 47 26 12,768 471 30 1,070 59 50 78Serbia 151 29 7 8 6 25 6 4 9,854 110 1 5,680 75 98 95Seychelles 122 17 14 15 13 14 12 9 87 − 0 11,130 – 92 –Sierra Leone 1 267 185 194 176 158 119 49 5,997 227 42 340 48 42 –Singapore 184 8 3 3 2 6 2 1 5,188 47 0 42,930 81 96 –Slovakia 145 18 8 9 7 16 7 4 5,472 58 0 16,070 75 – –Slovenia 184 10 3 3 3 9 2 2 2,035 20 0 23,610 79 100 97Solomon Islands 87 42 22 21 22 34 18 11 552 17 0 1,110 68 – –Somalia 2 180 180 190 170 108 108 50 9,557 416 71 d 51 – –South Africa 58 62 47 50 44 48 35 19 50,460 1,052 47 6,960 53 89 90South Sudan s 15 217 121 122 119 129 76 38 10,314 − 43 a – – –Spain 169 11 4 5 4 9 4 3 46,455 499 2 30,990 81 98 100Sri Lanka 128 29 12 13 11 24 11 8 21,045 373 5 2,580 75 91 94State of Palestine 87 43 22 23 21 36 20 13 4,152 137 3 a 73 95 89Sudan s 29 123 86 91 81 77 57 31 34,318 − 95 − – – –Suriname 74 52 30 33 26 44 26 16 529 10 0 7,640 x 71 95 91Swaziland 21 83 104 113 94 61 69 35 1,203 35 4 3,300 49 87 86Sweden 184 7 3 3 3 6 2 2 9,441 113 0 53,230 81 – 99Switzerland 169 8 4 5 4 7 4 3 7,702 77 0 76,380 82 – 99Syrian Arab Republic 115 36 15 16 14 30 13 9 20,766 466 7 2,750 x 76 83 99Tajikistan 46 114 63 70 56 89 53 25 6,977 194 12 870 68 100 98Thailand 128 35 12 13 11 29 11 8 69,519 824 10 4,420 74 94 x 90The former YugoslavRepublic of Macedonia 135 38 10 11 9 34 9 6 2,064 22 0 4,730 75 97 98Timor-Leste 51 180 54 57 51 135 46 24 1,154 44 2 2,730 x 62 58 86Togo 19 147 110 118 102 85 73 36 6,155 195 21 560 57 57 94Tonga 115 25 15 18 13 21 13 8 105 3 0 3,580 72 99 x –Trinidad and Tobago 78 37 28 31 24 32 25 18 1,346 20 1 15,040 70 99 97Tunisia 107 51 16 18 15 40 14 10 10,594 179 3 4,070 75 78 99Turkey 115 72 15 16 14 60 12 9 73,640 1,289 20 10,410 74 91 97Turkmenistan 54 94 53 57 48 75 45 22 5,105 109 5 4,110 65 100 –Tuvalu 74 58 30 33 27 45 25 14 10 − 0 5,010 – – –Uganda 26 178 90 97 83 106 58 28 34,509 1,545 131 510 54 73 91Ukraine 135 19 10 11 9 17 9 5 45,190 494 5 3,120 68 100 91United Arab Emirates 151 22 7 7 6 19 6 4 7,891 94 1 40,760 77 90 x –United Kingdom 165 9 5 6 5 8 4 3 62,417 761 4 37,780 80 – 100United Republicof Tanzania 41 158 68 70 65 97 45 25 46,218 1,913 122 540 58 73 98United States 145 11 8 8 7 9 6 4 313,085 4,322 32 48,450 79 – 96Neonatalmortalityrate2011Totalpopulation(thousands)2011Annual no.of births(thousands)2011Annual no.of under-5deaths(thousands)2011GNI percapita (US$)2011Lifeexpectancyat birth(years)2011Total adultliteracy rate(%)2007–2011*Primaryschool netenrolmentratio (%)2008–2011*102THE STATE OF THE WORLD’S CHILDREN 2013: <strong>Children</strong> <strong>with</strong> <strong>Disabilities</strong>
TABLE 1BASIC INdICATORSCountriesand areasUnder-5mortalityrankUnder-5 mortality rate(U5MR)U5MR by sex2011Infant mortality rate(under 1)1990 2011 male female 1990 2011Uruguay 135 23 10 11 9 20 9 5 3,380 49 1 11,860 77 98 99Uzbekistan 56 75 49 55 42 62 42 15 27,760 589 30 1,510 68 99 92Vanuatu 125 39 13 14 12 31 11 7 246 7 0 2,870 71 83 –Venezuela(Bolivarian Republic of) 115 31 15 17 13 26 13 8 29,437 598 9 11,920 74 96 95Viet Nam 87 50 22 25 19 36 17 12 88,792 1,458 32 1,260 75 93 98Yemen 36 126 77 80 73 89 57 32 24,800 940 70 1,070 65 64 78Zambia 31 193 83 86 80 114 53 27 13,475 622 46 1,160 49 71 93Zimbabwe 43 79 67 73 61 53 43 30 12,754 377 24 640 51 – –Neonatalmortalityrate2011Totalpopulation(thousands)2011Annual no.of births(thousands)2011Annual no.of under-5deaths(thousands)2011GNI percapita (US$)2011Lifeexpectancyat birth(years)2011Total adultliteracy rate(%)2007–2011*Primaryschool netenrolmentratio (%)2008–2011*MEMORANDUMSudan andSouth Sudan s – – – – – – – – – 1,447 – 1,300 x 61 – –SUMMARY INDICATORS #Sub-Saharan Africa 178 109 114 103 107 69 34 876,497 32,584 3,370 1,269 55 63 76Eastern andSouthern Africa 162 84 89 79 100 55 29 418,709 14,399 1,177 1,621 56 68 86West andCentral Africa 197 132 138 126 116 83 39 422,564 16,712 2,096 937 53 57 67Middle East andNorth Africa 72 36 38 34 54 28 16 415,633 10,017 351 6,234 71 77 90South Asia 119 62 61 63 85 48 32 1,653,679 37,402 2,309 1,319 66 62 92East Asia and Pacific 55 20 21 19 41 17 11 2,032,532 28,448 590 4,853 73 94 96Latin Americaand Caribbean 53 19 21 17 42 16 10 591,212 10,790 203 8,595 74 91 95CEE/CIS 48 21 23 19 40 18 10 405,743 5,823 125 7,678 70 98 95Least developedcountries 171 98 102 93 107 65 33 851,103 28,334 2,649 695 59 60 80World 87 51 53 50 61 37 22 6,934,761 135,056 6,914 9,513 69 84 91s Due to the cession in July 2011 of the Republic of South Sudan by the Republic of the Sudan, and its subsequent admission to the United Nations on 14 July 2011, disaggregated data for the Sudanand South Sudan as separate States are not yet available for all indicators. Aggregated data presented are for the Sudan pre-cession (see Memorandum item).# For a complete list of countries and areas in the regions, subregions and country categories, see page 98.DEFINITIONS OF THE INDICATORSUnder-5 mortality rate – Probability of dying between birth and exactly 5 years of age,expressed per 1,000 live births.Infant mortality rate – Probability of dying between birth and exactly 1 year of age, expressedper 1,000 live births.Neonatal mortality rate – Probability of dying during the first 28 completed days of life,expressed per 1,000 live births.GNI per capita – Gross national income (GNI) is the sum of value added by all residentproducers, plus any product taxes (less subsidies) not included in the valuation of output, plusnet receipts of primary income (compensation of employees and property income) from abroad.GNI per capita is GNI divided by midyear population. GNI per capita in US dollars is convertedusing the World Bank Atlas method.Life expectancy at birth – Number of years newborn children would live if subject to themortality risks prevailing for the cross section of population at the time of their birth.Total adult literacy rate – Number of literate persons aged 15 and above, expressed as apercentage of the total population in that age group.Primary school net enrolment ratio – Number of children enrolled in primary or secondaryschool who are of official primary school age, expressed as a percentage of the total number ofchildren of official primary school age. Because of the inclusion of primary-school-aged childrenenrolled in secondary school, this indicator can also be referred to as a primary adjusted netenrolment ratio.MAIN DATA SOURCESUnder-5 and infant mortality rates – United Nations Inter-agency Group for Child MortalityEstimation (UNICEF, World Health Organization, United Nations Population Division and theWorld Bank).Neonatal mortality rate – World Health Organization, using civil registrations, surveillancesystems and household surveys.Total population and births – United Nations Population Division.Under-5 deaths – United Nations Inter-agency Group for Child Mortality Estimation (UNICEF,World Health Organization, United Nations Population Division and the World Bank).GNI per capita – The World Bank.Life expectancy at birth – United Nations Population Division.Total adult literacy rate and primary school net enrolment ratio – UNESCO Institute forStatistics.NOTESa low-income country (GNI per capita is $1,025 or less).b lower-middle-income country (GNI per capita is $1,026 to $4,035).c upper-middle-income country (GNI per capita is $4,036 to $12,475).d high-income country (GNI per capita is $12,476 or more).− Data not available.x Data refer to years or periods other than those specified in the column heading. Such dataare not included in the calculation of regional and global averages.z Data provided by the Chinese Ministry of Education. The UNESCO Institute for Statisticsdataset does not currently include net enrolment rates for China.* Data refer to the most recent year available during the period specified in the column heading.STATISTICAL TABLES 103
TABLE 2: NuTRITIONCountriesand areasLowbirthweight(%)2007–2011*Earlyinitiation ofbreastfeeding(%)2007–2011*Exclusivebreastfeeding
TABLE 2NuTRITIONCountriesand areasLowbirthweight(%)2007–2011*Earlyinitiation ofbreastfeeding(%)2007–2011*Exclusivebreastfeeding
TABLE 2NuTRITIONCountriesand areasLowbirthweight(%)2007–2011*Earlyinitiation ofbreastfeeding(%)2007–2011*Exclusivebreastfeeding
TABLE 2NuTRITIONCountriesand areasLowbirthweight(%)2007–2011*Earlyinitiation ofbreastfeeding(%)2007–2011*Exclusivebreastfeeding
TABLE 3: HEALTHCountriesUse of improveddrinking watersources (%) 2010Use of improvedsanitation facilities(%) 2010RoutineEPIvaccinesfinancedby govt.Immunization coverage (%)2011Pneumonia (%)2007–2012*Diarrhoea(%)2007–2012*Malaria (%)2007–2012*and areas(%)rehydrationtotal urban rural total urban rural 2011 BCG DPT1 b DPT3 b Polio3 MCV HepB3 Hib3pneumonia salts (ORS)Afghanistan 50 78 42 37 60 30 – 68 86 66 66 62 66 66 60 61 64 53 – – –Albania 95 96 94 94 95 93 – 99 99 99 99 99 99 99 87 70 60 54 – – –Algeria 83 85 79 95 98 88 – 99 99 95 95 95 95 95 90 53 x 59 x 19 x – – –Andorra 100 100 100 100 100 100 – – 99 99 99 99 99 99 – – – – – – –Angola 51 60 38 58 85 19 – 88 99 86 85 88 86 86 70 – – – 28 26 35Antigua and Barbuda – 95 – – 98 – – – 99 99 99 99 99 99 – – – – – – –Argentina – 98 – – – – – 99 98 93 95 93 93 93 – – – – – – –Armenia 98 99 97 90 95 80 – 96 98 95 96 97 95 95 – 57 36 33 – – –Australia 100 100 100 100 100 100 – – 92 92 92 94 92 92 – – – – – – –Austria 100 100 100 100 100 100 – – 93 83 83 76 83 83 – – – – – – –Azerbaijan 80 88 71 82 86 78 78 82 79 74 80 67 48 38 – 36 x – 21 x 1 x 1 x –Bahamas – 98 – 100 100 100 – – 99 98 97 90 95 98 92 – – – – – –Bahrain – 100 – – 100 – 100 – 99 99 99 99 99 99 94 – – – – – –Bangladesh 81 85 80 56 57 55 30 95 99 96 96 96 96 96 94 35 71 78 – – –Barbados 100 100 100 100 100 100 – – 93 91 91 93 91 91 – – – – – – –Belarus 100 100 99 93 91 97 – 99 99 98 98 99 98 21 – 90 x 67 x 36 x – – –Belgium 100 100 100 100 100 100 – – 99 98 98 95 97 98 – – – – – – –Belize 98 98 99 90 93 87 – 98 98 95 95 98 95 95 88 71 x 44 x 27 x – – –Benin 75 84 68 13 25 5 17 97 94 85 85 72 85 85 92 31 – 50 38 71 80Bhutan 96 100 94 44 73 29 4 95 98 95 95 95 95 – 89 74 49 61 – – –Bolivia (PlurinationalState of) 88 96 71 27 35 10 – 90 90 82 82 84 82 82 74 51 64 35 – – –Bosnia and Herzegovina 99 100 98 95 99 92 – 94 94 88 89 89 88 85 – 91 x 73 x 35 x – – –Botswana 96 99 92 62 75 41 100 99 98 96 96 94 93 96 92 14 x – 49 x – – –Brazil 98 100 85 79 85 44 – 99 99 96 97 97 96 97 92 50 – – – – –Brunei Darussalam – – – – – – – 96 99 97 99 91 93 96 95 – – – – – –Bulgaria 100 100 100 100 100 100 – 98 96 95 95 95 96 95 – – – – – – –Burkina Faso 79 95 73 17 50 6 32 99 93 91 90 63 91 91 88 56 47 21 35 47 57Burundi 72 83 71 46 49 46 3 90 99 96 94 92 96 96 80 55 43 38 17 45 52Cambodia 64 87 58 31 73 20 23 94 96 94 94 93 94 94 91 64 39 34 – 4 x 5 xCameroon 77 95 52 49 58 36 9 80 90 66 67 76 66 66 75 30 – 17 21 21 36Canada 100 100 99 100 100 99 – – 98 95 99 98 70 95 – – – – – – –Cape Verde 88 90 85 61 73 43 100 99 99 90 90 96 90 90 92 – – – – – –Central African Republic 67 92 51 34 43 28 – 74 64 54 47 62 54 54 80 30 31 16 32 36 47Chad 51 70 44 13 30 6 11 53 45 22 31 28 22 22 60 26 31 13 36 10 42Chile 96 99 75 96 98 83 – 91 98 94 93 91 94 94 – – – – – – –China 91 98 85 64 74 56 100 99 99 99 99 99 99 – – – – – – – –Colombia 92 99 72 77 82 63 – 83 95 85 85 88 85 85 79 64 – 54 – – 3 xComoros 95 91 97 36 50 30 – 76 94 83 85 72 83 83 85 56 x – 19 x 63 x 9 x –Congo 71 95 32 18 20 15 9 95 90 90 90 90 90 90 83 52 – 35 25 26 27Cook Islands – 98 – 100 100 100 – 98 98 93 93 89 93 93 – – – – – – –Costa Rica 97 100 91 95 95 96 – 78 87 85 82 83 84 81 – – – – – – –Côte d’Ivoire 80 91 68 24 36 11 30 74 75 62 58 49 62 62 82 38 – 17 18 39 68Croatia 99 100 97 99 99 98 – 99 97 96 96 96 97 96 – – – – – – –Cuba 94 96 89 91 94 81 – 99 96 96 99 99 96 96 – 97 70 51 – – –Cyprus 100 100 100 100 100 100 – – 99 99 99 87 96 96 – – – – – – –Czech Republic 100 100 100 98 99 97 – – 99 99 99 98 99 99 – – – – – – –Democratic People’sRepublic of Korea 98 99 97 80 86 71 – 98 95 94 99 99 94 – 93 80 88 74 – – –Democratic Republicof the Congo 45 79 27 24 24 24 0 67 79 70 78 71 70 70 70 40 42 27 39 38 51Denmark 100 100 100 100 100 100 – – 94 91 91 87 – 91 – – – – – – –Djibouti 88 99 54 50 63 10 0 89 89 87 87 84 87 87 79 62 x 43 x 62 x 1 20 30Dominica – 96 – – – – – 99 99 98 99 99 98 98 – – – – – – –Dominican Republic 86 87 84 83 87 75 – 98 91 84 84 79 80 71 90 70 57 41 – – –Ecuador 94 96 89 92 96 84 – 99 99 99 99 98 98 99 85 – – – – – –Egypt 99 100 99 95 97 93 100 98 97 96 96 96 96 – 86 73 58 28 – – –El Salvador 88 94 76 87 89 83 – 91 90 89 89 89 90 90 88 67 51 58 – – –Equatorial Guinea – – – – – – 100 73 65 33 39 51 – – 75 – – 29 x 49 x 1 x –Eritrea – – – – – 4 3 99 99 99 99 99 99 99 93 44 x – 45 x 13 49 71Estonia 98 99 97 95 96 94 100 99 96 93 93 94 94 93 – – – – – – –Ethiopia 44 97 34 21 29 19 – 69 61 51 62 57 51 51 88 27 7 26 10 33 53Fiji 98 100 95 83 94 71 – 99 99 99 99 94 99 99 94 – – – – – –Finland 100 100 100 100 100 100 100 – 99 99 99 97 – 99 – – – – – – –Newbornsprotectedagainsttetanus lCareseekingforsuspectedpneumoniaAntibiotictreatmentforsuspectedTreatment<strong>with</strong> oralAntimalarialtreatmentamongfebrilechildren<strong>Children</strong>sleepingunderITNsHouseholds<strong>with</strong> atleastone ITN108THE STATE OF THE WORLD’S CHILDREN 2013: <strong>Children</strong> <strong>with</strong> <strong>Disabilities</strong>
TABLE 3HEALTHCountriesUse of improveddrinking watersources (%) 2010Use of improvedsanitation facilities(%) 2010RoutineEPIvaccinesfinancedby govt.Immunization coverage (%)2011Pneumonia (%)2007-2012*Diarrhoea(%)2007-2012*Malaria (%)2007-2012*and areas(%)rehydrationtotal urban rural total urban rural 2011 BCG DPT1 b DPT3 b Polio3 MCV HepB3 Hib3pneumonia salts (ORS)France 100 100 100 100 100 100 – – 99 99 99 89 65 97 – – – – – – –Gabon 87 95 41 33 33 30 100 89 69 45 44 55 45 45 75 48 x – 25 x – 55 70Gambia 89 92 85 68 70 65 100 90 99 96 95 91 96 96 91 69 70 39 30 33 51Georgia 98 100 96 95 96 93 78 96 95 94 90 94 92 92 – 74 x 56 x 40 x – – –Germany 100 100 100 100 100 100 – – 99 99 95 99 93 93 – – – – – – –Ghana 86 91 80 14 19 8 – 98 94 91 91 91 91 91 88 41 56 35 53 39 48Greece 100 100 99 98 99 97 – 91 99 99 99 99 95 83 – – – – – – –Grenada – 97 – 97 96 97 – – 98 94 95 95 94 94 – – – – – – –Guatemala 92 98 87 78 87 70 – 89 91 85 86 87 85 85 85 64 x – 37 – – –Guinea 74 90 65 18 32 11 24 93 86 59 57 58 59 59 80 42 x – 33 x 74 5 8Guinea-Bissau 64 91 53 20 44 9 – 93 92 76 73 61 76 76 80 52 35 19 51 36 53Guyana 94 98 93 84 88 82 – 97 97 93 93 98 93 93 90 65 18 50 6 24 26Haiti 69 85 51 17 24 10 – 75 83 59 59 59 – – 70 31 x 3 x 40 x 5 x – –Holy See – – – – – – – – – – – – – – – – – – – – –Honduras 87 95 79 77 85 69 – 99 99 98 98 99 98 98 94 56 x 54 x 56 x 1 x – –Hungary 100 100 100 100 100 100 100 99 99 99 99 99 – 99 – – – – – – –Iceland 100 100 100 100 100 100 – – 98 96 96 93 – 96 – – – – – – –India 92 97 90 34 58 23 100 87 83 72 70 74 47 – 87 69 x 13 x 26 x 8 x – –Indonesia 82 92 74 54 73 39 100 82 86 63 70 89 63 – 85 66 – 35 1 3 3Iran (Islamic Republic of) 96 97 92 100 100 100 100 99 99 99 99 99 99 – 95 93 x – – – – –Iraq 79 91 56 73 76 67 – 92 90 77 78 76 76 – 85 82 x 82 x 31 x 1 x 0 x –Ireland 100 100 100 99 100 98 – 41 98 95 95 92 95 95 – – – – – – –Israel 100 100 100 100 100 100 – – 96 94 94 98 99 93 – – – – – – –Italy 100 100 100 – – – – – 98 96 96 90 96 96 – – – – – – –Jamaica 93 98 88 80 78 82 – 99 99 99 99 88 99 99 80 75 x 52 x 40 x – – –Japan 100 100 100 100 100 100 – 94 99 98 96 94 – – – – – – – – –Jordan 97 98 92 98 98 98 100 95 98 98 98 98 98 98 90 75 79 20 – – –Kazakhstan 95 99 90 97 97 98 – 96 99 99 99 99 99 95 – 71 x 32 x 74 x – – –Kenya 59 82 52 32 32 32 57 92 95 88 88 87 88 88 73 56 50 39 23 47 56Kiribati – – – – – – – 86 99 99 95 90 95 95 – 81 51 62 – – –Kuwait 99 99 99 100 100 100 – 99 99 99 99 99 99 99 95 – – – – – –Kyrgyzstan 90 99 85 93 94 93 – 98 97 96 94 97 96 96 – 62 x 45 x 20 x – – –Lao People’sDemocratic Republic 67 77 62 63 89 50 6 77 83 78 79 69 78 78 80 32 x 52 x 46 x 8 x 41 x 45 xLatvia 99 100 96 – – – 100 95 97 94 94 99 91 93 – – – – – – –Lebanon 100 100 100 – 100 – – – 84 81 75 79 81 81 – 74 x – 44 x – – –Lesotho 78 91 73 26 32 24 42 95 93 83 91 85 83 83 83 66 – 51 – – –Liberia 73 88 60 18 29 7 91 73 61 49 56 40 49 49 91 62 – 53 57 37 50Libya – – – 97 97 96 – 99 98 98 98 98 98 98 – – – – – – –Liechtenstein – – – – – – – – – – – – – – – – – – – – –Lithuania – 98 – – 95 – 100 98 95 92 92 94 95 92 – – – – – – –Luxembourg 100 100 100 100 100 100 – – 99 99 99 96 95 99 – – – – – – –Madagascar 46 74 34 15 21 12 21 82 96 89 88 70 89 89 78 42 – 17 20 46 57Malawi 83 95 80 51 49 51 – 99 98 97 86 96 97 97 87 70 – 69 43 39 57Malaysia 100 100 99 96 96 95 – 99 99 99 99 95 97 99 90 – – – – – –Maldives 98 100 97 97 98 97 100 98 97 96 96 96 96 – 95 22 x – 57 – – –Mali 64 87 51 22 35 14 – 89 85 72 71 56 72 72 89 38 x – 14 x 35 70 85Malta 100 100 100 100 100 100 – – 99 96 96 84 82 96 – – – – – – –Marshall Islands 94 92 99 75 83 53 2 99 99 94 95 97 97 92 – – – – – – –Mauritania 50 52 48 26 51 9 21 86 91 75 73 67 75 75 80 45 24 20 21 – 12Mauritius 99 100 99 89 91 88 100 99 99 98 98 99 98 98 95 – – – – – –Mexico 96 97 91 85 87 79 – 99 99 97 97 98 98 97 88 – – – – – –Micronesia(Federated States of) – – – – – – – 75 96 84 83 92 83 72 – – – – – – –Monaco 100 100 – 100 100 – – 89 99 99 99 99 99 99 – – – – – – –Mongolia 82 100 53 51 64 29 69 99 99 99 99 98 99 99 – 87 72 38 x – – –Montenegro 98 99 96 90 92 87 100 97 98 95 95 91 91 90 – 89 x 57 x 16 x – – –Morocco 83 98 61 70 83 52 – 99 99 99 98 95 98 99 89 70 – 23 x – – –Mozambique 47 77 29 18 38 5 20 91 90 76 73 82 76 76 83 65 22 55 30 18 28Myanmar 83 93 78 76 83 73 – 93 99 99 99 99 52 – 93 69 34 61 – 11 –Namibia 93 99 90 32 57 17 – 89 88 82 85 74 82 82 83 53 x – 63 20 34 54Nauru 88 88 – 65 65 – 100 99 99 99 99 99 99 99 – 69 47 – – – –Nepal 89 93 88 31 48 27 20 97 96 92 92 88 92 92 82 50 7 39 1 – –Netherlands 100 100 100 100 100 100 100 – 99 97 97 96 – 97 – – – – – – –Newbornsprotectedagainsttetanus lCareseekingforsuspectedpneumoniaAntibiotictreatmentforsuspectedTreatment<strong>with</strong> oralAntimalarialtreatmentamongfebrilechildren<strong>Children</strong>sleepingunderITNsHouseholds<strong>with</strong> atleastone ITNSTATISTICAL TABLES 109
TABLE 3CountriesHEALTHUse of improveddrinking watersources (%) 2010Use of improvedsanitation facilities(%) 2010RoutineEPIvaccinesfinancedby govt.Immunization coverage (%)2011Pneumonia (%)2007-2012*Diarrhoea(%)2007-2012*Malaria (%)2007-2012*and areas(%)rehydrationtotal urban rural total urban rural 2011 BCG DPT1 b DPT3 b Polio3 MCV HepB3 Hib3pneumonia salts (ORS)New Zealand 100 100 100 – – – 100 – 95 95 95 93 95 94 – – – – – – –Nicaragua 85 98 68 52 63 37 – 98 99 98 99 99 98 98 81 58 x – 59 2 x – –Niger 49 100 39 9 34 4 14 61 80 75 44 76 75 75 84 51 – 34 – 64 76Nigeria 58 74 43 31 35 27 – 64 53 47 73 71 50 – 60 45 23 26 49 29 42Niue 100 100 100 100 100 100 5 99 99 98 98 99 98 99 – – – – – – –Norway 100 100 100 100 100 100 100 – 99 94 94 93 – 95 – – – – – – –Oman 89 93 78 99 100 95 – 99 99 99 99 99 99 99 91 – – – – – –Pakistan 92 96 89 48 72 34 – 85 88 80 75 80 80 80 75 69 50 41 3 – 0Palau 85 83 96 100 100 100 0 – 99 84 98 85 91 85 – – – – – – –Panama – 97 – – – – – 97 95 87 91 97 87 87 – – – – – – –Papua New Guinea 40 87 33 45 71 41 45 83 83 61 58 60 62 61 61 63 x – – – – –Paraguay 86 99 66 71 90 40 – 94 97 90 87 93 90 90 85 – – – – – –Peru 85 91 65 71 81 37 – 91 94 91 91 96 91 91 85 68 51 32 – – –Philippines 92 93 92 74 79 69 – 84 85 80 80 79 76 14 76 50 42 47 0 x – –Poland – 100 – – 96 – – 93 99 99 96 98 98 99 – – – – – – –Portugal 99 99 100 100 100 100 100 96 99 98 97 96 97 97 – – – – – – –Qatar 100 100 100 100 100 100 – 97 94 93 93 99 93 93 – – – – – – –Republic of Korea 98 100 88 100 100 100 – 99 99 99 98 99 99 – – – – – – – –Republic of Moldova 96 99 93 85 89 82 – 98 96 93 96 91 96 78 – 60 x – 33 x – – –Romania – 99 – – – – 100 99 96 89 89 93 96 89 – – – – – – –Russian Federation 97 99 92 70 74 59 – 95 97 97 97 98 97 – – – – – – – –Rwanda 65 76 63 55 52 56 11 99 98 97 93 95 97 97 85 50 – 29 11 70 82Saint Kitts and Nevis 99 99 99 96 96 96 – 99 99 97 98 99 98 98 – – – – – – –Saint Lucia 96 98 95 65 71 63 – 97 98 97 97 95 97 97 – – – – – – –Saint Vincent andthe Grenadines – – – – – 96 – 99 98 95 95 99 96 96 – – – – – – –Samoa 96 96 96 98 98 98 100 99 99 91 91 67 91 91 – – – 68 – – –San Marino – – – – – – – – 90 86 86 83 86 85 – – – – – – –Sao Tome and Principe 89 89 88 26 30 19 15 99 98 96 96 91 96 96 – 75 – 49 8 56 61Saudi Arabia – 97 – – 100 – – 98 99 98 98 98 98 98 – – – – – – –Senegal 72 93 56 52 70 39 32 95 94 83 73 82 83 83 88 50 – 22 8 35 63Serbia 99 99 98 92 96 88 – 99 91 91 91 95 89 91 – 90 82 36 – – –Seychelles – 100 – – 98 – 100 99 99 99 99 99 99 99 – – – – – – –Sierra Leone 55 87 35 13 23 6 2 96 94 84 81 80 84 84 85 74 58 73 62 30 36Singapore 100 100 – 100 100 – – 99 98 96 96 95 96 – – – – – – – –Slovakia 100 100 100 100 100 99 100 97 99 99 99 98 99 99 – – – – – – –Slovenia 99 100 99 100 100 100 – – 98 96 96 95 – 96 – – – – – – –Solomon Islands – – – – 98 – 47 89 94 88 93 73 88 88 85 73 23 – 19 40 49Somalia 29 66 7 23 52 6 0 41 52 41 49 46 – – 64 13 x 32 x 13 x 8 x 11 x 12 xSouth Africa 91 99 79 79 86 67 100 78 77 72 73 78 76 72 77 65 x – 40 x – – –South Sudan s – – – – – – 0 57 58 46 46 64 – – 44 48 33 39 36 25 53Spain 100 100 100 100 100 100 – – 99 97 97 95 97 97 – – – – – – –Sri Lanka 91 99 90 92 88 93 39 99 99 99 99 99 99 99 95 58 – 50 0 3 5State of Palestine 85 86 81 92 92 92 – 98 99 99 99 99 98 – – 65 x – – – – –Sudan s – – – – – – 2 92 98 93 93 87 93 93 74 56 66 22 65 – 25Suriname 92 97 81 83 90 66 – – 90 86 86 85 86 86 93 74 x 37 x 44 x – 3 x –Swaziland 71 91 65 57 64 55 – 98 98 91 85 98 91 91 86 58 61 57 2 2 10Sweden 100 100 100 100 100 100 – 23 99 98 98 96 – 98 – – – – – – –Switzerland 100 100 100 100 100 100 0 – 95 95 95 92 – 95 – – – – – – –Syrian Arab Republic 90 93 86 95 96 93 – 90 86 72 75 80 66 72 94 77 x 71 x 50 x – – –Tajikistan 64 92 54 94 95 94 18 97 98 96 97 98 96 96 – 64 x 41 x 73 2 x 1 x 2 xThailand 96 97 95 96 95 96 100 99 99 99 99 98 98 – 91 84 x 65 x 57 x – – –The former YugoslavRepublic of Macedonia 100 100 99 88 92 82 – 98 95 95 95 98 90 89 – 93 x 74 x 62 – – –Timor-Leste 69 91 60 47 73 37 100 68 69 67 66 62 67 – 81 71 45 71 6 42 42Togo 61 89 40 13 26 3 25 90 95 81 81 67 81 81 81 32 41 11 34 57 57Tonga 100 100 100 96 98 96 100 99 99 99 99 99 99 99 – – – – – – –Trinidad and Tobago 94 98 93 92 92 92 – – 96 90 91 92 90 90 – 74 x 34 x – – – –Tunisia – 99 – – 96 – – 98 98 98 98 96 98 43 96 59 x – 55 x – – –Turkey 100 100 99 90 97 75 – 97 98 97 97 97 96 97 90 41 x – – – – –Turkmenistan – 97 – 98 99 97 – 98 98 97 97 99 97 71 – 83 x 50 x 40 x – – –Tuvalu 98 98 97 85 88 81 – 99 99 96 96 98 96 96 – – – – – – –Uganda 72 95 68 34 34 34 19 86 91 82 82 75 82 82 85 79 47 44 65 43 60Ukraine 98 98 98 94 96 89 – 90 73 50 58 67 21 26 – – – – – – –United Arab Emirates 100 100 100 98 98 95 – 98 94 94 94 94 94 94 – – – – – – –Newbornsprotectedagainsttetanus lCareseekingforsuspectedpneumoniaAntibiotictreatmentforsuspectedTreatment<strong>with</strong> oralAntimalarialtreatmentamongfebrilechildren<strong>Children</strong>sleepingunderITNsHouseholds<strong>with</strong> atleastone ITN110THE STATE OF THE WORLD’S CHILDREN 2013: <strong>Children</strong> <strong>with</strong> <strong>Disabilities</strong>
CountriesUse of improveddrinking watersources (%) 2010Use of improvedsanitation facilities(%) 2010RoutineEPIvaccinesfinancedby govt.Immunization coverage (%)2011Pneumonia (%)2007-2012*Diarrhoea(%)2007-2012*Malaria (%)2007-2012*and areas(%)rehydrationtotal urban rural total urban rural 2011 BCG DPT1 b DPT3 b Polio3 MCV HepB3 Hib3pneumonia salts (ORS)United Kingdom 100 100 100 100 100 100 – – 98 95 95 90 – 95 – – – – – – –United Republicof Tanzania 53 79 44 10 20 7 23 99 96 90 88 93 90 90 88 71 – 44 59 64 64United States 99 100 94 100 100 99 – – 98 94 94 90 91 88 – – – – – – –Uruguay 100 100 100 100 100 99 – 99 99 95 95 95 95 95 – – – – – – –Uzbekistan 87 98 81 100 100 100 – 99 99 99 99 99 99 99 – 68 x 56 x 28 x _ – –Vanuatu 90 98 87 57 64 54 16 81 78 68 67 52 59 – 75 – – 23 53 56 68Venezuela (BolivarianRepublic of) – – – – – – – 95 90 78 78 86 78 78 50 72 x – 38 x – – –Viet Nam 95 99 93 76 94 68 30 98 97 95 96 96 95 95 87 73 68 47 1 9 10Yemen 55 72 47 53 93 34 13 59 89 81 81 71 81 81 66 44 x 38 x 33 x – – –Zambia 61 87 46 48 57 43 19 88 87 81 83 83 81 81 81 68 47 60 34 50 64Zimbabwe 80 98 69 40 52 32 – 98 99 99 99 92 93 93 66 48 31 21 2 10 29MEMORANDUMSudan and South Sudan s 58 † 67 † 52 † 26 † 44 † 14 † – – – – – – – – – – – – – – –Newbornsprotectedagainsttetanus lCareseekingforsuspectedpneumoniaAntibiotictreatmentforsuspectedTreatment<strong>with</strong> oralTABLE 3Antimalarialtreatmentamongfebrilechildren<strong>Children</strong>sleepingunderITNsHEALTHHouseholds<strong>with</strong> atleastone ITNSUMMARY INDICATORS #Sub-Saharan Africa 61 83 49 30 43 23 27 79 79 71 76 74 70 60 76 49 34 32 38 38 50Eastern andSouthern Africa 61 87 50 35 54 27 39 85 85 79 79 79 76 76 81 55 30 39 31 41 54West and Central Africa 62 82 47 26 35 20 17 73 71 62 72 69 63 44 72 44 33 27 42 36 49Middle East andNorth Africa 86 93 76 82 91 70 75 93 96 92 92 90 91 48 85 – – – – – –South Asia 90 96 88 38 60 28 90 87 85 75 73 77 57 23 85 65 24 34 7 – –East Asia and Pacific 90 97 84 67 77 58 95 95 95 91 92 95 89 10 85 ** 64 ** – 43 ** – 6 ** –Latin Americaand Caribbean 94 98 81 79 84 60 – 95 96 92 92 93 90 90 85 – – – – – –CEE/CIS 96 99 91 85 87 80 – 96 95 92 93 94 89 58 – – – – – – –Least developed countries 63 82 56 35 48 30 19 82 87 78 79 76 75 74 81 50 43 42 36 41 53World 89 96 81 63 79 47 84 88 89 83 84 84 75 43 82 ** 60 ** 31 ** 35 ** 19 ** – –s Due to the cession in July 2011 of the Republic of South Sudan by the Republic of the Sudan, and its subsequent admission to the United Nations on 14 July 2011, disaggregated data for the Sudan and South Sudan as separateStates are not yet available for all indicators. Aggregated data presented are for the Sudan pre-cession (see Memorandum item).# For a complete list of countries and areas in the regions, subregions and country categories, see page 98.DEFINITIONS OF THE INDICATORSUse of improved drinking water sources – Percentage of the population using any of the following as themain drinking water source: drinking water supply piped into dwelling, plot, yard or neighbour’s yard; public tap orstandpipe; tube well or borehole; protected dug well; protected spring; rainwater; bottled water plus one of theprevious sources as a secondary source.Use of improved sanitation facilities – Percentage of the population using any of the following sanitation facilities,not shared <strong>with</strong> other households: flush or pour-flush latrine connected to a piped sewerage system, septic tank or pitlatrine; ventilated improved pit latrine; pit latrine <strong>with</strong> a slab; covered pit; composting toilet.Routine EPI vaccines financed by government – Percentage of EPI vaccines that are routinely administered ina country to protect children and are financed by the national government (including loans).EPI – Expanded programme on immunization: The immunizations in this programme include those againsttuberculosis (TB); diphtheria, pertussis (whooping cough) and tetanus (DPT); polio; and measles, as well asvaccination of pregnant women to protect babies against neonatal tetanus. Other vaccines, e.g., against hepatitis B(HepB), Haemophilus influenzae type b (Hib) or yellow fever, may be included in the programme in some countries.BCG – Percentage of live births who received bacille Calmette-Guérin (vaccine against tuberculosis).DPT1 – Percentage of surviving infants who received their first dose of diphtheria, pertussis and tetanus vaccine.DPT3 – Percentage of surviving infants who received three doses of diphtheria, pertussis and tetanus vaccine.Polio3 – Percentage of surviving infants who received three doses of the polio vaccine.MCV – Percentage of surviving infants who received the first dose of the measles-containing vaccine.HepB3 – Percentage of surviving infants who received three doses of hepatitis B vaccine.Hib3 – Percentage of surviving infants who received three doses of Haemophilus influenzae type b vaccine.Newborns protected against tetanus – Percentage of newborns protected at birth against tetanus.Care-seeking for suspected pneumonia – Percentage of children under age 5 <strong>with</strong> suspected pneumonia(cough and fast or difficult breathing due to a problem in the chest) in the two weeks preceding the survey and whowere taken to an appropriate health-care provider.Antibiotic treatment for suspected pneumonia – Percentage of children under age 5 <strong>with</strong> suspectedpneumonia (cough and fast or difficult breathing due to a problem in the chest) in the two weeks preceding thesurvey who received antibiotics.Diarrhoea treatment <strong>with</strong> oral rehydration salts (ORS) – Percentage of children under age 5 who haddiarrhoea in the two weeks preceding the survey and who received oral rehydration salts (ORS packets orpre-packaged ORS fluids).Antimalarial treatment among febrile children – Percentage of children under age 5 who were ill <strong>with</strong> fever inthe two weeks preceding the survey and received any antimalarial medicine. NB: This indicator refers to antimalarialtreatment among all febrile children, rather than among confirmed malaria cases, and thus should be interpreted<strong>with</strong> caution. For more information, please refer to http://www.childinfo.org/malaria_maltreatment.php.<strong>Children</strong> sleeping under ITNs – Percentage of children under age 5 who slept under an insecticide-treatedmosquito net the night prior to the survey.Households <strong>with</strong> at least one ITN – Percentage of households <strong>with</strong> at least one insecticide-treated mosquito net.MAIN DATA SOURCESUse of improved drinking water sources and improved sanitation facilities – UNICEF andWorld Health Organization (WHO), Joint Monitoring Programme.Routine EPI vaccines financed by government – As reported by governments on UNICEF andWHO Joint Reporting Form.Immunization – UNICEF and WHO.Suspected pneumonia care-seeking and treatment – Demographic and Health Surveys (DHS),Multiple Indicator Cluster Surveys (MICS) and other national household surveys.Diarrhoea treatment – DHS, MICS and other national household surveys.Malaria prevention and treatment – DHS, MICS, Malaria Indicator Surveys (MIS) and othernational household surveys.NOTES– Data not available.x Data refer to years or periods other than those specified in the column heading. Such data are notincluded in the calculation of regional and global averages, <strong>with</strong> the exception of 2005–2006 datafrom India. Estimates from data years prior to 2000 are not displayed.b Coverage for DPT1 should be at least as high as DPT3. Discrepancies where DPT1 coverage is lessthan DPT3 reflect deficiencies in the data collection and reporting process. UNICEF and WHO areworking <strong>with</strong> national and territorial systems to eliminate these discrepancies.l WHO and UNICEF have employed a model to calculate the percentage of births that can beconsidered as protected against tetanus because pregnant women were given two doses ormore of tetanus toxoid (TT) vaccine. The model aims to improve the accuracy of this indicator bycapturing or including other potential scenarios where women might be protected (e.g., womenwho receive doses of TT in supplemental immunization activities). A fuller explanation of themethodology can be found at .† The WHO/UNICEF Joint Monitoring Programme for Water Supply and Sanitation (JMP) closed itsdatabases for these estimates before the cession of the Republic of South Sudan by the Republicof the Sudan. Aggregated data presented are for the Sudan pre-cession. Disaggregated data forthe Sudan and South Sudan as separate States will be published by the JMP in 2013.* Data refer to the most recent year available during the period specified in the column heading.** Excludes China.STATISTICAL TABLES 111
TABLE 4: HIV/AIdSPrevention among young people (aged 15–24)OrphansCountriesand areasAfghanistan
TABLE 4HIV/AIdSPrevention among young people (aged 15–24)OrphansCountriesand areasAdult HIVprevalence(%)2011People of all ages living <strong>with</strong> HIV(thousands) 2011Womenliving<strong>with</strong> HIV(thousands)2011<strong>Children</strong>living<strong>with</strong> HIV(thousands)Comprehensiveknowledge of HIV (%)2007–2011*Condom use amongyoung people <strong>with</strong>multiple partners (%)2007–2011*HIV prevalence among youngpeople (%) 2011(thousands) (thousands) ratio (%)estimate low high 2011 total male female male female male female 2011 2011 2007–2011*France 0.4 160 130 200 46 – 0.1 0.2 0.1 – – – – – – –Gabon 5.0 46 34 67 24 3 2.1 1.2 3.0 – – – – 21 64 –Gambia 1.5 14 7 28 8 – 0.8 0.4 1.2 – 33 – 49 p – – 103Georgia 0.2 5 2 8 1 – 0.2 0.2 0.1 – – – – – – –Germany 0.1 73 66 82 11 – 0.1 0.1
TABLE 4HIV/AIdSPrevention among young people (aged 15–24)OrphansCountriesand areasAdult HIVprevalence(%)2011People of all ages living <strong>with</strong> HIV(thousands) 2011Womenliving<strong>with</strong> HIV(thousands)2011<strong>Children</strong>living<strong>with</strong> HIV(thousands)Comprehensiveknowledge of HIV (%)2007–2011*Condom use amongyoung people <strong>with</strong>multiple partners (%)2007–2011*HIV prevalence among youngpeople (%) 2011(thousands) (thousands) ratio (%)estimate low high 2011 total male female male female male female 2011 2011 2007–2011*New Zealand 0.1 3 2 3
TABLE 4HIV/AIdSPrevention among young people (aged 15–24)OrphansCountriesand areasAdult HIVprevalence(%)2011People of all ages living <strong>with</strong> HIV(thousands) 2011Womenliving<strong>with</strong> HIV(thousands)2011<strong>Children</strong>living<strong>with</strong> HIV(thousands)Comprehensiveknowledge of HIV (%)2007–2011*Condom use amongyoung people <strong>with</strong>multiple partners (%)2007–2011*<strong>Children</strong>orphanedby AIDS<strong>Children</strong>orphaneddue to allcausesHIV prevalence among youngpeople (%) 2011(thousands) (thousands) ratio (%)estimate low high 2011 total male female male female male female 2011 2011 2007–2011*Ukraine 0.8 230 180 310 94 – 0.1 0.1 0.1 43 45 64 63 – – –United Arab Emirates – – – – – – – – – – – – – – – –United Kingdom 0.3 94 74 120 29 – 0.1 0.1 0.1 – – – – – – –United Republicof Tanzania 5.8 1,600 1,500 1,700 760 230 2.9 1.8 4.0 43 48 36 32 1,300 3,000 90United States 0.6 1,300 1,000 2,000 300 – 0.2 0.3 0.2 – – – – – – –Uruguay 0.6 12 6 33 4 – 0.3 0.4 0.2 – – – – – – –Uzbekistan – – – – – – – – – – 31 x – – – – –Vanuatu – – – – – – – – – – 15 – – – – 92Venezuela (BolivarianRepublic of) 0.5 99 51 230 25 – 0.2 0.4 0.1 – – – – – – –Viet Nam 0.5 250 200 330 48 – 0.2 0.3 0.2 – 51 – – – – –Yemen 0.2 22 19 25 9 – 0.1 0.1 0.1 – 2 x,y – – – – –Zambia 12.5 970 900 1,100 460 170 5.0 3.1 7.0 41 38 43 42 p 680 1,200 92Zimbabwe 14.9 1,200 1,200 1,300 600 200 5.6 3.6 7.6 47 52 51 39 p 1,000 1,300 95MEMORANDUMSudan and South Sudan s – – – – – – – – – – – – – – – –OrphanschoolattendanceSUMMARY INDICATORS #Sub-Saharan Africa 4.8 23,500 22,100 24,900 11,800 3,100 2.2 1.3 3.0 36 28 49 30 15,200 53,600 95Eastern and SouthernAfrica 7.0 17,200 16,300 17,800 8,700 2,200 3.1 1.9 4.3 40 36 44 30 10,700 27,200 89West and Central Africa 2.6 6,300 5,700 6,800 3,200 850 1.3 0.7 1.8 33 21 56 30 4,500 26,300 100Middle East and NorthAfrica 0.1 260 220 320 74 32 0.1 0.1 0.1 – – – – 160 6,000 –South Asia 0.2 2,500 1,600 3,400 890 110 0.1 0.1 0.1 34 17 33 17 600 42,900 72East Asia and Pacific 0.2 2,400 2,100 2,700 720 64 0.1 0.1 0.1 – 23 ** – – 510 28,700 –Latin America andCaribbean 0.4 1,600 1,300 1,900 540 58 0.2 0.2 0.2 – – – – 600 9,500 –CEE/CIS 0.6 1,500 1,100 1,800 410 18 0.1 0.1 0.1 – – – – 170 6,500 –Least developed countries 1.9 10,300 9,600 10,900 5,000 1,600 0.9 0.6 1.3 30 24 – – 7,800 43,200 88World 0.8 34,000 31,400 35,900 15,000 3,400 0.4 0.3 0.5 – 21 ** – – 17,300 151,000 –s Due to the cession in July 2011 of the Republic of South Sudan by the Republic of the Sudan, and its subsequent admission to the United Nations on 14 July 2011, disaggregated data for the Sudanand South Sudan as separate States are not yet available for all indicators. Aggregated data presented are for the Sudan pre-cession (see Memorandum item).# For a complete list of countries and areas in the regions, subregions and country categories, see page 98.DEFINITIONS OF THE INDICATORSAdult HIV prevalence – Estimated percentage of adults (aged 15–49) living <strong>with</strong>HIV as of 2011.People living <strong>with</strong> HIV – Estimated number of people (all ages) living <strong>with</strong> HIV asof 2011.Women living <strong>with</strong> HIV – Estimated number of women (aged 15+) living <strong>with</strong> HIVas of 2011.<strong>Children</strong> living <strong>with</strong> HIV – Estimated number of children (aged 0–14) living <strong>with</strong>HIV as of 2011.HIV prevalence among young people – Estimated percentage of young men andwomen (aged 15–24) living <strong>with</strong> HIV as of 2011.Comprehensive knowledge of HIV – Percentage of young men and women(aged 15–24) who correctly identify the two major ways of preventing the sexualtransmission of HIV (using condoms and limiting sex to one faithful, uninfectedpartner), who reject the two most common local misconceptions about HIVtransmission and who know that a healthy-looking person can be HIV-positive.Condom use among young people <strong>with</strong> multiple partners – Among youngpeople (aged 15–24) who reported having had more than one sexual partner in thepast 12 months, the percentage who reported using a condom the last time they hadsex <strong>with</strong> any partner.<strong>Children</strong> orphaned by AIDS – Estimated number of children (aged 0–17) who havelost one or both parents to AIDS as of 2011.<strong>Children</strong> orphaned due to all causes – Estimated number of children (aged 0–17)who have lost one or both parents to any cause as of 2011.Orphan school attendance ratio – Percentage of children (aged 10–14) whohave lost both biological parents and who are currently attending school as apercentage of non-orphaned children of the same age who live <strong>with</strong> at least oneparent and who are attending school.MAIN DATA SOURCESEstimated adult HIV prevalence – UNAIDS, Report on the Global AIDS Epidemic, 2012.Estimated number of people living <strong>with</strong> HIV – UNAIDS, Report on the Global AIDS Epidemic, 2012.Estimated number of women living <strong>with</strong> HIV – UNAIDS, Report on the Global AIDS Epidemic, 2012.Estimated number of children living <strong>with</strong> HIV – UNAIDS, Report on the Global AIDS Epidemic, 2012.HIV prevalence among young people – UNAIDS, Report on the Global AIDS Epidemic, 2012.Comprehensive knowledge of HIV – AIDS Indicator Surveys (AIS), Demographic and Health Surveys(DHS), Multiple Indicator Cluster Surveys (MICS) and other national household surveys; HIV/AIDS SurveyIndicators Database, .Condom use among young people <strong>with</strong> multiple partners – AIS, DHS, MICS and other nationalhousehold surveys; HIV/AIDS Survey Indicators Database, .<strong>Children</strong> orphaned by AIDS – UNAIDS, Report on the Global AIDS Epidemic, 2012.<strong>Children</strong> orphaned by all causes – UNAIDS, Report on the Global AIDS Epidemic, 2012.Orphan school attendance ratio – AIS, DHS, MICS and other national household surveys; HIV/AIDSSurvey Indicators Database, .NOTES– Data not available.x Data refer to years or periods other than those specified in the column heading. Such data are notincluded in the calculation of regional and global averages, <strong>with</strong> the exception of 2005–2006 data fromIndia. Estimates from data years prior to 2000 are not displayed.y Data differ from the standard definition or refer to only part of a country. If they fall <strong>with</strong>in the notedreference period, such data are included in the calculation of regional and global averages.p Based on small denominators (typically 25–49 unweighted cases).* Data refer to the most recent year available during the period specified in the column heading.** Excludes China.STATISTICAL TABLES 115
TABLE 5: EduCATIONCountriesand areasYouth (15–24 years)literacy rate (%)2007–2011*malefemaleNumber per 100population2011mobilephonesPre-primary schoolparticipation Primary school participation Secondary school participationGross enrolmentratio (%)2008–2011*Gross enrolmentratio (%)2008–2011*Net enrolmentratio (%)2008–2011*Net attendanceratio (%)2007–2011*Internetusers male female male female male female male femaleSurvival rate to lastprimary grade (%)2008–2011*2007–2011*Net enrolmentratio (%)2008–2011*Net attendanceratio (%)2007–2011*Afghanistan – – 54 5 – – 114 79 – – 66 x 40 x – 90 x – – 18 x 6 xAlbania 99 99 96 49 56 55 87 87 80 80 90 91 95 100 – – 84 82Algeria 94 x 89 x 99 14 79 76 113 107 98 96 97 x 96 x 95 93 x – – 57 x 65 xAndorra – – 75 81 104 99 84 85 78 79 – – – – 74 75 – –Angola 80 66 48 15 103 105 137 112 93 78 77 75 32 83 x 12 11 21 17Antigua and Barbuda – – 182 82 76 76 106 97 91 84 – – – – 85 85 – –Argentina 99 99 135 48 73 75 118 117 – – – – 94 – 78 87 – –Armenia 100 100 104 – 29 34 101 104 – – 99 x 98 x – 100 x 85 88 93 x 95 xAustralia – – 108 79 79 78 105 105 97 98 – – – – 85 86 – –Austria – – 155 80 100 100 100 99 – – – – 97 – – – – –Azerbaijan 100 100 109 50 26 25 94 93 85 84 74 x 72 x 96 100 x – – 83 82Bahamas – – 86 65 – – 113 115 – – – – 89 – 82 88 – –Bahrain 100 100 128 77 – – – – – – 86 x 87 x – 99 x – – 77 x 85 xBangladesh 75 78 56 5 14 13 – – – – 85 y 88 y 66 94 x 45 50 – –Barbados – – 127 72 108 108 119 122 – – – – – – 81 88 – –Belarus 100 100 112 40 100 98 100 100 – – 93 x 94 x 100 100 x – – 95 x 97 xBelgium – – 117 78 118 118 105 104 99 99 – – 93 – – – – –Belize – – 64 – 45 47 127 116 – – 95 x 95 x 90 98 x – – 58 x 60 xBenin 66 45 85 4 18 19 135 117 – – 65 x 58 x – 89 x – – 34 x 23 xBhutan 80 x 68 x 66 21 2 2 110 112 88 91 91 93 91 94 50 54 54 56Bolivia (PlurinationalState of) 100 99 83 30 45 45 105 104 – – 97 97 – 96 68 69 78 75Bosnia and Herzegovina 100 100 85 60 17 17 111 113 86 88 97 x 98 x 99 100 x – – 89 x 89 xBotswana 94 97 143 7 19 19 112 108 87 88 86 88 93 – 57 65 36 x 44 xBrazil 97 99 123 45 – – – – – – 95 x 95 x – 88 x – – 74 x 80 xBrunei Darussalam 100 100 109 56 88 88 107 109 – – – – 96 – 95 99 – –Bulgaria 98 98 141 51 80 79 103 102 99 100 – – 97 – 84 82 – –Burkina Faso 47 33 45 3 3 3 79 72 61 56 49 x 44 x 64 89 x 18 14 17 x 15 xBurundi 78 78 14 1 9 9 157 155 – – 73 74 56 82 x 18 15 7 7Cambodia 88 86 70 3 13 13 130 124 96 95 85 y 85 y – 92 x – – 45 y 44 yCameroon 89 77 52 5 28 29 129 111 – – 82 x 77 x 66 87 x – – 39 x 37 xCanada – – 75 83 71 71 99 98 – – – – – – – – – –Cape Verde 97 99 79 32 70 70 114 105 95 92 – – – – 61 71 – –Central African Republic 72 58 25 2 6 6 109 78 81 61 56 x 47 x 46 62 x 18 10 12 x 9 xChad 53 41 32 2 2 2 107 78 – – 56 48 28 94 x – – 20 12Chile 99 99 130 54 55 58 108 103 94 94 – – – – 81 84 – –China 99 99 73 38 54 54 110 113 100 z 100 z – – 99 z – – – – –Colombia 98 99 98 40 49 49 116 114 92 91 90 92 85 95 72 77 73 79Comoros 86 85 29 6 22 21 109 100 – – 31 x 31 x – 19 x – – 10 x 11 xCongo 87 x 78 x 94 6 12 13 118 112 92 89 86 x 87 x – 93 x – – 39 x 40 xCook Islands – – – – 166 149 107 110 98 99 – – – – 76 82 – –Costa Rica 98 99 92 42 71 72 110 109 – – 96 96 89 – – – 59 x 65 xCôte d’Ivoire 72 62 86 2 4 4 96 80 67 56 59 x 51 x 61 90 x – – 32 x 22 xCroatia 100 100 116 71 62 61 93 93 95 97 – – 99 – 88 94 – –Cuba 100 100 12 23 100 100 104 102 100 100 – – 95 – 86 85 – –Cyprus 100 100 98 58 81 81 106 105 99 99 – – – – 96 96 – –Czech Republic – – 122 73 107 105 106 106 – – – – 100 – – – – –Democratic People’sRepublic of Korea 100 100 4 – – – – – – – 99 99 – – – – 98 98Democratic Republicof the Congo 68 62 23 1 3 3 100 87 – – 78 72 55 75 – – 35 28Denmark – – 126 90 97 96 99 99 95 97 – – 99 – 88 91 – –Djibouti – – 21 7 4 4 62 56 47 42 67 x 66 x 64 92 x 28 20 45 x 37 xDominica – – 164 51 111 114 113 111 – – – – 88 – – – – –Dominican Republic 96 98 87 36 38 38 115 102 96 90 95 96 – 78 58 67 56 68Ecuador 98 99 105 31 109 115 114 115 – – 92 y 93 y – – – – 71 y 73 yEgypt 91 84 101 36 24 23 103 98 – – 90 87 – 99 71 69 70 70El Salvador 96 96 126 18 63 65 117 111 95 95 – – 86 – 57 59 – –Equatorial Guinea 98 98 59 – 47 63 88 85 57 56 61 x 60 x 62 – – – 23 x 22 xEritrea 92 87 4 6 14 13 48 41 37 33 69 x 64 x 69 – 32 25 23 x 21 xEstonia 100 100 139 77 96 96 100 98 96 96 – – 98 – 91 93 – –Ethiopia 63 47 17 1 5 5 106 97 85 80 64 65 47 84 x – – 16 16Fiji – – 84 28 17 19 106 104 99 99 – – 91 – – – – –Finland – – 166 89 68 68 99 99 98 98 – – 100 – 94 94 – –admin.datasurveydata male female male female116THE STATE OF THE WORLD’S CHILDREN 2013: <strong>Children</strong> <strong>with</strong> <strong>Disabilities</strong>
TABLE 5educationCountriesand areasYouth (15–24 years)literacy rate (%)2007–2011*malefemaleNumber per 100population2011mobilephonesPre-primary schoolparticipation Primary school participation Secondary school participationGross enrolmentratio (%)2008–2011*Gross enrolmentratio (%)2008–2011*Net enrolmentratio (%)2008–2011*Net attendanceratio (%)2007–2011*Internetusers male female male female male female male femaleSurvival rate to lastprimary grade (%)2008–2011*2007–2011*Net enrolmentratio (%)2008–2011*Net attendanceratio (%)2007–2011*France – – 105 80 109 108 111 109 99 99 – – – – 98 99 – –Gabon 99 97 117 8 41 43 184 179 – – 94 x 94 x – – – – 34 x 36 xGambia 72 62 89 11 30 31 82 84 68 70 40 45 61 93 – – 34 34Georgia 100 100 102 37 52 64 107 111 – – 95 96 96 98 x – – 85 x 88 xGermany – – 132 83 114 113 103 102 – – – – 96 – – – – –Ghana 82 80 85 14 68 70 107 107 84 85 72 74 72 81 51 47 40 44Greece 99 99 106 53 – – – – – – – – – – – – – –Grenada – – – – 95 102 103 103 96 99 – – – – 95 86 – –Guatemala 89 85 140 12 70 72 119 114 100 98 – – – – 43 40 23 x 24 xGuinea 70 57 44 1 14 14 103 86 83 70 55 x 48 x 66 96 x 36 22 27 x 17 xGuinea-Bissau 79 65 26 3 7 7 127 119 77 73 69 65 – 79 – – 27 20Guyana – – 69 32 74 78 83 86 82 86 94 96 83 100 78 83 70 79Haiti 74 70 41 – – – – – – – 48 x 52 x – 85 x – – 18 x 21 xHoly See – – – – – – – – – – – – – – – – – –Honduras 94 96 104 16 43 44 116 116 95 97 87 x 90 x – – – – 35 x 43 xHungary 99 99 117 59 85 84 102 101 98 98 – – 98 – 91 91 – –Iceland – – 106 95 97 97 99 100 99 100 – – – – 87 89 – –India 88 74 72 10 54 56 116 116 99 98 85 x 81 x – 95 x – – 59 x 49 xIndonesia 100 99 98 18 43 44 117 119 – – 98 98 – – 68 67 57 y 59 yIran (Islamic Republic of) 99 99 75 21 41 44 114 115 – – 94 x 91 x 94 – 92 80 – –Iraq 85 81 78 5 – – – – – – 91 x 80 x – 93 x – – 46 x 34 xIreland – – 108 77 99 97 108 108 99 100 – – – – 98 100 – –Israel – – 122 70 103 109 103 103 97 97 – – 99 – 97 100 – –Italy 100 100 152 57 100 96 102 101 100 99 – – 100 – 94 94 – –Jamaica 93 98 108 32 113 113 91 87 83 81 97 x 98 x 95 99 x 80 87 89 x 93 xJapan – – 103 80 – – 103 103 – – – – 100 – 99 100 – –Jordan 99 99 118 35 33 31 92 92 91 91 99 99 – – 83 88 85 89Kazakhstan 100 100 143 45 48 47 111 111 – – 99 x 98 x 100 100 x 89 88 95 x 95 xKenya 92 94 65 28 52 52 115 112 84 85 72 75 – 96 52 48 40 42Kiribati – – 14 10 – – 111 115 – – – – – – – – 55 y 63 yKuwait 99 99 – 74 81 83 104 107 97 100 – – 96 – 86 93 – –Kyrgyzstan 100 100 105 20 19 19 100 99 95 95 91 x 93 x 98 99 x 79 79 88 x 91 xLao People’s DemocraticRepublic 89 x 79 x 87 9 22 22 131 122 98 95 81 x 77 x – 65 x 42 38 39 x 32 xLatvia 100 100 103 72 85 82 101 100 95 97 – – 95 – 83 84 – –Lebanon 98 99 79 52 82 81 106 103 94 93 98 98 92 93 x 71 79 77 85Lesotho 86 98 48 4 – – 104 102 72 75 87 91 69 84 x 23 37 26 40Liberia 71 82 49 3 – – 101 91 – – 32 28 – – – – 14 14Libya 100 100 156 17 – – – – – – – – – – – – – –Liechtenstein – – 102 85 102 105 109 102 100 98 – – 79 – 64 64 – –Lithuania 100 100 151 65 75 73 96 95 96 96 – – 98 – 91 91 – –Luxembourg – – 148 91 87 86 99 100 96 98 – – – – 84 86 – –Madagascar 66 64 38 2 9 9 150 147 – – 78 80 35 89 23 24 27 28Malawi 87 87 25 3 – – 133 138 – – 76 x 79 x 53 81 x 28 27 19 20Malaysia 98 98 127 61 64 69 – – – – – – 98 – 65 71 – –Maldives 99 99 166 34 113 115 111 107 97 97 82 84 – 99 – – 52 63Mali 56 34 68 2 3 3 86 75 71 61 62 55 75 96 x 35 24 38 24Malta 97 99 125 69 119 115 101 101 93 94 – – 80 – 82 80 – –Marshall Islands – – – – 45 47 102 101 – – – – 83 – – – – –Mauritania 71 65 93 5 – – 99 105 73 76 56 59 71 77 – – 21 17Mauritius 96 98 99 35 97 96 99 100 92 94 – – 98 – – – – –Mexico 98 98 82 36 101 102 115 113 99 100 97 x 97 x 94 – 70 73 – –Micronesia(Federated States of) – – – – – – – – – – – – – – – – – –Monaco – – 86 – – – – – – – – – – – – – – –Mongolia 94 97 105 20 76 79 123 121 100 99 95 97 94 99 – – 91 95Montenegro 99 99 – 40 32 30 107 106 – – 97 x 98 x – 97 x – – 90 x 92 xMorocco 87 72 113 51 65 50 115 108 95 93 91 x 88 x 91 – – – 39 x 36 xMozambique 79 65 33 4 – – 121 109 95 89 82 80 27 60 17 15 21 20Myanmar 96 96 3 1 10 10 126 126 – – 90 91 75 93 49 52 52 y 53 yNamibia 91 95 105 12 – – 108 107 84 89 91 93 83 89 x – – 47 62Nauru – – 65 – 96 93 90 96 – – – – – – – – 52 y 69 yNepal 88 78 44 9 – – – – – – 67 y 70 y – 95 x – – 46 x 38 xNetherlands – – – 92 93 93 108 107 – – – – – – 87 88 – –admin.datasurveydata male female male femaleSTATISTICAL TABLES 117
TABLE 5EduCATIONCountriesand areasYouth (15–24 years)literacy rate (%)2007–2011*malefemaleNumber per 100population2011mobilephonesPre-primary schoolparticipation Primary school participation Secondary school participationGross enrolmentratio (%)2008–2011*Gross enrolmentratio (%)2008–2011*Net enrolmentratio (%)2008–2011*Net attendanceratio (%)2007–2011*Internetusers male female male female male female male femaleSurvival rate to lastprimary grade (%)2008–2011*2007–2011*Net enrolmentratio (%)2008–2011*Net attendanceratio (%)2007–2011*New Zealand – – 109 86 91 95 101 101 99 100 – – – – 94 95 – –Nicaragua 85 x 89 x 82 11 55 56 119 116 93 95 71 y 70 y – 56 x 43 49 35 x 47 xNiger 52 x 23 x 27 1 4 4 73 60 64 52 44 x 31 x 69 88 x 13 8 13 x 8 xNigeria 78 66 59 28 14 14 87 79 60 55 65 60 80 98 – – 45 43Niue – – – – – – – – – – – – – – – – – –Norway – – 117 94 100 98 99 99 99 99 – – 99 – 94 94 – –Oman 98 98 169 68 45 45 107 104 100 97 – – – – 89 90 – –Pakistan 79 61 62 9 – – 104 85 81 67 70 62 62 – 38 29 35 29Palau – – 75 – – – – – – – – – – – – – – –Panama 98 97 204 43 67 67 109 106 99 98 – – 94 – 66 72 – –Papua New Guinea 65 72 34 2 101 99 63 57 – – – – – – – – – –Paraguay 99 99 99 24 35 35 101 98 86 86 87 89 78 – 58 62 81 x 80 xPeru 98 97 110 37 79 79 108 108 98 98 96 96 90 95 77 78 81 y 82 yPhilippines 97 98 92 29 51 52 107 105 88 90 88 x 89 x 76 90 x 56 67 55 x 70 xPoland 100 100 128 65 65 66 98 97 96 96 – – 98 – 90 92 – –Portugal 100 100 115 55 82 82 116 112 99 100 – – – – – – – –Qatar 96 98 123 86 57 54 103 103 96 97 – – – – 76 93 – –Republic of Korea – – 109 84 118 119 106 105 99 98 – – 99 – 96 95 – –Republic of Moldova 99 100 105 38 76 75 94 93 90 90 84 x 85 x 95 100 x 78 79 82 x 85 xRomania 97 97 109 44 79 79 96 95 88 87 – – 97 – 82 83 – –Russian Federation 100 100 179 49 91 89 99 99 95 96 – – 96 – – – – –Rwanda 77 78 41 7 10 11 141 144 – – 86 89 – 76 x – – 15 16Saint Kitts and Nevis – – – – 92 88 93 94 86 86 – – 74 – 89 88 – –Saint Lucia – – 123 42 62 59 96 92 90 89 – – 92 – 85 85 – –Saint Vincentand the Grenadines – – 121 43 79 80 109 101 – – – – – – 85 96 – –Samoa 99 100 – – 35 41 107 109 93 97 88 y 89 y – – 73 83 51 y 70 ySan Marino – – 112 50 96 89 89 101 91 93 – – – – – – – –Sao Tome and Principe 95 96 68 20 44 48 131 130 – – 86 85 68 84 44 52 30 31Saudi Arabia 99 97 191 48 – – 106 106 90 89 – – – – 78 83 – –Senegal 74 56 73 18 12 14 84 89 76 80 60 63 60 93 x – – 35 32Serbia 99 99 125 42 53 53 96 96 95 94 98 99 99 99 89 91 88 90Seychelles 99 99 146 43 106 97 117 117 – – – – – – – – – –Sierra Leone 69 50 36 – 7 7 129 120 – – 73 76 – 93 – – 40 33Singapore 100 100 149 75 – – – – – – – – 99 – – – – –Slovakia – – 109 74 92 89 102 102 – – – – 98 – – – – –Slovenia 100 100 107 72 87 85 98 97 97 97 – – 100 – 91 92 – –Solomon Islands – – 50 6 49 50 – – – – 63 y 69 y – – – – 29 y 30 ySomalia – – 7 1 – – – – – – 18 x 15 x – 85 x – – 12 x 8 xSouth Africa 97 98 127 21 65 65 104 100 90 91 80 x 83 x – – – – 41 x 48 xSouth Sudan s – – – – – – – – – – 32 25 – 65 – – 8 4Spain 100 100 114 68 126 127 106 105 100 100 – – 99 – 94 96 – –Sri Lanka 98 99 87 15 – – 99 99 94 94 – – – – – – – –State of Palestine 99 99 – 55 40 39 92 90 90 88 91 x 92 x – – 81 87 – –Sudan s – – – – – – – – – – 78 72 – 82 – – 33 30Suriname 98 99 179 32 85 86 116 111 91 91 95 x 94 x 90 92 x 46 55 56 x 67 xSwaziland 92 95 64 18 22 23 121 111 86 85 96 97 84 93 29 37 42 52Sweden – – 119 91 95 95 102 101 100 99 – – 99 – 94 94 – –Switzerland – – 130 85 99 100 103 102 99 99 – – – – 84 82 – –Syrian Arab Republic 96 94 63 23 10 9 119 116 100 98 87 x 86 x 95 100 x 67 67 63 x 63 xTajikistan 100 100 91 13 9 8 104 100 99 96 99 y 96 y 99 100 x 90 80 89 x 74 xThailand 98 x 98 x 113 24 98 101 91 90 90 89 98 x 98 x – 99 x 68 76 77 x 83 xThe former YugoslavRepublic of Macedonia 99 99 109 57 25 26 89 91 97 99 99 98 – 99 – – 84 81Timor-Leste 80 79 53 1 – – 119 115 86 86 71 73 67 91 34 39 43 48Togo 88 75 50 4 9 9 147 132 – – 91 87 59 90 – – 51 40Tonga 99 x 100 x 53 25 – – – – – – – – – – – – – –Trinidad and Tobago 100 100 136 55 – – 107 103 98 97 98 x 98 x 89 98 x – – 84 x 90 xTunisia 98 96 117 39 – – 111 107 – – 95 x 93 x 95 – – – – –Turkey 99 97 89 42 22 21 103 101 98 97 94 y 92 y 92 95 x 77 71 – –Turkmenistan 100 100 69 5 – – – – – – 99 x 99 x – 100 x – – 84 x 84 xTuvalu – – 22 30 – – – – – – – – – – – – 35 y 47 yUganda 90 85 48 13 14 14 120 122 90 92 82 y 80 y 32 72 x – – 17 y 17 yUkraine 100 100 123 31 99 96 99 100 91 91 70 76 98 100 86 86 85 85admin.datasurveydata male female male female118THE STATE OF THE WORLD’S CHILDREN 2013: <strong>Children</strong> <strong>with</strong> <strong>Disabilities</strong>
TABLE 5EduCATIONCountriesand areasYouth (15–24 years)literacy rate (%)2007–2011*malefemaleNumber per 100population2011mobilephonesPre-primary schoolparticipation Primary school participation Secondary school participationGross enrolmentratio (%)2008–2011*Gross enrolmentratio (%)2008–2011*Net enrolmentratio (%)2008–2011*Net attendanceratio (%)2007–2011*Internetusers male female male female male female male femaleSurvival rate to lastprimary grade (%)2008–2011*2007–2011*Net enrolmentratio (%)2008–2011*Net attendanceratio (%)2007–2011*United Arab Emirates 94 x 97 x 149 70 – – – – – – – – – – – – – –United Kingdom – – 131 82 81 82 106 106 100 100 – – – – 95 97 – –United Republicof Tanzania 78 76 56 12 33 34 101 103 98 98 79 82 81 91 x – – 26 24United States – – 106 78 68 70 102 101 95 96 – – 93 – 89 90 – –Uruguay 98 99 141 51 89 89 115 111 100 99 – – 95 – 66 73 – –Uzbekistan 100 100 92 30 26 26 95 93 93 91 96 x 96 x 98 100 x 93 91 91 x 90 xVanuatu 94 94 – – 58 59 120 114 – – 80 82 71 88 46 49 38 36Venezuela(Bolivarian Republic of) 98 99 98 40 71 76 104 101 95 95 91 x 93 x 92 82 x 68 76 30 x 43 xViet Nam 97 96 143 35 84 79 109 103 – – 98 98 – 99 – – 78 84Yemen 96 74 47 15 1 1 96 78 86 70 75 x 64 x – 73 x 49 31 49 x 27 xZambia 82 67 61 12 – – 115 116 91 94 81 82 53 87 – – 38 36Zimbabwe – – 72 16 – – – – – – 87 89 – 79 x – – 48 49admin.datasurveydata male female male femaleMEMORANDUMSudan and South Sudan s – – 56 19 – – – – – – – – – – – – – –SUMMARY INDICATORS #Sub-Saharan Africa 76 67 53 13 18 18 103 96 78 74 72 70 60 – – – 31 29Eastern andSouthern Africa 80 72 51 11 21 22 113 108 88 85 75 75 49 – 33 30 23 23West and CentralAfrica 73 61 54 14 14 14 96 86 69 64 68 64 68 90 – – 40 36Middle East andNorth Africa 94 89 94 29 25 23 103 97 92 87 – – – – 68 63 – –South Asia 86 73 69 9 48 49 107 105 93 91 83 79 – 95 54 46 55 46East Asia and Pacific 99 99 81 35 56 56 110 112 96 96 96 ** 97 ** 95 – 70 74 61 ** 63 **Latin Americaand Caribbean 97 97 107 39 70 70 116 112 96 95 – – 91 – 71 76 – –CEE/CIS 99 99 132 42 57 56 100 99 95 95 – – 96 – 83 82 – –Least developed countries 76 68 42 6 13 13 106 100 82 78 76 75 56 – 35 29 27 24World 92 87 85 33 48 48 107 105 92 90 82 ** 79 ** 81 – 64 61 49 ** 45 **s Due to the cession in July 2011 of the Republic of South Sudan by the Republic of the Sudan, and its subsequent admission to the United Nations on 14 July 2011, disaggregated data for the Sudan and South Sudan as separateStates are not yet available for all indicators. Aggregated data presented are for the Sudan pre-cession (see Memorandum item).# For a complete list of countries and areas in the regions, subregions and country categories, see page 98.DEFINITIONS OF THE INDICATORSYouth literacy rate – Number of literate persons aged 15–24 years, expressed as a percentage of the total population inthat group.Mobile phones – The number of active subscriptions to a public mobile telephone service, including the number of prepaidSIM cards active during the past three months.Internet users – The estimated number of Internet users, including those using the Internet from any device (includingmobile phones) in the last 12 months.Pre-primary school gross enrolment ratio – Number of children enrolled in pre-primary school, regardless of age,expressed as a percentage of the total number of children of official pre-primary school age.Primary school gross enrolment ratio – Number of children enrolled in primary school, regardless of age, expressed as apercentage of the total number of children of official primary school age.Primary school net enrolment ratio – Number of children enrolled in primary or secondary school who are of officialprimary school age, expressed as a percentage of the total number of children of official primary school age. Because of theinclusion of primary-school-aged children enrolled in secondary school, this indicator can also be referred to as a primaryadjusted net enrolment ratio.Primary school net attendance ratio – Number of children attending primary or secondary school who are of officialprimary school age, expressed as a percentage of the total number of children of official primary school age. Because ofthe inclusion of primary-school-aged children attending secondary school, this indicator can also be referred to as a primaryadjusted net attendance ratio.Survival rate to last primary grade – Percentage of children entering the first grade of primary school who eventuallyreach the last grade of primary school.Secondary school net enrolment ratio – Number of children enrolled in secondary school who are of official secondaryschool age, expressed as a percentage of the total number of children of official secondary school age. Secondary netenrolment ratio does not include secondary-school-aged children enrolled in tertiary education owing to challenges in agereporting and recording at that level.Secondary school net attendance ratio – Number of children attending secondary or tertiary school who are of officialsecondary school age, expressed as a percentage of the total number of children of official secondary school age. Because ofthe inclusionof secondary-school-aged children attending tertiary school, this indicator can also be referred to as a secondary adjusted netattendance ratio.All data refer to official International Standard Classifications of Education (ISCED) for the primary andsecondary education levels and thus may not directly correspond to a country-specific school system.MAIN DATA SOURCESYouth literacy – UNESCO Institute for Statistics (UIS).Phone and Internet use – International Telecommunications Union, Geneva.Pre-primary, primary and secondary enrolment – UIS. Estimates based onadministrative data from International Education Management Information Systems (EMIS)<strong>with</strong> United Nations population estimates.Primary and secondary school attendance – Demographic and Health Surveys (DHS),Multiple Indicator Cluster Surveys (MICS) and other national household surveys.Survival rate to last primary grade – Administrative data: UIS; survey data: DHS andMICS. Regional and global averages calculated by UNICEF.NOTES− Data not available.x Data refer to years or periods other than those specified in the column heading. Suchdata are not included in the calculation of regional and global averages, <strong>with</strong> theexception of 2005–2006 data from India. Estimates from data years prior to 2000 are notdisplayed.y Data differ from the standard definition or refer to only part of a country. If they fall <strong>with</strong>inthe noted reference period, such data are included in the calculation of regional and globalaverages.z Data provided by the Chinese Ministry of Education. The UNESCO Institute for Statisticsdataset does not currently include net enrolment rates or primary school survival forChina.* Data refer to the most recent year available during the period specified in the columnheading.** Excludes China.STATISTICAL TABLES 119
TABLE 6: dEmOGRApHIC INdICATORSCountriesand areasTotal Urbanized Average annualPopulation (thousands)Population annualfertility population growth rate of urban2011growth rate (%) Crude death rate Crude birth rate Life expectancy rate (%) population (%)total under 18 under 5 1990–2011 2011–2030 a 1970 1990 2011 1970 1990 2011 1970 1990 2011 2011 2011 1990–2011 2011–2030 aAfghanistan 32,358 17,219 5,686 4.3 2.6 29 22 16 52 52 43 35 42 49 6.2 24 5.6 4.1Albania 3,216 877 203 -0.1 0.1 8 6 6 33 25 13 67 72 77 1.5 53 1.7 1.5Algeria 35,980 11,641 3,464 1.7 1.0 16 6 5 49 32 20 53 67 73 2.2 73 3.3 1.7Andorra 86 16 4 2.3 1.4 – – – – – – – – – – 87 1.9 1.0Angola 19,618 10,399 3,393 3.1 2.4 27 23 14 52 53 41 37 41 51 5.3 59 5.3 3.3Antigua and Barbuda 90 28 8 1.7 0.8 – – – – – – – – – – 30 0.9 1.5Argentina 40,765 12,105 3,423 1.1 0.7 9 8 8 23 22 17 66 72 76 2.2 93 1.4 0.8Armenia 3,100 763 225 -0.6 0.0 5 8 9 23 21 15 70 68 74 1.7 64 -0.9 0.3Australia 22,606 5,190 1,504 1.3 1.1 9 7 7 20 15 14 71 77 82 2.0 89 1.5 1.2Austria 8,413 1,512 381 0.4 0.1 13 11 9 15 11 9 70 75 81 1.4 68 0.6 0.5Azerbaijan 9,306 2,430 846 1.2 0.8 7 7 7 29 27 20 65 65 71 2.2 54 1.2 1.4Bahamas 347 95 27 1.4 0.9 6 6 5 26 24 15 66 69 76 1.9 84 1.7 1.1Bahrain 1,324 311 102 4.7 1.2 7 3 3 38 29 19 64 72 75 2.5 89 4.7 1.3Bangladesh 150,494 55,515 14,421 1.7 1.0 23 10 6 47 36 20 42 59 69 2.2 28 3.4 2.7Barbados 274 59 15 0.3 0.1 9 8 9 22 16 11 69 75 77 1.6 44 1.7 1.1Belarus 9,559 1,766 527 -0.3 -0.4 7 11 14 16 14 11 71 71 70 1.5 75 0.3 0.0Belgium 10,754 2,182 619 0.4 0.2 12 11 10 15 12 11 71 76 80 1.8 97 0.4 0.3Belize 318 131 37 2.4 1.7 8 5 4 42 37 24 66 72 76 2.7 45 2.2 1.8Benin 9,100 4,568 1,546 3.1 2.5 26 17 12 48 47 39 40 49 56 5.2 45 4.3 3.7Bhutan 738 258 70 1.3 1.0 23 14 7 47 38 20 41 53 67 2.3 36 5.0 2.6Bolivia (PlurinationalState of) 10,088 4,254 1,230 2.0 1.5 20 11 7 46 36 26 46 59 67 3.3 67 2.9 2.0Bosnia and Herzegovina 3,752 686 167 -0.7 -0.4 7 9 10 23 15 8 66 67 76 1.1 48 0.3 0.6Botswana 2,031 788 229 1.8 0.8 13 7 13 46 35 23 55 64 53 2.7 62 3.7 1.5Brazil 196,655 59,010 14,662 1.3 0.6 10 7 6 35 24 15 59 66 73 1.8 85 1.9 0.8Brunei Darussalam 406 124 37 2.3 1.3 7 4 3 36 29 19 67 73 78 2.0 76 3.0 1.7Bulgaria 7,446 1,249 378 -0.8 -0.8 9 12 15 16 12 10 71 71 73 1.5 73 -0.3 -0.2Burkina Faso 16,968 8,824 3,047 2.9 2.8 23 17 12 48 47 43 41 49 55 5.8 27 6.0 5.2Burundi 8,575 3,813 1,221 2.0 1.5 20 19 14 44 46 34 44 46 50 4.2 11 4.7 4.0Cambodia 14,305 5,480 1,505 1.9 1.0 20 12 8 42 44 22 44 56 63 2.5 20 3.1 2.4Cameroon 20,030 9,420 3,102 2.4 1.9 19 14 14 45 42 36 46 53 52 4.4 52 3.7 2.8Canada 34,350 6,926 1,936 1.0 0.8 7 7 8 17 14 11 73 77 81 1.7 81 1.3 0.9Cape Verde 501 190 50 1.7 0.8 15 9 5 41 39 20 53 65 74 2.3 63 3.4 1.7Central African Republic 4,487 2,098 658 2.0 1.8 23 17 16 43 41 35 42 49 48 4.5 39 2.3 2.8Chad 11,525 5,992 2,047 3.1 2.5 22 17 16 46 47 44 44 51 50 5.9 22 3.3 3.5Chile 17,270 4,615 1,222 1.3 0.6 10 6 6 29 23 14 62 74 79 1.8 89 1.6 0.8China 1,347,565 317,892 82,205 0.8 0.2 9 7 7 36 21 12 63 69 73 1.6 51 3.9 1.8Colombia 46,927 15,951 4,509 1.6 1.0 9 6 5 38 27 19 61 68 74 2.3 75 2.1 1.3Comoros 754 366 124 2.6 2.3 18 11 9 47 37 37 48 56 61 4.9 28 2.6 3.0Congo 4,140 1,940 637 2.6 2.1 14 12 11 43 38 35 53 56 57 4.5 64 3.4 2.7Cook Islands 20 8 2 0.7 0.4 – – – – – – – – – – 74 1.9 0.8Costa Rica 4,727 1,405 359 2.1 1.0 7 4 4 33 27 16 67 76 79 1.8 65 3.2 1.6Côte d’Ivoire 20,153 9,539 2,992 2.3 2.1 21 13 12 52 41 34 44 53 55 4.3 51 3.5 3.2Croatia 4,396 806 215 -0.1 -0.3 10 11 12 15 12 10 69 72 77 1.5 58 0.2 0.3Cuba 11,254 2,343 543 0.3 -0.1 7 7 7 29 17 10 70 74 79 1.5 75 0.4 0.0Cyprus 1,117 244 65 1.8 0.8 7 7 7 19 19 12 73 77 80 1.5 70 2.0 1.1Czech Republic 10,534 1,836 567 0.1 0.1 12 12 10 16 12 11 70 72 78 1.5 73 0.0 0.2Democratic People’sRepublic of Korea 24,451 6,757 1,706 0.9 0.4 7 5 10 35 21 14 62 71 69 2.0 60 1.1 0.7Democratic Republicof the Congo 67,758 35,852 12,037 3.0 2.4 21 19 16 48 50 43 44 47 48 5.7 34 4.0 3.8Denmark 5,573 1,212 327 0.4 0.3 10 12 10 15 12 11 73 75 79 1.9 87 0.5 0.4Djibouti 906 382 115 2.3 1.8 20 14 10 49 42 29 43 51 58 3.7 77 2.4 1.9Dominica 68 21 6 -0.2 0.1 – – – – – – – – – – 67 -0.3 0.4Dominican Republic 10,056 3,672 1,051 1.6 1.0 11 6 6 42 30 21 58 68 73 2.5 70 2.7 1.5Ecuador 14,666 5,234 1,469 1.7 1.0 12 6 5 42 29 20 58 69 76 2.4 67 2.7 1.7Egypt 82,537 30,537 9,092 1.8 1.3 16 9 5 41 32 23 50 62 73 2.7 43 1.8 2.0El Salvador 6,227 2,394 631 0.7 0.7 13 8 7 43 32 20 57 66 72 2.2 65 2.0 1.3Equatorial Guinea 720 327 111 3.1 2.2 25 20 14 39 47 36 40 47 51 5.1 39 3.7 3.0Eritrea 5,415 2,588 879 2.6 2.3 21 16 8 47 41 36 43 48 62 4.4 21 4.0 4.4Estonia 1,341 250 80 -0.7 -0.2 11 13 13 15 14 12 71 69 75 1.7 69 -0.9 0.0Ethiopia 84,734 40,698 11,915 2.7 1.8 21 18 9 47 48 31 43 47 59 4.0 17 4.1 3.6Fiji 868 300 91 0.8 0.5 8 6 7 34 29 21 60 66 69 2.6 52 1.9 1.2Finland 5,385 1,084 303 0.4 0.2 10 10 10 14 13 11 70 75 80 1.9 84 0.6 0.4France 63,126 13,837 3,985 0.5 0.4 11 9 9 17 13 13 72 77 82 2.0 86 1.2 0.8Gabon 1,534 642 188 2.4 1.8 20 11 9 34 38 27 47 61 63 3.2 86 3.4 2.0120THE STATE OF THE WORLD’S CHILDREN 2013: <strong>Children</strong> <strong>with</strong> <strong>Disabilities</strong>
TABLE 6dEmOGRApHIC INdICATORSCountriesand areasTotal Urbanized Average annualPopulation (thousands)Population annualfertility population growth rate of urban2011growth rate (%) Crude death rate Crude birth rate Life expectancy rate (%) population (%)total under 18 under 5 1990–2011 2011–2030 a 1970 1990 2011 1970 1990 2011 1970 1990 2011 2011 2011 1990–2011 2011–2030 aGambia 1,776 897 292 2.9 2.4 26 13 9 51 47 38 38 53 58 4.8 57 4.8 3.2Georgia 4,329 892 258 -1.1 -0.7 9 9 11 19 17 12 67 71 74 1.5 53 -1.3 -0.3Germany 82,163 13,437 3,504 0.2 -0.2 12 11 11 14 11 9 71 75 80 1.4 74 0.2 0.1Ghana 24,966 11,174 3,591 2.5 2.0 17 11 8 47 39 31 49 57 64 4.1 52 4.2 3.0Greece 11,390 2,001 600 0.5 0.1 8 9 10 17 10 10 72 77 80 1.5 61 0.7 0.6Grenada 105 35 10 0.4 0.1 9 8 6 28 28 19 64 69 76 2.2 39 1.2 1.0Guatemala 14,757 7,072 2,192 2.4 2.3 15 9 5 44 39 32 52 62 71 3.9 50 3.3 3.2Guinea 10,222 5,045 1,691 2.7 2.3 30 21 13 49 46 38 34 44 54 5.2 35 3.8 3.7Guinea-Bissau 1,547 739 244 2.0 2.0 26 22 16 46 46 38 37 43 48 5.0 44 4.1 3.2Guyana 756 297 60 0.2 0.3 12 10 6 37 25 18 56 61 70 2.2 28 0.0 1.0Haiti 10,124 4,271 1,245 1.7 1.1 18 13 9 39 37 26 47 55 62 3.3 53 4.7 2.6Holy See 0 0 0 -2.5 -0.1 – – – – – – – – – – 100 -2.5 -0.1Honduras 7,755 3,338 975 2.2 1.7 15 7 5 47 38 26 52 66 73 3.1 52 3.4 2.6Hungary 9,966 1,800 493 -0.2 -0.2 11 14 13 15 12 10 69 69 74 1.4 69 0.1 0.4Iceland 324 81 24 1.1 1.0 7 7 6 21 17 15 74 78 82 2.1 94 1.3 1.1India 1,241,492 448,336 128,542 1.7 1.1 16 11 8 38 31 22 49 58 65 2.6 31 2.6 2.3Indonesia 242,326 77,471 21,210 1.3 0.8 15 8 7 40 26 18 52 62 69 2.1 51 3.7 1.9Iran (Islamic Republic of) 74,799 20,819 6,269 1.5 0.6 16 8 5 42 34 17 51 62 73 1.6 69 2.4 0.9Iraq 32,665 16,146 5,294 3.0 2.8 12 7 6 45 38 35 58 67 69 4.6 66 2.8 2.9Ireland 4,526 1,137 370 1.2 0.9 11 9 6 22 14 16 71 75 81 2.1 62 1.6 1.4Israel 7,562 2,417 754 2.5 1.4 7 6 5 26 22 21 72 76 82 2.9 92 2.6 1.4Italy 60,789 10,308 2,910 0.3 0.0 10 10 10 17 10 9 71 77 82 1.4 68 0.4 0.4Jamaica 2,751 956 254 0.7 0.2 8 7 7 36 26 18 68 71 73 2.3 52 1.0 0.6Japan 126,497 20,375 5,418 0.2 -0.3 7 7 9 19 10 8 72 79 83 1.4 91 1.0 0.0Jordan 6,330 2,747 817 2.9 1.5 11 5 4 51 36 25 61 70 73 3.0 83 3.6 1.7Kazakhstan 16,207 4,800 1,726 -0.1 0.8 9 9 10 26 23 21 62 67 67 2.5 54 -0.3 1.0Kenya 41,610 20,317 6,805 2.7 2.4 15 10 10 51 42 37 52 59 57 4.7 24 4.4 4.1Kiribati 101 36 10 1.6 1.4 – – – – – – – – – – 44 2.7 2.0Kuwait 2,818 863 282 1.4 1.9 6 3 3 49 21 18 67 72 75 2.3 98 1.4 1.9Kyrgyzstan 5,393 1,957 624 1.0 1.1 11 8 7 31 31 24 60 66 68 2.7 35 0.7 1.8Lao People’sDemocratic Republic 6,288 2,581 682 1.9 1.1 18 13 6 42 42 22 46 54 67 2.7 34 5.7 3.3Latvia 2,243 382 117 -0.8 -0.4 11 13 14 14 14 11 70 69 73 1.5 68 -0.9 -0.2Lebanon 4,259 1,271 328 1.8 0.5 9 7 7 33 26 15 65 69 73 1.8 87 2.0 0.6Lesotho 2,194 970 276 1.4 0.8 17 10 15 43 36 28 49 59 48 3.1 28 4.6 2.9Liberia 4,129 2,057 700 3.2 2.4 23 21 11 49 46 39 41 42 57 5.2 48 2.2 3.2Libya 6,423 2,293 717 1.9 1.0 16 4 4 49 26 23 52 68 75 2.5 78 2.0 1.3Liechtenstein 36 7 2 1.1 0.7 – – – – – – – – – – 14 0.3 1.1Lithuania 3,307 616 173 -0.5 -0.4 9 11 14 17 15 11 71 71 72 1.5 67 -0.6 -0.1Luxembourg 516 110 29 1.4 1.1 12 10 8 13 13 12 70 75 80 1.7 85 1.7 1.3Madagascar 21,315 10,570 3,378 3.0 2.7 21 16 6 48 45 35 44 51 67 4.6 33 4.6 4.3Malawi 15,381 8,116 2,829 2.4 3.2 24 18 12 52 48 44 41 47 54 6.0 16 3.8 4.7Malaysia 28,859 10,244 2,796 2.2 1.3 7 5 5 33 28 20 64 70 74 2.6 73 4.0 1.9Maldives 320 104 26 1.8 0.9 21 9 4 50 41 17 44 61 77 1.7 41 4.0 2.6Mali 15,840 8,525 2,995 2.9 2.8 30 21 14 49 49 46 34 44 51 6.2 35 4.8 4.3Malta 418 77 20 0.6 0.2 9 8 8 16 16 9 70 75 80 1.3 95 0.8 0.3Marshall Islands 55 20 5 0.7 1.1 – – – – – – – – – – 72 1.2 1.5Mauritania 3,542 1,635 522 2.7 2.0 18 11 9 47 41 33 47 56 59 4.5 41 2.9 3.0Mauritius 1,307 344 81 1.0 0.3 7 6 7 29 22 13 63 69 73 1.6 42 0.8 0.8Mexico 114,793 39,440 10,943 1.5 0.9 10 5 5 43 28 19 61 71 77 2.3 78 1.9 1.2Micronesia(Federated States of) 112 48 13 0.7 0.8 9 7 6 41 34 24 62 66 69 3.4 23 0.1 1.6Monaco 35 7 2 0.7 0.0 – – – – – – – – – – 100 0.7 0.0Mongolia 2,800 934 317 1.2 1.2 15 10 6 44 32 23 56 61 68 2.5 69 2.0 2.0Montenegro 632 145 39 0.2 0.0 3 5 10 10 11 12 69 76 75 1.6 63 1.5 0.4Morocco 32,273 10,790 3,048 1.3 0.8 17 8 6 47 30 19 52 64 72 2.2 57 2.0 1.4Mozambique 23,930 12,086 3,877 2.7 2.1 25 21 14 48 43 37 39 43 50 4.8 31 4.6 3.3Myanmar 48,337 14,832 3,981 1.0 0.6 16 11 8 40 27 17 50 57 65 2.0 33 2.3 2.2Namibia 2,324 994 288 2.4 1.4 15 9 8 43 38 26 53 61 62 3.2 38 3.9 2.8Nauru 10 4 1 0.6 0.4 – – – – – – – – – – 100 0.6 0.4Nepal 30,486 12,883 3,453 2.2 1.4 21 13 6 44 39 24 43 54 69 2.7 17 5.3 3.4Netherlands 16,665 3,526 907 0.5 0.2 8 9 8 17 13 11 74 77 81 1.8 83 1.4 0.5New Zealand 4,415 1,091 320 1.2 0.9 9 8 7 22 17 15 71 75 81 2.2 86 1.3 1.0Nicaragua 5,870 2,390 684 1.7 1.1 14 7 5 46 37 23 54 64 74 2.6 58 2.1 1.7Niger 16,069 8,922 3,196 3.4 3.4 26 24 13 56 56 48 38 41 55 7.0 18 4.2 5.3Nigeria 162,471 79,931 27,195 2.4 2.4 22 19 14 46 44 40 42 46 52 5.5 50 4.1 3.5STATISTICAL TABLES 121
TABLE 6dEmOGRApHIC INdICATORSCountriesPopulation (thousands)2011Population annualgrowth rate (%) Crude death rate Crude birth rate Life expectancyand areastotal under 18 under 5 1990–2011 2011–2030 a 1970 1990 2011 1970 1990 2011 1970 1990 2011 2011 2011 1990–2011 2011–2030 aNiue 1 1 0 -2.3 -1.5 – – – – – – – – – – 38 -1.4 -0.5Norway 4,925 1,117 309 0.7 0.7 10 11 8 17 14 12 74 77 81 1.9 79 1.2 0.9Oman 2,846 910 290 2.0 1.2 16 5 4 49 38 18 51 71 73 2.2 73 2.5 1.6Pakistan 176,745 73,756 22,064 2.2 1.5 15 10 7 43 40 27 53 61 65 3.3 36 3.0 2.6Palau 21 7 2 1.5 1.0 – – – – – – – – – – 84 2.4 1.4Panama 3,571 1,213 345 1.9 1.2 8 5 5 37 26 20 65 72 76 2.5 75 3.5 1.7Papua New Guinea 7,014 3,168 975 2.5 2.0 17 10 7 44 35 30 46 56 63 3.9 12 1.6 3.6Paraguay 6,568 2,587 744 2.1 1.5 7 6 5 37 33 24 65 68 72 2.9 62 3.2 2.1Peru 29,400 10,421 2,902 1.4 1.0 14 7 5 42 30 20 53 66 74 2.5 77 2.0 1.3Philippines 94,852 39,205 11,161 2.1 1.5 9 7 6 39 33 25 61 65 69 3.1 49 2.1 2.3Poland 38,299 7,023 2,008 0.0 -0.1 8 10 10 17 15 11 70 71 76 1.4 61 0.0 0.1Portugal 10,690 1,930 501 0.4 -0.2 11 10 10 21 11 9 67 74 79 1.3 61 1.5 0.5Qatar 1,870 302 97 6.5 1.2 6 2 2 36 24 12 66 74 78 2.2 99 6.8 1.3Republic of Korea 48,391 9,842 2,488 0.6 0.2 9 6 6 32 16 10 61 72 81 1.4 83 1.1 0.4Republic of Moldova 3,545 740 223 -1.0 -0.6 10 10 13 18 19 12 65 68 69 1.5 48 -0.9 0.6Romania 21,436 3,928 1,093 -0.4 -0.3 9 11 12 21 14 10 68 69 74 1.4 53 -0.4 0.0Russian Federation 142,836 26,115 8,264 -0.2 -0.2 9 12 14 14 14 12 69 68 69 1.5 74 -0.1 0.0Rwanda 10,943 5,352 1,909 2.1 2.5 20 32 12 51 45 41 44 33 55 5.3 19 8.1 4.3Saint Kitts and Nevis 53 17 5 1.3 0.9 – – – – – – – – – – 32 0.9 1.7Saint Lucia 176 55 15 1.2 0.7 9 6 6 39 28 17 64 71 75 2.0 18 -1.3 -1.4Saint Vincentand the Grenadines 109 35 9 0.1 0.1 11 7 7 40 25 17 61 69 72 2.0 49 0.9 0.8Samoa 184 81 22 0.6 0.5 10 7 5 39 32 24 55 65 72 3.8 20 0.3 0.3San Marino 32 6 2 1.3 0.3 – – – – – – – – – – 94 1.5 0.4Sao Tome and Principe 169 79 24 1.8 1.7 13 10 8 41 38 31 55 61 65 3.6 63 3.5 2.5Saudi Arabia 28,083 9,923 3,186 2.6 1.7 15 5 4 47 36 22 52 69 74 2.7 82 3.0 1.9Senegal 12,768 6,425 2,125 2.7 2.4 24 13 9 51 44 37 41 53 59 4.7 43 3.1 3.3Serbia 9,854 2,089 551 0.1 -0.2 9 10 12 18 15 11 68 72 75 1.6 56 0.7 0.4Seychelles 87 43 14 1.0 0.3 – – – – – – – – – – 54 1.4 1.0Sierra Leone 5,997 2,965 984 2.0 1.9 29 25 15 47 44 38 35 39 48 4.9 39 2.8 2.9Singapore 5,188 1,104 238 2.6 0.7 5 5 5 23 19 9 68 76 81 1.3 100 2.6 0.7Slovakia 5,472 1,024 281 0.2 0.1 9 10 10 18 15 11 70 71 75 1.3 55 0.0 0.3Slovenia 2,035 344 102 0.3 0.1 10 10 10 17 11 10 69 73 79 1.5 50 0.2 0.4Solomon Islands 552 254 81 2.8 2.2 13 11 6 45 40 31 54 57 68 4.2 20 4.7 4.0Somalia 9,557 4,896 1,701 1.8 2.8 24 20 15 51 45 43 40 45 51 6.3 38 2.9 4.1South Africa 50,460 18,045 4,989 1.5 0.4 14 8 15 38 29 21 53 62 53 2.4 62 2.3 1.1South Sudan s 10,314 – – 2.6 2.3 – – – – – – – – – – 18 4.0 3.9Spain 46,455 8,306 2,546 0.8 0.4 9 9 9 20 10 11 72 77 81 1.5 77 1.0 0.6Sri Lanka 21,045 6,183 1,886 0.9 0.5 9 7 7 31 20 18 63 70 75 2.3 15 0.3 2.0State of Palestine 4,152 2,051 635 3.3 2.6 13 5 4 50 45 33 56 68 73 4.4 74 3.7 2.9Sudan s 34,318 – – 2.5 2.1 – – – – – – – – – – 33 3.2 2.9Suriname 529 176 47 1.3 0.7 9 7 7 37 23 18 63 67 71 2.3 70 2.0 1.1Swaziland 1,203 548 158 1.6 1.0 18 10 14 49 43 29 48 59 49 3.3 21 1.2 1.5Sweden 9,441 1,916 562 0.5 0.5 10 11 10 14 14 12 74 78 81 1.9 85 0.6 0.7Switzerland 7,702 1,435 382 0.7 0.3 9 9 8 16 12 10 73 78 82 1.5 74 0.7 0.5Syrian Arab Republic 20,766 8,923 2,446 2.5 1.5 11 5 4 47 36 22 60 71 76 2.9 56 3.1 2.2Tajikistan 6,977 3,052 883 1.3 1.3 10 8 6 40 39 28 60 63 68 3.2 27 0.5 2.1Thailand 69,519 17,111 4,270 0.9 0.3 10 5 7 38 19 12 60 73 74 1.6 34 1.6 1.6The former YugoslavRepublic of Macedonia 2,064 445 112 0.4 -0.1 8 8 9 24 17 11 66 71 75 1.4 59 0.5 0.4Timor-Leste 1,154 616 201 2.1 2.9 23 18 8 42 43 38 40 46 62 6.1 28 3.6 4.1Togo 6,155 2,831 870 2.5 1.8 20 14 11 49 42 32 45 53 57 4.0 38 3.8 3.0Tonga 105 46 14 0.4 0.8 7 6 6 36 31 27 65 70 72 3.9 23 0.6 1.5Trinidad and Tobago 1,346 334 96 0.5 0.0 7 7 8 27 21 15 65 69 70 1.6 14 2.7 1.7Tunisia 10,594 3,001 885 1.2 0.7 14 6 6 39 27 17 54 69 75 2.0 66 1.9 1.1Turkey 73,640 23,107 6,489 1.5 0.9 16 8 5 39 26 18 50 63 74 2.1 72 2.4 1.6Turkmenistan 5,105 1,785 499 1.6 1.0 11 8 8 37 35 21 58 63 65 2.4 49 1.9 1.8Tuvalu 10 4 1 0.4 0.6 – – – – – – – – – – 51 1.5 1.3Uganda 34,509 19,042 6,638 3.2 2.9 16 17 12 49 50 45 50 47 54 6.1 16 4.8 5.3Ukraine 45,190 7,977 2,465 -0.6 -0.6 9 13 16 15 13 11 71 70 68 1.5 69 -0.5 -0.2United Arab Emirates 7,891 1,590 451 7.0 1.5 7 3 1 37 26 13 62 72 77 1.7 84 7.3 1.7United Kingdom 62,417 13,153 3,858 0.4 0.6 12 11 9 15 14 12 72 76 80 1.9 80 0.5 0.8United Republicof Tanzania 46,218 23,690 8,267 2.8 3.0 18 15 10 48 44 41 47 51 58 5.5 27 4.5 4.7United States 313,085 75,491 21,629 1.0 0.8 9 9 8 16 16 14 71 75 79 2.1 82 1.4 1.0Uruguay 3,380 912 245 0.4 0.3 10 10 9 21 18 15 69 73 77 2.1 93 0.6 0.4TotalfertilityrateUrbanizedpopulation(%)Average annualgrowth rate of urbanpopulation (%)122THE STATE OF THE WORLD’S CHILDREN 2013: <strong>Children</strong> <strong>with</strong> <strong>Disabilities</strong>
TABLE 6dEmOGRApHIC INdICATORSCountriesPopulation (thousands)2011Population annualgrowth rate (%) Crude death rate Crude birth rate Life expectancyand areastotal under 18 under 5 1990–2011 2011–2030 a 1970 1990 2011 1970 1990 2011 1970 1990 2011 2011 2011 1990–2011 2011–2030 aUzbekistan 27,760 9,849 2,802 1.4 1.0 10 7 7 36 35 21 63 67 68 2.3 36 0.9 1.7Vanuatu 246 109 34 2.5 2.2 14 8 5 42 36 29 52 63 71 3.8 25 3.8 3.4Venezuela (BolivarianRepublic of) 29,437 10,215 2,935 1.9 1.2 7 5 5 37 29 20 64 71 74 2.4 94 2.4 1.3Viet Nam 88,792 25,532 7,202 1.3 0.7 18 8 5 41 30 16 48 66 75 1.8 31 3.4 2.5Yemen 24,800 12,697 4,179 3.5 2.7 24 12 6 51 52 38 40 56 65 5.1 32 5.5 4.3Zambia 13,475 7,169 2,509 2.6 3.1 17 17 15 49 44 46 49 47 49 6.3 39 2.5 4.3Zimbabwe 12,754 5,841 1,706 0.9 1.7 13 9 13 48 37 29 55 61 51 3.2 39 2.3 3.0MEMORANDUMSudan andSouth Sudan s – 20,660 6,472 – – 19 14 9 46 41 32 45 53 61 4.3 – – –TotalfertilityrateUrbanizedpopulation(%)Average annualgrowth rate of urbanpopulation (%)SUMMARY INDICATORS #Sub-Saharan Africa 876,497 428,333 140,617 2.5 2.3 20 16 12 47 44 37 44 50 55 4.9 37 3.8 3.4Eastern andSouthern Africa 418,709 196,675 63,188 2.5 2.2 19 15 12 47 43 35 47 51 56 4.5 30 3.6 3.4West and Central Africa 422,564 210,616 70,843 2.6 2.4 22 18 13 47 45 39 42 48 53 5.3 43 3.9 3.5Middle East andNorth Africa 415,633 157,845 48,169 2.1 1.5 16 8 5 44 34 24 52 63 71 2.8 60 2.7 1.9South Asia 1,653,679 614,255 176,150 1.8 1.1 17 11 8 40 33 23 49 59 66 2.7 31 2.8 2.4East Asia and Pacific 2,032,532 533,810 141,248 1.0 0.4 10 7 7 36 23 14 61 68 73 1.8 50 3.4 1.8Latin Americaand Caribbean 591,212 195,081 52,898 1.4 0.9 10 7 6 36 27 18 60 68 74 2.2 79 2.0 1.1CEE/CIS 405,743 95,460 28,590 0.2 0.1 10 11 11 20 18 14 66 68 70 1.8 65 0.3 0.6Least developed countries 851,103 395,405 124,162 2.4 2.1 22 15 10 47 43 33 43 51 59 4.2 29 3.9 3.6World 6,934,761 2,207,145 638,681 1.3 0.9 12 9 8 33 26 19 59 65 69 2.4 52 2.2 1.7s Due to the cession in July 2011 of the Republic of South Sudan by the Republic of the Sudan, and its subsequent admission to the United Nations on 14 July 2011, disaggregated data for the Sudanand South Sudan as separate States are not yet available for all indicators. Aggregated data presented are for the Sudan pre-cession (see Memorandum item).# For a complete list of countries and areas in the regions, subregions and country categories, see page 98.DEFINITIONS OF THE INDICATORSCrude death rate – Annual number of deaths per 1,000 population.Crude birth rate – Annual number of births per 1,000 population.Life expectancy – Number of years newborn children would live if subject to themortality risks prevailing for the cross section of population at the time of their birth.Total fertility rate – Number of children who would be born per woman if she livedto the end of her childbearing years and bore children at each age in accordance<strong>with</strong> prevailing age-specific fertility rates.Urbanized population – Percentage of population living in urban areas as definedaccording to the national definition used in the most recent population census.MAIN DATA SOURCESPopulation – United Nations Population Division. Growth rates calculated by UNICEF based ondata from United Nations Population Division.Crude death and birth rates – United Nations Population Division.Life expectancy – United Nations Population Division.Total fertility rate – United Nations Population Division.NOTES− Data not available.aBased on medium-fertility variant projections.STATISTICAL TABLES 123
TABLE 7: ECONOmIC INdICATORSCountriesGNI per capita2011GDP per capitaaverage annualgrowth rate (%)Averageannual rateof inflation(%)Populationbelowinternationalpoverty lineof US$1.25per day (%)Public spending as a % of GDP(2007–2010*)allocated to:ODAinflow inmillionsUS$ODA inflowas a % ofrecipientGNIDebt serviceas a % ofexports ofgoods andservicesShare of householdincome(%, 2005–2011*)and areasUS$ PPP US$ 1970–1990 1990–2011 1990–2011 2006–2011* health education military 2010 2010 2010 poorest 40% richest 20%Afghanistan 410 x 910 x, e – – – – 2 – 2 6,374 – – 23 37Albania 3,980 8,900 -0.7 x 5.3 13 1 3 – 2 338 3 9 20 43Algeria 4,470 8,370 e 1.6 1.5 12 – 5 4 3 199 0 1 – –Andorra 41,750 x – -1.4 2.5 x 3 x – 5 4 – – – – – –Angola 4,060 5,290 – 4.1 205 54 x – 3 5 239 0 4 8 x 62 xAntigua and Barbuda 12,060 15,670 e 7.8 x 0.6 4 – 4 2 – 19 2 – – –Argentina 9,740 17,250 -0.8 2.3 8 1 6 6 1 155 0 16 14 49Armenia 3,360 6,140 – 6.1 47 1 2 4 4 340 4 31 22 40Australia 46,200 x 36,910 x 1.6 2.2 3 – 6 5 2 – – – – –Austria 48,300 41,970 2.5 1.8 1 – 8 5 1 – – – 22 x 38 xAzerbaijan 5,290 9,020 – 5.9 50 0 1 3 3 156 0 1 20 42Bahamas 21,970 x 29,850 x, e 1.9 0.7 4 – 3 – – – – – – –Bahrain 15,920 x 21,240 x -1.0 x 1.3 x 3 x – 3 3 3 – – – – –Bangladesh 770 1,940 0.6 3.6 4 43 1 2 1 1,417 1 3 21 41Barbados 12,660 x 18,850 x, e 1.7 1.1 x 3 x – 4 7 – 16 – – – –Belarus 5,830 14,560 – 4.7 113 0 4 5 1 137 0 4 23 36Belgium 46,160 39,300 2.2 1.6 2 – 7 6 1 – – – 21 x 41 xBelize 3,690 6,070 e 2.9 1.8 1 – 4 6 1 25 2 11 – –Benin 780 1,630 0.5 1.3 5 47 x 2 5 1 691 10 – 18 x 46 xBhutan 2,070 5,480 – 5.3 7 10 5 5 – 131 9 – 17 45Bolivia (PlurinationalState of) 2,040 4,920 -1.1 1.6 7 16 3 – 2 676 4 8 9 59Bosnia and Herzegovina 4,780 9,200 – 8.3 x 5 x 0 7 – 1 492 3 16 18 43Botswana 7,480 14,560 8.1 3.4 9 – 8 8 3 157 1 1 – –Brazil 10,720 11,500 2.3 1.6 49 6 4 6 2 664 0 19 10 59Brunei Darussalam 31,800 x 49,790 x -2.2 x -0.4 x 5 x – – 2 3 – – – – –Bulgaria 6,550 13,980 3.4 x 3.3 37 0 4 4 2 – – 14 22 37Burkina Faso 570 1,310 1.3 2.8 3 45 4 5 1 1,065 12 – 17 47Burundi 250 610 1.2 -1.4 14 81 5 7 3 632 40 1 21 43Cambodia 830 2,260 – 6.5 x 4 x 23 2 2 1 737 7 1 19 46Cameroon 1,210 2,360 3.4 0.8 4 10 2 4 2 538 2 4 17 46Canada 45,560 39,830 2.0 1.8 2 – 7 5 1 – – – 20 x 40 xCape Verde 3,540 4,000 – 5.0 2 21 x 3 6 1 329 21 4 12 x 56 xCentral African Republic 470 810 -1.3 -0.5 3 63 2 1 2 264 13 – 10 61Chad 690 1,370 -0.9 3.1 6 62 x 4 3 6 490 7 – 17 x 47 xChile 12,280 16,160 1.5 3.4 6 1 4 5 3 198 0 15 12 58China 4,930 8,430 6.6 9.3 5 13 2 – 2 648 0 2 15 48Colombia 6,110 9,640 1.9 1.6 13 8 5 5 4 910 0 19 10 60Comoros 770 1,120 -0.1 x -0.8 4 46 x 2 8 – 68 13 – 8 x 68 xCongo 2,270 3,280 3.3 0.4 8 54 x – 6 1 1,314 15 – 13 53Cook Islands – – – – – – – – – 13 – – – –Costa Rica 7,660 11,950 e 0.7 2.6 12 3 7 6 – 96 0 7 12 56Côte d’Ivoire 1,100 1,730 -1.7 -0.6 5 24 1 5 2 848 4 – 16 48Croatia 13,850 19,330 – 2.8 24 0 7 4 2 149 0 – 20 42Cuba 5,460 x – 3.9 3.0 x 4 x – 11 14 3 129 – – – –Cyprus 29,450 x 30,910 x 5.9 x 2.0 3 – 2 8 2 – – – – –Czech Republic 18,520 24,190 – 2.7 5 – 6 5 1 – – – – –Democratic People’sRepublic of Korea a – – – – – – – – 79 – – – –Democratic Republicof the Congo 190 350 -2.2 -2.6 211 88 – 3 1 3,413 28 – 15 51Denmark 60,390 42,330 2.0 1.4 2 – 9 9 1 – – – – –Djibouti 1,270 x 2,450 x – -1.4 x 3 x 19 x 5 8 4 133 – 7 17 x 46 xDominica 7,090 12,460 e 5.2 x 2.2 3 – 4 4 – 32 9 7 – –Dominican Republic 5,240 9,490 e 2.1 3.9 11 2 2 2 1 177 0 7 13 53Ecuador 4,140 8,310 1.3 1.5 5 5 3 – 4 153 0 8 13 54Egypt 2,600 6,160 4.3 2.8 7 2 2 4 2 594 0 5 22 40El Salvador 3,480 6,690 e -1.9 2.4 4 9 4 4 1 284 1 12 13 53Equatorial Guinea 14,540 24,110 – 18.2 11 – 3 – – 85 1 – – –Eritrea 430 580 e – -0.8 x 13 x – 1 – – 161 8 – – –Estonia 15,200 21,270 – 5.5 x 6 x 1 x 5 6 2 – – – 18 x 43 xEthiopia 400 1,110 – 3.3 7 39 x 2 5 1 3,529 12 4 22 39Fiji 3,680 4,590 0.6 1.3 4 6 3 4 2 76 3 1 16 50Finland 48,420 37,990 2.9 2.5 2 – 7 7 2 – – – 24 x 37 x124THE STATE OF THE WORLD’S CHILDREN 2013: <strong>Children</strong> <strong>with</strong> <strong>Disabilities</strong>
TABLE 7ECONOmIC INdICATORSCountriesGNI per capita2011GDP per capitaaverage annualgrowth rate (%)Averageannual rateof inflation(%)Populationbelowinternationalpoverty lineof US$1.25per day (%)Public spending as a % of GDP(2007–2010*)allocated to:ODAinflow inmillionsUS$ODA inflowas a % ofrecipientGNIDebt serviceas a % ofexports ofgoods andservicesShare of householdincome(%, 2005–2011*)and areasUS$ PPP US$ 1970–1990 1990–2011 1990–2011 2006–2011* health education military 2010 2010 2010 poorest 40% richest 20%France 42,420 35,860 2.1 1.2 2 – 9 6 3 – – – – –Gabon 7,980 13,650 0.2 -0.7 6 5 x 1 – 1 104 1 – 16 48Gambia 610 2,060 0.6 0.9 6 34 x 3 4 – 121 16 5 13 x 53 xGeorgia 2,860 5,390 3.1 2.7 67 15 3 3 6 626 5 15 16 47Germany 43,980 40,170 2.3 1.3 1 – 8 5 1 – – – 22 x 37 xGhana 1,410 1,820 -2.0 2.5 26 29 3 5 0 1,694 6 3 15 49Greece 25,030 26,040 1.3 2.2 5 – 7 – 3 – – – 19 x 41 xGrenada 7,220 10,530 e 4.2 x 2.9 4 – 4 – – 34 6 12 – –Guatemala 2,870 4,800 e 0.2 1.3 7 14 2 3 0 398 1 10 10 60Guinea 440 1,050 – 2.9 8 43 1 2 – 214 5 5 17 46Guinea-Bissau 600 1,250 0.0 -1.2 17 49 x 2 – – 141 16 – 19 x 43 xGuyana 2,900 x 3,460 x, e -1.3 2.8 x 11 x – 7 3 – 153 6 2 – –Haiti 700 1,190 e – -1.0 x 15 x 62 x 1 – – 3,076 46 6 9 x 63 xHoly See – – – – – – – – – – – – – –Honduras 1,970 3,840 e 0.8 1.6 13 18 3 – 2 576 4 5 8 60Hungary 12,730 20,380 3.0 2.5 11 0 5 5 1 – – – 21 40Iceland 35,020 31,640 3.2 2.1 5 – 7 8 0 – – – – –India 1,410 3,620 2.0 4.9 6 33 1 – 3 2,807 0 5 21 42Indonesia 2,940 4,530 4.6 2.7 14 18 1 4 1 1,393 0 16 20 43Iran (Islamic Republic of) 4,520 x 11,400 x -2.3 2.7 x 22 x 2 x 2 5 2 122 – – 17 45Iraq 2,640 3,770 – -1.9 x 13 x 3 3 – 6 2,192 3 – 21 40Ireland 38,580 33,310 – 0.6 x 1 x – 7 6 1 – – – 20 x 42 xIsrael 28,930 27,290 1.9 1.8 5 – 4 6 6 – – – 16 x 45 xItaly 35,330 32,350 2.8 0.8 3 – 7 5 2 – – – 18 x 42 xJamaica 4,980 7,770 e -1.3 0.5 15 0 x 3 6 1 141 1 19 14 x 52 xJapan 45,180 35,510 3.4 0.7 -1 – 7 3 1 – – – – –Jordan 4,380 5,970 2.5 x 2.6 4 0 6 – 6 955 3 4 19 44Kazakhstan 8,220 11,310 – 4.1 54 0 3 4 1 222 0 70 22 38Kenya 820 1,720 1.2 0.4 9 43 x – 7 2 1,631 5 4 14 53Kiribati 2,110 3,480 e -5.3 1.1 3 – 10 – – 23 11 – – –Kuwait 48,900 x 53,820 x -6.7 x 1.4 x 6 x – 3 – 4 – – – – –Kyrgyzstan 920 2,290 – 0.7 35 6 3 6 4 373 8 14 18 43Lao People’s DemocraticRepublic 1,130 2,600 – 4.7 21 34 1 2 0 416 6 13 19 45Latvia 12,350 17,820 3.4 4.4 17 0 4 6 1 – – 74 18 44Lebanon 9,110 14,000 – 2.5 7 – 4 2 4 449 1 14 – –Lesotho 1,220 2,070 2.4 2.3 8 43 x 5 13 2 257 10 2 10 x 56 xLiberia 240 520 -4.0 5.5 30 84 4 3 0 1,423 177 1 18 45Libya 12,320 x 16,750 x, e – – – – 2 – 1 9 – – – –Liechtenstein 137,070 x – 2.2 3.0 x 1 x – – 2 – – – – – –Lithuania 12,280 19,690 – 3.6 20 0 5 6 2 – – 32 18 44Luxembourg 78,130 63,540 2.6 2.7 3 – 5 – 1 – – – 21 x 39 xMadagascar 430 950 -2.3 -0.3 13 81 3 3 1 473 5 – 15 50Malawi 340 870 0.0 1.3 25 74 x 4 – 1 1,027 21 – 18 x 47 xMalaysia 8,420 15,190 4.0 3.1 4 0 2 6 2 2 0 5 13 51Maldives 6,530 8,540 – 5.8 x 5 x – 5 9 – 111 8 20 17 x 44 xMali 610 1,050 0.1 2.1 5 50 3 4 2 1,093 12 – 20 41Malta 18,620 x 24,170 x 6.0 2.4 3 – 6 6 1 – – – – –Marshall Islands 3,910 – – 0.5 2 – 16 – – 91 49 – – –Mauritania 1,000 2,410 -1.1 1.3 8 23 2 4 3 373 10 – 16 47Mauritius 8,240 14,760 3.2 x 3.5 6 – 2 3 0 125 1 2 – –Mexico 9,240 15,120 1.7 1.3 12 1 3 5 1 473 0 8 13 54Micronesia(Federated States of) 2,900 3,610 e – 0.4 2 31 x 13 – – 125 41 – 7 x 64 xMonaco 183,150 x – 1.4 2.1 x 1 x – 3 1 – – – – – –Mongolia 2,320 4,360 – 3.3 24 – 4 5 1 304 5 4 18 44Montenegro 7,060 13,720 – 3.4 x 7 x 0 7 – 1 77 2 – 22 39Morocco 2,970 4,910 1.9 2.5 3 3 2 5 3 994 1 9 17 48Mozambique 470 980 -1.0 x 4.3 17 60 4 – 1 1,959 21 3 15 51Myanmar a – 1.6 7.4 x 24 x – 0 – – 358 – 8 – –Namibia 4,700 6,600 -2.1 x 1.9 9 32 x 4 6 3 259 2 – 8 x 69 xNauru – – – – – – – – – 28 – – – –Nepal 540 1,260 1.1 1.9 7 25 2 5 2 821 5 4 20 41Netherlands 49,730 43,770 1.6 1.9 2 – 8 6 2 – – – – –STATISTICAL TABLES 125
TABLE 7ECONOmIC INdICATORSCountriesGNI per capita2011GDP per capitaaverage annualgrowth rate (%)Averageannual rateof inflation(%)Populationbelowinternationalpoverty lineof US$1.25per day (%)Public spending as a % of GDP(2007–2010*)allocated to:ODAinflow inmillionsUS$ODA inflowas a % ofrecipientGNIDebt serviceas a % ofexports ofgoods andservicesShare of householdincome(%, 2005–2011*)and areasUS$ PPP US$ 1970–1990 1990–2011 1990–2011 2006–2011* health education military 2010 2010 2010 poorest 40% richest 20%New Zealand 29,350 x 29,140 x 1.1 x 1.8 x 2 x – 8 6 1 – – – – –Nicaragua 1,170 2,840 e -3.7 1.9 17 12 x 5 – 1 628 10 11 16 47Niger 360 720 -2.0 -0.2 4 44 3 4 1 749 14 – 20 43Nigeria 1,200 2,300 -1.3 2.1 20 68 2 – 1 2,069 1 0 13 54Niue – – – – – – – – – 15 – – – –Norway 88,890 58,090 3.2 2.0 4 – 8 7 2 – – – 24 x 37 xOman 19,260 x 25,770 x 3.1 2.7 5 – 2 4 10 -40 – – – –Pakistan 1,120 2,880 2.6 1.9 10 21 1 3 3 3,021 2 10 23 40Palau 7,250 12,330 e – -0.1 x 3 x – 9 – – 26 20 – – –Panama 7,910 14,740 e 0.3 3.4 2 7 5 4 – 129 1 5 11 56Papua New Guinea 1,480 2,590 e -1.0 0.1 8 – 2 – 0 513 6 13 – –Paraguay 2,970 5,310 3.1 0.3 10 7 3 4 1 105 1 4 11 56Peru 5,500 10,160 -0.6 3.2 10 5 3 3 1 -254 0 15 12 53Philippines 2,210 4,160 0.5 1.9 7 18 1 3 1 535 0 15 15 50Poland 12,480 20,450 – 4.4 10 0 5 6 2 – – – 20 42Portugal 21,250 24,530 2.5 1.5 4 – 8 6 2 – – – – –Qatar 80,440 87,030 – 0.8 x 11 x – 2 2 2 – – – – –Republic of Korea 20,870 30,290 6.2 4.1 4 – 4 5 3 – – – – –Republic of Moldova 1,980 3,670 1.8 x -0.1 38 0 6 10 0 468 7 9 20 41Romania 7,910 15,140 0.9 x 2.8 44 0 4 4 2 – – 29 21 38Russian Federation 10,400 20,050 – 2.3 52 0 3 4 4 – – 13 17 47Rwanda 570 1,240 1.2 2.3 9 63 5 4 1 1,034 19 2 13 57Saint Kitts and Nevis 12,480 14,490 e 6.3 x 1.6 5 – 4 4 – 11 2 17 – –Saint Lucia 6,680 9,080 e 5.3 x 0.7 3 – 5 4 – 41 5 6 – –Saint Vincentand the Grenadines 6,100 10,560 e 3.3 3.2 4 – 3 5 – 17 3 14 – –Samoa 3,190 4,430 e – 2.8 6 – 5 5 – 147 27 3 – –San Marino 50,400 x – 1.7 3.2 x 3 x – 6 – – – – – – –Sao Tome and Principe 1,360 2,080 – – – 28 x 3 – – – – 5 14 x 56 xSaudi Arabia 17,820 24,870 -1.4 0.2 5 – 2 6 8 – – – – –Senegal 1,070 1,960 -0.5 1.1 4 34 x 3 6 2 931 7 – 17 46Serbia 5,680 11,640 – 1.4 23 x 0 6 5 2 651 2 24 23 37Seychelles 11,130 25,320 e 2.9 2.0 6 0 3 – 1 56 7 4 9 70Sierra Leone 340 850 -0.5 1.1 16 53 x 1 4 2 475 25 2 16 x 49 xSingapore 42,930 59,790 5.9 3.5 1 – 2 4 5 – – – – –Slovakia 16,070 22,610 – 3.7 6 0 6 5 1 – – – 24 36Slovenia 23,610 27,110 – 3.2 12 0 x 6 6 2 – – – 21 x 39 xSolomon Islands 1,110 2,360 e – -0.9 7 – 5 7 – 340 61 6 – –Somalia a – -0.8 – – – – – – 499 – – – –South Africa 6,960 10,790 0.1 1.3 8 14 3 5 1 1,032 0 5 7 68South Sudan s b – – – – – – – – – – – – –Spain 30,990 31,930 1.9 1.9 4 – 7 5 1 – – – 19 x 42 xSri Lanka 2,580 5,560 3.0 4.1 10 7 2 3 4 581 1 9 17 48State of Palestine b – – -2.4 x 4 x 0 – – – 2,519 – – 19 43Sudan s – – – – – – – – – – – – – –Suriname 7,640 x 7,710 x, e -2.2 x 1.7 x 46 x – 4 – – 104 – – – –Swaziland 3,300 5,970 3.1 1.8 9 41 4 8 3 92 3 2 11 57Sweden 53,230 42,350 1.8 2.2 2 – 8 7 1 – – – 23 x 37 xSwitzerland 76,380 50,900 1.7 x 0.9 1 – 6 5 1 – – – 20 x 41 xSyrian Arab Republic 2,750 x 5,090 x 2.2 1.8 x 7 x 2 x 1 5 4 137 0 3 19 x 44 xTajikistan 870 2,310 – 0.2 73 7 2 5 – 430 8 18 21 39Thailand 4,420 8,390 4.7 2.8 3 0 3 4 2 -11 0 5 17 47The former YugoslavRepublic of Macedonia 4,730 11,490 – 1.2 22 0 5 – 2 178 2 12 15 49Timor-Leste 2,730 x 5,210 x, e – 1.9 x 7 x 37 9 16 5 292 11 – 21 41Togo 560 1,030 -0.3 -0.1 4 39 1 3 2 421 15 – 19 42Tonga 3,580 4,690 e – 1.5 6 – 5 – – 70 19 – – –Trinidad and Tobago 15,040 24,940 e 0.5 4.8 5 – 3 – – 4 0 – – –Tunisia 4,070 9,090 2.5 3.3 4 1 x 3 6 1 551 1 9 16 48Turkey 10,410 16,730 2.0 2.4 44 0 5 – 3 1,049 0 33 17 45Turkmenistan 4,110 8,350 e – 5.8 86 – 1 – – 43 0 – – –Tuvalu 5,010 – – 2.1 3 – 10 – – 13 35 – – –Uganda 510 1,320 – 3.7 7 38 2 3 2 1,730 10 1 15 51126THE STATE OF THE WORLD’S CHILDREN 2013: <strong>Children</strong> <strong>with</strong> <strong>Disabilities</strong>
TABLE 7ECONOmIC INdICATORSCountriesGNI per capita2011GDP per capitaaverage annualgrowth rate (%)Averageannual rateof inflation(%)Populationbelowinternationalpoverty lineof US$1.25per day (%)Public spending as a % of GDP(2007–2010*)allocated to:ODAinflow inmillionsUS$ODA inflowas a % ofrecipientGNIDebt serviceas a % ofexports ofgoods andservicesShare of householdincome(%, 2005–2011*)and areasUS$ PPP US$ 1970–1990 1990–2011 1990–2011 2006–2011* health education military 2010 2010 2010 poorest 40% richest 20%Ukraine 3,120 7,080 – 0.6 67 0 4 5 3 624 0 39 24 36United Arab Emirates 40,760 48,220 e -4.3 x -1.9 5 – 2 1 6 – – – – –United Kingdom 37,780 36,970 2.1 2.4 2 – 8 6 3 – – – – –United Republicof Tanzania 540 1,510 – 2.5 13 68 3 7 1 2,961 13 3 18 45United States 48,450 48,890 2.1 1.7 2 – 8 5 5 – – – 16 x 46 xUruguay 11,860 14,740 0.9 2.1 15 0 5 – 2 49 0 12 14 51Uzbekistan 1,510 3,440 e – 2.5 78 – 2 – – 229 1 – 19 x 44 xVanuatu 2,870 4,500 e 1.2 x 0.6 3 – 3 5 – 108 15 – – –Venezuela (BolivarianRepublic of) 11,920 12,620 -1.7 0.4 32 7 3 4 1 53 0 8 14 49Viet Nam 1,260 3,260 – 6.0 10 17 3 5 2 2,945 3 2 19 43Yemen 1,070 2,180 – 1.1 15 18 x 2 5 4 666 – 2 18 45Zambia 1,160 1,490 -2.3 0.8 28 69 4 1 2 913 6 1 10 59Zimbabwe 640 – -0.4 -3.0 1 – – 2 1 738 11 – – –MEMORANDUMSudan and South Sudan s 1,300 x 2,020 x 0.1 3.4 26 20 2 – – 2,055 4 4 18 42SUMMARY INDICATORS #Sub-Saharan Africa 1,269 2,269 0.0 2.0 29 53 3 5 1 40,604 4 3 15 50Eastern andSouthern Africa 1,621 2,868 0.3 1.9 34 51 3 5 1 19,572 3 4 16 50West and Central Africa 937 1,721 -0.5 2.0 21 59 – – – 18,844 5 1 15 50Middle East andNorth Africa 6,234 9,655 -0.1 0.8 7 – 2 4 5 11,535 1 5 19 43South Asia 1,319 3,366 2.0 4.5 6 32 – – – 15,263 1 5 21 42East Asia and Pacific 4,853 8,185 5.6 7.5 5 14 2 ** 4 ** 2 ** 9,289 0 4 16 47Latin Americaand Caribbean 8,595 11,759 1.4 1.7 28 5 4 5 1 9,272 0 13 12 56CEE/CIS 7,678 14,216 – 2.5 51 0 3 4 3 6,582 0 23 19 43Least developed countries 695 1,484 -0.1 3.1 45 51 2 4 2 44,538 8 4 19 45World 9,513 11,580 2.4 2.6 8 22 6 ** 5 ** 3 ** 90,358 0 9 17 46s Due to the cession in July 2011 of the Republic of South Sudan by the Republic of the Sudan, and its subsequent admission to the United Nations on 14 July 2011, disaggregated data for the Sudanand South Sudan as separate States are not yet available for all indicators. Aggregated data presented are for the Sudan pre-cession (see Memorandum item).# For a complete list of countries and areas in the regions, subregions and country categories, see page 98.DEFINITIONS OF THE INDICATORSGNI per capita – Gross national income (GNI) is the sum of value added by all resident producers,plus any product taxes (less subsidies) not included in the valuation of output, plus net receipts ofprimary income (compensation of employees and property income) from abroad. GNI per capita isGNI divided by midyear population. GNI per capita in US dollars is converted using the World BankAtlas method.GNI per capita (PPP US$) – GNI per capita converted to international dollars, taking intoaccount differences in price levels (purchasing power) between countries. Based on data from theInternational Comparison Programme (ICP).GDP per capita – Gross domestic product (GDP) is the sum of value added by all residentproducers; plus any product taxes (less subsidies) not included in the valuation of output. GDP percapita is GDP divided by midyear population. Growth is calculated from constant price GDP data inlocal currency.Population below international poverty line of US$1.25 per day – Percentage of thepopulation living on less than US$1.25 per day at 2005 prices, adjusted for purchasing power parity(PPP). The new poverty threshold reflects revisions to PPP exchange rates based on the results ofthe 2005 ICP. The revisions reveal that the cost of living is higher across the developing world thanpreviously estimated. As a result of these revisions, poverty rates for individual countries cannotbe compared <strong>with</strong> poverty rates reported in previous editions. More detailed information on thedefinition, methodology and sources of the data presented is available at .ODA – Net official development assistance.Debt service – Sum of interest payments and repayments of principal on external public andpublicly guaranteed long-term debts.Share of household income – Percentage of income received by the 20 per cent of households<strong>with</strong> the highest income and by the 40 per cent of households <strong>with</strong> the lowest income.MAIN DATA SOURCESGNI per capita – The World Bank.GDP per capita – The World Bank.Rate of inflation – The World Bank.Population below international poverty line of US$1.25 per day – The World Bank.Spending on health, education and military – The World Bank.ODA – Organisation for Economic Co-operation and Development.Debt service – The World Bank.Share of household income – The World Bank.NOTESa low-income country (GNI per capita is $1,025 or less).b lower-middle-income country (GNI per capita is $1,026 to $4,035).c upper-middle-income country (GNI per capita is $4,036 to $12,475).d high-income country (GNI per capita is $12,476 or more).– Data not available.x Data refer to years or periods other than those specified in the column heading. Such dataare not included in the calculation of regional and global averages.e Estimate is based on regression; other PPP figures are extrapolated from the 2005 ICPbenchmark estimates.* Data refer to the most recent year available during the period specified in the columnheading.** Excludes China.STATISTICAL TABLES 127
TABLE 8: WOmENCountriesand areasLife Adult literacyexpectancy: rate: femalesfemales as a as a % of% of males males2011 2007–2011*Enrolment ratios: females Survival rateas a % of males 2008–2011* to last gradeof primary:PrimaryGERSecondaryGERfemales as a% of males2008–2011*Contraceptiveprevalence(%)2007–2012*Antenatal care (%)2007–2012*Delivery care (%)2007–2012* Maternal mortality ratio †2007–2011* 2010Afghanistan 101 – 69 51 – 21 48 15 39 33 4 330 460 32Albania 108 97 99 98 100 69 97 67 99 97 19 21 27 2,200Algeria 104 79 x 94 102 104 61 x 89 x – 95 x 95 x – – 97 430Andorra – – 101 105 – – – – – – – – – –Angola 106 70 81 69 73 6 x 80 – 47 46 – – 450 39Antigua and Barbuda – 101 92 101 – – 100 – 100 – – 0 – –Argentina 110 100 99 112 101 78 x 99 x 89 x 95 99 – 44 77 560Armenia 109 100 102 102 – 55 99 93 100 99 13 9 30 1,700Australia 106 – 99 95 – 71 x 98 92 – 99 31 – 7 8,100Austria 107 – 99 96 103 – – – – – 24 – 4 18,200Azerbaijan 109 100 99 98 102 51 x 77 x 45 x 88 x 78 x 5 x 24 43 1,000Bahamas 109 – 102 105 96 45 x 98 – 99 – – 0 47 1,100Bahrain 102 97 – – – – 100 – 97 – – – 20 1,800Bangladesh 102 85 – 113 114 61 55 26 32 29 17 220 240 170Barbados 109 – 102 109 – – 100 – 100 – – 0 x 51 1,300Belarus 118 100 100 – – 73 x 99 x – 100 100 x 22 1 4 16,300Belgium 107 – 100 97 103 75 x – – – – 18 – 8 7,500Belize 104 – 91 – 103 34 x 94 x – 94 89 – 55 53 610Benin 107 55 87 – – 13 86 61 x 84 87 4 x 400 x 350 53Bhutan 106 59 x 102 101 105 66 97 77 65 63 12 260 x 180 210Bolivia (PlurinationalState of) 107 91 99 99 – 61 86 72 71 68 19 310 190 140Bosnia and Herzegovina 107 97 102 103 99 36 x 99 x – 100 x 100 x – 3 8 11,400Botswana 96 101 96 106 104 53 94 73 95 99 – 160 160 220Brazil 110 100 – – – 81 x 98 91 97 x 98 50 75 56 910Brunei Darussalam 106 97 101 103 100 – 99 – 100 100 – – 24 1,900Bulgaria 110 99 100 95 99 – – – 100 93 31 8 11 5,900Burkina Faso 104 59 91 76 109 16 94 34 66 66 2 340 300 55Burundi 106 85 99 72 118 22 99 33 60 60 4 500 800 31Cambodia 105 80 95 90 – 51 89 59 71 54 3 210 250 150Cameroon 104 80 86 83 98 23 85 – 64 61 2 x 670 x 690 31Canada 106 – 100 98 – 74 x 100 99 100 99 26 – 12 5,200Cape Verde 111 89 92 120 – 61 x 98 x 72 x 78 x 76 11 x 54 79 480Central African Republic 107 62 71 58 90 15 68 38 54 53 5 540 x 890 26Chad 106 54 73 42 96 5 53 23 23 16 2 1,100 x 1,100 15Chile 108 100 95 103 – 58 x – – 100 100 – 20 25 2,200China 105 94 103 104 – 85 x 94 – 100 98 27 30 37 1,700Colombia 110 100 98 110 101 79 97 89 99 99 43 63 92 430Comoros 105 87 92 – – 26 x 75 x – 62 x – – 380 x 280 67Congo 105 – 95 – – 45 93 – 94 92 3 x 780 x 560 39Cook Islands – – 102 110 – 29 100 – 100 100 – 0 – –Costa Rica 106 100 99 106 103 82 90 86 99 99 21 y 23 40 1,300Côte d’Ivoire 104 72 83 – 96 18 91 – 59 57 6 x 540 x 400 53Croatia 110 99 100 107 101 – – – 100 – 19 9 17 4,100Cuba 105 100 98 99 102 74 100 100 100 100 – 41 73 1,000Cyprus 106 98 99 100 – – 99 – – 100 – – 10 6,300Czech Republic 108 – 99 101 100 – – – 100 – 20 2 5 12,100Democratic People’sRepublic of Korea 110 100 – – – 69 x 100 94 100 95 13 77 81 670Democratic Republicof the Congo 107 74 87 58 88 17 89 45 80 75 7 550 540 30Denmark 106 – 100 102 100 – – – – – 21 – 12 4,500Djibouti 105 – 90 80 101 23 92 x – 93 x 87 x 12 550 x 200 140Dominica – – 98 109 105 – 100 – 100 – – 0 – –Dominican Republic 108 100 88 112 – 73 99 95 98 98 42 160 150 240Ecuador 108 97 101 103 – 73 x 84 x 58 x, y 98 x 85 x 26 x 61 110 350Egypt 105 79 96 96 – 60 74 66 79 72 28 55 66 490El Salvador 114 94 95 101 101 73 94 78 y 96 85 25 56 81 490Equatorial Guinea 105 93 97 – 108 10 x 86 x – 65 x – – – 240 88Eritrea 108 73 84 76 94 8 x 70 x 41 x 28 x 26 x 3 x – 240 86Estonia 115 100 99 102 100 – – – 100 x – – 7 x 2 25,100Ethiopia 106 59 91 82 100 29 43 19 10 10 2 680 350 67Fiji 108 – 98 109 95 32 100 – 100 – – 23 26 1,400Finland 108 – 99 105 100 – 100 x – – 100 16 – 5 12,200At leastone visitAt leastfour visitsSkilledattendantat birthInstitutionaldeliveryC-sectionReportedAdjustedLifetime risk ofmaternal death(1 in:)128THE STATE OF THE WORLD’S CHILDREN 2013: <strong>Children</strong> <strong>with</strong> <strong>Disabilities</strong>
TABLE 8WOmENCountriesand areasLife Adult literacyexpectancy: rate: femalesfemales as a as a % of% of males males2011 2007–2011*Enrolment ratios: females Survival rateas a % of males 2008–2011* to last gradeof primary:PrimaryGERSecondaryGERfemales as a% of males2008–2011*Contraceptiveprevalence(%)2007–2012*Antenatal care (%)2007–2012*Delivery care (%)2007–2012* Maternal mortality ratio †2007–2011* 2010France 108 – 99 101 – 71 x 100 x – – – 21 – 8 6,200Gabon 103 92 97 – – 33 x 94 x 63 x 86 x 85 x 6 x 520 x 230 130Gambia 104 67 102 95 94 13 98 72 57 56 3 730 x 360 56Georgia 110 100 103 – 105 53 98 90 100 98 24 19 67 960Germany 106 – 100 95 101 – 100 x – – – 29 – 7 10,600Ghana 103 84 100 91 91 34 96 87 68 67 11 450 350 68Greece 106 98 – – – 76 x – – – – – – 3 25,500Grenada 104 – 100 103 – 54 x 100 – 99 – – 0 24 1,700Guatemala 111 87 96 93 – 54 93 – 52 51 16 140 120 190Guinea 106 58 84 59 76 9 x 88 50 46 39 2 980 x 610 30Guinea-Bissau 107 60 94 – – 14 93 70 44 42 – 410 x 790 25Guyana 109 – 104 111 96 43 92 79 92 89 13 86 280 150Haiti 104 84 x – – – 32 x 85 x 54 x 26 x 25 x 3 x 630 x 350 83Holy See – – – – – – – – – – – – – –Honduras 107 100 100 123 – 65 x 92 x 81 x 67 x 67 x 13 x – 100 270Hungary 111 100 99 99 100 – – – 100 – 31 19 21 3,300Iceland 104 – 100 103 – – – – – – 17 – 5 8,900India 105 68 x 100 92 – 55 74 x 37 x 52 47 9 x 210 200 170Indonesia 105 94 102 100 – 61 93 82 79 55 15 230 220 210Iran (Islamic Republic of) 105 90 101 86 100 79 x 98 x 94 x 97 x 96 x 40 x 25 x 21 2,400Iraq 110 82 – – – 50 x 84 x – 80 65 21 x 84 x 63 310Ireland 106 – 100 105 – 65 x 100 x – 100 x 100 25 – 6 8,100Israel 106 – 101 102 98 – – – – – – – 7 5,100Italy 107 99 99 99 100 – 99 x 68 x – 99 x 40 – 4 20,300Jamaica 107 112 95 103 102 72 99 87 98 97 15 95 x 110 370Japan 109 – 100 100 100 54 x – – – 100 x – – 5 13,100Jordan 104 93 100 106 – 59 99 94 99 99 19 19 63 470Kazakhstan 118 100 100 97 100 51 x 100 x – 100 100 x – 17 51 770Kenya 104 93 98 90 – 46 92 47 44 43 6 490 360 55Kiribati – – 104 111 – 22 88 71 80 66 10 0 – –Kuwait 102 97 103 107 100 – 100 – 100 – – – 14 2,900Kyrgyzstan 113 99 99 99 99 48 x 97 x – 99 97 x – 64 71 480Lao People’sDemocratic Republic 104 77 x 93 83 – 38 x 35 x – 20 x 17 x 2 410 x 470 74Latvia 115 100 99 98 100 – 92 x – 100 x – – 32 34 2,000Lebanon 106 92 97 112 103 54 96 x – 98 x – – – 25 2,100Lesotho 97 115 98 138 124 47 92 70 62 59 7 1,200 620 53Liberia 104 88 91 – – 11 79 66 46 37 4 990 770 24Libya 107 86 – – – – 93 – 100 – – – 58 620Liechtenstein – – 94 103 96 – – – – – – – – –Lithuania 117 100 99 98 100 – 100 x – 100 x – – 9 8 9,400Luxembourg 107 – 101 102 – – – – 100 x 100 x 29 – 20 3,200Madagascar 105 91 98 94 105 40 86 49 44 35 2 500 240 81Malawi 100 84 104 91 103 46 95 46 71 73 5 680 460 36Malaysia 106 95 – 107 100 – 91 – 99 99 – 30 29 1,300Maldives 103 100 x 96 – – 35 99 85 95 95 32 140 x 60 870Mali 104 47 87 70 95 8 x 70 x 35 x 49 x 45 x 2 x 460 x 540 28Malta 106 103 x 101 89 91 – 100 x – – 100 – – 8 8,900Marshall Islands – – 99 103 91 45 81 77 99 85 9 140 – –Mauritania 106 79 105 85 99 9 75 16 x 61 48 3 x 690 510 44Mauritius 109 95 101 100 99 76 x – – 98 x 98 x – 22 x 60 1,000Mexico 106 97 99 107 102 73 96 86 95 80 43 52 50 790Micronesia(Federated States of) 103 – – – – 55 80 – 100 – – 0 100 290Monaco – – – – – – – – – – – – – –Mongolia 112 101 98 107 102 55 99 – 99 99 21 47 63 600Montenegro 107 98 98 101 – 39 x 97 x – 100 100 – 13 8 7,400Morocco 107 64 94 – 100 67 77 – 74 73 16 130 100 400Mozambique 104 61 90 82 94 12 92 – 55 58 2 x 500 490 43Myanmar 105 95 100 106 107 46 83 – 71 36 – 320 x 200 250Namibia 102 99 99 – 107 55 95 70 81 81 13 450 200 160Nauru – – 106 120 – 36 95 40 97 99 8 300 x – –Nepal 103 66 – – – 50 58 50 36 35 5 280 x 170 190Netherlands 105 – 99 99 – 69 – – – 100 14 – 6 10,500At leastone visitAt leastfour visitsSkilledattendantat birthInstitutionaldeliveryC-sectionReportedAdjustedLifetime risk ofmaternal death(1 in:)STATISTICAL TABLES 129
TABLE 8WOmENCountriesand areasLife Adult literacyexpectancy: rate: femalesfemales as a as a % of% of males males2011 2007–2011*Enrolment ratios: females Survival rateas a % of males 2008–2011* to last gradeof primary:PrimaryGERSecondaryGERfemales as a% of males2008–2011*Contraceptiveprevalence(%)2007–2012*Antenatal care (%)2007–2012*Delivery care (%)2007–2012* Maternal mortality ratio †2007–2011* 2010New Zealand 105 – 100 105 – – – – – – 23 – 15 3,300Nicaragua 109 100 x 98 110 – 72 90 78 74 74 20 63 95 350Niger 102 35 x 82 66 94 18 46 x 15 x 18 x 17 x 1 x 650 x 590 23Nigeria 103 70 91 88 107 15 58 45 39 35 2 550 630 29Niue – – – – – 23 x 100 – 100 – – 0 x – –Norway 106 – 100 98 100 88 x – – – – 16 – 7 7,900Oman 107 90 97 99 – 24 99 96 99 99 14 26 32 1,200Pakistan 103 59 82 76 92 27 61 28 43 41 7 280 260 110Palau – – – – – 22 90 81 100 100 – 0 – –Panama 107 99 97 107 100 52 96 – 89 88 – 60 92 410Papua New Guinea 107 90 89 – – 32 x 79 x 55 x 53 x 52 x – 730 x 230 110Paraguay 106 98 97 105 106 79 96 91 82 – 33 100 99 310Peru 107 89 100 98 101 75 95 94 85 85 23 93 67 570Philippines 110 101 98 108 111 51 91 78 62 44 10 160 x 99 300Poland 112 100 99 99 100 – – – 100 x – 21 2 5 14,400Portugal 108 97 97 104 – 67 x 100 x – 100 x – 31 – 8 9,200Qatar 99 99 100 121 – – 100 – 100 – – – 7 5,400Republic of Korea 109 – 99 99 100 80 – – – – 32 – 16 4,800Republic of Moldova 111 99 100 102 104 68 x 98 x 89 x 100 99 9 x 15 41 1,500Romania 110 99 99 99 100 70 x 94 x 76 x 99 98 x 19 x 21 27 2,600Russian Federation 119 100 100 98 – 80 – – 100 – – 17 34 2,000Rwanda 105 90 102 102 – 52 98 35 69 69 7 480 340 54Saint Kitts and Nevis – – 100 99 90 54 100 – 100 – – 0 – –Saint Lucia 108 – 96 99 97 – 99 – 100 – – 0 x 35 1,400Saint Vincentand the Grenadines 106 – 93 102 – 48 x 100 – 99 – – 0 x 48 940Samoa 109 100 102 114 – 29 93 58 81 81 13 29 x 100 260San Marino – – 113 102 – – – – – – – – – –Sao Tome and Principe 105 90 100 103 121 38 98 72 82 79 5 160 70 330Saudi Arabia 103 90 99 95 – 24 97 – 97 – – – 24 1,400Senegal 104 63 106 88 105 13 93 50 65 73 6 390 370 54Serbia 106 97 99 102 100 61 99 94 100 100 25 9 12 4,900Seychelles – 101 100 109 – – – – – – – 57 x – –Sierra Leone 103 59 93 – – 11 93 75 63 50 5 860 890 23Singapore 106 96 – – 100 – – – – 100 x – – 3 25,300Slovakia 111 – 99 101 100 – 97 x – 100 – 24 10 6 12,200Slovenia 109 100 99 100 100 – 100 x – 100 – – 10 12 5,900Solomon Islands 104 – – – – 35 74 65 86 85 6 150 93 240Somalia 106 – – – – 15 x 26 x 6 x 33 x 9 x – 1,000 x 1,000 16South Africa 102 96 96 105 – 60 x 97 87 91 x 89 x 21 x 400 x 300 140South Sudan s – – – – – 4 40 17 19 12 1 2,100 x – –Spain 108 98 99 102 101 66 x – – – – 26 – 6 12,000Sri Lanka 109 97 100 – – 68 99 93 99 98 24 39 x 35 1,200State of Palestine 105 94 98 108 – 50 x 99 x – 99 x 97 x 15 x – 64 330Sudan s – – – – – 9 56 47 23 21 7 94 x – –Suriname 110 99 95 123 122 46 x 90 x – 90 x 88 x – 180 130 320Swaziland 98 99 92 100 107 65 97 77 82 80 12 590 x 320 95Sweden 105 – 99 99 100 – 100 x – – – – – 4 14,100Switzerland 106 – 100 97 – – – – – – 30 – 8 9,500Syrian Arab Republic 104 86 98 100 101 54 88 64 96 78 26 65 x 70 460Tajikistan 110 100 96 87 101 37 89 49 88 88 – 45 65 430Thailand 109 96 x 99 108 – 80 99 80 100 99 24 12 x 48 1,400The former YugoslavRepublic of Macedonia 106 97 101 99 – 40 99 94 98 98 25 4 10 6,300Timor-Leste 103 83 96 101 111 22 84 55 29 22 2 560 300 55Togo 106 61 90 – 123 15 72 55 59 67 9 – 300 80Tonga 108 100 x – – – 32 98 – 98 98 – 36 110 230Trinidad and Tobago 110 99 97 107 106 43 x 96 x – 98 x 97 x – – 46 1,300Tunisia 106 82 96 106 102 60 x 96 x 68 x 95 x 89 x 21 x – 56 860Turkey 106 89 98 91 103 73 92 74 91 90 37 29 x 20 2,200Turkmenistan 114 100 – – – 48 x 99 x 83 x 100 x 98 x 3 x 12 67 590Tuvalu – – – – – 31 97 67 98 93 7 0 x – –Uganda 103 78 101 85 101 30 93 48 57 57 5 440 310 49Ukraine 118 100 101 98 101 67 99 75 99 99 10 16 32 2,200At leastone visitAt leastfour visitsSkilledattendantat birthInstitutionaldeliveryC-sectionReportedAdjustedLifetime risk ofmaternal death(1 in:)130THE STATE OF THE WORLD’S CHILDREN 2013: <strong>Children</strong> <strong>with</strong> <strong>Disabilities</strong>
TABLE 8WOmENCountriesand areasLife Adult literacyexpectancy: rate: femalesfemales as a as a % of% of males males2011 2007–2011*Enrolment ratios: females Survival rateas a % of males 2008–2011* to last gradeof primary:PrimaryGERSecondaryGERfemales as a% of males2008–2011*Contraceptiveprevalence(%)2007–2012*Antenatal care (%)2007–2012*United Arab Emirates 103 102 x – – – – 100 – 100 100 – 0 12 4,000United Kingdom 105 – 100 102 – 84 – – – – 26 – 12 4,600United Republicof Tanzania 103 85 102 – 113 34 88 43 49 50 5 450 460 38United States 107 – 99 101 89 79 – – – – 31 13 21 2,400Uruguay 110 101 97 – 104 78 x 96 90 100 – 34 34 29 1,600Uzbekistan 110 100 97 99 101 65 x 99 x – 100 x 97 x – 21 28 1,400Vanuatu 106 96 95 102 94 38 84 – 74 80 – 86 110 230Venezuela(Bolivarian Republic of) 108 100 97 110 105 – 94 x – 95 x 95 x – 63 92 410Viet Nam 105 96 94 109 – 78 94 60 93 92 20 69 59 870Yemen 105 58 82 62 – 28 x 47 x 14 x 36 x 24 x 9 x 370 x 200 90Zambia 102 77 101 – 95 41 94 60 47 48 3 590 440 37Zimbabwe 97 – – – – 59 90 65 66 65 5 960 570 52MEMORANDUMSudan and South Sudan s 106 – – – – – – – – – – – 730 31At leastone visitAt leastfour visitsSkilledattendantat birthDelivery care (%)2007–2012* Maternal mortality ratio †2007–2011* 2010InstitutionaldeliveryC-sectionReportedAdjustedLifetime risk ofmaternal death(1 in:)SUMMARY INDICATORS #Sub-Saharan Africa 104 76 93 82 101 24 77 46 49 47 4 – 500 39Eastern andSouthern Africa 104 82 96 89 103 34 81 44 44 43 4 – 410 52West and Central Africa 104 70 89 76 100 17 74 47 55 52 4 – 570 32Middle East andNorth Africa 105 82 94 92 – 48 77 – 73 62 – – 170 190South Asia 104 69 98 91 – 52 70 35 49 44 9 – 220 150East Asia and Pacific 105 94 102 104 – 64 ** 93 77 ** 92 84 23 – 82 680Latin Americaand Caribbean 109 98 97 108 102 – 96 89 90 89 40 – 81 520CEE/CIS 113 98 99 97 101 73 – – 97 – – – 32 1,700Least developed countries 104 76 94 84 102 35 74 38 48 44 6 – 430 52World 106 90 97 97 100 ** 55 ** 81 50 ** 66 61 16 – 210 180s Due to the cession in July 2011 of the Republic of South Sudan by the Republic of the Sudan, and its subsequent admission to the United Nations on 14 July 2011, disaggregated data for the Sudan and South Sudan as separateStates are not yet available for all indicators. Aggregated data presented are for the Sudan pre-cession (see Memorandum item).# For a complete list of countries and areas in the regions, subregions and country categories, see page 98.DEFINITIONS OF THE INDICATORSLife expectancy – Number of years newborn children would live if subject to the mortalityrisks prevailing for the cross section of population at the time of their birth.Adult literacy rate – The number of persons aged 15 years and over who can both readand write <strong>with</strong> understanding a short, simple statement about everyday life, expressedas a percentage of the total population in that age group.Primary gross enrolment ratio (GER) – Total enrolment in primary school, regardlessof age, expressed as a percentage of the official primary-school-aged population.Secondary gross enrolment ratio (GER) – Total enrolment in secondary school,regardless of age, expressed as a percentage of the official secondary-school-agedpopulation.Survival rate to last grade of primary – Percentage of children entering the firstgrade of primary school who eventually reach the last grade (administrative data).Contraceptive prevalence – Percentage of women (aged 15–49) in union currentlyusing any contraceptive method.Antenatal care – Percentage of women (aged 15–49) attended at least once duringpregnancy by skilled health personnel (doctor, nurse or midwife) and the percentageattended by any provider at least four times.Skilled attendant at birth – Percentage of births attended by skilled heath personnel(doctor, nurse or midwife).Institutional delivery – Percentage of women (aged 15–49) who gave birth in ahealth facility.C-section – Percentage of births delivered by Caesarian section. (C-section ratesbetween 5 and 15 per cent are expected given adequate levels of emergencyobstetric care.)Maternal mortality ratio – Number of deaths of women from pregnancy-relatedcauses per 100,000 live births during the same time period. The ‘reported’ column showscountry-reported figures that are not adjusted for under-reporting or misclassification.For the ‘adjusted’ column, see note at right (†). Maternal mortality ratio values have beenrounded according to the following scheme: 1,000, rounded to nearest 100.Lifetime risk of maternal death – Lifetime risk of maternal death takes into accountboth the probability of becoming pregnant and the probability of dying as a result ofpregnancy, accumulated across a woman’s reproductive years.MAIN DATA SOURCESLife expectancy – United Nations Population Division.Adult literacy – UNESCO Institute for Statistics (UIS).Primary and secondary school enrolment – UIS.Survival rate to last primary grade – UIS. Regional and global averages calculated by UNICEF.Contraceptive prevalence rate – Demographic and Health Surveys (DHS), Multiple Indicator Cluster Surveys (MICS) and othernationally representative sources; United Nations Population Division.Antenatal care – DHS, MICS and other nationally representative sources.Skilled attendant at birth – DHS, MICS and other nationally representative sources.Institutional delivery – DHS, MICS and other nationally representative sources.C-section – DHS, MICS and other nationally representative sources.Maternal mortality ratio (reported) – Nationally representative sources, including household surveys and vital registration.Maternal mortality ratio (adjusted) – United Nations Maternal Mortality Estimation Inter-agency Group (WHO, UNICEF, UNFPA and theWorld Bank).Lifetime risk of maternal death – United Nations Maternal Mortality Estimation Inter-agency Group (WHO, UNICEF, UNFPA and theWorld Bank).NOTES− Data not available.x Data refer to years or periods other than those specified in the column heading. Such data are not included in the calculation of regionaland global averages, <strong>with</strong> the exception of 2005–2006 data from India. Estimates from data years prior to 2000 are notdisplayed.* Data refer to the most recent year available during the period specified in the column heading.** Excludes China.† The maternal mortality data in the column headed ‘reported’ refer to data reported by national authorities. The data in the columnheaded ‘adjusted’ refer to the 2010 United Nations inter-agency maternal mortality estimates that were released in May 2012. Periodically,the United Nations Maternal Mortality Estimation Inter-agency Group (WHO, UNICEF, UNFPA and the World Bank) producesinternationally comparable sets of maternal mortality data that account for the well-documented problems of under-reporting andmisclassification of maternal deaths, and that also include estimates for countries <strong>with</strong> no data. Please note that these values are notcomparable <strong>with</strong> previously reported maternal mortality ratio ‘adjusted’ values, mainly due to an increase in the number of countriesand data sources included in the latest round of estimation. Comparable time series on maternal mortality ratios for the years 1990,1995, 2000, 2005 and 2010 are available at .STATISTICAL TABLES 131
TABLE 9: CHILd pROTECTIONCountriesand areasChild labour (%) +2002–2011*total male femaleChild marriage (%)2002–2011*marriedby 15Birthregistration(%) 2005–2011*Female genital mutilation/cutting (%)2002–2011*prevalenceattitudesJustification ofwife beating (%)2002–2011*Violent discipline (%) +2005–2011*marriedsupport forby 18 total women a daughters b the practice c male female total male femaleAfghanistan 10 11 10 15 40 37 – – – – 90 74 75 74Albania 12 14 9 0 10 99 – – – 36 30 75 78 71Algeria 5 y 6 y 4 y 0 2 99 – – – – 68 88 89 87Andorra – – – – – – – – – – – – – –Angola 24 x 22 x 25 x – – 29 x – – – – – – – –Antigua and Barbuda – – – – – – – – – – – – – –Argentina 7 y 8 y 5 y – – 91 x, y – – – – – – – –Armenia 4 y 5 y 3 y 0 7 100 – – – 20 9 70 72 67Australia – – – – – – – – – – – – – –Austria – – – – – – – – – – – – – –Azerbaijan 7 y 8 y 5 y 1 12 94 – – – 58 49 75 79 71Bahamas – – – – – – – – – – – – – –Bahrain 5 x 6 x 3 x – – – – – – – – – – –Bangladesh 13 18 8 32 66 10 – – – 36 36 – – –Barbados – – – – – – – – – – – – – –Belarus 5 6 4 0 7 – – – – – – 84 87 80Belgium – – – – – – – – – – – – – –Belize 6 7 5 3 26 95 – – – – 9 71 71 70Benin 46 47 45 8 34 60 13 2 1 14 47 – – –Bhutan 3 3 3 6 26 100 – – – – 68 – – –Bolivia (PlurinationalState of) 26 y 28 y 24 y 3 22 76 y – – – – 16 – – –Bosnia and Herzegovina 5 7 4 0 6 100 – – – – 5 38 40 36Botswana 9 y 11 y 7 y – – 72 – – – – – – – –Brazil 3 y 4 y 2 y 11 36 93 y – – – – – – – –Brunei Darussalam – – – – – – – – – – – – – –Bulgaria – – – – – – – – – – – – – –Burkina Faso 39 42 36 10 52 77 76 13 y 9 34 44 83 84 82Burundi 26 26 27 3 20 75 – – – 44 73 – – –Cambodia 37 y – – 2 18 62 – – – 22 y 46 y – – –Cameroon 31 31 30 11 36 70 1 1 7 – 56 93 93 93Canada – – – – – – – – – – – – – –Cape Verde 3 x, y 4 x, y 3 x, y 3 18 91 – – – 16 y 17 – – –Central African Republic 29 27 30 29 68 61 24 1 y 11 80 y 80 92 92 92Chad 26 25 28 29 68 16 44 18 38 – 62 84 85 84Chile 3 3 2 – – 100 y – – – – – – – –China – – – – – – – – – – – – – –Colombia 9 y 12 y 6 y 6 23 97 – – – – – – – –Comoros 27 x 26 x 28 x – – 83 x – – – – – – – –Congo 25 24 25 7 33 81 y – – – – 76 – – –Cook Islands – – – – – – – – – – – – – –Costa Rica 5 6 3 – – – – – – – – – – –Côte d’Ivoire 35 36 34 8 35 55 36 9 20 – 65 91 91 91Croatia – – – – – – – – – – – – – –Cuba – – – 9 40 100 y – – – – – – – –Cyprus – – – – – – – – – – – – – –Czech Republic – – – – – – – – – – – – – –Democratic People’sRepublic of Korea – – – – – 100 – – – – – – – –Democratic Republicof the Congo 15 13 17 9 39 28 – – – – 76 92 92 91Denmark – – – – – – – – – – – – – –Djibouti 8 8 8 2 5 89 93 49 37 – – 72 73 71Dominica – – – – – – – – – – – – – –Dominican Republic 13 18 8 12 41 79 – – – – 4 67 69 65Ecuador 8 7 8 4 22 90 – – – – – – – –Egypt 7 8 5 2 17 99 91 24 y 54 – 39 y 92 y – –El Salvador 5 y 7 y 3 y 5 25 99 – – – – – – – –Equatorial Guinea 28 x 28 x 28 x – – 32 x – – – – – – – –Eritrea – – – 20 47 – 89 63 49 – 71 – – –Estonia – – – – – – – – – – – – – –Ethiopia 27 y 31 y 24 y 16 41 7 74 38 – 45 68 – – –Fiji – – – – – – – – – – – 72 y – –Finland – – – – – – – – – – – – – –France – – – – – – – – – – – – – –Gabon – – – 11 x 34 x 89 x – – – – – – – –132THE STATE OF THE WORLD’S CHILDREN 2013: <strong>Children</strong> <strong>with</strong> <strong>Disabilities</strong>
TABLE 9CHILd pROTECTIONCountriesand areasChild labour (%) +2002–2011*total male femaleChild marriage (%)2002–2011*marriedby 15Birthregistration(%) 2005–2011*Female genital mutilation/cutting (%)2002–2011*prevalenceattitudesJustification ofwife beating (%)2002–2011*Violent discipline (%) +2005–2011*marriedsupport forby 18 total women a daughters b the practice c male female total male femaleGambia 19 21 18 7 36 53 76 42 y 64 – 75 90 90 91Georgia 18 20 17 1 14 99 – – – – 7 67 70 63Germany – – – – – – – – – – – – – –Ghana 34 34 34 5 21 63 4 0 y 2 26 y 44 94 94 94Greece – – – – – – – – – – – – – –Grenada – – – – – – – – – – – – – –Guatemala 21 y – – 7 30 97 – – – – – – – –Guinea 25 26 24 20 63 43 96 57 69 – 86 – – –Guinea-Bissau 38 40 36 7 22 24 50 39 34 – 40 y 82 82 81Guyana 16 17 16 6 23 88 – – – 19 16 76 79 74Haiti 21 22 19 6 30 81 – – – – 29 – – –Holy See – – – – – – – – – – – – – –Honduras 16 16 15 11 39 94 – – – – 16 – – –Hungary – – – – – – – – – – – – – –Iceland – – – – – – – – – – – – – –India 12 12 12 18 47 41 – – – 51 54 – – –Indonesia 7 y 8 y 6 y 4 22 53 – – – 16 y 31 y – – –Iran (Islamic Republic of) – – – – – – – – – – – – – –Iraq 11 12 9 3 17 95 – – – – 59 86 87 84Ireland – – – – – – – – – – – – – –Israel – – – – – – – – – – – – – –Italy – – – – – – – – – – – – – –Jamaica 6 7 5 1 9 98 – – – 22 y 3 y 89 90 87Japan – – – – – – – – – – – – – –Jordan 2 y 3 y 0 y 1 10 – – – – – 90 y – – –Kazakhstan 2 2 2 0 6 100 – – – 17 12 49 54 45Kenya 26 x 27 x 25 x 6 26 60 27 – 9 44 53 – – –Kiribati – – – 3 20 94 – – – 60 76 81 y – –Kuwait – – – – – – – – – – – – – –Kyrgyzstan 4 4 3 1 10 94 – – – – 38 54 y 58 y 49 yLao People’sDemocratic Republic 11 10 13 – – 72 – – – – 81 74 75 72Latvia – – – – – – – – – – – – – –Lebanon 2 3 1 1 6 100 – – – – 10 y 82 82 82Lesotho 23 x 25 x 21 x 2 19 45 – – – 48 37 – – –Liberia 21 21 21 11 38 4 y 58 – – 30 59 94 94 94Libya – – – – – – – – – – – – – –Liechtenstein – – – – – – – – – – – – – –Lithuania – – – – – – – – – – – – – –Luxembourg – – – – – – – – – – – – – –Madagascar 28 y 29 y 27 y 14 48 80 – – – 30 32 – – –Malawi 26 25 26 12 50 – – – – 13 13 – – –Malaysia – – – – – – – – – – – – – –Maldives – – – 0 4 93 – – – 14 y 31 y – – –Mali 21 22 21 15 55 81 89 75 73 – 87 – – –Malta – – – – – – – – – – – – – –Marshall Islands – – – 6 26 96 – – – 58 56 – – –Mauritania 16 18 15 15 35 56 72 66 53 – – – – –Mauritius – – – – – – – – – – – – – –Mexico 5 6 5 5 23 – – – – – – – – –Micronesia(Federated States of) – – – – – – – – – – – – – –Monaco – – – – – – – – – – – – – –Mongolia 10 10 11 0 5 99 – – – 9 y 10 46 48 43Montenegro 10 12 8 0 5 98 – – – – 11 63 64 61Morocco 8 9 8 3 16 85 x, y – – – – 64 91 92 90Mozambique 22 21 24 21 56 31 – – – – 36 – – –Myanmar – – – – – 72 – – – – – – – –Namibia – – – 2 9 67 – – – 41 35 – – –Nauru – – – 2 27 83 – – – – – – – –Nepal 34 y 30 y 38 y 10 41 42 – – – 22 23 – – –Netherlands – – – – – – – – – – – – – –New Zealand – – – – – – – – – – – – – –Nicaragua 15 x 18 x 11 x 10 41 81 y – – – – 14 – – –Niger 43 43 43 36 75 32 y 2 1 3 – 70 – – –STATISTICAL TABLES 133
TABLE 9CHILd pROTECTIONCountriesand areasChild labour (%) +2002–2011*total male femaleChild marriage (%)2002–2011*marriedby 15Birthregistration(%) 2005–2011*Female genital mutilation/cutting (%)2002–2011*prevalenceattitudesJustification ofwife beating (%)2002–2011*Violent discipline (%) +2005–2011*marriedsupport forby 18 total women a daughters b the practice c male female total male femaleNigeria 29 29 29 16 39 30 30 y 30 y 22 30 43 – – –Niue – – – – – – – – – – – – – –Norway – – – – – – – – – – – – – –Oman – – – – – – – – – – – – – –Pakistan – – – 7 24 27 – – – – – – – –Palau – – – – – – – – – – – – – –Panama 7 y 10 y 4 y – – – – – – – – – – –Papua New Guinea – – – 2 21 – – – – – – – – –Paraguay 15 17 12 – 18 – – – – – – – – –Peru 34 y 31 y 36 y 3 19 93 – – – – – – – –Philippines – – – 2 14 83 x – – – – 14 – – –Poland – – – – – – – – – – – – – –Portugal 3 x, y 4 x, y 3 x, y – – – – – – – – – – –Qatar – – – – – – – – – – – – – –Republic of Korea – – – – – – – – – – – – – –Republic of Moldova 16 20 12 1 19 98 x – – – 22 y 21 – – –Romania 1 x 1 x 1 x – – – – – – – – – – –Russian Federation – – – – – – – – – – – – – –Rwanda 29 27 30 1 8 63 – – – 25 56 – – –Saint Kitts and Nevis – – – – – – – – – – – – – –Saint Lucia – – – – – – – – – – – – – –Saint Vincentand the Grenadines – – – – – – – – – – – – – –Samoa – – – – – 48 – – – 46 61 – – –San Marino – – – – – – – – – – – – – –Sao Tome and Principe 8 8 7 5 34 75 – – – 22 20 – – –Saudi Arabia – – – – – – – – – – – – – –Senegal 17 y 18 y 16 y 12 33 75 26 13 y 17 25 60 – – –Serbia 4 5 4 1 5 99 – – – 7 y 3 67 70 64Seychelles – – – – – – – – – – – – – –Sierra Leone 26 27 25 18 44 78 88 10 y 72 – 73 82 81 82Singapore – – – – – – – – – – – – – –Slovakia – – – – – – – – – – – – – –Slovenia – – – – – – – – – – – – – –Solomon Islands – – – 3 22 – – – – 65 69 72 y – –Somalia 49 45 54 8 45 3 98 46 65 – 76 y – – –South Africa – – – 1 6 92 y – – – – – – – –South Sudan s – – – 9 52 35 – – – – 79 – – –Spain – – – – – – – – – – – – – –Sri Lanka – – – 2 12 97 – – – – 53 y – – –State of Palestine – – – 7 19 96 y – – – – – 95 – –Sudan s – – – 7 33 59 88 37 y 42 – 47 – – –Suriname 6 7 5 3 19 97 – – – – 13 86 87 85Swaziland 7 8 7 1 7 50 – – – 23 y 28 89 90 88Sweden – – – – – – – – – – – – – –Switzerland – – – – – – – – – – – – – –Syrian Arab Republic 4 5 3 3 13 95 – – – – – 89 90 88Tajikistan 10 9 11 1 13 88 – – – – 74 y 78 80 75Thailand 8 8 8 3 20 99 – – – – – – – –The former YugoslavRepublic of Macedonia 13 12 13 1 7 100 – – – – 15 69 71 67Timor-Leste 4 4 4 3 19 55 – – – 81 86 – – –Togo 28 28 29 6 25 78 4 0 y 2 – 43 93 94 93Tonga – – – – – – – – – – – – – –Trinidad and Tobago 1 1 1 2 8 96 – – – – 8 77 78 77Tunisia – – – – – – – – – – – – – –Turkey 3 y 3 y 2 y 3 14 94 – – – – 25 – – –Turkmenistan – – – 1 7 96 – – – – 38 y – – –Tuvalu – – – 0 10 50 – – – 73 70 – – –Uganda 25 y 27 y 24 y 10 40 30 1 1 y 9 44 58 – – –Ukraine 7 8 7 0 10 100 – – – 11 4 70 76 65United Arab Emirates – – – – – – – – – – – – – –United Kingdom – – – – – – – – – – – – – –United Republicof Tanzania 21 y 23 y 19 y 7 37 16 15 3 6 38 54 – – –United States – – – – – – – – – – – – – –134THE STATE OF THE WORLD’S CHILDREN 2013: <strong>Children</strong> <strong>with</strong> <strong>Disabilities</strong>
TABLE 9CHILd pROTECTIONCountriesand areasChild labour (%) +2002–2011*total male femaleChild marriage (%)2002–2011*marriedby 15Birthregistration(%) 2005–2011*Female genital mutilation/cutting (%)2002–2011*prevalenceattitudesJustification ofwife beating (%)2002–2011*Violent discipline (%) +2005–2011*marriedsupport forby 18 total women a daughters b the practice c male female total male femaleUruguay 8 y 8 y 8 y – – – – – – – – – – –Uzbekistan – – – 0 7 100 – – – 59 y 70 – – –Vanuatu – – – 9 27 26 – – – – – 78 y – –Venezuela(Bolivarian Republic of) 8 x 9 x 6 x – – 92 x – – – – – – – –Viet Nam 7 7 7 1 9 95 – – – – 36 74 76 71Yemen 23 21 24 11 32 22 23 x, y 20 x, y 41 x, y – – 95 95 95Zambia 41 y 42 y 40 y 9 42 14 1 – – 49 62 – – –Zimbabwe – – – 4 31 49 – – – 34 40 – – –MEMORANDUMSudan and South Sudan s 13 x 14 x 12 x – – – – – – – – – – –SUMMARY INDICATORS #Sub-Saharan Africa 27 28 26 12 37 41 40 24 21 35 55 – – –Eastern andSouthern Africa 27 28 25 9 34 37 42 – – 40 55 – – –West and Central Africa 27 28 27 14 41 42 34 23 22 30 56 – – –Middle East andNorth Africa 9 10 8 3 17 81 – – – – 52 90 – –South Asia 12 13 12 18 46 37 – – – 49 52 – – –East Asia and Pacific 8 ** 8 ** 7 ** 3 ** 18 ** 70 ** – – – – 30 ** – – –Latin Americaand Caribbean 9 9 7 7 29 93 – – – – – – – –CEE/CIS 5 6 4 1 10 96 – – – – 27 – – –Least developed countries 23 24 22 16 46 35 – – – 36 54 – – –World 15 ** 15 ** 14 ** 11 ** 34 ** 51 ** – – – – 47 ** – – –s Due to the cession in July 2011 of the Republic of South Sudan by the Republic of the Sudan, and its subsequent admission to the United Nations on 14 July 2011, disaggregated data for the Sudanand South Sudan as separate States are not yet available for all indicators. Aggregated data presented are for the Sudan pre-cession (see Memorandum item).# For a complete list of countries and areas in the regions, subregions and country categories, see page 98.DEFINITIONS OF THE INDICATORSChild labour – Percentage of children 5–14 years old involved in child labour at the moment of thesurvey. A child is considered to be involved in child labour under the following conditions: children5–11 years old who, during the reference week, did at least one hour of economic activity or at least28 hours of household chores, or children 12–14 years old who, during the reference week, did atleast 14 hours of economic activity or at least 28 hours of household chores.Child marriage – Percentage of women 20–24 years old who were first married or in unionbefore they were 15 years old and percentage of women 20–24 years old who were first marriedor in union before they were 18 years old.Birth registration – Percentage of children less than 5 years old who were registered at themoment of the survey. The numerator of this indicator includes children whose birth certificatewas seen by the interviewer or whose mother or caretaker says the birth has been registered.Female genital mutilation/cutting – (a) Women: percentage of women 15–49 years old whohave been mutilated/cut; (b) daughters: percentage of women 15–49 years old <strong>with</strong> at least onemutilated/cut daughter; (c) support for the practice: percentage of women 15–49 years oldwho believe that the practice of female genital mutilation/cutting should continue.Justification of wife beating – Percentage of women and men 15–49 years old who considera husband to be justified in hitting or beating his wife for at least one of the specified reasons,i.e., if his wife burns the food, argues <strong>with</strong> him, goes out <strong>with</strong>out telling him, neglects thechildren or refuses sexual relations.Violent discipline – Percentage of children 2–14 years old who experience any violentdiscipline (psychological aggression and/or physical punishment).MAIN DATA SOURCESChild labour – Multiple Indicator Cluster Surveys (MICS), Demographic and Health Surveys(DHS) and other national surveys.Child marriage – MICS, DHS and other national surveys.Birth registration – MICS, DHS, other national surveys and vital registration systems.Female genital mutilation/cutting – MICS, DHS and other national surveys.Justification of wife beating – MICS, DHS and other national surveys.Violent discipline – MICS, DHS and other national surveys.NOTES– Data not available.x Data refer to years or periods other than those specified in the column heading. Such data arenot included in the calculation of regional and global averages.y Data differ from the standard definition or refer to only part of a country. If they fall <strong>with</strong>inthe noted reference period, such data are included in the calculation of regional and globalaverages.+ A more detailed explanation of the methodology and the changes in calculating theseestimates can be found in the General Note on the Data, page 94.* Data refer to the most recent year available during the period specified in the column heading.** Excludes China.STATISTICAL TABLES 135
TABLE 10: THE RATE OF pROGRESSCountriesand areasUnder-5mortalityrankUnder-5 mortality rateAnnual rate of reduction (%)uUnder-5 mortality rateReductionsince 1990Reductionsince 2000GDP per capitaaverage annualgrowth rate (%) Total fertility rateAverage annual rateof reduction (%)Total fertility rate1970 1990 2000 2011 1970–1990 1990–2000 2000–2011 1990–2011 (%)u (%)u 1970–1990 1990–2011 1970 1990 2011 1970–1990 1990–2011Afghanistan 23 309 192 136 101 2.4 3.4 2.7 3.1 47 26 – – 7.7 8.0 6.2 -0.2 1.2Albania 122 – 41 26 14 – 4.5 5.5 5.0 65 46 -0.7 x 5.3 4.9 3.2 1.5 2.1 3.6Algeria 74 199 66 46 30 5.5 3.6 3.9 3.8 55 35 1.6 1.5 7.4 4.7 2.2 2.3 3.6Andorra 184 – 8 5 3 – 5.1 3.8 4.4 60 34 -1.4 2.5 x – – – – –Angola 8 – 243 199 158 – 2.0 2.1 2.1 35 21 – 4.1 7.3 7.2 5.3 0.1 1.4Antigua and Barbuda 145 – 27 15 8 – 5.9 6.1 6.0 72 49 7.8 x 0.6 – – – – –Argentina 122 58 28 20 14 3.7 3.1 3.3 3.2 49 31 -0.8 2.3 3.1 3.0 2.2 0.1 1.5Armenia 102 – 47 30 18 – 4.6 4.8 4.7 63 41 – 6.1 3.2 2.5 1.7 1.2 1.8Australia 165 21 9 6 5 4.2 3.8 2.9 3.4 51 27 1.6 2.2 2.7 1.9 2.0 1.9 -0.2Austria 169 29 9 6 4 5.6 5.2 2.6 3.8 55 25 2.5 1.8 2.3 1.5 1.4 2.4 0.3Azerbaijan 61 – 95 69 45 – 3.2 3.9 3.6 53 35 – 5.9 4.6 3.0 2.2 2.2 1.5Bahamas 107 31 22 17 16 1.8 2.6 0.4 1.4 26 4 1.9 0.7 3.5 2.6 1.9 1.5 1.6Bahrain 135 81 21 12 10 6.9 5.0 2.0 3.4 51 19 -1.0 x 1.3 x 6.5 3.7 2.5 2.8 1.9Bangladesh 60 226 139 84 46 2.4 5.0 5.5 5.3 67 45 0.6 3.6 6.9 4.5 2.2 2.1 3.4Barbados 98 47 18 17 20 4.8 0.4 -1.2 -0.5 -10 -15 1.7 1.1 x 3.1 1.7 1.6 2.9 0.5Belarus 157 – 17 14 6 – 2.3 8.1 5.3 67 59 – 4.7 2.3 1.9 1.5 1.0 1.2Belgium 169 24 10 6 4 4.3 5.4 2.7 4.0 57 26 2.2 1.6 2.2 1.6 1.8 1.7 -0.7Belize 106 – 44 26 17 – 5.1 4.0 4.5 62 36 2.9 1.8 6.3 4.5 2.7 1.7 2.4Benin 20 261 177 140 106 1.9 2.4 2.5 2.4 40 24 0.5 1.3 6.7 6.7 5.2 0.0 1.2Bhutan 51 286 138 89 54 3.6 4.4 4.6 4.5 61 40 – 5.3 6.7 5.8 2.3 0.7 4.3Bolivia (PlurinationalState of) 55 226 120 81 51 3.2 3.9 4.3 4.1 58 37 -1.1 1.6 6.6 4.9 3.3 1.5 1.9Bosnia and Herzegovina 145 – 19 10 8 – 6.7 2.0 4.3 59 20 – 8.3 x 2.9 1.7 1.1 2.6 1.9Botswana 80 131 53 81 26 4.5 -4.3 10.4 3.4 51 68 8.1 3.4 6.6 4.7 2.7 1.7 2.6Brazil 107 129 58 36 16 4.0 4.9 7.5 6.3 73 56 2.3 1.6 5.0 2.8 1.8 2.9 2.1Brunei Darussalam 151 – 12 10 7 – 2.5 2.6 2.6 41 25 -2.2 x -0.4 x 5.8 3.5 2.0 2.4 2.7Bulgaria 128 39 22 21 12 2.9 0.7 4.9 2.9 45 42 3.4 x 3.3 2.2 1.7 1.5 1.1 0.6Burkina Faso 9 291 208 182 146 1.7 1.4 2.0 1.7 30 19 1.3 2.8 6.6 6.8 5.8 -0.2 0.8Burundi 10 229 183 165 139 1.1 1.0 1.5 1.3 24 15 1.2 -1.4 6.8 6.5 4.2 0.2 2.1Cambodia 62 – 117 102 43 – 1.4 7.9 4.8 64 58 – 6.5 x 5.9 5.7 2.5 0.2 3.9Cameroon 11 206 145 140 127 1.8 0.4 0.8 0.6 12 9 3.4 0.8 6.2 5.9 4.4 0.2 1.4Canada 157 22 8 6 6 4.9 2.9 0.9 1.9 33 10 2.0 1.8 2.2 1.7 1.7 1.5 -0.1Cape Verde 91 160 58 39 21 5.1 4.0 5.5 4.8 63 45 – 5.0 6.9 5.3 2.3 1.3 3.9Central African Republic 6 226 169 172 164 1.5 -0.2 0.5 0.2 3 5 -1.3 -0.5 6.0 5.8 4.5 0.1 1.1Chad 4 257 208 189 169 1.1 1.0 1.0 1.0 19 10 -0.9 3.1 6.5 6.7 5.9 -0.1 0.6Chile 141 82 19 11 9 7.4 5.5 2.0 3.6 53 19 1.5 3.4 4.0 2.6 1.8 2.1 1.7China 115 117 49 35 15 4.3 3.3 7.9 5.8 70 58 6.6 9.3 5.5 2.3 1.6 4.3 1.9Colombia 102 105 34 25 18 5.6 3.2 3.1 3.2 48 29 1.9 1.6 5.6 3.1 2.3 2.9 1.3Comoros 33 219 122 100 79 2.9 2.0 2.1 2.0 35 20 -0.1 x -0.8 7.1 5.6 4.9 1.2 0.7Congo 25 152 119 109 99 1.2 0.9 0.9 0.9 17 9 3.3 0.4 6.3 5.4 4.5 0.8 0.8Cook Islands 135 61 19 17 10 5.8 1.1 5.3 3.3 50 44 – – – – – – –Costa Rica 135 71 17 13 10 7.1 2.9 2.2 2.5 41 22 0.7 2.6 5.0 3.2 1.8 2.3 2.6Côte d’Ivoire 17 233 151 139 115 2.2 0.9 1.7 1.3 24 17 -1.7 -0.6 7.9 6.3 4.3 1.2 1.7Croatia 165 – 13 8 5 – 4.3 4.5 4.4 60 39 – 2.8 2.0 1.7 1.5 0.9 0.6Cuba 157 41 13 9 6 5.6 4.5 3.5 4.0 56 32 3.9 3.0 x 4.0 1.8 1.5 4.2 0.9Cyprus 184 – 11 7 3 – 5.3 6.7 6.0 72 52 5.9 x 2.0 2.6 2.4 1.5 0.4 2.4Czech Republic 169 – 14 7 4 – 7.6 4.9 6.2 73 42 – 2.7 2.0 1.8 1.5 0.6 1.0Democratic People’sRepublic of Korea 69 – 45 58 33 – -2.5 5.0 1.4 26 42 – – 4.0 2.4 2.0 2.6 0.9Democratic Republicof the Congo 5 244 181 181 168 1.5 0.0 0.7 0.4 8 8 -2.2 -2.6 6.2 7.1 5.7 -0.7 1.1Denmark 169 16 9 6 4 3.2 4.4 3.8 4.1 57 34 2.0 1.4 2.1 1.7 1.9 1.2 -0.6Djibouti 26 – 122 106 90 – 1.4 1.5 1.5 26 15 – -1.4 x 7.4 6.2 3.7 0.9 2.5Dominica 128 54 17 15 12 5.7 1.6 2.1 1.8 32 21 5.2 x 2.2 – – – – –Dominican Republic 83 122 58 39 25 3.7 4.1 4.0 4.1 58 36 2.1 3.9 6.2 3.5 2.5 2.9 1.5Ecuador 86 138 52 34 23 4.8 4.3 3.7 4.0 56 33 1.3 1.5 6.3 3.7 2.4 2.7 1.9Egypt 91 237 86 44 21 5.1 6.6 6.8 6.7 75 52 4.3 2.8 5.9 4.4 2.7 1.6 2.3El Salvador 115 158 60 34 15 4.8 5.7 7.3 6.6 75 55 -1.9 2.4 6.2 4.0 2.2 2.3 2.8Equatorial Guinea 16 – 190 152 118 – 2.2 2.3 2.3 38 22 – 18.2 5.7 5.9 5.1 -0.2 0.7Eritrea 41 247 138 98 68 2.9 3.4 3.4 3.4 51 31 – -0.8 x 6.6 6.2 4.4 0.3 1.7Estonia 169 – 20 11 4 – 6.2 9.7 8.1 82 66 – 5.5 x 2.1 1.9 1.7 0.4 0.6Ethiopia 36 230 198 139 77 0.7 3.6 5.3 4.5 61 44 – 3.3 6.8 7.1 4.0 -0.2 2.7Fiji 107 53 30 22 16 2.9 2.8 2.8 2.8 45 26 0.6 1.3 4.5 3.4 2.6 1.5 1.2Finland 184 16 7 4 3 4.4 4.4 3.6 4.0 57 33 2.9 2.5 1.9 1.7 1.9 0.3 -0.3France 169 18 9 5 4 3.6 4.9 2.5 3.6 53 24 2.1 1.2 2.5 1.8 2.0 1.8 -0.6Gabon 44 – 94 82 66 – 1.4 2.1 1.7 31 20 0.2 -0.7 4.7 5.2 3.2 -0.5 2.3136THE STATE OF THE WORLD’S CHILDREN 2013: <strong>Children</strong> <strong>with</strong> <strong>Disabilities</strong>
TABLE 10THE RATE OF pROGRESSCountriesand areasUnder-5mortalityrankUnder-5 mortality rateAnnual rate of reduction (%)uUnder-5 mortality rateReductionsince 1990Reductionsince 2000GDP per capitaaverage annualgrowth rate (%) Total fertility rateAverage annual rateof reduction (%)Total fertility rate1970 1990 2000 2011 1970–1990 1990–2000 2000–2011 1990–2011 (%)u (%)u 1970–1990 1990–2011 1970 1990 2011 1970–1990 1990–2011Gambia 23 286 165 130 101 2.8 2.3 2.4 2.3 39 23 0.6 0.9 6.1 6.1 4.8 0.0 1.1Georgia 91 – 47 33 21 – 3.6 4.2 3.9 56 37 3.1 2.7 2.6 2.2 1.5 0.9 1.6Germany 169 26 9 5 4 5.6 4.5 2.7 3.6 53 26 2.3 1.3 2.0 1.4 1.4 1.9 -0.2Ghana 34 183 121 99 78 2.1 2.0 2.2 2.1 36 21 -2.0 2.5 7.0 5.6 4.1 1.1 1.5Greece 169 38 13 8 4 5.5 5.0 5.1 5.0 65 43 1.3 2.2 2.4 1.4 1.5 2.5 -0.3Grenada 125 – 21 16 13 – 2.9 1.9 2.4 39 18 4.2 x 2.9 4.6 3.8 2.2 0.9 2.6Guatemala 74 172 78 48 30 4.0 4.8 4.2 4.5 61 37 0.2 1.3 6.2 5.6 3.9 0.6 1.7Guinea 12 316 228 175 126 1.6 2.7 3.0 2.8 45 28 – 2.9 6.8 6.7 5.2 0.1 1.3Guinea-Bissau 7 242 210 186 161 0.7 1.2 1.3 1.3 24 14 0.0 -1.2 6.1 6.6 5.0 -0.5 1.4Guyana 68 78 63 49 36 1.0 2.5 2.8 2.7 43 27 -1.3 2.8 x 5.6 2.6 2.2 3.8 0.7Haiti 40 229 143 102 70 2.3 3.4 3.4 3.4 51 31 – -1.0 x 5.8 5.4 3.3 0.3 2.4Holy See – – – – – – – – – – – – – – – – – –Honduras 91 156 55 35 21 5.2 4.5 4.5 4.5 61 39 0.8 1.6 7.3 5.1 3.1 1.7 2.4Hungary 157 43 19 11 6 4.2 5.3 5.1 5.2 66 43 3.0 2.5 2.0 1.8 1.4 0.6 1.2Iceland 184 16 6 4 3 4.6 4.8 4.0 4.4 60 36 3.2 2.1 3.0 2.2 2.1 1.6 0.1India 49 189 114 88 61 2.5 2.6 3.3 3.0 46 30 2.0 4.9 5.5 3.9 2.6 1.7 2.0Indonesia 71 164 82 53 32 3.5 4.4 4.6 4.5 61 39 4.6 2.7 5.5 3.1 2.1 2.8 1.9Iran (Islamic Republic of) 83 203 61 44 25 6.0 3.3 5.1 4.3 59 43 -2.3 2.7 x 6.5 4.8 1.6 1.5 5.1Iraq 67 115 46 43 38 4.6 0.7 1.1 0.9 18 11 – -1.9 x 7.4 6.0 4.6 1.0 1.2Ireland 169 23 9 7 4 4.6 2.5 5.1 3.9 56 43 – 0.6 x 3.8 2.0 2.1 3.2 -0.3Israel 169 – 12 7 4 – 5.1 4.3 4.7 63 38 1.9 1.8 3.8 3.0 2.9 1.2 0.1Italy 169 33 10 6 4 6.1 5.5 3.8 4.6 62 34 2.8 0.8 2.5 1.3 1.4 3.2 -0.5Jamaica 102 63 35 26 18 3.0 3.0 3.0 3.0 47 28 -1.3 0.5 5.5 2.9 2.3 3.1 1.2Japan 184 18 6 5 3 5.1 3.5 2.5 3.0 47 24 3.4 0.7 2.1 1.6 1.4 1.5 0.6Jordan 91 97 37 28 21 4.8 2.7 2.7 2.7 44 26 2.5 x 2.6 7.9 5.8 3.0 1.6 3.1Kazakhstan 78 79 57 42 28 1.7 3.0 3.7 3.3 50 33 – 4.1 3.5 2.8 2.5 1.1 0.5Kenya 38 153 98 113 73 2.2 -1.5 4.0 1.4 26 36 1.2 0.4 8.1 6.0 4.7 1.5 1.2Kiribati 58 154 88 65 47 2.8 2.9 2.9 2.9 46 27 -5.3 1.1 – – – – –Kuwait 133 60 17 13 11 6.4 2.9 1.4 2.1 36 14 -6.7 x 1.4 x 7.2 2.6 2.3 5.1 0.6Kyrgyzstan 72 143 70 47 31 3.6 3.9 4.0 4.0 56 35 – 0.7 4.9 3.9 2.7 1.2 1.8Lao People’sDemocratic Republic 63 – 148 81 42 – 6.0 6.0 6.0 72 48 – 4.7 6.0 6.2 2.7 -0.1 4.0Latvia 145 – 21 17 8 – 1.7 6.7 4.3 60 52 3.4 4.4 1.9 1.9 1.5 0.0 1.2Lebanon 141 57 33 19 9 2.7 5.6 6.5 6.0 72 51 – 2.5 5.1 3.1 1.8 2.4 2.7Lesotho 29 177 88 117 86 3.5 -2.9 2.8 0.1 2 27 2.4 2.3 5.8 4.9 3.1 0.8 2.1Liberia 34 280 241 164 78 0.7 3.9 6.7 5.4 68 52 -4.0 5.5 6.7 6.5 5.2 0.1 1.1Libya 107 139 44 27 16 5.7 4.9 4.7 4.8 63 40 – – 7.6 4.8 2.5 2.3 3.1Liechtenstein – – – – – – – – – – – 2.2 3.0 x – – – – –Lithuania 157 26 17 12 6 2.0 3.9 6.6 5.3 67 52 – 3.6 2.3 2.0 1.5 0.7 1.4Luxembourg 184 22 8 5 3 4.7 5.4 3.9 4.6 62 35 2.6 2.7 2.0 1.6 1.7 1.1 -0.3Madagascar 47 176 161 104 62 0.4 4.4 4.8 4.6 62 41 -2.3 -0.3 7.3 6.3 4.6 0.8 1.5Malawi 31 334 227 164 83 1.9 3.2 6.2 4.8 64 50 0.0 1.3 7.3 6.8 6.0 0.4 0.6Malaysia 151 54 17 11 7 5.8 4.8 4.4 4.6 62 39 4.0 3.1 4.9 3.5 2.6 1.6 1.4Maldives 133 266 105 53 11 4.6 6.9 14.5 10.9 90 80 – 5.8 x 7.2 6.1 1.7 0.8 6.1Mali 3 373 257 214 176 1.9 1.8 1.8 1.8 32 18 0.1 2.1 6.9 7.1 6.2 -0.1 0.6Malta 157 27 11 8 6 4.4 3.7 2.5 3.1 48 24 6.0 2.4 2.0 2.1 1.3 -0.2 2.2Marshall Islands 80 98 52 38 26 3.2 3.2 3.3 3.3 50 30 – 0.5 – – – – –Mauritania 18 197 125 118 112 2.3 0.6 0.5 0.5 10 5 -1.1 1.3 6.8 5.9 4.5 0.7 1.4Mauritius 115 85 24 19 15 6.3 2.5 1.9 2.2 37 19 3.2 x 3.5 4.0 2.3 1.6 2.7 1.7Mexico 107 108 49 29 16 4.0 5.2 5.6 5.4 68 46 1.7 1.3 6.7 3.4 2.3 3.4 1.9Micronesia(Federated States of) 63 – 56 49 42 – 1.5 1.4 1.5 26 15 – 0.4 6.9 5.0 3.4 1.7 1.8Monaco 169 – 8 5 4 – 4.2 2.4 3.3 50 24 1.4 2.1 x – – – – –Mongolia 72 – 107 63 31 – 5.2 6.6 5.9 71 52 – 3.3 7.6 4.1 2.5 3.1 2.4Montenegro 151 – 18 13 7 – 3.3 5.1 4.3 59 43 – 3.4 x 2.4 1.9 1.6 1.2 0.6Morocco 69 177 81 53 33 3.9 4.3 4.3 4.3 60 38 1.9 2.5 7.1 4.0 2.2 2.8 2.8Mozambique 22 275 226 172 103 1.0 2.7 4.7 3.7 54 40 -1.0 x 4.3 6.6 6.2 4.8 0.3 1.2Myanmar 47 172 107 84 62 2.4 2.5 2.6 2.6 42 25 1.6 7.4 x 6.1 3.4 2.0 2.8 2.6Namibia 63 113 73 74 42 2.2 -0.1 5.2 2.7 43 44 -2.1 x 1.9 6.5 5.2 3.2 1.1 2.4Nauru 66 – 40 40 40 – 0.0 0.0 0.0 0 0 – – – – – – –Nepal 57 249 135 83 48 3.1 4.8 5.0 4.9 64 42 1.1 1.9 6.1 5.2 2.7 0.8 3.2Netherlands 169 16 8 6 4 3.2 2.9 4.0 3.5 52 35 1.6 1.9 2.4 1.6 1.8 2.2 -0.6New Zealand 157 21 11 7 6 3.1 4.1 2.1 3.0 47 20 1.1 x 1.8 x 3.1 2.1 2.2 2.0 -0.2Nicaragua 80 161 66 42 26 4.5 4.5 4.6 4.5 61 39 -3.7 1.9 6.9 4.8 2.6 1.9 2.9Niger 13 324 314 216 125 0.2 3.8 5.0 4.4 60 42 -2.0 -0.2 7.4 7.8 7.0 -0.3 0.5Nigeria 14 259 214 188 124 1.0 1.3 3.8 2.6 42 34 -1.3 2.1 6.5 6.4 5.5 0.1 0.7STATISTICAL TABLES 137
TABLE 10THE RATE OF pROGRESSCountriesand areasUnder-5mortalityrankUnder-5 mortality rateAnnual rate of reduction (%)uUnder-5 mortality rateReductionsince 1990Reductionsince 2000GDP per capitaaverage annualgrowth rate (%) Total fertility rateAverage annual rateof reduction (%)Total fertility rate1970 1990 2000 2011 1970–1990 1990–2000 2000–2011 1990–2011 (%)u (%)u 1970–1990 1990–2011 1970 1990 2011 1970–1990 1990–2011Niue 91 – 14 29 21 – -7.3 3.0 -1.9 -49 28 – – – – – – –Norway 184 16 8 5 3 3.3 5.4 4.2 4.7 63 37 3.2 2.0 2.5 1.9 1.9 1.5 -0.2Oman 141 195 48 22 9 7.1 7.8 8.3 8.1 82 60 3.1 2.7 7.3 7.2 2.2 0.1 5.5Pakistan 39 182 122 95 72 2.0 2.5 2.5 2.5 41 24 2.6 1.9 6.6 6.0 3.3 0.5 2.8Palau 100 – 32 25 19 – 2.6 2.6 2.6 42 25 – -0.1 x – – – – –Panama 98 62 33 26 20 3.1 2.6 2.5 2.5 41 24 0.3 3.4 5.3 3.0 2.5 2.8 1.0Papua New Guinea 50 151 88 72 58 2.7 2.0 2.0 2.0 34 19 -1.0 0.1 6.2 4.8 3.9 1.2 1.0Paraguay 87 75 53 35 22 1.7 4.0 4.1 4.1 57 37 3.1 0.3 5.7 4.5 2.9 1.2 2.1Peru 102 158 75 39 18 3.7 6.6 7.0 6.8 76 53 -0.6 3.2 6.3 3.8 2.5 2.5 2.1Philippines 83 88 57 39 25 2.2 3.8 3.9 3.8 55 35 0.5 1.9 6.3 4.3 3.1 1.9 1.6Poland 157 36 17 10 6 3.6 5.9 4.6 5.2 66 40 – 4.4 2.2 2.0 1.4 0.4 1.8Portugal 184 66 15 7 3 7.5 7.1 6.8 6.9 77 53 2.5 1.5 3.0 1.5 1.3 3.3 0.7Qatar 145 57 20 13 8 5.2 4.7 4.5 4.6 62 39 – 0.8 x 6.9 4.2 2.2 2.5 3.0Republic of Korea 165 49 8 6 5 9.4 2.7 1.6 2.1 36 16 6.2 4.1 4.5 1.6 1.4 5.2 0.8Republic of Moldova 107 70 35 24 16 3.5 3.8 3.6 3.7 54 33 1.8 x -0.1 2.6 2.4 1.5 0.3 2.4Romania 125 64 37 27 13 2.7 3.3 6.9 5.2 67 53 0.9 x 2.8 2.9 1.9 1.4 2.1 1.5Russian Federation 128 40 27 21 12 2.0 2.5 5.3 4.0 56 44 – 2.3 2.0 1.9 1.5 0.3 1.0Rwanda 51 223 156 183 54 1.8 -1.6 11.1 5.1 65 70 1.2 2.3 8.1 7.0 5.3 0.7 1.3Saint Kitts and Nevis 151 71 28 16 7 4.6 5.5 7.2 6.4 74 55 6.3 x 1.6 – – – – –Saint Lucia 107 63 23 18 16 5.2 2.2 1.4 1.7 31 14 5.3 x 0.7 6.1 3.4 2.0 2.9 2.6Saint Vincentand the Grenadines 91 96 27 22 21 6.5 1.9 0.4 1.1 21 5 3.3 3.2 6.0 3.0 2.0 3.6 1.8Samoa 100 – 30 23 19 – 2.6 1.8 2.2 37 18 – 2.8 6.1 4.8 3.8 1.2 1.1San Marino 195 – 12 5 2 – 8.1 9.8 9.0 85 66 1.7 3.2 x – – – – –Sao Tome and Principe 28 96 96 93 89 -0.0 0.4 0.4 0.4 8 4 – – 6.5 5.4 3.6 0.9 1.9Saudi Arabia 141 – 43 21 9 – 7.3 7.3 7.3 78 55 -1.4 0.2 7.3 5.8 2.7 1.1 3.6Senegal 45 295 136 130 65 3.9 0.4 6.4 3.5 52 50 -0.5 1.1 7.4 6.6 4.7 0.5 1.6Serbia 151 – 29 13 7 – 8.1 5.3 6.6 75 44 – 1.4 2.4 2.1 1.6 0.6 1.4Seychelles 122 66 17 14 14 6.9 1.8 0.0 0.9 17 0 2.9 2.0 – – – – –Sierra Leone 1 342 267 241 185 1.2 1.0 2.4 1.7 31 23 -0.5 1.1 5.9 5.7 4.9 0.1 0.7Singapore 184 27 8 4 3 6.4 6.5 3.7 5.0 65 33 5.9 3.5 3.2 1.8 1.3 2.9 1.5Slovakia 145 – 18 12 8 – 4.2 3.7 3.9 56 34 – 3.7 2.5 2.0 1.3 1.0 2.0Slovenia 184 – 10 5 3 – 6.6 6.0 6.2 73 48 – 3.2 2.3 1.5 1.5 2.0 0.1Solomon Islands 87 102 42 31 22 4.5 3.2 3.1 3.1 48 29 – -0.9 6.9 5.9 4.2 0.8 1.6Somalia 2 – 180 180 180 – 0.0 0.0 0.0 0 0 -0.8 – 7.2 6.6 6.3 0.4 0.2South Africa 58 – 62 74 47 – -1.7 4.2 1.4 25 37 0.1 1.3 5.6 3.7 2.4 2.1 2.0South Sudan s 15 302 217 165 121 1.6 2.8 2.8 2.8 45 27 – – – – – – –Spain 169 29 11 7 4 4.9 5.0 4.1 4.5 61 36 1.9 1.9 2.9 1.3 1.5 3.8 -0.5Sri Lanka 128 76 29 19 12 4.8 4.1 4.1 4.1 58 36 3.0 4.1 4.3 2.5 2.3 2.8 0.4State of Palestine 87 – 43 30 22 – 3.6 2.8 3.2 49 27 – -2.4 x 7.9 6.5 4.4 0.9 1.9Sudan s 29 148 123 104 86 0.9 1.7 1.7 1.7 30 17 – – – – – – –Suriname 74 – 52 40 30 – 2.6 2.7 2.7 43 26 -2.2 x 1.7 x 5.7 2.7 2.3 3.6 0.8Swaziland 21 181 83 114 104 3.9 -3.2 0.9 -1.0 -24 9 3.1 1.8 6.9 5.7 3.3 0.9 2.7Sweden 184 13 7 4 3 3.4 4.9 3.5 4.2 58 32 1.8 2.2 2.0 2.0 1.9 0.1 0.2Switzerland 169 18 8 6 4 4.1 3.5 2.4 2.9 46 23 1.7 x 0.9 2.1 1.5 1.5 1.6 0.1Syrian Arab Republic 115 113 36 23 15 5.7 4.6 3.6 4.1 58 33 2.2 1.8 x 7.6 5.3 2.9 1.8 3.0Tajikistan 46 – 114 95 63 – 1.9 3.7 2.8 45 33 – 0.2 6.9 5.2 3.2 1.4 2.2Thailand 128 102 35 19 12 5.3 6.4 3.7 5.0 65 34 4.7 2.8 5.6 2.1 1.6 4.9 1.4The former YugoslavRepublic of Macedonia 135 – 38 16 10 – 8.4 4.8 6.5 74 41 – 1.2 3.1 2.1 1.4 1.9 1.9Timor-Leste 51 – 180 109 54 – 5.0 6.4 5.7 70 51 – 1.9 x 5.9 5.3 6.1 0.5 -0.6Togo 19 220 147 128 110 2.0 1.4 1.4 1.4 25 14 -0.3 -0.1 7.1 6.3 4.0 0.6 2.2Tonga 115 43 25 20 15 2.9 2.2 2.2 2.2 37 21 – 1.5 5.9 4.6 3.9 1.2 0.9Trinidad and Tobago 78 52 37 32 28 1.7 1.4 1.3 1.4 25 14 0.5 4.8 3.5 2.4 1.6 1.8 1.9Tunisia 107 181 51 30 16 6.3 5.5 5.5 5.5 68 45 2.5 3.3 6.6 3.6 2.0 3.0 2.9Turkey 115 194 72 35 15 5.0 7.1 7.7 7.4 79 57 2.0 2.4 5.5 3.0 2.1 3.0 1.9Turkmenistan 54 – 94 71 53 – 2.8 2.8 2.8 44 26 – 5.8 6.3 4.3 2.4 1.9 2.9Tuvalu 74 – 58 43 30 – 2.9 3.3 3.1 48 30 – 2.1 – – – – –Uganda 26 190 178 141 90 0.3 2.4 4.1 3.3 49 36 – 3.7 7.1 7.1 6.1 0.0 0.8Ukraine 135 34 19 19 10 2.8 0.4 5.6 3.1 48 46 – 0.6 2.1 1.9 1.5 0.6 1.2United Arab Emirates 151 92 22 12 7 7.1 5.9 5.7 5.8 70 46 -4.3 x -1.9 6.6 4.4 1.7 2.0 4.5United Kingdom 165 21 9 7 5 4.1 3.3 2.3 2.8 45 23 2.1 2.4 2.3 1.8 1.9 1.2 -0.1United Republicof Tanzania 41 208 158 126 68 1.4 2.2 5.7 4.0 57 47 – 2.5 6.8 6.2 5.5 0.4 0.6United States 145 23 11 9 8 3.6 2.8 1.1 2.0 34 12 2.1 1.7 2.2 1.9 2.1 0.7 -0.3138THE STATE OF THE WORLD’S CHILDREN 2013: <strong>Children</strong> <strong>with</strong> <strong>Disabilities</strong>
TABLE 10THE RATE OF pROGRESSCountriesand areasUnder-5mortalityrankUnder-5 mortality rateAnnual rate of reduction (%)uUnder-5 mortality rateReductionsince 1990Reductionsince 2000GDP per capitaaverage annualgrowth rate (%) Total fertility rateAverage annual rateof reduction (%)Total fertility rate1970 1990 2000 2011 1970–1990 1990–2000 2000–2011 1990–2011 (%)u (%)u 1970–1990 1990–2011 1970 1990 2011 1970–1990 1990–2011Uruguay 135 55 23 17 10 4.3 3.0 4.6 3.8 55 40 0.9 2.1 2.9 2.5 2.1 0.7 0.9Uzbekistan 56 – 75 61 49 – 2.1 2.1 2.1 35 20 – 2.5 6.5 4.2 2.3 2.2 2.8Vanuatu 125 102 39 23 13 4.9 5.2 5.0 5.1 66 43 1.2 x 0.6 6.3 4.9 3.8 1.2 1.2Venezuela(Bolivarian Republic of) 115 61 31 22 15 3.4 3.3 3.6 3.4 51 33 -1.7 0.4 5.4 3.4 2.4 2.2 1.7Viet Nam 87 – 50 34 22 – 3.9 4.1 4.0 57 36 – 6.0 7.4 3.6 1.8 3.6 3.3Yemen 36 293 126 99 77 4.2 2.4 2.4 2.4 39 23 – 1.1 7.5 8.7 5.1 -0.7 2.5Zambia 31 179 193 154 83 -0.4 2.3 5.6 4.0 57 46 -2.3 0.8 7.4 6.5 6.3 0.7 0.1Zimbabwe 43 119 79 106 67 2.0 -2.9 4.1 0.8 15 37 -0.4 -3.0 7.4 5.2 3.2 1.8 2.3MEMORANDUMSudan and South Sudan s – – – – – – – – – – – 0.1 3.4 6.6 6.0 4.3 0.5 1.5SUMMARY INDICATORS#Sub-Saharan Africa 236 178 154 109 1.4 1.5 3.1 2.3 39 29 0.0 2.0 6.7 6.2 4.9 0.3 1.2Eastern andSouthern Africa 214 162 135 84 1.4 1.8 4.3 3.1 48 38 0.3 1.9 6.8 6.0 4.5 0.6 1.4West and Central Africa 259 197 175 132 1.4 1.2 2.6 1.9 33 24 -0.5 2.0 6.6 6.5 5.3 0.1 1.0Middle East andNorth Africa 190 72 52 36 4.8 3.4 3.3 3.3 50 30 -0.1 0.8 6.7 5.0 2.8 1.5 2.8South Asia 195 119 89 62 2.5 2.9 3.3 3.1 48 30 2.0 4.5 5.7 4.2 2.7 1.6 2.1East Asia and Pacific 120 55 39 20 3.9 3.4 5.9 4.7 63 48 5.6 7.5 5.6 2.6 1.8 3.8 1.8Latin Americaand Caribbean 117 53 34 19 4.0 4.4 5.2 4.8 64 44 1.4 1.7 5.3 3.2 2.2 2.5 1.8CEE/CIS 88 48 35 21 3.1 3.2 4.6 3.9 56 40 – 2.5 2.8 2.3 1.8 0.9 1.3Least developed countries 238 171 136 98 1.7 2.3 3.0 2.7 43 28 -0.1 3.1 6.7 5.9 4.2 0.6 1.7World 141 87 73 51 2.4 1.8 3.2 2.5 41 29 2.4 2.6 4.7 3.2 2.4 1.9 1.3s Due to the cession in July 2011 of the Republic of South Sudan by the Republic of the Sudan, and its subsequent admission to the United Nations on 14 July 2011, disaggregated data for the Sudanand South Sudan as separate States are not yet available for all indicators. Aggregated data presented are for the Sudan pre-cession (see Memorandum item).# For a complete list of countries and areas in the regions, subregions and country categories, see page 98.DEFINITIONS OF THE INDICATORSUnder-5 mortality rate – Probability of dying between birth and exactly 5 years of age,expressed per 1,000 live births.Reduction since 1990 – Percentage reduction in the under-five mortality rate (U5MR) from1990 to 2011. The United Nations Millennium Declaration in 2000 established a goal of atwo-thirds (67 per cent) reduction in U5MR from 1990 to 2015. This indicator provides acurrent assessment of progress towards this goal.GDP per capita – Gross domestic product (GDP) is the sum of value added by all residentproducers plus any product taxes (less subsidies) not included in the valuation of output. GDP percapita is GDP divided by midyear population. Growth is calculated from constant price GDP datain local currency.Total fertility rate – Number of children who would be born per woman if she lived to theend of her childbearing years and bore children at each age in accordance <strong>with</strong> prevailing agespecificfertility rates.MAIN DATA SOURCESUnder-5 mortality rate – United Nations Inter-agency Group for Child Mortality Estimation(UNICEF, World Health Organization, United Nations Population Division and the World Bank).GDP per capita – The World Bank.Total fertility rate – United Nations Population Division.NOTES− Data not available.u A negative value indicates an increase in the under-five mortality rate.x Data refer to years or periods other than those specified in the column heading. Such dataare not included in the calculation of regional and global averages.STATISTICAL TABLES 139
TABLE 11: AdOLESCENTSCountriesand areasPopulation aged 10–19Total(thousands)2011Justification of wife Use of massLowersecondaryUppersecondaryComprehensiveknowledge ofProportion of Adolescents currentlybeating among media among school gross school gross HIV amongtotal population(%)married/in union (%)2002–2011*Births byage 18 (%)Adolescentbirth rateadolescents (%)2002–2011*adolescents (%)2002–2011*enrolmentratioenrolmentratioadolescents (%)2007–2011*2011 male female 2007–2011* 2006–2010* male female male female 2008–2011* 2008–2011* male femaleAfghanistan 8,015 25 – 20 26 90 – 84 – – 62 27 – –Albania 551 17 1 8 3 11 37 24 97 99 95 81 21 36Algeria 6,425 18 – 2 – 4 – 66 – – 133 50 – 12 xAndorra – – – – – 5 – – – – 88 84 – –Angola 4,720 24 – – – 165 x – – – – 39 22 – –Antigua and Barbuda – – – – – 67 x – – – – 122 80 55 40Argentina 6,769 17 – – – 68 – – – – 109 68 – –Armenia 435 14 1 8 2 28 21 8 94 92 96 85 4 10Australia 2,917 13 – – – 16 – – – – 113 167 – –Austria 929 11 – – – 10 – – – – 102 96 – –Azerbaijan 1,378 15 0 10 4 x 41 63 39 97 95 92 75 2 x 3 xBahamas 58 17 – – – 41 – – – – 101 90 – –Bahrain 153 11 – – – 12 – – – – – – – –Bangladesh 31,601 21 – 46 40 133 x – 41 – 63 y 66 40 – 7Barbados 38 14 – – – 50 – – – – 99 103 – –Belarus 1,025 11 – 4 3 x 21 – – – – – – – –Belgium 1,207 11 – – – 11 – – – – 114 109 – –Belize 73 23 – 15 19 x 90 x – 11 – – – – – 39 xBenin 2,094 23 2 22 23 x 114 x 12 41 83 64 – – 31 x 17 xBhutan 148 20 – 15 15 59 – 70 – – 78 42 – 22Bolivia (Plurinational State of) 2,232 22 4 13 20 89 x – 17 100 97 94 73 24 22Bosnia and Herzegovina 434 12 – 7 – 17 – 4 – – 99 84 – 45 xBotswana 434 21 – – – 51 – – – – 91 68 – –Brazil 33,906 17 – 25 – 71 – – – – – – – –Brunei Darussalam 65 16 – – – 18 – – – – – – – –Bulgaria 696 9 – – – 48 – – – – 83 94 – –Burkina Faso 3,978 23 2 32 28 130 40 39 61 55 28 9 31 29Burundi 1,946 23 1 9 11 65 56 74 83 69 34 13 45 43Cambodia 3,222 23 2 10 7 48 25 y 42 y 73 76 60 – 41 43Cameroon 4,481 22 – 22 33 x 127 – 58 77 61 – – – 32 xCanada 4,137 12 – – – 14 – – – – 99 102 – –Cape Verde 113 23 2 8 22 x 92 x 24 23 88 88 109 67 – –Central African Republic 1,030 23 11 55 45 133 x 87 y 79 – – – – 26 x 16 xChad 2,690 23 – 48 47 193 x – 59 55 24 29 18 – 10Chile 2,769 16 – – – 54 – – – – 100 82 – –China 195,432 15 – – – 6 – – – – 92 71 – –Colombia 8,759 19 – 14 20 85 – – – – 105 80 – 21Comoros 161 21 – – – 95 x – – – – – – – –Congo 909 22 2 19 29 x 132 x – 76 75 63 – – 18 8Cook Islands – – – – – 47 x – – – – 97 67 – –Costa Rica 832 18 3 11 9 67 – – – – 116 75 – –Côte d’Ivoire 4,653 23 2 20 29 x 111 – 63 86 75 – – – –Croatia 490 11 – – – 13 – – – – 105 87 – –Cuba 1,454 13 – 20 9 51 – – – – 94 85 – 54Cyprus 153 14 – – – 4 – – – – 102 96 – –Czech Republic 1,069 10 – – – 11 – – – – 93 88 – –Democratic People’sRepublic of Korea 4,103 17 – – – 1 – – – – – – – 7Democratic Republicof the Congo 16,323 24 – 25 25 135 – 72 55 43 48 32 – 13Denmark 701 13 – – – 6 – – – – 116 119 – –Djibouti 202 22 – 4 – 27 x – – – – 44 25 – 16 xDominica – – – – – 48 – – – – 108 84 – –Dominican Republic 1,967 20 – 17 25 98 x – 7 98 98 90 70 33 39Ecuador 2,843 19 – 16 – 100 x – – – – 85 65 – –Egypt 15,964 19 – 13 7 50 x – 50 y – 97 y 94 51 16 3El Salvador 1,440 23 – 21 – 65 – – – – 86 44 – –Equatorial Guinea 154 21 – – – 128 x – – – – – – – –Eritrea 1,171 22 – 29 25 x – – 70 – 85 44 22 – –Estonia 133 10 – – – 21 – – – – 105 103 – –Ethiopia 20,948 25 2 19 22 79 51 64 42 38 45 16 32 24Fiji 159 18 – – – 31 x – – – – 100 69 – –Finland 627 12 – – – 8 – – – – 99 115 – –France 7,482 12 – – – 12 – – – – 110 117 – –140THE STATE OF THE WORLD’S CHILDREN 2013: <strong>Children</strong> <strong>with</strong> <strong>Disabilities</strong>
TABLE 11AdOLESCENTSCountriesand areasJustification of wife Use of massLowersecondaryUppersecondaryComprehensiveknowledge ofProportion of Adolescents currentlybeating among media among school gross school gross HIV amongtotal population(%)married/in union (%)2002–2011*Births byage 18 (%)Adolescentbirth rateadolescents (%)2002–2011*adolescents (%)2002–2011*enrolmentratioenrolmentratioadolescents (%)2007–2011*2011 male female 2007–2011* 2006–2010* male female male female 2008–2011* 2008–2011* male femalePopulation aged 10–19Total(thousands)2011Gabon 346 23 2 x 18 x 35 x – – – 89 x 83 x – – – –Gambia 421 24 – 24 23 104 x – 74 – – 63 45 – 33Georgia 541 13 – 11 6 44 – 5 – – 93 81 – –Germany 8,059 10 – – – 9 – – – – 101 107 – –Ghana 5,412 22 1 7 16 70 37 53 90 85 83 39 30 28Greece 1,087 10 – – – 12 – – – – – – – –Grenada 20 20 – – – 53 x – – – – 121 89 – –Guatemala 3,467 23 – 20 22 92 – – – – 65 48 24 20Guinea 2,334 23 3 36 44 x 153 x – 79 66 55 46 26 – –Guinea–Bissau 349 23 – 19 31 x 137 – 39 y – – – – – 12Guyana 181 24 1 16 16 97 25 18 94 94 99 78 45 53Haiti 2,270 22 2 17 15 x 69 x – 29 88 83 – – 34 x 31 xHoly See – – – – – – – – – – – – – –Honduras 1,777 23 – 20 26 x 108 x – 18 – 98 75 71 – 28 xHungary 1,072 11 – – – 19 – – – – 99 98 – –Iceland 45 14 – – – 15 – – – – 97 115 – –India 243,492 20 5 30 22 x 39 57 53 88 72 81 50 35 x 19 xIndonesia 42,771 18 – 14 10 52 x – 41 y – 79 y 92 63 2 y 6Iran (Islamic Republic of) 12,015 16 – 16 – 31 – – – – 98 87 – –Iraq 7,490 23 – 19 – 68 – 57 – – – – – 3 xIreland 567 13 – – – 16 – – – – 110 138 – –Israel 1,206 16 – – – 14 – – – – 94 110 – –Italy 5,742 9 – – – 7 – – – – 107 97 – –Jamaica 562 21 – 5 16 72 28 y 4 y – – 91 95 52 y 61 yJapan 11,799 9 – – – 5 – – – – 103 102 – –Jordan 1,418 23 – 7 4 32 – 91 y – 97 y 94 73 – 12Kazakhstan 2,402 15 1 5 3 x 31 14 9 99 99 105 80 – 22 xKenya 9,322 22 0 12 26 106 54 57 91 81 91 44 52 42Kiribati – – 5 16 9 39 x 65 77 58 57 99 72 46 41Kuwait 394 14 – – – 14 – – – – 110 89 – –Kyrgyzstan 1,082 20 – 8 2 x 31 – 28 – – 94 62 – 19 xLao People’sDemocratic Republic 1,509 24 – – 55 x 110 x – 79 – – 55 32 – –Latvia 216 10 – – – 15 – – – – 95 96 – –Lebanon 772 18 – 3 – 18 x – 22 y – – 90 73 – –Lesotho 531 24 1 16 13 92 54 48 64 69 58 29 28 35Liberia 921 22 3 19 38 177 37 48 73 63 – – 21 18Libya 1,117 17 – – – 4 x – – – – – – – –Liechtenstein – – – – – 4 – – – – 103 23 – –Lithuania 391 12 – – – 17 – – – – 96 105 – –Luxembourg 63 12 – – – 7 – – – – 110 88 – –Madagascar 5,060 24 11 34 36 147 33 35 61 60 42 15 26 23Malawi 3,673 24 2 23 35 157 21 16 82 65 40 15 45 40Malaysia 5,537 19 5 6 – 14 – – – – 91 50 – –Maldives 66 21 – 5 1 19 – 41 y – 100 – – – 22 yMali 3,723 24 – 40 46 x 190 x – 83 81 79 48 26 – 14Malta 50 12 – – – 20 – – – – 103 97 – –Marshall Islands – – 5 21 21 105 71 47 86 85 110 92 35 27Mauritania 791 22 – 25 19 88 x – – 55 x 44 x 26 22 10 4Mauritius 211 16 – – – 31 – – – – 96 85 – –Mexico 21,658 19 – 15 39 87 – – – – 117 61 – –Micronesia(Federated States of) 27 24 – – – 52 x – – – – – – – –Monaco – – – – – – – – – – – – – –Mongolia 500 18 1 5 2 20 9 14 – – 89 90 24 28Montenegro 83 13 – 2 – 24 – 6 – – 114 94 – –Morocco 6,094 19 – 11 8 x 18 x – 64 – 90 – – – –Mozambique 5,577 23 5 43 42 x 193 – 37 95 88 34 11 31 37Myanmar 8,665 18 – 7 – 17 x – – – – 62 38 – 31Namibia 530 23 0 5 17 74 x 44 38 86 88 – – 59 62Nauru – – 9 18 22 84 x – – 89 86 – – 8 8Nepal 7,043 23 7 29 19 81 27 24 86 76 – – 33 25Netherlands 2,019 12 – – – 5 – – – – 127 116 – –New Zealand 612 14 – – – 29 – – – – 104 137 – –STATISTICAL TABLES 141
TABLE 11AdOLESCENTSCountriesand areasJustification of wife Use of massLowersecondaryUppersecondaryComprehensiveknowledge ofProportion of Adolescents currentlybeating among media among school gross school gross HIV amongtotal population(%)married/in union (%)2002–2011*Births byage 18 (%)Adolescentbirth rateadolescents (%)2002–2011*adolescents (%)2002–2011*enrolmentratioenrolmentratioadolescents (%)2007–2011*2011 male female 2007–2011* 2006–2010* male female male female 2008–2011* 2008–2011* male femalePopulation aged 10–19Total(thousands)2011Nicaragua 1,319 22 – 24 28 x 109 x – 19 – 95 x 80 54 – –Niger 3,776 24 3 59 51 x 199 x – 68 66 48 19 4 14 x 12 xNigeria 36,205 22 1 29 28 123 35 40 82 64 47 41 28 20Niue – – – – – 16 – – – – – – – –Norway 646 13 – – – 10 – – – – 98 124 – –Oman 462 16 – – – 12 – – – – 108 93 – –Pakistan 39,894 23 – 16 10 16 – – – – 44 26 – 2Palau – – – – – 27 x – – – – – – – –Panama 646 18 – – – 88 – – – – 93 54 – –Papua New Guinea 1,561 22 3 15 14 x 70 x – – – – – – – –Paraguay 1,385 21 – 11 – 63 – – – – 78 56 – –Peru 5,769 20 – 11 13 72 – – – 91 101 77 – 17Philippines 20,508 22 – 10 7 53 – 15 – 94 88 76 – 19Poland 4,300 11 – – – 16 – – – – 97 97 – –Portugal 1,100 10 – – – 16 – – – – 116 98 – –Qatar 151 8 – – – 15 – – – – 101 86 – –Republic of Korea 6,458 13 – – – 2 – – – – 100 94 – –Republic of Moldova 459 13 1 10 5 x 26 25 24 99 98 89 86 – –Romania 2,252 11 – – – 41 – – – – 96 98 – –Russian Federation 14,023 10 – – – 30 – – – – 90 86 – –Rwanda 2,356 22 0 3 5 41 35 56 88 73 43 20 44 49Saint Kitts and Nevis – – – – – 67 x – – – – 100 93 – –Saint Lucia 32 18 – – – 49 x – – – – 98 93 – –Saint Vincentand the Grenadines 21 19 – – – 70 – – – – 119 91 – –Samoa 44 24 1 7 5 29 50 58 97 97 105 76 5 2San Marino – – – – – 1 x – – – – 99 96 – –Sao Tome and Principe 40 24 1 20 25 110 25 23 96 95 71 19 39 39Saudi Arabia 4,926 18 – – – 7 – – – – 106 95 – –Senegal 3,004 24 1 24 22 93 31 61 86 81 – – 28 26Serbia 1,207 12 1 5 3 22 6 2 99 100 99 85 43 53Seychelles – – – – – 62 – – – – 131 104 – –Sierra Leone 1,366 23 – 23 38 98 x – 63 66 51 – – 26 16Singapore 747 14 – – – 6 – – – – – – – –Slovakia 635 12 – – – 21 – – – – 91 88 – –Slovenia 193 9 – – – 5 – – – – 96 98 – –Solomon Islands 121 22 0 13 15 70 x 73 72 71 54 – – 26 29Somalia 2,140 22 – 25 – 123 x – 75 y – – – – – 3 xSouth Africa 9,940 20 2 4 15 x 54 – – – – 96 92 – –South Sudan s – – – 40 28 – – 72 – – – – – 8Spain 4,299 9 – – – 13 – – – – 120 133 – –Sri Lanka 3,165 15 – 9 4 24 – 54 y – 88 y – – – –State of Palestine 1,040 25 1 13 – 60 – – – – 88 78 – –Sudan s – – – 24 14 – – 52 – – – – – 4Suriname 96 18 – 11 – 66 – 19 – – 89 56 – 41 xSwaziland 301 25 0 4 22 111 x 34 42 94 89 67 45 52 56Sweden 1,097 12 – – – 6 – – – – 97 101 – –Switzerland 867 11 – – – 4 – – – – 108 86 – –Syrian Arab Republic 4,786 23 – 10 9 x 75 x – – – – 92 37 – 6 xTajikistan 1,670 24 – 6 4 x 27 x – 85 y – – 98 61 9 11Thailand 10,192 15 – 15 8 x 47 – – – – 91 64 – 46 xThe former YugoslavRepublic of Macedonia 280 14 – 4 2 20 – 14 – – 90 78 – 23 xTimor-Leste 301 26 0 8 9 54 72 81 61 62 63 49 15 11Togo 1,416 23 0 12 17 – – 41 – – – – – 33Tonga 23 22 – – – 16 – – – – – – – –Trinidad and Tobago 189 14 – 6 – 33 – 10 – – 92 87 – 49 xTunisia 1,709 16 – – – 6 – – – – 116 73 – –Turkey 13,004 18 – 10 8 x 38 – 30 – – 96 64 – –Turkmenistan 1,013 20 – 5 2 x 21 – 37 y – 96 x – – – 4 xTuvalu – – 2 8 3 28 x 83 69 89 95 – – 57 31Uganda 8,326 24 2 20 33 159 x 52 62 88 82 35 13 36 36Ukraine 4,638 10 3 6 3 30 8 3 99 99 104 78 33 39United Arab Emirates 898 12 – – – 34 – – – – – – – –142THE STATE OF THE WORLD’S CHILDREN 2013: <strong>Children</strong> <strong>with</strong> <strong>Disabilities</strong>
TABLE 11AdOLESCENTSCountriesand areasJustification of wife Use of massLowersecondaryUppersecondaryComprehensiveknowledge ofProportion of Adolescents currentlybeating among media among school gross school gross HIV amongtotal population(%)married/in union (%)2002–2011*Births byage 18 (%)Adolescentbirth rateadolescents (%)2002–2011*adolescents (%)2002–2011*enrolmentratioenrolmentratioadolescents (%)2007–2011*2011 male female 2007–2011* 2006–2010* male female male female 2008–2011* 2008–2011* male femalePopulation aged 10–19Total(thousands)2011United Kingdom 7,442 12 – – – 25 – – – – 109 96 – –United Republic of Tanzania 10,475 23 4 18 28 128 39 52 79 70 – – 41 46United States 41,478 13 – – – 39 – – – – 103 90 – –Uruguay 524 15 – – – 60 – – – – 113 68 – –Uzbekistan 5,798 21 – 5 2 x 26 63 63 – – 96 124 – 27 xVanuatu 54 22 – 13 – – – – – – 65 41 – 14Venezuela(Bolivarian Republic of) 5,499 19 – 16 x – 101 – – – – 90 71 – –Viet Nam 15,251 17 – 8 3 35 – 35 97 94 88 65 – 51Yemen 6,073 25 – 19 – 80 x – – – – 54 34 – 2 x, yZambia 3,176 24 1 18 34 151 x 55 61 80 71 – – 38 36Zimbabwe 3,196 25 1 23 21 115 48 48 59 53 – – 42 46MEMORANDUMSudan and South Sudan s 10,044 23 – – – 70 – – – – – – – –SUMMARY INDICATORS #Sub–Saharan Africa 200,971 23 2 23 26 109 42 55 73 62 47 30 34 26Eastern and Southern Africa 94,195 22 3 19 26 102 46 55 71 64 49 30 38 35West and Central Africa 96,530 23 1 28 27 121 35 55 75 60 46 31 28 19Middle East and North Africa 82,134 20 – 14 – 37 – 57 – – 89 57 – –South Asia 333,425 20 5 29 22 38 56 52 88 71 75 45 34 15East Asia and Pacific 317,250 16 – 11 ** 8 ** 14 – 34 ** – 85 ** 89 68 – 20 **Latin America and Caribbean 108,552 18 – 18 – 77 – – – – 102 75 – –CEE/CIS 53,462 13 – 7 – 31 – 31 – – 95 80 – –Least developed countries 193,984 23 – 27 28 106 – 55 68 61 50 26 – 22World 1,199,890 17 – 22 ** 20 ** 43 – 49 ** – 73 ** 82 59 – 19 **s Due to the cession in July 2011 of the Republic of South Sudan by the Republic of the Sudan, and its subsequent admission to the United Nations on 14 July 2011, disaggregated data for the Sudanand South Sudan as separate States are not yet available for all indicators. Aggregated data presented are for the Sudan pre-cession (see Memorandum item).# For a complete list of countries and areas in the regions, subregions and country categories, see page 98.DEFINITIONS OF THE INDICATORSAdolescents currently married/in union – Percentage of boys and girls aged 15–19 who arecurrently married or in union. This indicator is meant to provide a snapshot of the current maritalstatus of boys and girls in this age group. However, it is worth noting that those not married at thetime of the survey are still exposed to the risk of marrying before they exit adolescence.Births by age 18 – Percentage of women aged 20–24 who gave birth before age 18. Thisstandardized indicator from population-based surveys captures levels of fertility among adolescentsup to the age of 18. Note that the data are based on the answers from women aged 20–24, whoserisk of giving birth before the age of 18 is behind them.Adolescent birth rate – Number of births per 1,000 adolescent girls aged 15–19.Justification of wife beating among adolescents – The percentage of boys and girls aged15–19 who consider a husband to be justified in hitting or beating his wife for at least one of thespecified reasons: if his wife burns the food, argues <strong>with</strong> him, goes out <strong>with</strong>out telling him, neglectsthe children or refuses sexual relations.Use of mass media among adolescents – The percentage of boys and girls aged 15–19 whouse at least one of the following types of information media, at least once a week: newspaper,magazine, television or radio.Lower secondary school gross enrolment ratio – Number of children enrolled in lowersecondary school, regardless of age, expressed as a percentage of the total number of children ofofficial lower secondary school age.Upper secondary school gross enrolment ratio – Number of children enrolled in uppersecondary school, regardless of age, expressed as a percentage of the total number of children ofofficial upper secondary school age.Comprehensive knowledge of HIV among adolescents – Percentage of young men andwomen aged 15–19 who correctly identify the two major ways of preventing the sexual transmissionof HIV (using condoms and limiting sex to one faithful, uninfected partner), who reject the two mostcommon local misconceptions about HIV transmission and who know that a healthy-looking personcan be HIV-positive.MAIN DATA SOURCESAdolescent population – United Nations Population Division.Adolescents currently married/in union – Demographic and Health Surveys (DHS),Multiple Indicator Cluster Surveys (MICS) and other national surveys.Births by age 18 – DHS and MICS.Adolescent birth rate – United Nations Population Division.Justification of wife beating among adolescents – DHS, MICS and other nationalsurveys.Use of mass media among adolescents – AIDS Indicator Surveys (AIS), DHS, MICS andother national surveys.Gross enrolment ratio – UNESCO Institute for Statistics (UIS).Comprehensive knowledge of HIV among adolescents – AIDS Indicator Surveys (AIS),DHS, MICS, Reproductive Health Surveys (RHS) and other national household surveys; HIV/AIDS Survey Indicators Database, .NOTES– Data not available.x Data refer to years or periods other than those specified in the column heading. Such dataare not included in the calculation of regional and global averages, <strong>with</strong> the exception of2005–2006 data from India. Estimates from data years prior to 2000 are not displayed.y Data differ from the standard definition or refer to only part of a country. If they fall <strong>with</strong>inthe noted reference period, such data are included in the calculation of regional andglobal averages.* Data refer to the most recent year available during the period specified in the columnheading.** Excludes China.STATISTICAL TABLES 143
TABLE 12: dISpARITIES By RESIdENCECountriesBirth registration (%)2005–2011*Skilled attendant atbirth (%)2007–2012*ratio ofurban torural urban ruralUnderweight prevalencein children under 5 (%)2007–2011*ratio ofurban torural urban ruralDiarrhoea treatment<strong>with</strong> oral rehydrationsalts (ORS) (%)2007−2012*ratio ofrural tourban urban ruralPrimary school netattendance ratio2007−2011*ratio ofurban torural urban ruralComprehensiveknowledge of HIV (%)Females 15−242007−2011*ratio ofurban torural urban ruralUse of improvedsanitation facilities (%)2010ratio ofurban torural urban ruraland areasurban ruralAfghanistan 60 33 1.8 74 31 2.4 – – – 48 54 0.9 73 x 47 x 1.6 x – – – 60 30 2.0Albania 99 98 1.0 100 99 1.0 5 6 1.2 33 x 36 x 0.9 x 90 91 1.0 51 26 2.0 95 93 1.0Algeria 99 99 1.0 98 x 92 x 1.1 x 3 x 4 x 1.4 x 18 x 19 x 1.0 x 98 x 95 x 1.0 x 16 x 10 x 1.7 x 98 88 1.1Andorra – – – – – – – – – – – – – – – – – – 100 100 1.0Angola 34 x 19 x 1.7 x 71 26 2.8 – – – – – – 85 67 1.3 – – – 85 19 4.5Antigua and Barbuda – – – – – – – – – – – – – – – – – – 98 – –Argentina – – – – – – – – – – – – – – – – – – – – –Armenia 99 100 1.0 100 99 1.0 3 7 2.6 22 x 28 x 0.8 x – – – 16 16 1.0 95 80 1.2Australia – – – – – – – – – – – – – – – – – – 100 100 1.0Austria – – – – – – – – – – – – – – – – – – 100 100 1.0Azerbaijan 96 92 1.0 97 x 80 x 1.2 x 4 x 12 x 3.1 x 19 x 5 x 3.6 x 74 x 72 x 1.0 x 7 x 2 x 3.3 x 86 78 1.1Bahamas – – – – – – – – – – – – – – – – – – 100 100 1.0Bahrain – – – – – – – – – – – – – – – – – – 100 – –Bangladesh 13 9 1.5 54 25 2.1 28 39 1.4 84 76 1.1 86 y 86 y 1.0 y – – – 57 55 1.0Barbados – – – – – – – – – – – – – – – – – – 100 100 1.0Belarus – – – 100 x 100 x 1.0 x 1 x 2 x 1.7 x 38 x 33 x 1.1 x 92 x 95 x 1.0 x – – – 91 97 0.9Belgium – – – – – – – – – – – – – – – – – – 100 100 1.0Belize 95 96 1.0 99 x 93 x 1.1 x 2 x 6 x 2.9 x – – – 97 x 94 x 1.0 x 49 x 29 x 1.7 x 93 87 1.1Benin 68 56 1.2 92 79 1.2 15 x 21 x 1.4 x 58 47 1.2 74 x 55 x 1.3 x 22 x 11 x 1.9 x 25 5 5.0Bhutan 100 100 1.0 90 54 1.6 11 14 1.3 64 60 1.1 96 90 1.1 32 15 2.1 73 29 2.5Bolivia (PlurinationalState of) 79 y 72 y 1.1 y 88 51 1.7 3 6 2.3 38 32 1.2 98 96 1.0 32 9 3.5 35 10 3.5Bosnia and Herzegovina 99 100 1.0 100 x 100 x 1.0 x 2 x 1 x 0.7 x 34 x 35 x 1.0 x 98 x 98 x 1.0 x 46 x 42 x 1.1 x 99 92 1.1Botswana 78 67 1.2 99 90 1.1 – – – 47 x 51 x 0.9 x 89 85 1.0 – – – 75 41 1.8Brazil – – – 98 x 94 x 1.0 x 2 x 2 x 0.8 x – – – – – – – – – 85 44 1.9Brunei Darussalam – – – – – – – – – – – – – – – – – – – – –Bulgaria – – – – – – – – – – – – – – – – – – 100 100 1.0Burkina Faso 93 74 1.3 93 61 1.5 – – – 31 19 1.6 79 x 38 x 2.1 x 46 24 1.9 50 6 8.3Burundi 87 74 1.2 88 58 1.5 18 30 1.7 33 38 0.9 87 73 1.2 59 43 1.4 49 46 1.1Cambodia 74 60 1.2 95 67 1.4 19 30 1.6 33 34 1.0 85 y 85 y 1.0 y 55 41 1.3 73 20 3.7Cameroon 86 58 1.5 87 47 1.9 7 20 2.8 27 12 2.2 90 x 71 x 1.3 x 42 x 18 x 2.4 x 58 36 1.6Canada – – – – – – – – – – – – – – – – – – 100 99 1.0Cape Verde – – – 91 x 64 x 1.4 x – – – – – – – – – – – – 73 43 1.7Central African Republic 78 52 1.5 83 38 2.2 23 24 1.0 23 12 2.0 66 x 42 x 1.6 x 21 x 13 x 1.6 x 43 28 1.5Chad 42 9 4.9 60 12 5.1 22 33 1.5 27 10 2.8 – – – 18 7 2.6 30 6 5.0Chile – – – 100 x 99 x 1.0 x – – – – – – – – – – – – 98 83 1.2China – – – 100 99 1.0 1 4 3.3 – – – – – – – – – 74 56 1.3Colombia 97 95 1.0 98 86 1.1 3 5 1.6 57 49 1.2 91 91 1.0 30 21 1.4 82 63 1.3Comoros 87 x 83 x 1.1 x 79 x 57 x 1.4 x – – – 25 x 17 x 1.5 x 41 x 29 x 1.4 x – – – 50 30 1.7Congo 88 y 75 y 1.2 y 98 86 1.1 8 x 15 x 2.0 x 38 27 1.4 – – – 9 6 1.5 20 15 1.3Cook Islands – – – – – – – – – – – – – – – – – – 100 100 1.0Costa Rica – – – 100 99 1.0 – – – – – – 96 96 1.0 – – – 95 96 1.0Côte d’Ivoire 79 41 2.0 84 45 1.9 9 x,y 20 x,y 2.2 x,y 22 14 1.5 67 x 48 x 1.4 x – – – 36 11 3.3Croatia – – – – – – – – – – – – – – – – – – 99 98 1.0Cuba 100 y 100 y 1.0 y – – – – – – 54 37 1.4 – – – 55 49 1.1 94 81 1.2Cyprus – – – – – – – – – – – – – – – – – – 100 100 1.0Czech Republic – – – – – – – – – – – – – – – – – – 99 97 1.0Democratic People’sRepublic of Korea 100 100 1.0 100 100 1.0 13 27 2.0 75 73 1.0 100 99 1.0 11 4 2.8 86 71 1.2Democratic Republicof the Congo 24 29 0.8 96 75 1.3 17 27 1.6 26 27 1.0 86 70 1.2 21 12 1.7 24 24 1.0Denmark – – – – – – – – – – – – – – – – – – 100 100 1.0Djibouti 90 82 1.1 95 x 40 x 2.3 x 18 y 27 y 1.5 y – – – 67 x 49 x 1.4 x 18 x 9 x 2.0 x 63 10 6.3Dominica – – – – – – – – – – – – – – – – – – – – –Dominican Republic 83 73 1.1 98 97 1.0 3 4 1.2 42 39 1.1 95 95 1.0 42 37 1.2 87 75 1.2Ecuador 89 92 1.0 98 x 99 x 1.0 x – – – – – – – – – – – – 96 84 1.1Egypt 99 99 1.0 90 72 1.2 6 6 1.0 28 29 1.0 91 87 1.0 7 3 2.3 97 93 1.0El Salvador 99 99 1.0 97 94 1.0 4 y 7 y 2.0 y 60 56 1.1 – – – – – – 89 83 1.1Equatorial Guinea 43 x 24 x 1.8 x 87 x 49 x 1.8 x – – – 43 x 19 x 2.2 x – – – – – – – – –Eritrea – – – 65 x 10 x 6.2 x 23 x 40 x 1.7 x 59 x 39 x 1.5 x – – – – – – – 4 –Estonia – – – – – – – – – – – – – – – – – – 96 94 1.0Ethiopia 29 5 5.9 51 4 12.7 16 30 1.9 45 24 1.9 86 61 1.4 38 19 2.0 29 19 1.5Fiji – – – – – – – – – – – – – – – – – – 94 71 1.3Finland – – – – – – – – – – – – – – – – – – 100 100 1.0ratio ofurban torural144THE STATE OF THE WORLD’S CHILDREN 2013: <strong>Children</strong> <strong>with</strong> <strong>Disabilities</strong>
TABLE 12disparities by residenceCountriesBirth registration (%)2005–2011*Skilled attendant atbirth (%)2007–2012*ratio ofurban torural urban ruralUnderweight prevalencein children under 5 (%)2007–2011*ratio ofurban torural urban ruralDiarrhoea treatment<strong>with</strong> oral rehydrationsalts (ORS) (%)2007−2012*ratio ofrural tourban urban ruralPrimary school netattendance ratio2007−2011*ratio ofurban torural urban ruralComprehensiveknowledge of HIV (%)Females 15−242007−2011*ratio ofurban torural urban ruralUse of improvedsanitation facilities (%)2010ratio ofurban torural urban ruraland areasurban ruralFrance – – – – – – – – – – – – – – – – – – 100 100 1.0Gabon 90 x 87 x 1.0 x 92 x 67 x 1.4 x – – – 23 x 29 x 0.8 x – – – – – – 33 30 1.1Gambia 54 52 1.0 77 41 1.9 12 22 1.9 39 39 1.0 53 35 1.5 41 24 1.7 70 65 1.1Georgia 99 98 1.0 99 x 98 x 1.0 x 1 1 1.6 44 x 36 x 1.2 x 97 95 1.0 – – – 96 93 1.0Germany – – – – – – – – – – – – – – – – – – 100 100 1.0Ghana 72 55 1.3 88 54 1.6 11 16 1.5 37 34 1.1 80 68 1.2 34 22 1.5 19 8 2.4Greece – – – – – – – – – – – – – – – – – – 99 97 1.0Grenada – – – – – – – – – – – – – – – – – – 96 97 1.0Guatemala 96 97 1.0 77 37 2.1 8 y 16 y 1.9 y 38 37 1.0 – – – 32 14 2.2 87 70 1.2Guinea 78 33 2.4 84 31 2.7 15 23 1.5 52 x 28 x 1.9 x – – – – – – 32 11 2.9Guinea-Bissau 30 21 1.4 69 x 27 x 2.6 x 13 21 1.6 28 13 2.1 84 57 1.5 22 8 2.8 44 9 4.9Guyana 91 87 1.0 98 90 1.1 7 12 1.7 42 x 38 x 1.1 x 96 94 1.0 72 47 1.5 88 82 1.1Haiti 87 78 1.1 47 x 15 x 3.0 x 12 x 20 x 1.7 x 51 x 35 x 1.4 x – – – 38 x 26 x 1.4 x 24 10 2.4Holy See – – – – – – – – – – – – – – – – – – – – –Honduras 95 93 1.0 90 x 50 x 1.8 x 4 x 11 x 2.4 x 55 x 56 x 1.0 x 92 x 86 x 1.1 x 37 x 21 x 1.8 x 85 69 1.2Hungary – – – – – – – – – – – – – – – – – – 100 100 1.0Iceland – – – – – – – – – – – – – – – – – – 100 100 1.0India 59 35 1.7 76 43 1.7 33 x 46 x 1.4 x 33 x 24 x 1.4 x – – – 33 x 14 x 2.4 x 58 23 2.5Indonesia 71 41 1.7 84 76 1.1 15 21 1.4 33 35 0.9 99 97 1.0 16 y 6 y 2.5 y 73 39 1.9Iran (Islamic Republic of) – – – – – – – – – – – – – – – – – – 100 100 1.0Iraq 95 96 1.0 86 71 1.2 6 x 7 x 1.1 x 30 x 32 x 0.9 x 92 x 78 x 1.2 x 4 x 1 x 4.4 x 76 67 1.1Ireland – – – – – – – – – – – – – – – – – – 100 98 1.0Israel – – – – – – – – – – – – – – – – – – 100 100 1.0Italy – – – – – – – – – – – – – – – – – – – – –Jamaica – – – 99 98 1.0 – – – – – – 97 x 98 x 1.0 x 66 60 1.1 78 82 1.0Japan – – – – – – – – – – – – – – – – – – 100 100 1.0Jordan – – – 99 99 1.0 2 2 1.3 20 20 1.0 – – – – – – 98 98 1.0Kazakhstan 100 100 1.0 100 x 100 x 1.0 x 3 x 5 x 1.7 x – – – 98 x 98 x 1.0 x 24 x 21 x 1.1 x 97 98 1.0Kenya 76 57 1.3 75 37 2.0 10 17 1.7 40 39 1.0 81 72 1.1 57 45 1.3 32 32 1.0Kiribati 95 93 1.0 84 77 1.1 – – – – – – – – – 45 43 1.1 – – –Kuwait – – – – – – – – – – – – – – – – – – 100 100 1.0Kyrgyzstan 96 93 1.0 100 x 96 x 1.0 x 2 x 2 x 0.9 x – – – 93 x 92 x 1.0 x 23 x 18 x 1.3 x 94 93 1.0Lao People’s DemocraticRepublic 84 68 1.2 68 x 11 x 6.2 x 20 x 34 x 1.7 x 79 x 43 x 1.9 x 93 x 75 x 1.2 x – – – 89 50 1.8Latvia – – – – – – – – – – – – – – – – – – – – –Lebanon – – – – – – – – – – – – – – – – – – 100 – –Lesotho 43 46 1.0 88 54 1.6 12 13 1.1 57 50 1.1 93 88 1.0 44 36 1.2 32 24 1.3Liberia 5 y 3 y 1.9 y 79 32 2.4 17 y 20 y 1.2 y 57 52 1.1 46 21 2.2 26 15 1.8 29 7 4.1Libya – – – – – – – – – – – – – – – – – – 97 96 1.0Liechtenstein – – – – – – – – – – – – – – – – – – – – –Lithuania – – – – – – – – – – – – – – – – – – 95 – –Luxembourg – – – – – – – – – – – – – – – – – – 100 100 1.0Madagascar 92 78 1.2 82 39 2.1 31 x 37 x 1.2 x 32 14 2.2 93 77 1.2 40 19 2.1 21 12 1.8Malawi – – – 84 69 1.2 10 13 1.3 72 69 1.0 88 x 88 x 1.0 x 56 38 1.5 49 51 1.0Malaysia – – – – – – – – – – – – – – – – – – 96 95 1.0Maldives 93 92 1.0 99 93 1.1 11 20 1.8 – – – 83 83 1.0 43 32 1.4 98 97 1.0Mali 92 77 1.2 80 x 38 x 2.1 x 20 x 29 x 1.5 x 26 x 11 x 2.3 x 79 52 1.5 19 12 1.5 35 14 2.5Malta – – – – – – – – – – – – – – – – – – 100 100 1.0Marshall Islands 96 96 1.0 97 68 1.4 – – – – – – – – – 33 12 2.7 83 53 1.6Mauritania 75 42 1.8 90 39 2.3 – – – 16 y 11 y 1.5 y 72 49 1.5 8 2 4.7 51 9 5.7Mauritius – – – – – – – – – – – – – – – – – – 91 88 1.0Mexico – – – 98 87 1.1 – – – – – – – – – – – – 87 79 1.1Micronesia(Federated States of) – – – – – – – – – – – – – – – – – – – – –Monaco – – – – – – – – – – – – – – – – – – 100 – –Mongolia 99 99 1.0 99 98 1.0 4 5 1.2 41 x 36 x 1.1 x 97 94 1.0 36 21 1.7 64 29 2.2Montenegro 98 99 1.0 100 x 98 x 1.0 x 2 x 1 x 0.7 x – – – 97 x 98 x 1.0 x – – – 92 87 1.1Morocco 92 x,y 80 x,y 1.1 x,y 92 55 1.7 2 4 2.5 28 x 18 x 1.5 x 96 x 83 x 1.2 x – – – 83 52 1.6Mozambique 39 28 1.4 78 46 1.7 10 17 1.7 65 50 1.3 89 78 1.1 43 32 1.4 38 5 7.6Myanmar 94 64 1.5 90 63 1.4 19 24 1.3 72 56 1.3 93 89 1.0 – – – 83 73 1.1Namibia 83 59 1.4 94 73 1.3 12 19 1.7 67 60 1.1 94 91 1.0 65 65 1.0 57 17 3.4Nauru – – – – – – – – – – – – – – – – – – 65 – –Nepal 44 42 1.0 73 32 2.3 17 30 1.8 44 39 1.1 70 y 69 y 1.0 y 40 24 1.7 48 27 1.8Netherlands – – – – – – – – – – – – – – – – – – 100 100 1.0ratio ofurban toruralSTATISTICAL TABLES 145
TABLE 12disparities by residenceCountriesand areasBirth registration (%)2005–2011*urbanruralSkilled attendant atbirth (%)2007–2012*ratio ofurban torural urban ruralUnderweight prevalencein children under 5 (%)2007–2011*ratio ofurban torural urban ruralDiarrhoea treatment<strong>with</strong> oral rehydrationsalts (ORS) (%)2007−2012*ratio ofrural tourban urban ruralPrimary school netattendance ratio2007−2011*ratio ofurban torural urban ruralComprehensiveknowledge of HIV (%)Females 15−242007−2011*ratio ofurban torural urban ruralUse of improvedsanitation facilities (%)2010ratio ofurban torural urban ruralNew Zealand – – – – – – – – – – – – – – – – – – – – –Nicaragua 87 y 77 y 1.1 y 92 56 1.7 4 7 1.7 64 55 1.2 76 y 64 y 1.2 y – – – 63 37 1.7Niger 71 y 25 y 2.9 y 71 x 8 x 8.5 x 44 y 39 y 0.9 y 31 x 16 x 2.0 x 71 x 32 x 2.2 x 31 x 8 x 3.8 x 34 4 8.5Nigeria 49 22 2.2 65 28 2.4 16 27 1.7 41 21 1.9 78 56 1.4 30 18 1.7 35 27 1.3Niue – – – – – – – – – – – – – – – – – – 100 100 1.0Norway – – – – – – – – – – – – – – – – – – 100 100 1.0Oman – – – – – – – – – – – – – – – – – – 100 95 1.1Pakistan 32 24 1.3 66 33 2.0 27 33 1.3 44 40 1.1 78 62 1.3 – – – 72 34 2.1Palau – – – – – – – – – – – – – – – – – – 100 100 1.0Panama – – – 99 84 1.2 – – – – – – – – – – – – – – –Papua New Guinea – – – 88 x 47 x 1.9 x 12 x 20 x 1.6 x – – – – – – – – – 71 41 1.7Paraguay – – – – – – – – – – – – 89 87 1.0 – – – 90 40 2.3Peru – – – 96 64 1.5 2 8 3.8 37 24 1.6 97 94 1.0 – – – 81 37 2.2Philippines 87 x 78 x 1.1 x 78 48 1.6 – – – 58 36 1.6 – – – 23 17 1.4 79 69 1.1Poland – – – – – – – – – – – – – – – – – – 96 – –Portugal – – – – – – – – – – – – – – – – – – 100 100 1.0Qatar – – – – – – – – – – – – – – – – – – 100 100 1.0Republic of Korea – – – – – – – – – – – – – – – – – – 100 100 1.0Republic of Moldova 98 x 98 x 1.0 x 100 x 99 x 1.0 x 2 x 4 x 2.0 x 9 x 6 x 1.5 x – – – – – – 89 82 1.1Romania – – – 100 x 98 x 1.0 x 3 x 4 x 1.3 x – – – – – – – – – – – –Russian Federation – – – – – – – – – – – – – – – – – – 74 59 1.3Rwanda 60 64 0.9 82 67 1.2 6 12 1.9 26 30 0.9 92 87 1.1 66 50 1.3 52 56 0.9Saint Kitts and Nevis – – – – – – – – – – – – – – – – – – 96 96 1.0Saint Lucia – – – – – – – – – – – – – – – – – – 71 63 1.1Saint Vincentand the Grenadines – – – – – – – – – – – – – – – – – – – 96 –Samoa 62 44 1.4 94 78 1.2 – – – – – – 89 y 88 y 1.0 y 5 2 2.4 98 98 1.0San Marino – – – – – – – – – – – – – – – – – – – – –Sao Tome and Principe 76 74 1.0 89 75 1.2 12 14 1.1 45 52 0.9 86 85 1.0 47 38 1.3 30 19 1.6Saudi Arabia – – – – – – – – – – – – – – – – – – 100 – –Senegal 89 66 1.4 91 49 1.8 12 21 1.8 24 21 1.2 81 50 1.6 41 18 2.2 70 39 1.8Serbia 99 99 1.0 100 100 1.0 2 1 0.7 50 22 2.3 99 98 1.0 63 41 1.5 96 88 1.1Seychelles – – – – – – – – – – – – – – – – – – 98 – –Sierra Leone 78 78 1.0 72 59 1.2 20 22 1.1 66 75 0.9 80 72 1.1 30 19 1.6 23 6 3.8Singapore – – – – – – – – – – – – – – – – – – 100 – –Slovakia – – – – – – – – – – – – – – – – – – 100 99 1.0Slovenia – – – – – – – – – – – – – – – – – – 100 100 1.0Solomon Islands – – – 95 84 1.1 8 12 1.5 – – – 72 y 65 y 1.1 y 34 28 1.2 98 – –Somalia 6 2 3.7 65 x 15 x 4.5 x 20 x 38 x 1.9 x 25 x 9 x 2.9 x 30 x 9 x 3.3 x 7 x 2 x 4.1 x 52 6 8.7South Africa – – – 94 x 85 x 1.1 x 10 x 9 x 0.9 x 41 x 32 x 1.3 x – – – – – – 86 67 1.3South Sudan s 45 32 1.4 31 15 2.0 23 29 1.3 44 37 1.2 47 23 2.0 16 7 2.3 – – –Spain – – – – – – – – – – – – – – – – – – 100 100 1.0Sri Lanka 97 98 1.0 99 99 1.0 – – – 57 50 1.1 – – – – – – 88 93 0.9State of Palestine 97 y 96 y 1.0 y 99 x 98 x 1.0 x – – – – – – – – – – – – 92 92 1.0Sudan s 85 50 1.7 41 16 2.5 24 35 1.5 23 22 1.1 89 69 1.3 10 3 3.4 – – –Suriname 98 95 1.0 95 x 82 x 1.2 x 7 x 8 x 1.1 x 24 x 60 x 0.4 x 96 x 91 x 1.1 x 45 x 32 x 1.4 x 90 66 1.4Swaziland 62 47 1.3 89 80 1.1 4 6 1.5 65 55 1.2 97 96 1.0 70 55 1.3 64 55 1.2Sweden – – – – – – – – – – – – – – – – – – 100 100 1.0Switzerland – – – – – – – – – – – – – – – – – – 100 100 1.0Syrian Arab Republic 96 95 1.0 99 93 1.1 9 x 9 x 1.0 x 56 x 44 x 1.3 x 89 x 85 x 1.0 x 7 x 7 x 1.0 x 96 93 1.0Tajikistan 85 90 0.9 95 86 1.1 12 16 1.3 70 78 0.9 97 y 97 y 1.0 y – – – 95 94 1.0Thailand 100 99 1.0 100 100 1.0 5 x 8 x 1.7 x 50 x 59 x 0.9 x 98 x 98 x 1.0 x 43 x 47 x 0.9 x 95 96 1.0The former YugoslavRepublic of Macedonia 100 100 1.0 98 98 1.0 1 2 2.3 19 x 30 x 0.6 x 99 98 1.0 33 x 18 x 1.8 x 92 82 1.1Timor-Leste 50 57 0.9 59 20 2.9 35 47 1.4 65 74 0.9 79 70 1.1 14 12 1.2 73 37 2.0Togo 93 71 1.3 91 43 2.1 10 20 1.9 15 10 1.5 94 86 1.1 39 27 1.4 26 3 8.7Tonga – – – – – – – – – – – – – – – – – – 98 96 1.0Trinidad and Tobago – – – – – – – – – – – – – – – – – – 92 92 1.0Tunisia – – – 98 x 89 x 1.1 x – – – 58 x 50 x 1.1 x – – – – – – 96 – –Turkey 95 92 1.0 96 80 1.2 1 3 2.1 – – – 94 y 91 y 1.0 y – – – 97 75 1.3Turkmenistan 96 95 1.0 100 x 99 x 1.0 x 7 x 9 x 1.2 x 32 x 45 x 0.7 x – – – 7 x 4 x 2.0 x 99 97 1.0Tuvalu 60 38 1.6 – – – – – – – – – – – – 38 41 0.9 88 81 1.1Uganda 38 29 1.3 89 52 1.7 7 15 2.3 46 43 1.1 85 y 81 y 1.1 y 48 35 1.4 34 34 1.0Ukraine 100 100 1.0 99 98 1.0 – – – – – – 71 76 0.9 48 37 1.3 96 89 1.1ratio ofurban torural146THE STATE OF THE WORLD’S CHILDREN 2013: <strong>Children</strong> <strong>with</strong> <strong>Disabilities</strong>
TABLE 12dISpARITIES By RESIdENCECountriesand areasBirth registration (%)2005–2011*urbanruralSkilled attendant atbirth (%)2007–2012*ratio ofurban torural urban ruralUnderweight prevalencein children under 5 (%)2007–2011*ratio ofurban torural urban ruralDiarrhoea treatment<strong>with</strong> oral rehydrationsalts (ORS) (%)2007−2012*ratio ofrural tourban urban ruralPrimary school netattendance ratio2007−2011*ratio ofurban torural urban ruralComprehensiveknowledge of HIV (%)Females 15−242007−2011*ratio ofurban torural urban ruralUse of improvedsanitation facilities (%)2010ratio ofurban torural urban ruralUnited Arab Emirates – – – – – – – – – – – – – – – – – – 98 95 1.0United Kingdom – – – – – – – – – – – – – – – – – – 100 100 1.0United Republic of Tanzania 44 10 4.6 83 40 2.0 11 17 1.5 44 44 1.0 91 77 1.2 55 45 1.2 20 7 2.9United States – – – – – – – – – – – – – – – – – – 100 99 1.0Uruguay – – – – – – – – – – – – – – – – – – 100 99 1.0Uzbekistan 100 100 1.0 100 x 100 x 1.0 x 4 x 4 x 0.9 x 34 x 31 x 1.1 x 97 x 95 x 1.0 x 33 x 30 x 1.1 x 100 100 1.0Vanuatu 39 23 1.7 87 72 1.2 11 11 1.0 – – – 85 80 1.1 23 13 1.8 64 54 1.2Venezuela(Bolivarian Republic of) – – – – – – – – – – – – – – – – – – – – –Viet Nam 97 94 1.0 99 91 1.1 6 14 2.3 47 46 1.0 98 98 1.0 58 48 1.2 94 68 1.4Yemen 38 16 2.3 62 x 26 x 2.3 x – – – 30 x 34 x 0.9 x 83 x 64 x 1.3 x 4 x 1 x 6.7 x 93 34 2.7Zambia 28 9 3.2 83 31 2.7 13 15 1.2 59 60 1.0 91 77 1.2 42 27 1.6 57 43 1.3Zimbabwe 65 43 1.5 86 58 1.5 8 10 1.3 26 18 1.4 89 88 1.0 59 47 1.3 52 32 1.6MEMORANDUMSudan and South Sudan s – – – – – – – – – – – – – – – – – – 44 † 14 † 3.1 †ratio ofurban toruralSUMMARY INDICATORS #Sub-Saharan Africa 56 33 1.7 76 40 1.9 15 24 1.6 38 31 1.2 83 67 1.2 34 25 1.4 43 23 1.9Eastern and SouthernAfrica 49 28 1.7 75 36 2.1 12 20 1.7 46 38 1.2 87 72 1.2 48 32 1.5 54 27 2.0West and Central Africa 57 36 1.6 78 46 1.7 16 26 1.7 35 23 1.5 80 61 1.3 29 16 1.8 35 20 1.8Middle East and NorthAfrica 91 72 1.3 84 57 1.5 – – – – – – – – – – – – 91 70 1.3South Asia 52 32 1.6 73 40 1.8 31 43 1.4 39 32 1.2 – – – 33 14 2.3 60 28 2.1East Asia and the Pacific 80 ** 65 ** 1.2 ** 95 88 1.1 5 10 2.0 46 ** 41 ** 1.1 ** 98 ** 95 ** 1.0 ** 24 ** 21 ** 1.1 ** 77 58 1.3Latin Americaand the Caribbean – – – – – – – – – – – – – – – – – – 84 60 1.4CEE/CIS 97 96 1.0 – – – – – – – – – – – – – – – 87 80 1.1Least developed countries 50 31 1.6 76 40 1.9 18 27 1.5 47 41 1.1 86 73 1.2 35 24 1.4 48 30 1.6World 65 ** 41 ** 1.6 ** 84 53 1.6 15 28 1.9 40 ** 33 ** 1.2 ** – – – – 18 ** – 79 47 1.7s Due to the cession in July 2011 of the Republic of South Sudan by the Republic of the Sudan, and its subsequent admission to the United Nations on 14 July 2011, disaggregated data for the Sudanand South Sudan as separate States are not yet available for all indicators. Aggregated data presented are for the Sudan pre-cession (see Memorandum item).# For a complete list of countries and areas in the regions, subregions and country categories, see page 98.DEFINITIONS OF THE INDICATORSBirth registration – Percentage of children under age 5 who were registeredat the moment of the survey. This includes children whose birth certificate wasseen by the interviewer or whose mother or caretaker says the birth has beenregistered.Skilled attendant at birth – Percentage of births attended by skilled healthpersonnel (doctor, nurse or midwife).Underweight prevalence in children under 5 – Percentage of children underage 5 who are below minus two standard deviations from median weight-forageof the World Health Organization (WHO) Child Growth Standards.Diarrhoea treatment <strong>with</strong> oral rehydration salts (ORS) – Percentageof children under age 5 who had diarrhoea in the two weeks preceding thesurvey and who received oral rehydration salts (ORS packets or pre-packagedORS fluids).Primary school net attendance ratio – Number of children attendingprimary or secondary school who are of official primary school age, expressedas a percentage of the total number of children of official primary school age.Because of the inclusion of primary-school-aged children attending secondaryschool, this indicator can also be referred to as a primary adjusted netattendance ratio.Comprehensive knowledge of HIV – Percentage of young women (aged15–24) who correctly identify the two major ways of preventing the sexualtransmission of HIV (using condoms and limiting sex to one faithful, uninfectedpartner), who reject the two most common local misconceptions about HIVtransmission and who know that a healthy-looking person can be HIV-positive.Use of improved sanitation facilities – Percentage of the population usingany of the following sanitation facilities, not shared <strong>with</strong> other households:flush or pour-flush latrine connected to a piped sewerage system, septic tankor pit latrine; ventilated improved pit latrine; pit latrine <strong>with</strong> a slab; covered pit;composting toilet.MAIN DATA SOURCESBirth registration – Demographic and Health Surveys (DHS), Multiple Indicator Cluster Surveys (MICS), othernational surveys and vital registration systems.Skilled attendant at birth – DHS, MICS and other nationally representative sources.Underweight prevalence in children under 5 – DHS, MICS, other national household surveys, WHO and UNICEF.Diarrhoea treatment <strong>with</strong> oral rehydration salts (ORS) – DHS, MICS and other national household surveys.Primary school net attendance ratio – DHS, MICS and other national household surveys.Comprehensive knowledge of HIV – AIDS Indicator Surveys (AIS), DHS, MICS and other national householdsurveys; HIV/AIDS Survey Indicators Database, .Use of improved sanitation facilities – UNICEF and WHO Joint Monitoring Programme.Italicized disparity data are from different sources than the data for the same indicators presentedelsewhere in the report: Table 2 (Nutrition – Underweight prevalence), Table 3 (Health – Diarrhoeatreatment), Table 4 (HIV/AIDS – Comprehensive knowledge of HIV) and Table 8 (Women – Skilledattendant at birth).NOTES− Data not available.x Data refer to years or periods other than those specified in the column heading. Such data are not included inthe calculation of regional and global averages, <strong>with</strong> the exception of 2005–2006 data from India. Estimatesfrom data years prior to 2000 are not displayed.y Data differ from the standard definition or refer to only part of a country. If they fall <strong>with</strong>in the notedreference period, such data are included in the calculation of regional and global averages.† The WHO/UNICEF Joint Monitoring Programme For Water Supply and Sanitation (JMP) closed its databasesfor these estimates before the cession of the Republic of South Sudan by the Republic of the Sudan.Aggregated data presented are for the Sudan pre-cession. Disaggregated data for the Sudan and SouthSudan as separate States will be published by the JMP in 2013.* Data refer to the most recent year available during the period specified in the column heading.** Excludes China.STATISTICAL TABLES 147
TABLE 13: dISpARITIES By HOuSEHOLd WEALTHCountriesBirth registration (%)2005–2011*ratio ofrichest to poorestpoorest 20%Skilled attendant atbirth (%)2007–2012*ratio ofrichest to poorestpoorest 20%Underweight prevalencein children under 5 (%)2007–2011*ratio ofpoorest to poorestrichest 20%Diarrhoea treatment<strong>with</strong> oral rehydrationsalts (ORS) (%)2007−2012*ratio ofrichest to poorestpoorest 20%Primary school netattendance ratio2007−2011*ratio ofrichest to poorestpoorest 20%Comprehensiveknowledge of HIV(%) Females 15−242007−2011*ratio ofrichest to poorestpoorest 20%Comprehensiveknowledge of HIV(%) Males 15−242007−2011*and areaspoorest richestrichestrichestrichestrichestrichestrichest20% 20%20%20%20%20%20%20%Afghanistan 31 58 1.9 16 76 4.9 – – – 56 52 0.9 – – – – – – – – –Albania 98 99 1.0 98 100 1.0 8 4 2.2 – – – 89 91 1.0 20 60 3.0 10 38 3.8Algeria – – – 88 x 98 x 1.1 x 5 x 2 x 2.4 x 15 x 19 x 1.2 x 93 x 98 x 1.1 x 5 x 20 x 3.7 x – – –Andorra – – – – – – – – – – – – – – – – – – – – –Angola 17 x 48 x 2.8 x – – – – – – – – – 63 78 1.2 – – – – – –Antigua and Barbuda – – – – – – – – – – – – – – – – – – – – –Argentina – – – – – – – – – – – – – – – – – – – – –Armenia 100 100 1.0 99 100 1.0 8 2 5.3 – – – – – – – – – – – –Australia – – – – – – – – – – – – – – – – – – – – –Austria – – – – – – – – – – – – – – – – – – – – –Azerbaijan 92 97 1.1 76 x 100 x 1.3 x 15 x 2 x 7.0 x 3 x 36 x 13.3 x 72 x 78 x 1.1 x 1 x 12 x 10.3 x 2 x 14 x 6.3 xBahamas – – – – – – – – – – – – – – – – – – – – –Bahrain – – – – – – – – – – – – – – – – – – – – –Bangladesh 6 19 3.0 12 64 5.5 50 21 2.4 81 82 1.0 – – – – – – – – –Barbados – – – – – – – – – – – – – – – – – – – – –Belarus – – – 100 x 100 x 1.0 x 2 x 0 x 6.7 x – – – 96 x 94 x 1.0 x – – – – – –Belgium – – – – – – – – – – – – – – – – – – – – –Belize 95 97 1.0 – – – – – – – – – – – – 28 x 55 x 2.0 x – – –Benin 46 75 1.6 52 x 96 x 1.9 x 25 x 10 x 2.4 x 15 x 32 x 2.1 x 39 x 63 x 1.6 x 9 x 26 x 3.1 x 17 x 52 x 3.0 xBhutan 100 100 1.0 34 95 2.8 16 7 2.2 60 56 0.9 85 94 1.1 7 32 4.4 – – –Bolivia (PlurinationalState of) 68 y 90 y 1.3 y 38 99 2.6 8 2 3.8 31 35 1.1 95 97 1.0 5 40 8.4 11 45 4.3Bosnia and Herzegovina 99 100 1.0 99 x 100 x 1.0 x 2 x 3 x 0.5 x – – – 99 x 98 x 1.0 x 46 x 49 x 1.1 x – – –Botswana – – – 84 x 100 x 1.2 x 16 4 4.0 – – – – – – – – – – – –Brazil – – – – – – – – – – – – – – – – – – – – –Brunei Darussalam – – – – – – – – – – – – – – – – – – – – –Bulgaria – – – – – – – – – – – – – – – – – – – – –Burkina Faso 62 95 1.5 46 92 2.0 38 x 18 x 2.1 x 13 31 2.5 33 x 39 x 1.2 x 8 x 37 x 4.4 x – – –Burundi 64 87 1.4 51 81 1.6 41 17 2.4 35 42 1.2 64 87 1.4 – – – – – –Cambodia 48 78 1.6 49 97 2.0 35 16 2.2 32 34 1.1 79 y 86 y 1.1 y 28 58 2.1 30 64 2.1Cameroon 51 91 1.8 23 x 98 x 4.4 x – – – 5 x 34 x 6.8 x 50 x 87 x 1.7 x 12 x 50 x 4.0 x – – –Canada – – – – – – – – – – – – – – – – – – – – –Cape Verde – – – – – – – – – – – – – – – – – – – – –Central African Republic 46 85 1.8 33 87 2.6 26 19 1.4 11 28 2.5 31 x 48 x 1.5 x 14 23 1.6 19 33 1.7Chad 5 46 9.2 8 61 7.6 33 21 1.6 5 29 5.3 – – – 6 18 2.9 – – –Chile – – – – – – – – – – – – – – – – – – – – –China – – – – – – – – – – – – – – – – – – – – –Colombia – – – 84 99 1.2 6 2 3.0 47 61 1.3 90 93 1.0 15 32 2.2 – – –Comoros 72 x 93 x 1.3 x 49 x 77 x 1.6 x – – – 16 x 24 x 1.5 x 25 x 39 x 1.6 x – – – – – –Congo 69 y 91 y 1.3 y 40 x 95 x 2.4 x 16 x 5 x 3.1 x 13 x 18 x 1.4 x – – – 5 12 2.4 12 27 2.3Cook Islands – – – – – – – – – – – – – – – – – – – – –Costa Rica – – – – – – – – – – – – – – – – – – – – –Côte d’Ivoire 28 89 3.2 29 x 95 x 3.3 x 21 x,y 6 x,y 3.4 x,y 6 x 12 x 2.0 x 35 x 55 x 1.6 x – – – – – –Croatia – – – – – – – – – – – – – – – – – – – – –Cuba – – – – – – – – – – – – – – – – – – – – –Cyprus – – – – – – – – – – – – – – – – – – – – –Czech Republic – – – – – – – – – – – – – – – – – – – – –Democratic People’sRepublic of Korea – – – – – – – – – – – – – – – – – – – – –DemocraticRepublic of the Congo 25 27 1.1 69 99 1.4 29 12 2.3 28 26 0.9 65 73 1.1 8 24 2.8 14 30 2.2Denmark – – – – – – – – – – – – – – – – – – – – –Djibouti – – – – – – – – – – – – – – – – – – – – –Dominica – – – – – – – – – – – – – – – – – – – – –Dominican Republic 61 93 1.5 95 99 1.0 5 1 4.4 41 38 0.9 92 98 1.1 31 46 1.5 21 41 2.0Ecuador – – – 99 x 98 x 1.0 x – – – – – – – – – – – – – – –Egypt 99 100 1.0 55 97 1.8 8 5 1.4 34 23 0.7 81 93 1.1 2 9 4.9 9 28 3.1El Salvador 98 99 1.0 91 98 1.1 12 y 1 y 12.9 y – – – – – – – – – – – –Equatorial Guinea – – – 47 x 85 x 1.8 x – – – 24 x 37 x 1.5 x – – – – – – – – –Eritrea – – – 7 x 81 x 12.1 x – – – – – – – – – – – – – – –Estonia – – – – – – – – – – – – – – – – – – – – –Ethiopia 3 18 7.0 2 46 26.8 36 15 2.4 18 45 2.5 52 86 1.7 – – – – – –Fiji – – – – – – – – – – – – – – – – – – – – –Finland – – – – – – – – – – – – – – – – – – – – –ratio ofrichest topoorest148THE STATE OF THE WORLD’S CHILDREN 2013: <strong>Children</strong> <strong>with</strong> <strong>Disabilities</strong>
TABLE 13dISpARITIES By HOuSEHOLd WEALTHCountriesBirth registration (%)2005–2011*ratio ofrichest to poorestpoorest 20%Skilled attendant atbirth (%)2007–2012*ratio ofrichest to poorestpoorest 20%Underweight prevalencein children under 5 (%)2007–2011*ratio ofpoorest to poorestrichest 20%Diarrhoea treatment<strong>with</strong> oral rehydrationsalts (ORS) (%)2007−2012*ratio ofrichest to poorestpoorest 20%Primary school netattendance ratio2007−2011*ratio ofrichest to poorestpoorest 20%Comprehensiveknowledge of HIV(%) Females 15−242007−2011*ratio ofrichest to poorestpoorest 20%Comprehensiveknowledge of HIV(%) Males 15−242007−2011*and areaspoorest richestrichestrichestrichestrichestrichestrichest20% 20%20%20%20%20%20%20%France – – – – – – – – – – – – – – – – – – – – –Gabon 88 x 92 x 1.0 x – – – – – – – – – – – – – – – – – –Gambia 46 61 1.3 34 58 1.7 24 9 2.6 43 32 0.7 28 42 1.5 20 48 2.4 – – –Georgia 99 98 1.0 95 x 99 x 1.0 x – – – – – – 92 96 1.0 – – – – – –Germany – – – – – – – – – – – – – – – – – – – – –Ghana 47 82 1.7 39 98 2.5 19 9 2.2 45 34 0.7 61 86 1.4 17 34 2.1 23 50 2.1Greece – – – – – – – – – – – – – – – – – – – – –Grenada – – – – – – – – – – – – – – – – – – – – –Guatemala – – – 20 95 4.7 21 y 3 y 6.5 y 39 51 1.3 – – – 5 41 7.8 – – –Guinea 21 83 4.0 26 57 2.2 24 19 1.3 18 x 59 x 3.3 x – – – – – – – – –Guinea-Bissau 17 35 2.0 19 x 79 x 4.0 x 22 11 2.1 16 37 2.3 52 87 1.7 6 25 4.3 – – –Guyana 84 92 1.1 81 96 1.2 16 4 3.8 – – – 91 97 1.1 37 72 2.0 25 65 2.6Haiti 72 92 1.3 6 x 68 x 10.5 x 22 x 6 x 3.6 x 29 x 50 x 1.7 x – – – 18 x 41 x 2.2 x 28 x 52 x 1.9 xHoly See – – – – – – – – – – – – – – – – – – – – –Honduras 92 96 1.0 33 x 99 x 2.9 x 16 x 2 x 8.1 x 56 x 47 x 0.8 x 80 x 90 x 1.1 x 13 x 44 x 3.4 x – – –Hungary – – – – – – – – – – – – – – – – – – – – –Iceland – – – – – – – – – – – – – – – – – – – – –India 24 72 3.0 24 85 3.6 57 x 20 x 2.9 x 19 x 43 x 2.3 x – – – 4 x 45 x 11.7 x 15 x 55 x 3.8 xIndonesia 23 84 3.7 65 86 1.3 23 10 2.2 32 27 0.9 – – – 3 23 7.5 2 27 12.2Iran (Islamic Republic of) – – – – – – – – – – – – – – – – – – – – –Iraq – – – – – – – – – – – – – – – – – – – – –Ireland – – – – – – – – – – – – – – – – – – – – –Israel – – – – – – – – – – – – – – – – – – – – –Italy – – – – – – – – – – – – – – – – – – – – –Jamaica 96 99 1.0 97 98 1.0 – – – – – – – – – 54 69 1.3 – – –Japan – – – – – – – – – – – – – – – – – – – – –Jordan – – – 98 100 1.0 3 0 26.0 18 30 1.6 – – – – – – – – –Kazakhstan 100 100 1.0 100 x 100 x 1.0 x 5 x 2 x 2.8 x – – – 99 x 98 x 1.0 x 18 x 28 x 1.6 x – – –Kenya 48 80 1.7 20 81 4.0 25 9 2.8 40 37 0.9 58 78 1.3 29 61 2.1 42 68 1.6Kiribati 93 94 1.0 76 93 1.2 – – – – – – – – – 42 49 1.2 38 52 1.4Kuwait – – – – – – – – – – – – – – – – – – – – –Kyrgyzstan 94 95 1.0 93 x 100 x 1.1 x 2 x 2 x 0.8 x – – – 94 x 91 x 1.0 x 17 x 29 x 1.7 x – – –Lao People’sDemocratic Republic 62 85 1.4 3 x 81 x 27.1 x 38 x 14 x 2.7 x 42 x 80 x 1.9 x 59 x 84 x 1.4 x – – – – – –Latvia – – – – – – – – – – – – – – – – – – – – –Lebanon – – – – – – – – – – – – – – – – – – – – –Lesotho 42 49 1.2 35 90 2.6 18 9 1.9 – – – 83 94 1.1 26 48 1.8 14 45 3.3Liberia 1 y 7 y 6.1 y 26 81 3.2 21 y 13 y 1.6 y 41 64 1.6 15 56 3.7 14 29 2.1 17 37 2.2Libya – – – – – – – – – – – – – – – – – – – – –Liechtenstein – – – – – – – – – – – – – – – – – – – – –Lithuania – – – – – – – – – – – – – – – – – – – – –Luxembourg – – – – – – – – – – – – – – – – – – – – –Madagascar 61 93 1.5 22 90 4.1 40 x 24 x 1.7 x 12 29 2.4 59 96 1.6 10 42 4.3 8 49 6.5Malawi – – – 63 89 1.4 17 13 1.3 67 73 1.1 71 x 90 x 1.3 x 34 55 1.6 35 54 1.5Malaysia – – – – – – – – – – – – – – – 23 48 2.0 – – –Maldives 92 94 1.0 89 99 1.1 24 11 2.3 – – – 82 82 1.0 9 19 2.0 – – –Mali 65 96 1.5 35 x 86 x 2.5 x 31 x 17 x 1.8 x 8 x 29 x 3.5 x 37 56 1.5 – – – – – –Malta – – – – – – – – – – – – – – – – – – – – –Marshall Islands 92 98 1.1 68 99 1.5 – – – – – – – – – 12 39 3.3 37 58 1.6Mauritania 28 83 2.9 21 95 4.6 – – – 10 34 3.2 41 59 1.5 0 12 29.5 4 27 6.2Mauritius – – – – – – – – – – – – – – – – – – – – –Mexico – – – – – – – – – – – – – – – – – – – – –Micronesia(Federated States of) – – – – – – – – – – – – – – – – – – – – –Monaco – – – – – – – – – – – – – – – – – – – – –Mongolia 99 99 1.0 98 99 1.0 6 2 2.7 – – – 93 98 1.1 17 42 2.5 12 48 4.1Montenegro 94 99 1.0 98 x 100 x 1.0 x 4 x 1 x 4.1 x – – – 92 x 100 x 1.1 x – – – – – –Morocco – – – 30 x 95 x 3.2 x – – – 18 x 25 x 1.4 x 77 x 95 x 1.2 x – – – – – –Mozambique 20 48 2.4 37 89 2.4 – – – 40 50 1.3 72 80 1.1 41 43 1.1 16 45 2.7Myanmar 50 96 1.9 51 96 1.9 33 14 2.5 52 75 1.4 81 94 1.2 – – – – – –Namibia 46 92 2.0 60 98 1.6 22 7 3.1 50 59 1.2 88 97 1.1 61 69 1.1 55 67 1.2Nauru 71 88 1.2 97 98 1.0 7 3 2.7 – – – – – – 13 y 10 y 0.8 y – 25 y –Nepal 36 52 1.5 11 82 7.6 40 10 4.0 39 36 0.9 66 y 76 y 1.2 y 12 x 49 x 4.3 x 30 x 59 x 2.0 xNetherlands – – – – – – – – – – – – – – – – – – – – –ratio ofrichest topoorestSTATISTICAL TABLES 149
TABLE 13dISpARITIES By HOuSEHOLd WEALTHCountriesand areasBirth registration (%)2005–2011*poorest20%richest20%ratio ofrichest to poorestpoorest 20%Skilled attendant atbirth (%)2007–2012*richest20%ratio ofrichest to poorestpoorest 20%Underweight prevalencein children under 5 (%)2007–2011*richest20%ratio ofpoorest to poorestrichest 20%Diarrhoea treatment<strong>with</strong> oral rehydrationsalts (ORS) (%)2007−2012*Primary school netattendance ratio2007−2011*Comprehensiveknowledge of HIV(%) Females 15−242007−2011*Comprehensiveknowledge of HIV(%) Males 15−242007−2011*New Zealand – – – – – – – – – – – – – – – – – – – – –Nicaragua 72 y 93 y 1.3 y 42 99 2.4 9 1 6.6 53 64 1.2 – – – – – – – – –Niger 20 y 67 y 3.3 y 5 x 59 x 11.8 x – – – 14 x 32 x 2.3 x 26 x 32 x 1.2 x 5 x 30 x 6.5 x 6 x 34 x 5.8 xNigeria 9 62 7.0 8 86 10.3 35 10 3.5 15 53 3.5 31 72 2.4 9 34 3.6 18 41 2.2Niue – – – – – – – – – – – – – – – – – – – – –Norway – – – – – – – – – – – – – – – – – – – – –Oman – – – – – – – – – – – – – – – – – – – – –Pakistan 18 38 2.1 16 77 4.8 – – – 41 44 1.1 42 74 1.8 – – – – – –Palau – – – – – – – – – – – – – – – – – – – – –Panama – – – – – – – – – – – – – – – – – – – – –Papua New Guinea – – – – – – – – – – – – – – – – – – – – –Paraguay – – – – – – – – – – – – – – – – – – – – –Peru – – – 56 100 1.8 9 1 15.7 27 42 1.6 92 97 1.1 – – – – – –Philippines – – – 26 94 3.7 – – – 37 55 1.5 – – – 14 26 1.8 – – –Poland – – – – – – – – – – – – – – – – – – – – –Portugal – – – – – – – – – – – – – – – – – – – – –Qatar – – – – – – – – – – – – – – – – – – – – –Republic of Korea – – – – – – – – – – – – – – – – – – – – –Republic of Moldova 97 x 98 x 1.0 x 99 x 100 x 1.0 x 5 x 1 x 8.2 x – – – – – – – – – – – –Romania – – – – – – – – – – – – – – – – – – – – –Russian Federation – – – – – – – – – – – – – – – – – – – – –Rwanda 58 64 1.1 61 86 1.4 16 5 3.0 22 37 1.7 80 94 1.2 – – – – – –Saint Kitts and Nevis – – – – – – – – – – – – – – – – – – – – –Saint Lucia – – – – – – – – – – – – – – – – – – – – –Saint Vincentand the Grenadines – – – – – – – – – – – – – – – – – – – – –Samoa 31 63 2.1 66 95 1.4 – – – – – – 85 y 91 y 1.1 y 3 3 1.0 3 9 2.7San Marino – – – – – – – – – – – – – – – – – – – – –Sao Tome and Principe 74 86 1.1 74 93 1.3 18 7 2.6 – – – 75 95 1.3 27 56 2.0 39 55 1.4Saudi Arabia – – – – – – – – – – – – – – – – – – – – –Senegal 50 94 1.9 30 96 3.2 24 10 2.4 21 31 1.5 47 78 1.7 – – – – – –Serbia 97 100 1.0 99 100 1.0 3 2 1.4 – – – 96 98 1.0 28 69 2.4 28 66 2.4Seychelles – – – – – – – – – – – – – – – – – – – – –Sierra Leone 74 88 1.2 44 85 1.9 22 15 1.4 75 70 0.9 59 88 1.5 14 36 2.6 – – –Singapore – – – – – – – – – – – – – – – – – – – – –Slovakia – – – – – – – – – – – – – – – – – – – – –Slovenia – – – – – – – – – – – – – – – – – – – – –Solomon Islands – – – 74 95 1.3 14 10 1.4 – – – 58 y 61 y 1.1 y 17 37 2.1 35 50 1.5Somalia 1 7 6.6 11 x 77 x 7.2 x 42 x 14 x 3.0 x 7 x 31 x 4.8 x 3 x 40 x 12.5 x 1 x 8 x 13.5 x – – –South Africa – – – – – – – – – – – – – – – – – – – – –South Sudan s 21 57 2.7 8 41 5.1 32 21 1.6 27 52 1.9 12 58 4.7 3 18 6.1 – – –Spain – – – – – – – – – – – – – – – – – – – – –Sri Lanka 97 98 1.0 97 99 1.0 29 11 2.6 – – – – – – – – – – – –State of Palestine – – – 98 x 100 x 1.0 x – – – – – – – – – – – – – – –Sudan s 26 98 3.8 6 59 10.5 40 17 2.4 21 16 0.7 55 97 1.8 1 11 13.6 – – –Suriname 94 98 1.0 81 x 96 x 1.2 x 9 x 5 x 1.8 x – – – 88 x 97 x 1.1 x 23 x 54 x 2.4 x – – –Swaziland 39 73 1.9 65 94 1.4 8 4 2.3 58 60 1.0 95 99 1.0 49 72 1.5 44 64 1.5Sweden – – – – – – – – – – – – – – – – – – – – –Switzerland – – – – – – – – – – – – – – – – – – – – –Syrian Arab Republic 92 99 1.1 78 x 99 x 1.3 x 10 x 7 x 1.5 x 45 x 59 x 1.3 x – – – 4 x 10 x 2.9 x – – –Tajikistan 89 86 1.0 90 90 1.0 17 13 1.3 52 x 50 x 1.0 x 96 y 96 y 1.0 y – – – – – –Thailand 99 100 1.0 93 x 100 x 1.1 x 11 x 3 x 3.3 x 56 x 54 x 1.0 x 97 x 98 x 1.0 x 47 x 43 x 0.9 x – – –The former YugoslavRepublic of Macedonia 99 100 1.0 98 98 1.0 2 0 – – – – 97 99 1.0 9 x 45 x 5.0 x – – –Timor-Leste 50 56 1.1 10 69 6.9 49 35 1.4 70 71 1.0 60 83 1.4 9 16 1.8 11 35 3.0Togo 59 97 1.7 28 94 3.4 21 9 2.5 8 19 2.5 80 92 1.2 18 42 2.3 20 55 2.7Tonga – – – – – – – – – – – – – – – – – – – – –Trinidad and Tobago 94 98 1.0 98 100 1.0 – – – – – – 95 x 99 x 1.0 x 48 x 62 x 1.3 x – – –Tunisia – – – – – – – – – – – – – – – – – – – – –Turkey 89 99 1.1 73 100 1.4 4 1 8.4 – – – 87 y 95 y 1.1 y – – – – – –Turkmenistan 94 97 1.0 99 x 100 x 1.0 x 8 x 2 x 3.2 x 45 x 30 x 0.7 x – – – 3 x 8 x 2.8 x – – –Tuvalu 39 71 1.8 99 98 1.0 1 0 – – – – – – – 34 y 39 1.2 y – 67 y –Uganda 27 44 1.6 43 88 2.0 – – – 43 45 1.1 – – – 20 x 47 x 2.3 x 28 x 47 x 1.6 xUkraine 100 100 1.0 97 99 1.0 – – – – – – 78 75 1.0 33 45 1.4 28 42 1.5richest20%ratio ofrichest to poorestpoorest 20%richest20%ratio ofrichest to poorestpoorest 20%richest20%ratio ofrichest to poorestpoorest 20%richest20%ratio ofrichest topoorest150THE STATE OF THE WORLD’S CHILDREN 2013: <strong>Children</strong> <strong>with</strong> <strong>Disabilities</strong>
TABLE 13dISpARITIES By HOuSEHOLd WEALTHCountriesand areasBirth registration (%)2005–2011*poorest20%richest20%ratio ofrichest to poorestpoorest 20%Skilled attendant atbirth (%)2007–2012*richest20%ratio ofrichest to poorestpoorest 20%Underweight prevalencein children under 5 (%)2007–2011*richest20%ratio ofpoorest to poorestrichest 20%Diarrhoea treatment<strong>with</strong> oral rehydrationsalts (ORS) (%)2007−2012*Primary school netattendance ratio2007−2011*Comprehensiveknowledge of HIV(%) Females 15−242007−2011*Comprehensiveknowledge of HIV(%) Males 15−242007−2011*United Arab Emirates – – – – – – – – – – – – – – – – – – – – –United Kingdom – – – – – – – – – – – – – – – – – – – – –United Republic of Tanzania 4 56 12.7 31 90 2.9 22 9 2.3 41 38 0.9 68 93 1.4 39 55 1.4 34 56 1.7United States – – – – – – – – – – – – – – – – – – – – –Uruguay – – – – – – – – – – – – – – – – – – – – –Uzbekistan 100 100 1.0 100 x 100 x 1.0 x 5 x 3 x 1.5 x – – – 94 x 96 x 1.0 x 25 x 33 x 1.3 x – – –Vanuatu 13 41 3.1 55 90 1.6 12 10 1.2 – – – 74 76 1.0 9 23 2.7 – – –Venezuela(Bolivarian Republic of) 87 x 95 x 1.1 x 95 x 92 x 1.0 x – – – 39 x 55 x 1.4 x 86 x 99 x 1.2 x – – – – – –Viet Nam 87 98 1.1 72 99 1.4 21 3 6.6 – – – 95 99 1.0 38 68 1.8 – – –Yemen 5 50 9.3 17 x 74 x 4.3 x – – – 31 x 37 x 1.2 x 44 x 73 x 1.6 x 0 x 4 x – – – –Zambia 5 31 5.8 27 91 3.4 16 11 1.5 61 61 1.0 73 96 1.3 24 48 2.0 24 51 2.1Zimbabwe 35 75 2.1 48 91 1.9 – – – 18 28 1.6 84 91 1.1 31 x 52 x 1.7 x 37 x 51 x 1.4 xMEMORANDUMSudan and South Sudan s – – – – – – – – – – – – – – – – – – – – –richest20%ratio ofrichest to poorestpoorest 20%richest20%ratio ofrichest to poorestpoorest 20%richest20%ratio ofrichest to poorestpoorest 20%richest20%ratio ofrichest topoorestSUMMARY INDICATORS #Sub-Saharan Africa 25 60 2.4 27 82 3.0 30 12 2.5 27 42 1.5 53 80 1.5 16 36 2.2 22 45 2.0Eastern andSouthern Africa 23 50 2.2 28 77 2.7 26 12 2.2 34 44 1.3 62 86 1.4 – – – – – –West and Central Africa 26 65 2.5 28 88 3.1 31 11 2.7 21 42 2.0 43 73 1.7 10 30 3.0 17 38 2.2Middle East andNorth Africa – – – – – – – – – – – – – – – – – – – – –South Asia 23 63 2.7 22 82 3.7 55 19 2.8 29 46 1.6 – – – 4 44 11.7 15 55 3.8East Asia and the Pacific 48 ** 89 ** 1.9 ** 54 ** 92 ** 1.7 ** 24 ** 10 ** 2.5 ** 36 ** 41 ** 1.1 ** – – – 14 ** 35 ** 2.4 ** – – –Latin Americaand Caribbean – – – – – – – – – – – – – – – – – – – – –CEE/CIS 94 98 1.0 – – – – – – – – – – – – – – – – – –Least developed countries 25 52 2.1 30 78 2.6 33 15 2.3 40 47 1.2 61 83 1.4 – – – – – –World 32 ** 68 ** 2.1 ** 31 ** 85 ** 2.7 ** 39 ** 14 ** 2.7 ** 29 ** 44 ** 1.5 ** – – – – – – – – –s Due to the cession in July 2011 of the Republic of South Sudan by the Republic of the Sudan, and its subsequent admission to the United Nations on 14 July 2011, disaggregated data for the Sudanand South Sudan as separate States are not yet available for all indicators. Aggregated data presented are for the Sudan pre-cession (see Memorandum item).# For a complete list of countries and areas in the regions, subregions and country categories, see page 98.DEFINITIONS OF THE INDICATORSBirth registration – Percentage of children under age 5 who were registeredat the moment of the survey. This includes children whose birth certificate wasseen by the interviewer or whose mother or caretaker says the birth has beenregistered.Skilled attendant at birth – Percentage of births attended by skilled healthpersonnel (doctor, nurse or midwife).Underweight prevalence in children under 5 – Percentage of childrenunder age 5 who are below minus two standard deviations from median weightfor-ageof the World Health Organization (WHO) Child Growth Standards.Diarrhoea treatment <strong>with</strong> oral rehydration salts (ORS) – Percentageof children under age 5 who had diarrhoea in the two weeks preceding thesurvey and who received oral rehydration salts (ORS packets or pre-packagedORS fluids).Primary school net attendance ratio – Number of children attendingprimary or secondary school who are of official primary school age, expressedas a percentage of the total number of children of official primary school age.Because of the inclusion of primary-school-aged children attending secondaryschool, this indicator can also be referred to as a primary adjusted netattendance ratio.Comprehensive knowledge of HIV – Percentage of young men and women(aged 15–24) who correctly identify the two major ways of preventing thesexual transmission of HIV (using condoms and limiting sex to one faithful,uninfected partner), who reject the two most common local misconceptionsabout HIV transmission and who know that a healthy-looking person can beHIV-positive.MAIN DATA SOURCESBirth registration – Demographic and Health Surveys (DHS), Multiple Indicator Cluster Surveys (MICS), othernational surveys and vital registration systems.Skilled attendant at birth – DHS, MICS and other nationally representative sources.Underweight prevalence in children under 5 – DHS, MICS, other national household surveys, WHOand UNICEF.Diarrhoea treatment <strong>with</strong> oral rehydration salts (ORS) – DHS, MICS and other national household surveys.Primary school attendance – DHS, MICS and other national household surveys.Comprehensive knowledge of HIV – AIDS Indicator Surveys (AIS), DHS, MICS and other national householdsurveys; HIV/AIDS Survey Indicators Database, .Italicized disparity data are from different sources than the data for the same indicators presentedelsewhere in the report: Table 2 (Nutrition – Underweight prevalence), Table 3 (Health – Diarrhoeatreatment), Table 4 (HIV/AIDS – Comprehensive knowledge of HIV) and Table 8 (Women – Skilledattendant at birth).NOTES− Data not available.x Data refer to years or periods other than those specified in the column heading. Such data are not included inthe calculation of regional and global averages, <strong>with</strong> the exception of 2005–2006 data from India. Estimatesfrom data years prior to 2000 are not displayed.y Data differ from the standard definition or refer to only part of a country. If they fall <strong>with</strong>in the notedreference period, such data are included in the calculation of regional and global averages.* Data refer to the most recent year available during the period specified in the column heading.** Excludes China.STATISTICAL TABLES 151
TABLE 14: EARLy CHILdHOOd dEVELOpmENTCountriesand areasAttendance in early childhood education2005–2011*total male femalepoorest20%Adult support for learning ++2005–2011*richestpoorest richest20% total male female 20%Father’ssupport forlearning ++20% 2005–2011* totalLearning materials at home2005−2011* <strong>Children</strong> left in inadequate care<strong>Children</strong>’s books Playthings++2005−2011*Afghanistan 1 1 1 0 4 73 74 73 72 80 62 2 1 5 53 52 57 40 42 39 43 27Albania 40 39 42 26 60 86 85 87 68 96 53 32 16 52 53 57 48 13 14 11 9 16Bangladesh 15 14 15 11 16 61 61 60 42 85 53 – – – – – – – – – – –Belarus 86 87 85 – – 97 97 96 95 98 72 – – – – – – – – – – –Belize 32 30 34 16 59 86 88 83 73 94 50 40 17 73 57 55 58 2 3 2 4 1Bhutan 10 10 10 3 27 54 52 57 40 73 51 6 1 24 52 36 60 14 13 15 17 7Bosnia and Herzegovina 6 5 8 1 15 83 83 83 74 90 74 70 52 88 43 49 43 7 7 6 6 10Botswana 18 – – – – – – – – – – – – – – – – – – – – –Burkina Faso 2 3 1 0 9 14 14 14 12 26 24 – – – – – – – – – – –Burundi 5 5 5 4 10 34 35 34 32 38 20 – – – – – – – – – – –Cameroon 22 22 22 3 56 58 57 59 57 69 39 8 3 22 57 62 46 36 36 36 45 25Central African Republic 5 5 6 2 17 74 74 74 70 78 42 1 0 3 49 41 51 61 60 62 58 60Chad 5 5 4 1 16 70 69 70 64 71 29 1 0 2 43 38 50 56 57 56 58 56Côte d’Ivoire 6 5 6 1 24 50 50 51 55 57 40 5 3 13 39 44 35 59 60 58 62 51Democratic People’sRepublic of Korea 98 98 97 – – 91 88 93 – – 75 79 – – 47 – – 17 17 16 – –Democratic Republicof the Congo 5 5 5 2 18 61 61 62 62 76 36 1 0 2 29 21 40 60 60 60 69 39Djibouti 14 12 16 – – 36 36 35 – – 23 15 – – 24 – – 12 11 13 – –Gambia 18 17 19 13 33 48 49 47 50 56 21 1 0 5 42 29 49 21 22 19 25 18Georgia 43 44 42 17 70 93 93 93 85 99 61 72 48 91 38 41 41 8 8 8 7 8Ghana 68 65 72 42 97 40 38 42 23 78 30 6 1 23 41 31 51 21 21 21 27 15Guinea-Bissau 10 10 10 4 26 – – – – – – – – – – – – – – – – –Guyana 49 48 50 33 78 89 88 89 77 99 52 54 28 86 65 67 60 11 13 10 19 6Iraq 3 2 3 – – 58 59 57 – – 60 – – – – – – – – – – –Jamaica 86 84 88 – – 94 95 93 – – 41 57 – – 71 – – 4 4 3 – –Kazakhstan 37 36 38 19 61 92 92 91 84 96 49 48 24 76 45 40 49 4 4 4 5 4Kyrgyzstan 19 21 17 7 47 88 90 85 86 99 54 76 76 85 57 59 54 11 12 9 11 6Lao People’s DemocraticRepublic 7 8 7 1 44 33 33 34 20 59 24 3 1 11 57 54 40 26 26 25 33 17Lebanon 62 63 60 – – 56 y 58 y 54 y – – 74 y 29 – – 16 y – – 9 8 10 – –Mali 10 10 10 1 40 29 27 30 28 44 14 0 0 2 40 33 49 33 33 33 33 36Mauritania 5 5 5 2 11 48 48 47 39 64 30 – – – – – – – – – – –Mongolia 60 58 61 26 83 59 56 62 44 73 41 23 6 48 68 74 62 9 9 8 10 6Montenegro 29 28 30 6 62 97 96 98 88 100 79 77 50 92 39 49 33 6 8 5 11 3Morocco 39 36 41 6 78 48 y 47 y 49 y 35 y 68 y 56 y 21 y 9 y 52 y 14 y 19 y 7 y 9 9 9 11 6Mozambique – – – – – 47 45 48 48 50 20 3 2 10 – – – 33 33 32 – –Myanmar 23 23 23 8 46 58 y 58 y 58 y 42 y 76 y 44 y – – – – – – – – – – –Nepal 30 y 29 y 31 y 14 y 61 y – – – – – – – – – – – – – – – – –Nigeria 32 32 32 5 70 78 78 78 68 91 38 14 2 35 35 25 42 38 38 37 41 32Sao Tome and Principe 27 29 26 18 51 – – – – – – – – – – – – – – – – –Senegal 22 y 23 y 21 y 7 y 43 y – – – – – – – – – – – – – – – – –Serbia 44 41 47 22 75 95 96 95 84 98 78 76 49 86 63 65 60 1 1 1 2 1Sierra Leone 14 13 15 5 42 54 53 55 45 79 42 2 0 10 35 24 50 32 33 32 29 28Somalia 2 2 2 1 6 79 80 79 76 85 48 – – – – – – – – – – –South Sudan 6 6 6 2 13 – – – – – – – – – – – – – – – – –Sudan 20 20 21 10 48 – – – – – – – – – – – – – – – – –Suriname 39 37 40 17 63 75 75 76 61 92 31 45 20 75 64 67 63 7 6 8 13 1Swaziland 33 32 34 36 50 50 50 50 35 71 10 4 1 12 69 64 74 15 15 15 20 9Syrian Arab Republic 8 8 7 4 18 70 70 69 52 84 62 30 12 53 52 52 51 17 17 17 22 15Tajikistan 10 11 10 1 29 74 73 74 56 86 23 17 4 33 46 43 44 13 13 12 15 11Thailand 61 60 61 55 78 89 90 89 86 98 57 43 25 71 55 58 49 13 14 13 18 7The former YugoslavRepublic of Macedonia 22 25 19 0 59 92 92 91 81 97 71 52 19 83 71 70 79 5 5 5 10 1poorest20%richest20% totalpoorest20%richestpoorest richest20% total male female 20% 20%152THE STATE OF THE WORLD’S CHILDREN 2013: <strong>Children</strong> <strong>with</strong> <strong>Disabilities</strong>
TABLE 14EARLy CHILdHOOd dEVELOpmENTCountriesand areasAttendance in early childhood education2005–2011*total male femalepoorest20%Adult support for learning ++2005–2011*richestpoorest richest20% total male female 20%Father’ssupport forlearning ++20% 2005–2011* totalLearning materials at home2005−2011* <strong>Children</strong> left in inadequate care<strong>Children</strong>’s books Playthings++2005−2011*Togo 29 27 31 10 52 62 61 63 55 68 38 2 0 7 31 26 41 41 42 41 45 35Trinidad and Tobago 75 74 76 65 87 98 98 98 96 100 63 81 66 93 65 63 72 1 1 1 2 0Ukraine 63 63 63 30 74 – – – – – – 97 93 99 47 36 47 10 11 10 15 4Uzbekistan 20 20 19 5 46 91 91 90 83 95 54 43 32 59 67 74 62 5 5 5 6 7Viet Nam 72 71 73 59 91 77 74 80 63 94 61 20 3 49 49 41 54 9 10 9 17 4Yemen 3 3 3 0 8 33 34 32 16 56 37 10 4 31 49 45 49 34 36 33 46 22poorest20%richest20% totalpoorest20%richestpoorest richest20% total male female 20% 20%SUMMARY INDICATORS #Sub-Saharan Africa 21 21 21 6 47 – – – – – – – – – – – – – – – – –Eastern andSouthern Africa – – – – – – – – – – – – – – – – – – – – – –West and Central Africa 22 22 23 6 49 63 63 63 57 77 35 8 1 21 36 29 43 43 43 43 47 34Middle Eastand North Africa – – – – – – – – – – – – – – – – – – – – – –South Asia – – – – – – – – – – – – – – – – – – – – – –East Asia and Pacific – – – – – – – – – – – – – – – – – – – – – –Latin Americaand Caribbean – – – – – – – – – – – – – – – – – – – – – –CEE/CIS – – – – – – – – – – – – – – – – – – – – – –Least developed countries 11 11 12 6 24 – – – – – – – – – – – – – – – – –World – – – – – – – – – – – – – – – – – – – – – –# For a complete list of countries and areas in the regions, subregions and country categories, see page 98.DEFINITIONS OF THE INDICATORSAttendance in early childhood education – Percentage of children 36–59 months old whoare attending an early childhood education programme.Adult support for learning – Percentage of children 36–59 months old <strong>with</strong> whom an adulthas engaged in four or more of the following activities to promote learning and school readinessin the past three days: a) reading books to the child, b) telling stories to the child, c) singingsongs to the child, d) taking the child outside the home, e) playing <strong>with</strong> the child and f) naming,counting or drawing things <strong>with</strong> the child.Father’s support for learning – Percentage of children 36–59 months old whose father hasengaged in one or more of the following activities to promote learning and school readinessin the past three days: a) reading books to the child, b) telling stories to the child, c) singingsongs to the child, d) taking the child outside the home, e) playing <strong>with</strong> the child and f) naming,counting or drawing things <strong>with</strong> the child.Learning materials at home: children’s books – Percentage of children 0–59 months oldwho have three or more children’s books at home.Learning materials at home: playthings – Percentage of children 0–59 months old <strong>with</strong> twoor more of the following playthings at home: household objects or objects found outside (sticks,rocks, animals, shells, leaves, etc.), homemade toys or toys that came from a store.<strong>Children</strong> left in inadequate care – Percentage of children 0–59 months old left alone or inthe care of another child younger than 10 years of age for more than one hour at least once inthe past week.MAIN DATA SOURCESAttendance in early childhood education – Multiple Indicator Cluster Surveys (MICS),Demographic and Health Surveys (DHS) and other national surveys.Adult support for learning – MICS and other national surveys.Father’s support for learning – MICS and other national surveys.Learning materials at home: children’s books – MICS and other national surveys.Learning materials at home: playthings – MICS and other national surveys.<strong>Children</strong> left in inadequate care – MICS and other national surveys.NOTES– Data not available.y Data differ from the standard definition or refer to only part of a country. If they fall <strong>with</strong>in thenoted reference period, such data are included in the calculation of regional and global averages.* Data refer to the most recent year available during the period specified in the column heading.++ Changes in the definitions of several ECD indicators were made between the third and fourthrounds of MICS (MICS3 and MICS4). In order to allow for comparability <strong>with</strong> MICS4, data fromMICS3 for the adult support for learning, father’s support for learning and learning materialsat home (playthings) indicators were recalculated according to MICS4 indicator definitions.Therefore, the recalculated data presented here will differ from estimates reported in MICS3national reports.STATISTICAL TABLES 153
Conventions, optional protocols,signatures and ratificationsA note on terms used in this reportA Convention is a formal agreement between States parties. The term ‘Convention’ is used (rather than itssynonym, ‘treaty’) to denote a multilateral instrument <strong>with</strong> a large number of States parties, including oneopen to participation by the international community as a whole and negotiated under the auspices of aninternational organization.An Optional protocol to a Convention is a legal instrument intended to supplement the original agreementby establishing additional rights or obligations. It may be used to address in greater detail a mattermentioned in the original agreement, to speak to a new concern relevant to any of its topics, or to addprocedures for operation or enforcement. Such a protocol is optional in the sense that States parties to aConvention are not automatically bound by its provisions, but must ratify it independently. Thus, a Statemay be party to a Convention but not to its Optional Protocols.The process by which a State becomes party to a Convention comprises, in most cases, two steps:signature and ratification.By signing a Convention, a State indicates its intention to take steps to examine the Convention andits compatibility <strong>with</strong> domestic law. A signature does not create a legal obligation to be bound by aConvention’s provisions; however, it does indicate that a State will act in good faith and will not takeactions that would undermine the purpose of the Convention.Ratification is the concrete action by which a State agrees to be legally bound by the terms of aConvention. The procedure varies according to each country’s particular legislative structure. After aState has determined that a Convention is consistent <strong>with</strong> domestic laws and that steps may be taken tocomply <strong>with</strong> its provisions, the appropriate national organ (e.g., a parliament) makes a formal decisionto ratify. Once the instrument of ratification – a formal, sealed letter signed by the responsible authority(e.g., a president) – is deposited <strong>with</strong> the United Nations Secretary-General, the State becomes party tothe Convention.In some cases, a state will accede to a Convention or Optional Protocol. Essentially, accession is likeratifying <strong>with</strong>out first having to sign.For further information and more detailed definitions of these and related terms, see.The Convention on the Rights of Persons <strong>with</strong> <strong>Disabilities</strong> is available at.The Optional Protocol is available at .154THE STATE OF THE WORLD’S CHILDREN 2013: <strong>Children</strong> <strong>with</strong> <strong>Disabilities</strong>
UNICEF HeadquartersUNICEF House3 United Nations PlazaNew York, NY 10017, USAUNICEF Regional Office for EuropePalais des NationsCH-1211 Geneva 10, SwitzerlandUNICEF Central and Eastern Europe/Commonwealth of IndependentStates Regional OfficePalais des NationsCH-1211 Geneva 10, SwitzerlandUNICEF Eastern and Southern AfricaRegional OfficeP.O. Box 44145Nairobi, Kenya 00100UNICEF Latin America andthe Caribbean Regional OfficeP.O. Box 0843-03045Panama City, PanamaUNICEF East Asia and PacificRegional OfficeP.O. Box 2-154Bangkok 10200, ThailandUNICEF Middle East and North AfricaRegional OfficeP.O. Box 1551Amman 11821, JordanUNICEF South Asia Regional OfficeP.O. Box 5815Lekhnath MargKathmandu, NepalUNICEF West and Central AfricaRegional OfficeP.O. Box 29720, YoffDakar, Senegal
United Nations <strong>Children</strong>’s Fund3 United Nations PlazaNew York, NY 10017, USAEmail: pubdoc@unicef.orgWebsite: www.unicef.orgXX%Cert no. XXX-XXX-XXXTo read this report online,scan this QR code or go towww.unicef.org/sowc2013US $25.00ISBN: 978-92-806-4656-6eISBN: 978-92-806-4662-7United Nations publication sales no.: E.13.XX.1© United Nations <strong>Children</strong>’s Fund (UNICEF)May 2013