section 4 preflight preparations and launch
section 4 preflight preparations and launch
section 4 preflight preparations and launch
- No tags were found...

Create successful ePaper yourself
Turn your PDF publications into a flip-book with our unique Google optimized e-Paper software.
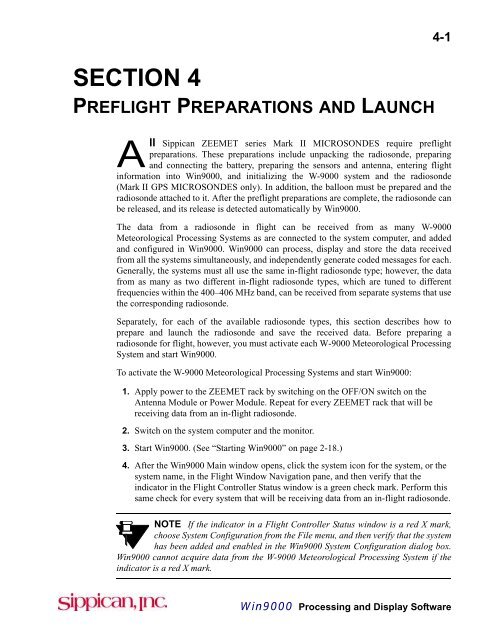
SECTION 4PREFLIGHT PREPARATIONS AND LAUNCH4-1All Sippican ZEEMET series Mark II MICROSONDES require <strong>preflight</strong><strong>preparations</strong>. These <strong>preparations</strong> include unpacking the radiosonde, preparing<strong>and</strong> connecting the battery, preparing the sensors <strong>and</strong> antenna, entering flightinformation into Win9000, <strong>and</strong> initializing the W-9000 system <strong>and</strong> the radiosonde(Mark II GPS MICROSONDES only). In addition, the balloon must be prepared <strong>and</strong> theradiosonde attached to it. After the <strong>preflight</strong> <strong>preparations</strong> are complete, the radiosonde canbe released, <strong>and</strong> its release is detected automatically by Win9000.The data from a radiosonde in flight can be received from as many W-9000Meteorological Processing Systems as are connected to the system computer, <strong>and</strong> added<strong>and</strong> configured in Win9000. Win9000 can process, display <strong>and</strong> store the data receivedfrom all the systems simultaneously, <strong>and</strong> independently generate coded messages for each.Generally, the systems must all use the same in-flight radiosonde type; however, the datafrom as many as two different in-flight radiosonde types, which are tuned to differentfrequencies within the 400–406 MHz b<strong>and</strong>, can be received from separate systems that usethe corresponding radiosonde.Separately, for each of the available radiosonde types, this <strong>section</strong> describes how toprepare <strong>and</strong> <strong>launch</strong> the radiosonde <strong>and</strong> save the received data. Before preparing aradiosonde for flight, however, you must activate each W-9000 Meteorological ProcessingSystem <strong>and</strong> start Win9000.To activate the W-9000 Meteorological Processing Systems <strong>and</strong> start Win9000:1. Apply power to the ZEEMET rack by switching on the OFF/ON switch on theAntenna Module or Power Module. Repeat for every ZEEMET rack that will bereceiving data from an in-flight radiosonde.2. Switch on the system computer <strong>and</strong> the monitor.3. Start Win9000. (See “Starting Win9000” on page 2-18.)4. After the Win9000 Main window opens, click the system icon for the system, or thesystem name, in the Flight Window Navigation pane, <strong>and</strong> then verify that theindicator in the Flight Controller Status window is a green check mark. Perform thissame check for every system that will be receiving data from an in-flight radiosonde.NOTE If the indicator in a Flight Controller Status window is a red X mark,choose System Configuration from the File menu, <strong>and</strong> then verify that the systemhas been added <strong>and</strong> enabled in the Win9000 System Configuration dialog box.Win9000 cannot acquire data from the W-9000 Meteorological Processing System if theindicator is a red X mark.Win9000 Processing <strong>and</strong> Display Software
This page is intentionally left blank.
Mark II PVT System Preparation <strong>and</strong> Launch 4-34.1 Mark II PVT System Preparation <strong>and</strong> LaunchBefore a Mark II PVT MICROSONDE can be <strong>launch</strong>ed, it must be prepared <strong>and</strong>initialized. In addition, you should update the GPS Almanac in the flight controller beforeinitializing the radiosonde. Refer to Figure 1-9 on page 1-12 for the location of theradiosonde battery compartment, sensors <strong>and</strong> other components called out below.4.1.1 Preparing the Radiosonde for FlightTo prepare the Mark II PVT MICROSONDE for flight:1. Prepare the balloon for flight.2. Unpack the radiosonde.3. Remove the battery from the radiosonde <strong>and</strong> its vacuum sealed foil bag.4. Place the battery with the label facing up in a container of fresh, room temperaturewater to a minimum depth of one inch.CAUTION Avoid getting the battery connectors wet. Water in the connectorsmay cause a short <strong>and</strong> significantly reduce battery life <strong>and</strong> may result in thebattery overheating.5. Leave the battery in the water for about two minutes, <strong>and</strong> then remove it.6. Shake the excess water from the battery by holding the battery in your h<strong>and</strong> with thelabel facing away from your palm, then extend your arm <strong>and</strong> swing it in an arcstarting over your head <strong>and</strong> stopping abruptly at your knees. Repeat the swingingmotion five or six times or until no water is present.CAUTION Excess water will cause overheating of the battery <strong>and</strong> a shorterbattery life.7. Place the battery in the plastic bag provided with the radiosonde.8. Place the battery in the radiosonde battery compartment such that the TOP label facesout of the compartment <strong>and</strong> the wires extend out from the bag compartment.9. Twist the battery wires that connect to the radiosonde counterclockwise four turns,<strong>and</strong> then twist the battery wires that connect to the battery clockwise four turns.NOTE Always connect the ground lead (black wire) of the battery to theradiosonde before connecting the positive lead (red wire). This procedureensures the radiosonde electronics is activated properly.Win9000 Processing <strong>and</strong> Display Software
4-4 SECTION 4 Preflight Preparations <strong>and</strong> LaunchCAUTION Never—for several seconds or longer—connect the positive lead(red wire) of the battery to the radiosonde without the ground lead (black wire)connected, as doing so may damage the radiosonde.10. As shown in Figure 4-1, connect theground lead (black wire) of thebattery to the ground lead (blackwire) of the radiosonde.Connect positiveleads (red) last11. Connect the positive lead (red wire)of the battery to the positive lead(red wire) of the radiosonde.12. Tuck any excess wire <strong>and</strong> theconnectors inside the batterycompartment, on the top or the sideof the battery.Connect groundleads (black) firstFIGURE 4-1: Connecting the Battery tothe RadiosondeNOTE Failure to completely tuck the wires inside the battery compartmentmay cause radio energy to feed back into the radiosonde electronics.13. Close the flap of the battery compartment, <strong>and</strong> then tape the compartment closedusing the supplied tape marked BATTERY by first removing the tape from the flap,removing the backing from the unused adhesive, <strong>and</strong> then taping the compartmentclosed using the fresh adhesive. Use additional tape if necessary.14. Unfold <strong>and</strong> extend the 403-MHz transmitter antenna.15. Remove the humidity (hygristor) sensor's protective canister from the radiosonde bytwisting it back <strong>and</strong> forth while pulling. If necessary, use a pair of pliers to remove it.16. Close the Humidity flap <strong>and</strong> tape it shut by removing the tape from the flap,removing the backing from the unused adhesive, <strong>and</strong> then firmly taping the flap shutusing the fresh adhesive. Use additional tape if necessary.17. Remove the plastic cover from the thermistor arm, <strong>and</strong> then orient the thermistor armaccording to the diagram on the side of the radiosonde.18. If the installed dereeler will be used, remove dereeler T-pin from the dereelerassembly, <strong>and</strong> then remove the tape that holds the string to the case <strong>and</strong> pull out six toeight inches of string.19. Place the radiosonde near the ZEEMET rack within reach of the initialization cable.The radiosonde is ready to be initialized.Operator’s ManualP/N 9017-205, Rev. C
Mark II PVT System Preparation <strong>and</strong> Launch 4-54.1.2 Updating the GPS AlmanacThe time to GPS lock-up of a Mark II PVT MICROSONDE can be reduced by initializingthe radiosonde with the current time, date, position, <strong>and</strong> GPS Almanac information.Loading this data into the radiosonde when initializing it will reduce the amount of timeneeded for the radiosonde to lock up on the GPS satellites. The GPS Almanac can bedownloaded to the system computer from the Sippican FTP site, where it is updated everyFriday, <strong>and</strong> then transferred to the flight controller in the ZEEMET rack.To download the current GPS Almanac <strong>and</strong> update the flight controller:1. Using Microsoft Internet Explorer, or other internet browser, go toftp://ftp.sippican.com.2. Enter "public" in the User name text box <strong>and</strong> "sippican" in the password text box.3. Click Log On.4. Navigate to the folder named "gps_almanac" <strong>and</strong> double-click it.5. Locate the file named almanac.dat <strong>and</strong> copy it to a folder on the system computer.6. Choose System Configuration from the File menu.The Win9000 System Configuration dialog box shown in Figure 3-1 on page 3-1opens.7. Select the W-9000 system for which the GPS Almanac is to be updated.8. Click Update Firmware.The Win9000 Firmware Update dialog box shown in Figure 4-2 opens.9. Select the Update Flight Controller Module option.10. Select the Copy a file to a specific location on flight controller option.11. Click Browse <strong>and</strong> select the gps_almanac file.12. Select C:\w9000 from the Save to following location on the flight controllerdrop-down list box.13. Select Save from the Perform the following action after downloading drop-down listbox.14. Click OK.A window opens asking you to verify that the flight controller is connected:Win9000 Processing <strong>and</strong> Display Software
4-6 SECTION 4 Preflight Preparations <strong>and</strong> LaunchFIGURE 4-2: The Win9000 Firmware Update Dialog Box15. Verify that you are communicating with the flight controller.16. Click OK.The GPS almanac is updated.Operator’s ManualP/N 9017-205, Rev. C
Mark II PVT System Preparation <strong>and</strong> Launch 4-74.1.3 Initializing the Radiosonde <strong>and</strong> the W-9000 SystemInitializing the Mark II PVT MICROSONDE <strong>and</strong> the W-9000 system first requires thatthe system that uses this radiosonde type be selected in Win9000. After selecting thesystem, a number of required <strong>and</strong> optional setup parameters that apply to the current flightmust be entered in Win9000. Then the radiosonde can be connected to the initializationcable of the ZEEMET rack <strong>and</strong> the radiosonde <strong>and</strong> the system can be initialized.To initialize the radiosonde <strong>and</strong> the W-9000 system:1. Choose New from the File menu.2. The Win9000 System Selection dialog box opens:retry.NOTE If the system is not enabled, click Cancel, <strong>and</strong> then choose SystemConfiguration from the File menu. In the Win9000 System Configuration dialogbox, select the system, click Enable/Disable, click Yes, <strong>and</strong> then click Close <strong>and</strong>3. Select the system for the Mark II PVT MICROSONDE, <strong>and</strong> then click OK.A dialog box opens asking you to select an action:4. Select the Start a new radiosonde flight option, <strong>and</strong> then click OK.5. The Preflight Information dialog box for 1548-720 Mark II PVT MICROSONDESopens to the Flight Information tab:Win9000 Processing <strong>and</strong> Display Software
4-8 SECTION 4 Preflight Preparations <strong>and</strong> Launch6. Enter the serial number of the Mark II PVT MICROSONDE in the RadiosondeSerial Number text box. The serial number is printed on the identification label on theoutside of the radiosonde case.7. Enter an Ascent Identifier (the Flight ID) in the Ascent Identifier text box.8. Verify that the Initialize Radiosonde check box is selected. Clear the check box if theradiosonde is already in flight <strong>and</strong> you want to acquire data from it.9. Select the Automatically save data when flight ends check box if you want Win9000to automatically save the data at the end of the flight to the flight data file specified inthe Save Data To text box. If the Create a new directory for each flight check box inthe Data Management/Notifications tab of the Win9000 System Configuration dialogbox for 1548-720 Mark II PVT MICROSONDES is checked, a new folder is createdfor the file. (See “Entering the Data Management/Notifications Parameter Settings”on page 3-8.) Both the file name <strong>and</strong> the new folder name are the same as the AscentIdentifier. Clear the check box if you want to save the data manually.This check box is initially selected or cleared in accordance with the choice made forthe Automatically save data when radiosonde flight ends check box on the DataManagement/Notifications tab of the Win9000 System Configuration dialog box for1548-720 Mark II PVT MICROSONDES. Similarly, the path <strong>and</strong> folder initiallydisplayed in the Save Data to text box is the one selected for the Default directory forsaving flight data text box on the Data Management/Notifications tab. To save theflight data file in a different folder, click Browse, select or create the folder <strong>and</strong> namethe file, or type the path <strong>and</strong> file name in the Save Data To text box. Each flight datafile should be saved in its own folder.10. Select the Automatically export data when flight ends check box if you wantWin9000 to automatically export the data at the end of the flight to an export file in anew folder that is created <strong>and</strong> placed in the folder specified in the Default directoryfor exporting flight data text box, which is on the Win9000 System ConfigurationOperator’s ManualP/N 9017-205, Rev. C
Mark II PVT System Preparation <strong>and</strong> Launch 4-9dialog box for 1548-720 Mark II PVT MICROSONDES. Both the new folder name<strong>and</strong> the file name are the same as the Ascent Identifier. Clear the check box if youwant to save the data manually.This check box is initially selected or cleared in accordance with the choice made forthe Automatically export data when radiosonde flight ends check box on the DataManagement/Notifications tab.11. If desired, enter a message containing up to 80 characters in the Real Time SerialOutput Header text box. This message is output along with <strong>and</strong> just prior to the datathat are output on the RTSO serial port of the ZEEMET rack if the Enable Real TimeSerial Output check box is selected on the System/Station tab of the Win9000 SystemConfiguration dialog box.12. Click the Location Information tab.The Location Information tab opens:13. If it is required to adjust the station location for the flight to improve the locationaccuracy, enter a latitude, longitude, <strong>and</strong> altitude for the station. The initial entries arethe ones entered on the System/Station tab of the Win9000 System Configurationdialog box for 1548-720 Mark II PVT MICROSONDES. (See “Entering the System/Station Parameter Settings” on page 3-4.)14. Click the Surface Data tab.The Surface Data tab opens:Win9000 Processing <strong>and</strong> Display Software
4-10 SECTION 4 Preflight Preparations <strong>and</strong> LaunchNOTE Values for the surface barometric pressure, dry bulb temperature,relative humidity, wind direction, <strong>and</strong> wind speed are required to be entered onthe Surface Data tab. And they should be entered just prior to the flight. All theentered values, except barometric pressure, can be approximate. The value entered forbarometric pressure should be as accurate as possible, as it directly determines theaccuracy of the calculated in-flight pressure. For some of the parameters you can selectthe units. Your selections do not affect units displayed in the any of the displays.15. In the Required area of the Surface Data tab, select the units for the surfacebarometric pressure from the drop-down list box, <strong>and</strong> then enter the pressure in theBarometric Pressure text box.16. Select the units for the surface dry bulb temperature, <strong>and</strong> then enter the temperaturein the Dry Bulb Temp. text box.17. Enter the surface relative humidity in percent in the Relative Humidity text box.18. Enter the surface wind direction in degrees in the Wind Direction text box.19. Select the units for the surface wind speed, <strong>and</strong> then enter the speed in the WindSpeed text box.NOTE Values for the wet bulb temperature, sea surface temperature, WMOCloud Code, st<strong>and</strong>ard day <strong>and</strong> hour, <strong>and</strong> transmission identifier are notrequired, but can be optionally entered. For some of the parameters you canselect the units. Your selections do not affect units displayed in the any of the displays.Operator’s ManualP/N 9017-205, Rev. C
Mark II PVT System Preparation <strong>and</strong> Launch 4-1120. In the Optional area of the of the Surface Data tab, select the Wet Bulb Temp. checkbox, <strong>and</strong> then select the units for the surface wet bulb temperature from thedrop-down list box <strong>and</strong> enter the temperature in the Wet Bulb Temp. text box.21. If you entered a value for the surface wet bulb temperature, you can have Win9000calculate the surface relative humidity by selecting the Use Wet Bulb TemperatureTo Calculate Humidity check box.22. Select the Sea Surface Temp. check box, <strong>and</strong> then select the units for the sea surfacetemperature <strong>and</strong> enter the temperature in the Sea Surface Temp. text box.23. Select the WMO Cloud Code check box, <strong>and</strong> then enter the code in the WMO CloudCode text box. The WMO Cloud Code is used in the TEMP message Part B,Section 8.24. Select the St<strong>and</strong>ard Day <strong>and</strong> Hour check box, <strong>and</strong> then select the day <strong>and</strong> hour fromthe drop-down list boxes. The day <strong>and</strong> hour is the WMO day <strong>and</strong> hour that theradiosonde will be <strong>launch</strong>ed.25. Select the Transmission Identifier check box, <strong>and</strong> then enter a Transmission ID in theTransmission Identifier text box. The Transmission ID, which identifies a station,can be included in a WMO message when it is transmitted.26. Click the Coded Messages tab.The Coded Messages tab opens:27. If required, click Configure to create one or more coded message groups, or to edit orremove any groups shown.Message groups shown were created on the Message Generation tab of the CodedMessages tab of the Win9000 System Configuration dialog box.Win9000 Processing <strong>and</strong> Display Software
4-12 SECTION 4 Preflight Preparations <strong>and</strong> LaunchNOTE Be sure the radiosonde has been powered for at least 30 seconds beforeconnecting the initialization cable.28. With the initialization connector on the radiosonde positioned as shown inFigure 4-3, orient the connector on the initialization cable with TOP label facing up<strong>and</strong> connect it to the initialization connector.RadiosondePosition connector onradiosonde as shown"TOP" label faces upOrient initializationconnector as shownInitialization cableFIGURE 4-3: Connecting the Initialization Cable to the Mark IIPVT MICROSONDE29. After connecting the initialization cable, wait at least 30 seconds, <strong>and</strong> then click OKon any tab in the Preflight Information dialog box.The Preflight Information dialog box closes, <strong>and</strong> a window opens asking you toverify that the initialization cable is connected to the radiosonde:Operator’s ManualP/N 9017-205, Rev. C
Mark II PVT System Preparation <strong>and</strong> Launch 4-1330. Verify that the initialization cable is connected, <strong>and</strong> then click OK.The window closes, <strong>and</strong> the Mark II PVT Flight window opens while the radiosonde<strong>and</strong> the system are initializing:After Win9000 initializes the radiosonde <strong>and</strong> the system, the Mark II PVT Flightwindow closes <strong>and</strong> a Flight window opens to the Current Data display as shown inFigure 4-4.You can click theSave Flight Data orSave Flight Data Asbutton at any time tosave the data sincedata acquisitionbegan to a flight datafile.The Surface Data,Radiosonde Signal,Calibration Data, <strong>and</strong>PTU Data indicatorsshould display a greencheck mark; the PVTGPS Winds indicatorwill display a red Xmark.FIGURE 4-4: The Current Data Display Immediately after Radiosonde <strong>and</strong>System Initialization—Mark II PVT SystemData acquisition begins when the Flight window opens. The Surface Data,Radiosonde Signal, Calibration Data, <strong>and</strong> PTU Data indicators in the Status area ofthe Current Data display should display a green check mark ( ), <strong>and</strong> the measuredpressure, temperature <strong>and</strong> humidity should be displayed. The PVT GPS Windsindicator will display a red X mark ( ).Win9000 Processing <strong>and</strong> Display Software
4-14 SECTION 4 Preflight Preparations <strong>and</strong> LaunchThe data can be saved at any time by clicking the Save Flight Data button, whichsaves the data acquired since data acquisition began to the flight data file specified inthe Save Data To text box on the Flight Information tab of the Preflight Informationdialog box. Or click the Save Flight Data As button, select a folder, <strong>and</strong> create a fileor select an existing file to save the data.31. Disconnect the initialization cable <strong>and</strong> immediately move the radiosonde to a locationwith a clear view of the sky for GPS lock-up. If a GPS repeater is present, place theradiosonde in a location within range of the GPS repeater antenna. Tie the radiosondeto the balloon <strong>and</strong> parachute train.Approximately two minutes after disconnecting the initialization cable, theradiosonde should lock up on the GPS satellites, after which the PVT GPS Windsindicator will turn from a red X mark to a green check mark, making all the indicatorsgreen check marks, <strong>and</strong> the Arm button at the top of the Flight window will becomeavailable as shown in Figure 4-5. At this time the radiosonde is ready to be armed for<strong>launch</strong>.If when Ready to Arm for Launch was selected in the Give audible notificationsdrop-down list box on the Data Management/Notifications tab of the Win9000System Configuration dialog box for 1548-720 Mark II PVT MICROSONDES, alongwith a .wav file, an audible notification will be heard every few seconds.The Arm buttonbecomes availableafter GPS lockup isobtained.Click the PreflightInformation button ifyou want to changeany of the settings inthe PreflightInformation dialog boxbefore arming theradiosonde.Click the PressureBaselining button toenter the barometricpressure offset.The PVT GPSWinds indicatorturns from a red X toa green check markwhen GPS lockup isobtained.FIGURE 4-5: The Current Data Display when Ready to Arm forLaunch—Mark II PVT System32. If you want to change any of the settings made in the Preflight Information dialogbox, click the Preflight Information button to open the dialog box <strong>and</strong> make thechanges. You cannot change the settings after arming the radiosonde.Operator’s ManualP/N 9017-205, Rev. C
Mark II PVT System Preparation <strong>and</strong> Launch 4-1533. Click the Pressure Baselining button.The Win9000 Pressure Capsule Baselining dialog box opens:The Win9000 Pressure Capsule Baselining dialog box displays the surfacebarometric pressure, the barometric pressure measured by the pressure capsule in theradiosonde, <strong>and</strong> their difference. The surface pressure is the barometric pressureentered on the Surface Data tab of the Preflight Information dialog box for 1548-720Mark II PVT MICROSONDES. In addition, the average difference is displayed,where averaging is performed over time beginning when the dialog box is firstopened.34. Allow Win9000 to continue to average the difference for approximately threeminutes, <strong>and</strong> then enter the displayed average difference in the Offset text box.35. Click OK to save the offset entry <strong>and</strong> close the Win9000 Pressure Capsule Baseliningdialog box. Click Cancel if you do not want to apply the offset.4.1.4 Launching the RadiosondeTo <strong>launch</strong> the radiosonde:1. Click the Arm button.The End Flight button becomes available as shown in Figure 4-6. Win9000 willautomatically detect the <strong>launch</strong> of the radiosonde soon after it is released. The flightcan be ended manually at any time by clicking the End Flight button.The data can also be saved by clicking the Save Flight Data button, which saves thedata acquired up to that point in the flight to the flight data file specified in the SaveData To text box on the Flight Information tab of the Preflight Information dialogbox. If no file was specified, Win9000 asks you to select a folder <strong>and</strong> create a file tosave the data. You can also click the Save Flight Data As button, select a folder, <strong>and</strong>create a file or select an existing file to save the data.Win9000 Processing <strong>and</strong> Display Software
4-16 SECTION 4 Preflight Preparations <strong>and</strong> LaunchAfter clicking theArm button, the EndFlight buttonbecomes availablefor manually endingthe flight.FIGURE 4-6: The Current Data Display when Monitoring forLaunch—Mark II PVT System2. Release the radiosonde.Win9000 will detect the <strong>launch</strong> <strong>and</strong> continue acquiring data. The Flight windowshown in Figure 4-7 displays the Current Data display as it appears immediately afterdetecting a <strong>launch</strong>. The End Flight, Save Flight Data <strong>and</strong> Save Flight Data As buttonsare available throughout the entire flight for manually ending the flight <strong>and</strong> saving thedata a flight data file. Win9000 will continue to acquire the data until the flight iseither manually or automatically terminated.If at Start of Flight was selected in the Give audible notifications drop-down list boxon the Data Management/Notifications tab of the Win9000 System Configurationdialog box for 1548-720 Mark II PVT MICROSONDES, along with a .wav file, anaudible notification will be heard when the <strong>launch</strong> is detected.3. Wait for Win9000 to terminate the flight automatically, or click the End Flight buttonto terminate the flight manually.NOTE You should save the data to a flight data file after the flight, otherwiseany unsaved data will be lost when you close the Flight window or exit fromWin9000. However, if the Automatically save data when flight ends check boxon the Flight Information tab of the Preflight Information dialog box is selected, the datawill be saved automatically when the flight ends.Operator’s ManualP/N 9017-205, Rev. C
Mark II PVT System Preparation <strong>and</strong> Launch 4-17The End Flight,Save Flight Data<strong>and</strong> Save FlightData As buttonsremain availablethroughout the flightfor manually endingthe flight <strong>and</strong> savingthe data to a flightdata file.FIGURE 4-7: The Current Data Display when Launch is Detected—Mark IIPVT System4. Save the data to a flight data file by doing one of the following:• Allow Win9000 to save the data automatically if the Automatically save datawhen flight ends check box on the Flight Information tab of the PreflightInformation dialog box is selected. The data are saved to the flight data filespecified in the Save Data To text box, along with additional files that aretransferred from the flight controller to the same folder as the flight data file. Whilethe files are being transferred, the Win9000 End of Flight File Transfer windowopens where the progress of the file transfer can be viewed:Win9000 Processing <strong>and</strong> Display Software
4-18 SECTION 4 Preflight Preparations <strong>and</strong> LaunchNOTE If the Automatically save data when flight ends check box is cleared,the data are not saved. However, the additional files are transferred to the folderspecified in the Default directory for saving flight data text box on the DataManagement/Notifications tab of the Win9000 System Configuration dialog box for1548-720 Mark II PVT MICROSONDES.• Click the Save Flight Data button. The data are saved to the flight data filespecified in the Save Data To text box.• Click the Save Flight Data As button, select a folder, <strong>and</strong> create a file or select anexisting file to save the data.Operator’s ManualP/N 9017-205, Rev. C
Mark II DGPS (LOS) System Preparation <strong>and</strong> Launch 4-194.2 Mark II DGPS (LOS) System Preparation <strong>and</strong>LaunchBefore a Mark II DGPS (LOS) MICROSONDE can be <strong>launch</strong>ed, it must be prepared <strong>and</strong>initialized. Refer to Figure 1-9 on page 1-12 for the location of the radiosonde batterycompartment, sensors <strong>and</strong> other components called out below.4.2.1 Preparing the Radiosonde for FlightTo prepare the Mark II DGPS (LOS) MICROSONDE for flight:1. Prepare the balloon for flight.2. Unpack the radiosonde.3. Remove the battery from the radiosonde <strong>and</strong> its vacuum sealed foil bag.4. Place the battery with the label facing up in a container of fresh, room temperaturewater to a minimum depth of one inch.CAUTION Avoid getting the battery connectors wet. Water in the connectorsmay cause a short <strong>and</strong> significantly reduce battery life <strong>and</strong> may result in thebattery overheating.5. Leave the battery in the water for about two minutes, <strong>and</strong> then remove it.6. Shake the excess water from the battery by holding the battery in your h<strong>and</strong> with thelabel facing away from your palm, then extend your arm <strong>and</strong> swing it in an arcstarting over your head <strong>and</strong> stopping abruptly at your knees. Repeat the swingingmotion five or six times or until no water is present.CAUTION Excess water will cause overheating of the battery <strong>and</strong> a shorterbattery life.7. Place the battery in the plastic bag provided with the radiosonde.8. Place the battery in the radiosonde battery compartment such that the TOP label facesout of the compartment <strong>and</strong> the wires extend out from the bag compartment.9. Twist the battery wires that connect to the radiosonde counterclockwise four turns,<strong>and</strong> then twist the battery wires that connect to the battery clockwise four turns.NOTE Always connect the ground lead (black wire) of the battery to theradiosonde before connecting the positive lead (red wire). This procedureensures the radiosonde electronics is activated properly.Win9000 Processing <strong>and</strong> Display Software
4-20 SECTION 4 Preflight Preparations <strong>and</strong> LaunchCAUTION Never—for several seconds or longer—connect the positive lead(red wire) of the battery to the radiosonde without the ground lead (black wire)connected, as doing so may damage the radiosonde.10. As shown in Figure 4-8, connect theground lead (black wire) of thebattery to the ground lead (blackwire) of the radiosonde.Connect positiveleads (red) last11. Connect the positive lead (red wire)of the battery to the positive lead(red wire) of the radiosonde.12. Tuck any excess wire <strong>and</strong> theconnectors inside the batterycompartment, on the top or the sideof the battery.Connect groundleads (black) firstFIGURE 4-8: Connecting the Battery tothe RadiosondeNOTE Failure to completely tuck the wires inside the battery compartmentmay cause radio energy to feed back into the radiosonde electronics.13. Close the flap of the battery compartment, <strong>and</strong> then tape the compartment closedusing the supplied tape marked BATTERY by first removing the tape from the flap,removing the backing from the unused adhesive, <strong>and</strong> then taping the compartmentclosed using the fresh adhesive. Use additional tape if necessary.14. Unfold <strong>and</strong> extend the 403-MHz transmitter antenna.15. Remove the humidity (hygristor) sensor's protective canister from the radiosonde bytwisting it back <strong>and</strong> forth while pulling. If necessary, use a pair of pliers to remove it.16. Close the Humidity flap <strong>and</strong> tape it shut by removing the tape from the flap,removing the backing from the unused adhesive, <strong>and</strong> then firmly taping the flap shutusing the fresh adhesive. Use additional tape if necessary.17. Remove the plastic cover from the thermistor arm, <strong>and</strong> then orient the thermistor armaccording to the diagram on the side of the radiosonde.18. If the installed dereeler will be used, remove dereeler T-pin from the dereelerassembly, <strong>and</strong> then remove the tape that holds the string to the case <strong>and</strong> pull out six toeight inches of string.19. Place the radiosonde near the ZEEMET rack within reach of the initialization cable.The radiosonde is ready to be initialized.Operator’s ManualP/N 9017-205, Rev. C
Mark II DGPS (LOS) System Preparation <strong>and</strong> Launch 4-214.2.2 Initializing the Radiosonde <strong>and</strong> the W-9000 SystemInitializing Mark II DGPS (LOS) MICROSONDE <strong>and</strong> the W-9000 system first requiresthat the system that uses this radiosonde type be selected in Win9000. After selecting thesystem, a number of required <strong>and</strong> optional setup parameters that apply to the current flightmust be entered in Win9000. Then the radiosonde can be connected to the initializationcable of the ZEEMET rack <strong>and</strong> the radiosonde <strong>and</strong> the system can be initialized.To initialize the radiosonde <strong>and</strong> the W-9000 system:1. Choose New from the File menu.2. The Win9000 System Selection dialog box opens:retry.NOTE If the system is not enabled, click Cancel, <strong>and</strong> then choose SystemConfiguration from the File menu. In the Win9000 System Configuration dialogbox, select the system, click Enable/Disable, click Yes, <strong>and</strong> then click Close <strong>and</strong>3. Select the system for the Mark II DGPS (LOS) MICROSONDE, <strong>and</strong> then click OK.A dialog box opens asking you to select an action:4. Select the Start a new radiosonde flight option, <strong>and</strong> then click OK.Win9000 Processing <strong>and</strong> Display Software
4-22 SECTION 4 Preflight Preparations <strong>and</strong> LaunchNOTE Win9000 requests that you update the GPS Almanac if it has not yetbeen updated that day. You should update the GPS Almanac before initializingthe radiosonde. Updating the GPS Almanac ensures the radiosonde will quicklylock up on the GPS satellites after disconnecting the initialization cable from theradiosonde.If the GPS Almanac is not current, a window opens asking if you want to update it:5. Click Yes if you want to update the GPS Almanac; click No if you do not.If you click Yes, the Win9000 Almanac Update window opens <strong>and</strong> the almanacupdates:After the almanac updates, or if you clicked No, the Preflight Information dialog boxfor 1548-611 Mark II DGPS (LOS) MICROSONDES opens to the FlightInformation tab:Operator’s ManualP/N 9017-205, Rev. C
Mark II DGPS (LOS) System Preparation <strong>and</strong> Launch 4-236. Enter the serial number of the Mark II DGPS (LOS) MICROSONDE in theRadiosonde Serial Number text box. The serial number is printed on theidentification label on the outside of the radiosonde case.7. Enter an Ascent Identifier (the Flight ID) in the Ascent Identifier text box.8. Verify that the Initialize Radiosonde check box is selected. Clear the check box if theradiosonde is already in flight <strong>and</strong> you want to acquire data from it.9. Select the Automatically save data when flight ends check box if you want Win9000to automatically save the data at the end of the flight to the flight data file specified inthe Save Data To text box. If the Create a new directory for each flight check box inthe Data Management/Notifications tab of the Win9000 System Configuration dialogbox for 1548-611 Mark II DGPS (LOS) MICROSONDES is checked, a new folder iscreated for the file. (See “Entering the Data Management/Notifications ParameterSettings” on page 3-18.) Both the file name <strong>and</strong> the new folder name are the same asthe Ascent Identifier. Clear the check box if you want to save the data manually.This check box is initially selected or cleared in accordance with the choice made forthe Automatically save data when radiosonde flight ends check box on the DataManagement/Notifications tab of the Win9000 System Configuration dialog box for1548-611 Mark II DGPS (LOS) MICROSONDES. Similarly, the path <strong>and</strong> folderinitially displayed in the Save Data to text box is the one selected for the Defaultdirectory for saving flight data text box on the Data Management/Notifications tab.To save the flight data file in a different folder, click Browse, select or create thefolder <strong>and</strong> name the file, or type the path <strong>and</strong> file name in the Save Data To text box.Each flight data file should be saved in its own folder.10. Select the Automatically export data when flight ends check box if you wantWin9000 to automatically export the data at the end of the flight to an export file in anew folder that is created <strong>and</strong> placed in the folder specified in the Default directoryfor exporting flight data text box, which is on the Data Management/Notificationstab of the Win9000 System Configuration dialog box for 1548-611 Mark II DGPSWin9000 Processing <strong>and</strong> Display Software
4-24 SECTION 4 Preflight Preparations <strong>and</strong> Launch(LOS) MICROSONDES. Both the new folder name <strong>and</strong> the file name are the same asthe Ascent Identifier. Clear the check box if you want to save the data manually.This check box is initially selected or cleared in accordance with the choice made forthe Automatically export data when radiosonde flight ends check box on the DataManagement/Notifications tab.11. If desired, enter a message containing up to 80 characters in the Real Time SerialOutput Header text box. This message is output along with <strong>and</strong> just prior to the datathat are output on the RTSO serial port of the ZEEMET rack if the Enable Real TimeSerial Output check box is selected on the System/Station tab of the Win9000 SystemConfiguration dialog box.12. Click the Surface Data tab. The Surface Data tab opens:NOTE Values for the surface barometric pressure, dry bulb temperature,relative humidity, wind direction, <strong>and</strong> wind speed are required to be entered onthe Surface Data tab. And they should be entered just prior to the flight. All theentered values, except barometric pressure, can be approximate. The value entered forbarometric pressure should be as accurate as possible, as it directly determines theaccuracy of the calculated in-flight pressure. For some of the parameters you can selectthe units. Your selections do not affect units displayed in the any of the displays.13. In the Required area of the Surface Data tab, select the units for the surfacebarometric pressure from the drop-down list box, <strong>and</strong> then enter the pressure in theBarometric Pressure text box.14. Select the units for the surface dry bulb temperature, <strong>and</strong> then enter the temperaturein the Dry Bulb Temp. text box.15. Enter the surface relative humidity in percent in the Relative Humidity text box.16. Enter the surface wind direction in degrees in the Wind Direction text box.Operator’s ManualP/N 9017-205, Rev. C
Mark II DGPS (LOS) System Preparation <strong>and</strong> Launch 4-2517. Select the units for the surface wind speed, <strong>and</strong> then enter the speed in the WindSpeed text box.NOTE Values for the wet bulb temperature, sea surface temperature, WMOCloud Code, st<strong>and</strong>ard day <strong>and</strong> hour, <strong>and</strong> transmission identifier are notrequired, but can be optionally entered. For some of the parameters you canselect the units. Your selections do not affect units displayed in the any of the displays.18. In the Optional area of the of the Surface Data tab, select the Wet Bulb Temp. checkbox, <strong>and</strong> then select the units for the surface wet bulb temperature from thedrop-down list box <strong>and</strong> enter the temperature in the Wet Bulb Temp. text box.19. If you entered a value for the surface wet bulb temperature, you can have Win9000calculate the surface relative humidity by selecting the Use Wet Bulb TemperatureTo Calculate Humidity check box.20. Select the Sea Surface Temp. check box, <strong>and</strong> then select the units for the sea surfacetemperature <strong>and</strong> enter the temperature in the Sea Surface Temp. text box.21. Select the WMO Cloud Code check box, <strong>and</strong> then enter the code in the WMO CloudCode text box. The WMO Cloud Code is used in the TEMP message Part B,Section 8.22. Select the St<strong>and</strong>ard Day <strong>and</strong> Hour check box, <strong>and</strong> then select the day <strong>and</strong> hour fromthe drop-down list boxes. The day <strong>and</strong> hour is the WMO day <strong>and</strong> hour that theradiosonde will be <strong>launch</strong>ed.23. Select the Transmission Identifier check box, <strong>and</strong> then enter a Transmission ID in theTransmission Identifier text box. The Transmission ID, which identifies a station,can be included in a WMO message when it is transmitted.24. Click the Coded Messages tab.The Coded Messages tab opens:Win9000 Processing <strong>and</strong> Display Software
4-26 SECTION 4 Preflight Preparations <strong>and</strong> Launch25. If required, click Configure to create one or more coded message groups, or to edit orremove any groups shown.Message groups shown were created on the Message Generation tab of the CodedMessages tab of the Win9000 System Configuration dialog box.NOTE Be sure the radiosonde has been powered for at least 30 seconds beforeconnecting the initialization cable.26. With the initialization connector on the radiosonde positioned as shown inFigure 4-9, orient the connector on the initialization cable with TOP label facing up<strong>and</strong> connect it to the initialization connector.RadiosondePosition connector onradiosonde as shown"TOP" label faces upOrient initializationconnector as shownInitialization cableFIGURE 4-9: Connecting the Initialization Cable to the Mark IIDGPS (LOS) MICROSONDE27. After connecting the initialization cable, wait at least 30 seconds, <strong>and</strong> then click OKon any tab in the Preflight Information dialog box.The Preflight Information dialog box closes, <strong>and</strong> a window opens asking you toverify that the initialization cable is connected to the radiosonde:Operator’s ManualP/N 9017-205, Rev. C
Mark II DGPS (LOS) System Preparation <strong>and</strong> Launch 4-2728. Verify that the initialization cable is connected, <strong>and</strong> then click OK.The window closes, <strong>and</strong> the Mark II DGPS (LOS) Flight window opens while theradiosonde <strong>and</strong> the system are initializing:After Win9000 initializes the radiosonde <strong>and</strong> the system, the Mark II DGPS (LOS)Flight window closes <strong>and</strong> a Flight window opens to the Current Data display asshown in Figure 4-10.You can click theSave Flight Data orSave Flight Data Asbutton at any time tosave the data sincedata acquisitionbegan to a flight datafile.The Surface Data,Radiosonde Signal,Calibration Data, <strong>and</strong>PTU Data indicatorsshould display a greencheck mark; theDifferential GPSWinds indicator willdisplay a red X mark.FIGURE 4-10: The Current Data Display Immediately after Radiosonde <strong>and</strong>System Initialization—Mark II DGPS (LOS) SystemData acquisition begins when the Flight window opens. The Surface Data,Radiosonde Signal, Calibration Data, <strong>and</strong> PTU Data indicators in the Status area ofthe Current Data display should display a green check mark ( ), <strong>and</strong> the measuredpressure, temperature <strong>and</strong> humidity should be displayed. The Differential GPS Windsindicator will display a red X mark ( ).Win9000 Processing <strong>and</strong> Display Software
4-28 SECTION 4 Preflight Preparations <strong>and</strong> LaunchThe data can be saved at any time by clicking the Save Flight Data button, whichsaves the data acquired since data acquisition began to the flight data file specified inthe Save Data To text box on the Flight Information tab of the Preflight Informationdialog box. Or click the Save Flight Data As button, select a folder, <strong>and</strong> create a fileor select an existing file to save the data.29. Disconnect the initialization cable <strong>and</strong> immediately move the radiosonde to a locationwith a clear view of the sky for GPS lock-up. If a GPS repeater is present, place theradiosonde in a location within range of the GPS repeater antenna. Tie the radiosondeto the balloon <strong>and</strong> parachute train.Approximately two minutes after disconnecting the initialization cable, theradiosonde should lock up on the GPS satellites, after which the Differential GPSWinds indicator will turn from a red X mark to a green check mark, making all theindicators green check marks, <strong>and</strong> the Arm button at the top of the Flight window willbecome available as shown in Figure 4-11. At this time the radiosonde is ready to bearmed for <strong>launch</strong>.If when Ready to Arm for Launch was selected in the Give audible notificationsdrop-down list box on the Data Management/Notifications tab of the Win9000System Configuration dialog box for 1548-611 Mark II DGPS (LOS)MICROSONDES, along with a .wav file, an audible notification will be heard everyfew seconds.The Arm buttonbecomes availableafter GPS lockup isobtained.Click the PreflightInformation button ifyou want to changeany of the settings inthe PreflightInformation dialog boxbefore arming theradiosonde.The DifferentialGPS Windsindicator turns froma red X to a greencheck mark whenGPS lockup isobtained.FIGURE 4-11: The Current Data Display when Ready to Arm forLaunch—Mark II DGPS (LOS) System30. If you want to change any of the settings made in the Preflight Information dialogbox, click the Preflight Information button to open the dialog box <strong>and</strong> make thechanges. You cannot change the settings after arming the radiosonde.Operator’s ManualP/N 9017-205, Rev. C
Mark II DGPS (LOS) System Preparation <strong>and</strong> Launch 4-294.2.3 Launching the RadiosondeTo <strong>launch</strong> the radiosonde:1. Click the Arm button.The Manual Launch <strong>and</strong> End Flight buttons become available as shown inFigure 4-12. Win9000 will automatically detect the <strong>launch</strong> of the radiosonde soonafter it is released. However, you can initiate the <strong>launch</strong> manually by clicking theManual Launch button. The flight can be ended manually at any time by clicking theEnd Flight button.The data can also be saved by clicking the Save Flight Data button, which saves thedata acquired up to that point in the flight to the flight data file specified in the SaveData To text box on the Flight Information tab of the Preflight Information dialogbox. If no file was specified, Win9000 asks you to select a folder <strong>and</strong> create a file tosave the data. You can also click the Save Flight Data As button, select a folder, <strong>and</strong>create a file or select an existing file to save the data.After clicking the Armbutton, the ManualLaunch buttonbecomes available forinitializing the <strong>launch</strong>manually. The EndFlight button becomesavailable for manuallyending the flight.FIGURE 4-12: The Current Data Display when Monitoring forLaunch—Mark II DGPS (LOS) System2. Release the radiosonde.Win9000 will detect the <strong>launch</strong> <strong>and</strong> continue acquiring data. The Flight windowshown in Figure 4-13 displays the Current Data display as it appears immediatelyafter detecting a <strong>launch</strong>. The End Flight, Save Flight Data <strong>and</strong> Save Flight Data Asbuttons are available throughout the entire flight for manually ending the flight <strong>and</strong>saving the data a flight data file. Win9000 will continue to acquire the data until theflight is either manually or automatically terminated.Win9000 Processing <strong>and</strong> Display Software
4-30 SECTION 4 Preflight Preparations <strong>and</strong> LaunchIf at Start of Flight was selected in the Give audible notifications drop-down list boxon the Data Management/Notifications tab of the Win9000 System Configurationdialog box for 1548-611 Mark II DGPS (LOS) MICROSONDES, along with a .wavfile, an audible notification will be heard when the <strong>launch</strong> is detected.The End Flight,Save Flight Data<strong>and</strong> Save FlightData As buttonsremain availablethroughout the flightfor manually endingthe flight <strong>and</strong> savingthe data to a flightdata file.FIGURE 4-13: The Current Data Display when Launch is Detected—Mark IIDGPS (LOS) System3. Wait for Win9000 to terminate the flight automatically, or click the End Flight buttonto terminate the flight manually.NOTE You should save the data to a flight data file after the flight, otherwiseany unsaved data will be lost when you close the Flight window or exit fromWin9000. However, if the Automatically save data when flight ends check boxon the Flight Information tab of the Preflight Information dialog box is selected, the datawill be saved automatically when the flight ends.4. Save the data to a flight data file by doing one of the following:• Allow Win9000 to save the data automatically if the Automatically save datawhen flight ends check box on the Flight Information tab of the PreflightInformation dialog box is selected. The data are saved to the flight data filespecified in the Save Data To text box, along with additional files that aretransferred from the flight controller to the same folder as the flight data file. Whilethe files are being transferred, the Win9000 End of Flight File Transfer windowopens where the progress of the file transfer can be viewed:Operator’s ManualP/N 9017-205, Rev. C
Mark II DGPS (LOS) System Preparation <strong>and</strong> Launch 4-31NOTE If the Automatically save data when flight ends check box is cleared,the data are not saved. However, the additional files are transferred to the folderspecified in the Default directory for saving flight data text box on the DataManagement/Notifications tab of the Win9000 System Configuration dialog box for1548-611 Mark II DGPS (LOS) MICROSONDES.• Click the Save Flight Data button. The data are saved to the flight data filespecified in the Save Data To text box.• Click the Save Flight Data As button, select a folder, <strong>and</strong> create a file or select anexisting file to save the data.Win9000 Processing <strong>and</strong> Display Software
This page is intentionally left blank.
Mark II DGPS (LOS-B) System Preparation <strong>and</strong> Launch 4-334.3 Mark II DGPS (LOS-B) System Preparation<strong>and</strong> LaunchBefore a Mark II DGPS (LOS-B) MICROSONDE can be <strong>launch</strong>ed, it must be prepared<strong>and</strong> initialized. Refer to Figure 1-9 on page 1-12 for the location of the radiosonde batterycompartment, sensors <strong>and</strong> other components called out below.4.3.1 Preparing the Radiosonde for FlightTo prepare the Mark II DGPS (LOS-B) MICROSONDE for flight:1. Prepare the balloon for flight.2. Unpack the radiosonde.3. Remove the battery from the radiosonde <strong>and</strong> its vacuum sealed foil bag.4. Place the battery with the label facing up in a container of fresh, room temperaturewater to a minimum depth of one inch.CAUTION Avoid getting the battery connectors wet. Water in the connectorsmay cause a short <strong>and</strong> significantly reduce battery life <strong>and</strong> may result in thebattery overheating.5. Leave the battery in the water for about two minutes, <strong>and</strong> then remove it.6. Shake the excess water from the battery by holding the battery in your h<strong>and</strong> with thelabel facing away from your palm, then extend your arm <strong>and</strong> swing it in an arcstarting over your head <strong>and</strong> stopping abruptly at your knees. Repeat the swingingmotion five or six times or until no water is present.CAUTION Excess water will cause overheating of the battery <strong>and</strong> a shorterbattery life.7. Place the battery in the plastic bag provided with the radiosonde.8. Place the battery in the radiosonde battery compartment such that the TOP label facesout of the compartment <strong>and</strong> the wires extend out from the bag compartment.9. Twist the battery wires that connect to the radiosonde counterclockwise four turns,<strong>and</strong> then twist the battery wires that connect to the battery clockwise four turns.NOTE Always connect the ground lead (black wire) of the battery to theradiosonde before connecting the positive lead (red wire). This procedureensures the radiosonde electronics is activated properly.Win9000 Processing <strong>and</strong> Display Software
4-34 SECTION 4 Preflight Preparations <strong>and</strong> LaunchCAUTION Never—for several seconds or longer—connect the positive lead(red wire) of the battery to the radiosonde without the ground lead (black wire)connected, as doing so may damage the radiosonde.10. As shown in Figure 4-14, connectthe ground lead (black wire) of thebattery to the ground lead (blackwire) of the radiosonde.Connect positiveleads (red) last11. Connect the positive lead (red wire)of the battery to the positive lead(red wire) of the radiosonde.12. Tuck any excess wire <strong>and</strong> theconnectors inside the batterycompartment, on the top or the sideof the battery.Connect groundleads (black) firstFIGURE 4-14: Connecting the Battery tothe RadiosondeNOTE Failure to completely tuck the wires inside the battery compartmentmay cause radio energy to feed back into the radiosonde electronics.13. Close the flap of the battery compartment, <strong>and</strong> then tape the compartment closedusing the supplied tape marked BATTERY by first removing the tape from the flap,removing the backing from the unused adhesive, <strong>and</strong> then taping the compartmentclosed using the fresh adhesive. Use additional tape if necessary.14. Unfold <strong>and</strong> extend the 403-MHz transmitter antenna.15. Remove the humidity (hygristor) sensor's protective canister from the radiosonde bytwisting it back <strong>and</strong> forth while pulling. If necessary, use a pair of pliers to remove it.16. Close the Humidity flap <strong>and</strong> tape it shut by removing the tape from the flap,removing the backing from the unused adhesive, <strong>and</strong> then firmly taping the flap shutusing the fresh adhesive. Use additional tape if necessary.17. Remove the plastic cover from the thermistor arm, <strong>and</strong> then orient the thermistor armaccording to the diagram on the side of the radiosonde.18. If the installed dereeler will be used, remove dereeler T-pin from the dereelerassembly, <strong>and</strong> then remove the tape that holds the string to the case <strong>and</strong> pull out six toeight inches of string.19. Place the radiosonde near the ZEEMET rack within reach of the initialization cable.The radiosonde is ready to be initialized.Operator’s ManualP/N 9017-205, Rev. C
Mark II DGPS (LOS-B) System Preparation <strong>and</strong> Launch 4-354.3.2 Initializing the Radiosonde <strong>and</strong> the W-9000 SystemInitializing Mark II DGPS (LOS-B) MICROSONDE <strong>and</strong> the W-9000 system first requiresthat the system that uses this radiosonde type be selected in Win9000. After selecting thesystem, a number of required <strong>and</strong> optional setup parameters that apply to the current flightmust be entered in Win9000. Then the radiosonde can be connected to the initializationcable of the ZEEMET rack <strong>and</strong> the radiosonde <strong>and</strong> the system can be initialized.To initialize the radiosonde <strong>and</strong> the W-9000 system:1. Choose New from the File menu.2. The Win9000 System Selection dialog box opens:retry.NOTE If the system is not enabled, click Cancel, <strong>and</strong> then choose SystemConfiguration from the File menu. In the Win9000 System Configuration dialogbox, select the system, click Enable/Disable, click Yes, <strong>and</strong> then click Close <strong>and</strong>3. Select the system for the Mark II DGPS (LOS-B) MICROSONDE, <strong>and</strong> then clickOK.A dialog box opens asking you to select an action:4. Select the Start a new radiosonde flight option, <strong>and</strong> then click OK.Win9000 Processing <strong>and</strong> Display Software
4-36 SECTION 4 Preflight Preparations <strong>and</strong> LaunchNOTE Win9000 requests that you update the GPS Almanac if it has not yetbeen updated that day. You should update the GPS Almanac before initializingthe radiosonde. Updating the GPS Almanac ensures the radiosonde will quicklylock up on the GPS satellites after disconnecting the initialization cable from theradiosonde.If the GPS Almanac is not current, a window opens asking if you want to update it:5. Click Yes if you want to update the GPS Almanac; click No if you do not.If you click Yes, the Win9000 Almanac Update window opens <strong>and</strong> the almanacupdates:After the almanac updates, or if you clicked No, the Preflight Information dialog boxfor 1548-617 Mark II DGPS (LOS-B) MICROSONDES opens to the FlightInformation tab:Operator’s ManualP/N 9017-205, Rev. C
Mark II DGPS (LOS-B) System Preparation <strong>and</strong> Launch 4-376. Enter the serial number of the Mark II DGPS (LOS-B) MICROSONDE in theRadiosonde Serial Number text box. The serial number is printed on theidentification label on the outside of the radiosonde case.7. Enter an Ascent Identifier (the Flight ID) in the Ascent Identifier text box.8. Verify that the Initialize Radiosonde check box is selected. Clear the check box if theradiosonde is already in flight <strong>and</strong> you want to acquire data from it.9. Select the Automatically save data when flight ends check box if you want Win9000to automatically save the data at the end of the flight to the flight data file specified inthe Save Data To text box. If the Create a new directory for each flight check box inthe Data Management/Notifications tab of the Win9000 System Configuration dialogbox for 1548-617 Mark II DGPS (LOS-B) MICROSONDES is checked, a new folderis created for the file. (See “Entering the Data Management/Notifications ParameterSettings” on page 3-28.) Both the file name <strong>and</strong> the new folder name are the same asthe Ascent Identifier. Clear the check box if you want to save the data manually.This check box is initially selected or cleared in accordance with the choice made forthe Automatically save data when radiosonde flight ends check box on the DataManagement/Notifications tab of the Win9000 System Configuration dialog box for1548-617 Mark II DGPS (LOS-B) MICROSONDES. Similarly, the path <strong>and</strong> folderinitially displayed in the Save Data to text box is the one selected for the Defaultdirectory for saving flight data text box on the Data Management/Notifications tab.To save the flight data file in a different folder, click Browse, select or create thefolder <strong>and</strong> name the file, or type the path <strong>and</strong> file name in the Save Data To text box.Each flight data file should be saved in its own folder.10. Select the Automatically export data when flight ends check box if you wantWin9000 to automatically export the data at the end of the flight to an export file in anew folder that is created <strong>and</strong> placed in the folder specified in the Default directoryfor exporting flight data text box, which is on the Data Management/Notificationstab of the Win9000 System Configuration dialog box for 1548-617 Mark II DGPSWin9000 Processing <strong>and</strong> Display Software
4-38 SECTION 4 Preflight Preparations <strong>and</strong> Launch(LOS-B) MICROSONDES. Both the new folder name <strong>and</strong> the file name are the sameas the Ascent Identifier. Clear the check box if you want to save the data manually.This check box is initially selected or cleared in accordance with the choice made forthe Automatically export data when radiosonde flight ends check box on the DataManagement/Notifications tab.11. If desired, enter a message containing up to 80 characters in the Real Time SerialOutput Header text box. This message is output along with <strong>and</strong> just prior to the datathat are output on the RTSO serial port of the ZEEMET rack if the Enable Real TimeSerial Output check box is selected on the System/Station tab of the Win9000 SystemConfiguration dialog box.12. Click the Surface Data tab. The Surface Data tab opens:NOTE Values for the surface barometric pressure, dry bulb temperature,relative humidity, wind direction, <strong>and</strong> wind speed are required to be entered onthe Surface Data tab. And they should be entered just prior to the flight. All theentered values, except barometric pressure, can be approximate. The value entered forbarometric pressure should be as accurate as possible, as it directly determines theaccuracy of the calculated in-flight pressure. For some of the parameters you can selectthe units. Your selections do not affect units displayed in the any of the displays.13. In the Required area of the Surface Data tab, select the units for the surfacebarometric pressure from the drop-down list box, <strong>and</strong> then enter the pressure in theBarometric Pressure text box.14. Select the units for the surface dry bulb temperature, <strong>and</strong> then enter the temperaturein the Dry Bulb Temp. text box.15. Enter the surface relative humidity in percent in the Relative Humidity text box.16. Enter the surface wind direction in degrees in the Wind Direction text box.Operator’s ManualP/N 9017-205, Rev. C
Mark II DGPS (LOS-B) System Preparation <strong>and</strong> Launch 4-3917. Select the units for the surface wind speed, <strong>and</strong> then enter the speed in the WindSpeed text box.NOTE Values for the wet bulb temperature, sea surface temperature, WMOCloud Code, st<strong>and</strong>ard day <strong>and</strong> hour, <strong>and</strong> transmission identifier are notrequired, but can be optionally entered. For some of the parameters you canselect the units. Your selections do not affect units displayed in the any of the displays.18. In the Optional area of the of the Surface Data tab, select the Wet Bulb Temp. checkbox, <strong>and</strong> then select the units for the surface wet bulb temperature from thedrop-down list box <strong>and</strong> enter the temperature in the Wet Bulb Temp. text box.19. If you entered a value for the surface wet bulb temperature, you can have Win9000calculate the surface relative humidity by selecting the Use Wet Bulb TemperatureTo Calculate Humidity check box.20. Select the Sea Surface Temp. check box, <strong>and</strong> then select the units for the sea surfacetemperature <strong>and</strong> enter the temperature in the Sea Surface Temp. text box.21. Select the WMO Cloud Code check box, <strong>and</strong> then enter the code in the WMO CloudCode text box. The WMO Cloud Code is used in the TEMP message Part B,Section 8.22. Select the St<strong>and</strong>ard Day <strong>and</strong> Hour check box, <strong>and</strong> then select the day <strong>and</strong> hour fromthe drop-down list boxes. The day <strong>and</strong> hour is the WMO day <strong>and</strong> hour that theradiosonde will be <strong>launch</strong>ed.23. Select the Transmission Identifier check box, <strong>and</strong> then enter a Transmission ID in theTransmission Identifier text box. The Transmission ID, which identifies a station,can be included in a WMO message when it is transmitted.24. Click the Coded Messages tab.The Coded Messages tab opens:Win9000 Processing <strong>and</strong> Display Software
4-40 SECTION 4 Preflight Preparations <strong>and</strong> Launch25. If required, click Configure to create one or more coded message groups, or to edit orremove any groups shown.Message groups shown were created on the Message Generation tab of the CodedMessages tab of the Win9000 System Configuration dialog box.NOTE Be sure the radiosonde has been powered for at least 30 seconds beforeconnecting the initialization cable.26. With the initialization connector on the radiosonde positioned as shown inFigure 4-15, orient the connector on the initialization cable with TOP label facing up<strong>and</strong> connect it to the initialization connector.RadiosondePosition connector onradiosonde as shown"TOP" label faces upOrient initializationconnector as shownInitialization cableFIGURE 4-15: Connecting the Initialization Cable to the Mark IIDGPS (LOS-B) MICROSONDE27. After connecting the initialization cable, wait at least 30 seconds, <strong>and</strong> then click OKon any tab in the Preflight Information dialog box.The Preflight Information dialog box closes, <strong>and</strong> a window opens asking you toverify that the initialization cable is connected to the radiosonde:Operator’s ManualP/N 9017-205, Rev. C
Mark II DGPS (LOS-B) System Preparation <strong>and</strong> Launch 4-4128. Verify that the initialization cable is connected, <strong>and</strong> then click OK.The window closes, <strong>and</strong> the Mark II DGPS with Pressure Capsule (LOS-B) Flightwindow opens while the radiosonde <strong>and</strong> the system are initializing:After Win9000 initializes the radiosonde <strong>and</strong> the system, the Mark II DGPS withPressure Capsule (LOS-B) Flight window closes <strong>and</strong> a Flight window opens to theCurrent Data display as shown in Figure 4-16.You can click theSave Flight Data orSave Flight Data Asbutton at any time tosave the data sincedata acquisitionbegan to a flight datafile.The Surface Data,Radiosonde Signal,Calibration Data, <strong>and</strong>PTU Data indicatorsshould display a greencheck mark; theDifferential GPSWinds indicator willdisplay a red X mark.FIGURE 4-16: The Current Data Display Immediately after Radiosonde <strong>and</strong>System Initialization—Mark II DGPS (LOS-B) SystemData acquisition begins when the Flight window opens. The Surface Data,Radiosonde Signal, Calibration Data, <strong>and</strong> PTU Data indicators in the Status area ofthe Current Data display should display a green check mark ( ), <strong>and</strong> the measuredpressure, temperature <strong>and</strong> humidity should be displayed. The Differential GPS Windsindicator will display a red X mark ( ).Win9000 Processing <strong>and</strong> Display Software
4-42 SECTION 4 Preflight Preparations <strong>and</strong> LaunchThe data can be saved at any time by clicking the Save Flight Data button, whichsaves the data acquired since data acquisition began to the flight data file specified inthe Save Data To text box on the Flight Information tab of the Preflight Informationdialog box. Or click the Save Flight Data As button, select a folder, <strong>and</strong> create a fileor select an existing file to save the data.29. Disconnect the initialization cable <strong>and</strong> immediately move the radiosonde to a locationwith a clear view of the sky for GPS lock-up. If a GPS repeater is present, place theradiosonde in a location within range of the GPS repeater antenna. Tie the radiosondeto the balloon <strong>and</strong> parachute train.Approximately two minutes after disconnecting the initialization cable, theradiosonde should lock up on the GPS satellites, after which the Differential GPSWinds indicator will turn from a red X mark to a green check mark, making all theindicators green check marks, <strong>and</strong> the Arm button at the top of the Flight window willbecome available as shown in Figure 4-17. At this time the radiosonde is ready to bearmed for <strong>launch</strong>.If when Ready to Arm for Launch was selected in the Give audible notificationsdrop-down list box on the Data Management/Notifications tab of the Win9000System Configuration dialog box for 1548-617 Mark II DGPS (LOS-B)MICROSONDES, along with a .wav file, an audible notification will be heard everyfew seconds.The Arm buttonbecomes availableafter GPS lockup isobtained.Click the PreflightInformation button ifyou want to changeany of the settings inthe PreflightInformation dialog boxbefore arming theradiosonde.Click the PressureBaselining button toenter the barometricpressure offset.The Differential GPSWinds indicator turnsfrom a red X to agreen check markwhen GPS lockup isobtained.FIGURE 4-17: The Current Data Display when Ready to Arm forLaunch—Mark II DGPS (LOS-B) System30. If you want to change any of the settings made in the Preflight Information dialogbox, click the Preflight Information button to open the dialog box <strong>and</strong> make thechanges. You cannot change the settings after arming the radiosonde.Operator’s ManualP/N 9017-205, Rev. C
Mark II DGPS (LOS-B) System Preparation <strong>and</strong> Launch 4-4331. Click the P Baseline button.The Win9000 Pressure Capsule Baselining dialog box opens:The Win9000 Pressure Capsule Baselining dialog box displays the surfacebarometric pressure, the barometric pressure measured by the pressure capsule in theradiosonde, <strong>and</strong> their difference. The surface pressure is the barometric pressureentered on the Surface Data tab of the Preflight Information dialog box for 1548-617Mark II DGPS (LOS-B) MICROSONDES. In addition, the average difference isdisplayed, where averaging is performed over time beginning when the dialog box isfirst opened.32. Allow Win9000 to continue to average the difference for approximately threeminutes, <strong>and</strong> then enter the displayed average difference in the Offset text box.33. Click OK to save the offset entry <strong>and</strong> close the Win9000 Pressure Capsule Baseliningdialog box. Click Cancel if you do not want to apply the offset.4.3.3 Launching the RadiosondeTo <strong>launch</strong> the radiosonde:1. Click the Arm button.The Manual Launch <strong>and</strong> End Flight buttons become available as shown inFigure 4-18. Win9000 will automatically detect the <strong>launch</strong> of the radiosonde soonafter it is released. However, you can initiate the <strong>launch</strong> manually by clicking theManual Launch button. The flight can be ended manually at any time by clicking theEnd Flight button.The data can also be saved by clicking the Save Flight Data button, which saves thedata acquired up to that point in the flight to the flight data file specified in the SaveData To text box on the Flight Information tab of the Preflight Information dialogbox. If no file was specified, Win9000 asks you to select a folder <strong>and</strong> create a file tosave the data. You can also click the Save Flight Data As button, select a folder, <strong>and</strong>create a file or select an existing file to save the data.Win9000 Processing <strong>and</strong> Display Software
4-44 SECTION 4 Preflight Preparations <strong>and</strong> LaunchAfter clicking the Armbutton, the ManualLaunch buttonbecomes available forinitializing the <strong>launch</strong>manually. The EndFlight button becomesavailable for manuallyending the flight.FIGURE 4-18: The Current Data Display when Monitoring forLaunch—Mark II DGPS (LOS-B) System2. Release the radiosonde.Win9000 will detect the <strong>launch</strong> <strong>and</strong> continue acquiring data. The Flight windowshown in Figure 4-19 displays the Current Data display as it appears immediatelyafter detecting a <strong>launch</strong>. The End Flight, Save Flight Data <strong>and</strong> Save Flight Data Asbuttons are available throughout the entire flight for manually ending the flight <strong>and</strong>saving the data a flight data file. Win9000 will continue to acquire the data until theflight is either manually or automatically terminated.If at Start of Flight was selected in the Give audible notifications drop-down list boxon the Data Management/Notifications tab of the Win9000 System Configurationdialog box for 1548-617 Mark II DGPS (LOS-B) MICROSONDES, along with a.wav file, an audible notification will be heard when the <strong>launch</strong> is detected.3. Wait for Win9000 to terminate the flight automatically, or click the End Flight buttonto terminate the flight manually.NOTE You should save the data to a flight data file after the flight, otherwiseany unsaved data will be lost when you close the Flight window or exit fromWin9000. However, if the Automatically save data when flight ends check boxon the Flight Information tab of the Preflight Information dialog box is selected, the datawill be saved automatically when the flight ends.Operator’s ManualP/N 9017-205, Rev. C
Mark II DGPS (LOS-B) System Preparation <strong>and</strong> Launch 4-45The End Flight,Save Flight Data<strong>and</strong> Save FlightData As buttonsremain availablethroughout the flightfor manually endingthe flight <strong>and</strong> savingthe data to a flightdata file.FIGURE 4-19: The Current Data Display when Launch is Detected—Mark IIDGPS (LOS-B) System4. Save the data to a flight data file by doing one of the following:• Allow Win9000 to save the data automatically if the Automatically save datawhen flight ends check box on the Flight Information tab of the PreflightInformation dialog box is selected. The data are saved to the flight data filespecified in the Save Data To text box, along with additional files that aretransferred from the flight controller to the same folder as the flight data file. Whilethe files are being transferred, the Win9000 End of Flight File Transfer windowopens where the progress of the file transfer can be viewed:Win9000 Processing <strong>and</strong> Display Software
4-46 SECTION 4 Preflight Preparations <strong>and</strong> LaunchNOTE If the Automatically save data when flight ends check box is cleared,the data are not saved. However, the additional files are transferred to the folderspecified in the Default directory for saving flight data text box on the DataManagement/Notifications tab of the Win9000 System Configuration dialog box for1548-617 Mark II DGPS (LOS-B) MICROSONDES.• Click the Save Flight Data button. The data are saved to the flight data filespecified in the Save Data To text box.• Click the Save Flight Data As button, select a folder, <strong>and</strong> create a file or select anexisting file to save the data.Operator’s ManualP/N 9017-205, Rev. C
Mark IIA DGPS (LOS) System Preparation <strong>and</strong> Launch 4-474.4 Mark IIA DGPS (LOS) System Preparation <strong>and</strong>LaunchBefore a Mark IIA DGPS (LOS) MICROSONDE can be <strong>launch</strong>ed, it must be prepared<strong>and</strong> the W-9000 system initialized. A Mark IIA DGPS MICROSONDE does not requireto be initialized, only the W-9000 system. Refer to Figure 1-10 on page 1-15 for thelocation of the radiosonde battery compartment, sensors <strong>and</strong> other components called outbelow.4.4.1 Preparing the Radiosonde for FlightTo prepare the Mark IIA DGPS (LOS) MICROSONDE for flight:1. Prepare the balloon for flight.2. Unpack the radiosonde.3. Remove the battery from the radiosonde <strong>and</strong> its vacuum sealed foil bag.4. Place the battery with the label facing up in a container of fresh, room temperaturewater to a minimum depth of one inch.CAUTION Avoid getting the battery connectors wet. Water in the connectorsmay cause a short <strong>and</strong> significantly reduce battery life <strong>and</strong> may result in thebattery overheating.5. Leave the battery in the water for about two minutes, <strong>and</strong> then remove it.6. Shake the excess water from the battery by holding the battery in your h<strong>and</strong> with thelabel facing away from your palm, then extend your arm <strong>and</strong> swing it in an arcstarting over your head <strong>and</strong> stopping abruptly at your knees. Repeat the swingingmotion five or six times or until no water is present.CAUTION Excess water will cause overheating of the battery <strong>and</strong> a shorterbattery life.7. Place the battery in the plastic bag provided with the radiosonde.8. Place the battery in the radiosonde battery compartment such that the TOP label facesout of the compartment <strong>and</strong> the wires extend out from the bag compartment.9. Twist the battery wires that connect to the radiosonde counterclockwise four turns,<strong>and</strong> then twist the battery wires that connect to the battery clockwise four turns.NOTE Always connect the ground lead (black wire) of the battery to theradiosonde before connecting the positive lead (red wire). This procedureensures the radiosonde electronics is activated properly.Win9000 Processing <strong>and</strong> Display Software
4-48 SECTION 4 Preflight Preparations <strong>and</strong> LaunchCAUTION Never—for several seconds or longer—connect the positive lead(red wire) of the battery to the radiosonde without the ground lead (black wire)connected, as doing so may damage the radiosonde.10. As shown in Figure 4-20, connectthe ground lead (black wire) of thebattery to the ground lead (blackwire) of the radiosonde.Connect positiveleads (red) last11. Connect the positive lead (red wire)of the battery to the positive lead(red wire) of the radiosonde.12. Tuck any excess wire <strong>and</strong> theconnectors inside the batterycompartment, on the top or the sideof the battery.Connect groundleads (black) firstFIGURE 4-20: Connecting the Battery tothe RadiosondeNOTE Failure to completely tuck the wires inside the battery compartmentmay cause radio energy to feed back into the radiosonde electronics.13. Close the flap of the battery compartment, <strong>and</strong> then tape the compartment closedusing the supplied tape marked BATTERY by first removing the tape from the flap,removing the backing from the unused adhesive, <strong>and</strong> then taping the compartmentclosed using the fresh adhesive. Use additional tape if necessary.14. Unfold <strong>and</strong> extend the 403-MHz transmitter antenna.15. Remove the humidity (hygristor) sensor's protective canister from the radiosonde bytwisting it back <strong>and</strong> forth while pulling. If necessary, use a pair of pliers to remove it.16. Close the Humidity flap <strong>and</strong> tape it shut.17. Remove the plastic cover from the thermistor arm, <strong>and</strong> then orient the thermistor armaccording to the diagram on the side of the radiosonde.Operator’s ManualP/N 9017-205, Rev. C
Mark IIA DGPS (LOS) System Preparation <strong>and</strong> Launch 4-494.4.2 Initializing the W-9000 SystemInitializing the W-9000 system first requires that the system that uses the Mark IIA DGPS(LOS) MICROSONDE be selected in Win9000. After selecting the system, a number ofrequired <strong>and</strong> optional setup parameters that apply to the current flight must be entered inWin9000. Then the system can be initialized <strong>and</strong> the radiosonde can be <strong>launch</strong>ed.To initialize the W-9000 system:1. Choose New from the File menu.2. The Win9000 System Selection dialog box opens:retry.NOTE If the system is not enabled, click Cancel, <strong>and</strong> then choose SystemConfiguration from the File menu. In the Win9000 System Configuration dialogbox, select the system, click Enable/Disable, click Yes, <strong>and</strong> then click Close <strong>and</strong>3. Select the system for the Mark IIA DGPS (LOS) MICROSONDE, <strong>and</strong> then click OK.A dialog box opens asking you to select an action:4. Select the Start a new radiosonde flight option, <strong>and</strong> then click OK.The Preflight Information dialog box for 1648-611 Mark IIA DGPS (LOS)MICROSONDES opens to the Flight Information tab:Win9000 Processing <strong>and</strong> Display Software
4-50 SECTION 4 Preflight Preparations <strong>and</strong> Launch5. Enter the serial number of the Mark IIA DGPS (LOS) MICROSONDE in theRadiosonde Serial Number text box. The serial number is printed on theidentification label on the outside of the radiosonde case.6. Enter an Ascent Identifier (the Flight ID) in the Ascent Identifier text box.7. Select the Automatically save data when flight ends check box if you want Win9000to automatically save the data at the end of the flight to the flight data file specified inthe Save Data To text box. If the Create a new directory for each flight check box inthe Data Management/Notifications tab of the Win9000 System Configuration dialogbox for 1648-611 Mark IIA DGPS (LOS) MICROSONDES is checked, a new folderis created for the file. (See “Entering the Data Management/Notifications ParameterSettings” on page 3-38.) Both the file name <strong>and</strong> the new folder name are the same asthe Ascent Identifier. Clear the check box if you want to save the data manually.This check box is initially selected or cleared in accordance with the choice made forthe Automatically save data when radiosonde flight ends check box on the DataManagement/Notifications tab of the Win9000 System Configuration dialog box for1648-611 Mark IIA DGPS (LOS) MICROSONDES. Similarly, the path <strong>and</strong> folderinitially displayed in the Save Data to text box is the one selected for the Defaultdirectory for saving flight data text box on the Data Management/Notifications tab.To save the flight data file in a different folder, click Browse, select or create thefolder <strong>and</strong> name the file, or type the path <strong>and</strong> file name in the Save Data To text box.Each flight data file should be saved in its own folder.8. Select the Automatically export data when flight ends check box if you wantWin9000 to automatically export the data at the end of the flight to an export file in anew folder that is created <strong>and</strong> placed in the folder specified in the Default directoryfor exporting flight data text box, which is on the Data Management/Notificationstab of the Win9000 System Configuration dialog box for 1648-611 Mark IIA DGPS(LOS) MICROSONDES. Both the new folder name <strong>and</strong> the file name are the same asthe Ascent Identifier. Clear the check box if you want to save the data manually.Operator’s ManualP/N 9017-205, Rev. C
Mark IIA DGPS (LOS) System Preparation <strong>and</strong> Launch 4-51This check box is initially selected or cleared in accordance with the choice made forthe Automatically export data when radiosonde flight ends check box on the DataManagement/Notifications tab.9. If desired, enter a message containing up to 80 characters in the Real Time SerialOutput Header text box. This message is output along with <strong>and</strong> just prior to the datathat are output on the RTSO serial port of the ZEEMET rack if the Enable Real TimeSerial Output check box is selected on the System/Station tab of the Win9000 SystemConfiguration dialog box.10. Click the Surface Data tab. The Surface Data tab opens:NOTE Values for the surface barometric pressure, dry bulb temperature,relative humidity, wind direction, <strong>and</strong> wind speed are required to be entered onthe Surface Data tab. And they should be entered just prior to the flight. All theentered values, except barometric pressure, can be approximate. The value entered forbarometric pressure should be as accurate as possible, as it directly determines theaccuracy of the calculated in-flight pressure. For some of the parameters you can selectthe units. Your selections do not affect units displayed in the any of the displays.11. In the Required area of the Surface Data tab, select the units for the surfacebarometric pressure from the drop-down list box, <strong>and</strong> then enter the pressure in theBarometric Pressure text box.12. Select the units for the surface dry bulb temperature, <strong>and</strong> then enter the temperaturein the Dry Bulb Temp. text box.13. Enter the surface relative humidity in percent in the Relative Humidity text box.14. Enter the surface wind direction in degrees in the Wind Direction text box.Win9000 Processing <strong>and</strong> Display Software
4-52 SECTION 4 Preflight Preparations <strong>and</strong> Launch15. Select the units for the surface wind speed, <strong>and</strong> then enter the speed in the WindSpeed text box.NOTE Values for the wet bulb temperature, sea surface temperature, WMOCloud Code, st<strong>and</strong>ard day <strong>and</strong> hour, <strong>and</strong> transmission identifier are notrequired, but can be optionally entered. For some of the parameters you canselect the units. Your selections do not affect units displayed in the any of the displays.16. In the Optional area of the of the Surface Data tab, select the Wet Bulb Temp. checkbox, <strong>and</strong> then select the units for the surface wet bulb temperature from thedrop-down list box <strong>and</strong> enter the temperature in the Wet Bulb Temp. text box.17. If you entered a value for the surface wet bulb temperature, you can have Win9000calculate the surface relative humidity by selecting the Use Wet Bulb TemperatureTo Calculate Humidity check box.18. Select the Sea Surface Temp. check box, <strong>and</strong> then select the units for the sea surfacetemperature <strong>and</strong> enter the temperature in the Sea Surface Temp. text box.19. Select the WMO Cloud Code check box, <strong>and</strong> then enter the code in the WMO CloudCode text box. The WMO Cloud Code is used in the TEMP message Part B,Section 8.20. Select the St<strong>and</strong>ard Day <strong>and</strong> Hour check box, <strong>and</strong> then select the day <strong>and</strong> hour fromthe drop-down list boxes. The day <strong>and</strong> hour is the WMO day <strong>and</strong> hour that theradiosonde will be <strong>launch</strong>ed.21. Select the Transmission Identifier check box, <strong>and</strong> then enter a Transmission ID in theTransmission Identifier text box. The Transmission ID, which identifies a station,can be included in a WMO message when it is transmitted.22. Click the Coded Messages tab.The Coded Messages tab opens:Operator’s ManualP/N 9017-205, Rev. C
Mark IIA DGPS (LOS) System Preparation <strong>and</strong> Launch 4-5323. If required, click Configure to create one or more coded message groups, or to edit orremove any groups shown.Message groups shown were created on the Message Generation tab of the CodedMessages tab of the Win9000 System Configuration dialog box.24. Click OK on any tab in the Preflight Information dialog box.The Preflight Information dialog box closes, <strong>and</strong> the Mark IIA DGPS (LOS) Flightwindow opens while the system is initializing:After Win9000 initializes the system, the Mark IIA DGPS (LOS) Flight windowcloses <strong>and</strong> a Flight window opens to the Current Data display as in Figure 4-21.Data acquisition begins when the Flight window opens. The Surface Data,Radiosonde Signal, Calibration Data, <strong>and</strong> PTU Data indicators in the Status area ofthe Current Data display should display a green check mark ( ), <strong>and</strong> the measuredpressure, temperature <strong>and</strong> Differential GPS Winds humidity should be displayed. TheDifferential GPS Winds indicator will display a red X mark ( ).The data can be saved at any time by clicking the Save Flight Data button, whichsaves the data acquired since data acquisition began to the flight data file specified inthe Save Data To text box on the Flight Information tab of the Preflight Informationdialog box. Or click the Save Flight Data As button, select a folder, <strong>and</strong> create a fileor select an existing file to save the data.Approximately two minutes after data acquisition begins, the radiosonde should lockup on the GPS satellites, after which the Differential GPS Winds indicator will turnfrom a red X mark to a green check mark, making all the indicators green checkmarks, <strong>and</strong> the Arm button at the top of the Flight window will become available asshown in Figure 4-22. At this time the radiosonde is ready to be armed for <strong>launch</strong>.If when Ready to Arm for Launch was selected in the Give audible notificationsdrop-down list box on the Data Management/Notifications tab of the Win9000System Configuration dialog box for 1648-611 Mark IIA DGPS (LOS)MICROSONDES, along with a .wav file, an audible notification will be heard everyfew seconds.25. Move the radiosonde to the <strong>launch</strong> site, pull out a foot of string from the dereeler, tiethe dereeler to the balloon <strong>and</strong> parachute train, <strong>and</strong> then attach the loop of string fromthe dereeler to the plastic ring of the radiosonde.Win9000 Processing <strong>and</strong> Display Software
4-54 SECTION 4 Preflight Preparations <strong>and</strong> LaunchYou can click theSave Flight Data orSave Flight Data Asbutton at any time tosave the data sincedata acquisitionbegan to a flight datafile.The Surface Data,Radiosonde Signal,Calibration Data, <strong>and</strong>PTU Data indicatorsshould display a greencheck mark; theDifferential GPSWinds indicator willdisplay a red X mark.FIGURE 4-21: The Current Data Display Immediately after SystemInitialization—Mark IIA DGPS (LOS) System26. If you want to change any of the settings made in the Preflight Information dialogbox, click the Preflight Information button to open the dialog box <strong>and</strong> make thechanges. You cannot change the settings after arming the radiosonde.The Arm buttonbecomes availableafter GPS lockup isobtained.Click the PreflightInformation button ifyou want to changeany of the settings inthe PreflightInformation dialog boxbefore arming theradiosonde.The DifferentialGPS Windsindicator turns froma red X to a greencheck mark whenGPS lockup isobtained.FIGURE 4-22: The Current Data Display when Ready to Arm forLaunch—Mark IIA DGPS (LOS) SystemOperator’s ManualP/N 9017-205, Rev. C
Mark IIA DGPS (LOS) System Preparation <strong>and</strong> Launch 4-554.4.3 Launching the RadiosondeTo <strong>launch</strong> the radiosonde:1. Click the Arm button.The Manual Launch <strong>and</strong> End Flight buttons become available as shown inFigure 4-23. Win9000 will automatically detect the <strong>launch</strong> of the radiosonde soonafter it is released. However, you can initiate the <strong>launch</strong> manually by clicking theManual Launch button. The flight can be ended manually at any time by clicking theEnd Flight button.The data can also be saved by clicking the Save Flight Data button, which saves thedata acquired up to that point in the flight to the flight data file specified in the SaveData To text box on the Flight Information tab of the Preflight Information dialogbox. If no file was specified, Win9000 asks you to select a folder <strong>and</strong> create a file tosave the data. You can also click the Save Flight Data As button, select a folder, <strong>and</strong>create a file or select an existing file to save the data.After clicking the Armbutton, the ManualLaunch buttonbecomes available forinitializing the <strong>launch</strong>manually. The EndFlight button becomesavailable for manuallyending the flight.FIGURE 4-23: The Current Data Display when Monitoring forLaunch—Mark IIA DGPS (LOS) System2. Release the radiosonde.Win9000 will detect the <strong>launch</strong> <strong>and</strong> continue acquiring data. The Flight windowshown in Figure 4-24 displays the Current Data display as it appears immediatelyafter detecting a <strong>launch</strong>. The End Flight, Save Flight Data <strong>and</strong> Save Flight Data Asbuttons are available throughout the entire flight for manually ending the flight <strong>and</strong>saving the data a flight data file. Win9000 will continue to acquire the data until theflight is either manually or automatically terminated.Win9000 Processing <strong>and</strong> Display Software
4-56 SECTION 4 Preflight Preparations <strong>and</strong> LaunchThe End Flight,Save Flight Data<strong>and</strong> Save FlightData As buttonsremain availablethroughout the flightfor manually endingthe flight <strong>and</strong> savingthe data to a flightdata file.FIGURE 4-24: The Current Data Display when Launch is Detected—Mark IIADGPS (LOS) SystemIf at Start of Flight was selected in the Give audible notifications drop-down list boxon the Data Management/Notifications tab of the Win9000 System Configurationdialog box for 1648-611 Mark IIA DGPS (LOS) MICROSONDES, along with a .wavfile, an audible notification will be heard when the <strong>launch</strong> is detected.3. Wait for Win9000 to terminate the flight automatically, or click the End Flight buttonto terminate the flight manually.NOTE You should save the data to a flight data file after the flight, otherwiseany unsaved data will be lost when you close the Flight window or exit fromWin9000. However, if the Automatically save data when flight ends check boxon the Flight Information tab of the Preflight Information dialog box is selected, the datawill be saved automatically when the flight ends.4. Save the data to a flight data file by doing one of the following:• Allow Win9000 to save the data automatically if the Automatically save datawhen flight ends check box on the Flight Information tab of the PreflightInformation dialog box is selected. The data are saved to the flight data filespecified in the Save Data To text box, along with additional files that aretransferred from the flight controller to the same folder as the flight data file. Whilethe files are being transferred, the Win9000 End of Flight File Transfer windowopens where the progress of the file transfer can be viewed:Operator’s ManualP/N 9017-205, Rev. C
Mark IIA DGPS (LOS) System Preparation <strong>and</strong> Launch 4-57NOTE If the Automatically save data when flight ends check box is cleared,the data are not saved. However, the additional files are transferred to the folderspecified in the Default directory for saving flight data text box on the DataManagement/Notifications tab of the Win9000 System Configuration dialog box for1648-611 Mark IIA DGPS (LOS) MICROSONDES.• Click the Save Flight Data button. The data are saved to the flight data filespecified in the Save Data To text box.• Click the Save Flight Data As button, select a folder, <strong>and</strong> create a file or select anexisting file to save the data.Win9000 Processing <strong>and</strong> Display Software
This page is intentionally left blank.
Mark IIA DGPS (LOS-B) System Preparation <strong>and</strong> Launch 4-594.5 Mark IIA DGPS (LOS-B) System Preparation<strong>and</strong> LaunchBefore a Mark IIA DGPS (LOS-B) MICROSONDE can be <strong>launch</strong>ed, it must be prepared<strong>and</strong> the W-9000 system initialized. A Mark IIA DGPS MICROSONDE does not requireto be initialized, only the W-9000 system. Refer to Figure 1-10 on page 1-15 for thelocation of the radiosonde battery compartment, sensors <strong>and</strong> other components called outbelow.4.5.1 Preparing the Radiosonde for FlightTo prepare the Mark IIA DGPS (LOS-B) MICROSONDE for flight:1. Prepare the balloon for flight.2. Unpack the radiosonde.3. Remove the battery from the radiosonde <strong>and</strong> its vacuum sealed foil bag.4. Place the battery with the label facing up in a container of fresh, room temperaturewater to a minimum depth of one inch.CAUTION Avoid getting the battery connectors wet. Water in the connectorsmay cause a short <strong>and</strong> significantly reduce battery life <strong>and</strong> may result in thebattery overheating.5. Leave the battery in the water for about two minutes, <strong>and</strong> then remove it.6. Shake the excess water from the battery by holding the battery in your h<strong>and</strong> with thelabel facing away from your palm, then extend your arm <strong>and</strong> swing it in an arcstarting over your head <strong>and</strong> stopping abruptly at your knees. Repeat the swingingmotion five or six times or until no water is present.CAUTION Excess water will cause overheating of the battery <strong>and</strong> a shorterbattery life.7. Place the battery in the plastic bag provided with the radiosonde.8. Place the battery in the radiosonde battery compartment such that the TOP label facesout of the compartment <strong>and</strong> the wires extend out from the bag compartment.9. Twist the battery wires that connect to the radiosonde counterclockwise four turns,<strong>and</strong> then twist the battery wires that connect to the battery clockwise four turns.NOTE Always connect the ground lead (black wire) of the battery to theradiosonde before connecting the positive lead (red wire). This procedureensures the radiosonde electronics is activated properly.Win9000 Processing <strong>and</strong> Display Software
4-60 SECTION 4 Preflight Preparations <strong>and</strong> LaunchCAUTION Never—for several seconds or longer—connect the positive lead(red wire) of the battery to the radiosonde without the ground lead (black wire)connected, as doing so may damage the radiosonde.10. As shown in Figure 4-25, connectthe ground lead (black wire) of thebattery to the ground lead (blackwire) of the radiosonde.Connect positiveleads (red) last11. Connect the positive lead (red wire)of the battery to the positive lead(red wire) of the radiosonde.12. Tuck any excess wire <strong>and</strong> theconnectors inside the batterycompartment, on the top or the sideof the battery.Connect groundleads (black) firstFIGURE 4-25: Connecting the Battery tothe RadiosondeNOTE Failure to completely tuck the wires inside the battery compartmentmay cause radio energy to feed back into the radiosonde electronics.13. Close the flap of the battery compartment, <strong>and</strong> then tape the compartment closedusing the supplied tape marked BATTERY by first removing the tape from the flap,removing the backing from the unused adhesive, <strong>and</strong> then taping the compartmentclosed using the fresh adhesive. Use additional tape if necessary.14. Unfold <strong>and</strong> extend the 403-MHz transmitter antenna.15. Remove the humidity (hygristor) sensor's protective canister from the radiosonde bytwisting it back <strong>and</strong> forth while pulling. If necessary, use a pair of pliers to remove it.16. Close the Humidity flap <strong>and</strong> tape it shut.17. Remove the plastic cover from the thermistor arm, <strong>and</strong> then orient the thermistor armaccording to the diagram on the side of the radiosonde.Operator’s ManualP/N 9017-205, Rev. C
Mark IIA DGPS (LOS-B) System Preparation <strong>and</strong> Launch 4-614.5.2 Initializing the W-9000 SystemInitializing the W-9000 system first requires that the system that uses the Mark IIA DGPS(LOS-B) be selected in Win9000. After selecting the system, a number of required <strong>and</strong>optional setup parameters that apply to the current flight must be entered in Win9000.Then the system can be initialized <strong>and</strong> the radiosonde can be <strong>launch</strong>ed.To initialize the W-9000 system:1. Choose New from the File menu.2. The Win9000 System Selection dialog box opens:retry.NOTE If the system is not enabled, click Cancel, <strong>and</strong> then choose SystemConfiguration from the File menu. In the Win9000 System Configuration dialogbox, select the system, click Enable/Disable, click Yes, <strong>and</strong> then click Close <strong>and</strong>3. Select the system for the Mark IIA DGPS (LOS-B) MICROSONDE, <strong>and</strong> then clickOK.A dialog box opens asking you to select an action:4. Select the Start a new radiosonde flight option, <strong>and</strong> then click OK.The Preflight Information dialog box for 1648-617 Mark IIA DGPS (LOS-B)MICROSONDES opens to the Flight Information tab:Win9000 Processing <strong>and</strong> Display Software
4-62 SECTION 4 Preflight Preparations <strong>and</strong> Launch5. Enter the serial number of the Mark IIA DGPS (LOS-B) MICROSONDE in theRadiosonde Serial Number text box. The serial number is printed on theidentification label on the outside of the radiosonde case.6. Enter an Ascent Identifier (the Flight ID) in the Ascent Identifier text box.7. Select the Automatically save data when flight ends check box if you want Win9000to automatically save the data at the end of the flight to the flight data file specified inthe Save Data To text box. If the Create a new directory for each flight check box inthe Data Management/Notifications tab of the Win9000 System Configuration dialogbox for 1648-617 Mark IIA DGPS (LOS-B) MICROSONDES is checked, a newfolder is created for the file. (See “Entering the Data Management/NotificationsParameter Settings” on page 3-48.) Both the file name <strong>and</strong> the new folder name arethe same as the Ascent Identifier. Clear the check box if you want to save the datamanually.This check box is initially selected or cleared in accordance with the choice made forthe Automatically save data when radiosonde flight ends check box on the DataManagement/Notifications tab of the Win9000 System Configuration dialog box for1648-617 Mark IIA DGPS (LOS-B) MICROSONDES. Similarly, the path <strong>and</strong> folderinitially displayed in the Save Data to text box is the one selected for the Defaultdirectory for saving flight data text box on the Data Management/Notifications tab.To save the flight data file in a different folder, click Browse, select or create thefolder <strong>and</strong> name the file, or type the path <strong>and</strong> file name in the Save Data To text box.Each flight data file should be saved in its own folder.8. Select the Automatically export data when flight ends check box if you wantWin9000 to automatically export the data at the end of the flight to an export file in anew folder that is created <strong>and</strong> placed in the folder specified in the Default directoryfor exporting flight data text box, which is on the Data Management/Notificationstab of the Win9000 System Configuration dialog box for 1648-617 Mark IIA DGPS(LOS-B) MICROSONDES. Both the new folder name <strong>and</strong> the file name are the sameas the Ascent Identifier. Clear the check box if you want to save the data manually.Operator’s ManualP/N 9017-205, Rev. C
Mark IIA DGPS (LOS-B) System Preparation <strong>and</strong> Launch 4-63This check box is initially selected or cleared in accordance with the choice made forthe Automatically export data when radiosonde flight ends check box on the DataManagement/Notifications tab.9. If desired, enter a message containing up to 80 characters in the Real Time SerialOutput Header text box. This message is output along with <strong>and</strong> just prior to the datathat are output on the RTSO serial port of the ZEEMET rack if the Enable Real TimeSerial Output check box is selected on the System/Station tab of the Win9000 SystemConfiguration dialog box.10. Click the Surface Data tab. The Surface Data tab opens:NOTE Values for the surface barometric pressure, dry bulb temperature,relative humidity, wind direction, <strong>and</strong> wind speed are required to be entered onthe Surface Data tab. And they should be entered just prior to the flight. All theentered values, except barometric pressure, can be approximate. The value entered forbarometric pressure should be as accurate as possible, as it directly determines theaccuracy of the calculated in-flight pressure. For some of the parameters you can selectthe units. Your selections do not affect units displayed in the any of the displays.11. In the Required area of the Surface Data tab, select the units for the surfacebarometric pressure from the drop-down list box, <strong>and</strong> then enter the pressure in theBarometric Pressure text box.12. Select the units for the surface dry bulb temperature, <strong>and</strong> then enter the temperaturein the Dry Bulb Temp. text box.13. Enter the surface relative humidity in percent in the Relative Humidity text box.14. Enter the surface wind direction in degrees in the Wind Direction text box.Win9000 Processing <strong>and</strong> Display Software
4-64 SECTION 4 Preflight Preparations <strong>and</strong> Launch15. Select the units for the surface wind speed, <strong>and</strong> then enter the speed in the WindSpeed text box.NOTE Values for the wet bulb temperature, sea surface temperature, WMOCloud Code, st<strong>and</strong>ard day <strong>and</strong> hour, <strong>and</strong> transmission identifier are notrequired, but can be optionally entered. For some of the parameters you canselect the units. Your selections do not affect units displayed in the any of the displays.16. In the Optional area of the of the Surface Data tab, select the Wet Bulb Temp. checkbox, <strong>and</strong> then select the units for the surface wet bulb temperature from thedrop-down list box <strong>and</strong> enter the temperature in the Wet Bulb Temp. text box.17. If you entered a value for the surface wet bulb temperature, you can have Win9000calculate the surface relative humidity by selecting the Use Wet Bulb TemperatureTo Calculate Humidity check box.18. Select the Sea Surface Temp. check box, <strong>and</strong> then select the units for the sea surfacetemperature <strong>and</strong> enter the temperature in the Sea Surface Temp. text box.19. Select the WMO Cloud Code check box, <strong>and</strong> then enter the code in the WMO CloudCode text box. The WMO Cloud Code is used in the TEMP message Part B,Section 8.20. Select the St<strong>and</strong>ard Day <strong>and</strong> Hour check box, <strong>and</strong> then select the day <strong>and</strong> hour fromthe drop-down list boxes. The day <strong>and</strong> hour is the WMO day <strong>and</strong> hour that theradiosonde will be <strong>launch</strong>ed.21. Select the Transmission Identifier check box, <strong>and</strong> then enter a Transmission ID in theTransmission Identifier text box. The Transmission ID, which identifies a station,can be included in a WMO message when it is transmitted.22. Click the Coded Messages tab.The Coded Messages tab opens:Operator’s ManualP/N 9017-205, Rev. C
Mark IIA DGPS (LOS-B) System Preparation <strong>and</strong> Launch 4-6523. If required, click Configure to create one or more coded message groups, or to edit orremove any groups shown.Message groups shown were created on the Message Generation tab of the CodedMessages tab of the Win9000 System Configuration dialog box.24. Click OK on any tab in the Preflight Information dialog box.The Preflight Information dialog box closes, <strong>and</strong> the Mark IIA DGPS with PressureCapsule (LOS-B) Flight window opens while the system is initializing:After Win9000 initializes the system, the Mark IIA DGPS with Pressure Capsule(LOS-B) Flight window closes <strong>and</strong> a Flight window opens to the Current Data displayas shown in Figure 4-26.Data acquisition begins when the Flight window opens. The Surface Data,Radiosonde Signal, Calibration Data, <strong>and</strong> PTU Data indicators in the Status area ofthe Current Data display should display a green check mark ( ), <strong>and</strong> the measuredpressure, temperature <strong>and</strong> humidity should be displayed. The Differential GPS Windsindicator will display a red X mark ( ).The data can be saved at any time by clicking the Save Flight Data button, whichsaves the data acquired since data acquisition began to the flight data file specified inthe Save Data To text box on the Flight Information tab of the Preflight Informationdialog box. Or click the Save Flight Data As button, select a folder, <strong>and</strong> create a fileor select an existing file to save the data.Approximately two minutes after data acquisition begins, the radiosonde should lockup on the GPS satellites, after which the Differential GPS Winds indicator will turnfrom a red X mark to a green check mark, making all the indicators green checkmarks, <strong>and</strong> the Arm button at the top of the Flight window will become available asshown in Figure 4-27. At this time the radiosonde is ready to be armed for <strong>launch</strong>.If when Ready to Arm for Launch was selected in the Give audible notificationsdrop-down list box on the Data Management/Notifications tab of the Win9000System Configuration dialog box for 1648-617 Mark IIA DGPS (LOS-B)MICROSONDES, along with a .wav file, an audible notification will be heard everyfew seconds.25. Move the radiosonde to the <strong>launch</strong> site, pull out a foot of string from the dereeler, tiethe dereeler to the balloon <strong>and</strong> parachute train, <strong>and</strong> then attach the loop of string fromthe dereeler to the plastic ring of the radiosonde.Win9000 Processing <strong>and</strong> Display Software
4-66 SECTION 4 Preflight Preparations <strong>and</strong> LaunchYou can click theSave Flight Data orSave Flight Data Asbutton at any time tosave the data sincedata acquisitionbegan to a flight datafile.The Surface Data,Radiosonde Signal,Calibration Data, <strong>and</strong>PTU Data indicatorsshould display a greencheck mark; theDifferential GPSWinds indicator willdisplay a red X mark.FIGURE 4-26: The Current Data Display Immediately after SystemInitialization—Mark IIA DGPS (LOS-B) System26. If you want to change any of the settings made in the Preflight Information dialogbox, click the Preflight Information button to open the dialog box <strong>and</strong> make thechanges. You cannot change the settings after arming the radiosonde.The Arm buttonbecomes availableafter GPS lockup isobtained.Click the PreflightInformation button ifyou want to changeany of the settings inthe PreflightInformation dialog boxbefore arming theradiosonde.Click the PressureBaselining button toenter the barometricpressure offset.The Differential GPSWinds indicator turnsfrom a red X to agreen check markwhen GPS lockup isobtained.FIGURE 4-27: The Current Data Display when Ready to Arm forLaunch—Mark IIA DGPS (LOS-B) SystemOperator’s ManualP/N 9017-205, Rev. C
Mark IIA DGPS (LOS-B) System Preparation <strong>and</strong> Launch 4-6727. Click the P Baseline button.The Win9000 Pressure Capsule Baselining dialog box opens:The Win9000 Pressure Capsule Baselining dialog box displays the surfacebarometric pressure, the barometric pressure measured by the pressure capsule in theradiosonde, <strong>and</strong> their difference. The surface pressure is the barometric pressureentered on the Surface Data tab of the Preflight Information dialog box for 1648-617Mark IIA DGPS (LOS-B) MICROSONDES. In addition, the average difference isdisplayed, where averaging is performed over time beginning when the dialog box isfirst opened.28. Allow Win9000 to continue to average the difference for approximately threeminutes, <strong>and</strong> then enter the displayed average difference in the Offset text box.29. Click OK to save the offset entry <strong>and</strong> close the Win9000 Pressure Capsule Baseliningdialog box. Click Cancel if you do not want to apply the offset.4.5.3 Launching the RadiosondeTo <strong>launch</strong> the radiosonde:1. Click the Arm button.The Manual Launch <strong>and</strong> End Flight buttons become available as shown inFigure 4-28. Win9000 will automatically detect the <strong>launch</strong> of the radiosonde soonafter it is released. However, you can initiate the <strong>launch</strong> manually by clicking theManual Launch button. The flight can be ended manually at any time by clicking theEnd Flight button.The data can also be saved by clicking the Save Flight Data button, which saves thedata acquired up to that point in the flight to the flight data file specified in the SaveData To text box on the Flight Information tab of the Preflight Information dialogbox. If no file was specified, Win9000 asks you to select a folder <strong>and</strong> create a file tosave the data. You can also click the Save Flight Data As button, select a folder, <strong>and</strong>create a file or select an existing file to save the data.Win9000 Processing <strong>and</strong> Display Software
4-68 SECTION 4 Preflight Preparations <strong>and</strong> LaunchAfter clicking the Armbutton, the ManualLaunch buttonbecomes available forinitializing the <strong>launch</strong>manually. The EndFlight button becomesavailable for manuallyending the flight.FIGURE 4-28: The Current Data Display when Monitoring forLaunch—Mark IIA DGPS (LOS-B) System2. Release the radiosonde.Win9000 will detect the <strong>launch</strong> <strong>and</strong> continue acquiring data. The Flight windowshown in Figure 4-29 displays the Current Data display as it appears immediatelyafter detecting a <strong>launch</strong>. The End Flight, Save Flight Data <strong>and</strong> Save Flight Data Asbuttons are available throughout the entire flight for manually ending the flight <strong>and</strong>saving the data a flight data file. Win9000 will continue to acquire the data until theflight is either manually or automatically terminated.If at Start of Flight was selected in the Give audible notifications drop-down list boxon the Data Management/Notifications tab of the Win9000 System Configurationdialog box for 1648-617 Mark IIA DGPS (LOS-B) MICROSONDES, along with a.wav file, an audible notification will be heard when the <strong>launch</strong> is detected.3. Wait for Win9000 to terminate the flight automatically, or click the End Flight buttonto terminate the flight manually.NOTE You should save the data to a flight data file after the flight, otherwiseany unsaved data will be lost when you close the Flight window or exit fromWin9000. However, if the Automatically save data when flight ends check boxon the Flight Information tab of the Preflight Information dialog box is selected, the datawill be saved automatically when the flight ends.Operator’s ManualP/N 9017-205, Rev. C
Mark IIA DGPS (LOS-B) System Preparation <strong>and</strong> Launch 4-69The End Flight,Save Flight Data<strong>and</strong> Save FlightData As buttonsremain availablethroughout the flightfor manually endingthe flight <strong>and</strong> savingthe data to a flightdata file.FIGURE 4-29: The Current Data Display when Launch is Detected—Mark IIADGPS (LOS-B) System4. Save the data to a flight data file by doing one of the following:• Allow Win9000 to save the data automatically if the Automatically save datawhen flight ends check box on the Flight Information tab of the PreflightInformation dialog box is selected. The data are saved to the flight data filespecified in the Save Data To text box, along with additional files that aretransferred from the flight controller to the same folder as the flight data file. Whilethe files are being transferred, the Win9000 End of Flight File Transfer windowopens where the progress of the file transfer can be viewed:Win9000 Processing <strong>and</strong> Display Software
4-70 SECTION 4 Preflight Preparations <strong>and</strong> LaunchNOTE If the Automatically save data when flight ends check box is cleared,the data are not saved. However, the additional files are transferred to the folderspecified in the Default directory for saving flight data text box on the DataManagement/Notifications tab of the Win9000 System Configuration dialog box for1648-617 Mark IIA DGPS (LOS-B) MICROSONDES.• Click the Save Flight Data button. The data are saved to the flight data filespecified in the Save Data To text box.• Click the Save Flight Data As button, select a folder, <strong>and</strong> create a file or select anexisting file to save the data.Operator’s ManualP/N 9017-205, Rev. C
Mark II Loran System Preparation <strong>and</strong> Launch 4-714.6 Mark II Loran System Preparation <strong>and</strong>LaunchBefore a Mark II Loran MICROSONDE can be <strong>launch</strong>ed, it must be prepared <strong>and</strong> the W-9000 system initialized. A Mark II Loran MICROSONDE does not require to beinitialized, only the W-9000 system. Refer to Figure 1-11 on page 1-17 for the location ofthe radiosonde battery compartment, sensors <strong>and</strong> other components called out below.4.6.1 Preparing the Radiosonde for FlightTo prepare the Mark II Loran MICROSONDE for flight:1. Prepare the balloon for flight.2. Unpack the radiosonde.3. Remove the battery from the radiosonde <strong>and</strong> its vacuum sealed foil bag.4. Place the battery with the label facing up in a container of fresh, room temperaturewater to a minimum depth of one inch.CAUTION Avoid getting the battery connectors wet. Water in the connectorsmay cause a short <strong>and</strong> significantly reduce battery life <strong>and</strong> may result in thebattery overheating.5. Leave the battery in the water for about two minutes, <strong>and</strong> then remove it.6. Shake the excess water from the battery by holding the battery in your h<strong>and</strong> with thelabel facing away from your palm, then extend your arm <strong>and</strong> swing it in an arcstarting over your head <strong>and</strong> stopping abruptly at your knees. Repeat the swingingmotion five or six times or until no water is present.CAUTION Excess water will cause overheating of the battery <strong>and</strong> a shorterbattery life.7. Place the battery in the plastic bag provided with the radiosonde.8. Place the battery in the radiosonde battery compartment such that the TOP label facesout of the compartment <strong>and</strong> the wires extend out from the bag compartment.9. Twist the battery wires that connect to the radiosonde counterclockwise four turns,<strong>and</strong> then twist the battery wires that connect to the battery clockwise four turns.NOTE Always connect the ground lead (black wire) of the battery to theradiosonde before connecting the positive lead (red wire). This procedureensures the radiosonde electronics is activated properly.Win9000 Processing <strong>and</strong> Display Software
4-72 SECTION 4 Preflight Preparations <strong>and</strong> LaunchCAUTION Never—for several seconds or longer—connect the positive lead(red wire) of the battery to the radiosonde without the ground lead (black wire)connected, as doing so may damage the radiosonde.10. As shown in Figure 4-30, connectthe ground lead (black wire) of thebattery to the ground lead (blackwire) of the radiosonde.Connect positiveleads (red) last11. Connect the positive lead (red wire)of the battery to the positive lead(red wire) of the radiosonde.12. Tuck any excess wire <strong>and</strong> theconnectors inside the batterycompartment, on the top or the sideof the battery.Connect groundleads (black) firstFIGURE 4-30: Connecting the Battery tothe RadiosondeNOTE Failure to completely tuck the wires inside the battery compartmentmay cause radio energy to feed back into the radiosonde electronics.13. Close the flap of the battery compartment, <strong>and</strong> then tape the compartment closedusing the supplied tape marked BATTERY by first removing the tape from the flap,removing the backing from the unused adhesive, <strong>and</strong> then taping the compartmentclosed using the fresh adhesive. Use additional tape if necessary.14. Unfold <strong>and</strong> extend the 403-MHz transmitter antenna.15. Remove the humidity (hygristor) sensor's protective canister from the radiosonde bytwisting it back <strong>and</strong> forth while pulling. If necessary, use a pair of pliers to remove it.16. Close the Humidity flap <strong>and</strong> tape it shut by removing the tape from the flap,removing the backing from the unused adhesive, <strong>and</strong> then firmly taping the flap shutusing the fresh adhesive. Use additional tape if necessary.17. Remove the plastic cover from the thermistor arm, <strong>and</strong> then orient the thermistor armaccording to the diagram on the side of the radiosonde.18. If the installed dereeler will be used, remove dereeler T-pin from the dereelerassembly, <strong>and</strong> then remove the tape that holds the string to the case <strong>and</strong> pull out six toeight inches of string.Operator’s ManualP/N 9017-205, Rev. C
Mark II Loran System Preparation <strong>and</strong> Launch 4-734.6.2 Initializing the W-9000 SystemInitializing the W-9000 system first requires that the system that uses the Mark II LoranMICROSONDE be selected in Win9000. After selecting the system, a number of required<strong>and</strong> optional setup parameters that apply to the current flight must be entered in Win9000.Then the system can be initialized <strong>and</strong> the radiosonde can be <strong>launch</strong>ed.To initialize the W-9000 system:1. Choose New from the File menu.2. The Win9000 System Selection dialog box opens:retry.NOTE If the system is not enabled, click Cancel, <strong>and</strong> then choose SystemConfiguration from the File menu. In the Win9000 System Configuration dialogbox, select the system, click Enable/Disable, click Yes, <strong>and</strong> then click Close <strong>and</strong>3. Select the system for the Mark II Loran MICROSONDE, <strong>and</strong> then click OK.A dialog box opens asking you to select an action:4. Select the Start a new radiosonde flight option, <strong>and</strong> then click OK.The Preflight Information dialog box for 1543-611 Mark II Loran MICROSONDESopens to the Flight Information tab:Win9000 Processing <strong>and</strong> Display Software
4-74 SECTION 4 Preflight Preparations <strong>and</strong> Launch5. Enter the serial number of the Mark II Loran MICROSONDE in the RadiosondeSerial Number text box. The serial number is printed on the identification label on theoutside of the radiosonde case.6. Enter an Ascent Identifier (the Flight ID) in the Ascent Identifier text box.7. Select the Automatically save data when flight ends check box if you want Win9000to automatically save the data at the end of the flight to the flight data file specified inthe Save Data To text box. If the Create a new directory for each flight check box inthe Data Management/Notifications tab of the Win9000 System Configuration dialogbox for 1543-611 Mark II Loran MICROSONDES is checked, a new folder is createdfor the file. (See “Entering the Data Management/Notifications Parameter Settings”on page 3-58.) Both the file name <strong>and</strong> the new folder name are the same as the AscentIdentifier. Clear the check box if you want to save the data manually.This check box is initially selected or cleared in accordance with the choice made forthe Automatically save data when radiosonde flight ends check box on the DataManagement/Notifications tab of the Win9000 System Configuration dialog box for1543-611 Mark II Loran MICROSONDES. Similarly, the path <strong>and</strong> folder initiallydisplayed in the Save Data to text box is the one selected for the Default directory forsaving flight data text box on the Data Management/Notifications tab. To save theflight data file in a different folder, click Browse, select or create the folder <strong>and</strong> namethe file, or type the path <strong>and</strong> file name in the Save Data To text box. Each flight datafile should be saved in its own folder.8. Select the Automatically export data when flight ends check box if you wantWin9000 to automatically export the data at the end of the flight to an export file in anew folder that is created <strong>and</strong> placed in the folder specified in the Default directoryfor exporting flight data text box, which is on the Data Management/Notificationstab of the Win9000 System Configuration dialog box for 1543-611 Mark II LoranMICROSONDES. Both the new folder name <strong>and</strong> the file name are the same as theAscent Identifier. Clear the check box if you want to save the data manually.Operator’s ManualP/N 9017-205, Rev. C
Mark II Loran System Preparation <strong>and</strong> Launch 4-75This check box is initially selected or cleared in accordance with the choice made forthe Automatically export data when radiosonde flight ends check box on the DataManagement/Notifications tab.9. If desired, enter a message containing up to 80 characters in the Real Time SerialOutput Header text box. This message is output along with <strong>and</strong> just prior to the datathat are output on the RTSO serial port of the ZEEMET rack if the Enable Real TimeSerial Output check box is selected on the System/Station tab of the Win9000 SystemConfiguration dialog box.10. Click the Surface Data tab. The Surface Data tab opens:NOTE Values for the surface barometric pressure, dry bulb temperature,relative humidity, wind direction, <strong>and</strong> wind speed are required to be entered onthe Surface Data tab. And they should be entered just prior to the flight. All theentered values, except barometric pressure, can be approximate. The value entered forbarometric pressure should be as accurate as possible, as it directly determines theaccuracy of the calculated in-flight pressure. For some of the parameters you can selectthe units. Your selections do not affect units displayed in the any of the displays.11. In the Required area of the Surface Data tab, select the units for the surfacebarometric pressure from the drop-down list box, <strong>and</strong> then enter the pressure in theBarometric Pressure text box.12. Select the units for the surface dry bulb temperature, <strong>and</strong> then enter the temperaturein the Dry Bulb Temp. text box.13. Enter the surface relative humidity in percent in the Relative Humidity text box.14. Enter the surface wind direction in degrees in the Wind Direction text box.Win9000 Processing <strong>and</strong> Display Software
4-76 SECTION 4 Preflight Preparations <strong>and</strong> Launch15. Select the units for the surface wind speed, <strong>and</strong> then enter the speed in the WindSpeed text box.NOTE Values for the wet bulb temperature, sea surface temperature, WMOCloud Code, st<strong>and</strong>ard day <strong>and</strong> hour, <strong>and</strong> transmission identifier are notrequired, but can be optionally entered. For some of the parameters you canselect the units. Your selections do not affect units displayed in the any of the displays.16. In the Optional area of the of the Surface Data tab, select the Wet Bulb Temp. checkbox, <strong>and</strong> then select the units for the surface wet bulb temperature from thedrop-down list box <strong>and</strong> enter the temperature in the Wet Bulb Temp. text box.17. If you entered a value for the surface wet bulb temperature, you can have Win9000calculate the surface relative humidity by selecting the Use Wet Bulb TemperatureTo Calculate Humidity check box.18. Select the Sea Surface Temp. check box, <strong>and</strong> then select the units for the sea surfacetemperature <strong>and</strong> enter the temperature in the Sea Surface Temp. text box.19. Select the WMO Cloud Code check box, <strong>and</strong> then enter the code in the WMO CloudCode text box. The WMO Cloud Code is used in the TEMP message Part B,Section 8.20. Select the St<strong>and</strong>ard Day <strong>and</strong> Hour check box, <strong>and</strong> then select the day <strong>and</strong> hour fromthe drop-down list boxes. The day <strong>and</strong> hour is the WMO day <strong>and</strong> hour that theradiosonde will be <strong>launch</strong>ed.21. Select the Transmission Identifier check box, <strong>and</strong> then enter a Transmission ID in theTransmission Identifier text box. The Transmission ID, which identifies a station,can be included in a WMO message when it is transmitted.22. Click the Coded Messages tab.The Coded Messages tab opens:Operator’s ManualP/N 9017-205, Rev. C
Mark II Loran System Preparation <strong>and</strong> Launch 4-7723. If required, click Configure to create one or more coded message groups, or to edit orremove any groups shown.Message groups shown were created on the Message Generation tab of the CodedMessages tab of the Win9000 System Configuration dialog box.24. Click OK on any tab in the Preflight Information dialog box.The Preflight Information dialog box closes, <strong>and</strong> the Mark II Loran Flight windowopens while the system is initializing:After Win9000 initializes the system, the Mark II Loran Flight window closes <strong>and</strong> aFlight window opens to the Current Data display as shown in Figure 4-31.Data acquisition begins when the Flight window opens. The Surface Data,Radiosonde Signal, Calibration Data, <strong>and</strong> PTU Data indicators in the Status area ofthe Current Data display should display a green check mark ( ), <strong>and</strong> the measuredpressure, temperature <strong>and</strong> humidity should be displayed. The Loran Winds indicatorwill display a red X mark ( ).The data can be saved at any time by clicking the Save Flight Data button, whichsaves the data acquired since data acquisition began to the flight data file specified inthe Save Data To text box on the Flight Information tab of the Preflight Informationdialog box. Or click the Save Flight Data As button, select a folder, <strong>and</strong> create a fileor select an existing file to save the data.Shortly after data acquisition begins, the Loran trackers should lock on to each of thestations in the Loran chain, after which the Loran Winds indicator will turn from ared X mark to a green check mark, making all the indicators green check marks, <strong>and</strong>the Arm button at the top of the Flight window will become available as shown inFigure 4-32. At this time the radiosonde is ready to be armed for <strong>launch</strong>. The progressof the Loran trackers can be viewed in the Antenna/Receiver/Loran Status display.If when Ready to Arm for Launch was selected in the Give audible notificationsdrop-down list box on the Data Management/Notifications tab of the Win9000System Configuration dialog box for 1543-611 Mark II Loran MICROSONDES,along with a .wav file, an audible notification will be heard every few seconds.25. Immediately move the radiosonde to the <strong>launch</strong> site <strong>and</strong> tie it to the balloon <strong>and</strong>parachute train.Win9000 Processing <strong>and</strong> Display Software
4-78 SECTION 4 Preflight Preparations <strong>and</strong> LaunchYou can click theSave Flight Data orSave Flight Data Asbutton at any time tosave the data sincedata acquisitionbegan to a flight datafile.The Surface Data,Radiosonde Signal,Calibration Data, <strong>and</strong>PTU Data indicatorsshould display a greencheck mark; the LoranWinds indicator willdisplay a red X mark.FIGURE 4-31: The Current Data Display Immediately after SystemInitialization—Mark II Loran System26. If you want to change any of the settings made in the Preflight Information dialogbox, click the Preflight Information button to open the dialog box <strong>and</strong> make thechanges. You cannot change the settings after arming the radiosonde.The Arm buttonbecomes availableafter the radiosondebegins receiving theLoran signals.Click the PreflightInformation button ifyou want to changeany of the settings inthe PreflightInformation dialog boxbefore arming theradiosonde.The Loran Windsindicator turns froma red X to a greencheck mark whenthe Loran signalsare received.FIGURE 4-32: The Current Data Display when Ready to Arm forLaunch—Mark II Loran SystemOperator’s ManualP/N 9017-205, Rev. C
Mark II Loran System Preparation <strong>and</strong> Launch 4-794.6.3 Launching the RadiosondeTo <strong>launch</strong> the radiosonde:1. Click the Arm button.The End Flight button becomes available as shown in Figure 4-33. Win9000 willautomatically detect the <strong>launch</strong> of the radiosonde soon after it is released. The flightcan be ended manually at any time by clicking the End Flight button.The data can also be saved by clicking the Save Flight Data button, which saves thedata acquired up to that point in the flight to the flight data file specified in the SaveData To text box on the Flight Information tab of the Preflight Information dialogbox. If no file was specified, Win9000 asks you to select a folder <strong>and</strong> create a file tosave the data. You can also click the Save Flight Data As button, select a folder, <strong>and</strong>create a file or select an existing file to save the data.After clicking theArm button, the EndFlight buttonbecomes availablefor manually endingthe flight.FIGURE 4-33: The Current Data Display when Monitoring forLaunch—Mark II Loran System2. Release the radiosonde.Win9000 will detect the <strong>launch</strong> <strong>and</strong> continue acquiring data. The Flight windowshown in Figure 4-34 displays the Current Data display as it appears immediatelyafter detecting a <strong>launch</strong>. The End Flight, Save Flight Data <strong>and</strong> Save Flight Data Asbuttons are available throughout the entire flight for manually ending the flight <strong>and</strong>saving the data a flight data file. Win9000 will continue to acquire the data until theflight is either manually or automatically terminated.Win9000 Processing <strong>and</strong> Display Software
4-80 SECTION 4 Preflight Preparations <strong>and</strong> LaunchThe End Flight,Save Flight Data<strong>and</strong> Save FlightData As buttonsremain availablethroughout the flightfor manually endingthe flight <strong>and</strong> savingthe data to a flightdata file.FIGURE 4-34: The Current Data Display when Launch is Detected—Mark IILoran SystemIf at Start of Flight was selected in the Give audible notifications drop-down list boxon the Data Management/Notifications tab of the Win9000 System Configurationdialog box for 1543-611 Mark II Loran MICROSONDES, along with a .wav file, anaudible notification will be heard when the <strong>launch</strong> is detected.3. Wait for Win9000 to terminate the flight automatically, or click the End Flight buttonto terminate the flight manually.NOTE You should save the data to a flight data file after the flight, otherwiseany unsaved data will be lost when you close the Flight window or exit fromWin9000. However, if the Automatically save data when flight ends check boxon the Flight Information tab of the Preflight Information dialog box is selected, the datawill be saved automatically when the flight ends.4. Save the data to a flight data file by doing one of the following:• Allow Win9000 to save the data automatically if the Automatically save datawhen flight ends check box on the Flight Information tab of the PreflightInformation dialog box is selected. The data are saved to the flight data filespecified in the Save Data To text box, along with additional files that aretransferred from the flight controller to the same folder as the flight data file. Whilethe files are being transferred, the Win9000 End of Flight File Transfer windowopens where the progress of the file transfer can be viewed:Operator’s ManualP/N 9017-205, Rev. C
Mark II Loran System Preparation <strong>and</strong> Launch 4-81NOTE If the Automatically save data when flight ends check box is cleared,the data are not saved. However, the additional files are transferred to the folderspecified in the Default directory for saving flight data text box on the DataManagement/Notifications tab of the Win9000 System Configuration dialog box for1543-611 Mark II Loran MICROSONDES.• Click the Save Flight Data button. The data are saved to the flight data filespecified in the Save Data To text box.• Click the Save Flight Data As button, select a folder, <strong>and</strong> create a file or select anexisting file to save the data.Win9000 Processing <strong>and</strong> Display Software
This page is intentionally left blank.
Mark IIA DGPS with Radiation Sensor (LOS) System Preparation <strong>and</strong> Launch4-834.7 Mark IIA DGPS with Radiation Sensor (LOS)System Preparation <strong>and</strong> LaunchBefore a Mark IIA DGPS with Radiation Sensor (LOS) MICROSONDE can be <strong>launch</strong>ed,it must be prepared <strong>and</strong> the W-9000 system initialized. A Mark IIA DGPSMICROSONDE does not require to be initialized, only the W-9000 system. Refer toFigure 1-12 on page 1-19 for the location of the radiosonde battery compartment, sensors<strong>and</strong> other components called out below.4.7.1 Preparing the Radiosonde for FlightTo prepare the Mark IIA DGPS with Radiation Sensor (LOS) MICROSONDE for flight:1. Prepare the balloon for flight.2. Unpack the radiosonde.3. Remove the battery from the radiosonde <strong>and</strong> its vacuum sealed foil bag.4. Place the battery with the label facing up in a container of fresh, room temperaturewater to a minimum depth of one inch.CAUTION Avoid getting the battery connectors wet. Water in the connectorsmay cause a short <strong>and</strong> significantly reduce battery life <strong>and</strong> may result in thebattery overheating.5. Leave the battery in the water for about two minutes, <strong>and</strong> then remove it.6. Shake the excess water from the battery by holding the battery in your h<strong>and</strong> with thelabel facing away from your palm, then extend your arm <strong>and</strong> swing it in an arcstarting over your head <strong>and</strong> stopping abruptly at your knees. Repeat the swingingmotion five or six times or until no water is present.CAUTION Excess water will cause overheating of the battery <strong>and</strong> a shorterbattery life.7. Place the battery in the plastic bag provided with the radiosonde.8. Place the battery in the radiosonde battery compartment such that the TOP label facesout of the compartment <strong>and</strong> the wires extend out from the bag compartment.9. Twist the battery wires that connect to the radiosonde counterclockwise four turns,<strong>and</strong> then twist the battery wires that connect to the battery clockwise four turns.NOTE Always connect the ground lead (black wire) of the battery to theradiosonde before connecting the positive lead (red wire). This procedureensures the radiosonde electronics is activated properly.Win9000 Processing <strong>and</strong> Display Software
4-84 SECTION 4 Preflight Preparations <strong>and</strong> LaunchCAUTION Never—for several seconds or longer—connect the positive lead(red wire) of the battery to the radiosonde without the ground lead (black wire)connected, as doing so may damage the radiosonde.10. As shown in Figure 4-35, connectthe ground lead (black wire) of thebattery to the ground lead (blackwire) of the radiosonde.Connect positiveleads (red) last11. Connect the positive lead (red wire)of the battery to the positive lead(red wire) of the radiosonde.12. Tuck any excess wire <strong>and</strong> theconnectors inside the batterycompartment, on the top or the sideof the battery.Connect groundleads (black) firstFIGURE 4-35: Connecting the Battery tothe RadiosondeNOTE Failure to completely tuck the wires inside the battery compartmentmay cause radio energy to feed back into the radiosonde electronics.13. Close the flap of the battery compartment, <strong>and</strong> then tape the compartment closedusing the supplied tape marked BATTERY by first removing the tape from the flap,removing the backing from the unused adhesive, <strong>and</strong> then taping the compartmentclosed using the fresh adhesive. Use additional tape if necessary.14. Unfold <strong>and</strong> extend the 403-MHztransmitter antenna.15. Remove the humidity (hygristor)sensor's protective canister from theradiosonde by twisting it back <strong>and</strong>forth while pulling. If necessary, usea pair of pliers to remove it.16. Close the Humidity flap <strong>and</strong> tape itshut.17. Remove the plastic cover from thethermistor arm, <strong>and</strong> then orient thethermistor arm as shown inFigure 1-12 on page 1-19.18. Connect the radiation sensor powercable to the radiosonde as shown inFigure 4-36.FIGURE 4-36: Connecting the RadiationSensor Power Cable to the RadiosondeOperator’s ManualP/N 9017-205, Rev. C
Mark IIA DGPS with Radiation Sensor (LOS) System Preparation <strong>and</strong> Launch4-854.7.2 Initializing the W-9000 SystemInitializing the W-9000 system first requires that the system that uses the Mark IIA DGPSwith Radiation Sensor (LOS) MICROSONDE be selected in Win9000. After selecting thesystem, a number of required <strong>and</strong> optional setup parameters that apply to the current flightmust be entered in Win9000. Then the system can be initialized <strong>and</strong> the radiosonde can be<strong>launch</strong>ed.To initialize the W-9000 system:1. Choose New from the File menu.2. The Win9000 System Selection dialog box opens:retry.NOTE If the system is not enabled, click Cancel, <strong>and</strong> then choose SystemConfiguration from the File menu. In the Win9000 System Configuration dialogbox, select the system, click Enable/Disable, click Yes, <strong>and</strong> then click Close <strong>and</strong>3. Select the system for the Mark IIA DGPS with Radiation Sensor (LOS)MICROSONDE, <strong>and</strong> then click OK.A dialog box opens asking you to select an action:4. Select the Start a new radiosonde flight option, <strong>and</strong> then click OK.The Preflight Information dialog box for 1648-626 Mark IIA DGPS with RadiationSensor (LOS) MICROSONDES opens to the Flight Information tab:Win9000 Processing <strong>and</strong> Display Software
4-86 SECTION 4 Preflight Preparations <strong>and</strong> Launch5. Enter the serial number of the Mark IIA DGPS (LOS) MICROSONDE in theRadiosonde Serial Number text box, <strong>and</strong> the Sippican 1548-236 Radiation Sensor inthe Radiation Sensor Serial Number text box. The serial numbers are printed onidentification labels on the outside of the radiosonde <strong>and</strong> sensor cases.6. Enter an Ascent Identifier (the Flight ID) in the Ascent Identifier text box.7. Select the Automatically save data when flight ends check box if you want Win9000to automatically save the data at the end of the flight to the flight data file specified inthe Save Data To text box. If the Create a new directory for each flight check box inthe Data Management/Notifications tab of the Win9000 System Configuration dialogbox for 1648-626 Mark IIA DGPS with Radiation Sensor (LOS) MICROSONDES ischecked, a new folder is created for the file. (See “Entering the Data Management/Notifications Parameter Settings” on page 3-70.) Both the file name <strong>and</strong> the newfolder name are the same as the Ascent Identifier. Clear the check box if you want tosave the data manually.This check box is initially selected or cleared in accordance with the choice made forthe Automatically save data when radiosonde flight ends check box on the DataManagement/Notifications tab of the Win9000 System Configuration dialog box for1648-626 Mark IIA DGPS with Radiation Sensor (LOS) MICROSONDE. Similarly,the path <strong>and</strong> folder initially displayed in the Save Data to text box is the one selectedfor the Default directory for saving flight data text box on the Data Management/Notifications tab. To save the flight data file in a different folder, click Browse, selector create the folder <strong>and</strong> name the file, or type the path <strong>and</strong> file name in the Save DataTo text box. Each flight data file should be saved in its own folder.8. Select the Automatically export data when flight ends check box if you wantWin9000 to automatically export the data at the end of the flight to an export file in anew folder that is created <strong>and</strong> placed in the folder specified in the Default directoryfor exporting flight data text box, which is on the Data Management/Notificationstab of the Win9000 System Configuration dialog box for 1648-626 Mark IIA DGPSwith Radiation Sensor (LOS) MICROSONDE. Both the new folder name <strong>and</strong> the filename are the same as the Ascent Identifier. Clear the check box if you want to savethe data manually.Operator’s ManualP/N 9017-205, Rev. C
Mark IIA DGPS with Radiation Sensor (LOS) System Preparation <strong>and</strong> Launch4-87This check box is initially selected or cleared in accordance with the choice made forthe Automatically export data when radiosonde flight ends check box on the DataManagement/Notifications tab.9. If desired, enter a message containing up to 80 characters in the Real Time SerialOutput Header text box. This message is output along with <strong>and</strong> just prior to the datathat are output on the RTSO serial port of the ZEEMET rack if the Enable Real TimeSerial Output check box is selected on the System/Station tab of the Win9000 SystemConfiguration dialog box.10. Click the Surface Data tab. The Surface Data tab opens:NOTE Values for the surface barometric pressure, dry bulb temperature,relative humidity, wind direction, <strong>and</strong> wind speed are required to be entered onthe Surface Data tab. And they should be entered just prior to the flight. All theentered values, except barometric pressure, can be approximate. The value entered forbarometric pressure should be as accurate as possible, as it directly determines theaccuracy of the calculated in-flight pressure. For some of the parameters you can selectthe units. Your selections do not affect units displayed in the any of the displays.11. In the Required area of the Surface Data tab, select the units for the surfacebarometric pressure from the drop-down list box, <strong>and</strong> then enter the pressure in theBarometric Pressure text box.12. Select the units for the surface dry bulb temperature, <strong>and</strong> then enter the temperaturein the Dry Bulb Temp. text box.13. Enter the surface relative humidity in percent in the Relative Humidity text box.14. Enter the surface wind direction in degrees in the Wind Direction text box.Win9000 Processing <strong>and</strong> Display Software
4-88 SECTION 4 Preflight Preparations <strong>and</strong> Launch15. Select the units for the surface wind speed, <strong>and</strong> then enter the speed in the WindSpeed text box.NOTE Values for the wet bulb temperature, sea surface temperature, WMOCloud Code, st<strong>and</strong>ard day <strong>and</strong> hour, <strong>and</strong> transmission identifier are notrequired, but can be optionally entered. For some of the parameters you canselect the units. Your selections do not affect units displayed in the any of the displays.16. In the Optional area of the of the Surface Data tab, select the Wet Bulb Temp. checkbox, <strong>and</strong> then select the units for the surface wet bulb temperature from thedrop-down list box <strong>and</strong> enter the temperature in the Wet Bulb Temp. text box.17. If you entered a value for the surface wet bulb temperature, you can have Win9000calculate the surface relative humidity by selecting the Use Wet Bulb TemperatureTo Calculate Humidity check box.18. Select the Sea Surface Temp. check box, <strong>and</strong> then select the units for the sea surfacetemperature <strong>and</strong> enter the temperature in the Sea Surface Temp. text box.19. Select the WMO Cloud Code check box, <strong>and</strong> then enter the code in the WMO CloudCode text box. The WMO Cloud Code is used in the TEMP message Part B,Section 8.20. Select the St<strong>and</strong>ard Day <strong>and</strong> Hour check box, <strong>and</strong> then select the day <strong>and</strong> hour fromthe drop-down list boxes. The day <strong>and</strong> hour is the WMO day <strong>and</strong> hour that theradiosonde will be <strong>launch</strong>ed.21. Select the Transmission Identifier check box, <strong>and</strong> then enter a Transmission ID in theTransmission Identifier text box. The Transmission ID, which identifies a station,can be included in a WMO message when it is transmitted.22. Click the Coded Messages tab.The Coded Messages tab opens:Operator’s ManualP/N 9017-205, Rev. C
Mark IIA DGPS with Radiation Sensor (LOS) System Preparation <strong>and</strong> Launch4-8923. If required, click Configure to create one or more coded message groups, or to edit orremove any groups shown.Message groups shown were created on the Message Generation tab of the CodedMessages tab of the Win9000 System Configuration dialog box.24. Click OK on any tab in the Preflight Information dialog box.The Preflight Information dialog box closes, <strong>and</strong> the Mark IIA with Radiation SensorDGPS (LOS) Flight window opens while the system is initializing:After Win9000 initializes the system, the Mark IIA DGPS with Radiation Sensor(LOS) Flight window closes <strong>and</strong> a Flight window opens to the Current Data displayas shown in Figure 4-37.Data acquisition begins when the Flight window opens. The Surface Data,Radiosonde Signal, Calibration Data, <strong>and</strong> PTU Data indicators in the Status area ofthe Current Data display should display a green check mark ( ), <strong>and</strong> the measuredpressure, temperature <strong>and</strong> Differential GPS Winds humidity should be displayed. TheDifferential GPS Winds indicator will display a red X mark ( ).The data can be saved at any time by clicking the Save Flight Data button, whichsaves the data acquired since data acquisition began to the flight data file specified inthe Save Data To text box on the Flight Information tab of the Preflight Informationdialog box. Or click the Save Flight Data As button, select a folder, <strong>and</strong> create a fileor select an existing file to save the data.Approximately two minutes after data acquisition begins, the radiosonde should lockup on the GPS satellites, after which the Differential GPS Winds indicator will turnfrom a red X mark to a green check mark, making all the indicators green checkmarks, <strong>and</strong> the Arm button at the top of the Flight window will become available asshown in Figure 4-38. At this time the radiosonde is ready to be armed for <strong>launch</strong>.If when Ready to Arm for Launch was selected in the Give audible notificationsdrop-down list box on the Data Management/Notifications tab of the Win9000System Configuration dialog box for 1648-626 Mark IIA DGPS with RadiationSensor (LOS) MICROSONDE, along with a .wav file, an audible notification will beheard every few seconds.25. Move the radiosonde to the <strong>launch</strong> site, pull out a foot of string from the dereeler, tiethe dereeler to the balloon <strong>and</strong> parachute train, <strong>and</strong> then attach the loop of string fromthe dereeler to the plastic ring of the radiosonde.Win9000 Processing <strong>and</strong> Display Software
4-90 SECTION 4 Preflight Preparations <strong>and</strong> LaunchYou can click theSave Flight Data orSave Flight Data Asbutton at any time tosave the data sincedata acquisitionbegan to a flight datafile.The Surface Data,Radiosonde Signal,Calibration Data, <strong>and</strong>PTU Data indicatorsshould display a greencheck mark; theDifferential GPSWinds indicator willdisplay a red X mark.FIGURE 4-37: The Current Data Display Immediately after SystemInitialization—Mark IIA DGPS with Radiation Sensor (LOS) System26. If you want to change any of the settings made in the Preflight Information dialogbox, click the Preflight Information button to open the dialog box <strong>and</strong> make thechanges. You cannot change the settings after arming the radiosonde.The Arm buttonbecomes availableafter GPS lockup isobtained.Click the PreflightInformation button ifyou want to changeany of the settings inthe PreflightInformation dialog boxbefore arming theradiosonde.The DifferentialGPS Windsindicator turns froma red X to a greencheck mark whenGPS lockup isobtained.FIGURE 4-38: The Current Data Display when Ready to Arm forLaunch—Mark IIA DGPS with Radiation Sensor (LOS) SystemOperator’s ManualP/N 9017-205, Rev. C
Mark IIA DGPS with Radiation Sensor (LOS) System Preparation <strong>and</strong> Launch4-914.7.3 Launching the RadiosondeTo <strong>launch</strong> the radiosonde:1. Click the Arm button.The Manual Launch <strong>and</strong> End Flight buttons become available as shown inFigure 4-39. Win9000 will automatically detect the <strong>launch</strong> of the radiosonde soonafter it is released. However, you can initiate the <strong>launch</strong> manually by clicking theManual Launch button. The flight can be ended manually at any time by clicking theEnd Flight button.The data can also be saved by clicking the Save Flight Data button, which saves thedata acquired up to that point in the flight to the flight data file specified in the SaveData To text box on the Flight Information tab of the Preflight Information dialogbox. If no file was specified, Win9000 asks you to select a folder <strong>and</strong> create a file tosave the data. You can also click the Save Flight Data As button, select a folder, <strong>and</strong>create a file or select an existing file to save the data.After clicking the Armbutton, the ManualLaunch buttonbecomes available forinitializing the <strong>launch</strong>manually. The EndFlight button becomesavailable for manuallyending the flight.FIGURE 4-39: The Current Data Display when Monitoring forLaunch—Mark IIA DGPS with Radiation Sensor (LOS) System2. Release the radiosonde.Win9000 will detect the <strong>launch</strong> <strong>and</strong> continue acquiring data. The Flight windowshown in Figure 4-40 displays the Current Data display as it appears immediatelyafter detecting a <strong>launch</strong>. The End Flight, Save Flight Data <strong>and</strong> Save Flight Data Asbuttons are available throughout the entire flight for manually ending the flight <strong>and</strong>saving the data a flight data file. Win9000 will continue to acquire the data until theflight is either manually or automatically terminated.Win9000 Processing <strong>and</strong> Display Software
4-92 SECTION 4 Preflight Preparations <strong>and</strong> LaunchThe End Flight,Save Flight Data<strong>and</strong> Save FlightData As buttonsremain availablethroughout the flightfor manually endingthe flight <strong>and</strong> savingthe data to a flightdata file.FIGURE 4-40: The Current Data Display when Launch is Detected—Mark IIADGPS with Radiation Sensor (LOS) SystemIf at Start of Flight was selected in the Give audible notifications drop-down list boxon the Data Management/Notifications tab of the Win9000 System Configurationdialog box for 1648-626 Mark IIA DGPS with Radiation Sensor (LOS)MICROSONDE, along with a .wav file, an audible notification will be heard whenthe <strong>launch</strong> is detected.3. Wait for Win9000 to terminate the flight automatically, or click the End Flight buttonto terminate the flight manually.NOTE You should save the data to a flight data file after the flight, otherwiseany unsaved data will be lost when you close the Flight window or exit fromWin9000. However, if the Automatically save data when flight ends check boxon the Flight Information tab of the Preflight Information dialog box is selected, the datawill be saved automatically when the flight ends.4. Save the data to a flight data file by doing one of the following:• Allow Win9000 to save the data automatically if the Automatically save datawhen flight ends check box on the Flight Information tab of the PreflightInformation dialog box is selected. The data are saved to the flight data filespecified in the Save Data To text box, along with additional files that aretransferred from the flight controller to the same folder as the flight data file. Whilethe files are being transferred, the Win9000 End of Flight File Transfer windowopens where the progress of the file transfer can be viewed:Operator’s ManualP/N 9017-205, Rev. C
Mark IIA DGPS with Radiation Sensor (LOS) System Preparation <strong>and</strong> Launch4-93NOTE If the Automatically save data when flight ends check box is cleared,the data are not saved. However, the additional files are transferred to the folderspecified in the Default directory for saving flight data text box on the DataManagement/Notifications tab of the Win9000 System Configuration dialog box for1648-626 Mark IIA DGPS with Radiation Sensor (LOS) MICROSONDES.• Click the Save Flight Data button. The data are saved to the flight data filespecified in the Save Data To text box.• Click the Save Flight Data As button, select a folder, <strong>and</strong> create a file or select anexisting file to save the data.Win9000 Processing <strong>and</strong> Display Software
This page is intentionally left blank.
5-1SECTION 5OVERVIEW OF DATA DISPLAYSDuring a flight any one of a number of available data displays can be open in oneor more separate Flight windows simultaneously in the Flight Window pane foreach radiosonde in flight. There are three types of data displays: Informationdisplays, Tabular displays <strong>and</strong> Graphical displays. All of the Graphical displays areoperator interactive, allowing you to adjust the properties of the display, analyze the data,<strong>and</strong> for some displays, generate significant levels for WMO <strong>and</strong> military message coding.For instructions on how to work with the Graphical displays, see SECTION 6, “Workingwith the Graphical Displays.”NOTE Data that are in units of distance, speed/velocity, pressure, ortemperature, are displayed in the units selected on the Units tab of the Win9000System Configuration dialog box for the W-9000 Meteorological ProcessingSystem selected. The units can be changed during a flight, however, by clicking the ShowSystem Configuration button ( ) on the Flight window toolbar for the flight. Clickingthis button opens the Win9000 System Configuration dialog box <strong>and</strong> allows you to changethe units settings on the Units tab for the current flight only or for an open flight data file.This <strong>section</strong> provides a general overview of the Win9000 data displays <strong>and</strong> how to openthem in the Flight window. In addition, the function of each of the buttons <strong>and</strong> thedrop-down list box on the Flight window toolbar is provided. The Flight window toolbaris located at the top of each Flight window.5.1 Information DisplaysThe Information displays display real-time or saved meteorological data <strong>and</strong> generalinformation on the status of the current flight <strong>and</strong> the coded messages that are processedduring the flight. There are six Information displays:• Current Data• Flight Information• Antenna/Receiver• Loran Status• Coded Messages• Coordinate Plot• GPS Satellite StatusWin9000 Processing <strong>and</strong> Display Software
5-2 SECTION 5 Overview of Data Displays5.1.1 Current Data DisplayA Flight window is shown open to the Current Data display in Figure 5-1. The CurrentData display opens automatically after initializing a radiosonde <strong>and</strong> when opening a savedflight data file. To open a saved flight data file, choose Open from the File menu <strong>and</strong>select the file from the Open Win9000 Flight File dialog box. To open the Current Datadisplay for the current flight or for an open flight data file when a different display is open,click Current Data for the flight in the Flight Window Navigation pane of the Mainwindow.Status Message displayCurrent Unsmoothed Wind Data displayClick Current Data toopen the Current DatadisplayCurrent PTU displayCurrent LocationdisplayCurrent SmoothedWind Data displayTemporal ReferencesdisplayStatus displayGeometric Height vs.Time graphFIGURE 5-1: The Current Data DisplayThe main areas of the Current Data display include the Status Message display; theCurrent PTU (pressure, temperature <strong>and</strong> humidity) display; the Current Location display;the Temporal References display; the Current Unsmoothed Wind Data display; theCurrent Smoothed Wind Data display; the Status display; <strong>and</strong> the Geometric Height vs.Time graph.Status Message display. Displays messages pertaining to the current status of thesystem <strong>and</strong> updates accordingly during the <strong>preflight</strong> <strong>preparations</strong>, during the flight <strong>and</strong> atthe end of the flight.Current PTU display. Displays the pressure, temperature <strong>and</strong> relative humidity in realtime.Current Location display. Displays the current latitude <strong>and</strong> longitude of theradiosonde in degrees, minutes <strong>and</strong> seconds.Operator’s ManualP/N 9017-205, Rev. C
Information Displays 5-3Temporal References display. Displays the UTC time along with elapsed timeinformation pertaining to the <strong>launch</strong> of the radiosonde, including the time since <strong>launch</strong>,the time since data acquisition began, the time since <strong>launch</strong> of the last PTU <strong>and</strong>unsmoothed wind record, <strong>and</strong> the time since <strong>launch</strong> of the last smoothed wind record.NOTE Data acquisition begins immediately after the radiosonde is initialized,<strong>and</strong> the flight <strong>launch</strong> occurs when the <strong>launch</strong> is detected. However, the <strong>launch</strong> ofthe radiosonde, which is when it is actually released, is not detected by Win9000until about 20–30 seconds after it is released. After detecting the <strong>launch</strong>, Win9000 uses theacquired data to determine when the radiosonde was actually released <strong>and</strong> therefore thetime since <strong>launch</strong>.Current Unsmoothed Wind Data display. Displays the unsmoothed wind speed <strong>and</strong>direction data <strong>and</strong> the radiosonde height.Current Smoothed Wind Data display. Displays the smoothed wind speed <strong>and</strong>direction data <strong>and</strong> the radiosonde height. The displayed data are based on a least squaresfit of the data acquired during a Smoothing Length <strong>and</strong> is updated at the end of eachComputation Interval. The Smoothing Length <strong>and</strong> the Computation Interval are entered onthe Data Processing tab of the Win9000 System Configuration dialog box for the W-9000Meteorological Processing System selected. (See SECTION 3, “Win9000 Setup.”)Status display. Displays information about the radiosonde, including its ascent rate,transmit frequency, received signal strength, <strong>and</strong> current transmitted data frame number.Five indicators are also included, which must all be green before releasing a radiosonde:the Surface Data indicator, which indicates whether all the required surface data havebeen entered; the Radiosonde Signal indicator, which indicates whether an adequatesignal is being received from the radiosonde; the Calibration Data indicator, whichindicates whether the W-9000 system is calibrated; the PTU Data indicator, whichindicates whether PTU data are being received; <strong>and</strong> the PVT GPS Winds or DifferentialGPS Winds indicator, which indicates whether GPS lockup has been achieved.Geometric Height vs. Time graph. Displays a profile of the geometric height of theradiosonde versus the time in minutes since <strong>launch</strong>.Win9000 Processing <strong>and</strong> Display Software
5-4 SECTION 5 Overview of Data Displays5.1.2 Flight Information DisplayA Flight window is shown open to the Flight Information display in Figure 5-2. To openthe Flight Information display for the current flight, click Flight Information for the flightin the Flight Window Navigation pane of the Main window. To open the FlightInformation display for a saved flight data file, choose Open from the File menu, selectthe file from the Open Win9000 Flight File dialog box, <strong>and</strong> then click Flight Informationfor the flight in the Flight Window Navigation pane.Click Flight Informationto open the FlightInformation displayFlight InformationdisplayStation LocationInformation displaySurface Data displayFIGURE 5-2: The Flight Information DisplayThe main areas of the Flight Information display include the Flight Information display;the Station Location Information display; the Surface Data display; <strong>and</strong> the CalibrationCoefficients display.Flight Information display. Displays information about the radiosonde <strong>and</strong> the flight,including the radiosonde type <strong>and</strong> serial number; the system name from which the flightwas <strong>launch</strong>ed; the flight ID; the date of the flight; <strong>and</strong> the UTC times at which dataacquisition began, the system was armed, the radiosonde was <strong>launch</strong>ed, <strong>and</strong> the flight wasterminated. The reason for the flight termination <strong>and</strong> the flight duration are also displayedalong with the path <strong>and</strong> file name of the flight data file to which the flight data will besaved.Station Location Information. Displays the station latitude, longitude <strong>and</strong> altitudeinformation entered on the Location Information tab of the Preflight Information dialogbox. On systems that include a DGPS, the entered geoid separation <strong>and</strong> antenna heightinformation is also displayed.Operator’s ManualP/N 9017-205, Rev. C
Information Displays 5-5Surface Data. Displays the pressure, temperature, humidity, wind direction, <strong>and</strong> windspeed information entered in the Required area on the Surface Data tab of the PreflightInformation dialog box.5.1.3 Antenna/Receiver DisplayA Flight window is shown open to the Antenna/Receiver display in Figure 5-3. To openthe Antenna/Receiver display for the current flight, click Antenna/Receiver for the flightin the Flight Window Navigation pane of the Main window. To open the Antenna/Receiver display for a saved flight data file, choose Open from the File menu, select thefile from the Open Win9000 Flight File dialog box, <strong>and</strong> then click Antenna/Receiver forthe flight in the Flight Window Navigation pane.Radiosonde/Azimuth Antenna Configuration displayRadiosonde Frequency/Signal Strength displayClick Antenna/Receiverto open the Antenna/Receiver display.Elevation AngleVersus Flight TimedisplayInstantaneousElevation AngledisplayFIGURE 5-3: The Antenna/Receiver DisplayThe Antenna/Receiver display includes six displays: the Radiosonde/Azimuth AntennaConfiguration display, the Radiosonde Frequency/Signal Strength display, the FrequencyVersus Time display, the Signal Strength Versus Time display, the InstantaneousElevation Angle display, <strong>and</strong> the Elevation Angle Versus Flight Time display.The Radiosonde/Azimuth Antenna Configuration <strong>and</strong> Radiosonde Frequency/SignalStrength displays are always shown. The Frequency Versus Time <strong>and</strong> Signal StrengthVersus Time displays can be viewed together or individually by right-clicking in the lowerhalf of the display <strong>and</strong> making the choice from the pop-up menu. The InstantaneousElevation Angle <strong>and</strong> Elevation Angle Versus Flight Time displays are viewed as a pair bychoosing them from the pop-up menu.Win9000 Processing <strong>and</strong> Display Software
5-6 SECTION 5 Overview of Data DisplaysRadiosonde/Azimuth Antenna Configuration display. Displays the azimuth of theradiosonde <strong>and</strong> the directional orientation of the six elements of the Yagi antenna, each ofwhich are spaced 60 degrees apart in a complete circle. In this display you can switch back<strong>and</strong> forth between the Yagi antenna <strong>and</strong> the omnidirectional antenna, which is used earlyin the flight when the radiosonde is nearly overhead. The Yagi antenna is best used later inthe flight when the radiosonde is farther away. Win9000 automatically selects theomnidirectional antenna at the beginning of the flight <strong>and</strong> then switches to the Yagiantenna at the appropriate time. You can also manually adjust the orientation of the Yagiantenna so that it points in the direction of the radiosonde for the best receive signal, oryou can have Win9000 automatically perform this function.The Positioning button enables ordisables manual orientation of theYagi antenna. The Position buttonorients the antenna in the selecteddirection. The Update buttonupdates the displayed antennadirection.The Dir buttonselects the Yagiantenna. The Omnibutton selects theomnidirectionalantenna.To select the omnidirectional antenna,click the Omni button; to select the Yagiantenna, click the Dir button.The azimuth of the radiosonde isindicated by a balloon icon in a compassrose which is always oriented with northdirectly at the top. The RadiosondeAzimuth display also indicates thedirection of the radiosonde in degrees.The six elements of the Yagi antenna arerepresented by six lines that extendradially outward from the center of thecompass rose <strong>and</strong> are spaced 60 degreesapart. The directional orientation of theYagi antenna is indicated by a singleblue line that extends radially outwardfrom the center of the compass rose. TheAntenna Azimuth display also indicatesthe direction in degrees.Six radial lines indicatethe six elements of theYagi antenna.A single blue line indicates theorientation of the Yagi antenna.A balloon icon indicates theazimuth of the radiosonde asdetermined by the DGPS.transmit signal automatically due to a high level of interference.Normally Win9000 automaticallyorients the Yagi antenna. However, youcan manually orient the antenna.Manual orientation may be required ifthe receiver cannot find the radiosondeTo orient the Yagi antenna manually, first verify that the Yagi antenna is selected <strong>and</strong> thenclick the Positioning button. The center of the compass rose turns from gray to blueindicating that the automatic orientation function is disabled, <strong>and</strong> the current direction ofthe Yagi antenna is now indicated by a red line. Drag the slider at the bottom of the displayin the direction of the desired antenna orientation—to the right to rotate the antennaclockwise, to the left to rotate the antenna counterclockwise. The red line moves with theslider indicating the new direction while the Antenna Azimuth display continuouslydisplays the new direction. The original position of the red line remains displayed,Operator’s ManualP/N 9017-205, Rev. C
Information Displays 5-7indicating that you have not yet actually changed the antenna’s orientation. Position thered line such that it points directly at the balloon icon or in the desired direction, <strong>and</strong> thenclick the Position button. The antenna is oriented in the new direction. To re-enable theautomatic orientation function, click the Positioning button again. The center of thecompass rose turns back to gray. To display the new antenna orientation, click the Updatebutton. The blue line should snap to the new position <strong>and</strong> the Antenna Azimuth displayshould display the new orientation.Radiosonde Frequency/Signal Strength display. Provides two separate displaymodes, Normal <strong>and</strong> Spectrum. In Normal mode you can have Win9000 automaticallysearch for <strong>and</strong> track the radiosonde’s signal, or you can manually tune the 403 Receiver inthe ZEEMET rack to the radiosonde’s transmit frequency. In Spectrum mode Win9000displays the relative signal strength of a b<strong>and</strong> of received frequencies.The Tuner buttonenables or disablesmanual tuning ofthe receiver. TheTune button tunesthe receiver to theselected frequency.The Spec button switches theRadiosonde Frequency/SignalStrength display between theNormal <strong>and</strong> Spectrum modes. TheSearch button switches the searchfunction on or off. The AFC buttonswitches the Automatic FrequencyControl on or off.The Normal mode displays the relativesignal strength <strong>and</strong> the frequency of theradiosonde transmit signal beingreceived by the 403 Receiver. Thesignal strength <strong>and</strong> frequency aredisplayed in a graph as a vertical bluebar. The signal strength is indicated bythe height of the bar; the frequency, bythe position of the bar along thehorizontal axis of the graph. The SignalStrength <strong>and</strong> Receiver Frequencydisplays also indicate the relative signalstrength, from 0 to 255, <strong>and</strong> the precisefrequency in MHz. The frequency of theradiosonde transmit signal should residewithin the 400–406 MHz b<strong>and</strong>, which isindicated by a bar on the horizontal axisof the graph.A bar indicates the frequencyb<strong>and</strong> (400–406 MHz) withinwhich the radiosonde shouldbe transmitting.The height of the bluevertical bar indicates therelative signal strength ofthe signal transmitted bythe radiosonde. Itshorizontal positionindicates the frequency.When you open the Antenna/Receiverdisplay, the Radiosonde Frequency/Signal Strength display is in Normalmode. To display the RadiosondeFrequency/Signal Strength display inNormal mode when it is in Spectrummode, click the Spec button.In Normal mode you can have Win9000automatically search for <strong>and</strong> track theradiosonde’s transmit frequency. Or you can manually tune the receiver to the transmitfrequency of the radiosonde. To enable the automatic search, click the Search button. Tohave Win9000 automatically track the transmit frequency after it is found, click the AFCbutton. The Automatic Frequency Control display indicates when the automatic frequencyWin9000 Processing <strong>and</strong> Display Software
5-8 SECTION 5 Overview of Data Displayscontrol (AFC) function is on. Manual tuning may be required if the receiver cannot findthe radiosonde transmit signal automatically due to a high level of interference.To tune the receiver, first click the Tuner button. The display background turns from grayto light blue indicating that the tune function is enabled. Then drag the slider at the bottomof the display in the direction of the desired receive frequency. A gray bar appears in thedisplay <strong>and</strong> moves with the slider indicating the new frequency while the TuningFrequency display continuously displays the new frequency. The position of the blue bar<strong>and</strong> the frequency displayed by the Receiver Frequency display remain fixed, indicatingthat you have not yet actually changed the receiver frequency. Position the gray bar at theprecise frequency as displayed by the Tuning Frequency display, <strong>and</strong> then click the Tunebutton. The blue bar snaps to where the gray bar is <strong>and</strong> the receiver is tuned to the newfrequency. To disable the tune function, click the Tuner button again. The displaybackground turns back to gray. If the search function is on, Win9000 will continue tosearch for <strong>and</strong> track the radiosonde’s transmit frequency; if the search function is disabled,the receiver locks to the tuned frequency.The Spectrum mode provides a real-time spectrum analysis display of the relative signalstrengths being received by the 403 Receiver. The signal strengths are displayed in a graphover a frequency b<strong>and</strong> of 395–410 MHz in increments of 288 Hz. The relative signalstrength at each frequency increment is indicated by the height of a vertical bar. Theposition of the bar along the horizontal axis indicates its frequency. When the radiosondeis transmitting, its signal should appear within the 400–406 MHz b<strong>and</strong>, which is indicatedby a bar on the horizontal axis of the graph. The radiosonde transmit signal should be thestrongest of all the signals, <strong>and</strong> therefore be indicated by the tallest bar.To display the Radiosonde Frequency/Signal Strength display in Spectrum mode when itis in Normal mode, click the Spec button. The Spectrum display can be used to identifythe transmit frequencies of other sources that might interfere with the radiosonde’stransmitting signal, enabling you to determine the optimum transmit frequency of theradiosonde within the 400–406 MHz b<strong>and</strong>.Instantaneous Elevation Angledisplay. Displays the elevation angle,in degrees, of the radiosonde in realtime, both referenced to the vertical <strong>and</strong>to the horizontal. The Elevation Angledisplay also indicates the elevationangle in degrees from horizontal. Inaddition, The Slant Range, SurfaceRange <strong>and</strong> Altitude displays indicate thestraight path, horizontal <strong>and</strong> verticaldistances, respectively, to theradiosonde. To open the InstantaneousElevation Angle display, right-click inthe lower half of the Antenna/Receiverdisplay <strong>and</strong> choose Elevation Angleversus Flight Time from the pop-up menu.Operator’s ManualP/N 9017-205, Rev. C
Information Displays 5-9Elevation Angle Versus Flight Timedisplay. Displays the elevation angle,in degrees from horizontal, of theradiosonde versus time in minutes.Typically the elevation angle decreaseswith time as the distance of theradiosonde from the <strong>launch</strong> pointincreases. However, the elevation anglemay begin to increase during a flight ifcalm winds allow the radiosonde toascend at a rate that is faster than therate that it is moving horizontally. Toopen the Elevation Angle Versus FlightTime display, right-click in the lowerhalf of the Antenna/Receiver display<strong>and</strong> choose Elevation Angle versus Flight Time from the pop-up menu.Frequency Versus Flight Timedisplay. Displays the frequency of theradiosonde transmitter versus time inseconds for the entire flight. To open theFrequency Versus Flight Time display,right-click in the lower half of theAntenna/Receiver display <strong>and</strong> chooseFrequency versus Flight Time from thepop-up menu.Signal Strength Versus Flight Timedisplay. Displays the signal strength ofthe radiosonde transmitter versus time inseconds for the entire flight. To open theSignal Strength Versus Flight Timedisplay, right-click in the lower half ofthe Antenna/Receiver display <strong>and</strong>choose Signal Strength versus FlightTime from the pop-up menu.Win9000 Processing <strong>and</strong> Display Software
5-10 SECTION 5 Overview of Data DisplaysTo display both the Frequency Versus Flight Time <strong>and</strong> Signal Strength Versus FlightTime displays simultaneously, right-click in the lower half of the Antenna/Receiverdisplay <strong>and</strong> choose Freq./Sig. Strength versus Flight Time from the pop-up menu.To display all the active data sets, choose Draw all data sets from the pop-up menu; toreturn to just the active data set, choose Draw active data set. To save the display to a.bmp file, choose Save to .bmp, create or select folder in which to save it, <strong>and</strong> then name<strong>and</strong> save the file. To print the display, choose Print, select the printer from the Print dialogbox, <strong>and</strong> then click OK.5.1.4 Loran Status Information DisplayA Flight window is shown open to the Loran Status Information display in Figure 5-4.This display is available for W-9000 Meteorological Processing Systems that areconfigured for a Mark II Loran MICROSONDE. To open the Loran Status Informationdisplay for the current flight, click Loran Status Information for the flight in the FlightWindow Navigation pane of the Main window. To open the Loran Status Informationdisplay for a saved flight data file, choose Open from the File menu, select the file fromthe Open Win9000 Flight File dialog box, <strong>and</strong> then click Loran Status Information for theflight in the Flight Window Navigation pane.Radiosonde/Azimuth Antenna Configuration displayRadiosonde Frequency/Signal Strength displayClick Loran StatusInformation to open theLoran StatusInformation display.Tracker 1 StatusDisplayTracker 2 StatusdisplayFIGURE 5-4: The Loran Status Information DisplayOperator’s ManualP/N 9017-205, Rev. C
Information Displays 5-11The Loran Status Information display comprises four displays: the Radiosonde/AzimuthAntenna Configuration display, the Radiosonde Frequency/Signal Strength display, <strong>and</strong>the Loran Tracker 1 <strong>and</strong> Tracker 2 Status displays. The Radiosonde/Azimuth AntennaConfiguration display <strong>and</strong> the Radiosonde Frequency/Signal Strength display are the sameas those described in “Antenna/Receiver Display” on page 5-5.The Loran Tracker 1 <strong>and</strong> Tracker 2 Status displays provide information on the progress ofboth Loran trackers. The Loran trackers first lock up on the Loran signal from the localLoran antenna. Then when the radiosonde is <strong>launch</strong>ed <strong>and</strong> the Loran antenna that isattached to the dereeler on the radiosonde unreels, the trackers switch to tracking theLoran signal from the radiosonde. Only stations with a Tracking State of 8 <strong>and</strong> a TrackingStatus of Radiosonde, as explained below, are used to compute winds.NOTE To view hidden columns in the Loran Tracker 1 or Tracker 2 Statusdisplay, drag the scroll box in the horizontal scroll bar to the right or left in thedirection of the hidden columns, or click the right or left arrow.Station Name. The name given to a particular station in the chain.Latitude. The latitude of the station.Longitude. The longitude of the station.Key. Indicates whether the station is the master station in the chain or, if it is a secondarystation, whether that station is in use or is not in use.Tracking Status. Indicates the source of the Loran signal used to compute winds.There are four possible status indications: Local, where the system uses the Loran signalsfrom the local Loran antenna; Transferring, where the system is switching to tracking theradiosonde by monitoring the signals from radiosonde but is still acquiring signals fromlocal antenna; Committing, where the system is committing to tracking the radiosondesignal but will transfer back to the local antenna if the radiosonde signal weakens; <strong>and</strong>Radiosonde, where the system is committed to tracking the radiosonde signal <strong>and</strong> will nolonger use the local antenna.Tracking State. Indicates whether winds can be computed. A value of 8 indicates thatthe system can compute winds. Any other value indicates that wind data cannot becomputed.Time of Arrival. The time in microseconds in which a Loran station is detected relativeto a reference established by the ZEEMET rack clock.Time Difference. The time of arrival in microseconds of a slave station minus the timeof arrival of the master station.Signal to Noise Ratio. Indicates the relative strength of each Loran station <strong>and</strong> can beused to determine which stations to include or exclude in the wind computations. Therange is 0–99.Win9000 Processing <strong>and</strong> Display Software
5-12 SECTION 5 Overview of Data Displays5.1.5 Coded Messages DisplayA Flight window is shown open to the Coded Messages display in Figure 5-5. To open theCoded Messages display for the current flight, click Coded Messages for the flight in theFlight Window Navigation pane of the Main window. To open the Coded Messagesdisplay for a saved flight data file, choose Open from the File menu, select the file fromthe Open Win9000 Flight File dialog box, <strong>and</strong> then click Coded Messages for the flight inthe Flight Window Navigation pane.Click Coded Messagesto open the CodedMessages display.Message groupscontaining codedmessages are listedwith their folder iconshighlighted.Coded messages canbe displayed for theentire group or for asingle message in thegroup.FIGURE 5-5: The Coded Messages DisplayThe Coded Messages display displays a list of message groups, where each group containsone or more WMO, military—or both—messages. Message groups shown with ahighlighted folder icon contain coded messages. Along with the message groups, thecoded messages can be displayed, either for an entire group or for a single message in thegroup.You must create the message groups before a flight. The groups can be applied to allsubsequent flights, or you can create or edit them for each flight. And for each group youcan have Win9000 automatically generate the coded messages when a specific eventoccurs during a flight, or you can choose when to have Win9000 generate them. You canalso do both. You can also have Win9000 automatically transmit the coded messages onan RS-232 port or modem on the system computer, or you can transmit them manually.For instructions on how to create coded message groups <strong>and</strong> generate <strong>and</strong> view codedmessages, see SECTION 8, “Generating Coded Messages.” The coded messages can alsobe edited, saved, <strong>and</strong> printed.Operator’s ManualP/N 9017-205, Rev. C
Information Displays 5-135.1.6 Coordinate Plot DisplayA Flight window is shown open to the Coordinate Plot display in Figure 5-6. To open theCoordinate Plot display for the current flight, click Coordinate Plot for the flight in theFlight Window Navigation pane of the Main window. To open the Coordinate Plot displayfor a saved flight data file, choose Open from the File menu, select the file from the OpenWin9000 Flight File dialog box, <strong>and</strong> then click Coordinate Plot for the flight in the FlightWindow Navigation pane.Coordinate Plot toolbarClick Coordinate Plot toopen the CoordinatePlot display.Coordinate PlotnavigatorCoordinate Plotreal-time displayCoordinate Plot mapcoordinate displayCoordinate PlotmapFIGURE 5-6: The Coordinate Plot DisplayThe main components of the Coordinate Plot display include the Coordinate Plot map, theCoordinate Plot navigator, the Coordinate Plot real-time display, the Coordinate Plot mapcoordinate display, <strong>and</strong> the Coordinate Plot toolbar.Coordinate Plot map. Displays a track plot of the radiosonde in degrees, minutes <strong>and</strong>seconds of latitude <strong>and</strong> longitude against a geographic map overlay. If the overlay is notvisible, see “Working with the Coordinate Plot Display” on page 5-22 for instructions onhow to display it. The position of the radiosonde is marked with a balloon icon, <strong>and</strong> the<strong>launch</strong> point is marked with a red flag.Coordinate Plot navigator. Displays ageographic map of the world with a view box Click <strong>and</strong> dragthe view box torepresenting the boundaries of the Coordinatepan the worldPlot map. To pan the world map, click in the map.view box <strong>and</strong> drag it anywhere on the map. TheCoordinate Plot map displays the area of the new location of the view box. To return theWin9000 Processing <strong>and</strong> Display Software
5-14 SECTION 5 Overview of Data DisplaysCoordinate Plot map to the location of the radiosonde track, click the Auto Size button onthe Coordinate Plot toolbar.Coordinate Plot real-time display. Displays the current height of the radiosonde <strong>and</strong>its latitude <strong>and</strong> longitude in degrees, minutes <strong>and</strong> seconds.Coordinate Plot map coordinate display. Displays the latitude <strong>and</strong> longitude of theradiosonde in degrees, minutes <strong>and</strong> seconds corresponding to the coordinate of theCoordinate Plot map at which the mouse pointer is pointing. The display changesaccordingly as the position of the mouse pointer changes while the mouse pointer is in theCoordinate Plot map.Coordinate Plot toolbar. Provides buttons which activate the most often used functionsprovided in the Coordinate Plot display. The Coordinate Plot toolbar is shown inFigure 5-7. Placing your mouse pointer over a button for a few seconds opens a cue carddescribing that function.Opens the RadiosondeCoordinates Propertiesdialog box.Automatically scalesthe vertical <strong>and</strong>horizontal axis of theCoordinate Plot map tofit the track plot of theradiosonde.Centers the radiosonde<strong>launch</strong> point on theCoordinate Plot map.FIGURE 5-7: The Coordinate Plot ToolbarNOTE For instructions on how to work with the Coordinate Plot map,including how to zoom in <strong>and</strong> out, pan, automatically size, <strong>and</strong> set up thedisplay properties, see “Setting up the Coordinate Plot Display Properties” onpage 5-23.Operator’s ManualP/N 9017-205, Rev. C
Information Displays 5-155.1.7 GPS Satellite Status DisplayA Flight window is shown open to the GPS Satellite Status display in Figure 5-8. To openthe GPS Satellite Status display for the current flight, click GPS Satellite Status for theflight in the Flight Window Navigation pane of the Main window. To open the GPSSatellite Status display for a saved flight data file, choose Open from the File menu, selectthe file from the Open Win9000 Flight File dialog box, <strong>and</strong> then click GPS Satellite Statusfor the flight in the Flight Window Navigation pane.Click GPS SatelliteStatus to open theGPS Satellite Statusdisplay.Differential GPS Status displaySatellite icons indicatewhether satellite isbeing received by theradiosonde, the localGPS receiver, or both.Satellite identificationnumber is displayedblack when satellite isbeing received by theradiosonde, the localGPS receiver, or both.Bar graph indicatorindicates averagesatellite signalstrength.Instantaneoussatellite signalstrength indicator <strong>and</strong>average signalstrength in percentdisplay.FIGURE 5-8: The GPS Satellite Status DisplayNOTE For a W-9000 Meteorological Processing System that is configured fora Mark II PVT or a Mark II Loran MICROSONDE, the GPS Satellite Statusdisplay is not available.The GPS Satellite Status display displays which of the 32 available satellites are beingreceived by the radiosonde <strong>and</strong> local GPS receivers. If a satellite is being received by theradiosonde or the local GPS ground station receiver, or both, the correspondingidentification number (PRN) is displayed black <strong>and</strong> the radiosonde (Sonde) <strong>and</strong> local GPSground station (Gnd) receiver satellite icons indicate red, green or yellow as follows:the satellite.The Sonde icon is red <strong>and</strong> the Gnd icon is green when the radiosonde GPSreceiver is not receiving the satellite <strong>and</strong> the local GPS receiver is receivingWin9000 Processing <strong>and</strong> Display Software
5-16 SECTION 5 Overview of Data Displaysthe satellite.The Sonde icon is green <strong>and</strong> the Gnd icon is red when the radiosonde GPSreceiver is receiving the satellite <strong>and</strong> the local GPS receiver is not receivingBoth the Sonde <strong>and</strong> GPS receiver icons are green when both the radiosonde<strong>and</strong> local GPS receivers are receiving the satellite.When both icons are green, a bar graphis displayed to the right of the icons. Itslength is proportional to the averagestrength of the signal being received bythe radiosonde GPS receiver, frommoderate to maximum. Similarly, agreen indicator is shown which indicatesthe instantaneous signal strength, frommoderate to maximum, correspondingto its horizontal position. A display isBar graph length is proportionalto the average signal strength.Display shows the average signalstrength in percent.Green indicator’shorizontal position isproportional to theinstantaneous signalstrength.also shown that indicates the average signal strength in percent <strong>and</strong> corresponds to thelength of the bar graph.Both the Sonde <strong>and</strong> GPS receiver icons are yellow when the radiosonde <strong>and</strong>local GPS receivers are receiving the satellite but Win9000 is not able to usethe GPS data in the altitude, wind speed <strong>and</strong> wind direction calculations.Operator’s ManualP/N 9017-205, Rev. C
Tabular Displays 5-175.2 Tabular DisplaysThe Tabular displays list real-time or saved meteorological data in tabular format. Thereare three Tabular displays:• Tabular PTU Data• Tabular Smoothed Wind Data• Tabular Unsmoothed Wind/GPS Data5.2.1 Automatic <strong>and</strong> Manual ScrollingThe Tabular displays each include an auto-scroll feature that automatically scrolls eachrow of data as the data are acquired. The displays also include scroll bars that let youmanually scroll through the rows <strong>and</strong> display hidden columns. And each column includesa heading that displays a title for the data <strong>and</strong> the units that the data are listed in.Auto-scroll. When you first open a Tabular display, auto-scroll is enabled. You c<strong>and</strong>isable <strong>and</strong> enable auto-scroll at any time. With auto-scroll enabled, the most recentlyacquired row of data is always displayed at the bottom of the Flight window, <strong>and</strong>previously acquired rows continuously scroll off the top of the window <strong>and</strong> out of display.Disabling auto-scroll stops the scrolling process <strong>and</strong> the rows remain fixed. To disableauto-scroll, single-click any row. To enable auto-scroll, double-click any row orsingle-click the last row.Scroll bars. Vertical <strong>and</strong> horizontal scroll bars are provided for viewing hidden rows<strong>and</strong> columns. To view rows that are hidden, click the up or down arrow in the verticalscroll bar to scroll through the rows one at a time. Or drag the scroll box up or down toquickly scroll through the rows. To view hidden columns, drag the scroll box in thehorizontal scroll bar to the right or left in the direction of the hidden columns, or click theright or left arrow. The vertical scroll bar is not available until the first row of data scrollsout of view. To widen a column, click <strong>and</strong> drag the column separator to the right. Tonarrow a column, click <strong>and</strong> drag the column separator to the left. You can also viewadditional columns by clicking the maximize button in the Flight window.5.2.2 Tabular PTU Data DisplayA Flight window is shown open to the Tabular PTU Data display in Figure 5-9. To openthe Tabular PTU Data display for the current flight, click Tabular PTU Data for the flightin the Flight Window Navigation pane of the Main window. To open the Tabular PTUData display for a saved flight data file, choose Open from the File menu, select the filefrom the Open Win9000 Flight File dialog box, <strong>and</strong> then click Tabular PTU Data for theflight in the Flight Window Navigation pane.Win9000 Processing <strong>and</strong> Display Software
5-18 SECTION 5 Overview of Data DisplaysThe Tabular PTU Data display lists the pressure, temperature, relative humidity, dewpoint, refractivity index (N), modified refractivity index (M), <strong>and</strong> geopotential height dataalong with the elapsed time since the start of data acquisition at which the data weremeasured. A new row of data is added to the list every second until the flight isterminated. The same pressure, temperature <strong>and</strong> relative humidity data are displayed in theCurrent PTU display in the Current Data display.To widen a column,click <strong>and</strong> drag thecolumn separator tothe right; click <strong>and</strong>drag to the left tonarrow the column.Click Tabular PTUData to open theTabular PTU Datadisplay.Drag the vertical scroll box up or down to quickly scroll through the rows,or click the up or down arrow to scroll through one row at a time.Drag the horizontalscroll box to theright or left todisplay hiddencolumns, or click theleft or right arrow.FIGURE 5-9: The Tabular PTU Data Display5.2.3 Tabular Smoothed Wind Data DisplayA Flight window is shown open to the Tabular Smoothed Wind Data display inFigure 5-10. To open the Tabular Smoothed Wind Data display for the current flight, clickTabular Smoothed Wind Data for the flight in the Flight Window Navigation pane of theMain window. To open the Tabular Smoothed Wind Data display for a saved flight datafile, choose Open from the File menu, select the file from the Open Win9000 Flight Filedialog box, <strong>and</strong> then click Tabular Smoothed Wind Data for the flight in the FlightWindow Navigation pane.The Tabular Smoothed Wind Data display lists the geometric height, smoothed windspeed <strong>and</strong> direction, radiosonde azimuth, <strong>and</strong> radiosonde range data along with the elapsedtime since <strong>launch</strong> at which the data were recorded. The smoothed wind speed <strong>and</strong>direction <strong>and</strong> geometric height data, which are also displayed in the Current SmoothedWind Data display in the Current Data display, are based on a least squares fit of the dataacquired during a Smoothing Length. The radiosonde azimuth <strong>and</strong> range data are derivedfrom the smoothed wind data. A new row of data is added to the list at the end of eachOperator’s ManualP/N 9017-205, Rev. C
Tabular Displays 5-19Computation Interval until the flight is terminated. The Smoothing Length <strong>and</strong> theComputation Interval are entered on the Data Processing tab of the Win9000 SystemConfiguration dialog box for the W-9000 Meteorological Processing System selected.(See SECTION 3, “Win9000 Setup.”)Click TabularSmoothed Wind Datato open the TabularSmoothed Wind Datadisplay.FIGURE 5-10: The Tabular Smoothed Wind Data Display5.2.4 Tabular Unsmoothed Wind/GPS Data DisplayA Flight window is shown open to the Tabular Unsmoothed Wind/GPS Data display inFigure 5-11. To open the Tabular Unsmoothed Wind/GPS Data display for the currentflight, click Tabular Unsmoothed Wind/GPS Data for the flight in the Flight WindowNavigation pane of the Main window. To open the Tabular Unsmoothed Wind/GPS Datadisplay for a saved flight data file, choose Open from the File menu, select the file fromthe Open Win9000 Flight File dialog box, <strong>and</strong> then click Tabular Unsmoothed Wind/GPSData for the flight in the Flight Window Navigation pane.For a Mark II GPS or a Mark IIA GPS MICROSONDE, the Tabular Unsmoothed Wind/GPS Data display lists the unsmoothed wind speed <strong>and</strong> direction, N/S <strong>and</strong> E/W windvelocity components, latitude, longitude, altitude, geometric height, elevation angle, slantrange, <strong>and</strong> surface range along with the UTC time <strong>and</strong> the elapsed time since the start ofdata acquisition at which the data were measured.Win9000 Processing <strong>and</strong> Display Software
5-20 SECTION 5 Overview of Data DisplaysTo widen a column,click <strong>and</strong> drag thecolumn separator tothe right; click <strong>and</strong>drag to the left tonarrow the column.Drag the vertical scroll box up or down to quickly scroll through the rows,or click the up or down arrow to scroll through one row at a time.Click TabularUnsmoothed Wind/GPSData to open theTabular UnsmoothedWind/GPS Datadisplay.Drag the horizontalscroll box to theright or left todisplay hiddencolumns, or click theleft or right arrow.FIGURE 5-11: The Tabular Unsmoothed Wind/GPS Data DisplayFor a Mark II PVT MICROSONDE, the Tabular Unsmoothed Wind/GPS Data displaylists the altitude, unsmoothed wind speed <strong>and</strong> direction, latitude, longitude, <strong>and</strong> theavailable satellites <strong>and</strong> their PRNs along with the elapsed time since the start of dataacquisition at which the data were measured.A new row of data is added to the list every second until the flight is terminated. The sameunsmoothed wind speed <strong>and</strong> direction <strong>and</strong> radiosonde height data are displayed in theCurrent Unsmoothed Wind Data display in the Current Data display.Operator’s ManualP/N 9017-205, Rev. C
Graphical Displays 5-215.3 Graphical DisplaysThe Graphical displays display real-time or saved meteorological data in graphical format.A Graphical display uses the Win9000 Graph Generator to display any type of data versusanother in a single graph. However, a Graph Generator display for each Graphical displaymust first be added to the list of data displays on the Data Displays tab of the Win9000System Configuration dialog box for the selected W-9000 Meteorological ProcessingSystem as described in “Adding <strong>and</strong> Removing Displays <strong>and</strong> Display Groups” on page 3-75. Once the Graph Generator displays are added to the list, they can be renamed asdescribed in “Renaming Displays <strong>and</strong> Display Groups” on page 3-77. The names becomethe corresponding names for the Graphical displays that are shown listed in the FlightWindow Navigation pane. For more information about the Graphical displays <strong>and</strong> how towork with them, see SECTION 6, “Working with the Graphical Displays.”A Graphical display is shown in a Flight window in Figure 5-12. The Graph Generator forthe display was previously added to the group named PTU in the display list on the DataDisplays tab of the Win9000 System Configuration dialog box for the selected W-9000Meteorological Processing System, <strong>and</strong> then renamed Graphical PTU. It was set up todisplay profiles of pressure, temperature, <strong>and</strong> relative humidity versus flight time. To opena Graphical display for the current flight, click its data display icon or its name for theflight in the Flight Window Navigation pane of the Main window. To open a Graphicaldisplay for a saved flight data file, choose Open from the File menu, select the file fromthe Open Win9000 Flight File dialog box, <strong>and</strong> then click the Graphical display’s icon orits name for the flight in the Flight Window Navigation pane. Similar to that for a currentflight, the Graph Generator for the Graphical display must have been added eitherbefore the actual flight or before opening the flight data file.Click the data displayicon or its name toopen the Graphicsdisplay for it. TheGraph Generator forthe display must havebeen added to the listof data displays for theselected system.FIGURE 5-12: Graphical Display with Pressure, Temperature <strong>and</strong> RelativeHumidity ProfilesWin9000 Processing <strong>and</strong> Display Software
5-22 SECTION 5 Overview of Data Displays5.4 Working with the Coordinate Plot DisplayThe Coordinate Plot display allows you to perform the following functions:• Zoom in <strong>and</strong> out• Pan• Automatically size• Set up the display properties5.4.1 Zooming in <strong>and</strong> Out of the Coordinate Plot MapYou can zoom in <strong>and</strong> out of the Coordinate Plot display <strong>and</strong> return it to its normal size atany time.To zoom in <strong>and</strong> out of the Coordinate Plot display:1. In the Coordinate Plot display, click <strong>and</strong> drag your mouse pointer to draw a squarebox around the area of the display you want to zoom in on. The area will appear as adotted rectangle.2. Release the mouse button.The Coordinate Plot display displays the zoomed in area, <strong>and</strong> the position <strong>and</strong>boundaries of the view box in the Coordinate Plot navigator change to represent thezoomed in area.3. If desired, repeat Steps 1 <strong>and</strong> 2 to zoom in further.4. To zoom out of the Coordinate Plot display, right-click anywhere inside theCoordinate Plot display, choose Zoom Out from the pop-up menu, <strong>and</strong> then choose azoom factor: x2, x4, x8, x16, or Maximum. The Coordinate Plot display zooms out bythe factor selected, or the maximum, which is determined by the setting in theWin9000 Plot Coordinate Configuration dialog box as described in “Setting up theCoordinate Plot Display Properties” on page 5-23.5.4.2 Panning the Coordinate Plot DisplayYou can pan the Coordinate Plot display by dragging <strong>and</strong> dropping the view box in theCoordinate Plot navigator or by pointing <strong>and</strong> clicking in the display.To pan the Coordinate Plot display by dragging <strong>and</strong> dropping the view box:1. Click inside the view box in the Coordinate Plot navigator <strong>and</strong> drag the box to thearea on the world display you want to view.A copy of the view box, colored black, remains in the original position as long as themouse button is held down.Operator’s ManualP/N 9017-205, Rev. C
Working with the Coordinate Plot Display 5-232. Release the mouse button.The Coordinate Plot display displays the new area, the view box remains fixed in itsnew position in the Coordinate Plot navigator, <strong>and</strong> the black view box disappears.3. If desired, repeat Steps 1 <strong>and</strong> 2 to pan to another area of the display.To pan the Coordinate Plot display by pointing <strong>and</strong> clicking in the display, first determinethe approximate center of the area you want to pan to, <strong>and</strong> then click it. The point at whichyou click becomes the new center of the display.NOTE If when panning the Coordinate Plot display, you lose the track plot ofthe radiosonde, click the Auto Size or Station button.5.4.3 Automatically Sizing the Coordinate Plot DisplayYou can automatically size the Coordinate Plot display to fit the track plot of theradiosonde.To automatically size the Coordinate Plot display, click the Auto Size button. Orright-click anywhere inside the Coordinate Plot display <strong>and</strong> choose AutoScale from thepop-up menu. The display is automatically scaled to fit the entire track plot of theradiosonde.NOTE To center the <strong>launch</strong> point on the Coordinate Plot display, click theStation button.5.4.4 Setting up the Coordinate Plot Display PropertiesThe Coordinate Plot display properties are set up in the Win9000 Plot CoordinateConfiguration dialog box shown in Figure 5-13. To open the Win9000 Plot CoordinateConfiguration dialog box, click the Properties button in the Coordinate Plot display, orright-click anywhere inside the display <strong>and</strong> choose Properties from the pop-up menu.After changing the settings in the Win9000 Plot Coordinate Configuration dialog box,click OK to save the settings <strong>and</strong> exit the dialog box, or click Cancel to exit the dialog boxwithout saving any of the changed settings.To set up the Coordinate Plot display properties:1. Enter the name of the display in the text box in the Display Name area of theWin9000 Plot Coordinate Configuration dialog box.Win9000 Processing <strong>and</strong> Display Software
5-24 SECTION 5 Overview of Data DisplaysFIGURE 5-13: The Radiosonde Coordinates Properties Dialog Box2. If you want to change the center location of the Coordinate Plot display, enter thelatitude in degrees, minutes <strong>and</strong> seconds of the center location in the Center Latitudetext boxes in the Location area, <strong>and</strong> select the hemisphere from the correspondingdrop-down list box. Enter the longitude in the Center Longitude text boxes, <strong>and</strong> thehemisphere from the corresponding drop-down list box.3. If you want to change the vertical <strong>and</strong> horizontal scale of the Coordinate Plot display,enter the distance in meters in the Range text box.4. If you want to display a geographic map overlay on the Coordinate Plot display, clickthe Browse button in the Geographic Information Files area <strong>and</strong> select the foldercontaining the geographic information files. The default path <strong>and</strong> folder is C:ProgramFiles\Sippican\Win9000\geo.5. If you want to display the track plot of the radiosonde, select the Draw line betweenLat/Long points check box in the Radiosonde Flight Information Attributes area.Then click the Color button <strong>and</strong> choose a color for the track plot. Clear the check boxto hide the track plot.Operator’s ManualP/N 9017-205, Rev. C
Flight Window Toolbar 5-255.5 Flight Window ToolbarAt the top of every Flight window is the Flight Window toolbar which includes buttons<strong>and</strong> a drop-down list box that you can click to quickly access dialog boxes, open data sets<strong>and</strong> perform many of the functions available in a Flight window. The Flight Windowtoolbar is shown in Figure 5-14. Placing your mouse pointer over a button for a fewseconds opens a cue card that displays the name of the button. The function of each of thebuttons <strong>and</strong> the drop-down list box is described below <strong>and</strong> throughout this manual.ArmEnd FlightPreflight InformationClose Data SetActive Data Set Drop-Down List BoxSave Flight Data AsShow Each Display in Its Own WindowExport Flight Data to Text FilesSave Flight DataAdd a Data SetShow System ConfigurationManual LaunchFIGURE 5-14: The Flight Window ToolbarArm. For a new flight, click this button to arm the system for <strong>launch</strong>. The button isavailable only when the system is ready to be armed for <strong>launch</strong>.Manual Launch. For a new flight, click this button to initiate a <strong>launch</strong> manually withouthaving to wait for the <strong>launch</strong> to be detected automatically. The button is available onlyafter the system has been armed for <strong>launch</strong>.End Flight. Click this button to end a flight manually. The button is available only afterthe system has been armed for <strong>launch</strong>.Show System Configuration. Click this button to open the Win9000 SystemConfiguration dialog box for the system.Win9000 Processing <strong>and</strong> Display Software
5-26 SECTION 5 Overview of Data DisplaysPreflight Information. Click this button to open the Preflight Information dialog boxfor the system. The button is available only prior to arming the system for <strong>launch</strong>.Add a Data Set. Click this button to add a data set. (See “Displaying Data from MultipleFlight Data Files by Adding Data Sets” on page 6-20.)Close Data Set. Click this button to select <strong>and</strong> remove a data set that has been added.(See “Displaying Data from Multiple Flight Data Files by Adding Data Sets” on page 6-20.)Save Flight Data. Click this button to save the data up to the current point in the flightor at the end of a flight. If a file for the data has not yet been created, you will have toselect a folder <strong>and</strong> create a file to save the data.Save Flight Data As. Click this button to select a folder <strong>and</strong> create or select an existingfile to save the data up to the current point in the flight or at the end of a flight.Export Flight Data to Text Files. Click this button to open the Win9000 ExportOptions dialog box <strong>and</strong> convert the data in a flight data file into one or moretext-formatted export data files compatible with external application software such asword processors <strong>and</strong> spreadsheets. (See SECTION 7, “Exporting Flight Data to TextFiles.”)Show Each Display in Its Own Window. Click this button to view each data displayin a separate Flight window; click it again to view only one data display at a time in asingle flight window.Active Data Set Drop-Down List Box. Allows you to display a list of added data sets<strong>and</strong> to select which data set is the active data set. (See “Displaying Data from MultipleFlight Data Files by Adding Data Sets” on page 6-20.)Operator’s ManualP/N 9017-205, Rev. C
SECTION 66-1WORKING WITH THE GRAPHICAL DISPLAYSAll of the Graphical displays provided by Win9000 are operator interactive,allowing you, for example, to zoom in <strong>and</strong> out of a graph, manually <strong>and</strong>automatically scale the axis of a graph, change the color of the profiles on thegraph, automatically <strong>and</strong> manually insert significant levels, display <strong>and</strong> hide tolerancebars, <strong>and</strong> a number of other functions. The operator interactive functions can be performedfor the current flight or for a saved flight data file. For instructions on how to open a savedflight data file <strong>and</strong> for general information about the Graphical displays, see “GraphicalDisplays” on page 5-21.The Graphical displays use the Win9000 Graph Generator to display the data. The GraphGenerator is a user configurable data display which has numerous useful features,including the following:Dynamic display configuration. Allows reconfiguring of the graph setup at any timeto change the displayed data type or the graph characteristics. Most data types can bedisplayed verses any other on the same graph.Scaling a graph. Provides automatic <strong>and</strong> manual scaling capabilities that can beperformed at any time.Zooming in on a graph. Provides graph zooming capabilities that can be performed atany time.Marking data as bad or good. Provides the ability to mark data as bad or good. Datamarked as bad, including the significant levels, will not be displayed.Generating significant levels. Generates significant levels <strong>and</strong> allows displaying <strong>and</strong>editing of the significant levels which are used in the generation of coded messages.Displaying tolerance bars. Allows display <strong>and</strong> hiding of tolerance bars.Displaying data from multiple flight data files. Data from multiple flight data files,in addition to the current flight, can be displayed simultaneously or one at a time in thesame graph.Displaying difference profiles. Displays the difference between profiles of the samedata type from two different flight data files in the same graph.Printing a graph. Prints a graph.Saving a graph to a bitmap file. Saves a graph to a bitmap file.Win9000 Processing <strong>and</strong> Display Software
6-2 SECTION 6 Working with the Graphical Displays6.1 Configuring a Graphical DisplayA Graphical display is configured using the Win9000 Graph Generator. Each Graphicaldisplay requires that a corresponding Graph Generator display be included in the list ofdata displays on the Data Displays tab of the Win9000 System Configuration dialog boxfor the selected W-9000 Meteorological Processing System. For instructions on how toadd a Graph Generator display, see “Adding <strong>and</strong> Removing Displays <strong>and</strong> Display Groups”on page 3-75 <strong>and</strong> select Graph Generator from the available displays. Win9000 creates aname composed of "Graph Generator" followed by a sequence number, <strong>and</strong> this name canbe changed. For instructions on how to rename the Graphical displays, see “RenamingDisplays <strong>and</strong> Display Groups” on page 3-77. Any number of Graph Generator displayscan be added, <strong>and</strong> their names become the corresponding names for the Graphical displaysthat are shown listed in the Flight Window Navigation pane.The Graph Generator for a Graphical display is configured from the Graph GeneratorConfiguration dialog box. It can be configured for a selected W-9000 MeteorologicalProcessing System, or it can be configured during a flight or after opening a flight datafile. The Graph Generator Configuration dialog box is shown in Figure 6-1.FIGURE 6-1: The Graph Generator Configuration Dialog Box DisplayOptions TabTo open the Graph Generator Configuration dialog box for a Graphical display during aflight or after opening a flight data file, click the data display icon or its name for theGraphical display to be configured in the Flight Window Navigation pane, right-clickanywhere in the graph, <strong>and</strong> then choose Properties from the pop-up menu.Operator’s ManualP/N 9017-205, Rev. C
Configuring a Graphical Display 6-3To open the Graph Generator Configuration dialog box for a Graphical display for asystem, choose System Configuration from the Files menu, select the system from the listin the Win9000 Configuration dialog box, click Properties, <strong>and</strong> then click the DataDisplays tab. On the Data Displays tab, select the Graphical display to be configured, <strong>and</strong>then click Display Properties.To open a tab, click the tab. After changing the settings in any one or more tabs, click OKto save the settings <strong>and</strong> close the Graph Generator Configuration dialog box, or clickCancel to close the dialog box without saving any of the changed settings.6.1.1 Entering the Display Options SettingsThe display options settings are entered on the Display Options tab of the GraphGenerator Configuration dialog box. The Graph Generator Configuration dialog box isshown open to the Display Options tab in Figure 6-1 on page 6-2.The Display Options tab contains the parameters described below. The results of thesettings of some of these options are shown in the Graphical display in Figure 6-2. Foreach parameter select or enter the required settings as instructed.Display Name. Identifies the Graphical display. This name is the name shown in theFlight Window Navigation pane of the Main window for the flight or the flight data file.The name is also shown at the top of the graph. Enter a name of any length.Gutter Color. The color of the area outside the perimeter of the graph. Click the colorbutton <strong>and</strong> choose a color for the gutter.Graph Background Color. The color of the graph background over which the dataprofiles are displayed. Click the color button <strong>and</strong> choose a color for the gutter.Scale Lines Color. The color of the vertical <strong>and</strong> horizontal scale lines on the graph.Click the color button <strong>and</strong> choose a color for the scale lines.Display Profiles for the Active Data Set only. Select this option to displays profilesfor the active data set only. (See “Displaying Data from Multiple Flight Data Files byAdding Data Sets” on page 6-20 for information on active <strong>and</strong> base data sets.)Display Profiles for All data sets. Select this option to display profiles for all datasets, including the base data set. (See “Displaying Data from Multiple Flight Data Files byAdding Data Sets” on page 6-20 for information on active <strong>and</strong> base data sets.)Display Difference Profiles. Select this option to display profiles that show thedifference between data from the active data set <strong>and</strong> data from the base data set at thesame UTC time. (See “Displaying Data from Multiple Flight Data Files by Adding DataSets” on page 6-20 for information on active <strong>and</strong> base data sets, <strong>and</strong> “DisplayingDifference Profiles” on page 6-21 for instructions on how to display difference profiles ina graph.)Win9000 Processing <strong>and</strong> Display Software
6-4 SECTION 6 Working with the Graphical DisplaysDisplay nameVertical <strong>and</strong> horizontal scale linesGraph backgroundGutterFIGURE 6-2: Graphical Display with Selected Display Options Settings fromthe Display Options Tab of the Graph Generator Configuration Dialog Box6.1.2 Adding <strong>and</strong> Removing Profiles <strong>and</strong> Entering Their SettingsA profile is a plot of one data type versus another, where one data type is selected for thevertical axis of a graph <strong>and</strong> the other for the horizontal axis. Profiles are added <strong>and</strong>removed, <strong>and</strong> their settings entered on the Profiles tab of the Graph GeneratorConfiguration dialog box. The Graph Generator Configuration dialog box is shown opento the Profiles tab in Figure 6-3. Any data type can be selected for either axis in the graph,<strong>and</strong> any number of added profiles can be displayed. The Profile tab displays a list ofprofiles that have been added. Profiles can be added to or removed from the list at anytime. Win9000 provides a default list containing a single profile of Pressure versus FlightTime when a W-9000 Meteorological System is added in Win9000.To add a profile, click Add Profile, <strong>and</strong> then select the data type from the Data drop-downlist box in the Horizontal Axis <strong>and</strong> Vertical Axis areas of the Profiles tab. InitiallyWin9000 selects Pressure for the horizontal axis <strong>and</strong> Flight Time for the vertical axis. Toremove a profile, select the profile from the list, <strong>and</strong> then click Remove Profile.The Profiles tab contains the parameters described below. The parameters apply only tothe selected profile in the profile list under Profiles. If no profile is shown selected in thelist, the selected profile is the one that was most recently selected <strong>and</strong> is shown in theName text box in the Profile Name/Color area of the Profiles tab. To select a differentprofile, click its name in the profiles list under Profiles. For each parameter select or enterthe required settings as instructed. Always select the profile before entering or changingone or more of the settings for it.Operator’s ManualP/N 9017-205, Rev. C
Configuring a Graphical Display 6-5FIGURE 6-3: The Graph Generator Configuration Dialog Box Profiles TabThe following parameters are located in the Profile Name/Color area of the Profiles tab:Name. Identifies the selected profile. The name shown is the name of the selected profilein the profile list under Profiles. The name of the selected profile is also displayed abovethe list. Enter a name of any length.Color. The color of the profile for the data set shown in the drop-down list box. If morethan one data set has been added, it can be selected from the drop-down list box. Thisentry allows a different color for the profile to be selected for each data set. The colorbutton displays the currently selected color for the profile <strong>and</strong> data set. To select adifferent data set for the profile, first select the profile, <strong>and</strong> then select the data set from thedrop-down list box. Click the color button <strong>and</strong> choose a color for the profile.Style. The style of the line or points that are used for the profile for the data set shown inthe left drop-down list box. If more than one data set has been added, it can be selectedfrom the left drop-down list box. This entry allows a different line or point style for theprofile to be selected for each data set. The drop-down list box to the right displays thecurrently selected line or point style for the profile <strong>and</strong> data set. To select a different dataset for the profile, first select the profile, <strong>and</strong> then select the data set from the leftdrop-down list box. Select the line or point style from the right drop-down list box.The following parameters are located in the Options area of the Profiles tab:Display Profile. Clear this check box to hide the profile. The profile remains in theprofile list, however, even when hidden.Win9000 Processing <strong>and</strong> Display Software
6-6 SECTION 6 Working with the Graphical DisplaysAutomatically scale axis during flight. Select this check box to continuously <strong>and</strong>automatically scale the profile during the entire flight such that all the data are alwaysvisible on the graph.Vertical axis scaling references <strong>launch</strong> record. Select this check box to adjust thetick marks on the vertical axis of the graph for the profile such that they are relative to thevalue of the data at the <strong>launch</strong> point, where the data value at the <strong>launch</strong> point is zero. Datadisplayed that are less than the data value at the <strong>launch</strong> point are displayed as negativevalues; data displayed that are greater are displayed as positive values. For example, selectthis check box when displaying flight time to display negative flight times before a <strong>launch</strong><strong>and</strong> positive flight times after a <strong>launch</strong>.Horizontal axis scaling references <strong>launch</strong> record. Select this check box to adjustthe tick marks on the horizontal axis of the graph for the profile such that they are relativeto the value of the data at the <strong>launch</strong> point, where the data value at the <strong>launch</strong> point is zero.Data displayed that are less than the data value at the <strong>launch</strong> point are displayed asnegative values; data displayed that are greater are displayed as positive values.Display data prior to <strong>launch</strong>. Clear this check box to hide the data for the profile priorto <strong>launch</strong>.Display data after flight termination. Clear this check box to hide the data for theprofile after <strong>launch</strong> termination.Display Significant Levels. Select this check box to display the significant levels forthe profile.NOTE At least one profile must have the Display Significant Levels check boxselected to display any of the significant levels.Display Tolerance Bars. Select this check box to display tolerance bars for thesignificant levels for the profile. This option is available only if the Display SignificantLevels option is selected.The following parameters are located in the Horizontal Axis area of the Profiles tab:Data. Selects the data type for the horizontal axis of the graph for the profile. Select thedata type from the drop-down list box.Position. Specifies where on the graph the horizontal axis is located for the profile. Thehorizontal axis can display up to two data types overlapping the whole width of the top ofthe graph (Top 1- Center <strong>and</strong> Top 2 - Center); the whole width of the bottom of the graph(Bottom 1 - Center <strong>and</strong> Bottom 2 - Center); the left <strong>and</strong> right halves of the top (Top 1 -Left, Top 2 - Left, Top 1 - Right, <strong>and</strong> Top 2 - Right); <strong>and</strong> the left <strong>and</strong> right halves of thebottom (Bottom 1 - Left, Bottom 2 - Left, Bottom 1 - Right, <strong>and</strong> Bottom 2 - Right). Thehorizontal axis can also be hidden. Select the position from the drop-down list box.Operator’s ManualP/N 9017-205, Rev. C
Configuring a Graphical Display 6-7Minimum. Specifies the minimum value of the data type to be displayed on thehorizontal axis of the graph. Enter the minimum value in the units shown or keep thedefault values.Maximum. Specifies the maximum value of the data type to be displayed on thehorizontal axis of the graph. Enter the maximum value in the units shown or keep thedefault values.Display Scale Lines. Select this check box to display the scale lines for the profile.Typically select this check box for only one profile, otherwise the graphs will becomecrowded with scale lines for all the displayed profiles.The following parameters are located in the Vertical Axis area of the Profiles tab:Data. Selects the data type for the vertical axis of the graph for the profile. Select the datatype from the drop-down list box.Position. Specifies where on the graph the vertical axis is located for the profile. Thevertical axis can be located to the left or right, or it can be hidden. Select the position fromthe drop-down list box.Minimum. Specifies the minimum value of the data type to be displayed on the verticalaxis of the graph. Enter the minimum value in the units shown.Maximum. Specifies the maximum value of the data type to be displayed on the verticalaxis of the graph. Enter the maximum value in the units shown.Display Scale Lines. Select this check box to display the scale lines for the profile.Typically select this check box for only one profile, otherwise the graphs will becomecrowded with scale lines for all the displayed profiles.6.1.3 Entering the Significant Levels SettingsYou can have Win9000 automatically generate <strong>and</strong> display significant levels when one ormore of the following profiles have been added to the horizontal axis of a Graphicaldisplay <strong>and</strong> the Display Significant Levels check box on the Profiles tab has been selectedfor the profile:• Temperature• Humidity• Wind Speed• Wind DirectionWhen either a temperature or a humidity profile, or both, have been added to a Graphicaldisplay, you can have Win9000 generate significant levels for the following data types orevents:Win9000 Processing <strong>and</strong> Display Software
6-8 SECTION 6 Working with the Graphical Displays• Temperature• Humidity• Tropopause• Burst point• 100 hPa Level• Start of Missing Level• End of Missing Level• Start of Inversion• End of Inversion• Surface Value• Start of Isothermal• End of IsothermalWhen either a smoothed wind speed or a smoothed wind direction profile, or both, havebeen added to a Graphical display, you can have Win9000 generate significant levels forthe following data types or events:• Burst point• 100 hPa Level• Start of Missing Level• End of Missing Level• Surface Value• Wind Speed• Wind direction• Start of Calm Wind• End of Calm Wind• Maximum Wind SpeedNOTE You can also manually insert, move <strong>and</strong> remove significant levels asdescribed in “Manually Inserting, Moving <strong>and</strong> Removing Significant Levels” onpage 6-16.Operator’s ManualP/N 9017-205, Rev. C
Configuring a Graphical Display 6-9The significant levels settings are entered on the Significant Levels tab of the GraphGenerator Configuration dialog box. The Graph Generator Configuration dialog box isshown open to the Significant Levels tab in Figure 6-4. The dialog box also includessettings for the permanence regions <strong>and</strong> the tolerance bars corresponding to the significantlevels. All the settings apply to all the profiles in the profiles list on the Profiles tab. Forinformation on significant levels, see “Generating <strong>and</strong> Displaying Significant Levels” onpage 6-15.FIGURE 6-4: The Graph Generator Configuration Dialog Box SignificantLevels TabThe Significant Levels tab contains the parameters described below. For each parameter,select or enter the required settings as instructed.Significant Levels. The data type or event for which significant levels will be generatedfor all the profiles during a flight <strong>and</strong> for which each of the selected or entered parametersapply. Select the data type or event from the drop-down list box.NOTE The data type selections in the Significant Levels drop-down list boxapply to all the profiles that have been added on the Profiles tab of the GraphGenerator Configuration dialog box. Although all the data types for whichsignificant levels can be generated are listed, those for which the significant levels willactually be generated depend on whether temperature, humidity, smoothed wind, orsmoothed wind direction profiles have been added to the Graphical display as describedabove.Win9000 Processing <strong>and</strong> Display Software
6-10 SECTION 6 Working with the Graphical DisplaysStyle. The style of the marker that is inserted in all the profiles at each data point that isdetermined to be a significant level for the selected data type or event in the SignificantLevels drop-down list box. You can select a different style for each data type or event. TheDisplay Significant Level check box must be selected to display the marker. Thedrop-down list box displays the currently selected style. Select the style from thedrop-down list box.Color. The color of the marker that is inserted in all the profiles at each data point that isdetermined to be a significant level for the selected data type or event in the SignificantLevels drop-down list box. You can select a different color for each data type or event.TheDisplay Significant Level check box must be selected to display the marker. Click thecolor button <strong>and</strong> choose a color for the marker.Display Significant Level. Select this check box to display the significant levelmarkers for the selected data type or event in the Significant Levels drop-down list box.You can select or clear the check box for each data type or event.NOTE The Display Significant Levels check box on the Profiles tab must beselected for each profile for which you want the significant levels displayed.Level Highlight Color. The color of the highlighting that is displayed over a significantlevel marker when the mouse pointer is pointing to it. Click the color button <strong>and</strong> choose acolor for the highlighting.Permanent Level Highlight Color. The color of the highlighting of the significantlevel markers that are contained within a permanence region when selecting it. Click thecolor button <strong>and</strong> choose a color for the highlighting. (See “Protecting Significant LevelsUsing a Permanence Region” on page 6-17.)Permanent Region Color. The shaded color of a permanence region when it isselected. Click the color button <strong>and</strong> choose a color for the shading. (See “ProtectingSignificant Levels Using a Permanence Region” on page 6-17.)Display Permanent Region. Select this check box to display the permanence region.(See “Protecting Significant Levels Using a Permanence Region” on page 6-17.)Tolerance Bar Style. The style of the tolerance bars, either dotted or outline. Select thestyle from the drop-down list box. (See “Displaying <strong>and</strong> Hiding Tolerance Bars” on page6-18.)Tolerance Bar Color. The color of the tolerance bars. Click the color button <strong>and</strong> choosea color for the tolerance bars. (See “Displaying <strong>and</strong> Hiding Tolerance Bars” on page 6-18.)Operator’s ManualP/N 9017-205, Rev. C
Scaling a Graph 6-116.2 Scaling a GraphYou can scale the graph in a Graphical display in the following ways:• Default• Automatic• Maximum• Manually6.2.1 Selecting Which Profiles on a Graph to ScaleIf more than one profile is displayed on a graph, you can select which profile to scale oryou can scale all the profiles at once. The default selection is all the profiles. To select anindividual profile to scale, right-click anywhere in the graph, select Scaling Mode from thepop-up menu, <strong>and</strong> then choose the profile. A bullet is shown next to the current choice. Toselect all the profiles, choose Scale All.6.2.2 Scaling a Graph Using Default ScalingDefault scaling adjusts the minimum <strong>and</strong> maximum values of the horizontal <strong>and</strong> verticalaxis of a graph for each profile to a default scale selected by Win9000. These values areinitially assigned by Win9000 when starting a flight or opening a flight data file. If youchange the graph scaling for one or more profiles, you can reset the scaling of all theprofiles to their default values. To use the default scaling to scale a graph, right-clickanywhere in the graph <strong>and</strong> choose Default Scaling from the pop-up menu.6.2.3 Scaling a Graph AutomaticallyAutomatically scaling a graph adjusts the minimum <strong>and</strong> maximum values of the horizontal<strong>and</strong> vertical axis of the graph for each profile such that all the profiles always fit exactlywithin the graph. To automatically scale a graph, right-click anywhere in the graph <strong>and</strong>choose Automatic Scaling from the pop-up menu.To have Win9000 automatically scale the graph continuously throughout a flight,right-click anywhere in the graph, select Properties from the pop-up menu, <strong>and</strong> then selectthe Profiles tab of the Graph Generator Configuration dialog box. One at a time select theprofiles for which you want to continuously scale the graph, <strong>and</strong> then select theAutomatically scale axis during a flight check box in the Options area. When all of theselected profiles have been configured in this manner, click OK. Win9000 willautomatically scale the graph for each profile every minute.Win9000 Processing <strong>and</strong> Display Software
6-12 SECTION 6 Working with the Graphical Displays6.2.4 Scaling a Graph Using Maximum ScalingMaximum scaling adjusts the minimum <strong>and</strong> maximum values of the horizontal <strong>and</strong>vertical axis of a graph for each profile to the absolute minimum <strong>and</strong> maximum values forthe data type being displayed. These values far exceed the practical <strong>and</strong> expected valuesfor the data, enabling compression of the profiles within the graph. Using maximumscaling helps to identify extraneous data that might lie outside of the expected limits. It isalso useful when generating difference profiles where negative values of the data canoccur <strong>and</strong> would otherwise not be displayed. To use maximum scaling, right-clickanywhere in the graph <strong>and</strong> choose Maximum Scaling from the pop-up menu.6.2.5 Scaling a Graph ManuallyYou can manually adjust the minimum <strong>and</strong> maximum values of the horizontal <strong>and</strong> verticalaxis of the graph for any one or more of the profiles. To manually scale a profile,right-click anywhere in the graph, select Properties from the pop-up menu, <strong>and</strong> then selectthe Profiles tab of the Graph Generator Configuration dialog box. One at a time select theprofiles for which you want to manually scale the graph, <strong>and</strong> then enter the minimum <strong>and</strong>maximum values in the Minimum <strong>and</strong> Maximum text boxes in the units shown in theHorizontal Axis <strong>and</strong> Vertical Axis areas.NOTE Scaling a graph using default, automatic or maximum scaling removesany manual settings.6.3 Zooming In on a GraphYou can zoom in on one or more profiles on the graph in a Graphical display. To zoom inon the graph, click <strong>and</strong> drag your mouse pointer to draw a box around the segment of theprofile you want to zoom in on as shown in Figure 6-5. For more than one profile, drawthe box to encompass all of them. Release the mouse button. The selected segment orsegments exp<strong>and</strong> to fill the graph <strong>and</strong> the scales of the horizontal <strong>and</strong> vertical axis adjustautomatically as shown in Figure 6-6. You can repeat to zoom in further.NOTE To zoom out of a graph, scale the graph as described in “Scaling aGraph” on page 6-11.Operator’s ManualP/N 9017-205, Rev. C
Zooming In on a Graph 6-13Click <strong>and</strong> drag yourmouse pointer todraw a box aroundthe segment of one ormore of the profilesyou want to zoom inon.FIGURE 6-5: Selecting the Segments of Profiles in a Graph to Zoom in onThe zoomed insegment orsegments aredisplayed in thegraph.FIGURE 6-6: Zooming in on the GraphWin9000 Processing <strong>and</strong> Display Software
6-14 SECTION 6 Working with the Graphical Displays6.4 Marking Data as Bad or Good on a GraphYou can mark data anywhere on the graph in a Graphical display as bad. And you canmark data as good that have been marked as bad, including all the data on the graph atonce.6.4.1 Selecting <strong>and</strong> Marking Data as BadTo mark data as bad, right-click anywhere in the graph, select User-Defined Bad Datafrom the pop-up menu, <strong>and</strong> then choose Select data to be marked as bad. Click <strong>and</strong> dragyour mouse pointer to draw a box around the segment of the profile you want to mark asbad as shown in Figure 6-7. Release the mouse button. The selected segment of the profilewill disappear as shown in Figure 6-8, including any significant level markers. Should youdecide not to mark data as bad before drawing the box, choose Select data to be marked asbad again which will be shown with a check mark next to it.Click <strong>and</strong> drag yourmouse pointer todraw a box aroundthe segment of theprofile you want tomark as bad.FIGURE 6-7: Selecting Data to be Marked as Bad6.4.2 Selecting <strong>and</strong> Marking Data as GoodTo mark data as good that have been marked as bad, right-click anywhere in the graph,select User-Defined Bad Data from the pop-up menu, <strong>and</strong> then choose Select data to bemarked as good. Click <strong>and</strong> drag your mouse pointer to draw a box around the segment ofthe profile you want to mark as good. Release the mouse button. The selected segment ofthe profile marked as bad will reappear, including the significant level markers. Shouldyou decide not to mark data as good before drawing the box, choose Select data to bemarked as good again which will be shown with a check mark next to it.Operator’s ManualP/N 9017-205, Rev. C
Generating <strong>and</strong> Displaying Significant Levels 6-15The segment of theprofile marked asbad disappears,including anysignificant levelmarkers.FIGURE 6-8: Marking Selected Data as Bad6.4.3 Marking all Data as GoodTo mark all data on all the profiles as good, right-click anywhere in the graph, selectUser-Defined Bad Data from the pop-up menu, <strong>and</strong> then choose Mark All Data AsGood. All segments of all the profiles marked as bad will reappear.6.5 Generating <strong>and</strong> Displaying Significant LevelsYou can have Win9000 automatically <strong>and</strong> periodically generate <strong>and</strong> display significantlevels for the temperature, humidity, wind speed, <strong>and</strong> wind direction profiles on the graphin a Graphical display. Or you can manually select when to have Win9000 generate thesignificant levels. The profiles must have been added as described in “Adding <strong>and</strong>Removing Profiles <strong>and</strong> Entering Their Settings” on page 6-4. In addition, the DisplaySignificant Levels check box on the Profiles tab for the Graphical display must beselected for one or more of these profiles. The significant levels are used by Win9000 togenerate the WMO <strong>and</strong> military coded messages.The significant levels can be generated <strong>and</strong> displayed during a flight, after a flight, or froman open flight data file. Win9000 inserts a marker in the profile at each data point that itdetermines to be a significant level. Regardless which data type—temperature orhumidity—is the reason for the significant level, both the temperature <strong>and</strong> humidityprofiles are accordingly marked. The same is true for wind speed <strong>and</strong> wind direction.Different styles <strong>and</strong> colors of markers can be selected, including lines that span the widthof the graph. (For instructions on how to select the marker styles <strong>and</strong> their colors <strong>and</strong> othersignificant level settings, see “Entering the Significant Levels Settings” on page 6-7.)Win9000 Processing <strong>and</strong> Display Software
6-16 SECTION 6 Working with the Graphical DisplaysCAUTION Whenever Win9000 generates significant levels, all previouslygenerated significant levels, plus manually inserted <strong>and</strong> moved significantlevels are first removed. To protect moved <strong>and</strong> manually inserted significantlevels from removal, you can create permanence regions as described in “ProtectingSignificant Levels Using a Permanence Region” on page 6-17.6.5.1 Generating <strong>and</strong> Displaying Significant LevelsContinuouslyTo continuously generate <strong>and</strong> display significant levels during a flight, select theAutomatically generate Significant Levels every check box on the Data Processing tab ofthe Win9000 System Configuration dialog box for the radiosonde type. Enter how often inminutes in the corresponding text box. For information on the Data Processing tab, seeSECTION 3, “Win9000 Setup.”6.5.2 Generating <strong>and</strong> Displaying Significant Levels ManuallyTo manually generate <strong>and</strong> display significant levels during a flight, right-click anywherein the graph, select Significant Levels from the pop-up menu, <strong>and</strong> then choose Generate.6.5.3 Manually Inserting, Moving <strong>and</strong> Removing SignificantLevelsTo insert a significant level, right-click in the graph where you want to insert it, selectSignificant Levels from the pop-up menu, select Insert, <strong>and</strong> then choose the significantlevel you want to insert. The significant levels listed depend on whether the graph includesa temperature or humidity profile, or both, or a wind speed or wind direction profile, orboth.To move a significant level, place your mouse pointer on the marker of the significantlevel you want to move. The marker will be highlighted in the color selected for LevelHighlight Color on the Significant Levels tab of the Graph Generator Configurationdialog box. Click the marker, <strong>and</strong> then drag <strong>and</strong> drop it where you want to move thesignificant level.NOTE If one or more significant levels are removed during a flight <strong>and</strong> youhave selected to have Win9000 automatically generate significant levels, theywill be regenerated at the selected time if the flight does not end first.To remove a significant level, place your mouse pointer on the marker of the significantlevel you want to remove. The marker will be highlighted. Right-click on the marker,select Significant Levels from the pop-up menu, <strong>and</strong> then choose Remove.To remove all the significant levels, right-click anywhere in the graph, select SignificantLevels from the pop-up menu, <strong>and</strong> then choose Remove All.Operator’s ManualP/N 9017-205, Rev. C
Generating <strong>and</strong> Displaying Significant Levels 6-176.5.4 Protecting Significant Levels Using a PermanenceRegionWhen generating significant levels, either automatically or manually, Win9000 firstremoves all previously generated, inserted <strong>and</strong> moved significant levels. To preventremoval of one or more significant levels when regenerating significant levels, you cancreate a permanence region on the graph. To display a permanence region, the DisplayPermanent Region check box on the Significant Levels tab for the Graphical display mustbe selected.CAUTION If a permanence region already exists, creating a new one removesthe old.To create a permanence region, right-click anywhere in the graph, select Significant Levelsfrom the pop-up menu, select Permanence Region, <strong>and</strong> then choose Select. Click <strong>and</strong> dragyour mouse pointer to draw a box around the significant levels you want to protect asshown in Figure 6-9. The significant level markers in the selected region will behighlighted in the color selected for Permanent Level Highlight Color on the SignificantLevels tab of the Graph Generator Configuration dialog box. Release the mouse button.The area selected is shaded in the color selected for Permanent Region Color as shown inFigure 6-10 <strong>and</strong> extends the width of the graph to include the significant levels on all theprofiles that lie within the region. Should you decide not to create a permanence regionbefore drawing the box, choose Select again which will be shown with a check mark nextto it.Click <strong>and</strong> drag yourmouse pointer todraw a box aroundthe significant levelsyou want to protectwith a permanenceregion.The significant levelmarkers arehighlighted in thecolor selected forPermanent LevelHighlight Color.FIGURE 6-9: Selecting a Permanence RegionWin9000 Processing <strong>and</strong> Display Software
6-18 SECTION 6 Working with the Graphical DisplaysThe selectedpermanence region isshown shaded in thecolor selected forPermanent RegionColor.FIGURE 6-10: Displaying a Selected Permanence RegionTo remove a permanence region without creating a new one, right-click anywhere in thegraph, select Significant Levels from the pop-up menu, select Permanence Region, <strong>and</strong>then choose Remove.6.5.5 Displaying <strong>and</strong> Hiding Tolerance BarsAs a visual aid for testing the adequacy of the significant levels, both those generated byWin9000 <strong>and</strong> those manually inserted, you can display tolerance bars for the temperature,humidity, wind speed, <strong>and</strong> wind direction profiles on the graph in a Graphical display. Thetolerance bars connect from one significant level to the next, straddling the profiles, <strong>and</strong>they can be displayed or hidden any time during or after a flight <strong>and</strong> after opening a savedflight data file. You can also select a color for the tolerance bars <strong>and</strong> display them asoutlines or as solid lines.NOTE Before you can display tolerance bars, you must generate <strong>and</strong> displaythe significant levels, either automatically or manually. (See “Generating <strong>and</strong>Displaying Significant Levels” on page 6-15.)To display the tolerance bars, select the Display Tolerance Bars check box for eachprofile for which you want to display them on the Profiles tab for the Graphical display.This check box is available only if the Display Significant Levels check box is selected.To hide the tolerance bars, clear the check box. Select the tolerance bar style, outline orsolid, from the Tolerance Bar Style drop-down list box on the Significant Levels tab. Clickthe Tolerance Bar color button to choose a color for the tolerance bars. Tolerance bars areshown displayed as outlines in Figure 6-11, <strong>and</strong> as solid lines in Figure 6-12.Operator’s ManualP/N 9017-205, Rev. C
Generating <strong>and</strong> Displaying Significant Levels 6-19The tolerance barsconnect between thesignificant levels. Thetolerance bar limitsdetermine theirseparation.FIGURE 6-11: Tolerance Bars Displayed as OutlinesThe tolerance barsconnect between thesignificant levels. Thetolerance bar limitsdetermine theirseparation.FIGURE 6-12: Tolerance Bars Displayed as Solid LinesWin9000 Processing <strong>and</strong> Display Software
6-20 SECTION 6 Working with the Graphical Displays6.6 Displaying Data from Multiple Flight Data Filesby Adding Data SetsYou can easily display the data from multiple flight data files, in addition to the currentflight, one at a time or simultaneously, on the graph in the same Graphical display. For theInformation <strong>and</strong> Tabular displays, you can easily select which flight to display, one at atime. Before you can display the data in this manner, however, the data set for each flightmust be added to the Flight window. A data set contains all the data for the flight plus thesystem configuration data.The data set for the current flight, or if there is no flight in progress, the data set for thefirst opened flight data file, is the base data set. The data set that is currently beingdisplayed is the active data set, whether it is the base data set or one of the added data sets.6.6.1 Adding <strong>and</strong> Removing Data SetsTo add a data set to a Flight window, click the Add a Data Set button on the toolbar. TheOpen Win9000 Flight File dialog box opens. Select the flight data file to add, <strong>and</strong> then <strong>and</strong>click Open. You can add as many data sets as you want in this manner where each newlyadded data set becomes the active data set. A list of added data sets can be viewed in theActive Data Set drop-down list box in the Flight window as shown in Figure 6-13. The listshows the file names of the flight data files.To remove an added data set, click the Close Data Set button on the toolbar. A dialog boxopens showing a list of added data sets. Select the data set to remove, <strong>and</strong> then click OK. Ifthe removed data set was being displayed, the data set that was listed immediately above itin the Active Data Set drop-down list box becomes the active data set.6.6.2 Displaying Data Sets IndividuallyTo display a data set individually, select it from the Active Data Set drop-down list box.You can display the data in any of the displays shown in the Flight Window Navigationpane, <strong>and</strong> you can easily switch from one data set to another. The displays in the FlightWindow Navigation pane have been previously added to the display list for the base dataset on the Data Displays tab of the Win9000 System Configuration dialog box. (See “DataDisplays Setup” on page 3-75.) The same list of displays applies to all the added data sets.6.6.3 Displaying Multiple Data Sets SimultaneouslyYou can display multiple data sets simultaneously in a Graphical display only. All thedata sets listed in the Active Data Set drop-down list box are displayed. To display thedata sets simultaneously, right-click anywhere in the graph, choose Properties from thepop-up menu, select the Display Profiles for All Data Sets option on the DisplayOptions tab of the Graph Generator Configuration dialog box, <strong>and</strong> then click OK. Togo back to displaying a single data set, select the Display Profiles for the Active DataSet Only option on the Display Options tab. Only the last data set added or last selectedfrom the Active Data Set drop-down list box will be displayed.Operator’s ManualP/N 9017-205, Rev. C
Displaying Difference Profiles 6-21Select the data set todisplay from theActive Data Setdrop-down list box.The first data setlisted is the base dataset.FIGURE 6-13: Selecting the Data Set to Display6.7 Displaying Difference ProfilesYou can compare two profiles of the same data type by displaying their differences on thegraph in a Graphical display. The difference profiles allow you to compare the data setsfrom flights performed on the same day at the same time from two W-9000Meteorological Processing Systems. One of the profiles must be the base data set, <strong>and</strong> theother an active data set that has been added to the Flight window. For instructions on howto open a base data set <strong>and</strong> add active data sets, see “Displaying Data from Multiple FlightData Files by Adding Data Sets” on page 6-20. The profiles for a base data set are shownin Figure 6-14, <strong>and</strong> the profiles for an active data set in Figure 6-15. The base data set isthe first data set listed in the Active Data Set drop-down list box.The difference profile is generated by subtracting the values of each data point in theactive data set from each data point in the base data set at the same UTC time asdetermined by the base data set. If a corresponding data value in the active data set is notfound for a UTC time, the difference is not displayed. If there is no correspondencebetween the base <strong>and</strong> active data sets, no difference profile will be displayed. Thedifference profiles for the base <strong>and</strong> active data sets in Figure 6-14 <strong>and</strong> Figure 6-15 areshown in Figure 6-16 on page 6-23.To display the difference profiles for two data sets, select the active data set from theActive Data Set drop-down list box, right-click anywhere in the graph, chooseProperties from the pop-up menu, select the Display Difference Profiles option on theDisplay Options tab of the Graph Generator Configuration dialog box, <strong>and</strong> then clickOK.Win9000 Processing <strong>and</strong> Display Software
6-22 SECTION 6 Working with the Graphical DisplaysThe base data set is displayed in the Active Data Set drop-down list box as the first data set.Select a Graphicaldisplay.FIGURE 6-14: Opening a Flight Data File as the Base Data SetSelect the activedata set from theActive Data Setdrop-down list box.FIGURE 6-15: Selecting the Active Data SetOperator’s ManualP/N 9017-205, Rev. C
Printing a Graph 6-23To select a different active data set to compare, select it from the Active Data Setdrop-down list box. To select a different base data set to compare, right-click anywhere inthe graph, select Difference Profiles from the pop-up menu, select Base Data Set, <strong>and</strong> thenchoose the data set. A bullet is shown next to the current choice.The differenceprofiles are displayedin the graph.FIGURE 6-16: Displaying the Difference Profiles for the Base <strong>and</strong>Active Data Sets6.8 Printing a GraphYou can print the graph in a Graphical display at any time. To print the graph, right-clickanywhere in the graph, choose Print from the pop-up menu, select your printer from thePrint dialog box, <strong>and</strong> then click OK. A sample printout is shown in Figure 6-17.6.9 Saving a Graph to a Bitmap FileYou can save a graph to a bitmap (BMP) file, a file with extension .bmp. To save thegraph, right-click anywhere in the graph, choose Save to .bmp from the pop-up menu,select a folder <strong>and</strong> create a file or select an existing file to save the data, <strong>and</strong> then clickSave.Win9000 Processing <strong>and</strong> Display Software
6-24 SECTION 6 Working with the Graphical DisplaysFIGURE 6-17: Sample Printout of a Graph in a Graphical DisplayOperator’s ManualP/N 9017-205, Rev. C
Displaying Beta <strong>and</strong> Gamma Radioactivity Data 6-256.10 Displaying Beta <strong>and</strong> Gamma Radioactivity DataThe Sippican 1548-236 Radiation Sensor, which functions with a Mark IIA GPSMICROSONDE, acquires two types of radioactivity data, beta <strong>and</strong> gamma. (Forinformation on the radiation sensor, see “Sippican 1548-236 Radiation Sensor” on page1-19.) The profiles for each type of radioactivity data can be displayed on a linear orlogarithmic scale on the graph in a Graphical display. And the data can be displayed in thismanner on either the horizontal or vertical axis.Before you can display data from a radiation sensor, the Mark IIA DGPS with RadiationSensor (LOS) System must be added in Win9000 <strong>and</strong> configured as described in “MarkIIA DGPS with Radiation Sensor (LOS) System Setup” on page 3-65. When the system isadded, a Graphical display named "Graphical Radiation Sensor" that is configured withbeta <strong>and</strong> gamma profiles in the logarithmic scale is included automatically in the PTUgroup of the display list on the Data Displays tab of the Win9000 Configuration dialogbox for Mark IIA DGPS with Radiation Sensor (LOS) MICROSONDES. For instructionson how to rename the Graphical display, see “Renaming Displays <strong>and</strong> Display Groups” onpage 3-77. The graph is configured to display the data on the horizontal axis with flighttime on the vertical axis as shown in Figure 6-18. The data points are displayed as clearcircles.To display the radioactivity data, select the Graphical display for the data in the FlightWindow Navigation pane as shown in Figure 6-18.Select the Graphicaldisplay for theradioactivity data.The name"Graphical RadiationSensor" is initiallyassigned when thesystem is added inWin9000.FIGURE 6-18: Displaying Beta <strong>and</strong> Gamma Radioactivity Data on aLogarithmic ScaleWin9000 Processing <strong>and</strong> Display Software
6-26 SECTION 6 Working with the Graphical DisplaysTo change the settings of the graph in the Graphical display for a radiation sensor,right-click anywhere in the graph, select Properties from the pop-up menu, <strong>and</strong> then selectthe Profiles tab of the Graph Generator Configuration dialog box. One at a time select theprofiles in the profiles list under Profiles as shown in Figure 6-19 <strong>and</strong> change the settingsas required. To select a linear scale for beta, select Beta Radiation from the Datadrop-down list box in the Horizontal Axis or Vertical Axis area of the Profiles tab.Similarly, for gamma, select Gamma Radiation. The logarithmic scale selections are BetaRadiation (Log Scale) <strong>and</strong> Gamma Radiation (Log Scale). For more information on thesettings on the Profiles tab, see “Adding <strong>and</strong> Removing Profiles <strong>and</strong> Entering TheirSettings” on page 6-4.FIGURE 6-19: The Profiles Tab Set up to Display Beta <strong>and</strong>Gamma RadiationOperator’s ManualP/N 9017-205, Rev. C
SECTION 7EXPORTING FLIGHT DATA TO TEXT FILES7-1Win9000 allows you to convert the data in a flight data file into one or moretext-formatted export data files compatible with external application softwaresuch as word processors <strong>and</strong> spreadsheets.To create one or more export data files:1. Choose Open from the File menu <strong>and</strong> select a flight data file from the Open Win9000Flight File dialog box.A Flight window opens to the Current Data display as shown in Figure 7-1.Click the ExportFlight Data to TextFiles button toconvert a flight datafile into one or moreexport data files.FIGURE 7-1: Opened Flight Data File for Exporting2. Click the Export Flight Data to Text Files button as shown in Figure 7-1.The Win9000 Export Options dialog box opens as shown in Figure 7-2.3. In the Win9000 Export Options dialog box, select the types of data to export byselecting the appropriate check boxes. A description of each data type is provided.4. Click Change File Name.The Export dialog box opens.Win9000 Processing <strong>and</strong> Display Software
7-2 SECTION 7 Exporting Flight Data to Text FilesFIGURE 7-2: The Win9000 Export Options Dialog Box5. In the Export dialog box, select or create a directory in which the export data files areto be saved, enter a name for the file in the File name text box, <strong>and</strong> then click Save.The Export dialog box closes.6. In the Win9000 Export Options dialog box, click OK.A separate file for each selected file format is created in the selected directory withthe correct extensions added automatically. These export data files can be opened in aword processing or spreadsheet program.Operator’s ManualP/N 9017-205, Rev. C
8-1SECTION 8GENERATING CODED MESSAGESWin9000 allows you to create groups of WMO <strong>and</strong> military messages <strong>and</strong> togenerate <strong>and</strong> transmit the coded messages. You can have Win9000automatically generate the coded messages in a group during a flight, or youcan choose when to have Win9000 generate them. You can also have Win9000automatically transmit the coded messages after the flight from an RS-232 serial port ormodem on the system computer. Automatically coded messages in a group are generatedwhen one of the following operator selected events occurs:• The pressure is less than an operator specified value• The temperature is less than an operator specified value• The height is greater than an operator specified value• The time is greater than a operator specified value• At the end of the flight.This <strong>section</strong> provides instructions on how to create <strong>and</strong> edit WMO <strong>and</strong> military messagegroups <strong>and</strong> how to generate, edit, transmit, view, save, <strong>and</strong> print the coded messages.Instructions are also provided on how to configure the serial port or modem from which totransmit the coded messages.8.1 Creating, Editing <strong>and</strong> Removing WMO <strong>and</strong>Military Message GroupsWMO <strong>and</strong> military message groups are created, edited <strong>and</strong> removed on the MessageGeneration tab of the Coded Messages tab of the Win9000 System Configuration dialogbox. The Win9000 System Configuration dialog box is shown opened to the MessageGeneration tab in Figure 8-1. To open the Win9000 System Configuration dialog box for aW-9000 Meteorological Processing System, choose System Configuration from the Filemenu, select the W-9000 Meteorological Processing System, <strong>and</strong> then click Properties.To open the Message Generation tab, first click the Coded Messages tab, then theMessage Generation tab.The WMO <strong>and</strong> Military message groups created in the Win9000 System Configurationdialog box apply to all flights for the selected system. Message groups can also be created,edited <strong>and</strong> removed for the current flight from the Preflight Information dialog box whenpreparing for <strong>launch</strong>.Win9000 Processing <strong>and</strong> Display Software
8-2 SECTION 8 Generating Coded MessagesFIGURE 8-1: The Win9000 System Configuration Dialog Box—MessageGeneration Tab of Coded Messages TabTo create WMO <strong>and</strong> Military message groups:1. On the Message Generation tab, click Create New Group.The Create New Coded Message Group dialog box opens:2. Enter a name for the new message group in the text box, <strong>and</strong> then click OK.The Create New Coded Message Group dialog box closes, <strong>and</strong> the group nameappears on the Message Generation tab as shown in Figure 8-2.3. Click the plus (+) signs next to the WMO Messages <strong>and</strong> Military Messages titles. Theplus signs turn into minus (-) signs <strong>and</strong> all of the available messages are listed. Clickthe up <strong>and</strong> down arrows or drag the scroll bar up <strong>and</strong> down to view all the messages.4. From the list of messages double-click the ones you want to include in the group. Orfor every message you want to include, click it once <strong>and</strong> then click the button.The messages are added to the group <strong>and</strong> displayed to the right of the message list. Toremove a message from the group, click it once <strong>and</strong> then click the button.Operator’s ManualP/N 9017-205, Rev. C
Creating, Editing <strong>and</strong> Removing WMO <strong>and</strong> Military Message Groups 8-3Click Create New Group to create amessage group.Click Remove Group to removea message group.Creating a newmessage group addsthe group name to thelist.Click the plus (+)sign to display theavailable WMO ormilitary messages.The plus sign turnsinto a minus (-) sign<strong>and</strong> the messagesare listed.To add a messageto the group,double-click themessage or click itonce <strong>and</strong> then clickthe button.To remove amessage from thegroup, click themessage <strong>and</strong> thenclick the button.FIGURE 8-2: Creating WMO <strong>and</strong> Military Message Groups on theMessage Generation Tab5. Select the Use For Every Flight check box to create the group for every flight.6. Select the Automatically Generate check box if you want Win9000 to automaticallygenerate the coded messages when one of the events listed below the check boxoccurs. Clear the check box if you intend only to manually select when to generatethe coded messages. With the check box selected, you will still be able to manuallyselect when to generate the coded messages, overriding the automatic feature.7. If you selected the Automatically Generate check box, select an event to trigger thegeneration of the coded messages for the group, <strong>and</strong> then enter a specific value in thecorresponding text box if available.8. Select the Automatically Transmit check box to have Win9000 automaticallytransmit the coded messages for the group after the flight.9. Repeat all the steps above for each message group you wish to create.10. Click OK to save the new message groups <strong>and</strong> close the Win9000 SystemConfiguration dialog box.Win9000 Processing <strong>and</strong> Display Software
8-4 SECTION 8 Generating Coded MessagesTo edit message groups:1. On the Message Generation tab, click the name of the group you want to edit.2. From the list of messages, double-click the ones you want to add to the group. Or forevery message you want to add, click it once <strong>and</strong> then click the button.3. For every message you want to remove from the group, click it once <strong>and</strong> then clickthe button.4. Repeat the steps above for every group you want to edit.NOTE Changes made to the message groups are not saved until you click OKin the Win9000 System Configuration dialog box. Clicking Cancel closes thedialog box without saving the changes.5. Click OK to save your changes <strong>and</strong> close the Win9000 System Configuration dialogbox.To remove message groups:1. On the Message Generation tab, click the name of the group you want to remove.2. Click Remove Group.A dialog box opens asking if you want to remove the group:3. Click Yes.4. Repeat the steps above for every group you want to remove.NOTE Changes made to the message groups are not removed until you clickOK in the Win9000 System Configuration dialog box. Clicking Cancel closesthe dialog box without saving the changes.5. Click OK to remove the groups <strong>and</strong> close the Win9000 System Configuration dialogbox.Operator’s ManualP/N 9017-205, Rev. C
Generating <strong>and</strong> Transmitting Coded Messages 8-58.2 Generating <strong>and</strong> Transmitting Coded MessagesFor each message group created, you can have Win9000 automatically generate the codedmessages during a flight, or you can manually generate them, as many times as you wish.You can also do both. And you can have Win9000 transmit the coded messagesautomatically at the end of the flight, or you can transmit them at any time.To have Win9000 automatically generate the coded messages for a group during a flight,select the group on the Message Generation tab, select the Automatically Generate checkbox, <strong>and</strong> then select an event to trigger it.To have Win9000 automatically transmit the coded messages for a message group, selectthe group on the Message Generation tab, <strong>and</strong> then select the Automatically Transmitcheck box. The coded messages for the group will be transmitted on the selected RS-232port or modem after the flight. (See “Selecting <strong>and</strong> Configuring the Serial Port or Modem”on page 8-6 for instructions on how to select <strong>and</strong> configure the serial port or modem.)To manually generate coded messages:1. Click Coded Messages for the flight in the Flight Window Navigation pane of theMain window.The Coded Messages display opens.2. Click the Generate button.The Generate Coded Messages dialog box opens.3. Select the message group for which you want to generate the coded messages, <strong>and</strong>then click OK.The dialog box closes <strong>and</strong> the coded messages are generated.4. Repeat Steps 2 <strong>and</strong> 3 for each message group for which you want to generate thecoded messages.To manually transmit coded messages:1. Click Coded Messages for the flight in the Flight Window Navigation pane of theMain window.The Coded Messages display opens.2. Click the Transfer button.The Transmit Coded Messages dialog box opens.3. Select the message group for which you want to transmit the coded messages, <strong>and</strong>then click OK.The dialog box closes <strong>and</strong> the coded messages are transmitted.4. Repeat Steps 2 <strong>and</strong> 3 for each message group for which you want to transmit thecoded messages.Win9000 Processing <strong>and</strong> Display Software
8-6 SECTION 8 Generating Coded Messages8.3 Selecting <strong>and</strong> Configuring the Serial Portor ModemCoded WMO <strong>and</strong> military messages can be transmitted from an RS-232 serial port ormodem on the system computer. If you choose to transmit the coded messages on a serialport, you can select which port <strong>and</strong> configure it. If you choose to transmit them from amodem, you can select the modem <strong>and</strong> configure it.NOTE If you choose the transmit the coded messages from a serial port, do notselect the port that is connected to the ZEEMET rack.The serial port or modem is selected <strong>and</strong> configured on the Message Transmission tab ofthe Coded Messages tab of the Win9000 System Configuration dialog box. The Win9000System Configuration dialog box is shown opened to the Message Generation tab inFigure 8-3. To open the Win9000 System Configuration dialog box for a W-9000Meteorological Processing System, choose System Configuration from the File menu,select the W-9000 Meteorological Processing System, <strong>and</strong> then click Properties. To openthe Message Transmission tab, first click the Coded Messages tab, then the MessageTransmission tab.FIGURE 8-3: The Win9000 System Configuration Dialog Box—MessageTransmission Tab of Coded Messages TabOperator’s ManualP/N 9017-205, Rev. C
Selecting <strong>and</strong> Configuring the Serial Port or Modem 8-7NOTE The Send via Serial Port <strong>and</strong> Send via Modem options are onlyavailable if the Automatically Transmit check box is selected on the MessageGeneration tab for at least one message group. (See “Creating, Editing <strong>and</strong>Removing WMO <strong>and</strong> Military Message Groups” on page 8-1.)To select <strong>and</strong> configure a serial port:1. On the Message Transmission tab, select the Send via Serial Port option.2. Select the serial port from the Serial Port drop-down list.box.3. Select the baud rate from the Baud Rate drop-down list box.4. Select the parity from the Parity drop-down list box.5. Select the number of data bits from the Data Bits drop-down list box.6. Select the number of stop bits from the Stop Bits drop-down list box.7. Click OK.The Win9000 System Configuration dialog box closes <strong>and</strong> the selected serial port isconfigured.To select <strong>and</strong> configure the modem:1. On the Message Transmission tab, select the Send via Modem option.2. Select the COM port to which the modem connects from the Select the COM portused by the modem drop-down list box.3. Enter the phone number to use from the Enter the phone number used to establishthe connection text box.4. Click Modems <strong>and</strong> configure the modem. If necessary, refer to Help provided by theWindows operating system for assistance.5. Click Connections to configure the modem connection settings. If necessary, refer toHelp provided by the Windows operating system for assistance.6. Click OK.The Win9000 System Configuration dialog box closes <strong>and</strong> the selected modem isconfigured.Win9000 Processing <strong>and</strong> Display Software
8-8 SECTION 8 Generating Coded Messages8.4 Viewing, Editing, Saving, <strong>and</strong> PrintingCoded MessagesCoded WMO <strong>and</strong> military messages can be viewed, edited, saved, <strong>and</strong> printed at any timeduring or after a flight. The coded messages of a saved flight data file can also be viewed,edited, saved, <strong>and</strong> printed.To view coded messages:1. Click Coded Messages for the flight in the Flight Window Navigation pane of theMain window.The Coded Messages display opens with the WMO <strong>and</strong> military message groups thathave been created listed. For those groups with coded messages, the folder icon nextto the group name is highlighted as shown in Figure 8-4.Click Coded Messagesto open the CodedMessages .List of created WMO<strong>and</strong> military messagegroups. Groups withcoded messages areshown with their foldericons highlighted.FIGURE 8-4: List of Created Message Groups2. Click the highlighted folder icon or the group name for the message group containingthe coded messages you want to .All the coded messages for the group are displayed as shown in Figure 8-5.3. To view only a single coded message for the group, click the plus (+) sign for thegroup. The plus sign turns into a minus (-) sign <strong>and</strong> all the messages in the group arelisted as shown in Figure 8-6. Messages that have been coded are highlighted. Clickthe highlighted message icon or its name for the coded message you want to .4. To view transmission headers <strong>and</strong> trailers, click the Headers/Trailers button; to hidethem, click the button again.Operator’s ManualP/N 9017-205, Rev. C
Viewing, Editing, Saving, <strong>and</strong> Printing Coded Messages 8-9All the generated messages for the selectedmessage group are displayed.Click the highlightedfolder icon or thegroup name to viewall the codedmessages in themessage group.FIGURE 8-5: Display of all the Coded Messages for a SelectedMessage GroupThe generated message for the selectedcoded message is displayed.Click the plus (+) signto display themessages in thegroup. The plus signturns into a minus (-)sign <strong>and</strong> themessages are listed.Click a highlightedmessage icon or itsname to view thecoded message.FIGURE 8-6: Display of a Single Generated Message in aMessage GroupWin9000 Processing <strong>and</strong> Display Software
8-10 SECTION 8 Generating Coded MessagesTo edit coded messages:1. the coded messages for an entire message group as described above.2. Click the Edit button.The background of the displayed coded message is highlighted as shown inFigure 8-7.The displaybackground ishighlighted when thecoded messagescan be edited.FIGURE 8-7: Coded Messages for a Message Group—DisplayBackground Highlighted for EditingNOTE You can only edit the coded messages for an entire message group.3. Edit the coded messages by using your mouse to position the curser next to the codeyou want to change <strong>and</strong> type the new code or delete the code as required.4. Click the Edit button.The edited coded messages are added as an edited message group to the originalmessage group with its icon highlighted yellow as shown in Figure 8-8. Editing thecoded messages again overwrites them.Operator’s ManualP/N 9017-205, Rev. C
Viewing, Editing, Saving, <strong>and</strong> Printing Coded Messages 8-11The edited codedmessages are addedas an edited messagegroup to the originalmessage group. Itsicon is highlightedyellow.FIGURE 8-8: Edited Coded Messages for a Selected Message GroupTo save coded messages to a file:1. View the coded messages as described above.2. Click the Save button.The Save Coded Messages to Text File dialog box open:3. Enter a name for the file in the File name text box.4. Click Save.The coded messages are saved to the file.To print coded messages:1. View the coded messages as described above.2. Click the Print button.The Print dialog box for the system computer opens.3. Select the printer to use <strong>and</strong> click Print.The coded messages are printed.Win9000 Processing <strong>and</strong> Display Software
8-12 SECTION 8 Generating Coded Messages8.5 Regenerating Coded Messages from a SavedFlight Data FileYou can create new WMO <strong>and</strong> military message groups or edit existing groups for savedflight data files <strong>and</strong> then regenerate <strong>and</strong> transmit the coded messages. However, thesystem computer must be connected to the flight controller in the ZEEMET rack, <strong>and</strong> thedata from the radiosonde must have been saved in the flight controller after the end of theflight.To regenerate coded messages from a saved flight data file:1. Choose Open from the File menu <strong>and</strong> select the file from the Open Win9000 FlightFile dialog box.A dialog box reminding you that communications with the flight controller isrequired <strong>and</strong> that data from the radiosonde must have been saved in the flightcontroller:2. Click Yes.The Win9000 System Selection dialog box opens:retry.NOTE If the system is not enabled, click Cancel, <strong>and</strong> then choose SystemConfiguration from the File menu. In the Win9000 System Configuration dialogbox, select the system, click Enable/Disable, click Yes, <strong>and</strong> then click Close <strong>and</strong>Operator’s ManualP/N 9017-205, Rev. C
Regenerating Coded Messages from a Saved Flight Data File 8-133. Select the system, <strong>and</strong> then click OK.The Win9000 Flight Restore dialog box opens:4. Select the flight file to restore, <strong>and</strong> then click OK.The Restoring Flight File dialog box for the flight opens <strong>and</strong> the flight data isrestored in the flight controller:5. Click Coded Messages for the flight in the Flight Window Navigation pane of theMain window.The Coded Messages display opens.6. Click Configure.7. The Coded Message Configuration dialog box opens to the Message Generation tab.8. Create new message groups or edit or remove old groups as described in “Creating,Editing <strong>and</strong> Removing WMO <strong>and</strong> Military Message Groups” on page 8-1.9. Click Generate.The Create Coded Messages dialog box opens:Win9000 Processing <strong>and</strong> Display Software
8-14 SECTION 8 Generating Coded Messages10. Select the message group for which you want to generate the coded messages, <strong>and</strong>then click OK.The dialog box closes <strong>and</strong> the coded messages are generated.11. Repeat Steps 9 <strong>and</strong> 10 for each message group for which you want to generate orregenerate the coded messages.8.6 Automatically Transmitting Radioactivity DataBeta <strong>and</strong> gamma radioactivity data acquired with a Mark IIA DGPS with Radiation Sensor(LOS) MICROSONDE can be transmitted during a flight or transmited automatically atthe end of a flight. However, a message group with a data summary message must becreated first.To create a message group, automatically generate the coded messages, <strong>and</strong> transmit theradioactivity data at the end of a flight:1. On the Message Generation tab, click Create New Group. (See “Creating, Editing<strong>and</strong> Removing WMO <strong>and</strong> Military Message Groups” on page 8-1 for instructions onhow to open the Message Generation tab.)The Create New Coded Message Group dialog box opens:2. Enter "Radiation" or any other convenient name in the text box, <strong>and</strong> then click OK.The Create New Coded Message Group dialog box closes, <strong>and</strong> the group nameappears on the Message Generation tab as shown in Figure 8-9.3. Click the plus (+) sign next to the Summaries title. The plus sign turns into minus (-)sign <strong>and</strong> all of the available messages are listed.Operator’s ManualP/N 9017-205, Rev. C
Automatically Transmitting Radioactivity Data 8-15Create a newmessage group forthe radiation sensor.Add the St<strong>and</strong>ardIsobaric Surfacesmessage to thegroup.FIGURE 8-9: Creating a Message Group on the Message GenerationTab for Beta <strong>and</strong> Gamma Radioactivity Data4. Double-click the St<strong>and</strong>ard Isobaric Surfaces message.The message is added to the group <strong>and</strong> displayed to the right of the message list.5. Select the Use For Every Flight check box to create the group for every flight.6. Select the Automatically Generate check box if you want Win9000 to automaticallygenerate the coded messages when one of the events listed below the check boxoccurs. Clear the check box if you intend only to manually select when to generatethe coded messages. With the check box selected, you will still be able to manuallyselect when to generate the coded messages, overriding the automatic feature.7. Select the End of Flight option.8. Select the Automatically Transmit check box.9. Click OK to save the new message group <strong>and</strong> close the Win9000 SystemConfiguration dialog box.10. Verify the correct settings of the serial port or modem as described in “Selecting <strong>and</strong>Configuring the Serial Port or Modem” on page 8-6.The beta <strong>and</strong> gamma radioactivity data will be automatically transmitted at the end ofthe flight. The data format is the same as it would be for a St<strong>and</strong>ard Isobaric Surfacessummary, except that it includes two columns at the end, one for beta <strong>and</strong> one forgamma radioactivity data as shown below.Win9000 Processing <strong>and</strong> Display Software
8-16 SECTION 8 Generating Coded MessagesFlight ID: test1Date: 08-10-04 Time: 10:12:9Marion/WestRelease Point: 41.709N 70.773W 23 mSonde Serial Number 5006044Surface Data: 1014.9 mb 27.0 C 38%8.0 m/s @ 270 deg.Pressure Height Temp DP Dep. Humidity Direction Speed Beta Gamma(hPa) (meters) (deg C) (deg C) (%) (degrees) (knots) c/s uR/hr1000 152 24.2 19.5 29 275.9 13.0 0.9 17925 826 17.7 13.0 42 292.6 11.5 0.0 0850 1540 10.9 6.4 64 282.6 9.5 0.1 19700 3127 1.0 12.4 40 318.0 24.9 0.2 0500 5783 -10.1 29.9 7 298.7 36.4 1.2 26400 7454 -24.0 21.8 11 276.3 16.4 1.0 54To manually generate the coded messages <strong>and</strong> manually transmit the radioactivity data,see “Generating <strong>and</strong> Transmitting Coded Messages” on page 8-5.Operator’s ManualP/N 9017-205, Rev. C
9-1SECTION 9REAL-TIME SERIAL OUTPUT (RTSO)DATA FILE FORMATSThe real-time serial output (RTSO) is provided by the RTSO connector of thebreakout cable that connects to the Flight Controller Module. This connectorprovides an RS-232 serial output with the following configuration:Baud rate: 9600Data bits: 8Stop bits: 1Parity:NoneAn RTS file, a file of extension .rts, is automatically created by Win9000 which containsall of the data that are output on the RTSO connector during a flight. The file is saved inthe same folder as the flight file, a file of extension .w9k, along with additional files thatare transferred to the flight controller at the end of a flight. The folder is the one selected inthe Save Data To text box on the Flight Information tab of the Preflight Informationdialog box for the radiosonde type. To save <strong>and</strong> output the data in real time during a flight,you must select the Enable Real Time Serial Output check box on the System/Station tabof the Win9000 Configuration dialog box for the radiosonde type.This <strong>section</strong> provides information on the RTS file formats for the different radiosondetypes that are used with the W-9000 Meteorological Processing Systems.9.1 PVT W-9000 Real-Time Serial Output MessageFormatThe PVT W-9000 real-time serial output message format applies to the W-9000Meteorological Processing Systems that use the Mark II PVT (p/n 1548-720) radiosondetype.The following descriptions give the field number, description of item with units of item,what is given when this field is missing, <strong>and</strong> the start <strong>and</strong> stop byte for the data field. Eachone-second real-time serial record is made up of the following 28 fields of data:Field 1: Flight Time, seconds since <strong>launch</strong> was detectedThis field is never set to missing. Starts at byte 1, ends at byte 7.Field 2: Pressure, mbarsWhen missing, set to ‘////./’. Starts at byte 9, ends at byte 14.Win9000 Processing <strong>and</strong> Display Software
9-2 SECTION 9 Real-Time Serial Output (RTSO) Data File FormatsField 3: Temperature, °CWhen missing, set to ‘///./’. Starts at byte 16, ends at byte 20.Field 4: Relative Humidity, % relative humidityWhen missing, set to ‘///’. Starts at byte 22, ends at byte 24.Field 5: Geopotential Height, metersWhen missing, set to ‘/////’. Starts at byte 26, ends at byte 30.Field 6: Dewpoint, °CWhen missing, set to ‘///./’. Starts at byte 32, ends at byte 36.Field 7: Refractive Index, N UnitsWhen missing, set to ‘///./’. Starts at byte 38, ends at byte 42.Field 8: Gradient Refractive Index, N / kmWhen missing, set to ‘/////./’. Starts at byte 44, ends at byte 50.Field 9: Modified Refractive Index, M UnitsWhen missing, set to ‘////./’. Starts at byte 52, ends at byte 57.Field 10: Speed of Sound, m/sWhen missing, set to ‘///./’. Starts at byte 59, ends at byte 63.Field 11: Air Density, grams per cubic meterWhen missing, set to ‘////./’. Starts at byte 65, ends at byte 70.Field 12: Vapor Pressure, mbarsWhen missing, set to ‘//./’. Starts at byte 72, ends at byte 75.Field 13: Potential Temperature, °CWhen missing, set to ‘////./’. Starts at byte 77, ends at byte 82.Field 14: Virtual Temperature, °CWhen missing, set to ‘///./’. Starts at byte 84, ends at byte 88.Field 15: Specific Humidity, grams per kilogramWhen missing, set to ‘//.//’. Starts at byte 90, ends at byte 94.Field 16: Spare 1When missing, set to ‘/////.//’. Starts at byte 96, ends at byte 103.Field 17: Spare 2When missing, set to ‘/////.//’. Starts at byte 105, ends at byte 112.Field 18: Spare 3When missing, set to ‘/////.//’. Starts at byte 114, ends at byte 121.Field 19: Spare 4When missing, set to ‘/////.//’. Starts at byte 123, ends at byte 130.Operator’s ManualP/N 9017-205, Rev. C
GPS W-9000 Real-Time Serial Output Message Format 9-3Field 20: UTC Time, secondsUTC time never set to missing. Starts at byte 132, ends at byte 138.Field 21: Wind Speed, m/sWhen missing, set to ‘///./’. Starts at byte 140, ends at byte 144.Field 22: Wind Direction, degrees azimuthWhen missing, set to ‘///’. Starts at byte 146, ends at byte 149.Field 23: North/South Wind Component, Unfiltered wind component, m/sAlways set to missing, ‘////./’. Starts at byte 151, ends at byte 156.Field 24: East/West Wind Component, Unfiltered wind component, m/sAlways set to missing, ‘////./’. Starts at byte 158, ends at byte 163.Field 25: Vertical Wind Component, Unfiltered wind component, m/sAlways set to missing, ‘////./’. Starts at byte 165, ends at byte 170.Field 26: Longitude, decimal degreesWhen missing, set to ‘////./////’. Starts at byte 172, ends at byte 181.Field 27: Latitude, decimal degreesWhen missing, set to ‘///./////’. Starts at byte 183, ends at byte 191.Field 28: Geometric Height, metersWhen missing, set to ‘/////./’. Starts at byte 193, ends at byte 199.9.2 GPS W-9000 Real-Time Serial Output MessageFormatThe GPS W-9000 real-time serial output message format applies to the W-9000Meteorological Processing Systems that use the following radiosonde types:• Mark II DGPS (LOS), (p/n 1548-611)• Mark II DGPS with Pressure Capsule (LOS-B), (p/n 1548-617)• Mark IIA DGPS (LOS), (p/n 1648-611)• Mark IIA DGPS with Pressure Capsule (LOS-B), (p/n 1648-617)The following descriptions give the field number, description of item with units of item,what is given when this field is missing, <strong>and</strong> the start <strong>and</strong> stop byte for the data field. Eachone-second real-time serial record is made up of the following 28 fields of data:Field 1: Flight Time, seconds since <strong>launch</strong> was detectedThis field is never set to missing. Starts at byte 1, ends at byte 7.Field 2: Pressure, mbarsWhen missing, set to ‘////./’. Starts at byte 9, ends at byte 14.Win9000 Processing <strong>and</strong> Display Software
9-4 SECTION 9 Real-Time Serial Output (RTSO) Data File FormatsField 3: Temperature, °CWhen missing, set to ‘///./’. Starts at byte 16, ends at byte 20.Field 4: Relative Humidity, % relative humidityWhen missing, set to ‘///’. Starts at byte 22, ends at byte 24.Field 5: Geopotential Height, metersWhen missing, set to ‘/////’. Starts at byte 26, ends at byte 30.Field 6: Dewpoint, °CWhen missing, set to ‘///./’. Starts at byte 32, ends at byte 36.Field 7: Refractive Index, N UnitsWhen missing, set to ‘///./’. Starts at byte 38, ends at byte 42.Field 8: Gradient Refractive Index, N / kmWhen missing, set to ‘/////./’. Starts at byte 44, ends at byte 50.Field 9: Modified Refractive Index, M UnitsWhen missing, set to ‘////./’. Starts at byte 52, ends at byte 57.Field 10: Speed of Sound, m/sWhen missing, set to ‘///./’. Starts at byte 59, ends at byte 63.Field 11: Air Density, grams per cubic meterWhen missing, set to ‘////./’. Starts at byte 65, ends at byte 70.Field 12: Vapor Pressure, mbarsWhen missing, set to ‘//./’. Starts at byte 72, ends at byte 75.Field 13: Potential Temperature, °CWhen missing, set to ‘////./’. Starts at byte 77, ends at byte 82.Field 14: Virtual Temperature, °CWhen missing, set to ‘///./’. Starts at byte 84, ends at byte 88.Field 15: Specific Humidity, grams per kilogramWhen missing, set to ‘//.//’. Starts at byte 90, ends at byte 94.Field 16: Spare 1When missing, set to ‘/////.//’. Starts at byte 96, ends at byte 103.Field 17: Spare 2When missing, set to ‘/////.//’. Starts at byte 105, ends at byte 112.Field 18: Spare 3When missing, set to ‘/////.//’. Starts at byte 114, ends at byte 121.Field 19: Spare 4When missing, set to ‘/////.//’. Starts at byte 123, ends at byte 130.Operator’s ManualP/N 9017-205, Rev. C
Loran Real-Time Serial Output Message Format 9-5Field 20: UTC Time, secondsUTC time never set to missing. Starts at byte 132, ends at byte 138.Field 21: Wind Speed, m/sWhen missing, set to ‘///./’. Starts at byte 140, ends at byte 144.Field 22: Wind Direction, degrees azimuthWhen missing, set to ‘///’. Starts at byte 146, ends at byte 149.Field 23: North/South Wind Component, Unfiltered wind component, m/sWhen missing, set to ‘////./’. Starts at byte 151, ends at byte 156.Field 24: East/West Wind Component, Unfiltered wind component, m/sWhen missing, set to ‘////./’. Starts at byte 158, ends at byte 163.Field 25: Vertical Wind Component, Unfiltered wind component, m/sWhen missing, set to ‘////./’. Starts at byte 165, ends at byte 170.Field 26: Longitude, decimal degreesWhen missing, set to ‘////./////’. Starts at byte 172, ends at byte 181.Field 27: Latitude, decimal degreesWhen missing, set to ‘///./////’. Starts at byte 183, ends at byte 191.Field 28: Geometric Height, metersWhen missing, set to ‘/////./’. Starts at byte 193, ends at byte 199.9.3 Loran Real-Time Serial Output Message FormatThe Loran real-time serial output message format applies to the W-9000 MeteorologicalProcessing Systems that use the Mark II Loran (p/n 1543-611) radiosonde type.The following descriptions give the field number, description of item with units of item,what is given when this field is missing, <strong>and</strong> the start <strong>and</strong> stop byte for the data field. Each1.2-second real-time serial record is made up of the following 19 fields of data:Field 1: Flight Time, seconds since <strong>launch</strong> was detectedThis field is never set to missing. Starts at byte 1, ends at byte 7.Field 2: Pressure, mbarsWhen missing, set to ‘////./’. Starts at byte 9, ends at byte 14.Field 3: Temperature, °CWhen missing, set to ‘///./’. Starts at byte 16, ends at byte 20.Field 4: Relative Humidity, % relative humidityWhen missing, set to ‘///’. Starts at byte 22, ends at byte 24.Field 5: Geopotential Height, metersWhen missing, set to ‘/////’. Starts at byte 26, ends at byte 30.Win9000 Processing <strong>and</strong> Display Software
9-6 SECTION 9 Real-Time Serial Output (RTSO) Data File FormatsField 6: Dewpoint, °CWhen missing, set to ‘///./’. Starts at byte 32, ends at byte 36.Field 7: Refractive Index, N UnitsWhen missing, set to ‘///./’. Starts at byte 38, ends at byte 42.Field 8: Gradient Refractive Index, N / kmWhen missing, set to ‘/////./’. Starts at byte 44, ends at byte 50.Field 9: Modified Refractive Index, M UnitsWhen missing, set to ‘////./’. Starts at byte 52, ends at byte 57.Field 10: Speed of Sound, m/sWhen missing, set to ‘///./’. Starts at byte 59, ends at byte 63.Field 11: Air Density, grams per cubic meterWhen missing, set to ‘////./’. Starts at byte 65, ends at byte 70.Field 12: Vapor Pressure, mbarsWhen missing, set to ‘//./’. Starts at byte 72, ends at byte 75.Field 13: Potential Temperature, °CWhen missing, set to ‘////./’. Starts at byte 77, ends at byte 82.Field 14: Virtual Temperature, °CWhen missing, set to ‘///./’. Starts at byte 84, ends at byte 88.Field 15: Specific Humidity, grams per kilogramWhen missing, set to ‘//.//’. Starts at byte 90, ends at byte 94.Field 16: Spare 1When missing, set to ‘/////.//’. Starts at byte 96, ends at byte 103.Field 17: Spare 2When missing, set to ‘/////.//’. Starts at byte 105, ends at byte 112.Field 18: Spare 3When missing, set to ‘/////.//’. Starts at byte 114, ends at byte 121.Field 19: Spare 4When missing, set to ‘/////.//’. Starts at byte 123, ends at byte 130.Operator’s ManualP/N 9017-205, Rev. C