Fleet Electrification Roadmap
Fleet Electrification Roadmap
Fleet Electrification Roadmap
- No tags were found...

You also want an ePaper? Increase the reach of your titles
YUMPU automatically turns print PDFs into web optimized ePapers that Google loves.
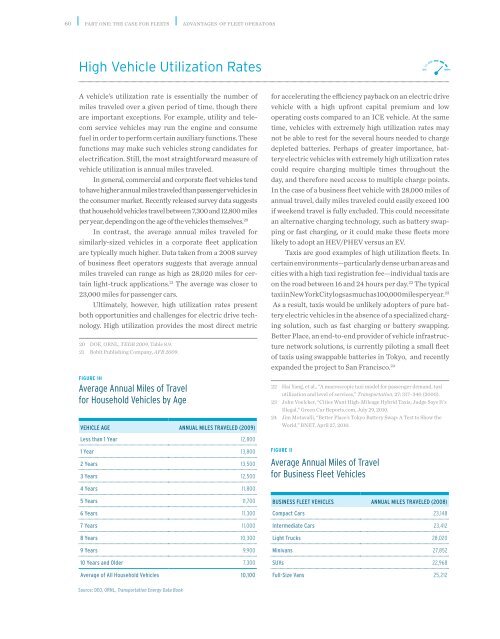
60 part one: the case for fleets advantages of fleet operatorsfleet electrification roadmap 61High Vehicle Utilization RatesA vehicle’s utilization rate is essentially the number ofmiles traveled over a given period of time, though thereare important exceptions. For example, utility and telecomservice vehicles may run the engine and consumefuel in order to perform certain auxiliary functions. Thesefunctions may make such vehicles strong candidates forelectrification. Still, the most straightforward measure ofvehicle utilization is annual miles traveled.In general, commercial and corporate fleet vehicles tendto have higher annual miles traveled than passenger vehicles inthe consumer market. Recently released survey data suggeststhat household vehicles travel between 7,300 and 12,800 milesper year, depending on the age of the vehicles themselves. 20In contrast, the average annual miles traveled forsimilarly-sized vehicles in a corporate fleet applicationare typically much higher. Data taken from a 2008 surveyof business fleet operators suggests that average annualmiles traveled can range as high as 28,020 miles for certainlight-truck applications. 21 The average was closer to23,000 miles for passenger cars.Ultimately, however, high utilization rates presentboth opportunities and challenges for electric drive technology.High utilization provides the most direct metric20 DOE, ORNL, TEDB 2009, Table 8.9.21 Bobit Publishing Company, AFB 2009.FIGURE 1HAverage Annual Miles of Travelfor Household Vehicles by AgeVEHICLE AGE ANNUAL MILES TRAVELED (2009)Less than 1 Year 12,800for accelerating the efficiency payback on an electric drivevehicle with a high upfront capital premium and lowoperating costs compared to an ICE vehicle. At the sametime, vehicles with extremely high utilization rates maynot be able to rest for the several hours needed to chargedepleted batteries. Perhaps of greater importance, batteryelectric vehicles with extremely high utilization ratescould require charging multiple times throughout theday, and therefore need access to multiple charge points.In the case of a business fleet vehicle with 28,000 miles ofannual travel, daily miles traveled could easily exceed 100if weekend travel is fully excluded. This could necessitatean alternative charging technology, such as battery swappingor fast charging, or it could make these fleets morelikely to adopt an HEV/PHEV versus an EV.Taxis are good examples of high utilization fleets. Incertain environments—particularly dense urban areas andcities with a high taxi registration fee—individual taxis areon the road between 16 and 24 hours per day. 22 The typicaltaxi in New York City logs as much as 100,000 miles per year. 23As a result, taxis would be unlikely adopters of pure batteryelectric vehicles in the absence of a specialized chargingsolution, such as fast charging or battery swapping.Better Place, an end-to-end provider of vehicle infrastructurenetwork solutions, is currently piloting a small fleetof taxis using swappable batteries in Tokyo, and recentlyexpanded the project to San Francisco. 2422 Hai Yang, et al., “A macroscopic taxi model for passenger demand, taxiutilization and level of services,” Transportation, 27: 317–340 (2000).23 John Voelcker, “Cities Want High-Mileage Hybrid Taxis; Judge Says It'sIllegal,” Green Car Reports.com, July 29, 2010.24 Jim Motavalli, “Better Place’s Tokyo Battery Swap: A Test to Show theWorld,” BNET, April 27, 2010.0%100%Some rental and car share companies also targetextremely high utilization rates. In the case of car sharing,it is typically optimal to minimize vehicle downtimethroughout the day, which would allow only for a shortcharge period overnight. Daytime car sharing customersmay not mind a quick stop at the gas station, but theywill be unwilling to charge a vehicle for the several hoursrequired by Level II electric vehicle supply equipment(EVSE). Here again, access to fast charge or battery swapwould be needed. In addition, car sharing companiesreport that they would need the ability to remotely monitorbattery state of charge in order to consider EVs andPHEVs, a capability not yet embraced by vehicle OEMs. 25Vehicle Replacement CycleVehicle utilization and other factors ultimately feed intothe rate at which a fleet replaces its vehicles. In general,fleets that have high utilization rates tend to have higherreplacement cycles, though there are important exceptions.For example, a company or institution that owns itsfleet vehicles may choose to hold on to them for the full lifeof the vehicle, 10 years or more, regardless of utilization.This could be advantageous if the vehicle is highly specializedand unlikely to be prominent in the marketplace.Nonetheless, highly utilized vehicles tend to approachservice milestones more quickly and operators often preferto sell these vehicles before incurring those costs.<strong>Fleet</strong> survey data suggests that average months inservice for light-duty vehicles in a corporate fleet applicationare far below the norms for consumer vehicles ( justas utilization rates are far higher). In 2008, the medianconsumer vehicle lifespan was 9.4 years for an automobileand 7.5 years for a light truck. 26 In contrast, compact cars25 EC, PRTM interviews.26 DOE, ORNL, TEDB 2008, Table 3.9.averaged three years in service in business fleet applicationswhile intermediate cars averaged 2.4 years. 27 Lighttrucks averaged slightly higher at 4.25 years. 28Conditions in the broader economy can have asignificant impact on the average age of fleet vehicles.During the 2007-2009 recession, the average endingmonths in service of fleet vehicles in operation increasedby as much as 10 percent in certain asset classes. 29Operators that owned their vehicles strenuously avoidedcapital expenditures that could be postponed throughincreased maintenance. With vehicle resale values at lowlevels, operators in commercial lease agreements simplyheld onto vehicles for longer periods.One potential benefit of a shorter replacement cycleis the ability of fleet managers to maintain access to up-todatetechnology. In the passenger market, consumers thathold onto vehicles for an average of seven to 10 years couldend up driving vehicles based on obsolete battery technology.This is exacerbated by the length of vehicle warranties,which are currently centered on eight to 10 years and 100,000miles or more. 30 Some OEMs may establish business modelsthat allow for battery upgrades over time, but this has notoccurred yet. In the fleet market, an operator cycling throughvehicles every four years will likely have rolling access to thebest batteries.Rental companies are an example of a fleet industrysegment that tends to have high turnover rates, making ita potentially attractive option for accelerating the deploymentof electric drive technologies. Because the averagerental fleet acquires new vehicles as often as every six to 10months, the opportunity may exist to establish a pipelineof frequent orders for electric drive vehicles.27 DOE, ORNL, TEDB 2009, Table 7.2.28 Id.29 GE Capital, <strong>Fleet</strong> Services.30 Scott Doggett, “Nissan Leaf Battery Warranty Same as Chevy Volt's - 8Years or 100,000 Miles,” Edmunds.com, July 27, 2010.1 Year 13,8002 Years 13,5003 Years 12,500FIGURE 1IAverage Annual Miles of Travelfor Business <strong>Fleet</strong> VehiclesFIGURE 1JAverage Cycle, <strong>Fleet</strong> Cars and Light Trucks50 Months in ServiceFIGURE 1KAverage Ending Months in Service, Business <strong>Fleet</strong> Vehicles4 Years 11,8005 Years 11,7006 Years 11,300BUSINESS FLEET VEHICLES ANNUAL MILES TRAVELED (2008)Compact Cars 23,148484645.64646.845.2VEHICLE TYPEAVERAGE MONTHS IN SERVICECompact Cars 367 Years 11,0008 Years 10,300Intermediate Cars 23,412Light Trucks 28,0204442.6Intermediate Cars 29Light Trucks 519 Years 9,900Minivans 27,85242Minivans 3610 Years and Older 7,300Average of All Household Vehicles 10,100SUVs 22,968Full-Size Vans 25,21240Q1 2009Q2 2009Q3 2009Q4 2009Q1 2010SUVs 29Full-Size Vans 56Source: DEO, ORNL, Transportation Energy Data BookSource: Bobit Publishing Company