Fleet Electrification Roadmap
Fleet Electrification Roadmap
Fleet Electrification Roadmap
- No tags were found...

Create successful ePaper yourself
Turn your PDF publications into a flip-book with our unique Google optimized e-Paper software.
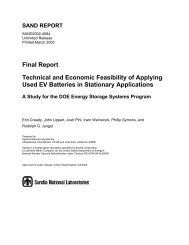
26 primer: electrification of the transportation sectorspecial sectionspecial sectionfleet electrification roadmap 27National Security CostsThe importance of oil has given it a place of prominencein foreign and military policy. In particular, two keyissues related to oil affect national security. First, the vulnerabilityof global oil supply lines and infrastructure hasdriven the United States to accept the burden of securingthe world’s oil supply. Second, the importance of largeindividual oil producers constrains U.S. foreign policyoptions when dealing with problems in these nations.A crippling disruption to global oil supplies ranksamong the most immediate threats to the United Statestoday. A prolonged interruption due to war in the MiddleEast or the closure of a key oil transit route would lead tosevere economic dislocation. U.S. leaders have recognizedthis for decades, and have made it a matter of stated policythat the United States will protect the free flow of oil withmilitary force. 34 Still, policy alone has consistently fallenshort of complete deterrence, and the risk of oil supplyinterruptions has persisted for nearly 40 years.To mitigate this risk, U.S. armed forces expend enormousresources protecting chronically vulnerable infra-34 RAND Corporation, “Imported Oil and U.S. National Security,” at60-62 (2009).structure in hostile corners of the globe and patrolling oiltransit routes. This engagement benefits all nations, butcomes primarily at the expense of the American militaryand ultimately the American taxpayer. A 2009 study bythe RAND Corporation placed the ongoing cost of thisburden at between $67.5 billion and $83 billion annually,plus an additional $8 billion in military operations. 35 Inproportional terms, these costs suggest that between 12and 15 percent of the current defense budget is devotedto guaranteeing the free flow of oil.Foreign policy constraints related to oil dependenceare less quantifiable, but no less damaging. Whether dealingwith uranium enrichment in Iran, a hostile regime inVenezuela, or an increasingly assertive Russia, Americandiplomacy is distorted by our need to minimize disruptionsto the flow of oil. Perhaps more frustrating, theimportance of oil to the broader global economy hasmade it nearly impossible for the United States to buildinternational consensus on a wide range of foreign policyand humanitarian issues.35 Id., at 71.FIGURE P9Global Map of Major U.S. Petroleum Imports (Million tonnes)Environmental SustainabilityThe environmental externalities of oil production andconsumption are increasingly coming into focus. Total U.S.energy-related CO 2 emissions were 5,405 million metrictons in 2009. 36 Emissions from the combustion of petroleumaccounted for 43 percent of the total, representing asignificantly larger share than emissions from coal use. 37From a sectoral perspective, electric power representsthe largest source of energy-related CO 2 emissions,accounting for 2,152 million metric tons in 2009. 38 Coalemissions make up more than 80 percent of the totalU.S. power emissions profile. 39 However, these figuresrepresent upstream emissions that result from economywideusage of electricity. In order to assess the impact ofenergy consumption of different sectors of the economy,it is also useful to consider emissions from the primaryend-use sectors reported by the Department of Energy:the industrial, commercial, residential, and transportationsectors. End-use figures incorporate the full consumptionof energy by a sector, including electricity andother energy forms.From an end-use perspective, the transportationsector is the single largest source of U.S. CO 2 emissions,having surpassed industrial emissions in 1999. 40 Total36 DOE, AER 2009, Table 12.1.37 DOE, AER 2009, Table 12.2.38 Id.39 Id.40 Id. Table 12.3.CO 2 emissions from transportation were 1,851 millionmetric tons in 2009, and 98 percent of these emissionswere from petroleum consumption. 41 In 2009, consumptionof petroleum in the transportation sector accountedfor more U.S. energy-related CO 2 emissions than the consumptionof coal for electric power production. 42International consensus is increasingly focused onreaching atmospheric greenhouse gas concentrations of 450parts per millionby mid-centuryin order to avoidthe most severeimpacts of climatechange. Thisscenario would require energy-related CO 2 emissions to bereduced by 40 percent from 2006 levels in developed countrieswhile other major economies limit their growth to 20percent. These reductions would require significant replacementof petroleum transportation fuels.In addition to negative externalities associatedwith the consumption of petroleum, the consequencesof petroleum production were also highlighted in 2010.On April 20, 2010, an oil and gas exploration rig in theGulf of Mexico experienced a catastrophic blowout,resulting in an explosion and fire. Two days later, the41 Id.42 Id. Tables 12.2 and 12.3.2009 energy-related CO 2emissions attributed to43% petroleum.CANADA 121.7EUROPE 36.2FSU 28.7MEXICO 61.2NORTH AFRICA 28.2WEST AFRICA 79.2MIDDLE EAST 86.9SOUTH AMERICA 115.7Source: BP, plc, Statistical Review of World Energy 2010, at 21Traffic on Interstate-35E and Dallas Skyline.