Fleet Electrification Roadmap
Fleet Electrification Roadmap
Fleet Electrification Roadmap
- No tags were found...

You also want an ePaper? Increase the reach of your titles
YUMPU automatically turns print PDFs into web optimized ePapers that Google loves.
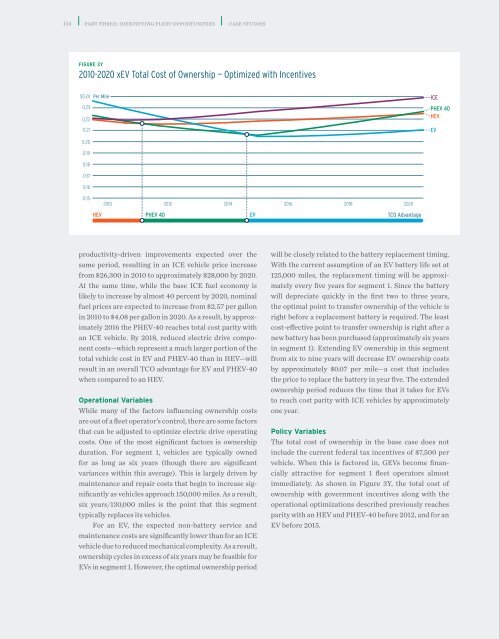
114 part three: identifying fleet opportunities case studiesfleet electrification roadmap 115FIGURE 3Y2010-2020 xEV Total Cost of Ownership — Optimized with Incentives$0.24 Per Mile0.230.220.210.200.190.180.170.160.15201020122014HEV PHEV 40 EV TCO Advantage201620182020ICEPHEV 40HEVEVCASE STUDY / SEGMENT 3ALight Sales, Service, Utility, Short HaulSegment 3a vehicles—light sales, service, utility, and short-haul trucks—are typicallypooled vehicles operated by sales people, service employees, utility employees, andshort-haul delivery company employees. Their average daily driving distance is 75miles and they tend to stay within a consistent distance from the depot at whichthey are left overnight. The consistency of the routes varies between applicationswithin segment 3a. It can be very consistent in segments such as short haul andhighly variable in segments such as utility.productivity-driven improvements expected over thesame period, resulting in an ICE vehicle price increasefrom $26,300 in 2010 to approximately $28,000 by 2020.At the same time, while the base ICE fuel economy islikely to increase by almost 40 percent by 2020, nominalfuel prices are expected to increase from $2.57 per gallonin 2010 to $4.08 per gallon in 2020. As a result, by approximately2016 the PHEV-40 reaches total cost parity withan ICE vehicle. By 2018, reduced electric drive componentcosts—which represent a much larger portion of thetotal vehicle cost in EV and PHEV-40 than in HEV—willresult in an overall TCO advantage for EV and PHEV-40when compared to an HEV.Operational VariablesWhile many of the factors influencing ownership costsare out of a fleet operator’s control, there are some factorsthat can be adjusted to optimize electric drive operatingcosts. One of the most significant factors is ownershipduration. For segment 1, vehicles are typically ownedfor as long as six years (though there are significantvariances within this average). This is largely driven bymaintenance and repair costs that begin to increase significantlyas vehicles approach 150,000 miles. As a result,six years/130,000 miles is the point that this segmenttypically replaces its vehicles.For an EV, the expected non-battery service andmaintenance costs are significantly lower than for an ICEvehicle due to reduced mechanical complexity. As a result,ownership cycles in excess of six years may be feasible forEVs in segment 1. However, the optimal ownership periodwill be closely related to the battery replacement timing.With the current assumption of an EV battery life set at125,000 miles, the replacement timing will be approximatelyevery five years for segment 1. Since the batterywill depreciate quickly in the first two to three years,the optimal point to transfer ownership of the vehicle isright before a replacement battery is required. The leastcost-effective point to transfer ownership is right after anew battery has been purchased (approximately six yearsin segment 1). Extending EV ownership in this segmentfrom six to nine years will decrease EV ownership costsby approximately $0.07 per mile—a cost that includesthe price to replace the battery in year five. The extendedownership period reduces the time that it takes for EVsto reach cost parity with ICE vehicles by approximatelyone year.Policy VariablesThe total cost of ownership in the base case does notinclude the current federal tax incentives of $7,500 pervehicle. When this is factored in, GEVs become financiallyattractive for segment 1 fleet operators almostimmediately. As shown in Figure 3Y, the total cost ofownership with government incentives along with theoperational optimizations described previously reachesparity with an HEV and PHEV-40 before 2012, and for anEV before 2015.VEHICLE CHARACTERISTICSClass 1-2 TruckTypical Dimensions:74" x 205" x 80" (WxLxH)OPERATIONAL SPECIFICATIONS75 miAt 75 miles, the average daily distance traveled by thissegment is conducive to EV-100 use. It is also high enoughto drive a relatively fast payback on upfront costs. Theassumed utility factor for PHEV-40s is 48 percent.INFRASTRUCTURE TOPOLOGYService AreaChargeDepletingRangeAverage DistanceSegment TravelsEach Day7 YearsAverageOwnershipDurationAt seven years, the average ownership durationfor this segment would likely necessitate batteryreplacement. The timing of battery replacement canhave a significant impact on TCO.$3,400Typical Cargo Volume:60 ft 3Gross Vehicle Weight:6,000–10,000 lbs.Extended Cab Capacity:5 PassengersInfrastructureCost PerVehicleThe 2010 charging infrastructure cost for segment3a vehicles is $3,400, assuming predominantly LevelII charging. By 2020, the cost is expected to fall to$2,400 per vehicle.Central DepotThe vehicles are returned to a central depot at the end of each daywhere they can be charged overnight. The vast majority of the chargingrequirements for these vehicles are likely to be supported by overnightLevel II charging. Daytime charging away from the depot is rarelyrequired as these vehicles will not typically travel further than the CDrange of an EV-100.Central Charger Depot BankFast ChargerHome ChargerPublic Charger