Fleet Electrification Roadmap
Fleet Electrification Roadmap
Fleet Electrification Roadmap
- No tags were found...

You also want an ePaper? Increase the reach of your titles
YUMPU automatically turns print PDFs into web optimized ePapers that Google loves.
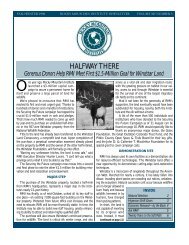
104 part three: identifying fleet opportunities modeling assumptionsfleet electrification roadmap 105FIGURE 3LMaintenance and Repair Costs - ICE VehiclesFIGURE 3NVehicle Depreciation Schedule$0.70 Per Mile100% of Original Value0.600.50Class 6-7 (2)9080700.400.30Class 4-5 (2)6050400.200.100Year 1Year 2Year 3Year 4Year 5Year 6Year 7Year 8Year 9Year 10Class 3 (1)Class 1-2 (1)Auto (1)30201001 2345678910 YearsAnnual MilesTraveled inIncrementsof 5,000(5K-100K)Source: (1) Auto <strong>Fleet</strong>, GE Capital, Utilimarc, and PRTM Analysis (2) Utilimarc and PRTM AnalysisSource: PRTM AnalysisOwnership ModelWhile different vehicle ownership models can have asignificant impact on a given institution’s ability to adoptelectric drive vehicles, the benefits of alternative financingmethods do not factor into the TCO calculation. 4 Leasing avehicle may minimize upfront capital costs associated withvehicle acquisition, but the lifecycle total cost of ownershipon a per mile basis should be equal to or more than the TCOfor a vehicle that is owned outright. Therefore, a simplifyingassumption that a company’s capital costs equal financingcosts is made in the model. A financing rate of 6 percentis the assumed cost of capital in the model.Residual Value<strong>Fleet</strong> owners in different industry segments—and acrossdifferent companies within an industry segment—hold4 In a number of states, sales taxes can be paid prorated per year of usage,deferring tax obligations. However, this as well as any additional interesttax shields are not considered by the model.FIGURE 3M% Improvement over ICE Maintenance & Repair Costson to their vehicles for varying lengths of time. The lengthof time that vehicles are owned and the ending mileagelargely determine the remaining value of the vehicle. Inessence, this residual value is a negative cost or a creditfor the capital that is not consumed during the operationof the vehicle. For fleet operators that tend to hold on totheir vehicles for shorter timeframes, the residual valueof their assets is a larger, more significant component ofthe total cost of ownership. For ICE vehicles, this residualvalue is easily attainable, as there are a number of wellestablishedprecedents and a liquid and efficient marketto price them. <strong>Fleet</strong> owners can analyze the trade-offsbetween selling their vehicles at their current residualvalue against maintaining them for longer periods basedon expected maintenance costs, prices of new vehicles,availability of capital, vehicle demand, and softer factorssuch as image and brand.Electric drive vehicles—particularly EVs andPHEVs—pose a new challenge because their residualvalue is not well known. For this reason, this analysisCOST COMPONENT HEV PHEV-40 EV-100Oil 5% 50% 100%Scheduled Maintenance 3% 10% 20%Repairs 4% 15% 30%Source: GE Capital data and PRTM estimatestreats the residual value calculation for the vehicle andthe battery separately.Vehicle Depreciation RatesThe rate of depreciation is the decline in value associatedwith an asset over a given period of time. It is important torealize that the depreciated financial value of an asset atany point in time may be significantly different than theremaining technical capacity. For example, the assessedmarket value of an internal combustion engine vehicleafter 10 years and 100,000 miles may be a small fraction ofthe initial purchase price despite the fact that the vehiclemay have the technical capacity to operate for another100,000 miles.The standard depreciation curve for an internalcombustion engine vehicle is therefore characterized bya steep decline in the initial period after ownership withthe rate of decline slowing over time. The starting pointfor the depreciation curve may vary based on the cumulativenumber of miles traveled by the vehicle. Figure 3Mpresents a standard set of depreciation curves for an ICEvehicle used in this analysis. The depreciation curvesinclude a time and distance factor to account for differentusage scenarios.This analysis assumes a depreciation curve for electricdrive vehicles—excluding the battery—in the sameway that a traditional ICE vehicle’s depreciation valuesmight be calculated. If a separate depreciation schedulewere calculated for electric drive vehicles, one mightexpect electric drive components to generate a higherresidual value than their ICE counterparts, as they willtend to incur lower maintenance and repair expensesand, in all likelihood, an increased asset life. However,there is simply not enough market experience dealingwith remarketed electric drive vehicles to confidentlyplot a separate deprecation schedule for these vehicles.The residual value of electric drive vehicles is generallyuncertain today.Battery DepreciationThe principal driving factor behind uncertainty in electricdrive residual value is the battery. Electric drivebatteries—particularly for PHEVs and EVs—constitute asignificant proportion of the vehicle’s upfront cost, so thetotal cost of ownership calculation is highly sensitive tothe residual value of the battery. Ideally, this value wouldbe determined by the number of cycles left in the batteryat the end of the vehicle’s useful life. However, significantuncertainties remain (as discussed in Part Two).The residual value of used PHEV and EV batterieswill be determined by the net residual capacity (the sumof each remaining cycle’s capacity) multiplied by thevalue of that capacity. For the purposes of this analysis,it was conservatively assumed that GEV batteries declinein value in a fashion similar to vehicles themselves (i.e.the curve shape in Figure 3M.) Residual value exceedsthe financial depreciated value but falls below the cost ofcomparable new battery. For cases in which ownership ofthe vehicle outlasts the useful battery life, it is assumedthat a replacement battery with a lower useful life wouldbe purchased at a discounted price to the original battery.