Fleet Electrification Roadmap
Fleet Electrification Roadmap
Fleet Electrification Roadmap
- No tags were found...

Create successful ePaper yourself
Turn your PDF publications into a flip-book with our unique Google optimized e-Paper software.
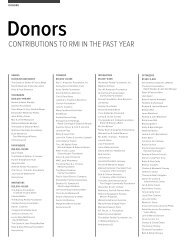
8 executive summaryfleet electrification roadmap 9EXECUTIVE SUMMARYBetween 2003 and 2009, the global oil market witnessed itsmost significant period of volatility in nearly a generation.After relentlessly increasing for five years, oil prices spikedFIGURE E1Net U.S. Government Debt as a Percentage of GDP100% Debt Percent of GDP WTI, $/BBL (real $) 1008060Net Government DebtSpot WTI8060to historical highs of more than $147 per barrel in July 2008. 1Not by coincidence, the home mortgage and global financialcrises erupted just a few months later, plunging the U.S.economy into its most severe recession since World WarTwo. After retreating to less than $40 per barrel in early2009, oil prices have now averaged more than $70 perbarrel throughout 2010. 2402001990Source: DOE; IMF19952000Highly volatile oil prices have been the most persistentstructural risk to the U.S. economy for decades. Theboom and bust cycle of oil prices that has been in placesince 2003—and a number of other times since 1970—contributes to a high degree of uncertainty throughoutthe economy, resulting in reduced economic activity,higher unemployment, and expansion of publicdebt. When global oil market dynamics generate priceshocks, the result has often been a recession followedby heavy government spending.The macroeconomic significance of oil price shocksis a function of the prominent role of oil in the U.S.economy. Petroleum accounts for nearly 40 percent ofU.S. primary energy needs, more than any other fuel.123In 2008, as oil prices reached inflation-adjusted all-timehighs, American consumers and businesses spent morethan $900 billion on retail petroleum-based fuels—6.4percent of GDP. 4 While 2008 represents an exceptionalyear, economy-wide spending on petroleum fuels hasaveraged more than 5 percent of GDP since 2005, andhousehold spending on gasoline has exceeded 10 percentof median income in some regions of the United States. 5More than 70 percent of the oil we use is for transportationfuels. 6 At approximately 14 million barrels perday, the U.S. transport sector alone consumes more oil1 U.S. Department of Energy (DOE), Energy Information Administration(EIA), Petroleum Navigator, Monthly Crude Oil Spot Prices, available athttp://www.eia.gov/dnav/pet/pet_pri_spt_s1_m.htm.2 Id.3 BP, plc, Statistical Review of World Energy 2010, at 41.4 EC analysis based on DOE, Annual Energy Review 2009 (AER 2009),Table 3.5.5 Id.6 DOE, AER 2009, Tables 5.13a through 5.13d.2005than any other national economy in the world. 7 Highwaytransportation—passenger vehicles, freight trucks, andbuses—accounts for the largest share, more than 11 millionbarrels per day. 8 With no substitutes available atscale, petroleum provides 94 percent of the energy usedin transportation. 9 In short, oil powers the mobility thatis central to American prosperity and the American wayof life.This excessive reliance on a single fuel to power akey component of our economy has left the United Stateshostage to a global oil market that is likely to becomeincreasingly volatile. Rising demand for mobility inemerging market economies is driving a steady increasein global oil consumption, despite efficiency improvementsin advanced economies. Between 2008 and 2030,increased oil consumption in the transportation sectorsof China, India, and the Middle East region is expectedto account for 70 percent of the total 15 million barrelper day increase in global oil consumption. 10 Burgeoningmiddle classes and higher standards of living in theseregions will place consistent pressure on global oil suppliersto expand capacity. In the meantime, resourcenationalism, political instability, and insufficientupstream investment in many oil producing regions arecontinuing to constrain growth in oil supplies. While oilmarkets are certainly well supplied today, perhaps the7 DOE, AER 2009, Tables 5.13a through 5.13d; BP, plc, Statistical Review ofWorld Energy 2010, at 11, 12.8 DOE, Office of Energy Efficiency and Renewable Energy (EERE) ,Transportation Energy Data Book 2010, Table 1.14.9 DOE, AER 2009, Table 2.1e.10 International Energy Agency, World Energy Outlook 2010, Annex A, NewPolicies Scenario.2010201540200