View - ResearchGate
View - ResearchGate View - ResearchGate
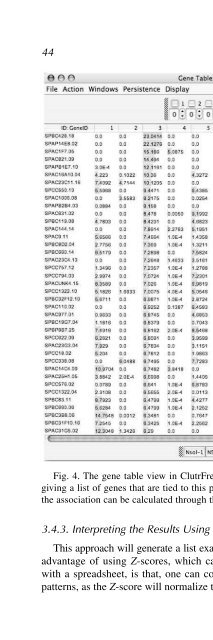
44 Wang and OchsFig. 4. The gene table view in ClutrFree. The table has been sorted by Pattern 3,giving a list of genes that are tied to this pattern strongly. A more formal measure ofthe association can be calculated through the Z-score as described in the text.3.4.3. Interpreting the Results Using Z-ScoresThis approach will generate a list exactly matched to the ClutrFree view. Theadvantage of using Z-scores, which can be done with statistical software orwith a spreadsheet, is that, one can compare the assignment of genes acrosspatterns, as the Z-score will normalize the strength of assignment, based on the
- Page 62: 18 BidautReferences1. Hughes, T. R.
- Page 66: 20 Kirov et al.way to associate gen
- Page 70: 22 Kirov et al.based on a study ass
- Page 74: 24 Kirov et al.1. Retrieve the gene
- Page 78: 26Fig. 1. Functional associations f
- Page 82: 28 Kirov et al.Fig. 2. Pathway anal
- Page 86: 30 Kirov et al.3. Gene symbols usag
- Page 90: 32 Kirov et al.9. OBO_Team, Open Bi
- Page 94: 3Estimating Gene Function With Leas
- Page 98: Estimating Gene Function With LS-NM
- Page 102: Estimating Gene Function With LS-NM
- Page 106: Estimating Gene Function With LS-NM
- Page 110: Estimating Gene Function With LS-NM
- Page 116: 46 Wang and Ochsresults posttreatme
- Page 120: 4From Promoter Analysis to Transcri
- Page 124: Prediction Using PAINT 51even in si
- Page 128: Prediction Using PAINT 53Fig. 1. A
- Page 132: Prediction Using PAINT 55first exon
- Page 138: 58 Gonye et al.Fig. 3. A network vi
- Page 142: 60 Gonye et al.exGeneList.txt) is a
- Page 146: 62 Gonye et al.(http://www.tm4.org)
- Page 150: 64 Gonye et al.does not span the en
- Page 154: 66 Gonye et al.4.7. Interpreting th
- Page 158: 68 Gonye et al.18. Dozmorov, M. G.,
44 Wang and OchsFig. 4. The gene table view in ClutrFree. The table has been sorted by Pattern 3,giving a list of genes that are tied to this pattern strongly. A more formal measure ofthe association can be calculated through the Z-score as described in the text.3.4.3. Interpreting the Results Using Z-ScoresThis approach will generate a list exactly matched to the ClutrFree view. Theadvantage of using Z-scores, which can be done with statistical software orwith a spreadsheet, is that, one can compare the assignment of genes acrosspatterns, as the Z-score will normalize the strength of assignment, based on the


