(Micro)Duct and Cable - ECA Digital Library
(Micro)Duct and Cable - ECA Digital Library
(Micro)Duct and Cable - ECA Digital Library

Create successful ePaper yourself
Turn your PDF publications into a flip-book with our unique Google optimized e-Paper software.
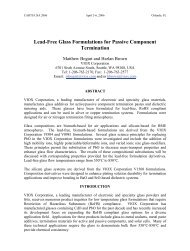
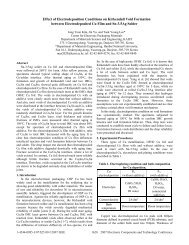
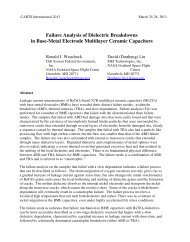
Blow Simulation Test to Measure Coefficient of Friction between(<strong>Micro</strong>)<strong>Duct</strong> <strong>and</strong> <strong>Cable</strong>W. Griffioen 1 , S. Z<strong>and</strong>berg 2 , P. M. Versteeg 1 , M. Keijzer 31 Draka Comteq Telecom B.V., Zuidelijk Halfrond 11, 2801 DD Gouda, The Netherl<strong>and</strong>s2 Draka Comteq Telecom B.V., IJzerweg 2, 9936 BM Farmsum, The Netherl<strong>and</strong>s3 Vecom Metal Treatment B.V., Mozartlaan 3, 3144 NA Maassluis, The Netherl<strong>and</strong>s+31-182-592490 · willem.griffioen@nkf.nlAbstractThere is a need for a quick test to evaluate the blowing performanceof a cable in a (micro)duct. An important parameter for this is thecoefficient of friction (COF) between cable <strong>and</strong> (micro)duct. Asummary is given of existing techniques to measure this parameter.It is concluded that none of these techniques offers sufficientreliable values to guarantee good blowing performance. In thispaper an alternative technique, a blow simulation test, is described.Here a cable moves back <strong>and</strong> forth in a (micro)duct with airflow,simulating a “window” in a real field installation. The measuredforces supply information on both friction <strong>and</strong> air drag force.Measurements show excellent correlation with blowing referencetests.Keywords: Optical cable; microduct cable; duct; microduct;coefficient of friction; jetting; blowing; lubricant; lubricator.1. IntroductionFor (micro)duct cabling a blowing test is needed to guaranteegood blowing performance. Measurements of the coefficient offriction (COF) between (micro)duct <strong>and</strong> cable (or fibre unit) couldserve as a quick alternative for blowing tests. Such tests wouldrequire less material <strong>and</strong> there would be no need to have a testtrajectory. The blowing length in practical situations is thancalculated from theory [1,2,3] (software exists which is based onthis theory [4]), taking into account cable, (micro)duct <strong>and</strong>equipment properties <strong>and</strong> the typical undulations <strong>and</strong> bends in thetrajectory. Many different techniques to measure the COF areused: wheel tests (different variants), sloped (micro)duct <strong>and</strong>cable tests <strong>and</strong> the bullet test from British Telecom [5].In this paper the shortcomings of these techniques are listed. Itappears that the correlation with blowing reference tests is poor.These matters are currently discussed in IEC 86A WG3,concerning the draft specification for microduct cabling [6].Probably the only reliable tests until now turn out to be blowingreference tests themselves. For blown fibres (not cables) it ispossible to perform such tests with the microduct on drum [7].In this paper a new technique, a blow simulation test, is presentedto measure the COF between (micro)duct <strong>and</strong> cable, based on butdiffering from the test of [8]. The cable is moved back <strong>and</strong> forthin a 17.1 m long (micro)duct while air is forced through. At thesame time the force to move the cable is measured. The cablemovingequipment <strong>and</strong> force-measuring device are placed in apressure chamber. The flow is such that real blowing conditionsare simulated, e.g. the input <strong>and</strong> output pressures are the same asfor a window of the same length in a blowing reference test. Inthis test the magnitudes of air-propelling force <strong>and</strong> COF can beacquired separately, showing e.g. the effect of textured cablesurfaces. Tests so far have shown excellent correlation withblowing reference tests, also in cases where the wheel test failed.2. Existing Test MethodsA summary is given of existing test methods to measure the COFbetween a cable <strong>and</strong> a (micro)duct.2.1 Wheel TestsMZwickorInstronRFigure 1. Sketch of a wheel test.A cable sample with attached weight is pulled through a(micro)duct sample around a wheel <strong>and</strong> the pulling force ismeasured. Several variants are used with different weights,diameters <strong>and</strong> angles over which the (micro)duct is pulled overthe wheel. Sometimes also a pulley is used to direct the cable inline with the pulling/force-measuring device. One variant for usewith microducts is given here as an example.A wheel with radius R of 52 cm is placed before a pulling/forcemeasuringdevice, e.g. an Instron or Zwick, see Figure 1. Themicroduct sample is wound firmly around the wheel over 360º.The free angle φ for both microduct ends is about 10º (minimiseseffect of bending a cable with stiffness from straight to curved). Aweight of which the mass M is about the mass of a length of 2 mInternational Wire & <strong>Cable</strong> Symposium 413 Proceedings of the 54th IWCS/Focus
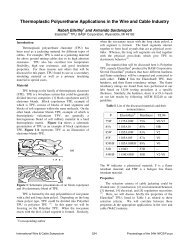
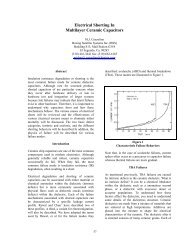
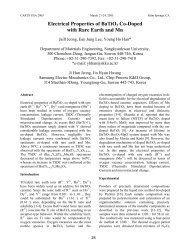
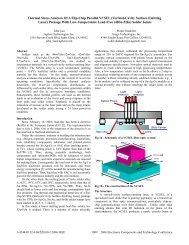
of the cable sample is attached to the cable. The force F to pullthe cable through the duct (speed 1.0 or 1.8 m/min) after 20 cm ofpulling is measured. A new clean, grease free cable sample has tobe used to test every other duct sample. Sometimes a dummycable, with the same weight but a lower stiffness than the cable tobe tested, is used to minimise stiffness effects at the ends of themicroducts. The COF can be calculated with the expression [1]:2 fF = ( Mg + W∆l)exp(2π f ) + WR[ exp( 2πf) −1](1)21+fHere W is the weight of the cable sample per unit length, g theacceleration of gravity (9.81 m/s 2 ), ∆l the length of cable outsidethe duct circle, R the radius of wheel, M the mass of the weight<strong>and</strong> f the COF. The value of f can be calculated by iteration. Thefriction is the average of the values of the third, fourth <strong>and</strong> fifthmeasurement.In order to simulate the friction in blowing practice as good aspossible the attached weight shall be small, see Appendix A (A7).This is the reason that (1) is a little intricate (tests with differentangles require different formulas), the simple exponential formulagiving too large errors. The low forces involved also do not allowthe use of (relatively small diameter) pulleys, where bending thecable, dissipating energy, results in extra forces.2.2 Slope TestsSlope tests are simple tests. They come with 2 variants, the sloped(micro)duct <strong>and</strong> the sloped cable test. They are easy to construct<strong>and</strong> are also available on the market [4].2.1.1 Sloped (micro)duct. In this test a (micro)duct sample, inwhich a short cable sample is placed, is mounted straight on aclamping device. The angle α with the horizontal at which thecable starts sliding is measured. The COF f simply follows from:f = tan(α)(2)A: duct fixing strap F: level indicatorB: duct G: level setting screwC: setting wheel H: blocking wheelD: cable or fibre I: base plateE: coefficient of friction indicator J: duct supportFigure 2. Sketch of the sloped (micro)duct test.Care shall be taken that the length of the piece of cable is smallenough. The (intrinsic) bend radius of the cable shall not result intouching opposite walls of the (micro)duct, which would result inextra friction due to spring action of the cable ends. The cablesamples must be started by h<strong>and</strong> for the best result.This test is used mainly for traditional optical cables <strong>and</strong> ducts.2.1.1 Sloped cable. In this test a piece of cable, over which ashort piece of (micro)duct is sleeved, is mounted straight, under alittle tension, in a clamping device. The angle α with thehorizontal at which the (micro)duct starts sliding is measured.Also here the COF f follows from (2).αcableduct massFigure 3. Sketch of the sloped cable test.Care shall be taken that the length of the piece of (micro)duct issmall enough. The (intrinsic) bend radius of the (micro)duct shallnot result in touching the cable with opposite walls of the(micro)duct, which would result in extra friction due to springaction of the duct ends. Longer lengths are possible when using astraight (metal) cylinder around the (micro)duct sample, which atthe same time serves as a weight, of course respecting (A7). The(micro)duct samples must be started by h<strong>and</strong> for the best result.This test is used for smaller types of cable, like microduct cables.2.3 Bullet TestA brass slider is shot through a curved piece of (micro)duct <strong>and</strong>the speed difference between two points is measured. This test isdescribed in [5]. After analysing the forces it turns out that thesidewall forces fall outside the window of (A7) of Appendix A.The test, with its brass slider, is not suitable to distinguishbetween different constructions of cable or fibre unit.3. Test Results Existing Test MethodsWheel tests are expected to give the right values for the COF, whenusing the proper weights, eliminating small diameter pulleys <strong>and</strong>using the right formula’s. Also slope tests, when using the properweight around the (micro)duct sample in the sloped cable test, givethose expectations. Users of said tests also claim good correlationbetween the measured COF <strong>and</strong> the blowing performance.However, the comparison found for different cable <strong>and</strong> (micro)ductsamples (next paragraph), with different lubrication procedures,does not always show good correlation. Here the COF’s calculatedfrom blowing reference tests can be much higher than measuredwith the wheel test described in this paper, see Figure 4 <strong>and</strong> text innext paragraphs. For this reason a decision was taken in IEC 86AWG3 not to incorporate tests to measure the COF in st<strong>and</strong>ards, butto write a separate technical document.Tests to measure the COF have been done on different 3.9 mmcables <strong>and</strong> 7 mm microducts (different suppliers) with the wheeltest described in this paper. The microducts as received from thesupplier were either dry, with low-friction liner or pre-lubricated.Tests have been performed with or without additionallylubricating the microducts with Jetting Lub [9] before blowing.International Wire & <strong>Cable</strong> Symposium 414 Proceedings of the 54th IWCS/Focus
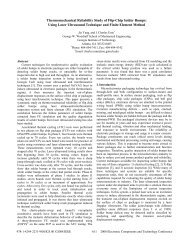
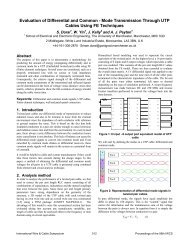
COF calculated from blow ref test0,60,50,40,30,20,1mounted in the flow path. This equalizes the pressure when thecable is moved <strong>and</strong> air is pushed aside. Also it minimizes theeffect of friction caused by the intrinsic curvature of the cable, anend effect disturbing the measurement.FcablepiLairflowp emicroductFigure 5. Sketch of the blow simulation test.00 0,1 0,2 0,3Measured COF (wheel)Figure 4. Calculated COF’s, from blowingreference tests of different cables in differentmicroducts, plotted against measured COF’s(wheel test). The line represents 100% correlation.Blowing reference tests have also been performed. They weredone in a trajectory of about 1500 m long with loops of 125 mlong <strong>and</strong> in between them 180-degree bends of 0.25 m radius. Theblowing pressure is maintained at 10 bar <strong>and</strong> the experiment isstopped when the blowing speed drops below 20 m/min. The COFhas been calculated from the blowing distance, using Drakasoftware which takes into account the filling of the duct by thecable (needed to obtain realistic COF-values when not reachingthe duct-end, see Appendix B). Since this software cannot h<strong>and</strong>lethe separate bends this is simulated by windings with amplitude of10 cm <strong>and</strong> period of 5 m (same result as for 180-degree bends of0.25 m radius every 125 m, according to JETplanner [4]).No points have been found under the line in Figure 4. This meansthat combinations of cables <strong>and</strong> microducts never perform betterin blowing than what follows from the COF measured with thewheel test. But, many combinations perform less than whatfollows from the wheel test, especially the ones with themicroducts which have not been additionally lubricated. For thewell-performing combinations the correlation with blowingreference tests is rather good.Test methods to guarantee good blowing performance should alsomeasure the effects of tacky lubricants <strong>and</strong> non-straight cableshaving little space. This can only be done with blow simulation.4. Blow Simulation ApparatusA sketch of the blow simulation test is given in Figure 5. Asample cable is placed in a sample (micro)duct of length L. Air isforced to flow through the (micro)duct via a pressure chamber.The pressure <strong>and</strong> flow are controlled such that pressures p i <strong>and</strong> p eare maintained at the inlet <strong>and</strong> exit of the sample duct,respectively. The pressures <strong>and</strong> the flow are monitored. In thepressure chamber the cable is attached to a force sensor <strong>and</strong>moved back <strong>and</strong> forth (speed about 20 m/min), while monitoringthe force. At the end of the sample duct a piece of a larger duct isFigure 6. Picture of the pressure chamber of theblow simulation test.A Picture of the pressure chamber is shown in Figure 6. In Figure7 the half of the test length is shown. The length extends inanother room, through the wall. The total (micro)duct test lengthis 17.1 m. On the left side in Figure 7 a pneumatic extension canbe seen, for the movement of the cable.Figure 7. Half of the test length (rest through wall).International Wire & <strong>Cable</strong> Symposium 415 Proceedings of the 54th IWCS/Focus
5. Blow Simulation TheoryWhen blowing a cable with pressure p 0 the pressure p as a functionof position x over the length l is given by [1,2]:2 2 x( p p ) l20 0 −p = p −(3)aHere p a is the (atmospheric) pressure at the end of the (micro)duct.The pressures are given as absolute pressures. The net force dF/dxon a piece dx of the moving cable, which is the blowing force minusthe friction force, is given by [1,2]:dFdx= −4π dpdpDd Dc± fW ≡ −Cblow± fWdxdx(4)Here W is the weight of the cable per unit of length, f is the COFbetween cable <strong>and</strong> (micro)duct <strong>and</strong> D d <strong>and</strong> D c are the inner diameterof the (micro)duct <strong>and</strong> outer diameter of the cable, respectively. Forforward movement the sign of the friction force is negative, forbackward movement positive, while a tensile force is positive. Thepressure, blowing force <strong>and</strong> friction force on the cable are given inarbitrary units in Figure 8. Here the friction force is also given, atthe same scale as the blowing force, for a typical jetting (synergy ofblowing <strong>and</strong> pushing) installation.In a blow simulation test the parameters are chosen the same as inthe blowing reference test. Take samples of the cable <strong>and</strong> the(micro)duct <strong>and</strong> copy the lubrication process (if any). Then choosethe same conditions for the airflow. The length L of the samplesshall be large enough that onset of the flow occurs at a relative shortlength <strong>and</strong> the flow can be considered as “fully developed”. Also theReynold number R e shall be the same as in the practical installation.For turbulent flow (Blasius equation) this number follows from[1,2]:DRe= 2.9µ12 / 7h8 / 7pfW⎛2⎜pi− pρa⎝ 2Lpapip eL2e⎞⎟⎠4 / 7window- C dpblowdx0 lFigure 8. Pressure p, blowing force C blow × dp/dx<strong>and</strong> friction force fW as a function of the position ina duct of length l in a blowing reference tests.Windows of length L, with pressure p i <strong>and</strong> p e atinlet <strong>and</strong> exit, respectively, are taken for the blowsimulation test.(5)Here µ is the dynamic viscosity of the flowing medium (1.8×10 -5Pas for air) <strong>and</strong> ρ a its density at atmospheric pressure (1.3 kg/m 3 forair), D h the hydraulic diameter (D d with correction when filled withcable, see Appendix B) <strong>and</strong> p i <strong>and</strong> p e the pressures at the inlet <strong>and</strong>exit of the length L, respectively (note that R e is constant over theentire length of a duct when its hydraulic diameter is constant). Itfollows that exact copies of both forces on the cable <strong>and</strong> flowproperties can only be obtained by cutting out windows from Figure8. The relation between p i <strong>and</strong> p e is then found using (3):p2i2 2( p − p )2 L− pe= 0 a(6)lFor a moving cable in a straight length L, on which the pressuredrop can be approximated linearly, <strong>and</strong> for a tensile force on thecable (F positive), the COF follows from (4):( p − p )πDdDci e − F4f = ±(7)WLHere the positive sign represents forward movement <strong>and</strong> thenegative sign backward movement. During forward movement theforce may also be compressive (when the friction forces are higherthan the air propelling forces). In this case f is found numerically.When the air propelling factor C blow is indeed given by thetheoretical expression from (4) the COF found for forward <strong>and</strong>backward movement will be the same. If the air propelling force isalso influenced in another way, e.g. by a textured surface on thecable, different <strong>and</strong> hence wrong results are found. In this case thefactor C blow shall be regarded as unknown. From the 2 equations(one for forward <strong>and</strong> one for backward) the 2 unknowns f <strong>and</strong> C bloware found:Fb− F ff = (8)2WLCblowFb+ F f= (9)2( p − p )ieHere F f <strong>and</strong> F b are the forces measured in forward <strong>and</strong> backwardmovement, respectively.6. Test Results Blow SimulationThe blow simulation tests have been performed on 7, 10 <strong>and</strong> 12 mmmicroducts (one supplier) with different cable types at pressures aslisted in Table 1. They represent “windows” of 17.1 m on a 1ength lof 1500 m <strong>and</strong> a pressure p 0 of 10 bar at the beginning of this length,p i <strong>and</strong> p e obtained with Equation (6). In Table 1 also the relativepositions x/l have been given of these “windows”.Table 1. Pressures for 7, 10 <strong>and</strong> 12 mm microductsx/l 0.45 0.60 0.75 0.90 1.00p i (bar) 7.18 6.00 4.56 2.61 0.54p e (bar) 7.10 5.90 4.44 2.41 0.00The samples were taken from blowing reference tests. From thesetests the COF was calculated in the same way as those from Figure4. The results from the field tests <strong>and</strong> the blow simulation tests aregiven in Figure 9. <strong>Micro</strong>ducts with too little (none) or too muchlubricant (<strong>Micro</strong>lub or Jetting lub [9]) were also used, by purpose, toget more information about the validity of the blow simulation test.International Wire & <strong>Cable</strong> Symposium 416 Proceedings of the 54th IWCS/Focus
COF calculated from blow ref test0,50,40,30,20,100 0,1 0,2 0,3 0,4 0,5Measured COF (simulation)Figure 9. Calculated COF’s, from blowing ref. testsof different cables in different microducts, plottedagainst measured COF’s with the blow simulationtest. The line represents 100% correlation.The blow simulation tests also gives information about the air dragforce. This force usually varies between the same as resulting fromthe existing blowing theory [1,2] <strong>and</strong> 10% more. No significantcorrelation of the air drag force <strong>and</strong> the roughness of either the cableor the (micro)duct has been found in our experiments. Bearing inmind that changing either the roughness of the cable or the(micro)duct (grooves) has in some cases led to increased blowingperformance (much more than 10%) leads to the conclusion that thishad affected rather the COF than the air drag force. The blowingtheory is therefore confirmed as a good tool to forecast blowingperformance.The blow simulation test has helped in the further improvement ofthe microduct cabling <strong>and</strong> their installation. One such developmentis the cable lubricator [11], see Figure 11. The use of this apparatuscorresponds to the most left point in Figure 9 (COF of 0.06, reallyeffective now; note that such a value was measured often in a wheeltest). Not only the 1500 m blowing reference test could be done atlow pressure, also a new record in microduct cabling was achieved:at CERN [12] a 24 fibre cable (3.9 mm) was recently blown withthe help of the cable lubricator into a 7/5.5 mm microduct over alength of 3.5 km (in one shot!).In Figure 10 the results are given of the wheel tests, from the samesamples as from Figure 9. Clearly there is little correlation betweenthe measured COF here <strong>and</strong> the COF obtained from the blowingreference tests, while the blow simulation test showed excellentcorrelation in Figure 9. The small deviations in Figure 9 wereattributed to not constant lubrication over the length of the blowingreference tests, as was observed by performing blow simulation testson samples taken from different locations. A blow simulationreference test only gives one (average) value for the COF, while inthe blowing reference tests the different local values are found.0,5COF calculated from blow ref test0,40,30,20,1Figure 11. <strong>Cable</strong> blowing equipment (blueapparatus) <strong>and</strong> cable lubricator (red apparatus) atwork during one-shot 3.5 km blowing of a 24-fibrecable into a 7/5.5 mm microduct at CERN.00 0,1 0,2 0,3 0,4 0,5Measured COF (wheel)Figure 10. Calculated COF’s, from blowingreference tests of different cables in differentmicroducts, plotted against measured COF’s withthe wheel test. The samples are the same as usedfor Figure 9. The line represents 100% correlation.7. ConclusionsIt is concluded that existing techniques to measure the COF betweencable <strong>and</strong> (micro)duct, such as the wheel test, do not offer sufficientreliable values to guarantee good blowing performance. Analternative test, the blow simulation test, has been described in thispaper. Here a cable moves backward <strong>and</strong> forward in a microductwith airflow, simulating a window in a real installation (whenmoving forward). The measured forces supply information on bothfriction <strong>and</strong> air drag force. Measurements show excellent correlationwith blowing. The air drag force is the same or 10% more thanInternational Wire & <strong>Cable</strong> Symposium 417 Proceedings of the 54th IWCS/Focus
would result from the existing blowing theory, confirming thistheory.8. AcknowledgmentsSpecial thanks to Willie Greven, Thomas Pothof, Frans Bakker, Atede Jong <strong>and</strong> Cees van ‘t Hul (Draka Comteq Telecom B.V.) forperforming the blowing reference tests, <strong>and</strong> to Arie van Wingerden,Arnie Berkers <strong>and</strong> Dick Huisman (Draka Comteq Telecom B.V.) forthe supply of (special) cables. Also acknowledged are John Fee(Polywater Inc.) <strong>and</strong> Gerard Plumettaz (Plumettaz S.A.) for theirstimulating discussions. Finally acknowledged are Ted Sugito(Draka Comteq Telecom B.V.), Luit de Jonge (CERN), PhilippePache, Tony Garcia <strong>and</strong> crew (Mauerhofer & Zuber) for the 3.5 kmone shot blowing.9. References[1] W. Griffioen, ”Installation of optical cables in ducts,Plumettaz, Bex (CH) 1993.[2] W. Griffioen, "The installation of conventional fibre opticcables in conduits using the viscous flow of air", J.Lightwave Technol., Vol. 7, no. 2 (1989) 297.[3] IEC 60794-1-1, Annex C, “Generic specification for opticalfibre cables”, edited 2004.[4] JETplanner <strong>and</strong> slope test equipment, Plumettaz, Bex,Switzerl<strong>and</strong>, www.plumettaz.ch.[5] D. Butler, D.J. Stockton, “<strong>Duct</strong> surface testing for use inoptical fibre transmission lines”, Patent applicationGB2205960A (1987).[6] IEC 60794-5, “Sectional specification for microduct cablingfor installation by blowing”, Committee Draft from SC 86AWG3.[7] W. Griffioen, A. van Wingerden, C. van 't Hul, M. Keijzer,"<strong>Micro</strong>duct cabling: Fiber to the Home", Proc 52 nd IWCS(2003) 431-437.[8] J.M. Fee, S.H. Dahlke, D.P. Solheid, “Analysis <strong>and</strong>measurement of friction in high speed air blowinginstallation of fiber optic cable”, Presented at the NationalFiber Optic Engineers Conference, June 18-22, 1995,Boston, MA.[9] Jetting Lub <strong>and</strong> <strong>Micro</strong>lub, Polywater, Stillwater, Minnesota,www.polywater.com <strong>and</strong> Plumettaz, Bex, Switzerl<strong>and</strong>,www.plumettaz.ch.[10] G.C. Weitz, “Prediction <strong>and</strong> minimization of fiber opticpulling tensions”, IEEE Journal of Selected Areas inCommunications, vol. sac-4, no. 5, 1986, pp. 686-690.[11] Optical cable installation with cable lubricator, United StatePatent US 6,848,541, Feb. 1, 2005.[12] W. Griffioen, C. van ‘t Hul, I. Eype, T. Sugito, W. Greven,T. Pothof, R. Khiar, L.K. de Jonge, “<strong>Micro</strong>duct cabling atCERN”, Proc 53 rd IWCS (2004) 204-211.Appendix A: Analysis of FrictionIn an experiment to measure the COF the conditions during theactual blowing need to be approximated as much as possible. Inorder to indicate which parameters are important, <strong>and</strong> whichboundary conditions need to be taken for them, a short analysis offriction will be given in this appendix.A1. Friction ContributorsIn most cases lubricants are used to reduce friction between cable<strong>and</strong> duct. Two types of friction can be distinguished:hydrodynamic friction <strong>and</strong> boundary friction [10].Hydrodynamic or “thick-film” friction is significant on sectionswith low sidewall bearing pressure between cable <strong>and</strong> duct. Underthese conditions the cable actually floats on a “thick” film oflubricant. The viscosity of the lubricant (low for low friction ofthis type) plays an important role. This type of friction alsoincreases at higher cable speeds.Boundary or “thin film” friction is significant on sections withhigh sidewall bearing pressure between cable <strong>and</strong> duct. Underthese conditions lubricants get squeezed into a thin film <strong>and</strong> maybreak down <strong>and</strong> loose effectiveness. This type of friction is alsodominant when no lubricants are used.With cable blowing both types of friction may occur, dependingon cable weight, forces in the cable, cable speed, lubricant used<strong>and</strong> bend radii in the duct trajectory. It is important that theconditions in the COF measurement are as close as possible tothose in the actual blowing situation.Another contributor to friction is the effect of static electricity.This is especially important for the very low weight “cables”, likemicroduct fibre units. This effect depends strongly on speed <strong>and</strong>also on environmental conditions as present with blowing. It isextremely difficult to test this effect in ways other than blowingtests.Finally the effect of wear of cable <strong>and</strong> duct on friction duringinstallation are mentioned. While this phenomena occurs withcable pulling it is hardly present with cable blowing, where forcesinvolved are an order of magnitude smaller.The actual friction is not only determined by a pure COF <strong>and</strong> theother parameters following from blowing theory <strong>and</strong> used inplanner software [4]. Other effects also play an important role,like non-straightness or memory of the cable or microduct,squeezing the cable between the inner walls of the microduct bytheir own “spring action”, especially when the diameter of thecable is relatively large. This effect is also measured in sometests, like an effective COF, but most tests do not measure this.A2. Forces during BlowingOne of the important factors mentioned in the previous section isthe sidewall bearing pressure between cable <strong>and</strong> (micro)duct. Thisis best expressed in sidewall (normal) force F n . Often a muchhigher sidewall force is used in a measurement of the COF than ispresent in an actual blowing situation.For blowing in a straight (micro)duct the sidewall force is simplythe weight of the cable. For a cable with weight W per unit oflength <strong>and</strong> length l this is:F n = Wl(A1)In a bend with radius R b in the duct trajectory the sidewall forcedepends on the longitudinal force F in the cable:FFn = lR(A2)bUsually the length of a bend is shorter than the length in themeasurement of the COF, especially for sharp bends in thetrajectory, so the force found in this formula gives the upper limitof effective sidewall force. The force can be tensile orcompressive, both resulting in an absolute positive value for thesidewall force. In blowing usually compressive forces dominate,especially short after the installation equipment. A typical valueof the pushing force used for blowing is:International Wire & <strong>Cable</strong> Symposium 418 Proceedings of the 54th IWCS/Focus
F push = W × 500m(A3)However, the pushing force rapidly decreases more than an orderof magnitude short after the installation equipment [1,2] <strong>and</strong> theCOF in this high pushing force section does not countsignificantly to the total blowing length that can be reached. Mostimportant for the blowing performance is the part where blowingforces are about equal to the friction. And here again (A1) holds.Because of expansion of the air the blowing force is not equallydistributed over the duct length. Hence longer cable sections canexperience a mismatch between friction <strong>and</strong> compensation by airpropellingforces. The cumulative blowing force given by [1,2]:πF = D D ∆p(A4)4blowcdHere D c <strong>and</strong> D d are the diameters of the cable <strong>and</strong> the (inner) duct<strong>and</strong> ∆p is the pressure drop over a duct section. Since airpropellingforces built-up at one section can only reach sectionsnot too far away, because of friction, only a part of the pressuredrop of the total is effectively contributing to the cumulativeblowing force. Also a part of the cumulative blowing force isalready used for compensation of friction in the section where it isbuilt-up. A good approximation of the excess cumulative blowingforce that can be generated (in a trajectory of about the maximumblowing length) is obtained by using (A4) with a pressure drop ofabout 0.5 bar (this can be the drop over 200 m) for the excessblowing force. For a constant filling rate of (micro)duct withcable the blowing force is proportional to the square of the cablediameter <strong>and</strong> hence proportional to the cable weight (for aconstant cable density). For a typical microduct cable in amicroduct this results, using the previous information, in anexcess blowing force:F = W m(A5)blow, excess × 5This excess force is much more relevant for the blowing lengththat can be reached than the force from (A3). <strong>Micro</strong>ducts areusually not bent sharper than with a radius of 0.5 m over thetrajectory (sometimes a sharper bend at a branch location). Hencefor microduct cabling (A2) <strong>and</strong> (A5) result in:F n = 10Wl(A6)Together with the condition (A1) for straight duct sidewall forcethis results in the following window for the normal force per unitof length in a COF measurement for microduct cabling:FnW ≤ ≤10W(A7)lAppendix B: Calculate COF from blowingIn order to calculate the COF from blowing experiments where thecable does not reach the duct end it is needed to know the effect offilling of the (micro)duct with cable, i.e. the effective hydraulicdiameter D h as appearing in (5).Equation (3) is valid for a flow channel of uniform (hydraulic)diameter, e.g. an empty (micro)duct or a (micro)duct entirely filledwith cable. When the cable gets stuck somewhere underway this isnot the case anymore. Now (3) needs to be replaced by theexpression for the pressure over the cable, until the pressure p ch atthe location x ch of the cable head:2 2( p p )2xp = p0 − 0 − ch(B1)xchwith (following with Blasius equation [1,2]):pch2 2 2 7 / 4 5 / 4 2( l − xch) p0( Dd− Dc) Dh+ xchpaDd2 2 4 4 19 / 4( l − x )( D − D ) 7 /D5 / + x Dchdchchd19 / 4= (B2)This effect of filling the (micro)duct with cable only counts forducts with high filling degree (such as is often the case withmicroduct cables) <strong>and</strong> when the cable does not reach the end. Drakahas developed jet-planning software that takes this filling intoaccount. Using this software the COF can be calculated fromblowing experiments using (micro)ducts with fixed length where notalways the end is reached. This COF can than be compared to theCOF from the friction or blow simulation experiments.For longitudinal extending flow channels, not deviating too muchfrom cylindrical, the hydraulic diameter D h is defined as 4 times thewetted area divided by the wetted surface of the cross-sectionalarea. For a (micro)duct with cable then simply follows:Dh= Dd− Dc(B3)However, the situation of a (micro)duct filled with cable appearsto be too far away from the cylindrical case <strong>and</strong> (B3) does notgive the right result. Fortunately the effective hydraulic diametercan be obtained from measuring the flow through the (micro)ductwhen empty <strong>and</strong> when filled. For turbulent flow (Blasius equation)[1,2] it follows, for an empty (micro)duct:p2i−2Lp2peaµ= 0.241/ 4 3 / 4ρ a19 / 4DdΦ7 / 4a(B5)Here the volume flow Φ a is defined at atmospheric conditions. For afilled (micro)duct (B5) is valid with the following replacement:D19 / 4d2 2 4 5 / 4( D − D ) 7 /D⇒ (B5a)dchFrom measuring the flow Φ f for the filled <strong>and</strong> then the flow Φ e forthe unfilled (micro)duct (both under atmospheric conditions), at thesame pressures, the hydraulic diameter can then be obtained with:−7 / 527 / 5⎡ ⎛ D⎤ ⎛ Φ ⎞⎢c⎞fD 1 ⎜ ⎟ ⎥ ⎜ ⎟h = Dd−⎢⎥(B6)⎝ Φ⎣ ⎝ Dd⎠e⎦ ⎠In Figure B1 an example is given for a 7/5.5 mm microduct of 19 m.The flow is measured as function of the inlet pressure while the exitpressure is atmospheric, for an empty microduct <strong>and</strong> for a microductfilled with a 3.9 mm cable. The effect of filling can be clearly seen.Also the transition from laminar to turbulent flow can be seen forthe filled microduct. The present blowing theory is not valid forlaminar flow. Fortunately both practical installation of microductcables (e.g. 1500 m with 10 bar) <strong>and</strong> the resulting blow simulationfriction measurements (p i of 0.59 bar for p e = 0 <strong>and</strong> L = 19 m) occurin the turbulent regime.Taking into account only the data in the turbulent regime the flow inthe empty microduct is up to 15 % higher than following from (B5).This is not unusual. Blasius’ equation is valid for smooth walls.Surface roughness will decrease the flow <strong>and</strong> longitudinal ribs (as isthe case with the tested microduct) may increase the flow, due todirecting effects of the ribs on the flow. From (B6) an hydraulicdiameter D h is found of 0.4 D d . This is a little higher than whatfollows from (B3).International Wire & <strong>Cable</strong> Symposium 419 Proceedings of the 54th IWCS/Focus
0.8flow (ml/s)emptyfilledSito Z<strong>and</strong>berg attended the HogereTechnische School in Leeuwardenwhere he received a B.Sc. in ChemicalEngineering in 1982. After he fulfilledhis duty in the Dutch Army he joinedthe Dutch Oil Company NAM as aDrilling Fluid Engineer. Here heworked on the improvement of the solidremoval system of drilling rigs. In 1987he joined Draka Comteq as aproduction engineer. In 1992 he becamehead of the laboratory that checks allincoming goods.At the moment he works as a Production Material Engineer <strong>and</strong> isresponsible for new materials for cables, trouble shooting if there areprocessing problems <strong>and</strong> testing of microducts, cables <strong>and</strong> COFmeasurements. Draka Comteq Telecom, IJzerweg 2, 9936 BMFarmsum.00 p (bar)i0.6Figure B1. Flow as a function of inlet pressure p i (zeroat exit) of a 7/5.5 mm microduct of 19 m. Squaresymbols represent an empty microduct, circlesymbols the microduct filled with a 3.9 mm cable. Graysymbols indicate laminar flow.BiographiesWillem Griffioen received an M.Sc.degree in Physics <strong>and</strong> Mathematicsfrom Leiden University (Netherl<strong>and</strong>s)in 1980 <strong>and</strong> worked there until1984. He joined KPN Research,St. Paulusstraat 4, 2264 XZLeidschendam, The Netherl<strong>and</strong>s.Responsibilities R&D of Outside-Plant<strong>and</strong> Installation Techniques. Heworked at Ericsson <strong>Cable</strong>s, Hudiksvall(Sweden) <strong>and</strong> at Telia Research,Haninge (Sweden) in the scope ofexchange/joint projects with KPNResearch.He received his Ph.D. (Reliability of Optical Fibers) in 1995 fromthe Technical University of Eindhoven (Netherl<strong>and</strong>s). Currently,since 1998, he is product manager at Draka Comteq Telecom,Zuidelijk Halfrond 11, 2801 DD Gouda, The Netherl<strong>and</strong>s.Menno Versteeg attended the LeidseInstrumentmakers School (metal -1989) at Leiden. In 1997 he receivedhis B.Sc. degree in Applied physics(Photonics). Also in 1997 he fulfilledhis duty to the Dutch Army as aMedical Engineer (N39XO), he wasresponsible for checking, repairing<strong>and</strong> setup of the all medical equipmentbeing used by theDutch Army. He has worked at ESA-ESTEC (1995), Fokker Space (1996)<strong>and</strong> TNO-TPD (1998) as Head ofTechnical Support in the Optical Components <strong>and</strong> Thin LayersDepartment. During the above he gave technical support in opticalsystems of different satellite components (GOME <strong>and</strong> OMI).Currently, since 2001, he is System Engineer at Draka ComteqTelecom - Zuidelijk Halfrond 11, 2801DD, Gouda, TheNetherl<strong>and</strong>s.Maja Keijzer received a BSc degree, aMSc degree, <strong>and</strong> PhD in ChemicalEngineering respectively in 1990 (TheHague), 1993 (Eindhoven) <strong>and</strong> 1998(Delft) on polymer science,(in)organic chemistry, electro-chemistry<strong>and</strong> corrosion protection. Sheworked at Netherl<strong>and</strong>s EnergyResearch Foundation ECN as projectleader on material development forsolid polymer fuel cells.In 2001 she joined Draka ComteqTelecom as product manager.Currently, since 2003, she works as Technical Manager oncorrosion protection at Vecom Metal Treatment B.V., Mozartlaan 3,3144 NA Maassluis, The Netherl<strong>and</strong>s.International Wire & <strong>Cable</strong> Symposium 420 Proceedings of the 54th IWCS/Focus