Advantages of using Intelligent Sample Loading with the HPLC-Chip ...
Advantages of using Intelligent Sample Loading with the HPLC-Chip ...
Advantages of using Intelligent Sample Loading with the HPLC-Chip ...

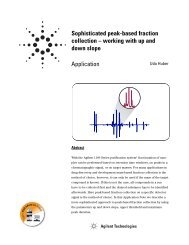
Create successful ePaper yourself
Turn your PDF publications into a flip-book with our unique Google optimized e-Paper software.
<strong>Advantages</strong> <strong>of</strong> <strong>using</strong> <strong>Intelligent</strong> <strong>Sample</strong><strong>Loading</strong> <strong>with</strong> <strong>the</strong> <strong>HPLC</strong>-<strong>Chip</strong> for automatedsample enrichmentApplication NoteMihaela GhitunEric BonneilLinda CôtéGeorges L. GauthierPierre ThibaultAbstractThe Agilent <strong>HPLC</strong>-<strong>Chip</strong> integrates enrichment column, analytical column,associated connection capillaries and a nanospray emitter directly ona single, small, reusable micr<strong>of</strong>luidic chip and <strong>the</strong> <strong>HPLC</strong>-<strong>Chip</strong> and companion<strong>HPLC</strong>-<strong>Chip</strong> Cube interface provide an easy to use, robust andreliable nanospray LC/MS platform when compared to conventionalnanocolumn LC/MS technology. When <strong>using</strong> an enrichment column,appropriate selection <strong>of</strong> valve timetable events is critical for properloading and transfer <strong>of</strong> <strong>the</strong> sample to <strong>the</strong> analytical nanocolumn andrequires re-adjustment each time <strong>the</strong> injection volume is changed.Optimization <strong>of</strong> this process is <strong>of</strong>ten time consuming and improper settingscan significantly degrade <strong>the</strong> efficiency <strong>of</strong> <strong>the</strong> enrichment process.This Application Note will demonstrate how <strong>Intelligent</strong> <strong>Sample</strong> <strong>Loading</strong>automates and optimizes sample enrichment on <strong>the</strong> <strong>HPLC</strong>-<strong>Chip</strong>. Directcomparison <strong>with</strong> <strong>the</strong> timetable approach will also show how <strong>Intelligent</strong><strong>Sample</strong> <strong>Loading</strong> increases <strong>the</strong> number <strong>of</strong> peptides detected in a proteindigest test mixture.
IntroductionMicr<strong>of</strong>luidic <strong>HPLC</strong>-<strong>Chip</strong>/MS technologyis rapidly establishing itselfas a robust, reliable easy to usealternative to conventionalnanocolumn LC-MS system 1 .Integration <strong>of</strong> <strong>the</strong> enrichmentcolumn, analytical columns,connecting capillaries andnanospray emitter directly on to<strong>the</strong> micro-fluidic <strong>HPLC</strong>-<strong>Chip</strong> hasdemonstrated improved sensitivityand enhanced chromatographicperformance leading to improvedpeptide and protein identification2-3 . <strong>HPLC</strong>-<strong>Chip</strong>s and <strong>the</strong><strong>HPLC</strong>-<strong>Chip</strong> Cube interface havebeen used <strong>with</strong> Ion-Trap and TOFmass spectrometers. Recent applications<strong>using</strong> <strong>HPLC</strong>-<strong>Chip</strong>/MStechnology include biomarkerdiscovery 4 , investigation <strong>of</strong> <strong>the</strong>nucleolar proteome 5, phophoproteomeanalysis 6 and oligosaccharideseparations in mucins andhuman milk 7 . When <strong>using</strong>nanocolumn LC/MS, long injectiontimes and very small or very dilutesamples requires <strong>the</strong> use <strong>of</strong> anenrichment column. This enrichmentcolumn is used to concentrate<strong>the</strong> sample and also allowsloading <strong>the</strong> sample at higher flowrates reducing <strong>the</strong> overall injectioncycle time. In addition, biologicalsamples can be desalted on<strong>the</strong> enrichment column to minimize<strong>the</strong> introduction <strong>of</strong> salt in <strong>the</strong> MSsource. Flow switching is requiredfor sample loading on to <strong>the</strong>enrichment column and subsequenttransfer to <strong>the</strong> analyticalnanocolumn. With <strong>the</strong> <strong>HPLC</strong>-<strong>Chip</strong>/MS system, this is achieved<strong>using</strong> a novel microvalve systemcontained in <strong>the</strong> <strong>HPLC</strong>-<strong>Chip</strong> Cubeinterface that ensures seamlesszero dead volume leak tight connections<strong>with</strong> <strong>the</strong> <strong>HPLC</strong>-<strong>Chip</strong>.Automation and optimization <strong>of</strong><strong>the</strong> flow switching process is criticalfor proper loading <strong>of</strong> <strong>the</strong> sampleon to <strong>the</strong> enrichment columnand transfer to <strong>the</strong> analyticalnanocolumn. For conventionalnanocolumn LC/MS system, valvecontrol is typically performed<strong>using</strong> a valve event timetable.However, this approach can createunnecessarily large data files andrequires re-optimization <strong>of</strong> <strong>the</strong>valve event timetable each time<strong>the</strong> sample injection volume ismodified. This process is quite<strong>of</strong>ten time consuming and errorprone and improper settings cansignificantly degrade <strong>the</strong> efficiency<strong>of</strong> <strong>the</strong> enrichment process.This will negatively impact both<strong>the</strong> amount and number <strong>of</strong> compoundsretained on <strong>the</strong> enrichmentcolumn. In this ApplicationNote, <strong>the</strong> features and performance<strong>of</strong> <strong>Intelligent</strong> <strong>Sample</strong><strong>Loading</strong> will be discussed indetail. Direct comparison <strong>with</strong> <strong>the</strong>time table approach will showhow <strong>Intelligent</strong> <strong>Sample</strong> <strong>Loading</strong>increases <strong>the</strong> number <strong>of</strong> peptidesdetected in a protein digest testmixture and reduces data file size.Equipment, sample and dataprocessingThe Agilent 1200 <strong>HPLC</strong>-<strong>Chip</strong>/MSsystem includes <strong>the</strong> followingcomponents:• Agilent 1200 Series nan<strong>of</strong>low LCsystem consisting <strong>of</strong> <strong>the</strong>nan<strong>of</strong>low pump, micro vacuumdegasser, and <strong>the</strong>rmostattedmicro well-plate autosampler(µ-WPS)• Agilent 1200 Series capillarypump for sample loading anddesalting• Agilent 1200 <strong>HPLC</strong>-<strong>Chip</strong> CubeMS interface• Agilent LC/MSD Trap XCT Ultramass spectrometers• Agilent Protein ID chip• Spectrum Mill Protein IDs<strong>of</strong>wareChromatographic conditions:<strong>HPLC</strong>-<strong>Chip</strong>/MS:Enrichment column: ZORBAX 300SB-C18,40 nL, 5 µmAnalytical column: ZORBAX 300SB-C18, 75 µm x 43 mm, 5 µm<strong>Loading</strong> flow rate:4 µL/min<strong>Loading</strong> mobile phase: 3 % acetonitrile, 0.2 % formic acidInjection flush volume: 6 µL for IFV method and 0 µL for TT method respectivelyInjection volume: 5 µLValve positions (for TT method): 0 min enrichment, 6 min analysis, 69 min enrichmentFlow rate:Mobile phase:Gradient:TT method:Time (min)% B0 86 863 4067 6068 6069 8Stoptime: 75Post time: 5 min300 nL/minA = 0.2 % formic acid in waterB = 0.2 % formic acid in acetonitrileIFV method:Time (min)% B0 857 4061 6062 6063 8Stop time: 64Post time: 10 minNeedle flush solvent: 20 % methanol + 0.2 % formic acid in waterTable 1<strong>HPLC</strong>-<strong>Chip</strong> chromatographic conditions.2
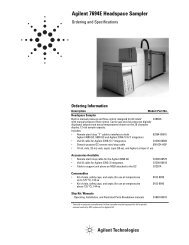
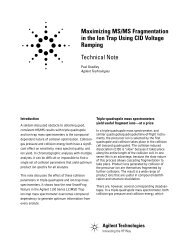
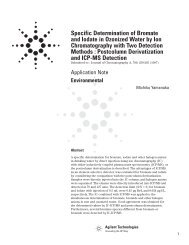
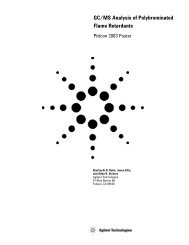
For peptide detection and clustering,a script was developed forconversion <strong>of</strong> <strong>the</strong> Agilent Ion-Trapdata files into text files containinginformation on all m/z, intensityand retention time values above auser specified threshold. Theresulting text file is <strong>the</strong>n processed<strong>using</strong> proprietary s<strong>of</strong>tware thatenables data reduction, peptidedetection and alignment <strong>of</strong> peptideion maps (m/z, retention time,intensity) 8 . Protein and peptideidentification was performed <strong>using</strong>Spectrum Mill. The sample usedfor this evaluation was a peptidemixture from <strong>the</strong> tryptic digest <strong>of</strong>8 different proteins (bovine serumalbumin, rabbit aldolase, yeastalcohol dehydrogenase, bovinecatalase, bovine glutamate dehydrogenase,E.Coli glycerokinase,human lactotransferrin, bovinelactoperoxidase, MichromBioresources, Auburn, CA). Thedigests were dissolved in water<strong>with</strong> 5 % acetonitrile and 0.2 %formic acid, and mixed toge<strong>the</strong>rto reach <strong>the</strong> concentration <strong>of</strong>40 fmol/µL each. The final injectionvolume contained 80 ng <strong>of</strong><strong>the</strong> mixture (ProMix). Chromatographicand Ion Trap MS conditionsfor <strong>the</strong> experiments aredescribed in tables 1 and 2.Chromatographic conditions:Ionization mode:<strong>HPLC</strong>-<strong>Chip</strong>/MS interfaceDrying gas flow:3.5 L/minDrying gas temperature: 300 °CCapillary voltage:1900 VSkimmer 1:30 VCapillary exit:75 VTrap drive: 85Averages: 1ICC: OnMaximum accumulation time: 150 msSmart target: 500000MS scan range: 400-1600Automatic MS/MS:Peptide scan mode (standard-enhanced for MSand ultra-scan for MS/MS)Number <strong>of</strong> precursors: 3Averages: 1Fragmentation amplitude: 1.3 VActive exclusion:On, 2 spectra, 1 minPrefer +2:OnMS/MS scan range: 100-2200ICC target: 500000Table 2Ion Trap MS conditions.Nano LC columnHV ESI contactRF tagEnrichment column,capillaries, fittings, fritsNanospray emitter, emitterassembly and fittingsWorkflow and description <strong>of</strong> <strong>the</strong><strong>HPLC</strong>-<strong>Chip</strong>The chip fabrication process and<strong>the</strong> chip interface for MS havebeen previously described 3,9 andfor this work, <strong>the</strong> Protein ID (p/nG4240-62001) chip was used. Thischip includes a 40-nL enrichmentcolumn and a 75-µm x 43-mmanalytical column which are bothpacked <strong>with</strong> 5-µm 300A ZORBAX<strong>HPLC</strong>-<strong>Chip</strong> in chip holderfor use <strong>with</strong> <strong>the</strong> <strong>HPLC</strong>-<strong>Chip</strong> interfaceFigure 1Design <strong>of</strong> <strong>the</strong> Protein ID chip. The different elements necessary for nan<strong>of</strong>low LC/MS areintegrated on <strong>the</strong> <strong>HPLC</strong>-<strong>Chip</strong>.SB-C18. Figure 1 shows <strong>the</strong>components integrated ontothis micr<strong>of</strong>luidic <strong>HPLC</strong>-<strong>Chip</strong>.Components and workflows integratedon to <strong>the</strong> <strong>HPLC</strong>-<strong>Chip</strong> areoutlined in figure 2 and clearlyillustrate <strong>the</strong> requirement for flowswitching so that <strong>the</strong> sample can3
e loaded <strong>using</strong> higher flow ratesonto <strong>the</strong> enrichment column,flushed onto <strong>the</strong> analytical column,and <strong>the</strong>n analyzed by nan<strong>of</strong>lowLC/MS.<strong>Loading</strong>pump<strong>HPLC</strong>-<strong>Chip</strong>Waste<strong>Intelligent</strong> sample loadingThe <strong>HPLC</strong>-<strong>Chip</strong>/MS system includeda novel <strong>Intelligent</strong> <strong>Sample</strong> <strong>Loading</strong>(ISL) feature that decouples <strong>the</strong>sample loading process from <strong>the</strong>LC/MS analysis. ISL will allow <strong>the</strong>system to automatically calculate<strong>the</strong> required time to effectivelyload <strong>the</strong> sample. At <strong>the</strong> end <strong>of</strong>this time, <strong>the</strong> <strong>HPLC</strong>-<strong>Chip</strong> Cubemicrovalve will automaticallyswitch from enrichment to analysismode and <strong>the</strong> pump gradient andMS data acquisition will begin.This novel feature eliminates <strong>the</strong>need to adjust <strong>the</strong> method whenchanging <strong>the</strong> injection volume andsaves time by <strong>using</strong> <strong>the</strong> shortestpossible injection cycle. Fur<strong>the</strong>rmore,data file size is also reducedsince <strong>the</strong> MS data acquisitioncoincides <strong>with</strong> <strong>the</strong> switchingfrom enrichment to analysis modeinstead <strong>of</strong> starting at <strong>the</strong> beginning<strong>of</strong> <strong>the</strong> autosampler sample loadingcycle.<strong>Intelligent</strong> <strong>Sample</strong> <strong>Loading</strong> parametersAutomatic calculation <strong>of</strong> <strong>the</strong> optimumsample loading time requiresthat <strong>the</strong> <strong>HPLC</strong>-<strong>Chip</strong>/MS system has<strong>the</strong> ability to measure actual flowrates from <strong>the</strong> sample loadingpump and prior knowledge <strong>of</strong><strong>the</strong> capillary tubing delay volumebetween <strong>the</strong> autosampler seatand <strong>the</strong> enrichment column on<strong>the</strong> <strong>HPLC</strong>-<strong>Chip</strong>. This delay volumeplus a flush factor are defined as<strong>the</strong> injection flush volume (IFV)and is calculated as follows:IFV = (VSeatCap +VTransferCap)x factorwhere:InjectorFigure 2Workflow diagram for <strong>the</strong> <strong>HPLC</strong>-<strong>Chip</strong>/MS system.VSeatCap = delay volume <strong>of</strong> <strong>the</strong>µ-WPS seat capillaryVTransferCap = delay volume <strong>of</strong><strong>the</strong> capillary from µ-WPS to<strong>Chip</strong> Cubefactor: number <strong>of</strong> time to flush<strong>the</strong> delay volume.Typical values are:VSeatCap: 75 µm x 150 mm (blue)= 0.663 µLVSeatCap: 100 µm x 150 mm (black)= 1.178 µLVTransferCap: 25 µm x 1050 mm(yellow) = 0.515 µLfactor = 3 (typical flush factorsare in <strong>the</strong> range <strong>of</strong> 2 to 6)EnrichmentcolumnC18NanocolumnNan<strong>of</strong>lowLC pumpOnlineMS/MSFor this experiment, <strong>the</strong> <strong>HPLC</strong>-<strong>Chip</strong> Cube was used <strong>with</strong> 100-µmseat capillary and <strong>the</strong> IFV is:(1.178 µL + 0.515 µL) x 3,5 = 5.926 µL.Measurement <strong>of</strong> <strong>the</strong> actual flowrate from <strong>the</strong> capillary loadingpump is achieved by linking <strong>the</strong>loading pump to <strong>the</strong> <strong>HPLC</strong>-<strong>Chip</strong>Cube during <strong>the</strong> initial system setup.Linkage <strong>of</strong> <strong>the</strong> capillary loadingpump to <strong>the</strong> <strong>Chip</strong> Cube willallow <strong>the</strong> <strong>Chip</strong> Cube to monitorreal time flow from <strong>the</strong> capillaryloading pump and automaticallyadjust <strong>the</strong> sample loading timewhen <strong>the</strong> injection volume ischanged. <strong>Sample</strong> loading time isautomatically calculated by <strong>the</strong>system as follows:<strong>Sample</strong> loading time = IFV +injection volume / Actualcapillary loading pump flow4
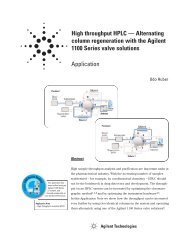
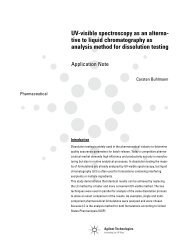
Thus, given an IFV <strong>of</strong> 5.926 µL,an injection volume <strong>of</strong> 1 µL anda flow rate <strong>of</strong> 4 µL/min at <strong>the</strong>capillary loading pump:<strong>Sample</strong> loading time:(5.926 µL + 1 µL) / 4 µL/min = 1.73 minFigure 3 illustrates <strong>the</strong> dialogbox from <strong>the</strong> Chemstation pumpconfiguration pull-down menurequired to link <strong>the</strong> capillary loadingpump and <strong>the</strong> nan<strong>of</strong>low pumpto <strong>the</strong> <strong>HPLC</strong>-<strong>Chip</strong> Cube. In additionto allowing real time measurement<strong>of</strong> flows, linking both pumps providean additional safety functionby allowing <strong>the</strong>m to react to <strong>the</strong>status <strong>of</strong> <strong>the</strong> <strong>Chip</strong> Cube and turn<strong>the</strong> flow <strong>of</strong>f when <strong>the</strong> chip is notin Operate (spraying) position.This ensures that no solvent isspilled into <strong>the</strong> <strong>Chip</strong> Cube while<strong>the</strong> chip tip is retracted or when<strong>the</strong> chip is unloaded and <strong>the</strong> valvestator ports are open.perform real time measurement<strong>of</strong> <strong>the</strong> capillary loading pump flowensures continued optimized sampleloading time throughout <strong>the</strong>lifetime <strong>of</strong> <strong>the</strong> <strong>HPLC</strong>-<strong>Chip</strong>. Thisensures that changing backpressures(and flows) will not affect<strong>the</strong> sample transfer.Smaller data file sizeDecoupling <strong>the</strong> sample loadingprocess from <strong>the</strong> LC/MS data acquisitionreduces <strong>the</strong> data file sizesince data acquisition is started at<strong>the</strong> same time <strong>the</strong> sample is transferredto <strong>the</strong> analytical nanocolumninstead <strong>of</strong> at <strong>the</strong> beginning <strong>of</strong> <strong>the</strong>sample injection cycle. Figure 4highlights <strong>the</strong> difference in runtime achieved when <strong>using</strong> ISL comparedto a microvalve time tablemethod for <strong>the</strong> ProMix tryptic peptidesample. In this example, dataacquisition time could be reducedby 16 % (from 51 to 43 min) anddata file size by 11 %. Reducing <strong>the</strong>acquisition time will increasethroughput. Smaller data files willaccelerate data processing timeand save valuable disk space on<strong>the</strong> host computer system.Identify more peptides <strong>with</strong> ISLFlow switching timing is criticalfor optimum loading <strong>of</strong> <strong>the</strong> sampleon to <strong>the</strong> enrichment column andtransfer to <strong>the</strong> analytical nanocolumn.Unfortunately, <strong>the</strong> process<strong>of</strong> selecting flow switching parameterscan be time consuming andrequire multiple experiments toselect and optimize all parameters.Because <strong>of</strong> this, sample loadingtimes are <strong>of</strong>ten set arbitrarilyfollowing a limited set <strong>of</strong> optimizationexperiments. Improper settings<strong>of</strong> <strong>the</strong> sample loading timewill significantly degrade <strong>the</strong>efficiency <strong>of</strong> <strong>the</strong> enrichmentprocess and negatively impactboth <strong>the</strong> amount and number <strong>of</strong>compounds retained on <strong>the</strong>enrichment column.1082.01.51.00.5Start <strong>of</strong> injection cycle and data acquisition<strong>Sample</strong> transfer to analytical nanocolumn, gradient startTT methodEnd <strong>of</strong> dataacquisitionFigure 3Pump configuration dialog box.Changing <strong>the</strong> injection volumeA change to <strong>the</strong> injection volumespecified in <strong>the</strong> method orautosampler sequence table willautomatically trigger a recalculation<strong>of</strong> <strong>the</strong> sample loading time.No o<strong>the</strong>r operator input isrequired. Over time, <strong>the</strong> enrichmentcolumn flow characteristicswill change and <strong>the</strong> ability to10 82.01.51.00.5<strong>Sample</strong> transfer to analytical nanocolumn,gradient and data acquisition startISL methodEnd <strong>of</strong> dataacquisition0 5 10 15 20 25 30 35 40 45 Time [min]Figure 4ProMix tryptic digest peptide sample <strong>using</strong> TimeTable (upper, TT) and ISL (lower, ISL).<strong>Sample</strong> analysis time was decreased by 18 %. Data file size was reduced by 11 %.5
Figures 5 and 6 clearly demonstratethis problem. In figure 5, <strong>the</strong>base peak chromatogram (BPC) <strong>of</strong>ProMix is compared <strong>using</strong> both amanual timetable (TT) and ISLapproach. For <strong>the</strong> most part, <strong>the</strong>BPC’s <strong>of</strong> both <strong>the</strong> TT and ISL runsappear to be identical. However,significant differences are noticeablein <strong>the</strong> initial part <strong>of</strong> <strong>the</strong> BPC<strong>with</strong> several more peaks observedin <strong>the</strong> sample analysed <strong>using</strong> ISL(figure 5). This is fur<strong>the</strong>r highlighted<strong>with</strong> <strong>the</strong> comparison <strong>of</strong> <strong>the</strong> peptideion maps generated from both<strong>the</strong> TT and ISL runs (figure 6).Zooming in on <strong>the</strong> initial segment<strong>of</strong> <strong>the</strong> peptide ion map <strong>of</strong> eachrun, we can clearly observe <strong>the</strong>additional peptides detected when<strong>using</strong> <strong>the</strong> ISL approach. For thisexample <strong>with</strong> <strong>the</strong> 8 proteinProMix tryptic digest sample, wewere able to detect 6.1 % morepeptides <strong>using</strong> ISL than <strong>with</strong> <strong>the</strong>TT approach. Table 3 highlights alist <strong>of</strong> additional peptides detected.Because <strong>of</strong> <strong>the</strong> overall chromatographicperformanceobserved for <strong>the</strong> TT approach(figure 6, left), <strong>the</strong> fact that <strong>the</strong>sample loading process was notfully optimized could have passedunnoticed and resulted in significantloss <strong>of</strong> information from <strong>the</strong>sample. This demonstrates <strong>the</strong>10 8 2.0TT method1.51.00.510 82.01.51.00.5ISL method0 5 10 15 20 25 30 35 40 45 Time [min]Figure 5BPC <strong>of</strong> ProMix <strong>with</strong> TT (top) and ISL (bottom) <strong>with</strong> scale expansion for first part <strong>of</strong> <strong>the</strong> BPC.Additional peaks are clearly visible in <strong>the</strong> ISL chromatogram.Figure 6Peptide ion map <strong>of</strong> ProMix <strong>with</strong> TT (left) and ISL (right). 6.1 % more peptides were detected <strong>using</strong>ISL. <strong>Sample</strong> loading on to <strong>the</strong> analytical nanocolumn occurred at t = 6 min for <strong>the</strong> TT approachand t = 0 for <strong>the</strong> ISL.m/z measured MH + MH +(Da) Matched (Da) Error (Da) Sequence RT (min) Intensity Protein1 667.83 1334.67 0.02 R.EFRPGIETTER.N 6.19 6.37e+008 Glycerol kinase2 503.34 1004.67 0.15 R.ETTIVWEK.E 9.00 0.90e+007 Glycerol kinase3 625.35 1249.62 0.09 R.FKDLGEEHFK.G 6.67 3.01e+008 BSA4 722.94 1443.87 0.25 K.YICDNQDTISSK.L 4.4 0.83e+007 BSA5 745.90 1490.71 0.08 R.LQSIGTENTEENR.R 2.65 2.51e+007 Aldolase6 481.82 962.57 0.07 K.DAQLFZIKK.A 8.94 7.56e+007 Catalase7 656.43 1310.85 0.17 K.RLCENIAGHLK.D 9.2 1.2e+007 Catalase8 740.36 1479.68 0.03 R.FNSANDDNVTQV.R 4.58 2.03e+008 Catalase9 575.90 1149.79 0.17 R.THYYAVAVVK.K 8 1.1e+007 Lactotransferrin10 498.43 994.85 0.32 R.RFTMELAK.K 9.1 0.70e+007 Glutamate dehydrogenase11 522.86 1043.71 0.14 R.QLLLTADDR.V 9 3.90e+007 AldolaseTable 3Additional ProMix peptides detected <strong>using</strong> <strong>Intelligent</strong> <strong>Sample</strong> <strong>Loading</strong>.6
critical aspect <strong>of</strong> optimizing sampleloading times and <strong>the</strong> advantages<strong>of</strong> <strong>using</strong> <strong>the</strong> automated ISLfeature <strong>of</strong> <strong>the</strong> <strong>HPLC</strong>-<strong>Chip</strong>/MSsystem.Conclusions<strong>Intelligent</strong> <strong>Sample</strong> <strong>Loading</strong> optimizessample loading on to <strong>the</strong>enrichment column and transferto <strong>the</strong> analytical nanocolumnwhen <strong>using</strong> <strong>the</strong> <strong>HPLC</strong>-<strong>Chip</strong>.Automation <strong>of</strong> <strong>the</strong> entire processensures that <strong>the</strong> operator canchange injection volumes <strong>with</strong>out<strong>the</strong> need to re-optimize methodparameters for sample loading.By automatically selecting <strong>the</strong>best parameters, ISL shortens<strong>the</strong> analysis time and reduces <strong>the</strong>data file size, saving disk storagespace and accelerating <strong>the</strong>data processing <strong>of</strong> <strong>the</strong> sample.Compared to a time table method,ISL automatically selects <strong>the</strong> mostefficient sample loading parametersallowing for <strong>the</strong> detection <strong>of</strong>additional peptides missed when<strong>using</strong> <strong>the</strong> timetable method.References1.Gauthier, G-L., Grimm, R.,“Miniaturisation: <strong>Chip</strong>-basedLiquid Chromatography andProteomics.” Drug DiscoveryToday, DDTEC., 3(1), 59-66,2006.2.“Performance <strong>of</strong> <strong>the</strong> Agilent 1100<strong>HPLC</strong>-<strong>Chip</strong>/MS System.” AgilentApplication Note, publicationnumber 5989-4148, 2005.3.“Comparison <strong>of</strong> <strong>HPLC</strong>-<strong>Chip</strong>/MS<strong>with</strong> conventional nan<strong>of</strong>lowLC/MS for proteomic analyses.”Agilent Application Note, publicationnumber 5989-3538, 2005.4.Fortier, M-H, Bonneil, E., Goodley,P., and Thibault, P., “IntegratedMicr<strong>of</strong>luidic Device for MassSpectrometry-Based Proteomicsand Its Application to BiomarkerDiscovery Programs,” Anal.Chem., 77(6), 1631-1640, 2005.5.Vollmer, M., Hörth, P., Rozing, G.,Couté, Y., Grimm, R., Hochstrasser,D., and Sanchez, J-C.,“Multi-dimensional <strong>HPLC</strong>/MS <strong>of</strong><strong>the</strong> nucleolar proteome <strong>using</strong><strong>HPLC</strong>-chip/MS.” J. Sep. Sci.,29(4) ,499-509, 2006.6.Ghitun, M., Bonneil, E., Fortier,M-H, Yin, H., Killeen, K. andThibault, P., “Integrated Micr<strong>of</strong>luidicDevices <strong>with</strong> EnhancedSeparation Performances;Application to PhosphoproteomeAnalyses <strong>of</strong> Differentiated CellModel Systems.” J. Sep. Sci.,in press 2006.7.Niñonuevo, M., An, H., Yin, H.,Killeen, K., Grimm, R., Ward, R.,German, B., and Lebrilla, C.,“Nanoliquid chromatography-massspectrometry <strong>of</strong> oligosaccharidesemploying graphitized carbonchromatography on microchip<strong>with</strong> a high-accuracy mass analyzer”Electrophoresis, 26, 3641–3649,2005.8.Kearney, P.; Thibault, P., “Bioinformaticsmeets proteomics –Bridging <strong>the</strong> gap between massspectrometry data analysis andcell biology” J. Bioinf. Comput.Biol., 1 (1), 183-200, 2003.9.Yin H., Killeen K., Brennen R.,Sobek D., Werlich M., and van deGoor T., “Micr<strong>of</strong>luidic <strong>Chip</strong> forPeptide Analysis <strong>with</strong> anIntegrated <strong>HPLC</strong> Column, <strong>Sample</strong>Enrichment Column, andNanoelectrospray Tip,” Anal.Chem., 77 (2), 527-533, 2005.7
Mihaela Ghitun and PierreThibault – Institute for Researchin Immunology and Cancer,Université de Montréal, Montréal,Canada and Department <strong>of</strong>Chemistry, Université deMontréal, Montréal, Canada;Eric Bonneil – Institute forResearch in Immunology andCancer, Université de Montréal,Montréal, Canada; Georges L.Gauthier – Agilent Technologies,Waldbronn, Germany; LindaCoté – Agilent Technologies,Montréal, Canadawww.agilent.com/chem/hplc-chipCopyright © 2006 Agilent TechnologiesAll Rights Reserved. Reproduction, adaptation ortranslation <strong>with</strong>out prior written permission isprohibited, except as allowed under <strong>the</strong> copyrightlaws.Published June 1, 2006Publication Number 5989-5222EN