stat_review_test2_sum07.tst - TestGen
stat_review_test2_sum07.tst - TestGen
stat_review_test2_sum07.tst - TestGen
- No tags were found...

Create successful ePaper yourself
Turn your PDF publications into a flip-book with our unique Google optimized e-Paper software.
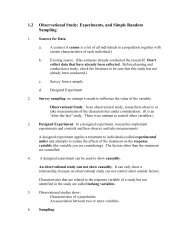
4)4)For the distribution drawn here, identify the mean, median, and mode.A) A = mode, B = mean, C = median B) A = mode, B = median, C = meanC) A = median, B = mode, C = mean D) A = mean, B = mode, C = medianSHORT ANSWER. Write the word or phrase that best completes each <strong>stat</strong>ement or answers the question.Obtain the population standard deviation, σ, for the given data. Assume that the data represent population data. Roundyour final answer to one more decimal place than that used for the observations. (Do this without using the <strong>stat</strong>isticalpackage in the calculator.)5) The normal annual precipitation (in inches) is given below for 8 different U.S. cities.5)9.0 7.0 6.3 13.019.4 6.8 10.2 17.6Provide an appropriate response.6) A group of medical researchers is interested in knowing the mean cholesterol level for allmen in the U.S. aged between 70 and 80. They pick a sample of 5,000 men and measuretheir cholesterol levels. They then calculate the mean and standard deviation of thesecholesterol levels. Do the mean and standard deviation obtained in this way representparameters or <strong>stat</strong>istics? Why? What symbols could you use to denote the mean andstandard deviation of the 5,000 cholesterol levels?6)Solve the problem.7) In a random sample, 10 students were asked to compute the distance they travel one wayto school to the nearest tenth of a mile. The data is listed below. Compute, by hand, therange, sample standard deviation and sample variance of the data.7)1.1 5.2 3.6 5.0 4.8 1.8 2.2 5.2 1.5 0.8Use the empirical rule to solve the problem.8) The systolic blood pressure of 18-year-old women is normally distributed with a mean of120 mmHg and a standard deviation of 12 mmHg. Approximately, what percentage of18-year-old women have a systolic blood pressure that lies within 3 standard deviationsto either side of the mean?8)2
Solve the problem.9) A study was designed to investigate the effects of two variables - (1) a studentʹs level ofmathematical anxiety and (2) teaching method - on a studentʹs achievement in amathematics course. Students who had a low level of mathematical anxiety were taughtusing the traditional expository method. These students obtained a mean score of 420 anda standard deviation of 40 on a standardized test. Find and interpret the z-score of astudent who scored 460 on the standardized test.9)MULTIPLE CHOICE. Choose the one alternative that best completes the <strong>stat</strong>ement or answers the question.10) The percentage of measurements that are above the 39th percentile isA) 39% B) 61%C) 71% D) cannot determine10)11) The weights (in pounds) of 30 preschool children are listed below. Find Q1. (Do not use the<strong>stat</strong>istical package in the calculator.)11)25 25 26 26.5 27 27 27.5 28 28 28.529 29 30 30 30.5 31 31 32 32.5 32.533 33 34 34.5 35 35 37 37 38 38A) 27 B) 28 C) 38 D) 25SHORT ANSWER. Write the word or phrase that best completes each <strong>stat</strong>ement or answers the question.12) The weights (in pounds) of 30 preschool children are listed below. Find the interquartilerange of the 30 weights listed below. (Do not use the <strong>stat</strong>istical package in the calculator.)12)25 25 26 26.5 27 27 27.5 28 28 28.529 29 30 30 30.5 31 31 32 32.5 32.533 33 34 34.5 35 35 37 37 38 3813) The following is a sample of 19 test scores from a geography class:52, 62, 66, 68, 72, 74, 74, 76, 76, 76, 78, 78, 82, 84, 84, 86, 88, 92, 96.13)Find the five-number summary. (Do this by hand. and show the steps.)14) The cholesterol levels (in milligrams per deciliter) of 30 adults are listed below. Draw amodified boxplot that represents the data. (You can use a calculator and sketch the graphpelow. Be srue that your scale is accurate.) Are there any outliers?14)154 156 165 165 170 171 172 180 184 185189 189 190 192 195 198 198 200 200 200205 205 211 215 220 220 225 238 255 2653
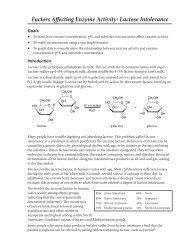
15) To study the physical fitness of a sample of 28 people, the data below were collectedrepresenting the number of sit-ups that a person could do in one minute.15)10 12 12 15 15 15 1820 22 25 25 26 29 3032 33 40 40 40 45 4647 48 48 50 52 53 56Determine the lower and upper fences. Are there any outliers according to this criterion?(You may use a calculator to help. )Solve the problem.16) In an area of the Midwest, records were kept on the relationship between the rainfall (ininches) and the yield of wheat (bushels per acre). Construct a scatter diagram for the data.Determine whether there is a positive linear correlation, negative linear correlation, or nolinear correlation.16)Rain fall (in inches), xYield (bushels per acre), y10.550.58.846.213.458.812.559.018.882.410.349.27.031.915.676.016.078.817) Construct a scatter diagram for the given data. Determine whether there is a positivelinear correlation, negative linear correlation, or no linear correlation.17)xy-511-3-6481-3-1-2-21052-536-47MULTIPLE CHOICE. Choose the one alternative that best completes the <strong>stat</strong>ement or answers the question.Use the scatter diagrams shown, labelled a through f to solve the problem.18)ab18)12y12y1010886644221 2 3 4 5 6x1 2 3 4 5 6x4
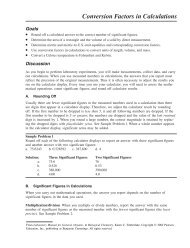
cd12y12y1010886644221 2 3 4 5 6x1 2 3 4 5 6 7xef12y12y1010886644221 2 3 4 5 6 7x1 2 3 4 5 6xIn which scatter diagram is r = -1?A) f B) b C) d D) aSHORT ANSWER. Write the word or phrase that best completes each <strong>stat</strong>ement or answers the question.Solve the problem.19) The data below are the ages and systolic blood pressures (measured in millimeters ofmercury) of 9 randomly selected adults. Calculate the correlation coefficient, r. (You canuse a calculator.)19)Age, xPressure, y33114361184012143129461404814352146561486015020) The data below are the temperatures on randomly chosen days during a summer class andthe number of absences on those days. Find the equation of the regression line for thegiven data. (You can use a calculator.)20)Temperature, xNumber of absences, y723857911090108889815754100158055
MULTIPLE CHOICE. Choose the one alternative that best completes the <strong>stat</strong>ement or answers the question.21) Is there a relationship between the raises administrators at State University receive and theirperformance on the job?21)A faculty group wants to determine whether job rating (x) is a useful linear predictor of raise (y).Consequently, the group considered the straight-line regression modely^ = β0 + β1x.Using the method of least squares, the faculty group obtained the following prediction equation:Interpret the estimated y-intercept of the line.y^ = 14,000 - 2,000xA) For an administrator who receives a rating of zero, we estimate his or her raise to be $14,000.B) For a 1-point increase in an administratorʹs rating, we estimate the administratorʹs raise toincrease $14,000.C) The base administrator raise at State University is $14,000.D) There is no practical interpretation, since rating of 0 is nonsensical and outside the range ofthe sample data.22) Is there a relationship between the raises administrators at State University receive and theirperformance on the job?22)A faculty group wants to determine whether job rating (x) is a useful linear predictor of raise (y).Consequently, the group considered the straight-line regression modely^ = β0 + β1x.Using the method of least squares, the faculty group obtained the following prediction equation:Interpret the estimated slope of the line.y^ = 14,000 - 2,000xA) For an administrator with a rating of 1.0, we estimate his/her raise to be $2,000.B) For a 1-point increase in an administratorʹs rating, we estimate the administratorʹs raise todecrease $2,000.C) For a $1 increase in an administratorʹs raise, we estimate the administratorʹs rating todecrease 2,000 points.D) For a 1-point increase in an administratorʹs rating, we estimate the administratorʹs raise toincrease $2,000.6
SHORT ANSWER. Write the word or phrase that best completes each <strong>stat</strong>ement or answers the question.23) The data below are the final exam scores of 10 randomly selected <strong>stat</strong>istics students andthe number of hours they studied for the exam. What is the best predicted value for ygiven x = 8? (You can use a calculator to find the regresion equation.)23)Hours, xScores, y36558026088826647848559069037124) The regression line for the given data is y^ = 0.449x - 30.27.24)Temperature, xNumber of absences, y72385791109010888981575410015805Determine the residual of a data point for which x = 90 and y = 10.25) Calculate the coefficient of determination, given that the linear correlation coefficient, r, is0.837. What does this tell you about the explained variation and the unexplained variationof the data about the regression line?25)26) In a study of feeding behavior, zoologists recorded the number of grunts of a warthogfeeding by a lake in the 15 minute period following the addition of food. The data showingthe weekly number of grunts and and the age of the warthog (in days) are listed below:26)Number of Grunts Age (days)88 12366 13937 15342 15861 16538 17260 18115 18718 193Find and interpret the value of R2. (You may use a calculator to find R2.)MULTIPLE CHOICE. Choose the one alternative that best completes the <strong>stat</strong>ement or answers the question.27) Which of the following cannot be a probability?A) 0.001 B)63C) -55 D) 027)28) Which of the following probabilities for the sample points A, B, and C could be true if A, B, and Care the only sample points in an experiment?28)A) P(A) = -1/4, P(B) = 1/2, P(C) = 3/4 B) P(A) = 1/4, P(B) = 1/4, P(C) = 1/4C) P(A) = 0, P(B) = 1/14, P(C) = 13/14 D) P(A) = 1/8, P(B) = 1/7, P(C) = 1/107
SHORT ANSWER. Write the word or phrase that best completes each <strong>stat</strong>ement or answers the question.Solve the problem.29) Identify the sample space of the probability experiment: determining the childrenʹs genderfor a family of three children (Use B for boy and G for girl.)29)30) If sample points A, B, C, and D, are the only possible outcomes of an experiment, find theprobability of D using the table below.30)Sample Point A B C DProbability 1/10 1/10 1/10.MULTIPLE CHOICE. Choose the one alternative that best completes the <strong>stat</strong>ement or answers the question.31)31) The table below represents a random sample of the number of deaths per 100 cases for a certainA) 1 35 ; 0.029 B) 35; 0.3510035C)65 ; 0.538 D) 7120 ; 0.058illness over time. If a person infected with this illness is randomly selected from all infected people,find the probability that the person lives 3-4 years after diagnosis.Years after Diagnosis Number deaths1-2 153-4 355-6 167-8 99-10 611-12 413-14 215+ 13TRUE/FALSE. Write ʹTʹ if the <strong>stat</strong>ement is true and ʹFʹ if the <strong>stat</strong>ement is false.Solve the problem.32) The probability that event A will occur isNumber of successful outcomesP(A) =Total number of all possible outcomes32)SHORT ANSWER. Write the word or phrase that best completes each <strong>stat</strong>ement or answers the question.33) A die is rolled. The set of equally likely outcomes is {1, 2, 3, 4, 5, 6}. Find the probability ofgetting a 2.33)8
Find the indicated probability.34) A committee of three people is to be formed. The three people will be selected from a listof five possible committee members. A simple random sample of three people is taken,without replacement, from the group of five people. If the five people are represented bythe letters A, B, C, D, E, the possible outcomes are as follows.34)ABCABDABEACDACEADEBCDBCEBDECDEDetermine the probability that C and D are both included in the sample.List the outcomes comprising the specified event.35) In a competition, two people will be selected from four finalists to receive the first andsecond prizes. The prize winners will be selected by drawing names from a hat. Thenames of the four finalists are Jim, George, Helen, and Maggie. The possible outcomes canbe represented as follows.35)JG JH JM GJ GH GMHJ HG HM MJ MG MHHere, for example, JG represents the outcome that Jim receives the first prize and Georgereceives the second prize. List the outcomes that comprise the following event.A = event that Helen gets a prizeMULTIPLE CHOICE. Choose the one alternative that best completes the <strong>stat</strong>ement or answers the question.Solve the problem.36) In 1999 the stock market took big swings up and down. A survey of 993 adult investors asked howoften they tracked their portfolio. The table shows the investor responses. What is the probabilitythat an adult investor tracks his or her portfolio daily?How frequently? ResponseDaily 231Weekly 283Monthly 280Couple times a year 141Donʹt track 58A) 280993; 0.282 B)14199336)283231; 0.142 C) ; 0.285 D)993 993 ; 0.2339
SHORT ANSWER. Write the word or phrase that best completes each <strong>stat</strong>ement or answers the question.37) The distribution of Masterʹs degrees conferred by a university is listed in the table.(assume that a student majors in only one subject)37)Major FrequencyMathematics 216English 207Engineering 92Business 178Education 217What is the probability that a randomly selected student with a Masterʹs degree majoredin Business, Education or Engineering? Round your answer to three decimal places.MULTIPLE CHOICE. Choose the one alternative that best completes the <strong>stat</strong>ement or answers the question.38) One hundred people were asked, ʺDo you favor the death penalty?ʺ Of the 33 that answered ʺyesʺto the question, 14 were male. Of the 67 that answered ʺnoʺ to the question, six were male. If oneperson is selected at random, what is the probability that this person answered ʺyesʺ or was amale?38)A) 0.53 B) 0.39 C) 0.13 D) 0.6739) A sample of 280 shoppers at a large suburban mall were asked two questions: (1) Did you see atelevision ad for the sale at department store X during the past 2 weeks? (2) Did you shop atdepartment store X during the past 2 weeks? The responses to the questions are summarized in thetable.39)Shopped at X Did Not Shop at XSaw ad 135 40Did not see ad 40 65What is the probability that a randomly selected shopper from the 280 questioned did not shop atdepartment store X?A) 0.625 B) 0.143 C) 0.375 D) 0.23210
SHORT ANSWER. Write the word or phrase that best completes each <strong>stat</strong>ement or answers the question.List the outcomes comprising the specified event.40) In a competition, two people will be selected from four finalists to receive the first andsecond prizes. The prize winners will be selected by drawing names from a hat. Thenames of the four finalists are Jim, George, Helen, and Maggie. The possible outcomes canbe represented as follows.40)JG JH JM GJ GH GMHJ HG HM MJ MG MHHere, for example, JG represents the outcome that Jim receives the first prize and Georgereceives the second prize. The events A and B are defined as follows.A = event that Helen gets first prizeB = event that George gets a prizeList the outcomes that comprise the event (A or B).MULTIPLE CHOICE. Choose the one alternative that best completes the <strong>stat</strong>ement or answers the question.Describe the specified event in words.41) When a quarter is tossed four times, 16 outcomes are possible.41)HHHH HHHT HHTH HHTTHTHH HTHT HTTH HTTTTHHH THHT THTH THTTTTHH TTHT TTTH TTTTHere, for example, HTTH represents the outcome that the first toss is heads, the next two tossesare tails, and the fourth toss is heads. The events A and B are defined as follows.A = event exactly two tails are tossedB = event the first toss is headsDescribe the event (A or B) in words.A) Event that exactly two tails are tossed and the first toss is headsB) Event that exactly two tails are tossed or the first toss is heads but not bothC) Event that exactly two tails are tossed or the first toss is heads or bothD) Event that the first toss is heads or the last two tosses are tails or both11
SHORT ANSWER. Write the word or phrase that best completes each <strong>stat</strong>ement or answers the question.Find the indicated probability by using the special addition rule.42) A percentage distribution is given below for the size of families in one U.S. city.42)Size Percentage2 46.43 24.54 14.05 9.16 4.07+ 2.0A family is selected at random. Find the probability that the size of the family is at most 3.Round approximations to three decimal places.MULTIPLE CHOICE. Choose the one alternative that best completes the <strong>stat</strong>ement or answers the question.43) Given that P(A or B) = 1 2 , P(A) = 1 4 , and P(A and B) = 1 , find P(B).943)A) 1336B) 3136C) 2336D) 5 24Solve the problem.44) The following Venn diagram is for the six sample points possible when rolling a fair die. Let A bethe event rolling an even number and let B be the event rolling a number greater than 1.44)Which of the following events describes the event rolling a 1?A) B B) A C) B D) A ∪ B45) In 5-card poker, played with a standard 52-card deck, 2,598,960 different hands are possible. Ifthere are 624 different ways a ʺfour-of-a-kindʺ can be dealt, find the probability of not being dealta ʺfour-of-a-kindʺ.A)6242,598,960B)12482,598,960C)6252,598,960D) 2,598,3362,598,96045)12
Answer KeyTestname: STAT_REVIEW_TEST2_SUM071) D2) mean: $315,767; median: $175,195; the median3) C4) B5) 4.72 in.6) The mean and standard deviation represent <strong>stat</strong>istics since they are descriptive measures for a sample. They aredenoted by x and s, respectively.7) range = 4.4, s = 1.8, s2 = 3.3248) 99.7%9) The z-score is z = x - μσ .460 - 420For a score of 46, z = = 1.00.40This studentʹs score falls 1.00 standard deviations above the mean score of 420.10) B11) B12) IQR = Q3 - Q1 = 34 - 28 = 613) 52, 72, 76, 84, 9614)15) lower fence = -22.25; upper fence = 87.75; outliers: none16)There appears to be a positive linear correlation between the variables.13
Answer KeyTestname: STAT_REVIEW_TEST2_SUM0717)There appears to be no linear correlation.18) D19) 0.96020) y^ = 0.449x - 30.2721) A22) B23) 9624) -0.1425) The coefficient of determination, R2, = 0.701. That is, 70.1% of the variation is explained by the regression line for xvalues and 29.9% of the variation is unexplained.26) r2 = .627; Approximately 62.7% of the variation in the number of grunts is explained by age.27) C28) C29) (BBB), (BBG), (BGB), (GBB), (BGG), (GBG), (GGB), (GGG)30) 7/1031) B32) TRUE33) 1 6334)1035) JH, GH, HJ, HG, HM, MH36) D37) 0.53538) B39) C40) JG, GJ, GH, GM, HJ, HG, HM, MG41) C42) 0.70943) A44) C45) D14