- Page 1 and 2:
NIH CurriculumSupplement SeriesGrad
- Page 3 and 4:
Education Development Center, Inc.D
- Page 5 and 6:
This material is based on work supp
- Page 7 and 8:
About the National Institutes of He
- Page 10:
Introduction
- Page 13 and 14:
activity of assessing different rea
- Page 15 and 16:
teaching strategies that will help
- Page 17 and 18:
2. The ability to distinguish an et
- Page 19 and 20:
quence of choosing one path over an
- Page 21 and 22:
Table 1. Assessing Student Justific
- Page 23 and 24:
Challenges in TeachingBioethics and
- Page 25 and 26:
How Exploring Bioethics Can HelpFor
- Page 27 and 28:
Prompts to encourage students to re
- Page 29 and 30:
Table 2d. Students say they already
- Page 31 and 32:
Resources forTeaching BioethicsBeau
- Page 33 and 34:
Table 3. Ethical Issues and Curricu
- Page 35 and 36:
Each module is divided into three d
- Page 37 and 38:
Table 4. Alignment with NSES Life S
- Page 39 and 40:
About the Web SiteThe Web site for
- Page 42 and 43:
1Module 1Bioethics Concepts and Ski
- Page 44 and 45:
• apply important ethical conside
- Page 46 and 47:
In Advance1Copies, Equipment, and M
- Page 48 and 49:
Teaching Sequence1Day 1: What’s i
- Page 50 and 51:
new medication, she is able to stay
- Page 52 and 53:
6. Read the list of Round 1 questio
- Page 54 and 55:
• With respect to performance enh
- Page 56 and 57:
LE/LE/LLE/LPoint out that some of t
- Page 58 and 59:
Organizer for Day 1: What’s in a
- Page 60 and 61:
Day 2: Four Key Questions1PurposeDa
- Page 62 and 63:
4. Emphasize that when bioethicists
- Page 64 and 65:
15. Ask students to list as many et
- Page 66 and 67:
Organizer for Day 2: Four Key Quest
- Page 68 and 69:
Encourage students to share example
- Page 70 and 71:
Activity 7:Using Ethical Considerat
- Page 72 and 73:
4. Ask a representative from each g
- Page 74 and 75:
Organizer for Day 3: Core Ethical C
- Page 76 and 77:
References and Resources1Informatio
- Page 78 and 79:
What Type of Question? ROUND 1—Et
- Page 80 and 81:
What Type of Question? ROUND 3: Eth
- Page 82 and 83:
Round 4Q9Should embryonic stem cell
- Page 84 and 85:
Oscar Pistorius—The Fastest Man w
- Page 86 and 87:
Four Key Questions and Statementof
- Page 88 and 89:
Carl’s CaseCarl listened to his t
- Page 90 and 91:
1Module 2Balancing Individual and C
- Page 92 and 93:
adopting vaccination policies that
- Page 94 and 95:
In Advance1Copies, Equipment, and M
- Page 96 and 97:
Teaching Sequence1Day 1: Exploring
- Page 98 and 99:
the key stakeholders, and taken int
- Page 100 and 101:
You may wish to highlight the dange
- Page 102 and 103:
ClosureAsk students to reflect on t
- Page 104 and 105:
Day 2: Community Immunity1PurposeOn
- Page 106 and 107:
10. Ask all students in the class t
- Page 108 and 109:
• While an unvaccinated person’
- Page 110 and 111:
ClosureRecap for students that the
- Page 112 and 113: Tell only the students who were tag
- Page 114 and 115: 5. Divide students into pairs, and
- Page 116 and 117: 17. Share with students that becaus
- Page 118 and 119: 13. Note that the Boston and Dublin
- Page 120 and 121: Teaching StrategiesYou may want to
- Page 122 and 123: Ask each member of the pair to read
- Page 124 and 125: 1Centers for Disease Control and Pr
- Page 126 and 127: Get Kids Vaccinated or ElseGet Kids
- Page 128 and 129: Name(s)Station 2—Vaccine RisksDir
- Page 130 and 131: Station 1: Vaccine-Preventable Dise
- Page 132 and 133: MumpsBefore the mumps vaccine was i
- Page 134 and 135: Station 2—Vaccine RisksNote: Like
- Page 136 and 137: Smallpox VaccineThe smallpox vaccin
- Page 138 and 139: Station 4—ExemptionsExemptions vs
- Page 140 and 141: State Exemptions Allowed as of Fall
- Page 142 and 143: Name(s)What are the ethical conside
- Page 144 and 145: Vaccination Status CardsVaccinated
- Page 146 and 147: Opting Out of a Vaccine—Variables
- Page 148 and 149: Measles in DublinIn 2000, an outbre
- Page 150: What are some of the different pers
- Page 153 and 154: Issues Explored• What is the fair
- Page 155 and 156: Day 3—What Is Your Recommendation
- Page 157 and 158: Teaching SequenceNoteAssign this ho
- Page 159 and 160: Teaching Strategies: Jigsaw Techniq
- Page 161: Some students might think that the
- Page 165 and 166: Inform students that they will now
- Page 167 and 168: 2. Tell them that one liver has bec
- Page 169 and 170: 6. If it does not naturally arise,
- Page 171 and 172: Criteria relevant to allocating liv
- Page 173 and 174: Organizer for Day 2: Identifying St
- Page 175 and 176: Day 3: What Is Your Recommendation?
- Page 177 and 178: Activity 9:Understanding Past and C
- Page 179 and 180: ClosureReinforce to students that t
- Page 181 and 182: Ask students whether they think the
- Page 183 and 184: Liver Function and FailureHepatitis
- Page 185 and 186: Name(s)Banting decided that he woul
- Page 187 and 188: Name(s)The COC distributed the peni
- Page 189 and 190: Name(s)The Admissions and Policy Co
- Page 191 and 192: Liver and Liver-Transplant Fact She
- Page 193 and 194: The Liver and Liver Transplants—C
- Page 195 and 196: Patient ProfilesAnitaAnita is a 19-
- Page 197 and 198: Additional Patient InformationAnita
- Page 199 and 200: The United Network for Organ Sharin
- Page 201 and 202: Comparing the Past and Current UNOS
- Page 204 and 205: 1Module 4Weighing Benefits and Harm
- Page 206 and 207: An optional extension activity incl
- Page 208 and 209: In Advance1Preparing the Envelopes
- Page 210 and 211: Teaching Sequence1Day 1: Deciding t
- Page 212 and 213:
6. Explain that each student should
- Page 214 and 215:
Activity 2:Introducing Max’s Thyr
- Page 216 and 217:
See Teacher Support MaterialsSupple
- Page 218 and 219:
ClosureTo close the class, remind s
- Page 220 and 221:
1Activity 2: Introducing Max’s Th
- Page 222 and 223:
Activity 5:Who or What Will Be Affe
- Page 224 and 225:
Activity 6:Exploring the Relevant E
- Page 226 and 227:
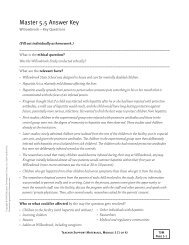
11. Give each student a copy of Mas
- Page 228 and 229:
1Ask students, “What are some rea
- Page 230 and 231:
5. Have students, in pairs, quickly
- Page 232 and 233:
ReflectionDisplay the posters from
- Page 234 and 235:
1Reflection: Have students view the
- Page 236:
1Retinitis PigmentosaFoundation Fig
- Page 239 and 240:
Alzheimer’s Disease and Genetic T
- Page 241 and 242:
Name(s)Now, on your own, answer the
- Page 243 and 244:
Name(s)Max’s Family Tree on His M
- Page 245 and 246:
Genetic Testing—Key Concepts• S
- Page 247 and 248:
What Impact Would Max’s Newly Dis
- Page 249 and 250:
Your Tentative ThoughtsName(s)1. Do
- Page 251 and 252:
Ethical Questions• Who should dec
- Page 253 and 254:
Extension (Optional)About Retinitis
- Page 255 and 256:
Issues Explored• Why is it import
- Page 257 and 258:
Key Science Knowledge*• Nature of
- Page 259 and 260:
Teaching SequenceDay 1: Research wi
- Page 261 and 262:
13. Ask students, “Should I just
- Page 263 and 264:
Some students in the treatment grou
- Page 265 and 266:
it is ethically acceptable. For exa
- Page 267 and 268:
Students should recognize that rese
- Page 269 and 270:
ClosureAsk the class whether they t
- Page 271 and 272:
Organizer for Day 1: Research with
- Page 273 and 274:
Activity 4: Returning to Your Decis
- Page 275 and 276:
5. Discuss the results with the who
- Page 277 and 278:
5. Summarize two key points about r
- Page 279 and 280:
• The Belmont Report has served a
- Page 281 and 282:
Organizer for Day 2:Harms and Benef
- Page 283 and 284:
Day 3: Analyzing the Willowbrook Ca
- Page 285 and 286:
Deciding on and Recording Main Poin
- Page 287 and 288:
Organizer for Day 3: Analyzing the
- Page 289 and 290:
Willowbrook StudyCenters for Diseas
- Page 291 and 292:
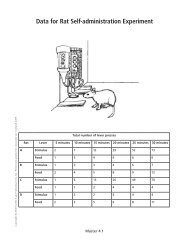
Asthma Simulation OutcomesYou were
- Page 293 and 294:
Name(s)Reflection Questions1. Aside
- Page 295 and 296:
Letter to ParentsThis is the letter
- Page 297 and 298:
What Are the Relevant Ethical Consi
- Page 299 and 300:
Name(s)(Fill out with your partner.
- Page 301 and 302:
Name(s)(Fill out individually.)Your
- Page 303 and 304:
Issues Explored• Should there be
- Page 305 and 306:
Key Science Knowledge*• DNA, RNA,
- Page 309 and 310:
4. Ask students for their prelimina
- Page 311 and 312:
8. Tell students to come to the nex
- Page 313 and 314:
Day 2: Deepening Your Thinking—So
- Page 316 and 317:
You may wish to note that• Cases
- Page 318 and 319:
2. Direct students to turn to their
- Page 320 and 321:
Organizer for Day 2: Deepening Your
- Page 322 and 323:
Day 3: Making a Recommendation—Se
- Page 324 and 325:
Those cases where students do not t
- Page 326 and 327:
3. Ask a representative from each g
- Page 328 and 329:
Activity 9: Returning to Alba’s C
- Page 330 and 331:
1Ear MiceBBC News. 2002. Artificial
- Page 332 and 333:
Alba’s CaseSince the early 1990s,
- Page 334 and 335:
Dyed FeathersPeople dye bird feathe
- Page 336 and 337:
Giant Panda BreedingThe giant panda
- Page 338 and 339:
Mad-Cow-Disease CowsMad cow disease
- Page 340 and 341:
Purebred DogsHumans have geneticall
- Page 342 and 343:
Spider-Silk GoatsSpider silk is str
- Page 344 and 345:
VealVeal is meat from calves that i
- Page 346 and 347:
Assessing Harms, Benefits, and Pote
- Page 348 and 349:
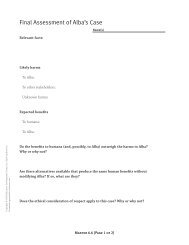
Final Assessment of Alba’s CaseRe
- Page 350:
This curriculum supplementwas devel