determination of btex in water samples by gas chromatography with ...
determination of btex in water samples by gas chromatography with ...
determination of btex in water samples by gas chromatography with ...

You also want an ePaper? Increase the reach of your titles
YUMPU automatically turns print PDFs into web optimized ePapers that Google loves.
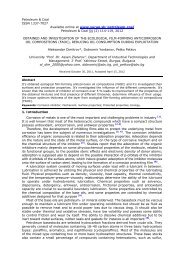
H.Jurdáková et al./Petroleum & Coal 47(3) 49-53 (2005) 52The effect <strong>of</strong> <strong>in</strong>jection port temperature is the most significant (major colour change along T axis). Lesssignificant is the effect <strong>of</strong> <strong>in</strong>jection volume (weak colour change along V <strong>in</strong>j axis) what can be expla<strong>in</strong>ed <strong>by</strong>undercool<strong>in</strong>g <strong>of</strong> <strong>in</strong>jection port at <strong>in</strong>jection <strong>of</strong> large sample volume. The concentration <strong>of</strong> analytes <strong>in</strong> the range<strong>of</strong> 12,7 - 147 mg.l -1 has no effect on the sorption-desorption process (no colour change along c axis).Accord<strong>in</strong>g to this optimization the <strong>in</strong>jection port temperature <strong>of</strong> 70 °C and stripp<strong>in</strong>g time <strong>of</strong> 3 m<strong>in</strong>utes waschosen to reach 95 % recovery <strong>of</strong> desorbed analytes and m<strong>in</strong>imal penetration <strong>of</strong> <strong>water</strong> from <strong>in</strong>jection port tocapillary column. To determ<strong>in</strong>e the limits <strong>of</strong> detection and quantification was chosen the sampl<strong>in</strong>g volume <strong>of</strong>250 μl, the highest volume <strong>of</strong> <strong>water</strong> sample reta<strong>in</strong>ed <strong>in</strong> the <strong>in</strong>jection port <strong>by</strong> used amount <strong>of</strong> Chromosorb PNAW.The calibration dependences are l<strong>in</strong>ear <strong>in</strong> full concentration range (5 - 5000 μg.l -1 ) at each sampl<strong>in</strong>gvolume (10, 100 and 250 μl) what <strong>in</strong>dicate high values <strong>of</strong> coefficients <strong>of</strong> <strong>determ<strong>in</strong>ation</strong> r 2 for all components,rang<strong>in</strong>g from 0,996 to 0,9999. After sampl<strong>in</strong>g <strong>of</strong> higher concentration (5 000 μg.l -1 ) the pure <strong>water</strong> was<strong>in</strong>jected to <strong>in</strong>vestigate the memory effect. No peak was detected <strong>in</strong> the elution area <strong>of</strong> BTEX.For large volume direct aqueous <strong>in</strong>jection method, the LOD values <strong>of</strong> BTEX are from 0,6 to 1,1 μg.l -1and LOQ values are from 2,0 to 3,6 μg.l -1 (Table I).Table I The values <strong>of</strong> limits <strong>of</strong> quantification (LOQ) and detection (LOD) for large volume direct aqueous<strong>in</strong>jection method.AnalyteLODLOQ(μg.l -1 ) (μg.l -1 )Benzene 0,6 2,0Toluene 0,9 3,0Ethylbenzene 0,9 3,0p-Xylene 1,0 3,3o-Xylene 1,1 3,6The progressive trend (from benzene to o-xylene) <strong>of</strong> this values results from the fact that at 3 m<strong>in</strong>utesstripp<strong>in</strong>g time approximately 95 % <strong>of</strong> <strong>in</strong>jected o-xylene mass penetrate to the column from <strong>in</strong>jection port whilefor benzene it is approximately 98 % (Fig. 2). Reached LOD and LOQ values are lower <strong>by</strong> two orders thanthose reached <strong>by</strong> methods <strong>of</strong> direct aqueous <strong>in</strong>jection and flame ionization detection before, and are belowthe normalized quality limit for dr<strong>in</strong>k<strong>in</strong>g <strong>water</strong> (5; 1 000; 700 and 10 000 μg.l -1 for benzene, toluene,ethylbenzene, m- and p-xylene, o-xylene, respectively [9] ), which makes this method suitable for monitor<strong>in</strong>g <strong>of</strong>BTEX <strong>in</strong> <strong>water</strong> <strong>samples</strong> at trace levels.Fig. 4 Chromatogram <strong>of</strong> <strong>water</strong> sample contam<strong>in</strong>ated <strong>with</strong> <strong>gas</strong>ol<strong>in</strong>e at sampl<strong>in</strong>g volume 250 μl and <strong>gas</strong>ol<strong>in</strong>econcentration <strong>of</strong> 1 mg.l -1 . 1 – benzene; 2 – toluene; 3 – ethylbenzene; 4 – p-, m-xylene; 5 – o-xylene.In Fig. 4 is shown the chromatogram <strong>of</strong> <strong>water</strong> sample contam<strong>in</strong>ated <strong>with</strong> <strong>gas</strong>ol<strong>in</strong>e. Determ<strong>in</strong>atedconcentrations were 8, 45, 16, 35 and 25 μg.l -1 for benzene, toluene, ethylbenzene, m- and p-xylene, o-xylene, respectively. After <strong>in</strong>jection <strong>of</strong> pure river <strong>water</strong> no peak was detected <strong>in</strong> the elution area <strong>of</strong> BTEX.
H.Jurdáková et al./Petroleum & Coal 47(3) 49-53 (2005) 53CONCLUSIONSA new solventless method employs Chromosorb P NAW <strong>in</strong> the l<strong>in</strong>er <strong>of</strong> <strong>in</strong>jection port as a sorbentmaterial to reta<strong>in</strong> <strong>water</strong> <strong>in</strong> the <strong>in</strong>jection port while the BTEX are stripped <strong>in</strong>to the column. This arrangementenables direct <strong>in</strong>jection <strong>of</strong> large volume <strong>of</strong> <strong>water</strong> sample at us<strong>in</strong>g capillary <strong>gas</strong> <strong>chromatography</strong> to determ<strong>in</strong>evolatile organic compounds BTEX. The developed large volume direct aqueous <strong>in</strong>jection method is suitablefor the analysis <strong>of</strong> BTEX <strong>in</strong> dr<strong>in</strong>k<strong>in</strong>g and river <strong>water</strong> <strong>samples</strong> concern<strong>in</strong>g the reached detection andquantification limits. The ma<strong>in</strong> advantages <strong>of</strong> this method lie ma<strong>in</strong>ly <strong>in</strong> facility, time sav<strong>in</strong>g (no enrichement orpre-treatment steps are required) and lower price <strong>of</strong> analysis <strong>in</strong> comparison <strong>with</strong> any other method (purgeand-trap,SPME).AcknowledgementsThe authors thank the Grant Agency VEGA (grant No. 1/2467/05), Slovak-German project STC(Nem/Slov/BMBF/UK/03), Slovak-Czech project STC (grant No. 011) and Comenius University <strong>in</strong> Bratislava(grant No. UK/165/2005), Slovakia, for the f<strong>in</strong>ancial support <strong>of</strong> this research.References[1] J. Namiesnik, W. Wardencki, J. High Resol. Chromatogr., 23, 297, 2000.[2] D.F. Gurka, S.P. Pyle, R. Titus, Anal. Chem., 64, 1749-1754, 1992.[3] L. Zwank, T.C. Schmidt, S.B. Haderle<strong>in</strong>, M. Berg, Environ. Sci. Technol., 36, 2054-2059 , 2002.[4] S.K. Golf<strong>in</strong>opoulos, T.D. Lekkas, A.D. Nikolaou, Chemosphere, 45, 275-284, 2001.[5] M. Straková, E. Matisová, Chem. Listy, 91, 330-341, 1997.[6] P. Kuráň, L. Soják, J. <strong>of</strong> Chromatogr. A, 733, 119-141, 1996.[7] N.J. Sung, S.I. Johnson, A. Zlatkis, B.S. Middleditch, J. High Resol. Chromatogr. and Chromatogr.Communi., 409-410, 1988.[8] H. Erfurth, G. Just, Modelování a optimalizace chemických procesú, SNTL, Praha, 1979, 47-51.[9] http://www.envirotools.org/factsheets/<strong>btex</strong>.shtml.