![[Eng] Nov 2012 DRAFT - The Curriculum Project](https://img.yumpu.com/45590859/1/500x640/eng-nov-2012-draft-the-curriculum-project.jpg)
[Eng] Nov 2012 DRAFT - The Curriculum Project
[Eng] Nov 2012 DRAFT - The Curriculum Project
[Eng] Nov 2012 DRAFT - The Curriculum Project
- No tags were found...

You also want an ePaper? Increase the reach of your titles
YUMPU automatically turns print PDFs into web optimized ePapers that Google loves.
<strong>DRAFT</strong>October <strong>2012</strong>About this bookActivities for the Science Classroom contains over 50 activities and experiments to helpscience teachers bring their classes to life, for themselves and for their students. We have organisedthe activities into four main sections:General Science looks at some of the most basic concepts we need to understand our world,gives ideas for making simple instuments, and suggests ways to measure, test and classify ourobservations.Physics looks at motion and Newton’s laws, sound, electricity, pressure, light and heat.Chemistry examines chemical reactions, acids, chromatography and isotopes and radioactivity.Biology covers both human and animal bodies, plants, cells and basic ecology.At the back of the book is a Glossary explaining all the terms in this style, and a Materials Listwith all the items you need for each section of the book.We selected the experiments and activities in this book because:►►they are easy to prepare, using (mostly) everyday objects, fluids and household equipment►►they have been used successfully by trainers who work with Myanmar science teachers►►they don’t have complicated instructions►►they clearly illustrate important conceptsWe hope you find this resource challenging, interesting and fun. Please send us your feedback so wecan improve it for the next edition.www.thabyay.orgThis material is produced by Educasia and <strong>The</strong> <strong>Curriculum</strong><strong>Project</strong>(CP), both programs of Thabyay Education Foundation.Educasia and CP produce context-appropriate learningmaterials, provide curriculum advice and deliver teachertraining to a wide range of adult education programs inThailand and Myanmar. For more information please visit ourwebsites: www.curriculumproject.org; www.educasia.orgActivities for the Science Classroom 1
List of Activities1. Introduction ............................................................................................................................................................................................................5GENERAL SCIENCE ...........................................................................................................................................................................................................62. Equipment ................................................................................................................................................................................................................62.1 Measuring Instruments ........................................................................................................................................................................62.2 Heating – Making a Coke Can Burner .........................................................................................................................................93. <strong>The</strong> Scientific Method ....................................................................................................................................................................................103.1 Ice Melting and Variables .................................................................................................................................................................103.2 Reaction Time ...........................................................................................................................................................................................113.3 Graphing ......................................................................................................................................................................................................124. Classification ........................................................................................................................................................................................................154.1 Classifying Your Class’s Shoes ........................................................................................................................................................15PHYSICS ...............................................................................................................................................................................................................................165. Motion .....................................................................................................................................................................................................................165.1 Distance and Time .................................................................................................................................................................................165.2 Motion of a Pendulum ........................................................................................................................................................................175.3 Hooke’s Law ...............................................................................................................................................................................................196. Illustrating Newton’s Laws ..........................................................................................................................................................................206.1 Egg Splash .................................................................................................................................................................................................206.2 Marbles on the Move .........................................................................................................................................................................216.3 Marbles with Momentum ................................................................................................................................................................226.4 Newton’s Cradle .....................................................................................................................................................................................227. Activities With Sound ....................................................................................................................................................................................237.1. Measuring the Velocity of Sound ................................................................................................................................................237.2 Transmission of Sound ......................................................................................................................................................................257.3 Qualities of Sound - Pitch and Loudness ................................................................................................................................267.4 Straw Oboe ...............................................................................................................................................................................................268. Electricity ..............................................................................................................................................................................................................278.1. Conductivity .............................................................................................................................................................................................278.2 Student Model of Electric Current ............................................................................................................................................288.3 Squishy Circuits .....................................................................................................................................................................................299. Pressure ..................................................................................................................................................................................................................319.1. Balloon Balance .......................................................................................................................................................................................319.2 Spray Bottle .............................................................................................................................................................................................329.3 Cartesian Diver .......................................................................................................................................................................................3310. Light ........................................................................................................................................................................................................................3410.1 Transmission of light .........................................................................................................................................................................3410.2 Finding the Image in a Plane Mirror .........................................................................................................................................3510.3 Lateral Inversion in a Plane Mirror ...........................................................................................................................................3510.4 Refraction ..................................................................................................................................................................................................3610.5 Curved Mirrors and Lenses ............................................................................................................................................................3710.6 Pinhole Camera .....................................................................................................................................................................................3810.7 After Images ............................................................................................................................................................................................3911. Heat .........................................................................................................................................................................................................................4011.1 Conduction, Convection and Radiation ...................................................................................................................................4011.2 Solar Oven ................................................................................................................................................................................................41Activities for the Science Classroom 3
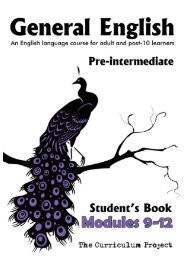
3.3. GraphingYou can add a lesson on graphing to many of the activities in this book. <strong>The</strong> four experiments from 3.1, 3.2,5.1 and 16.2 are used below as examples of simple graphs.TimingDepends on the class. You could spend an extra 15 minutes after every activity working on graphs and thestudents will get faster and more confident over time.Materials• Coloured pencils and graph paper will make graphing easier but these are not essentialMethod<strong>The</strong>re are various ways to express data.Pie chart• <strong>The</strong>se are usually used to display fractions of a whole. For example, you could make a pie chart forActivity 16.2 by classifying the invertebrates that your students bring in. Make a chart to show thepercentages that are insects, arachnids, worms, crustaceans, etc. Within the ‘Insect’ group, they canmake further classifications, e.g. ‘with one pair of wings’, ‘with two pairs of wings’, etc.Activity 16.2, Pie chart for Invertebrate Classification1. Have the students classify the invertebrates any way they like.• One option might be by ‘phylum’ – there might berepresentatives from three phyla – Annelida (whichincludes earthworms and leeches), Arthropoda –which includes insects, crustaceans (crabs, etc),centipedes, millipedes and arachnids (spiders, ticksand scorpions) – and Mollusca (which includes snailsand slugs).• A further break down might be by ‘class’ – e.g.,insects, arachnids and crustaceans are different classesof arthropods. Within the ‘insecta’ class, the studentsmight be able to distinguish different orders, likemoths, butterflies, flies, cockroaches, bees/wasps/ants,beetles, bugs, etc.• Or, they could classify by appearance: colour, numberof legs, with or without wings, etc.2. Work out the percentage of the total invertebrates that have been put into each group, and split up the360 o of the circle into these percentages. For example, if group 1 in the above example has 6 cricketsin it, and there are 24 invertebrates all together, the segment is 6 ÷ 24 x 100 = 25%. 25% of 360° =90°3. Label the segments correctly – instead of 1, 2, 3, 4 in the above example, the students would write thenames of the classes you have chosen.12 Activities for the Science Classroom
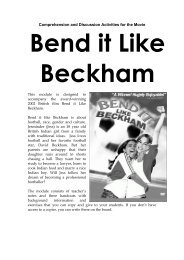
Scatter graph• <strong>The</strong>se are usually used to display data pointsthat are independent from each other. Forexample, the individual students’ reactiondistances from Activity 3.2.Activity 3.2, Scatter Plot for Reaction Time versusGender1. Always label the graph at the top.2. Put the independent variable on the horizontalaxis (the students, arranged in alphabetical orrandom order), and the dependent variable onthe vertical axis (reaction distance).3. Choose the scale of both axes so that they areapproximately the same size (you don’t wantone that is long while the other is short).4. Label the axes and the units in which they aremeasured.5. Place a dot for each student’s reaction distance – boys and girls in different colours. Do not join thedots because there is nothing to link the individual results.6. Look for a trend – is one colour (gender) lower (faster) than the other?Bar or column graph• Bar or column graphs are used when theindependent variable is a number of separatecategories that you want to compare.Activity 3.1, Column Graph for Ice Melting Speed1. <strong>The</strong> independent variable will be the state ofthe ice – either in a block, or in pieces, or ifyour students want to try three states, crushedup. <strong>The</strong> dependent variable will be the timetaken for the ice to melt.2. <strong>The</strong> independent variable goes along thehorizontal axis, and the dependent variablegoes up the vertical axis.3. You could add another variable by addingmore columns in a different colour. Forexample, you could compare the melting ratesin the sun and shade for the three shapes byadding a red column (sun) beside the bluecolumns (shade) for each shape.Activities for the Science Classroom 13
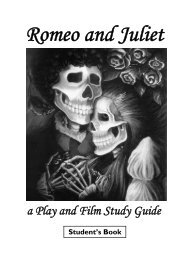
4. ClassificationClassification is an important scientific concept. Classificationis the process of grouping similar items together. All scientistsclassify things in some way. To do this properly, we must identifyfeatures that some of them have in common. This is called anattribute.4.1. Classifying Your Class’s ShoesThis activity is described using shoes, but you could do aclassification exercise with just about anything – flowers, fooditems, nails and screws, invertebrates, clothing, and so on. Ask allthe students to bring in one of your chosen item (i.e. each studentbrings one item), and then adapt the instructions below.TimingAbout 1 hour to explain about classification and have the students work out a suitable classification schemethemselves.All itemsMaterials• All the shoes your class wore todayMethod1. Explain how to classify items into groupsusing a particular attribute at each grouping.Use the tree diagram on the right to explainhow.1st subsubgroup1st subgroup2nd subsubgroup2nd subgroup3rd subsubgroup2. Go outside and have everyone take one of their shoes to add to the pile.3. Have the students describe attributes of the shoes: left or right foot, colour, style, brand, size, etc.4. Try to let the students run the classification themselves. You may need to choose a leader, or if thereare too many students, split the class into smaller groups.5. Help the students choose one attribute for the first split. For the first split, choose an attribute thatdivides the shoes into only two groups, e.g. all the shoes will be either right foot or left foot.6. Keep dividing the shoes into smaller and smaller groups until there is only one shoe in each group.<strong>The</strong> students should discuss the best way to do this.7. Have everybody draw a diagram of the classification they decided on. You could repeat the exercisea few times if there is a debate about the best way to do it. Here is an example of a diagram from oneclass (you will not get the same diagram with your class):Running shoesHave lacesFormal shoesAll shoesNo lacesHavestrapsLeft shoesRight shoes2 straps over3 straps overRubber bootNostrapsBlackRedOrangeActivities for the Science Classroom 15
PHYSICS5. Motion5.1. Distance and TimeTimingAbout 10 minutes plus about 15 minutes for the graphingexercise.Materials• Ruler (the students can use their paper ruler fromActivity 2.1)• A marble or ping pong ball• Pen• Stopwatch or students ready to count steadily• A piece of paper or cardboard (one for each ball)Method1. Make a ramp out of the paper or cardboard, as shown on the right side of the picture.2. Adjust the ramp so that the marble rolls down quite fast, and then keeps rolling along the floor. If thefloor is very rough, put paper down to make a smoother surface.3. As soon as the marble hits the floor, that is time zero and zerodistance. Someone needs to count the seconds out loud. Have Time (s) Distance (cm)other students ready to mark with the pen on the paper the0 0distance the marble has travelled each second.14. Try a few times until you get consistent results.5. Measure the distances marked for each second and fill in thetable.236. Teach students how to construct a line graph as per the4instructions in Activity 3.3.5ExplanationDiscuss the properties of time (T or t), Speed (S),velocity (v), distance (D), acceleration (a) anddeceleration (-a). If speed is constant, there is noacceleration. If speed is increasing, acceleration isconstant. If speed is increasing exponentially, thenacceleration is increasing. Draw simple diagrams toshow these properties.Introduce the formulas:S (m.s -1 ) = D (m) / t (s)Speed Distance Timea (m.s -2 ) = ∆ S (m.s -1 ) / t (s)Acceleration Change in speed Time16 Activities for the Science Classroom
5.2. Motion of a PendulumTimingpoint ofsuspension45-60 minutes including explanations and graphing.Materials• A 1 L or 1.5 L plastic bottle filled with water• String• A beam in the ceiling or a hook on a door frameMethod1. Tie the string to the bottle. Try to attach the stringto the centre of the top of the bottle so the weightis centred. To do this, you could make a hole in thecentre of the lid and tie a knot in the string inside, oryou could make a loop at each side of the neck.2. Attach it to a beam or a hook so that it can swingfreely, and set it swinging back and forth in a straightline.3. <strong>The</strong> time taken in seconds for one complete swing backand forth is the period, T.4. <strong>The</strong> displacement is how far away from the centre youpull the pendulum before letting it go.5. Have the students think about the following:• What is the period of your pendulum?• Does the period depend on the displacement? Trypulling it back to different displacements and see ifthe period varies.• Does the period depend upon the mass of thependulum? Tip half of the water out and see if theperiod is any longer or shorter.6. Explain about potential and kinetic energy (see the Explanation on the next page), then tell thestudents to go back to the pendulum to find out the following:• At which point in the swing of the pendulum is potential energy at a maximum?• At which point in the swing is the kinetic energy at a maximum?• Is all of the potential energy converted into kinetic energy?• Is all of the kinetic energy converted back into potential energy?• If not, where has the energy gone?7. Measure the length of the pendulum, including the sizeof the bottle to the centre of its mass (about the middleof the bottle). Now reduce the length of string so that thependulum is ¾ of the length and measure the period.8. Now reduce it to half the length and measure the period.<strong>The</strong>n to ¼ of the length. For short periods, you mighthave to measure it 5 times, and divide the total by 5. Fillin a table like the one on the right.9. Plot a graph showing length of string versus period.Does the graph pass through the origin? If the length ofthe pendulum is zero, can there be any period?amplitudeLength ofPendulum (cm)Full3/41/21/40lengthequilibriumpositionIdisplacement}- heightIPeriodT (s)Activities for the Science Classroom 17
5.3. Hooke’s LawTiming15 minutes plus graphing time.Materials• Empty plastic bottles (1 L or larger)• Rubber bands (or any other elastic material), 6 perbottle• String• Paper rulers (the ones you made in 2.1)• 200 mL measuring cups or bottles• Water• TapeMethod1. Join 5 or 6 rubber bands together and attach to a piece of string tiedaround the neck of the bottle. Attach the other end of the rubber bandsto any hook or nail high on the wall.2. Tape your paper ruler to the wall so that ‘0’ is level with the bottom ofthe bottle as it hangs.3. Add 1 cup of water to the bottle.4. Mark the distance the lower end of the bottle comes to. This is the‘extension’.5. Keep adding cups of water and measure the extension each time.6. Add at least 5 cups and fill in a table like the one on the right.7. Plot the results as a graph.ExplanationHooke’s law relates force to extension by the formula:Force(cups ofwater)Extension(cm)0 012345F (N) = – k x χ (m)Force in newtons constant displacementThis is a theoretical formula that means ‘the extension of amaterial is directly proportional to the load applied to it’.Because force is proportional to mass, and to the displacement(which is the extension in this experiment), we can plot cupfulsof water versus extension and see the relationship. For advancedstudents you could work out the actual force in newtons, fromthe formula:F (N) = m (kg) x a (m.s -2 )Acceleration dueto gravity – 9.8 ms -2If you did this experiment for a steel spring, the result would be a straight line graph because steel obeysHooke’s Law. For rubber, however, the result is a curved graph. It is actually a special curve called a‘hysteresis’ curve (the graph on the right shows an ‘ideal’ rubber band). This is because rubber bands do notstretch evenly. Some people say rubber is a ‘non-Hookean’ material!Activities for the Science Classroom 19
6.2. Marbles on the MoveTimingAbout 30 minutes to play with the marblesand to explain Newton’s second law.Materials• Marbles – small and large ones• Ping pong balls• Drinking strawsMethod1. Have the students blow through astraw pointed (almost) horizontallyat a marble, moving so that theykeep blowing on the marble fromthe same distance away. Notice thatthe marble keeps accelerating.2. Now have them blow on a marblewith a greater mass. <strong>The</strong> acceleration is a lot less.3. Have the students blow on the ping pong ball. What is the acceleration like?4. Roll a marble over the desk and while the marble is moving, blow from the side. What does themarble do?5. Have a desktop marble contest. Place the marble in the centre of the desk and have two studentsfacing each other. When you say ‘go’ they start blowing on the marble and try to get it to the other endof the desk.ExplanationWhen you blow on the marble through the straw, you are applying a force. If the force increases, theacceleration will increase. If the mass is greater, the force will need to be greater to produce the sameacceleration, because of the equation:F (N) = m (kg) x a (m.s -2 )force mass accelerationYou can give the students problems to solve using this equation.When they start the marble rolling, and if they change the direction of a marble already moving in a straightline, they are overcoming the inertia of the object.Have the students try blowing a flat object like an eraser.It doesn’t work because the force of friction is opposingthe force they are applying. Friction is the force betweenany two surfaces. As we saw in Activity 5.2, there is evenfriction between an object and the air around it, but thisis a small force compared to the friction between tworough surfaces.<strong>Eng</strong>lish Lesson!Did you know that theword ‘inertia’ can also be used asa figure of speech? It can be used todescribe someone who can’t get startedwith what they ought to be doing, orwon’t change ‘direction’ in their life,even if they are ‘forced’ todo so!Activities for the Science Classroom 21
Method1. Have the students work in pairs. Student A holds the mirror atStudent B’s eye height and holds a piece of paper under B’s chinso they can’t see their own hand when they try to draw on a pieceof paper on the table.2. Student B tries to write their name while looking in the angledmirror.3. Now Student A draws a windy road or a simple maze on thepaper. Student B, looking only in the mirror, tries to trace a linewith their pen going from one end of the road to the other withouttouching the lines. See Image 1.4. Now, Student A tries writing a message backwards so that when the other person holds it up in frontof them, they can read it in the mirror. See Image 2. This is similar to writing your name and thenlooking at it from behind the paper while holding the paper up to the light.Explanation‘Lateral Inversion’ is when an object is reflected in the mirror, and appears to be reversed from left to right.When you look in the mirror, and wink your left eye, the right eye of your reflection winks back. When youtry to write something when looking in the mirror, it is difficult because you are forming the letters from theopposite side. Some scientists say this is just an optical illusion, since the mirror is just reflecting light back. Itis our brains that think the image is the wrong way around!10.4. RefractionTimingAbout 20 minutes.Materials• A transparent (see-through) cup or glass• A small coin or stone• A pencil or penMethod1. Place the coin or stone against the edge inside the cup.2. Place a book between you and the cup so that you can see the cup butnot the coin.3. Get your partner to slowly fill the cup with water.4. What do you see happen?5. Fill the cup with water, put a pencil or pen in, and look at it fromdifferent angles.6. Does it appear to bend at the point where it enters the water?ExplanationInteresting Fact!Small children learn todo this much more quicklythan adults do.Light travels at different speeds in different materials. It travels faster in avacuum than it does in air. It travels faster in air than in water and faster in water than in glass.Since a beam of light has a width, when it strikes an interface of air and water at an angle, the edge that strikesfirst slows down and the light changes direction. Hence the beam appears to bend at the interface.36 Activities for the Science Classroom
Magnifying Glass (Convex Lens)A magnifying glass is an example of aconvex lens. Ray diagrams can be drawn thesame way for lenses as for mirrors.Experiment with holding the magnifyingglass close to an object to try to find thefocal point.Draw ray diagrams showing the positions ofthe object and images inside and outside thefocal point.Trial 1: (Convex Lens) <strong>The</strong> object is locatedbeyond twice the focal length. <strong>The</strong> image islocated between the focal length and twicethe focal length on the opposite side of thelens. It is reduced in size and inverted.Trial 2: (Convex Lens) <strong>The</strong> object is locatedat twice the focal length. <strong>The</strong> image is located at twice the focal length on the opposite side of the lens. It isinverted and the same size.Trial 3: (Convex Lens) <strong>The</strong> object is located between twice the focal length and the focal length. <strong>The</strong> image islocated beyond twice the focal length on the opposite side of the lens. It is enlarged in size and inverted.Trial 4: (Convex Lens) <strong>The</strong> object is located at the principal focus. Just like mirrors, no image is formed atthis position. All rays are refracted from the lens as parallel rays.Trial 5: (Convex Lens) <strong>The</strong> object is located between the principal focus and the lens. <strong>The</strong> image appears tobe located behind the object on the same side of the lens. It is enlarged in size.Trial 6: (Concave Lenses) All concave lenses form a virtual image, the right way up, reduced in size.10.6. Pinhole CameraTiming30 minutes.Materials• Empty aluminium canwith the end cut off• Knife or scissors witha pointed end• Paper tissue or napkin• Rubber bands• Sheet of A4 paper38 Activities for the Science Classroom
Method1. With the pointed scissors or knife, make a small round ‘pinhole’ (5-10 mm in diameter) in the end ofthe aluminium can.2. Cover the other end with a single sheet of the tissue or napkin and fasten with a rubber band. Thismakes the ‘screen’.3. Wrap the A4 sheet around the end of the can with the screen to make a ‘darkroom’. (In the pictureabove, the darkroom is on the left of the picture.) You will look through the other end.4. From inside a room, point the pinhole at a window or doorway with the light shining through. Lookthrough the darkroom tube and you should see an image of the window on the screen.5. Get someone to stand in front of the window or doorway and wave their arms.6. Are they upright or inverted?10.7. After Images<strong>The</strong> eye acts like a camera (or more accurately, a camera acts like theeye). Instead of a photographic film, or a digital receptor screen, the lightsensitive layer at the back of the eye consists of cells that fire off electricalimpulses to the brain whenever light falls on them. If you keep looking atthe same scene, the impulses get weaker and weaker.TimingAbout half an hour.Materials• Blank sheets of paper• Black markers• Coloured pencils (red, blue, green and yellow)Method1. Instruct the students to each draw a square about 5 cm x 5 cm and draw a solid black circle inside it.2. Now each student looks at the centre of their circle for one minute.3. Now they look at a blank sheet of white paper. What do they see?4. For part two, the students draw a square the same size as above and colour it either red, blue, green oryellow.5. Next, they cover one half of the square with a piece of paper and look at the coloured half for aminute. <strong>The</strong>n remove the paper – what happens?6. Now look at the whole coloured square for a minute, then at a blank sheet of paper. What colour doyou see?ExplanationWe have light receptors (photoreceptors) in our retinas that get tired if we stare at one colour for a long time.<strong>The</strong>y respond by ‘resting’ when you look at the white page afterwards. <strong>The</strong> photoreceptors for the oppositecolour, however, are still fresh, so your brain interprets their activity as though you are looking at that oppositecolour. If you look at a red square for a minute, when you look at a white sheet of paper you will see a green‘after image’. If you look at blue square you will see a yellow after image, and vice versa. This is becausered and green have paired photoreceptors, while yellow and blue have paired photoreceptors, as do black andwhite.Activities for the Science Classroom 39
11.2. Solar Oven<strong>The</strong> instructions given here are for the most basic design, but more complicated designs are possible once youhave tried the first one. You can get more information about solar ovens and different designs here:http://solarcooking.wikia.com. Below are some examples:TimingAbout 1-2 hours to build an oven but you will need extra time to experiment with the best shape and makeadjustments. When your oven is finished, you can try cooking rice or curry in it. <strong>The</strong> cooking time dependson how efficient your oven is at trapping heat and keeping the heat inside. Cooking rice in a good solar ovendoesn’t take much longer than cooking rice on a stove, but in lots of places where people use solar ovens, theystart the food cooking in the morning, and leave it to cook over the hottest part of the day – when the Sun isdirectly overhead.Preparation and SafetyDon’t ever look directly at the Sun – you can damage your eyes.Some designs of solar ovens involve putting reflective material like foil on the inside of an umbrella to makea big mirror. If you experiment with this design, be careful because the heat generated can be more than youwould expect!Eating uncooked meat can make you sick. It is important that you heat food to over 75 ˚C to kill bacteria.Solar ovens easily reach this temperature. If you are still experimenting with your oven, use vegetables untilyou are confident with cooking times and temperatures.Materials• 2 cardboard boxes of different sizes• Some aluminium foil – you can buy this or collect it from packages• Thick, clear plastic, or if you can’t find any, plasticwrap or a clear plastic bag• A metal cooking pot with a lid. <strong>The</strong> best typewould be black, or you could paint the outsideblack• Black paint or fabric. If you are using black paint,try to find ‘oven paint’ which is non-toxic andheat-proof. Black fabric or black cardboard worksjust as well.• Scrap cardboard, newspaper or waste paper• Tape, glue, staples or small nails and thin pieces oftimber• Scissors and/or a knife for cutting the cardboardIf youhave a thermometer,you could demonstrate thedifferent rates of heat absorptionby different colours. Find two containersthat are the same - glass, metal or plastic.Paint the inside of one container black, and theinside of the other container white. Measurethe change in temperature over time insidethe container when you put them both inthe sun together. Which colourabsorbs more heat?Activities for the Science Classroom 41
Method1. <strong>The</strong> two cardboard boxes need to fit together, oneinside the other. <strong>The</strong> inside of the smaller one(or at least the base) could be painted black, orcovered in reflective metal foil to help direct theheat into the pot.2. In between the two boxes, there should benewspaper, waste paper, or old pieces of fabricballed up and stuffed in. <strong>The</strong>re should be airgaps (don’t pack it too tight) because this is theinsulation.3. <strong>The</strong> plastic lid for the inner box needs to be ableto lift off when you put the saucepan in, so oneidea is to make a frame out of thin pieces of timberand stretch some flexible plastic over the frame.This could then be placed on top of the innerbox when you are cooking, but removed easily. You need this plastic (or glass) lid to let the reflectedradiant heat in, and then to trap it inside the oven. <strong>The</strong> simplest type of clear lid is a clear plastic bagstretched across the space and taped on, but then you might need new plastic every time you cook.4. <strong>The</strong> outside box needs to be cut as shown in the diagram. <strong>The</strong> top parts, which are higher than theinside box, are the ‘flaps’ – these should be covered in foil to reflect the light into the oven. Cut andstick the flaps on each side; experiment with different angles so that as much heat as possible isreflected into the box.5. Make some wooden‘feet’ for the cooking pot to sit on in the oven, otherwise a lot of heat will be lostfrom the pot where it contacts the base of the oven.Explanationplastic -->set pot inside on“feet” -->aluminium foilcovering flap -->
12.2. Polarity of Molecules (or Art with Milk)TimingAbout 10 minutes for the class to watch the colours swirling, plus about 10 minutes for an explanation.Materials• Milk• Dishwashing detergent• Large flat bowls or disposable containers (1 for each group of students)• Liquid food colouring (if you can only find powdered food colouring, dissolve some in water beforethe class). Using two colours works really well.Method1. Pour some milk into a flat tray and drop in a couple of drops of food colouring. If you have 2 colours,put a drop of each colour at opposite ends of the container.2. Drop in a couple of drops of dishwashing detergent and watch the coloured milk swirl around.Explanation<strong>The</strong> milk moves because it is made of polar (sugars and salts) and non-polar (fats) molecules and the detergentmolecules have a polar and a non-polar end. <strong>The</strong> like (similar) ends of the molecules repel each other and sothe coloured milk and the detergent move around quickly to avoid each other.Polarity of molecules fits into chemistry at a senior high school level, but this is a fun activity even if studentsdon’t completely understand it.44 Activities for the Science Classroom
13.2. Properties of Carbon DioxideTimingAn extra 5-10 minutes after Activity 13.1.Materials• As in Activity 13.1• Plastic cup or half of a clear water bottle• A taper such as a twisted piece of paper, a bamboo skewer or a thin piece of timber you can light• A lighter or box of matches (or you could use a gas cooking stove to light the taper)Preparation and SafetyThis experiment takes a bit of practice. You should have a student ready to light the taper once you havepoured in the CO 2. Since this experiment involves fire, only trusted, senior students should do this on theirown; otherwise, it is a good demonstration activity.Method1. Repeat Activity 13.1, but without the detergent. You can use the same bottle, just rinse it to get rid ofmost of the detergent or else you will have bubbles instead of CO 2gas.2. After the reaction between vinegar and baking soda has created lots of carbon dioxide in the bottle,carefully tip the bottle to pour the carbon dioxide gas into a plastic cup or another water bottle withthe top cut off (you will have to guess whether it is happening).3. When you think you have filled the cup with carbon dioxide, test with a taper. If the cup is full ofcarbon dioxide, the flame on the taper will go out, i.e. extinguish.You can also pour the carbon dioxide from onecup to the other (just imagine it is water), andcompare what happens when you put a lightedtaper into a cup filled with normal air and a cupfilled with CO 2.This is why CO 2is usedin fire extinguishers.ExplanationCO 2is heavier than air, so when you pour it,it stays at the bottom of the cup. CO 2is alsocolourless and odourless, so you can’t see itbeing poured from one cup to another.CO 2does not support combustion, so it willextinguish a lighted match or taper. <strong>The</strong> oxygenin normal air supports combustion so if you puta flame into a cup filled with normal air it willcontinue to burn.Activities for the Science Classroom 47
Preparation and SafetyTo prepare the red cabbage juice indicator, chopa red cabbage into small pieces until you haveabout 2 cups chopped. Place the cabbage in asaucepan, cover with boiling water, and leavefor at least ten minutes until all the colour hascome out of the cabbage. Strain out the cabbageand keep the purple liquid. If possible, keepit cold so that it lasts longer. Red cabbages areseasonal so you will probably only be able to dothis experiment at certain times of the year.You might want to prepare a printed version ofa table and a colour chart similar to the ones onthe right for your students to fill in. Otherwisethey can copy them from the whiteboard.Method1. Add three or four drops of red cabbageindicator to samples of each of theliquids you are testing.2. Compare the colour of the solution to the colour chart and fill in the table. Pink colours are acidic (lowpH) and greenish colours are basic (high pH). Blues are neutral (pH of ~7).ExplanationYou should be able to find lots of information about pH and indicators. This indicator is natural (and manyothers are made from natural plant dyes too). With senior students, you can discuss the relationship betweenthe pH scale and H + concentration, i.e. pH = -log [H + ].13.6. Preparation of Sodium Acetate and Measuring its pHTimingSee above for preparation of red cabbage juice. This experiment should take about 20 minutes and can be doneby individual students or in small groups.Materials• Vinegar• Sodium bicarbonate (baking soda)• Metal can burner (see Activity 2.2)• Plastic cup• Red cabbage juice indicatorMethodSubstance Colour pHSodium bicarbonate solutionVinegarSoap solutionTap waterBottled waterShampooLime juiceToothpaste1. Make a metal can burner as described in Activity 2.2.2. Place ¼ teaspoon of sodium bicarbonate in a plastic cup.3. Slowly add enough vinegar so that there is just a bit of undissolved sodium bicarbonate left in thebottom of the cup.4. Carefully tip the top of the solution onto the top of the metal can burner.5. Place a lighted candle under the tripod and evaporate off the water. You will be left with solid sodiumacetate.6. Dissolve the solid sodium acetate in a small amount of water. Add two or three drops of red cabbageindicator. What is the pH of the solution?50 Activities for the Science Classroom
15. Isotopes and RadioactivitySummaryIsotopes are varieties of atoms of a particular chemical elementwhich have different numbers of neutrons. All atoms of an elementmust contain the same number of protons, but they could havedifferent numbers of neutrons. <strong>The</strong> mass number of an element is thenumber of protons plus neutrons in the nucleus, so this is differentfor two different isotopes of an element. For example, carbon-12,carbon-13 and carbon-14 are three isotopes of the element carbonwith mass numbers 12, 13 and 14 respectively. <strong>The</strong> atomic number ofcarbon is 6 because every carbon atom has 6 protons; therefore, thenumbers of neutrons in these isotopes are 6, 7 and 8 respectively.Some isotopes are radioactive, which means they decay, or breakdown into smaller parts (usually another atom + smaller sub-atomicparticles like electrons or protons). Some isotopes are stable, like 12 C(carbon-12), which means it does not decay (and is not radioactive).<strong>The</strong> concept of a radioactive half-life is demonstrated in this activity.To start with, explain that a half-life is the amount of time it takes asample of a radioactive element to decay to half the original numberof atoms.15.1. Classroom ArchaeologyTimingAbout 1 hour, after a lesson explainingradioactivity.PreparationThis experiment will take some time to setup – you need to create the samples, whichare bags of ‘atoms’ which represent thedecayed atoms. Write a label on each bagto explain where the sample is from. Youcan make up your own, they just have tobe organic samples (used to be alive), andkeep to an archaeological theme. Here aresome examples of labels you could use:• A dog leg bone found in an oldfireplace discovered during theconstruction of the school• A scraping of food off the inside of an old cooking pot buried in Shan state• A wooden arrow found in the grave of a male skeleton in Kayin state• An ancient leaf preserved in a peat bog54 Activities for the Science Classroom
Materials• Beaker or large jar• Uncooked yellow beans, approximately 900 beans (you don’t haveto count exactly) – these represent atoms of the stable isotopeLegumium-600, or 600 Lg. (This is not a real element! We have justinvented to help demonstrate an idea.)• 1 type of small edible food items, e.g. dried peas, peanuts, grainsof cooked rice, or popped popcorn. You will need about 200of one type – these represent atoms of the radioactive isotopeLegumium-602, or 602 Lg. 100 go into the container with the yellowbeans.• 4 plastic sample bags. You should prepare them with different labelsas above. Split the other 100 peanuts (or whatever food you areusing as 602 Lg) between the 4 samples. For example you might put18 peanuts in Sample 1, 32 peanuts in Sample 2 etc (<strong>The</strong> numbersdon’t matter, as long as there are less than 100 in each bag).Method1. Put the 600 Lg atoms (yellow beans) into the large jar. Tell thestudents there are 900 atoms in there, but you don’t have to count!Add the 100 radioactive 602 Lg atoms (peanuts or whatever youdecided to use).2. With the class, count the number of radioactive atoms. Subtractfrom 1000 to get the number of stable atoms (900). Determine theratio of the radioactive atoms to the stable atoms (1:9). This is theratio found in nature of the element ‘Legumium’.3. Ask a student to start the radioactive decay by counting the yearspassing, and removing (and eating!) 1 radioactive atom every time10 years passes. Do this 10 times, which is 100 years. What isthe decay rate as a percentage for a 100 year period? (10%) Thispercentage decay rate will continue.4. Fill in a table like the one shown. Some data points are alreadyrecorded for you. Continue eating 10% of the radioactive atomsevery 100 years for 3000 years and record your results in the table.5. Have the students plot the data on a graph and draw the curveconnecting them. Ask students to work out the half life from thegraph (the point where half the original number of radioactiveatoms is gone, about 650 years from the graph).6. Create another graph for the 14 C table provided. From the graph,work out:a. What is the half life of 14 C? (5700 years)b. If an archaeologist detects 3000 radioactive atoms remaining ina sample, how long since the organism died? (~10000 years old)c. If a sample is 2000 years old, how many radioactive atomswould be remaining in the sample? (~8000)7. Show the bags of “radioactive atoms” representing differentarchaeological samples. Each bag contains only the radioactiveatoms from the sample that were found along with the 900 stableatoms, like you had in your original container. Any atoms that havealready decayed have disappeared. Have the students count thenumber of atoms remaining in each bag and use the Legumiumdecay graph they have drawn to estimate how long ago theorganisms died.Radioactive decay of Legumium-602Years sincedeathNo of radioactive atomsremaining0 100100 100 - (10% of 100) = 90200 90 - (10% of 90) = 81300 81 - (10% of 81) =400500600700800900100011001200130014001500160017001800190020002100220023002400250026002700280029003000Radioactive decay of Carbon-14Years since deathNo of radioactiveatoms remaining0 100005700 500011400 250017100 125022800 62528500 31234200 15639900 7845600 3951300 2057000 1062700 568400 2Activities for the Science Classroom 55
BIOLOGY16. Animal Bodies16.1. Human Organ SystemsDiscuss with the students why we have a skeleton and what its main functions are:• Shape• Protection of internal organs• Support of our organs and flesh• Movement by attaching tomuscles• Storage of minerals, such ascalcium• Blood production in the bonemarrowFor an advanced class, use the diagramprovided to teach some of the scientificnames for the bones.TimingAbout 30 minutes to colour, cut out andput together the skeleton.Materials• Scissors• Stapler or tape• Photocopies of attached diagramsof the human skeleton anddigestive systemMethod1. Have students cut out the shapesof the organs and staple or tapethem together according tothe numbering systems on thediagrams.2. Use this as an introduction to yourlessons about the human body.3. You can use any organ system to teach students about how the smallest building blocks are theorganelles, which make up the cells. Each different type of cell makes a different type of tissue,for example, bone cells make bone tissue. <strong>The</strong>re are different types of bone tissue, for example themarrow inside is different to the strong bone material outside. Use a chicken bone to demonstrate.Different tissues combine to make organs, and different organs make up organ systems.Activities for the Science Classroom 57
58 Activities for the Science Classroom
60 Activities for the Science Classroom
16.2. Spiders and InsectsSpiders and insects are both animals. <strong>The</strong>y both have exoskeletons (skeletons on theoutside). This is because they are both in the Order Arthropoda.Spiders have two body parts (head and abdomen), eight jointed legs, and a spinneret(the organ at the tail that spins a web).Insects have three body parts (head, thorax and abdomen) and six jointed legs on thethorax. If they have wings they are on the thorax.TimingAbout an hour to teach about classifying the different animals, giving the studentsplenty of time to sketch and describe their animals properly.Materials• An insect or a spider in a jar• A magnifying glass (one per pair of students, if possible)Preparation and Safety<strong>The</strong> day before class, instruct the students to bring in an insect or a spider. Tocollect the animals, they should place the jar or cup over the top, and slide a pieceof paper underneath. <strong>The</strong>y should not try to catch animals with their hands sincesome can bite or sting.Method1. Each student should study their insect or spider using the magnifyingglass. Count the number of legs and the segments of each leg. Does it haveantennae? Does it have wings and, if so, how many? If it is a spider, isit a hunting spider (with big fangs) or does it catch its prey with a web(pointy ‘spinnerets’ at the tail)?2. Examine and describe the mouth parts.3. Identify the ‘spiracles’ that the insect or spider ‘breathes’ through –these are small holes mostly along the abdomen.4. Each student should make a labelled drawing of their animal.5. Compare the drawings or draw somebody else’s animal.6. Release the spiders and insects outside when you are finished; do notkill them!ExtensionConduct a classification exercise with the students so they group the picturesdepending on the characteristics of the animal.You could also have the student collect other invertebrates and draw them andclassify them: crabs, worms, snails, etc. This is a good experiment to have thestudents practise drawing a pie chart.Activities for the Science Classroom 61
17. PlantsSummary<strong>The</strong>re are lots of experiments you can do to demonstrate how plants grow, respond to stimuli, and producetheir own food from sunlight through the process of photosynthesis. Here are just a few.17.1. Plant GrowthTimingPart of a lesson over several days or weeks. You could have the plants growing in the classroom and spend thefirst 5 minutes of every lesson observing changes. 30 minutes for setting up the experiment in the first lesson.Materials• Plant seeds like peas or beans• Clear plastic cups or half waterbottles• Paper towel or cotton wool• Cardboard box• Scissors• Marker pen• Soil for the optional second partMethodNameABCDConditionsControlDarkDryLight stimulusObservationsDay 0ObservationsDay 11. Label 4 plastic cups with the marker pen – A, B, C, D2. Make a table for the students to copy that explains the labels.3. In each of the cups place some bunched up paper towel or cotton wool. Sprinkle some water on it so itis just damp but not soaked. Do not put water on the paper towel in cup C.4. Put four seeds in the paper towel in each cup, just near the surface.5. Cup A is the control: it gets water, sunlight and fresh air. Put it near a window or somewhere it getssunlight.6. Cup B gets darkness so you need to find a cupboard or a small room where it doesn’t get exposed toany sunlight.7. Cup C needs to be beside the control, but never get any water (or if you want to, you can water theseeds until they germinate, and then stop watering it).8. Cup D goes into a special cardboard box that you can make. Put the cup at one side of the box, andcut a hole in the lid at the other side of the box. When the seeds germinate, the plants should growsideways towards the light. Put this box next to Cup A as well.9. Have the students describe the conditions in the table under ‘Observations Day 0’. Every lesson,check that A, B and D are still damp, sprinkle more water on if not, and have the students observe anychanges to the seeds and seedlings – these observations will be for Day 1, Day 2, etc. This is a goodexperiment for students to practise writing a lab report, with sections called Aim, Hypothesis, Method,Results, Discussion and Conclusion. <strong>The</strong>y can also measure the growth of each plant every lesson,and draw a graph to compare the growth under the different conditions. <strong>The</strong> students can also gentlyremove the seedlings from the cups and examine them, draw them and label them.10. Once the seedlings have grown a few leaves and the students have had a chance to observe the roots,you can move them into soil, and keep them growing under the same conditions. At this point, youcould experiment with different fertilisers, different types of soil, or put some plants into soil andleave some in the damp paper – how long can they grow like that?62 Activities for the Science Classroom
ExplanationAnything can happen in this experiment! You can adapt it depending on what you have been teaching, and thelevel of the students. Some of the seeds might not germinate, but that is normal. <strong>The</strong> final conclusion is thatplants are getting energy from the Sun to grow (not something they are absorbing from their roots, althoughthey also use nutrients from soil to help keep them healthy). <strong>The</strong>y need water and carbon dioxide to conductphotosynthesis, so the seeds growing without water and the ones growing in the dark will not grow as wellas the control. Cup D should demonstrate that plants respond to the stimulus of light. <strong>The</strong>y can grow towardslight. You can also show this by turning one of the cups upside down (but without blocking the plant’s accessto light and air), and it will grow in a bent shape towards the Sun.If you are using ‘dicot’ seeds, you will be able to see the two seed-covering leaves when the plant firstgerminates. A ‘monocot’ would only have one seed leaf. Beans, peas, tomatoes, cucumbers, etc. are dicots,but grasses, coconuts and other palms are monocots. If you have studied this in class already, you will be ableto get the students to observe the other characteristics of monocots and dicots, e.g.: Monocots have a tap root,parallel veins in their leaves, and an odd number of petals on their flowers. Dicots have no tap root, a networkof veins in their leaves, and an even number of petals on their flowers.17.2. Starch and PhotosynthesisStarch goes black in the presence of iodine. Ifyou can get some iodine from a pharmacy, youcan test different materials for starch, whichcan tell you which materials are made byplants.TimingAbout half an hour.Materials• Iodine solution (iodine crystalsdissolved in alcohol or potassiumiodide solution)• Drinking straw• Dish or tray to test items on• Selections of – rice, banana, bread, cake, biscuit, orange peel, paper, sugar, plastic, wood andanything elseMethod1. Using the drinking straw as a pipette, add a drop of iodine solution to each of the samples you have.2. Which ones turn black, showing the presence of starch?ExplanationStarch is a complex carbohydrate produced by green plants. Plants produce starch to store the energy that theyproduce through photosynthesis.Activities for the Science Classroom 63
18. CellsOnce the students know how to draw plant and animal cells, you can use the two experiments below to helpthem understand more about DNA, and explain how water is transported into and out of a cell through theprocess of osmosis.18.1. DNA ExtractionTiming45-60 minutesMaterials• 1 onion• A knife and chopping board• Salt• Warm water• Mortar and pestle• Plastic funnel or sieve• Coffee filters or a piece of scrap fabric• Dishwashing liquid• Cold methylated spirits (store in fridge)• Glass beakers, plastic cups or water bottles with the tops cut offPreparationYou can reduce the class-time for this experiment by chopping and mashing the onion before class, but thestudents enjoy participating in this as well, so if you have time, do the whole experiment in class and givedifferent students different responsibilities.Method1. Finely chop half an onion.2. Dissolve 1 teaspoon of salt in 200 mL warm water (2/3 boiling, 1/3 cold).3. Add enough salty water to cover the onion.Step 1 Step 2 Step 364 Activities for the Science Classroom
4. Mash gently until onion pieces are pulped up.5. Pour the mixture through the coffee filter paper in a funnel, or use fabric as a strainer to separate thesolid parts out of the onion mixture.6. Measure 50 mL of onion mixture and pour it into a clear cup or beaker.Step 4 Step 5 Step 67. Add 2 tsp of dishwashing detergent to the 50 mL of onion liquid. Stir gently.8. Measure out 100 mL of methylated spirits. Add it very slowly to the onion detergent mix.9. Wait for 5 minutes and the white ‘snotty’ strands of DNA should float up into the methylated spirits.Step 7 Step 8 Step 910. Keep experimenting if it doesn’t work the first time. It might work better if you cool the water downafter dissolving the salt, or mash the onion better. You can try different fruits and vegetables too!Photos from http://museumvictoria.com.au/scidiscovery/dna/howto.aspExplanationMashing onion – To break up the structure of onion into as small pieces as possible (even single cells), for theaction of the dishwashing liquid.Adding dishwashing liquid – Dishwashing liquid is a ‘detergent’, which breaks down the structure of the cellmembrane (and the nuclear membrane around the nucleus), causing the cell contents, including the DNA, tospill out. Breaking up cells like this is called cell ‘lysis’.Addition of salt – <strong>The</strong> positively charged ions of salts (Na+) protect the negatively charged DNA. In highsalt concentrations, alcohol (methylated spirits) causes a shape change in the DNA molecules, causing them tostick together.Addition of alcohol – DNA is soluble in water. <strong>The</strong> addition of alcohol and salt causes DNA to precipitate.<strong>The</strong> precipitation reaction is better if the methylated spirits is cold. Other parts of the cell remain in solution inthe liquid underneath the DNA and alcohol.Activities for the Science Classroom 65
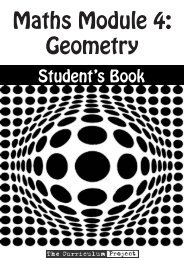
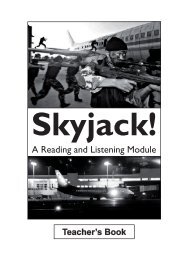
Signal AnalysisOverview (cont.)47Measurement Applications and Optional FeaturesAgilentPXAAgilentMXAAgilentEXAAgilentCXAAgilentPSAAgilent856xECAgilentESAAgilentN9320BAgilentHSAGeneral purpose AM/FM tune and listen • • • • • • • •Analog demodulation • • • • • • 1 • • •Cable fault location•Cable TV•EMC basic features • • • • •EMI • • • •Enhanced display package • • • • • •External source control • • • •Flexible digital modulation analysis • • • • • • • 2 • 2 •MATLAB software package • • • • •Noise figure • • • • • •Phase noise • • • • • • •Pulse measurement • • • • •Remote language compatibility for 856xE/EC • • • •and 8566/68 applicationSCPI language capability, FSP/FSU/FSE • • •Tracking generator • • • •Cellular 1xEV-DO • • • •communicationscdma2000 ® • • • •GSM/EDGE and EDGE Evolution • • • • 3 • 3 • 3 •LTE FDD and TDD • • • •TD-SCDMA with HSDPA/8PSK • • • • • •W-CDMA/HSPA/HSPA+ • • • • 4 • 4 •Wireless Bluetooth ® • • • • • •networkingFixed WiMAX • • •Mobile WiMAX • • • • •WLAN • • • • • •Digital video CMMB • • • •DTMB • • • •Digital cable TV • • • •DVB-T/H/ T2 • • • •ISDB-T • • • •89600BVSAOverview3ConnectivityAgilentPXAAgilentMXAAgilentEXAAgilentCXAAgilentPSAAgilent856xECAgilentESAAgilentN9320B89600B VSA software link • • • • • •Remote interface RS-232•GPIB • 5 • 5 • 5 • 5 • • • •LAN 1,000 1,000 1,000 100 10 10 10USB 2.0 2 .0 2 .0 2.0 2.0 6 1.1 1.1Removable data storage USB USB USB USB 3.5” Memory 3.5” USB USBfloppy card floppySolidstatedriveSolidstatedriveSolidstatedriveLXI C C C C1FM demodulation only2ASK/FSK demodulation analysis only3GSM/EDGE only, EDGE evolution not supported4W-CDMA/HSPA only, HSPA+ not supported5Switchable between master and slave6Device side (type B) for data transfer only; not for use with USB flash driveAgilentHSA89600BVSA
<strong>The</strong> story of the peppered mothsPeppered moths are a small speckled moth with two colour variants – dark and light. Researchersdiscovered at the start of last century that the dark coloured variant was becoming morecommon, until eventually there were hardly any light colouredmoths at all. <strong>The</strong> explanation was that pollution as a result of theindustrial revolution was making the bark of the trees darker,and so the dark coloured variants were able to hide better frompredators. <strong>The</strong> light-coloured moths stood out from the darktree bark and were eaten more often, which meant that theyweren’t able to pass on their genes to the next generation. Later,when pollution was less of a problem, the light coloured mothswere able to increase in numbers again.19.2. Bird Beak AdaptationBird beaks are a great example of how different organisms are adapted for different environments: dependingon the type of food available, different birds have evolved different ‘tools’ to allow them to hunt successfully.TimingAbout an hour, depending on how involved the students get.Materials• ‘Beaks’ such as chopsticks, spoons, strainers or slotted spoons, pliers or nutcrackers, eyedroppers,straws, envelopes, tongs• ‘Food’ such as cooked rice, loose leaf tea, a chicken bone with some meat on it, sunflower seeds,popped popcorn, small dried fish, some coloured water• ‘Habitats’ such as a small thin tube to contain the coloured water (nectar), a glass of sugar or salt(representing soil) to hide the gummy worms in, a glass of water to soak the fish in and another tofloat the tea in• Pictures of real bird beaks that match your activity ‘beaks’Here are some examples below. Students should get creative and come up with many more types of beaks tomatch real bird beaks and habitats.“Beaks”SpoonbillHummingbirdReal BirdsWarblerWorms in dirtHabitats“Nectar”Tea leaves inwaterActivities for the Science Classroom 69
Southern Ocean Food Webhttp://www.coolantarctica.com/Antarctica%20fact%20file/wildlife/whales/food%20web.htmForest Food Webhttp://king.portlandschools.org/files/houses/y2/animalmaineia/files/species/wfrogkm/foodweb/food%20web.htmlActivities for the Science Classroom 71
GlossaryAccurate, Accuracy – တိက်ေသာ၊ ေသခ်ာေသာ, တိက်မႈ၊ေသခ်ာမ – Accuracy is a measure of how close ameasured quantity is to its actual value. Precision is a measure of the reproducibility of results, or how closerepeated measurements of the same quantity are to each other.Adaptation – ေမြးစားျခင္း၊ ပတ္ဝန္းက်င္နွင့္လိုက္ေလ်ွာညီေထြရွိလာေအာင္ ျပဳမႈေနထိုင္ျခင္း ရွင္သန္ရန္ႏွင့္မ်ိဳးပြါးရန္အတြက္အဆင္ေျပ လိုက္ေလွ်ာေစေသာ လကၡဏာ – An adaptation is a trait (feature) of the body or behaviour of anorganism that allows the organism to be better suited to its environment.Aggregate – စုစုေပါင္း၊ စုစုေပါင္း ပမာဏ (adj – စုေပါင္းထားေသာ) – To aggregate items is to group them together.An aggregate can also be a joined group of separate parts.Attribute – ရလဒ္ကိုအေၾကာင္းအရင္းနွင့္ဆက္စပ္ျပသည္။ လူတစ္ဦး(တစ္ဖြဲ႕တစ္ခု)ရဲ႕အရည္အေသြးကို ဆံုးျဖတ္သည္။– သက္ဆိုင္သည္။ အေၾကာင္းရင္းအျဖစ္ မွတ္ယူေဖၚျပသည္။ – An attribute is a feature or trait. It can be physical(appearance) or related to a process.Collate – အစီအစဥ္အတိုင္းစီသည္။ နႈိုင္းယွဥ္သည္။ စနစ္တက် စုစည္းစီစဥ္သည္။ – To collate a group of results is tocollect and combine them in order to compare or analyse them.Compressing, Compression – စုေပါင္း၍ ဖိညွစ္သည္။ ဖိႏွိပ္၍ လိုအပ္ေသာ ပံုစံျဖစ္ရန္ ပံုသြင္းယူသည္။ – <strong>The</strong> process orresult of becoming smaller or pressed together. In lateral waves, compressions are parts of the waves wherethe molecules are squeezed together and have higher density.Concave – ခြက္ဝင္ေနေသာ ပစၥည္း၊ မ်က္ႏွာျပင္။ e.g. Concave mirror – မွန္ဘီလူးခြက္ – Curved like the inner surfaceof a sphere or bowl. Something can be more concave than something else if it is more tightly curved (i.e. asmaller sphere). <strong>The</strong> inside of a satellite dish is concave.Concentration – အာရံုစူးစိုက္ျခင္း၊ ျပင္းအား၊ အရာဝတၳဳတစ္ခု၏ အေလးခ်ိန္။ – <strong>The</strong> amount of a solute dissolved in asolvent. For example, if sugar is my solute and water is my solvent, if I disolve 1 kg of sugar in 2 L of water, Ihave a concentration of 0.5 kg/L. Dissolving more sugar gives a higher concentration (more concentrated) andadding more water “dilutes” the solution.Conducted – from conduction – အပူျဖတ္ကူးျခင္း(အရာဝထၳဳမ်ားမေရႊ႕) ထိေတြ႕ဆက္ဆံသည္၊ ဆက္သြယ္ေပးထားသည္။ e.g. conductor – အပူ(သို႔) လွ်ပ္စစ္ျဖတ္ကူးႏိုင္ရန္ အတြက္ ဆက္သြယ္ေပးထားသည့္ ပစၥည္း။ – Conduction isthe transfer of heat from a warm place to a cool place. It occurs through matter, but doesn’t require movementof the matter, unlike in “convection” which requires the particles of matter to move to transfer the heat (andtherefore can only happen in a liquid or a gas).Convex – ခံုးေနေသာ ပစၥည္း၊ မ်က္ႏွာျပင္။ e.g. Convex mirror – မွန္ဘီလူးခြက္။ – Curved surface like the outside ofa sphere or bowl. <strong>The</strong> back of a spoon is convex.Detergent – အစြန္းခၽြတ္ေဆး၊ အညစ္အေၾကးမ်ားဖယ္ထုတ္ရာတြင္ ေရျဖင့္ ေရာ၍ သံုးရေသာ ဓါတုေဗဒ ေဆးတစ္မ်ိဳး။ Atype of chemical that is used for cleaning. A molecule chain of detergent has one end that attracts water andone end that attracts fats and oils. This allows the fats and oils to mix with the water so they can be rinsedaway.Diminished – ပိုမိုေသးငယ္ ေလွ်ာ့ပါးသြားသည္။ – To be made smaller, but to retain the same basic shape.Displaced – ဖယ္ထုတ္သည္။ ေနရာမွ ဖယ္ရွားျခင္းခံရသည္။ ဖယ္ထုတ္ခံရသည္။ အစားဝင္ေနရာယူျခင္းခံရသည္။ – To bemoved out of the way by something else.Elastic – ဆန္႕နိုင္က်ံဳ႕နိုင္ေသာ။ ရႈံ႕နိုင္ေသာ။ – A property of matter that allows a substance to regain its shape.E.g. when you stretch a rubber band and then release it, it will return to its original shape, so it is elastic.Estimate – အက်ိဳးရလဒ္(သို႕) ကုန္က်စားရိတ္ကို ခန္႔မွန္းတြက္ခ်က္သည္။ – A prediction about a result. It is sometimescalled an ‘educated guess’, but an estimate can also be very accurate if you know a lot about what you areexpecting in the results.Expand – ျပန္႕ကားလာျခင္း၊ က်ယ္လာျခင္း – <strong>The</strong> process of growing bigger, but retaining the same shape.Extinguish – ဖယ္ထုတ္သည္။ မီးျငိမ္းသည္။ မီးျငိမ္းသည္။ အဆံုးသတ္ေစသည္။ – To put out a flame.72 Activities for the Science Classroom
Taper – တစ္ဖက္သို႕ခြ်န္သြားသည္။ n – မီးေတာက္ကူးရန္ ဖေယာင္းလူးထားသည့္မီးစာ၊ သြယ္ေျပာင္းရွည္လွ်ားသည့္ဖေယာင္းတိုင္။ v – အစြန္းတဖက္သို႔ အဖ်ားရႈးသြားသည္။ – A piece of wood or paper (or traditionally, a candle wick)that is used to move fire from one place to another, for example, to light one candle with another.Tripod – ေျခသံုးေခ်ာင္းေထာက္စင္ (သုိ႔)ေျခသုံးေခ်ာင္းေထာက္ စားပြဲ – A frame with three feet that supports theweight of another object.<strong>The</strong>rmometer – အပူခ်ိန္တိုင္းကိရိယာ – An instrument for measuring temperature, usually made out of glasswith a bulb containing alcohol or mercury which expands a known amount when heated.Valid – တိက်မွန္ကန္ေသာ။ ခိုင္မာေသာ။ အကာအကြယ္ျပဳႏိုင္ေသာ။ ဥပေဒအရလက္ခံႏိုင္ေသာ။သက္တမ္းမကုန္ဆံုးေသးေသာ။ – When an idea or result is logical and follows from the evidence.Velocity – အလ်င္ – A measurement of the speed of an object and its direction of motion. Velocity is measuredin metres per second squared (m.s -2 ).Weight – ကမၻာေျမႀကီးဆြဲအား။ အေလးခ်ိန္ – Mass times gravity, measured in newtons. An object with a mass of1 kg will have a weight of 9.8 N on Earth, but a lower weight on Mars where gravity is weaker.74 Activities for the Science Classroom
Chemistry• 200 small edible food items (peanuts, popcorn)• 900 yellow beans• Alcohol• Baking soda• Balloons• Different kinds of markers• Different liquids and solutions (e.g. soap, vinegar, lime juice, saliva, toothpaste, shampoo, etc)• Dishwashing detergent• Large flat bowls or disposable containers• Large Jar• Lighter or matches• Liquid food colouring• Metal can burner• Milk• Permanant markers• Red cabbage• Sultanas or raisins• Teaspoon• Twisted paper, bamboo skewer or thin piece of timber• VinegarBiology• ‘Bird beaks’ (see page 69)• ‘Bird food’ (see page 69)• ‘Bird habitats’ (see page 69)• Cardboard boxes• Coffee filter or piece of scrap fabric• Cold methylated spirits• Dish-washing liquid• Drinking straws• Eggs• Insect or spider in a jar• Iodine solution• Knife and chopping board• Magnifying glasses• Mass balance (can be made in 2.1)• Mortar and pestle• Newspaper• Onions• Paper towels or cotton wool• Photocopies of diagrams of human skeleton and digestive system from handbook• Pictures of bird beaks (see page 69)• Pieces of rice, banana, bread, cake, biscuit, orange peel, paper, sugar, plastic, wood and anything else• Plant seeds of peas or beans• Plastic funnel or sieve• Salt• Vinegar• Soil (optional)• Sugar syrup (optional)• Stapler (optional)76 Activities for the Science Classroom