In-Field Quantification of Fan Performance in Tunnel-Ventilated ...
In-Field Quantification of Fan Performance in Tunnel-Ventilated ...
In-Field Quantification of Fan Performance in Tunnel-Ventilated ...

Create successful ePaper yourself
Turn your PDF publications into a flip-book with our unique Google optimized e-Paper software.
<strong>In</strong>-<strong>Field</strong> <strong>Quantification</strong> <strong>of</strong> <strong>Fan</strong> <strong>Performance</strong> <strong>in</strong> <strong>Tunnel</strong>-<strong>Ventilated</strong>Freestall BarnsbyKather<strong>in</strong>e Lanker<strong>in</strong>g, Research AssociateCurt Gooch, P.E., Senior Extension AssociateScott <strong>In</strong>glis, Research AssociateBiological and Environmental Eng<strong>in</strong>eer<strong>in</strong>g DepartmentCornell UniversityABSTRACTHeat stress is a major cause <strong>of</strong> decreased milk production <strong>of</strong> cattle dur<strong>in</strong>g the hotsummer months. It has been shown that tunnel ventilat<strong>in</strong>g dairy barns is an economicalway to effectively cool livestock thereby <strong>in</strong>creas<strong>in</strong>g overall animal comfort andproductivity. This study served to quantify the overall <strong>in</strong>-place fan capacity anddeterm<strong>in</strong>e the best placement and layout for maximum performance. From the analysis<strong>of</strong> three (3) New York State tunnel-ventilated dairy facilities, it was determ<strong>in</strong>ed that airwas not uniformly discharged from each fan, therefore a contribut<strong>in</strong>g area method thatweighted each air velocity accord<strong>in</strong>g to position on the fan face was the best measur<strong>in</strong>gtechnique. <strong>Fan</strong> capacity for barn No. 1 was 24,581 cfm, for barn No. 2 was 37,257 cfm,and for barn No. 3 was 27,466 cfm. Efficiencies for barn Nos. 1 and 3 were 82.2% and91.8% respectively. Based <strong>in</strong>dividual fan data, it was determ<strong>in</strong>ed that tunnel-ventilatedbarns should have ceil<strong>in</strong>gs to decrease the cross-sectional area and elim<strong>in</strong>ate theneedless exchange <strong>of</strong> air far from the animals, fans should not have any objectsblock<strong>in</strong>g the airflow path, and plac<strong>in</strong>g the fans on an endwall angled at 60° funnels theair out <strong>of</strong> the barn for an overall <strong>in</strong>crease <strong>in</strong> fan performance compared to a flat endwall.INTRODUCTION<strong>Tunnel</strong> ventilation <strong>of</strong> dairy barns is a cost-effective way to ventilate a barn and reducethe level <strong>of</strong> heat stress on cattle dur<strong>in</strong>g summer months. Heat stress results <strong>in</strong>decreased feed <strong>in</strong>take <strong>of</strong> dairy cattle, which consequently decreases milk productionand reduces overall health. Improv<strong>in</strong>g the cow environment by use <strong>of</strong> tunnel ventilationwill <strong>in</strong>crease the productivity <strong>of</strong> the herd on many farms.<strong>Tunnel</strong>-ventilated dairy barns are usually designed based on achiev<strong>in</strong>g a desired airexchange rate (1,000 cfm/cow) and air velocity throughout the barn. Research hasshown that 500 to 600 fpm <strong>of</strong> air velocity is needed to effectively cool cows dur<strong>in</strong>gsummer heat stress conditions (Shearer, 1991). The cross-sectional area <strong>of</strong> the barnperpendicular to the direction <strong>of</strong> airflow, number <strong>of</strong> fans, number <strong>of</strong> cows, and fan outputall determ<strong>in</strong>e the airflow.<strong>In</strong>dividual fan capacity is generally based on the theoretical airflow rate provided by themanufacturer, or preferably by the fan analysis data obta<strong>in</strong>ed by a third party test<strong>in</strong>g labsuch as BESS Lab. Theoretical fan capacities reported <strong>in</strong> this paper were obta<strong>in</strong>ed atBESS Lab and provided by the manufacturer. Dur<strong>in</strong>g laboratory fan test<strong>in</strong>g, each fan is1
analyzed at a specific static pressure by itself, <strong>in</strong> a w<strong>in</strong>d tunnel; it has no competitionfrom other fans, or any obstructions block<strong>in</strong>g airflow. Although this is a good estimate <strong>of</strong><strong>in</strong>-place fan capacity, fan performance is expected to differ from the theoretical value.Static pressure differences, ambient w<strong>in</strong>d speed, fan placement, competition withneighbor<strong>in</strong>g fans for air, fan cleanl<strong>in</strong>ess, and/or objects block<strong>in</strong>g the airflow <strong>of</strong> the fan allcan preclude achiev<strong>in</strong>g optimum performance <strong>of</strong> each fan.This study evaluated the <strong>in</strong>-place capacity <strong>of</strong> each <strong>in</strong>dividual tunnel ventilation fan <strong>in</strong> thepresence <strong>of</strong> the various compet<strong>in</strong>g environmental factors and also evaluated the overallsystem performance <strong>of</strong> three (3) production dairy barns <strong>in</strong> New York State. This projectis aimed at f<strong>in</strong>d<strong>in</strong>g an easy, accurate, low cost method for quantify<strong>in</strong>g the <strong>in</strong>-placecapacity <strong>of</strong> fans used <strong>in</strong> tunnel-ventilated dairy barns and to determ<strong>in</strong>e how fanscompared relative to their performance based on BESS Lab data.OBJECTIVESThe objectives <strong>of</strong> this study were to:1.) determ<strong>in</strong>e the best method for quantify<strong>in</strong>g <strong>in</strong>-place fan capacity,2.) use the chosen method to f<strong>in</strong>d the overall <strong>in</strong>-place fan capacity,3.) determ<strong>in</strong>e if <strong>in</strong>dividual fan placement and overall layout affect fanperformance, and4.) determ<strong>in</strong>e if f<strong>in</strong>d<strong>in</strong>gs can be useful to future efforts to quantify ammoniaemissions from tunnel-ventilated dairy barns.These objectives will not only allow for assessment <strong>of</strong> <strong>in</strong>-place fan performance, butalso may prove useful for future work where actual fan performance data is needed.For example, quantification <strong>of</strong> airborne emissions, such as ammonia, leav<strong>in</strong>g a tunnelventilatedbarn can be calculated by determ<strong>in</strong><strong>in</strong>g the emission concentration and the <strong>in</strong>placefan capacity. The US EPA is concerned with the amount <strong>of</strong> ammonia be<strong>in</strong>gdischarged from animal hous<strong>in</strong>g facilities (Parry, 2003). A method to accurately, yetcost effectively, quantify ammonia emissions from dairy barns would be ideal.LITERATURE REVIEWSufficient and uniform air exchange (ventilation) is the ma<strong>in</strong> concern when evaluat<strong>in</strong>gthe effectiveness <strong>of</strong> a dairy barn ventilation system. It is important to have accuratequantification <strong>of</strong> the airflow throughout the barn. Wheeler and Bottcher (1995) foundthat tak<strong>in</strong>g measurements on the discharge side <strong>of</strong> the ventilation fan us<strong>in</strong>g a vaneanemometer provided the most accurate results. Their research showed that tak<strong>in</strong>gseveral measurements across the fan area would account for the uneven airflow patternand thereby accurately quantify the fan’s airflow capacity.Simmons et al. (1998) <strong>in</strong>vestigated the effects <strong>of</strong> fan position with respect to airflowdirection and proximity to neighbor<strong>in</strong>g fans. They observed that plac<strong>in</strong>g fans at a 90°angle with respect to the primary direction <strong>of</strong> airflow decreases the effectiveness <strong>of</strong> thefan because air is required to abruptly change direction before be<strong>in</strong>g discharged by thefan. Air resists the change <strong>in</strong> direction because it naturally wants to rema<strong>in</strong> <strong>in</strong> the2
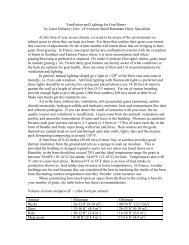
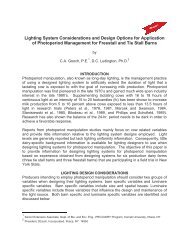
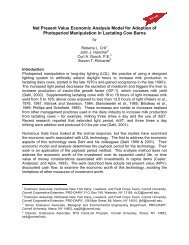
direction it is travel<strong>in</strong>g. <strong>Fan</strong>s mounted on the sidewall with the best performance stillonly ran at 83% <strong>of</strong> its maximum capacity. Simmons et al. also looked at fan placementon both the endwall and sidewalls and found that plac<strong>in</strong>g sidewall fans no closer than 1foot from endwall fans produced negligible flow discrepancies.BACKGROUNDThree (3) New York State commercial dairy farms each with freestall barns that utilizedtunnel ventilation were exam<strong>in</strong>ed. The relevant characteristics <strong>of</strong> each barn are shown<strong>in</strong> Table 1.Table 1. Barn characteristics and tunnel ventilation fan <strong>in</strong>formation.Barn No. 1 2 3Dimensions, w x l (ft) 106.5 x 400 106 x 770 62 x 352X-sectional Area 1 (ft 2 ) 2,223 2 1,908 930No. Rows <strong>of</strong> Stall 6 6 3<strong>In</strong>sulated Ceil<strong>in</strong>g No Yes Yes<strong>Fan</strong> Type and Size 51” Vortex 60” Advantage 51” VortexMotor Size, Hp 1.5 2 1.5Theor. Airflow (cfm) 3 perfan (@ 0.05” S.P. w.g.)29,900 -- 4 29,900Theor. Blade Speed (RPM) 575 490 575No. <strong>of</strong> <strong>Fan</strong>s 22 20 20Cum. Theor. Airflow (cfm) 657,800 -- 598,000Theor. Avg. Vel. (fpm) 295.9 -- 643.01 Perpendicular to the direction <strong>of</strong> airflow.2 Calculated based on area between barn floor and ro<strong>of</strong>, vertical airflow baffles are ignored.3 Data developed by BESS Lab and listed <strong>in</strong> manufacturer’s literature.4 Data not available.Barn Nos. 1 and 2 were located <strong>in</strong> central New York while barn No. 3 was located <strong>in</strong>northern New York. <strong>Fan</strong>s <strong>in</strong> barn Nos. 1 and 3 had discharge cones, grates, andlouvers. <strong>Fan</strong>s <strong>in</strong> barn No. 2 had the discharge cones and grates, but no louvers. BarnNos. 1 and 2 had fans oriented normal to the direction <strong>of</strong> airflow while barn No. 3 had anendwall at an obtuse angle with respect to the sidewall.The endwall elevation for barn Nos. 1 and 2 are shown <strong>in</strong> Figures 1 and 2 respectively.Each fan is identified with a number, depict<strong>in</strong>g the fan position from the left side <strong>of</strong> thebarn, and letter, depict<strong>in</strong>g fan level (B = bottom; M = middle; T = top). The sameconvention was used to identify barn No. 3 fans, as shown <strong>in</strong> Figure 3.3
T1T2T3 T4 T5 T6 T7 T8 T9T10T11M1M2M3M4M5M6B1B2B3B4B5Figure 1. Endwall elevation <strong>of</strong> barn No. 1.T1 T2 T3 T4 T5 T6 T7 T8 T9T10B1B2B3B4B5B6B7B8B9B10Figure 2. Endwall elevation <strong>of</strong> barn No. 2.B1, T1B2, T2B3, T3B4, T4B5, T560°Curta<strong>in</strong> Sidewall2 Rows <strong>of</strong> 5 <strong>Fan</strong>s Each (typ.)Scrape AlleyOverhead DoorWater TroughB6, T6B7, T7B8, T8B9, T9B10, T10Feed AlleyOverhead DoorDrive Along Feed AlleyFigure 3. Plan view <strong>of</strong> barn No. 3.Curta<strong>in</strong> Sidewall4
PROCEDURE<strong>In</strong>-place fan capacity analysis <strong>in</strong>cluded static pressure measurements for each barn,and fan blade rotation and air discharge measurements for each fan. A digitalmanometer (Dwyer, model #475) was used to measure static pressure. Static pressuremeasurements were taken at approximately halfway down the length <strong>of</strong> each barn. <strong>Fan</strong>blade rotational speed was measured us<strong>in</strong>g a non-contact tachometer (Monarch, model#3T179). Air velocity was measured us<strong>in</strong>g a record<strong>in</strong>g vane anemometer (Extech,model #451126). For safety reasons, all air velocity read<strong>in</strong>gs were taken on thedischarge side <strong>of</strong> the fan.Method ComparisonTo quantify <strong>in</strong>-place fan capacity, two methods, the average velocity method andcontribut<strong>in</strong>g area method, were tried and compared as a pilot study to evaluate whichone should be used based on field sampl<strong>in</strong>g time and accuracy. The procedure for theaverage velocity method is to make several evenly spaced air discharge speedmeasurements for a s<strong>in</strong>gle fan, average them, and multiply this value by the dischargecross-sectional area to obta<strong>in</strong> an overall volumetric flow rate through the fan. With thecontribut<strong>in</strong>g area method, air velocity measurements are taken at specificpredeterm<strong>in</strong>ed positions on the fan face. This value is then multiplied by its contribut<strong>in</strong>garea to give a flow rate for that particular section <strong>of</strong> the fan. The sum <strong>of</strong> all <strong>of</strong> the<strong>in</strong>dividual sections across the fan provide a total volumetric flow rate for that fan.The average velocity method assumes that each air velocity measured plays an equalrole <strong>in</strong> the overall performance <strong>of</strong> the fan. The contribut<strong>in</strong>g area method takes <strong>in</strong>toconsideration the fact that each area <strong>of</strong> the fan discharges a different amount <strong>of</strong> air byweight<strong>in</strong>g the air velocity with the appropriate contribut<strong>in</strong>g area accord<strong>in</strong>g to its positionon the discharge face.After analysis <strong>of</strong> the pilot study data (data not shown), air velocity was not found to beconsistent across the discharge face <strong>of</strong> each fan and each area measured does notcontribute equally to the overall fan discharge (Figure 4); therefore the contribut<strong>in</strong>g areamethod was determ<strong>in</strong>ed to be the better method for this study.Prelim<strong>in</strong>ary MeasurementsThe radial distance that the vane anemometer was placed from the fan’s center as wellas the size <strong>of</strong> the contribut<strong>in</strong>g area was calculated from the prelim<strong>in</strong>ary measurementsfor each contribut<strong>in</strong>g area. A group <strong>of</strong> four to five fans for each barn were chosen forthese prelim<strong>in</strong>ary measurements accord<strong>in</strong>g to location <strong>in</strong> order to provide an accuratesampl<strong>in</strong>g <strong>of</strong> all fans. Factors taken <strong>in</strong>to account <strong>in</strong>cluded distance from barn open<strong>in</strong>gs,as well as proximity to neighbor<strong>in</strong>g fans. At least one fan from each vertical level waschosen. Measurements were made across four axes: the horizontal axis, vertical axis,and diagonally at a 45-degree angle across the fan face start<strong>in</strong>g from the upper left andaga<strong>in</strong> start<strong>in</strong>g from the upper right. Measurements were taken for 10-second <strong>in</strong>tervalsevery two <strong>in</strong>ches along each <strong>of</strong> the four axes described (there were approximately 25-35 <strong>in</strong>tervals for each axis). The anemometer recorded data po<strong>in</strong>ts every second. The5
10 data po<strong>in</strong>ts for each two-<strong>in</strong>ch position were then averaged together. These datapo<strong>in</strong>ts were then plotted us<strong>in</strong>g Excel and a graphical analysis was made.The graphs obta<strong>in</strong>ed from the prelim<strong>in</strong>ary analysis data resembled a s<strong>in</strong>usoidal curve asshown <strong>in</strong> Figure 4b. The curve was sectioned <strong>of</strong>f as shown and an average value foreach section was then calculated from the correspond<strong>in</strong>g two-<strong>in</strong>ch position po<strong>in</strong>ts. Thecurve sections shown <strong>in</strong> Figure 4b determ<strong>in</strong>e the different circular area boundariesshown <strong>in</strong> Figure 4a. The average value for each section was then matched to a positionon the s<strong>in</strong>usoidal curve, and the correspond<strong>in</strong>g distance from the center was obta<strong>in</strong>ed.This method was used for each <strong>of</strong> the rema<strong>in</strong><strong>in</strong>g sections <strong>of</strong> the curve for each <strong>of</strong> thefans under prelim<strong>in</strong>ary analysis. After 9 (or 13 for barn No. 2) values were obta<strong>in</strong>ed foreach <strong>of</strong> the fans tested, an average value was taken for each position across each fan.These new 9 values (or 13 for barn No. 2) and correspond<strong>in</strong>g areas were used for theactual fan analysis.(a)(b)145962Air Velocity873lCenterPositionFigure 4. The central, <strong>in</strong>ner, and outer areas (a) correspond to the air velocity vs. position graph(b). The position is the placement across the diameter <strong>of</strong> the fan. The outermost peaks (th<strong>in</strong> solidl<strong>in</strong>e) represent regions 1-4. The dotted l<strong>in</strong>es represent regions 5-8. The central trough (thicksolid l<strong>in</strong>e) represents region 9.The prelim<strong>in</strong>ary data for barn Nos. 1, 2, and 3 are shown <strong>in</strong> Table 2.6
Table 2. Prelim<strong>in</strong>ary data measurements.<strong>Fan</strong>s <strong>in</strong> Barn Number Region Position from Edge(<strong>in</strong>)123Contribut<strong>in</strong>g Area(ft 2 )<strong>In</strong>ner 11.25 2.991Outer 26.25 1.841Center 30 0.3068<strong>In</strong>ner 12 3.338Outer 24 0.9163Center 33 0.4418<strong>In</strong>ner 13.75 4.057Outer 22.5 0.8181Center 25 0.1364The data collection positions found from the prelim<strong>in</strong>ary analysis vary because they areaffected not only by fan type and size, but also by fan location and position on theendwall. The volume <strong>of</strong> air that enters each fan before be<strong>in</strong>g discharged varies acrossthe <strong>in</strong>let <strong>of</strong> the fan. This variation can be attributed to obstructions placed at the fan<strong>in</strong>let, or from an air deficit due to the placement <strong>of</strong> the fan on the endwall. Therefore,the optimum position for data collection for each fan will differ from barn to barn, as wellas from fan to fan. The same fans placed <strong>in</strong> different barns will experience vary<strong>in</strong>gairflows, and will consequently yield differ<strong>in</strong>g prelim<strong>in</strong>ary pr<strong>of</strong>iles. However, onceprelim<strong>in</strong>ary positions are determ<strong>in</strong>ed for a particular barn, they should not vary from dayto day. Only the magnitude <strong>of</strong> the values should change.For the actual fan analysis, air velocity read<strong>in</strong>gs were taken for 30 seconds <strong>in</strong> each <strong>of</strong>the 9 (or 13 for barn No. 2) contribut<strong>in</strong>g areas for each fan. The anemometer recordeda data po<strong>in</strong>t every second. Volumetric flow rate for each fan was found and an overallbarn flow rate was calculated. Analysis <strong>of</strong> the overall <strong>in</strong> place performance <strong>of</strong> the fanwas done through comparison with the manufacturer (theoretical) data.RESULTSThe follow<strong>in</strong>g data was collected us<strong>in</strong>g the contribut<strong>in</strong>g areas method and analyzed.Table 3 shows the months that the test<strong>in</strong>g was carried out. All measurements weretaken dur<strong>in</strong>g the summer months so as to keep the fan environment as consistent aspossible and m<strong>in</strong>imize any data variations due to the surround<strong>in</strong>gs.Table 3. <strong>Fan</strong> test<strong>in</strong>g schedule by month.Barn No. Trial 1 Trial 2 Trial 31 July 2002 July 2002 June 20032 August 2002 August 2002 June 20033 August 2002 July 2003 July 20037
<strong>Fan</strong> Capacity DataBarn No. 1The volumetric output and fan blade rotational speed for each fan <strong>in</strong> barn No. 1 isshown <strong>in</strong> Table 4 for three trials. The average volumetric output for all fans <strong>in</strong> trial No. 1was 25,099 cfm, 26,133 cfm for trial No. 2, and 22,512 cfm for trial No. 3. The staticpressures for trials Nos. 1-3 were 0.04 and 0.06, 0.05 s.p.w.g., respectively. Theaverage rotational speed for trial Nos. 1 and 2 was 560.5 and 560.6 respectively. N<strong>of</strong>an speed measurements were taken for trial No. 3.Table 4. <strong>In</strong>-place fan performance for barn No. 1.Trial 1 Trial 2 Trial 3<strong>Fan</strong> CFM RPM CFM RPM CFMB1 23,138 560 22,589 560 19,897B2 23,115 562 23,466 562 22,107B3 24,004 560 23,988 560 21,124B4 21,969 561 23,316 562 21,017B5 22,535 539 23,110 539 21,425M1 25,949 562 26,897 562 23,336M2 26,429 563 27,373 563 24,320M3 26,294 561 27,468 561 24,738M4 25,294 563 25,774 563 24,427M5 22,688 561 26,126 560 23,848M6 24,250 561 25,189 562 23,560T1 26,254 566 27,090 565 22,429T2 25,938 560 26,478 560 24,106T3 27,717 562 27,466 562 22,364T4 27,775 561 26,864 562 22,879T5 25,578 560 27,885 561 22,099T6 26,401 562 26,888 563 21,785T7 26,124 562 27,276 560 20,475T8 25,214 563 27,690 564 22,590T9 26,243 558 27,507 560 22,650T10 24,877 564 26,786 563 22,028T11 24,381 560 27,691 560 22,049Barn No. 2The <strong>in</strong>dividual volumetric output and fan blade rotational speed for each fan <strong>in</strong> barn No.2 is shown <strong>in</strong> Table 5 for trial Nos. 1-3. The average output for fans and static pressure<strong>in</strong> barn No. 2 were 37,262 cfm @ 0.05 s.p.w.g., 36,018 cfm @ 0.06 s.p.w.g., and 38,492cfm @ 0.08 s.p.w.g. for trials 1 through 3, respectively. <strong>Fan</strong> T1 was not measuredbecause there was no grate attached to the discharge cone <strong>of</strong> the fan. The lack <strong>of</strong> agrate prevented the accurate, steady placement <strong>of</strong> the anemometer and presented asafety hazard. The average rotational speed was 431.9 RPM for trial No. 1 and 429.0RPM for trial No. 2. <strong>Fan</strong> rotational speed was not checked for trial No. 3.8
Table 5. <strong>In</strong>-place fan performance for barn No. 2.Trial 1 Trial 2 Trail 3<strong>Fan</strong> CFM RPM CFM RPM CFMB1 41,401 463 34,996 428 38,732B2 43,899 472 44,025 471 40,611B3 22,005 326 19,011 323 41,570B4 43,481 473 44,430 472 41,126B5 42,369 470 42,543 470 36,953B6 42,045 473 43,079 470 39,897B7 43,673 463 42,318 462 40,222B8 19,611 323 13,208 446 36,163B9 35,402 422 35,717 410 38,315B10 35,533 420 32,937 397 34,536T1 -- 470 -- 467 --T2 28,584 371 30,035 372 43,449T3 30,621 373 29,435 351 39,027T4 42,627 472 42,558 471 41,026T5 42,355 460 41,483 470 31,971T6 41,547 465 43,155 462 41,136T7 35,021 397 31,397 360 38,206T8 42,324 465 41,661 448 37,581T9 35,566 400 33,201 379 37,971T10 39,905 460 39,146 451 32,859Barn No. 3The volumetric output and average fan blade rotational speeds for each fan <strong>in</strong> barn No.3 are shown <strong>in</strong> Table 6. The average volumetric output for trial Nos.1 through 3respectively were 27,181 cfm, 27,604 cfm, and 27,612 cfm. The static pressure for trialNo.1 was 0.08 and for trial No. 2 was 0.05 s.p.w.g. The average blade rotation for trialNo. 1 was 539.1 RPM and 536.2 RPM for trial No. 2. <strong>Fan</strong> rotational speed and staticpressure were not measured for trial No. 3.DISCUSSIONIt was observed that w<strong>in</strong>d played a large role <strong>in</strong> how the fans performed. Depend<strong>in</strong>g onthe direction <strong>of</strong> the w<strong>in</strong>d, measurements showed that fan discharge can either beenhanced or impeded. For example, fan capacity for barn No. 3 was measured on oneday when w<strong>in</strong>d velocity was 300-400 ft/m<strong>in</strong>. Data analysis showed that the fanefficiency for this trial dropped 12% lower than its theoretical <strong>in</strong>-place value and thisdata was subsequently discarded. For this analysis, we def<strong>in</strong>ed fan efficiency as thefan’s theoretical value (BESS lab data) m<strong>in</strong>us the measured <strong>in</strong>-place value divided bythe theoretical value. All data reported here<strong>in</strong> were collected when little or no w<strong>in</strong>d waspresent (less than 20 ft/m<strong>in</strong>). Air temperature will also affect fan discharge rates due tothe change <strong>in</strong> air density. However, because this density difference is relatively smallexcept over very large temperature changes, this discrepancy was neglected. Allmeasurements were made with<strong>in</strong> a 15°F temperature range.9
Table 6. <strong>In</strong>-place fan performance for barn No. 3.Trial 1 Trial 2 Trial 3<strong>Fan</strong> CFM RPM CFM RPM CFMB1 25,931 538 24,267 534 23,863B2 27,220 545 28,931 542 27,293B3 27,903 546 26,525 542 27,320B4 20,154 515 24,279 511 25,247B5 25,737 516 27,261 512 27,509B6 27,406 540 27,470 539 30,415B7 25,089 538 27,161 535 25,700B8 25,850 537 26,975 533 25,379B9 28,378 540 29,363 538 28,488B10 25,539 543 24,366 540 24,611T1 29,940 541 28,786 538 28,757T2 29,695 545 30,294 542 30,075T3 29,476 543 29,547 541 28,580T4 30,062 548 30,536 545 29,812T5 28,972 540 29,044 539 29,229T6 30,152 543 28,716 540 30,094T7 29,745 540 29,084 539 29,492T8 28,779 539 26,718 535 28,522T9 28,324 544 29,165 542 28,837T10 19,258 540 23,594 536 23,016Barn No. 1The calculated average air velocity through barn No. 1 was 243.3 ft/m<strong>in</strong>. This value isbased on the average volumetric flow rates from each trial. This air velocity is 82.2% <strong>of</strong>the value predicted when us<strong>in</strong>g BESS lab data for fans runn<strong>in</strong>g under similar staticpressure conditions. The theoretical output for a 51” Aerotech Vortex fan with theseattachments is 29,900 cfm at a static pressure <strong>of</strong> 0.05 s.p.w.g. The theoreticalrotational speed for the Vortex fan was 575 RPM. The fan speed for trial Nos. 1 and 2were 97.5% <strong>of</strong> the maximum. These fans were well ma<strong>in</strong>ta<strong>in</strong>ed and accord<strong>in</strong>g to therotational speed measurements, the fans were runn<strong>in</strong>g properly for the first two trials.The discrepancies <strong>in</strong> the flow rates could be due to the slight differences between themeasured and theoretical static pressures. This difference was 0.02 <strong>in</strong>ches <strong>of</strong> water fortrial Nos. 1 and 2. Discrepancies could also, <strong>in</strong> part, be due to the cleanl<strong>in</strong>ess <strong>of</strong> thefans at the time <strong>of</strong> measur<strong>in</strong>g. Prior to trials 1 and 2, the tunnel fan blades, hous<strong>in</strong>g,and discharge cones had been thoroughly cleaned. When trial 3 had been conducted(one year later), however, there had been no recent ma<strong>in</strong>tenance <strong>of</strong> the tunnel fans.The data showed that fan location also played a large role <strong>in</strong> air discharge rate <strong>of</strong> a fan.The fans placed the highest on the barn endwall (T1-T11) had the highest efficiencies(average = 26,045 cfm, 27,332 cfm, and 22,314 cfm for trials 1, 2 and 3 respectively),while the fans at cow level (B1-B5) had the lowest efficiencies (average = 22,052 cfm,23,293 cfm, and 21,114 cfm for trials 1, 2, and 3 respectively). This was most likely dueto the fans on the highest level hav<strong>in</strong>g the least amount <strong>of</strong> competition for air converg<strong>in</strong>gtowards the fan bank. There were no obstructions <strong>in</strong> front <strong>of</strong> the highest fans, unlike theground level ones that had animals, stalls, and gates block<strong>in</strong>g airflow. Also, the high10
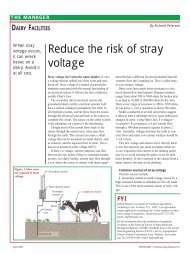
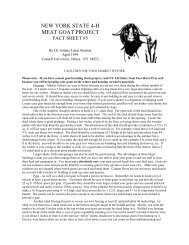
level fans were able to draw air from above (no ceil<strong>in</strong>g) and share air with the fans frombelow <strong>in</strong> addition to the air at their level. The low level fans can draw some air from thefans above, and air at their level, but are blocked by the ground from draw<strong>in</strong>g air frombelow.<strong>Fan</strong>s on the left side <strong>of</strong> barn No.1 (fan Nos. T1-T2 averaged 25,383 cfm for trial Nos. 1,2, and 3; fan Nos. M1-M3 averaged 25,867 cfm, for trial Nos. 1, 2, and 3; fan Nos. B1-B3 averaged 22,604 cfm for trial Nos. 1, 2, and 3) performed better than the right side(fan Nos. T10-T11 averaged 24,636 cfm for trials 1, 2, and 3; fan Nos. M4-M6 averaged24,573 cfm for trials 1, 2, and 3; fan Nos. B4-B5 averaged 22,229 cfm for trials 1, 2, and3). This may be due to the connect<strong>in</strong>g barn that leads to the naturally ventilated milk<strong>in</strong>gcenter located half way down the left side <strong>of</strong> the barn. This large open<strong>in</strong>g was not fullysealed, and therefore the fans draw air from this area <strong>in</strong> addition to the <strong>in</strong>let endwall <strong>of</strong>the barn. This decreased the airflow through the barn. A summary <strong>of</strong> the averageddata, by trial for barn No. 1, is shown <strong>in</strong> Table 7.Table 7. Summary table for barn No. 1.Variable Trial 1 Trial 2 Trial 3Ave. Output for All <strong>Fan</strong>s (cfm) 25,099 26,133 22,512<strong>Fan</strong> Efficiency (percent) 83.9 87.4 75.3Ave. Static Pressure (<strong>in</strong>. w.g.) 0.04 0.06 0.05Ave. <strong>Fan</strong> Speed (rpm) 561 561 --Percent Theoretical <strong>Fan</strong> Speed 97.5 97.5 --Barn No. 2The calculated average air velocity through barn No. 2 was 390.5 ft/m<strong>in</strong>. Themanufacturer was unable to provide theoretical data for the fans operat<strong>in</strong>g withdischarge cones and grates <strong>in</strong> place, but without shutters, therefore, overall efficiency <strong>of</strong>the fans could not be calculated. Based on the theoretical blade rotation value for thefans (490 RPM), the fans ran at an average <strong>of</strong> 12% less than the theoretical. Two fans<strong>in</strong> particular, B3 and B8, ran at less than 70% <strong>of</strong> the theoretical. Visual observationshowed that the fans were not properly ma<strong>in</strong>ta<strong>in</strong>ed on a regular basis. This is a majorreason why several <strong>of</strong> the fans were not perform<strong>in</strong>g to their potential. Figure 5 shows adirect correlation between airflow and fan rotational speed. Improv<strong>in</strong>g blade rotationwould correct the discrepancies <strong>in</strong> airflow, as was shown <strong>in</strong> trial No. 3 data. (<strong>Fan</strong>s wereserviced by the farm between trial Nos. 2 and 3.)11
<strong>Fan</strong> location does not seem to play as large a role with barn No. 2 as it did with barnNo. 1 (top level average = 37,550 cfm for trials 1, 2, and 3; bottom level average =36,994 cfm for trials 1, 2, and 3). Barn No. 2 had an <strong>in</strong>sulated ceil<strong>in</strong>g that limits the areafrom which the upper fans can draw air. Horizontal position also does not appear toplay a role <strong>in</strong> fan discharge. Unlike barn No. 1, the milk<strong>in</strong>g center associated with barnNo. 2 is tunnel-ventilated, result<strong>in</strong>g <strong>in</strong> a nearly static air condition with<strong>in</strong> the barnconnect<strong>in</strong>g the two together. This condition results <strong>in</strong> little chance for additional airsource for the tunnel ventilation fans <strong>in</strong> barn No. 2. A summary <strong>of</strong> the averaged data,by trial, is shown <strong>in</strong> Table 8.50,000500Velocity (CFM)40,00030,00020,00010,000CFMRPM400300200100RPM00135791113151719<strong>Fan</strong> No.Figure 5. Barn No. 2 velocity and fan blade rotation comparison.Table 8. Summary table for barn No. 2.Variable Trial 1 Trial 2 Trial 3Ave. Output for All <strong>Fan</strong>s (cfm) 37,262 36,018 38,492<strong>Fan</strong> Efficiency (percent) -- -- --Ave. Static Pressure (<strong>in</strong>. w.g.) 0.05 0.06 0.08Ave. <strong>Fan</strong> Speed (rpm) 434 429 --Percent Theoretical <strong>Fan</strong> Speed 88.7 87.6 --Barn No. 3The calculated average air velocity through barn No. 3 was 591 fpm. This value wasbased on us<strong>in</strong>g the average value for the average volumetric flow rates measured <strong>in</strong>trial Nos. 1 through 3. The air velocity was 90.4% <strong>of</strong> the value us<strong>in</strong>g theoretical fancapacity, (643 fpm) predicted from the airflow rates from the manufacturer’s data andcross-sectional area <strong>of</strong> the barn. The calculated average volumetric flow rate throughthe barn was 549,320 cfm compared to the theoretical value <strong>of</strong> 598,000 cfm. This barnhas the same make and model fans as barn No. 1. The fan blade rotational speeds fortrial Nos. 1 and 2 are both approximately 94% <strong>of</strong> the theoretical.12
There were no trends between top and bottom row fans. This was due to the <strong>in</strong>sulatedceil<strong>in</strong>g and lack <strong>of</strong> large obstructions placed <strong>in</strong> front <strong>of</strong> the fans. These fans were brandnew when trial No. 1 was conducted, and thoroughly cleaned by the farm prior to the2003 tunnel-ventilation season. Several factors contributed to the high efficiency <strong>of</strong>these fans. This barn was designed to specifically function as a tunnel barn. It was notconverted from a naturally ventilated facility, as were barn Nos. 1 and 2. The wallsconta<strong>in</strong> m<strong>in</strong>imal air leaks and the parlor walkway was sealed with a plastic drop curta<strong>in</strong>.<strong>In</strong> order to achieve the desired airflow, Barn No. 3 needed more fans than could fit onthe flat endwall. Because <strong>of</strong> the f<strong>in</strong>d<strong>in</strong>gs from Simmons et al., (1998) the option forplac<strong>in</strong>g fans on the sidewall at a 90-degree angle to the airflow was rejected. Angl<strong>in</strong>gthe endwall allowed the desired number <strong>of</strong> fans to be <strong>in</strong>stalled without forc<strong>in</strong>g the air tomake abrupt turns before discharge. The angled endwalls funneled the air <strong>in</strong>to asmaller area allow<strong>in</strong>g for a more gradual, smoother discharge <strong>of</strong> the air. This designsignificantly decreases the amount <strong>of</strong> air hitt<strong>in</strong>g the flat walls, therefore the air is able torema<strong>in</strong> streaml<strong>in</strong>ed as it approaches the fan <strong>in</strong>let. Flat endwalls positioned normal tothe flow pull<strong>in</strong>g air towards the end <strong>of</strong> the barn discharge a portion <strong>of</strong> the air out, whilethe rest hits the wall and must change direction before be<strong>in</strong>g discharged. The air thathits the wall and must be redirected towards the fan <strong>in</strong>let and thereby decreases theoverall performance efficiency <strong>of</strong> the fan. Angl<strong>in</strong>g the endwall actually improved theperformance <strong>of</strong> the fans. The 2 fans (B10 and T10) positioned closest to the overheaddoor <strong>of</strong> the feed alley were less efficient than the others. Because the air approach<strong>in</strong>gthese fans comes at an obtuse angle from the feed delivery alley, the air tends toovershoot these first 2 fans and be discharged from the next 8 fans along the endwall.Simmons, et al. stated that fans are frequently positioned with the <strong>in</strong>tent to m<strong>in</strong>imize theamount <strong>of</strong> dead air spaces rather than decreas<strong>in</strong>g performance losses. This designdoes leave a pocket <strong>of</strong> dead air along the rear overhead door positioned between the 2sets <strong>of</strong> fans. However, this is not a drawback because air exchange is not needed <strong>in</strong>this area. Barn No. 3 is also a three-row barn (versus Nos. 1 and 2 that are six-rowbarns). This smaller width allows for more efficient airflow. A summary <strong>of</strong> the data forbarn No. 3 is shown <strong>in</strong> Table 9. Table 10 compares actual vs. theoretical values, basedon us<strong>in</strong>g data average for all three trials.Table 9. Summary table for barn No. 3.Variables Trial 1 Trial 2 Trial 3Ave. Output for All <strong>Fan</strong>s (cfm) 27,181 27,604 27,612<strong>Fan</strong> Efficiency (percent) 90.9 92.3 92.3Ave. Static Pressure (<strong>in</strong>. w.g.) 0.08 0.05 --Ave. <strong>Fan</strong> Speed (rpm) 539 536 --Percent Theoretical <strong>Fan</strong> Speed 93.7 93.2 --13
Table 10. Comparison <strong>of</strong> actual vs. theoretical values for various parameters based on averagevalues.Barn No. 1 Barn No. 2 Barn No. 3Actual Theor. Actual Theor. Actual Theor.Avg. Air Velocity (fpm) 243.3 295.9 390.5 -- 590.7 643.0Avg. Airflow per <strong>Fan</strong> (cfm) 24,581 29,900 37,257 -- 27,466 29,900Average Total Airflow (cfm) 540,787 657,800 745,149 -- 549,320 598,000No. Room Vol. Exchanges 0.61 0.74 0.51 -- 1.68 1.83Avg. Blade Speed (RPM) 560.6 575 430.5 490 537.5 575CONCLUSIONSBased on the data collected from the three tunnel ventilated barns, the follow<strong>in</strong>gconclusions were made:1.) The contribut<strong>in</strong>g area method was determ<strong>in</strong>ed to be the best means forquantify<strong>in</strong>g airflow.2.) The theoretical and <strong>in</strong>-place fan capacities are not the same and this shouldbe taken <strong>in</strong>to account when design<strong>in</strong>g a tunnel-ventilated barn.3.) Plac<strong>in</strong>g fans at a 60-degree angle with respect to the direction <strong>of</strong> airflow didnot appear to significantly affect fan performance.4.) The fans perform best when placed away from obstructions and higher <strong>of</strong>f thefloor.5.) Regular fan ma<strong>in</strong>tenance is important.6.) Regular fan ma<strong>in</strong>tenance ensures that fans perform closer to their maximumpotential at all times.REFERENCESWheeler, E.F., R. Bottcher. 1995. Evaluat<strong>in</strong>g Mechanical Ventilation Systems,Evaluat<strong>in</strong>gLivestock Hous<strong>in</strong>g Environments.Shearer, J.K., D.K. Beede, R.A. Buckl<strong>in</strong>, and D.R. Bray. 1991. EnvironmentalModifications to Reduce Heat Stress <strong>in</strong> Dairy Cattle. Agri-Practice, Volume 12, No. 4,July/August, 1991.Simmons, J.D., I.E. Hannigan, and B.D. Lott. 1998. Flow Rate Variations Result<strong>in</strong>gfrom Placement <strong>of</strong> Large <strong>Fan</strong>s <strong>in</strong> <strong>Tunnel</strong> <strong>Ventilated</strong> Broiler Houses. 1998 ASAE Annual<strong>In</strong>t’l Meet<strong>in</strong>g 1998.Parry, R. (2003) Personal Contact. US EPA, Office <strong>of</strong> Water.14