Texas, USA 2010 - International Herbage Seed Group
Texas, USA 2010 - International Herbage Seed Group Texas, USA 2010 - International Herbage Seed Group
at maturity or earlier if weather conditions are severe (Tischler & Ocumpaugh 2004). Seedshattering and non-uniformity of seed ripening have been considered major limitations toconsistent seed production because yield can be dramatically reduced if harvests are delayed forany reason, but seed quality can be compromised if harvested before physiological maturity (Roe1972). Issues related to seed production should be addressed before promoting its utilization inthe region. Fortunately, phenotypic variability in seed retention in some accession of P.coloratum var. coloratum has been previously reported, suggesting the possibility of geneticimprovement in the species (Young 1986; Young 1991).The present study was initiated to assess seed shattering variability in a germplasm collection inArgentina to evaluate the possibility of undertaking an efficient program of selection andbreeding to develop a shattering resistant material.Materials and MethodsSeed shattering dynamics were evaluated in a germplasm collection established at INTA(National Institute of Agricultural Technology) Rafaela Experiment Station (31°11‟41‟‟ S;61°29‟55‟‟ W) in October 2006. The collection included 5 populations coming from a widerange of soils, precipitation and different management regimes in north- central Argentina. Threepopulations were collected in Córdoba (Typic Haplustol, 600 mm annual precipitation): DF wasunder grazing of cattle and goats; UCB and MR were not grazed. The other two populations (ERand BR) were from Corrientes (Vertic Argiudol, 1500 mm annual precipitation, grazed by beefcattle). Populations consisting in 32 individual plants planted spaced at 0.6 m distance, werewidely separated from each other to prevent cross pollination.A seed trap especially designed was used to collect all the seeds produced per panicle. The trapconsisted of a cylindrical steel structure over a pole and covered by a nylon stocking. Panicles wereset into the trap at the peak of anthesis, when at least 2/3 of all florets had gone through anthesis.Ten plants per populations were evaluated. Trap setting was performed in 3 consecutive summers(2006-07, 20007-08 and 2008-09, hereafter 2007-2008 and 2009, respectively). In 2007, traps‟setting up was performed on 03/6 in DF, 03/15 in UCB, 03/20 in ER and BR. A strong rainfallevent the last week of March 2007 delayed trap setting in MR until 04/04 (Figure 1). Date ofanthesis was uniform among populations in 2008 and 2009; therefore all traps were set on 02/04/08and on 02/27/09. The seeds trapped in the nylon-stocking as they ripened, were collected weekly ina paper bag, taken to the lab and counted for seed shattering evaluation. In 2007, seed collectionstarted on 03/15 in DF, on 03/21 in UCB, on 04/04 in BR and ER and on 04/11 in MR. Seedcollection commenced 02/19 for all populations in 2008 and on 03/10 in 2009. Consequently, seedswere collected at 8 successive dates in 2007, 5 dates in 2008 and 9 in 2009. The samples were handcleaned,seeds were separated from remaining glumes and only mature seeds were counted. At thelast harvest, panicles were cut, taken to the lab and the threshed seeds were counted and added up toget the total number of seeds per panicle.27
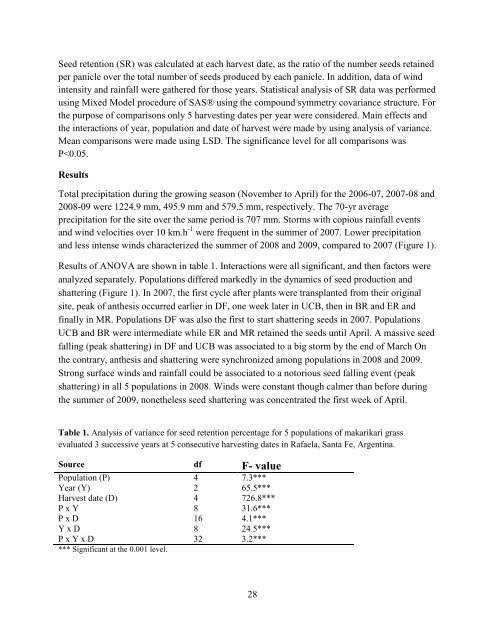
Seed retention (SR) was calculated at each harvest date, as the ratio of the number seeds retainedper panicle over the total number of seeds produced by each panicle. In addition, data of windintensity and rainfall were gathered for those years. Statistical analysis of SR data was performedusing Mixed Model procedure of SAS® using the compound symmetry covariance structure. Forthe purpose of comparisons only 5 harvesting dates per year were considered. Main effects andthe interactions of year, population and date of harvest were made by using analysis of variance.Mean comparisons were made using LSD. The significance level for all comparisons wasP
- Page 1 and 2: Proceedings of the 7th Internationa
- Page 3 and 4: Table of ContentsORAL PRESENTATIONS
- Page 5 and 6: Seed yield components and yield per
- Page 7 and 8: International Herbage Seed Conferen
- Page 9 and 10: 16:15 - 16:30 Reliability of salini
- Page 11 and 12: Hotel expense is covered for night
- Page 13 and 14: 40,000 were slaves (McDonald, 2007)
- Page 15 and 16: Fig. 1. Texas AgriLife Research and
- Page 17 and 18: $7 billion for cattle, $3 billion f
- Page 19 and 20: principle and encourages both AgriL
- Page 21 and 22: eceived by growers, the above perce
- Page 23 and 24: seed conditioning plants are locate
- Page 25 and 26: Table 4.Hectares of open-field burn
- Page 27 and 28: system, a seed crop is produced fro
- Page 29 and 30: Fig. 1. Land resource areas of Texa
- Page 31 and 32: y land owners. Seed yields are low
- Page 33 and 34: The influence of planting density o
- Page 35 and 36: Simple correlation and regression a
- Page 37: Variation in seed shattering in a g
- Page 41 and 42: mm160120Precipitation8040020Km h -1
- Page 43 and 44: Young, B. A. (1986). A Source of Re
- Page 45 and 46: Several methods are commonly used f
- Page 47 and 48: Table 3. Effect of the length of ha
- Page 49 and 50: Alfalfa seed production in semi-hum
- Page 51 and 52: Rather near the meteorological stat
- Page 53 and 54: ReferencesBolaños-Aguilar E.D., Hu
- Page 55 and 56: ased bioenergy conversion plants wa
- Page 57 and 58: Table 1. Average distances required
- Page 59 and 60: Figure 1. Optimized locations for 1
- Page 61 and 62: Perennial ryegrass (Lolium perenne
- Page 63 and 64: Relative Seed Yieldsingle composite
- Page 65 and 66: Flowers, M.D.; Hart, J.M.; Young II
- Page 67 and 68: Thus, similar to tissue tests, remo
- Page 69 and 70: Conclusion:Perhaps our most importa
- Page 71 and 72: Modelling critical NDVI curves in p
- Page 73 and 74: The five spectral reflectance measu
- Page 75 and 76: Harvest loss in ryegrass seed crops
- Page 77 and 78: Larger than expected harvest losses
- Page 79 and 80: Rolston, P.; Trethewey, J.; McCloy,
- Page 81 and 82: Optical sensors have the potential
- Page 83 and 84: Figure 2. Seed yield response to ap
- Page 85 and 86: Flowers, M. D., Hart, J.M., Young I
- Page 87 and 88: In 2010, France has launched the fo
<strong>Seed</strong> retention (SR) was calculated at each harvest date, as the ratio of the number seeds retainedper panicle over the total number of seeds produced by each panicle. In addition, data of windintensity and rainfall were gathered for those years. Statistical analysis of SR data was performedusing Mixed Model procedure of SAS® using the compound symmetry covariance structure. Forthe purpose of comparisons only 5 harvesting dates per year were considered. Main effects andthe interactions of year, population and date of harvest were made by using analysis of variance.Mean comparisons were made using LSD. The significance level for all comparisons wasP


