Texas, USA 2010 - International Herbage Seed Group
Texas, USA 2010 - International Herbage Seed Group Texas, USA 2010 - International Herbage Seed Group
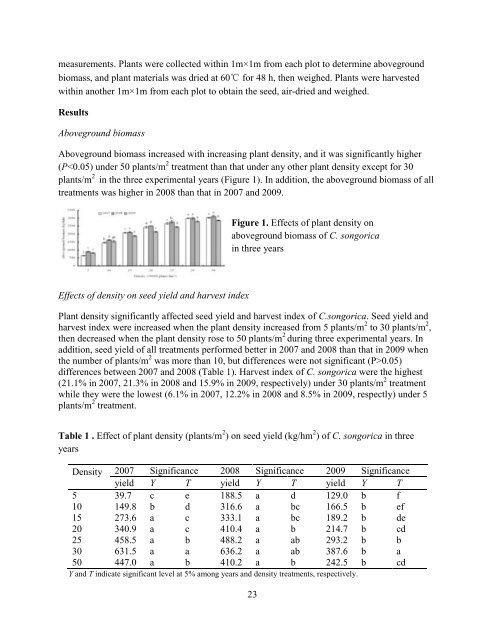
measurements. Plants were collected within 1m×1m from each plot to determine abovegroundbiomass, and plant materials was dried at 60℃ for 48 h, then weighed. Plants were harvestedwithin another 1m×1m from each plot to obtain the seed, air-dried and weighed.ResultsAboveground biomassAboveground biomass increased with increasing plant density, and it was significantly higher(P0.05)differences between 2007 and 2008 (Table 1). Harvest index of C. songorica were the highest(21.1% in 2007, 21.3% in 2008 and 15.9% in 2009, respectively) under 30 plants/m 2 treatmentwhile they were the lowest (6.1% in 2007, 12.2% in 2008 and 8.5% in 2009, respectly) under 5plants/m 2 treatment.Table 1 . Effect of plant density (plants/m 2 ) on seed yield (kg/hm 2 ) of C. songorica in threeyearsDensity 2007 Significance 2008 Significance 2009 Significanceyield Y T yield Y T yield Y T5 39.7 c e 188.5 a d 129.0 b f10 149.8 b d 316.6 a bc 166.5 b ef15 273.6 a c 333.1 a bc 189.2 b de20 340.9 a c 410.4 a b 214.7 b cd25 458.5 a b 488.2 a ab 293.2 b b30 631.5 a a 636.2 a ab 387.6 b a50 447.0 a b 410.2 a b 242.5 b cdY and T indicate significant level at 5% among years and density treatments, respectively.23
Simple correlation and regression analysis between seed yield and its componentsThe results showed that the most important yield component of C. songorica was the number offertile shoots/m 2 that was significantly (P
- Page 1 and 2: Proceedings of the 7th Internationa
- Page 3 and 4: Table of ContentsORAL PRESENTATIONS
- Page 5 and 6: Seed yield components and yield per
- Page 7 and 8: International Herbage Seed Conferen
- Page 9 and 10: 16:15 - 16:30 Reliability of salini
- Page 11 and 12: Hotel expense is covered for night
- Page 13 and 14: 40,000 were slaves (McDonald, 2007)
- Page 15 and 16: Fig. 1. Texas AgriLife Research and
- Page 17 and 18: $7 billion for cattle, $3 billion f
- Page 19 and 20: principle and encourages both AgriL
- Page 21 and 22: eceived by growers, the above perce
- Page 23 and 24: seed conditioning plants are locate
- Page 25 and 26: Table 4.Hectares of open-field burn
- Page 27 and 28: system, a seed crop is produced fro
- Page 29 and 30: Fig. 1. Land resource areas of Texa
- Page 31 and 32: y land owners. Seed yields are low
- Page 33: The influence of planting density o
- Page 37 and 38: Variation in seed shattering in a g
- Page 39 and 40: Seed retention (SR) was calculated
- Page 41 and 42: mm160120Precipitation8040020Km h -1
- Page 43 and 44: Young, B. A. (1986). A Source of Re
- Page 45 and 46: Several methods are commonly used f
- Page 47 and 48: Table 3. Effect of the length of ha
- Page 49 and 50: Alfalfa seed production in semi-hum
- Page 51 and 52: Rather near the meteorological stat
- Page 53 and 54: ReferencesBolaños-Aguilar E.D., Hu
- Page 55 and 56: ased bioenergy conversion plants wa
- Page 57 and 58: Table 1. Average distances required
- Page 59 and 60: Figure 1. Optimized locations for 1
- Page 61 and 62: Perennial ryegrass (Lolium perenne
- Page 63 and 64: Relative Seed Yieldsingle composite
- Page 65 and 66: Flowers, M.D.; Hart, J.M.; Young II
- Page 67 and 68: Thus, similar to tissue tests, remo
- Page 69 and 70: Conclusion:Perhaps our most importa
- Page 71 and 72: Modelling critical NDVI curves in p
- Page 73 and 74: The five spectral reflectance measu
- Page 75 and 76: Harvest loss in ryegrass seed crops
- Page 77 and 78: Larger than expected harvest losses
- Page 79 and 80: Rolston, P.; Trethewey, J.; McCloy,
- Page 81 and 82: Optical sensors have the potential
- Page 83 and 84: Figure 2. Seed yield response to ap
measurements. Plants were collected within 1m×1m from each plot to determine abovegroundbiomass, and plant materials was dried at 60℃ for 48 h, then weighed. Plants were harvestedwithin another 1m×1m from each plot to obtain the seed, air-dried and weighed.ResultsAboveground biomassAboveground biomass increased with increasing plant density, and it was significantly higher(P0.05)differences between 2007 and 2008 (Table 1). Harvest index of C. songorica were the highest(21.1% in 2007, 21.3% in 2008 and 15.9% in 2009, respectively) under 30 plants/m 2 treatmentwhile they were the lowest (6.1% in 2007, 12.2% in 2008 and 8.5% in 2009, respectly) under 5plants/m 2 treatment.Table 1 . Effect of plant density (plants/m 2 ) on seed yield (kg/hm 2 ) of C. songorica in threeyearsDensity 2007 Significance 2008 Significance 2009 Significanceyield Y T yield Y T yield Y T5 39.7 c e 188.5 a d 129.0 b f10 149.8 b d 316.6 a bc 166.5 b ef15 273.6 a c 333.1 a bc 189.2 b de20 340.9 a c 410.4 a b 214.7 b cd25 458.5 a b 488.2 a ab 293.2 b b30 631.5 a a 636.2 a ab 387.6 b a50 447.0 a b 410.2 a b 242.5 b cdY and T indicate significant level at 5% among years and density treatments, respectively.23


