ORAL - International Conference of Agricultural Engineering
ORAL - International Conference of Agricultural Engineering
ORAL - International Conference of Agricultural Engineering

You also want an ePaper? Increase the reach of your titles
YUMPU automatically turns print PDFs into web optimized ePapers that Google loves.
<strong>ORAL</strong>SPC-06: APPLI-CATIONSOF SMARTSSESNSORSAND WIRELESSSENSORNETWORKS(WSN) IN PLFC-0372WIRELESS SENSOR NETWORKS LOCALIZATIONIN HETEROGENEOUS TRANSMISSION MEDIUMPresenter: Esmaeil S. NadimiDenmarkAuthors: Esmaeil S. Nadimi 1 , Jakob Juul Larsen 2 , Ole Green 2 ,Victoria Blanes-Vidal 1 , Pilar Barreiro Elorza 3 , Thomas SkjodebergT<strong>of</strong>tegaard 21University <strong>of</strong> Southern Denmark2Aarhus University3University <strong>of</strong> MadridC-0876THE EFFECT ON WIRELESS SENSOR NETWORKCOMMUNICATION WHEN EMBEDDED IN BIO-MASSPresenter: Jakob Juul LarsenDenmarkAuthors: Jakob Juul Larsen 1 , Ole Green 1 , Esmaeil S. Nadimi 2 ,Thomas Skjodeberg T<strong>of</strong>tegaard 11Department <strong>of</strong> <strong>Engineering</strong> Aarhus University2Faculty <strong>of</strong> <strong>Engineering</strong> University <strong>of</strong> Southern DenmarkC-1361ADAPTIVE RFID SENSORING OF RELATIVE TEM-PERATURE AND HUMIDITY FOR SMART FARMQUALITY CONTROLLER SYSTEM.Presenter: Chalitda MadhyamapurushThailandAuthors: Chalitda MadhyamapurushMAEJO UniversityC-1452CHILDREN AS FIELD SENSORS - A TRIAL INVIETNAMPresenter: Seishi NinomiyaJapanAuthors: Seishi Ninomiya 1 , Yumi Mori 2 , Toshiya Takasaki 2 ,TranThin Hoa 3 , Y. Okano 2 , Takaharu Kameoka 4 , S. Togami 4 , A.Takezaki 5 , R Ikeda 61U. Tokyo2NPO Pangaean3MARD Vietnam4Mie U.C-1561ASSESSING THE DYNAMIC BEHAVIOR OF WSNMOTES AND RFID SEMI-PASSIVE TAGS FORTEMPERATURE MONITORINGPresenter: Luis Ruiz-GarciaSpainAuthors: Ricardo Badía Melis 1 , Luis Ruiz-Garcia 1 , TatianaJimenez-Ariza 1 , Javier Gargia-Hierro 2 , José Ignacio RoblaVillalba 2 , Pilar Barreiro Elorza 11Laboratorio de Propiedades Físicas Y tecnologías Avanzadasen Agroalimentación, Universidad Politécnica de Madrid,ETSI Agrónomos, Edificio Motores, Avda. Complutense s/n,28040 Madrid, Spain2Sensors Technology Laboratory, Centro Nacional de InvestigacionesMetalurgicas, Consejo Superior de InvestigacionesCientíficas (CENIM-CSIC),C-1937CLIMATIC CHANGES AND EVALUATION OF THEIREFFECTS ON AGRICULTURE IN ASIAN MONSOONREGIONPresenter: Masaru MizoguchiJapanAuthors: Masaru MizoguchiUniversity <strong>of</strong> TokyoC-1955A WIRELESS SENSOR NETWORK FOR PRECISESOIL WATER MANAGEMENT IN AN ORCHARDPresenter: Takashi TogamiJapanAuthors: Takashi Togami 2 , Kyosuke Yamamoto 1 , Ryoei Ito 2 ,Atsushi Hashimoto 2 , Takaharu Kameoka 22Mie University1The Univeristy <strong>of</strong> Tokyo
C-2060TOWARD A WIRELESS SYSTEMS INTEGRATIONON AGRICULTURAL ENVIRONMENTPresenter: Christian CorreaSpainAuthors: Christian Correa, Wilson Esquivel, Fernando Reyes,José ReyesPower and Machinery Universidad de ConcepciónC-2121EFFECTIVENESS AND POTENTIAL OF A WEB-BA-SED SENSOR NETWORK SYSTEM FOR AGRICUL-TURAL APPLICATIONS USING IMAGE DATAPresenter: Tokihiro FukatsuJapanAuthors: Tokihiro Fukatsu, Masayuki Hirafuji, Takuji KiuraNational Agriculture and Food Research Organization
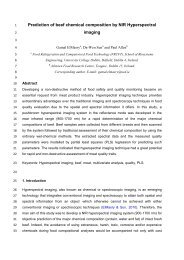
Manuscript Preparation Guidelines for CIGR-Ageng2012<strong>International</strong> <strong>Conference</strong> <strong>of</strong> <strong>Agricultural</strong> <strong>Engineering</strong>THE EFFECT ON WIRELESS SENSOR NETWORK COMMUNICATION WHENEMBEDDED IN BIOMASSJakob J. Larsen 1 *, Ole Green 1 , Esmaeil S. Nadimi 2 , Thomas S. T<strong>of</strong>tegaard 31 Department <strong>of</strong> <strong>Engineering</strong>, Aarhus University, Blichers Alle 20, 8830 Tjele, Denmark.2 Faculty <strong>of</strong> <strong>Engineering</strong>, Institute <strong>of</strong> Chemical <strong>Engineering</strong>, Biotechnology andEnvironmental Technology, University <strong>of</strong> Southern Denmark, Odense, Denmark.3Department <strong>of</strong> <strong>Engineering</strong>, Aarhus University, Ny Munkegade 120, 8000 Aarhus, Denmark.*Corresponding author. E-mail: JakobJuul.Larsen@agrsci.dkAbstractUsing wireless sensor networks (WSN) inside a heterogeneous biomass is challenging. Inthis article some <strong>of</strong> the challenges <strong>of</strong> deploying a WSN in a heterogeneous biomass, in thiscase silage, is handled. The permittivity <strong>of</strong> silage is measured using an open-ended coaxialprobe. Results were successfully obtained in the frequency range from 400 MHz to 4 GHz,but large variations suggested that a larger probe should be used for more stable results.The effect <strong>of</strong> silage on a helix and loop antenna was measured. Of the two antennas testedthe helix antenna was deemed best suited for deployment in biomass. Lastly it is suggestedthat taking the dielectric properties <strong>of</strong> silage into account during hardware development couldresult in much better achievable communication range.Key words: WSN; permittivity; detuning; biomass storage.1 IntroductionEfficient storage <strong>of</strong> farm produce is vital as improper storage causes product loss andtherefore also financial loss. Substantial losses can happen without it being easily detectable(McDonald et al. 1991). Current monitoring systems involve considerable extrapolation fromvery few samples (MacDonald et al. 2002).Wireless Sensor Network (WSN) technology could help change this and is now commonlyused in a variety <strong>of</strong> monitoring situations, but relatively few WSN applications have so farbeen developed which require signal transmission through complex materials with high watercontent. Recently Green (Green & Pranov 2008; Green 2010) suggested that WSN might besuitable for monitoring agricultural biomass and patented a suitable sensor (Green et al.2009) for use in silage. Green et al. (2009) indicated a great potential for quality optimizationand ensuring the quality. The sensors used in the experiment were limited to very shortcommunication ranges. No discussion was made on how to improve transmission distance,or which parameters to consider when designing sensors for embedding in biomass. Thisarticle tries to investigate the properties <strong>of</strong> silage that affects Radio Frequency (RF)communication and how big the effects are.In a heterogeneous material such as silage the RF-characteristics within a region <strong>of</strong> thematerial will be determined by the permittivity <strong>of</strong> that region. To estimate which challenges aWSN deployed in silage must face a method for measuring the complex permittivity isneeded. A variety <strong>of</strong> methods exist for this purpose (von Hippel 1954; Roberts & Von Hippel1946; Nelson 1973). For a high loss material such as silage (Stuchly & Stuchly 1980) is thesimplest and <strong>of</strong>fer good accuracy.The aim <strong>of</strong> this study is to measure the RF properties <strong>of</strong> silage under normal storageconditions to gain a better understanding <strong>of</strong> how it will affect the radio communication <strong>of</strong> a
open, short and 50 Ω termination. During the experiment a loop antenna and a helix antennawere used. The homemade 433 MHz loop antenna was made from ø1 mm copper wire witha loop diameter <strong>of</strong> 35 mm. The tuning capacitor was 1.2 pF and Q <strong>of</strong> the antenna wasapproximately 336 in air. The helix antenna was a Linx Technologies ANT-433-HETH. SMAconnectors were used for both antennas and each antenna was enclosed in a small plasticbox to avoid direct contact with the silage.The experiment was carried out on the 6th <strong>of</strong> January 2011 and the silage stack used wasmade in July 2010 by and stored at the Faculty <strong>of</strong> <strong>Agricultural</strong> Sciences, Foulum, Denmark.The stack was stored in a barn. The resonance frequency and quality, Q, <strong>of</strong> the antenna wasmeasured in two different circumstances. First it was measured while in air using the VNA.Then a 40 cm hole with a 4 cm diameter was drilled in the grass silage stack, the antennaplaced at the bottom and the resonance frequency and Q was measured again. This wasdone for both types <strong>of</strong> antenna. Each recorded measurement was averaged on the VNA over100 measurements. Dry-matter analysis was done on all samples.4 Results and Discussion4.1 Properties <strong>of</strong> the silage samplesTable 1 Dry-matter analysis <strong>of</strong> the silage samples.Silage baleSilage stackMean Standard div. Mean Standard dev.Moisture content 66.70 % 0.12 66.46 % 1.06Density - - 0.56 g/cm 3 0.10Table 1 contains the dry matter analysis as well as density for the samples from the silagestack and the samples from the silage bale. The moisture content <strong>of</strong> the silage stack samplesis less stable than that <strong>of</strong> the silage bale but this was expected as the bale has been treatedmore uniformly and the samples were taken from a smaller volume than those <strong>of</strong> the silagestack. The density also varies but is well within the variations found in other works (Muck &Holmes 2000).4.2 Complex permittivity measurementsFigure 2 shows the averaged complex relative permittivity for all samples calculated from thereflection coefficient measurements and the standard deviation on both the real an imaginarypart.Figure 2 The real (solid line) and imaginary (dotted line) part <strong>of</strong> the permittivity and standarddeviation.The figure show a permittivity that drops as frequency increases, which corresponds wellwith observations on biological materials in general (Ponne & Bartels 1995). It can be
observed from Figure 2 that the measured permittivity has a large spread. This correspondswell with silage being a heterogeneous material. Another contributing factor could be that theopen end <strong>of</strong> the probe was observed during the experiment to be small considering thecoarseness <strong>of</strong> the material. At the current probe size single stands <strong>of</strong> grass have a widthcomparable to that <strong>of</strong> the open end which gives the individual strands too large an impact onthe measurement. A larger probe would make for a better averaging <strong>of</strong> the material which inturn should lead to more consistent measurements (Filali et al. 2008). Figure 2 also showsthat the material becomes less lossy as the frequency rises but the gain from the decreasedloss should be seen in relation to the shorter wavelength. As shorter wavelengths have lesspenetration power due to increased scattering increasing the frequency would not be asbeneficial as it could initially appear.The measured permittivity is high, which corresponds well with the high water contentrecorded in Table 1.4.3 Resonance measurementsTable 2 Resonance frequency, Q and S11 measurements for both antennas in both air andsilage.Antenna f res,air(MHz)f res,silage(MHz)Δf res(MHz)Q air Q silage S11 res,air(dB)S11 res,sil(dB)Helix 424 345 79 11.5 7 -4.0 -8.1Loop 434 429 5 336.7 167.4 -16.6 -0.5Table 2 presents the measurements <strong>of</strong> the resonance frequency <strong>of</strong> the two differentantennas. From the table it is clear that moving from air to silage does change the resonancefrequency <strong>of</strong> the antennas. This is because <strong>of</strong> the large change in permittivity <strong>of</strong> thesurrounding material. It can also be seen that both antennas are affected but to a vastlydifferent extent. While the loop antenna's resonance frequency drops 5 MHz the resonance<strong>of</strong> the helix antenna drops 79 MHz, more than a factor <strong>of</strong> 15 compared to the loop antenna.This occurs because the near field <strong>of</strong> the loop antenna is primarily a magnetic field whereasthe near field <strong>of</strong> the helix antenna is an electric field (Balanis 2005). This means that it isprimarily the permability <strong>of</strong> the surrounding material that influences the loop antenna while forthe helix antenna it is the permittivity. Assuming that the permeability <strong>of</strong> silage and air arealmost equal is not unreasonable (Ponne & Bartels 1995), whereas the relative permittivity <strong>of</strong>air is ~1, very different from the measured permittivity, Figure 2. S11 at resonance and the Q<strong>of</strong> the antennas also change when embedded in silage, see Table 2. The Q drops for bothantennas making them less selective but while the S11 changes +16 dB for the loopantenna, S11 for the helix antenna changes by -4.5 dB. This means that almost all power isreflected back from the loop antenna leaving very little to be transmitted. Coupled with thelow radiation resistance <strong>of</strong> loop antennas in general this means almost no power is beingtransmitted. The helix antenna on the other hand actually reflects less power at the inputmaking more power go into the antenna. Whether this extra power is radiated is not knownas it cannot be seen from the measurements if the losses also increase in the antenna.Table 2 shows that adjusting the antenna to be deployed in silage is a good way to increasetransmission distance. While the range will still be shorter due to the higher loss factorcompared to vacuum, the detuning that happens if the dielectric properties <strong>of</strong> silage are nottaken into account makes the effects much worse.To aid in choosing an antenna for deployment several factors should be taken into account.Given the characteristics <strong>of</strong> the material the antenna should be as insensitive to changes inthe nearby environment as possible. As the sensor node will need to be protected from thesilage and the machines used to handle it the antenna needs to be compact to fit within thelimited space <strong>of</strong> a protective shell. The directionality <strong>of</strong> the antenna is also important as in areal situation having to arrange the sensors to face a particular way is time consuming andimpractical. Because <strong>of</strong> this an omnidirectional antenna would be preferable. From the
measurements done it can be argued that broadband antennas are preferable overnarrowband in a heterogeneous environment. While the complex permittivity measurementsdone here give a hint in which range silage lies, changes in any <strong>of</strong> several parameters(moisture, temperature, density, conductivity) could well move a narrowband antenna outsideits operating band. This could cause increased packet loss or in the worst case the WSNcommunication could be made impossible. While not all the parameters are equally likely tochange silage is <strong>of</strong>ten stored outside or in open barns which means that a constanttemperature over the entire storage period is unlikely. A broadband antenna could easiercope with these changes and remain within its operating band. An alternative method toovercome this would be to place sensors very close together or transmit with more power,the former being expensive in hardware and the latter putting extra strain on the alreadylimited power resources <strong>of</strong> a sensor node.Future work should involve investigating the influence <strong>of</strong> temperature on the permittivityduring the entire storage period <strong>of</strong> a silage stack. Furthermore the measurements <strong>of</strong> thecomplex permittivity should be redone with a probe capable <strong>of</strong> sampling a large volume <strong>of</strong>silage.5 ConclusionIn this paper the permittivity <strong>of</strong> silage was examined. The complex permittivity was measuredover a frequency span from 400 MHz to 4 GHz using an open-ended coaxial probe. Resultswere successfully obtained, but large variations suggested that a larger prober should beused for more stable results. Furthermore the effect <strong>of</strong> silage on helix and loop antennas wasinvestigated. Detuning was present for both antennas, but the helix antenna suffered a largershift in resonance frequency than the loop antenna. This effect was attributed to thedifference in nature between the two antennas, the helix being an electric antenna and theloop being a magnetic antenna. The change in Q was also measured and here the helixantenna preformed significantly better than the loop antenna.For WSN’s designed to be deployed in silage it is suggested that the antennas used arecompact, broadband and that the high permittivity <strong>of</strong> the biomass is taken into account, asthis can greatly increase the achievable communication range. Of the antennas tested thehelix antenna is recommended.Athey, T.W. & Stuchly, M.A., 1982. Measurement <strong>of</strong> radio frequency permittivity <strong>of</strong> biologicaltissues with an open-ended coaxial line: Part I. IEEE T. Microw. Theory, 82(1), p.82-86.Balanis, C., 2005. Antenna theory : analysis and design 3rd ed., John Wiley & Sons.Brady, M.M., Symons, S.A. & Stuchly, S.S., 1981. Dielectric behavior <strong>of</strong> selected animaltissues in vitro at frequencies from 2 to 4 GHz. IEEE Trans. Bio-med. Eng., 28(3),p.305-7.Filali, B., Boone, F. & Rhazi, J., 2008. Design and calibration <strong>of</strong> a large open-ended coaxialprobe for the measurement <strong>of</strong> the dielectric properties <strong>of</strong> concrete. IEEE T. Microw.Theory, 56(10), p.2322-2328.Ghannouchi, F.M. & Bosisio, R.G., 1989. Measurement <strong>of</strong> microwave permittivity using a sixportreflectometer with an open-ended coaxial line. IEEE T. Instrum. Meas., 38(2),p.505-508.Green, O. et al., 2009. Monitoring and modeling temperature variations inside silage stacksusing novel wireless sensor networks. Comput. Electron. Agr., 69(2), p.149-157.
Green, O., 2010. Monitoring <strong>of</strong> stored and processed agricultural biomass by remote wirelesstechnology. Aarhus University.Green, O. & Pranov, H., 2008. Patent: Embedded Silage Sensor.Hippel, A. von, 1954. Dielectrics and waves, New York, USA: John Wiley and Sons.Langhe, P.D., Martens, L. & Zutter, D.D., 1994. Design rules for an experimental setup usingan open-ended coaxial probe based on theoretical modelling. IEEE T. Instrum. Meas.,43(6), p.810-817.MacDonald, P. et al., 2002. Animal Nutrition 6th ed., New Jersey, USA: Pearson.Marcuvitz, N., 1986. Waveguide Handbook 1st ed. N. Marcuvitz, ed., The Institution <strong>of</strong><strong>Engineering</strong> and Technology.McDonald, P., Henderson, A.R. & Heron, S.J.E., 1991. The Biochemestry <strong>of</strong> Silage 2nd ed.,Southampton, UK: Chalcombe Publications.Muck, R.E. & Holmes, B.J., 2000. Factors affecting bunker silo densities. Appl. Eng. Agric.,16(6), p.613–619.Nelson, S.O., 1973. Microwave dielectric properties <strong>of</strong> grain and seed. Trans. ASABE, 5,p.902-905.Ponne, C. & Bartels, P., 1995. Interaction <strong>of</strong> electromagnetic energy with biological material— relation to food processing. Radiat. Phys. Chem., 45(4), p.591-607.Roberts, S. & Hippel, A. Von, 1946. A new method for measuring dielectric constant and lossin the range <strong>of</strong> centimeter waves. J. Appl. Phys., 17(7), p.610–616.Stuchly, M.A. & Stuchly, S.S., 1980. Coaxial Line Reflection Methods for MeasuringDielectric Properties <strong>of</strong> Biological Substances at Radio and Microwave Frequencies-AReview. IEEE T. Instrum. Meas., 29(3), p.176-183.Stuchly, S.S., Sibbald, C.L. & Anderson, J.M., 1994. A new aperture admittance model foropen-ended waveguides. IEEE T. Microw. Theory, 42(2), p.192–198.
Children As Field Sensors – A Trial in VietnamSeishi Ninomiya 1 *, Yumi Mori 2 , Toshiya Takasaki 2 , Yasukazu Okano 2 , TakaharuKameoka 3 , Takashi Togami 3 , Kyosuke Yamamoto 3 , Akanae Takezaki 4 , RyoichiIkeda 5 , Toru Ishida 61 ISAS, The University <strong>of</strong> Tokyo, Nishitokyo, Tokyo 188-0002, Japan2 NPO Pangaean, Kyoto, Japan3 Ministry <strong>of</strong> Agriculture and Rural Development, Vietnam4 NARC, National Agriculture and Food Research Organization, Tsukuba, Japan5 Tokyo University <strong>of</strong> Agriculture, Tokyo, Japan6 Kyoto University, Kyoto, Japan*Corresponding author. E-mail: snino@isas.a.u-tokyo.ac.jpAbstract<strong>Agricultural</strong> decision support is becoming more important particularly in developing countriesas the sustainability <strong>of</strong> agriculture needs to be achieved nowadays in addition to itsproductivity and necessary technologies and knowledge are becoming rather complicated.Because <strong>of</strong> the site-specificity <strong>of</strong> agriculture, the decision support also needs to be optimizedfor each location and the experts need to know the site-specific conditions to provide properadvices. However, site-specific information is insufficient in rural areas <strong>of</strong> developingcountries. In this study, we propose a totally new idea <strong>of</strong> collecting site-specific fieldinformation which utilizes children as field sensors. We conducted an initial study as a part <strong>of</strong>a project for the YMC (Youth Mediated Communication) model which is an idea to transferinformation to illiterate parents through their children who are educated at school.Key words: illiteracy, technology transfer, youth mediated communication1. IntroductionIn the 20 th century, agriculture was successful in terms <strong>of</strong> providing sufficient food for humanbeings, causing explosive growth <strong>of</strong> the population. It was, however, extremely dependent onexcess use <strong>of</strong> chemicals such as fertilizer and pesticide and seriously damaged environmentby the end <strong>of</strong> the century. In the 21 st century, we are requested to realize a paradigm shift <strong>of</strong>agriculture to achieve its real sustainability while securing its productivity and farm levelpr<strong>of</strong>its. Accordingly, agricultural decision support is becoming more important particularly indeveloping countries as the technologies and knowledge are becoming rather complicated torealize such agriculture.Because <strong>of</strong> the site-specificity <strong>of</strong> agriculture, the decision support also needs to be optimizedfor each location and the experts need to know the site-specific conditions to provide properadvices. However, in rural areas <strong>of</strong> developing countries, number <strong>of</strong> experts is short andweather observatories are <strong>of</strong>ten unavailable, resulting in lack <strong>of</strong> site-specific information.Recently, reasonably low-cost field monitoring systems to collect site-specific meteorologicaldata and images are available (Fukatsu and Hirafuji 2005) and one idea would be to deploythem in such rural areas. We, however, need certain level <strong>of</strong> skill to maintain such systemsand it is rather difficult to have it in rural areas <strong>of</strong> developing countries. Moreover, suchsystems can provide us only limited information and we still need human visual observationsto collect some <strong>of</strong> site-specific field data to lead to optimal advices.In this study, we propose a totally new idea <strong>of</strong> collecting site-specific field information whichutilizes the capability <strong>of</strong> children, asking them to act as field sensors and conducted an initialstudy in Vietnam as a part <strong>of</strong> a project for the YMC (Youth Mediated Communication) model
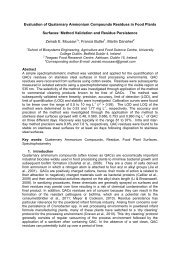
FIGURE2: Example <strong>of</strong> the recipe cards in Vietnamese. The experts indicate color andnumber<strong>of</strong> the cards so that children can easily pick them without mistakes.Some humans are interactively included in the process. So-called bridgers inJapancompensate the weakness <strong>of</strong>f the machine translation by slightly retouching Englishtext towhich the free textt answer bythe experts is translated while the bridgers in Vietnam retouchthe Vietnamese text to which the English text was translated. The last step includes aprocesss to translate special technical terms to ordinal terms which childrenn can understand.3. Children as SensorsEvery children participating inthe project receives a tool kit to serve ass a sensor. . The kitcontainsa thermo-hygrometerand a field notebook. The childrenn are requested to fix the thermo-hydrometer on thea measuring tape, a leaf color chart, c an insect plate, a mobilephone outside wall <strong>of</strong> their home att 1.5m highh where no direct solar radiation reaches. They areengaged to observe temperature and humidity every morning before going to school and tosend thedata to the project sever by SMSS using themobile phone (Fig. 3) ).They are also engaged to visit the paddies <strong>of</strong> their families twice a week in order to conductthe following observations (Fig. 4);1) Measuring plant height bythe measuring tape.2) Recording leafcolor by the leaf colorr chart.3) Finding pests by swinging canopy and catching them which drop on the insect plateinserted into the canopy and, taking pictures <strong>of</strong> them by thee mobile phone.4) Visually observing canopy and plantt and recording special findings by taking pictures <strong>of</strong>them.When they visited the village center to use the computers to exchange e the information withthe experts, the facilitators helped children to upload the photographs taken in the fields tothe project server. The data collected by the children can be linked to their questions andhelp theexperts to give the farmers suggestions.
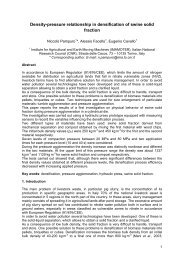
FIGURE 3: The tool kit for the t children sensors. a: thermo-hydrometer, b: field notebook,c:mobile phone, d: measuring tape, e: leaf color chart, f: insect plateFIGURE 4: Child’s sensor in action.4. CaseStudy andDiscussionWe hada test bed at a villagein Vinh Long District where the most majorr crop is paddy rice.Generally speaking, the rice yield is quitee high but the grain quality is rather low in the villageresultingin low selling price. Moreover, the farmerstend to use too muchh fertilizer, chemicaland seed because they believe that highh input assures high yield. Such high input is causingenvironmental damage and aggravating their balance <strong>of</strong> payments.We conducted interviews with severall families in the village and choose 38 families,considering their illiteracy and farm conditions. Wecould conduct the project for only onecroppingseason <strong>of</strong> paddy rice and we need to wait for at least a feww cropping seasonsbefore we can evaluate the efficiency <strong>of</strong>f the approach in terms <strong>of</strong> benefits <strong>of</strong> the famers aswell as the improvement on sustainabilityy <strong>of</strong> their farming.
The information acquired bythe children from the fields, however, h strongly helped theexperts to provideproper suggestions to the farmers. For example, leaf color informationhelped the expertsto know the nitrogen condition <strong>of</strong>the rice plant and to give properr adviceson federalizer amount. The photographs taken by the children (Fig. 5) also helped theexperts to know the diseases and the pests in the fields to give proper advices. Withoutphotographs, it would be rather difficult for the experts to identify such diseases and pests.Aggregating such disease and pests information and mappingg them on GIS can create anearly warning system in near future. fFIGURE 5: Example <strong>of</strong> photographs taken by b children.We alsorealized that the dataa acquisitions by the children seemed to be sustainableand weare quite confidentthat the enriched database about the weather and cropp condition will leadto quantitative modeling <strong>of</strong> crops and pest predictions in the future (Laurenson et. al. 2002).We alsolearned that the family communication was accelerated and the children becamemore interested inagriculture obtainingg much knowledge about a agriculture through theproject, which canbe a trigger to reestablish the rural community. Thiss new approach <strong>of</strong>decisionsupport by digital-analogue fusion seems to be promising and we are planning tostart thesecond stage for much longer duration.ReferencesFukatsuu T., Hirafuji M. (2005) Field monitoring using sensor-nodes withh a web server, J.Robotics and Mechatronics, 17, 164-172langrid.org (2011) Language Grid; http://langrid.org/en/index.htmlLaurenson, M. R., Kiura T., Ninomiya S. . (2002) Providing agricultural models with mediatedaccess to heterogeneous weather databases, Applied <strong>Engineering</strong> Agric., 18, 617-625.Otuka A., NinomiyaS. (1998) Conceptual retrieval <strong>of</strong> agricultural cases with latent semanticindexingapproach, <strong>Agricultural</strong> Information Technology in Asia and Oceania 1998, 203-206.PANGAEA (2012) http://www. .pangaean.org
ASSESSING THE DYNAMIC BEHAVIOR OF WSN MOTES AND RFIDSEMI-PASSIVE TAGS FOR TEMPERATURE MONITORINGRicardo Badia-Melis 1 *, Javier Garcia-Hierro 2 , Luis Ruiz-Garcia 1 , Tatiana Jiménez-Ariza 1 , José Ignacio Robla Villalba 2 , Pilar Barreiro 11 Laboratorio de Propiedades Físicas Y tecnologías Avanzadas en Agroalimentación, UniversidadPolitécnica de Madrid, CEI-Campus Moncloa. ETSI Agrónomos, Edificio Motores, Avda.Complutense s/n, 28040 Madrid, Spain2 Sensors Technology Laboratory, Centro Nacional de Investigaciones Metalurgicas, Consejo Superiorde Investigaciones Científicas (CENIM-CSIC), Avenida Gregorio del Amo, 8. 28040, Madrid Spain*Corresponding author. E-mail: ricardobadia@live.comAbstractA notorious advantage <strong>of</strong> wireless transmission is a significant reduction and simplification inwiring and harness. There are a lot <strong>of</strong> applications <strong>of</strong> wireless systems, but in manyoccasions sensor nodes require a specific housing to protect the electronics from hushenvironmental conditions. Nowadays the information is scarce and nonspecific on thedynamic behaviour <strong>of</strong> WSN and RFID. Therefore the purpose <strong>of</strong> this study is to evaluate thedynamic behaviour <strong>of</strong> the sensors. A series <strong>of</strong> trials were designed and performed coveringtemperature steps between cold room (5 °C), room temperature (23 °C) and heatedenvironment (35 °C). As sensor nodes: three Crossbow motes, a surface mounted Nlazamodule (with sensor Sensirion located on the motherboard), an aerial mounted Nlaza wherethe Sensirion sensor stayed at the end <strong>of</strong> a cable), and four tags RFID Turbo Tag (T700model with and without housing), and 702-B (with and without housing). To assess thedynamic behaviour a first order response approach is used and fitted with dedicatedoptimization tools programmed in Matlab that allow extracting the time response () andcorresponding determination coefficient (r 2 ) with regard to experimental data. The shorterresponse time (20.9 s) is found for the uncoated T 700 tag which encapsulated versionprovides a significantly higher response (107.2 s). The highest corresponds to theCrossbow modules (144.4 s), followed by the surface mounted Nlaza module (288.1 s),while the module with aerial mounted sensor gives a response certainly close above to theT700 without coating (42.8 s). As a conclusion, the dynamic response <strong>of</strong> temperaturesensors within wireless and RFID nodes is dramatically influenced by the way they arehoused (to protect them from the environment) as well as by the heat released by the nodeelectronics itself; its characterization is basic to allow monitoring <strong>of</strong> high rate temperaturechanges and to certify the cold chain. Besides the time to rise and to recover is significantlydifferent being mostly higher for the latter than for the former.KeywordsMetrology, smart sensor, monitor, logistics, sensor network1. IntroductionWSN and RFID are changing and entering in a new phase and is said to improve theperformance <strong>of</strong> agricultural world. A notorious advantage <strong>of</strong> wireless transmission is asignificant reduction and simplification in wiring and harness. Also, wireless technologiesshow several differences and advantages over previous technologies like barcode. RFIDtags do not require direct line <strong>of</strong> sight to the reader and thus can be embedded in a item,placed inside the packing or injected inside the body <strong>of</strong> animals. RFID can be read evenmore than 100 m <strong>of</strong> distance, and due to it reasonable price and the high read rates you canalso use as much as units as you need, for instance more than 100 tags per second (Ruiz-Garcia et al., 2011). Moreover RFID tags have enough memory to store data (up to 4kB in
passive, 1 MB in active tags) such as temperature and humidity; and the WSN <strong>of</strong>ten usesexternal memories or computer`s hard disk.There are a lot <strong>of</strong> applications <strong>of</strong> wireless systems such as: traceability by means <strong>of</strong> RFID,food packaging, history checking and contamination, or inventory control and food inspection(Wang et al., 2006).Relevant environments for the application <strong>of</strong> wireless systems include monitoring <strong>of</strong> fruit andvegetable containers and cold-storage facilities, or monitoring quality and senescence <strong>of</strong>specialty crops during transport (Ruiz-Garcia et al., 2009). The economic impact <strong>of</strong> productlosses stays around 10% in Europe (6-7% in retailers) and 15% in USA (Pang et al., 2012),while reaching 30% in developing countries (mostly to the lack <strong>of</strong> temperature control). Ineither <strong>of</strong> the cases, with transport distances above several thousand <strong>of</strong> kilometers(Jedermann et al., 2011).Pang et al. (2011) explicitly declare that Food chains has become highly distributed,heterogeneous, cooperative, and globalized with extremely diverse requirements, and thusdeclares the need for convergence <strong>of</strong> all the necessary technical requirements (withdedicated analysis for wireless technologies), corresponding operation models, networkingprotocols, hardware (WSN versus RFID), and s<strong>of</strong>tware. According to the authors, a scenariois an abstraction <strong>of</strong> a class <strong>of</strong> deployment environments, and so a particular scenario mayappear multiple times at different positions among the entire sequence link, from produceand manufacturers to sell or consumers. Besides, depending on the scenario there is aspecific need for sensors: store scenario requires gas concentration monitoring (oxygen,ethylene or carbon dioxide), while transport demands GPS and acceleration measurements,while the variety <strong>of</strong> scenarios also provides specific facilities like WIFI (store and sellscenario), or accessible power supply (sell and consumer scenario).Jedermann et al., 2011 focus mainly in the use <strong>of</strong> WSN in transport, and more precisely inthe high attenuation <strong>of</strong> signal in packed food which has turned out to be the major problemfor monitoring packed food transports. According to the authors, about 20% <strong>of</strong> the sensordata are lost because there is no physical route possible between a sensor node and thebase station, while additional sensor data are lost because the protocols are not able todetect the correct routing (4% <strong>of</strong> the sensor data). Another conclusion <strong>of</strong> this study is the factthat electronics has to be protected against high humidity, condensed water, and mechanicalstress during transshipments, while automated localization <strong>of</strong> the sensors inside thecontainer could be very useful, because it cannot be guaranteed that the workers in thepacking station may report the sensor positions properly.In many occasions sensors nodes require a specific housing to protect the electronics fromhush environmental conditions, since this kind <strong>of</strong> equipment was not originally designed forthem, i.e. meteorological data acquisition system (Lee et al., 2010), however this effort isalways shows as contra wise effect the lack <strong>of</strong> sensitivity <strong>of</strong> sensors, in a Penelope-likestrategy.Interestingly, up to date there is no scientific information available on the dynamic behavior <strong>of</strong>WSN and RFID as related to sensor housing or mounting on the base electronics. The aim tothis study is therefore to assess the dynamic behavior <strong>of</strong> the sensors as crucial for a propercharacterization <strong>of</strong> history reconstruction.2. Material and MethodsA series <strong>of</strong> trials were designed and performed with some <strong>of</strong> the technologies that couldrepresent the future in monitoring processes, processes as mentioned in the introduction <strong>of</strong>the paper. This devices covering temperature steps between cold room (5 °C), roomtemperature (23 °C) and heated environment ( stove at 35 °C).
This test has included wireless modules (with ZigBee protocol) type Crossbow Iris(IRIS_XM2110) with sensor card which includes sensors <strong>of</strong> light, acceleration, temperature,humidity and pressure (MTS card 420), a standard Nlaza module (with sensor Sensirionlocated on the motherboard), and a Nlaza module modified (Sensirion sensor stayed at theend <strong>of</strong> a cable) and finally four RFID cards has been used, two 702-B Turbo Tag (one withcoating and one without coating), two Turbo Tag 700 (with coating and without this coating).FIGURE 1: Nlaza module with the Sensirion sensor at the end <strong>of</strong> a cableThe modified module is provided with: (1) Temperature and relative humidity sensor.Sensirion SHT 15, (2) Switch on/<strong>of</strong>f, (3) Transmitter, receptor and (4) Electrical connector.FIGURE 2: Turbo Tags T-700 and T702 with and without coatingAfter several unsuccessful attempts, it was possible to carry out the experiment detailedbelow, were RFID cards and Crossbow nodes were used. Nlaza modules were also used ina later experiment under the same set-up: shifting from 5ºC (refrigerator) to 35 ºC (controlledtemperature oven).Is necessary to keep the sensors far away as much as possible <strong>of</strong> the motherboards, batteryand battery case and unnecessary coatings, and therefore a Turbo tag <strong>of</strong> each type hasbeen opened, and is left exposed the sensor to air, thus it can be seen the thermal inertiaeffect <strong>of</strong> the coatingsWe started the test by placing three Crossbow modules, one in the stove (at 35 ºC), otherone in the fridge (with a temperature <strong>of</strong> 5 °C.) and the last into a room temperature, becausewas needed to have reference temperatures to compare On the other hand were positionedin the fridge the one Crossbow module and RFID tags. At that time the Crossbow moduleswere activated and the computer started to register the data (every 3 seconds).After 20 minutes it was estimated that had stabilized at the temperature <strong>of</strong> the refrigerator,then RFID tags were programmed every 4 seconds (minimum interval that leaves themanufacturer's s<strong>of</strong>tware), started the experiment, at 8:02 am April 26, 2011.The module and the Turbo Tags were changed to the stove at 8:15 am, these remained 20minutes inside the stove, enough time to observe temperature stabilization between thereference module inside the stove and the module just insert (is possible see the tabletemperatures in real time showing the s<strong>of</strong>tware <strong>of</strong> the Crossbow modules).
After that were transported to the refrigerator, at 8:35 am, there remain 30 minutes, againuntil to see stabilization.For the last time to the stove, at 9:06 am the process was repeated, to facilitate data analysisif the first change had errors and improve the quality <strong>of</strong> information.2.1. Procedure <strong>of</strong> the data analysis.For data analysis, dedicated routines have been developed in Matlab for an accuratecharacterization <strong>of</strong> the time response <strong>of</strong> the sensors, based on the equation that representsthe behavior <strong>of</strong> a first order system (Pallas, 1998), that is to say there is an element thatabsorbs and relishes energy: the sensor house. Therefore, the relationship between the inputx (t) and the output y (t) is made by a differential equation type (Eq. 1)The corresponding transfer function is shown in Equation 2.Where k=1/a 0 is called static sensitivity, and τ = a 1 /a 0 is known as the system time constant.The natural frequency ωc is given by 1/τ. The system is characterized therefore by twoparameters k for the static response and ωc or for the dynamic response.The response <strong>of</strong> a first order system when using a step-shaped temperature decrease als<strong>of</strong>ollows an exponential downward trend (Equation 3).While the upward trajectory under step-shape excitation is expressed by Equation 4.Considering that in our test we shift from a base temperature (5ºC) to an upper bound limit(35 ºC) and back to the initial temperature (5 ºC), previous mathematical expressions areadapted to Equations 5 and 6.Being: "a" the temperature step (30 ºC temperature shift), "x" the time interval, "b" standingfor " " which is the sensor response time (s), and "c" being the initial annealing temperaturefor the upward trajectory and the final stabilization in the downward trend.3. ResultsA comparison is made on the average reaction rate <strong>of</strong> the sensors (Turbo Tag or Sensirion)when shifting between 5 and 35 °C, with the result <strong>of</strong> a faster response corresponding toT700 (without coating) which surpasses 0.18 ºC/s, followed by the aerial-mounted Nlazamodule, and the T702 card without coating, this fact highlights the influence <strong>of</strong> coating andsensor montage on the motherboards with regard to the reaction rates. Besides,encapsulated RFID tags show to be faster than the Crossbow module, while the lowestspeed (0.04 °C/s) corresponds to surface –mounted Nlaza module, where the sensor issoldered onto the motherboard. Reaction times are plotted in figure 3, while first orderresponse parameters are provided in Table 1.
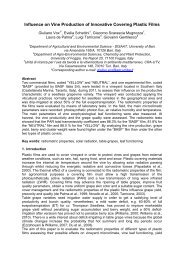
ºC35353030252520201510T700 with coatingT702 without coatingNlaza cableNlaza motherboardT702 with coatingT700 without coating55Crossbow00 20 40 60 80 100 1200 20 40 60 80 100 120 0Time (s)1510FIGURE 3: Fitted shapes <strong>of</strong> the sensor´s response timesFigure 3 shows the fits <strong>of</strong> the temperature rise and fall by the change from the fridge to thestove and vice versa. The most important thing <strong>of</strong> this graphic is to look at the differentslopes. It shows a lower rate reaction tags without coating and Nlaza modified module, withbiggest slopes. After that goes the T700 tag and T702 with coating, the Crossbow modulelater and finally the Nlaza module with the s<strong>of</strong>ter slope. In the downward shapes can be seenthat the tags without coating together with the modified Nlaza have again the shorterresponse, but now the bigger response belongs to the Crossbow module.The script created in Matlab gives the response times and the fits with r 2 that is showed in thetable below. At the same time is obtained also with this script, the graphic (Fig3).TABLE 1: Response times and r 2Upward shapeDownward shapeDevice Status (s) r 2 (s) r 2T700 With coating 107.2±0.3 0.99 115.0±0.3 0.99Without 20.9±0.3 0.99 45.8±0.6 0.98coatingT702 B With coating 131.2±0.3 0.99 156.8±0.3 0.99Without 53.8±0.6 0.98 57.6±0.9 0.97coatingNlaza Motherboard 126.4±0.3 0.99 184.0±0.3 0.99air 42.8±0.3 0.99 58.4±0.3 0.99Crossbow IrisMTS 400Motherboard 144.4±1.2 0.96 254.0±0.6 0.98Table 1, shows the settings <strong>of</strong> the measured temperatures, the validity <strong>of</strong> the adjustments iscorroborated by the values <strong>of</strong> r 2 , all very close to unit. On the other hand, the obtainedshow that response times are lower in the unencapsulated T700 tag than the encapsulated,with a rise <strong>of</strong> temperatures in 20.9 seconds ( = 20.9 seconds and r 2 =0.99), while theencapsulated version provides =107.2 seconds and r 2 = 0.99. Followed by the module withaerial-mounted Nlaza with =42.8 seconds (r 2 = 0.99), and followed by the T702 (53.8 s timeresponse).These response time (required to reach 63% <strong>of</strong> static response) contrasting with the highestwhich corresponds to the Crossbow module with = 144.4 seconds (r 2 = 0.96), followed bythe surface-mounted Nlaza module ( =126.4 seconds r 2 = 0.99).In the downward trend, the T700 tag shows a response time <strong>of</strong> 45.8 seconds, followed by theT702 with 57.6 seconds and the aerial-mounted Nlaza module in the third position (58.4
seconds). The largest response time corresponds to the Crossbow module (254 seconds),while the Nlaza module that has Sensirion welded to the motherboard reports a responsetime <strong>of</strong> 184 seconds.4. ConclusionsThe dynamic response <strong>of</strong> temperature sensors within wireless and RFID nodes isdramatically influenced by the way they are housed (to protect them from the environment)as well as by the heat released by the node electronics itself; its characterization is basic toallow monitoring <strong>of</strong> high rate temperature changes and to certify the cold chain.In this study the fastest response time stays around 20s which indicates that temperaturecycles <strong>of</strong> higher frequency cannot be addressed with available wireless technologies. On theother end, the slowest response (144 s) corresponds to surface-mounted sensors whichrefers the need <strong>of</strong> a dedicated design.AcknowledgementsThe funding <strong>of</strong> this work has been covered by the MICINN with the project "Sensóricainteligente para el Control de la Calidad en línea de procesos alimentarios Smart-QC"(ALG2008-05267-C03-03), by MITYC, plan Avanza with the project “Plataforma de ControlLogístico Avanzado para el seguimiento de la cadena de frío de productos Sanitarios yAgroalimentarios CLARISA” (TSI-020100-2009-851),And by the European Commission with the project InsideFood “Integrated, sensing andimaging devices for designing, monitoring and controlling microstructure <strong>of</strong> foods” (FP7-KBBE-2B-226783)ReferencesJederman, R., Becker, M., Görg, C., Lang, W., 2011. Testing network protocols and signalattenuation in packed food transports. <strong>International</strong> Journal <strong>of</strong> Sensor Networks. Volume 9,Number 3-4/2011.170-181.Ning Wang, Naiqian Zhang, Maohua wang., 2006. Wireless sensors in agriculture and foodindustry-Recent development and future perspective. Computers and electronics inAgriculture50(2006)1-14Pallás Areny, R. (1998). Sistemas de primer orden Sensores y acondicionadores de señal3ªed S. A. MACOMBO.Pang, Z., Chen, Q., & Zheng, L. (2012). Scenario-based design <strong>of</strong> wireless sensor system forfood chain visibility and safety. In Y. Wu (Ed.), Advances in computer, communication,control and automation (pp. 541-548) Springer Berlin Heidelberg.Ruiz-Garcia, L., Lunadei, L., 2011. The role <strong>of</strong> RFID in agriculture: Applications, limitationsand challenges. Computers and electronics in agriculture 79(2011)42-50Ruiz-Garcia, L., Lunadei, L. Barreiro, P. Robla, J.I. 2009. A Review <strong>of</strong> Wireless Sensorstechnologies and Applications in agriculture and food industry: State <strong>of</strong> the art and ActualTrends. Sensors ISSN 1424-8220. Sensors, 2009, 9 (6), pp. 4728-4750.W.S. Lee, V. Alchanatis, C. Yang, M. Hirafuji, D. Moshou, C. Li., 2010. Review. Sensingtechnologies for precision specialty crop production. Computers and Electronics inAgriculture 74 (2010) 2-33.
Climatic Changes and Evaluation <strong>of</strong> Their Effects on Agriculture inAsian Monsoon RegionMasaru Mizoguchi 1 *1 University <strong>of</strong> Tokyo, 1-1-1 Yayoi Bunkyo-ku, Tokyo, JAPAN*Corresponding author. E-mail: amizo@mail.ecc.u-tokyo.ac.jpAbstratWe began a new research project entitled “Climatic changes and evaluation <strong>of</strong> their effectson agriculture in Asian monsoon region (CAAM)” under the research framework <strong>of</strong> the GreenNetwork <strong>of</strong> Excellence (GRENE) for the Japanese fiscal years from 2011 to 2015 supportedby the Japanese Ministry <strong>of</strong> Education, Culture, Sports, Science and Technology (MEXT).This project aims to improve the reliability <strong>of</strong> future climate prediction and to develop theinformation platform which will be useful to design adaptation and mitigation strategies inagriculture against the predicted climatic changes in Asian monsoon regions. In thispresentation, I will explain the outline <strong>of</strong> the project.Key words: Climatic changes, adaptation measures, Asian monsoon, environmentalinformation, GRENE1. Introduction-What is GRENE?Based on the new growth strategy which was approved by the Cabinet <strong>of</strong> Japan in June2010, Green Network <strong>of</strong> Excellence program (GRENE) has started under the Ministry <strong>of</strong>Education, Culture, Sports, Science and Technology (MEXT) from FY 2011. The objectives<strong>of</strong> this program are that the domestic leading universities work together strategically andpromote a comprehensive human resource development and research <strong>of</strong> the highest level inthe world while sharing research resources and research goals. In the field <strong>of</strong> environmentalinformation, it is required that universities and research institutions, which are working onissues such as adaptation to climate change, cooperate to promote the utilization <strong>of</strong>environmental information and to develop human resources while using DIAS (DataIntegration and Analysis System) which has been built by MEXT.2. Background <strong>of</strong> researchIt is important to predict climate change correctly in regional scale and to build adaptationmeasures and mitigation measures in the Asian monsoon region where more than 60 % <strong>of</strong>the world's population are living. The reliability <strong>of</strong> climate change prediction model isevaluated by the reproducibility <strong>of</strong> past climate in general. However, because there are manydeveloping countries in the Asian monsoon region, adequate documentations <strong>of</strong> past climatewhich are needed to evaluate the climate reproducibility have not been prepared. In addition,at present it is difficult to get information on wide-area agricultural meteorological data whichaffect the growth <strong>of</strong> agricultural crops when considering the impact on agriculture <strong>of</strong> climate.This study has been proposed to increase the confidence in future climate prediction <strong>of</strong> Asianmonsoon and to build an information infrastructure in order to develop mitigation measuresand adaptation <strong>of</strong> agriculture to expected climate change.In this project, we will promote joint research actively with local Agriculture Organizationalong with domestic and international graduate students from target countries. In addition, wewill develop human resources who can judge precisely the actual situation and futureprediction <strong>of</strong> climate change and can formulate mitigation measures and adaptation toclimate change having a deep knowledge about the agricultural impact <strong>of</strong> climate change.
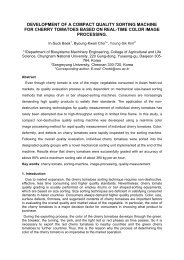
And finally, we will strengthen the network <strong>of</strong> people who can share and use the informationinfrastructure that we prepare.3. Configuration and goal <strong>of</strong> the studyIn this project, five research institutions which are responsible for climate change andagricultural impact researches, work closely for four sub-themes. (Figure 1)Climatic changes and evaluation <strong>of</strong> their effects on agriculture in Asian monsoon region (CAAM)Leader: Masaru Mizoguchi (The University <strong>of</strong> Tokyo)Aims1. To improve the reliability <strong>of</strong> future climate prediction , 2. To develop the information platformwhich will be useful to design adaptation and mitigation strategies in agriculture against the predicted climaticchanges in Asian monsoon regionClimate change researchDevelopment <strong>of</strong> Agro‐climatological Data‐base in the DevelopingCountries<strong>Agricultural</strong> effect researchClimatic Changes and Evaluation <strong>of</strong> Their Effects onAgriculture Based on a Field SurveyDigitization <strong>of</strong> old observationaldata recorded in paper formatAgro‐meteorological data baseNear real‐time meteorological dataacquisition systemEstimation <strong>of</strong>the element <strong>of</strong><strong>Agricultural</strong> Meteorologyheat balance modelAssessment System Using MeteorologicalData and Crop Models/Construction <strong>of</strong> the systemfor crop simulation undervarious conditions/Evaluation <strong>of</strong> the impact <strong>of</strong> climatechange on crop productionValidation <strong>of</strong> evaluationsystem by field survey/Survey <strong>of</strong> cropping/Comparison <strong>of</strong> simulationand real planting/Cultivation based on thesimulation testImpact <strong>of</strong> Land‐Use/Land‐Cover (LULC) Changes on the AsianMonsoon Climate ‐ Land‐Atmosphere Interaction Study ‐/Use <strong>of</strong> climate‐model output on the DIAS and adetailed land surface data/Elucidation <strong>of</strong> the importance <strong>of</strong> landsurface atmosphere interaction Including theimpact <strong>of</strong> anthropogenic Asian monsoon regionDIASDevelopment <strong>of</strong> Information Platform to Design Adaptationand Mitigation Strategies <strong>of</strong> Major Cropsagainst the Predicted Climatic Changes/Collection and maintenance <strong>of</strong> informationrelated to land use and land management, soiland <strong>Agricultural</strong> Meteorology/Collection <strong>of</strong> basic data on greenhouse gasbalance in agricultural landBenefits1. Development <strong>of</strong> basic environmental information and its application to decision‐making in the Asian monsoon region2. Training <strong>of</strong> young researchers to lead the study <strong>of</strong> global warming mitigation measures and adaptation research and climate change3. Construction <strong>of</strong> information infrastructure for the realization <strong>of</strong> global warming adaptation and mitigation measures for agricultural sectorsFIGURE 1: An overview <strong>of</strong> this subject (2011-2015)3.1. Development <strong>of</strong> Agro-climatological Data-base in the Developing Countries (JAMSTEC)In developing countries <strong>of</strong> the Asian monsoon region, the publication <strong>of</strong> meteorological datais not sufficient. In addition, it is difficult to use wide-area data with the exception <strong>of</strong> somelow-precision global data because the data is managed separately in each country. Inparticular, high time resolution data acquisition is insufficient for the validation <strong>of</strong> the modelsuch as the use <strong>of</strong> agriculture and climate. In this sub-theme, we will collect high timeresolution meteorological data and make a database in mainly Vietnam and the Philippines.In addition, we will make a database <strong>of</strong> the paper-based data which were observed from thenortheastern part <strong>of</strong> China to Southeast Asian countries in the Asian monsoon region.Elements <strong>of</strong> agricultural meteorology (solar radiation, soil moisture, soil temperature, the netevaporation, and the wet climate degree, etc.) are difficult to measure directly in normalweather observation. We will estimate these elements with high accuracy by applying thesurface heat balance model using existing meteorological and climate data. As a standarddata set, we will develop the data <strong>of</strong> 30 years from 1979 to 2008 in which year satelliteobservation was sufficient. In addition, we will create a reliable data set as far as possible inthe country having the long term meteorological data. We will use these data to validate the
climate model output (CMIP5 or CMIP3) and to create a scenario by the down-scale agroclimaticstatistical data.3.2. Impact <strong>of</strong> Land-Use/Land-Cover (LULC) Changes on the Asian Monsoon Climate(Tokyo Metropolitan University)In the Asian monsoon region, there is the Asia-specific surface state such as paddy. Theland surface state is affected by climate change and controlled artificially at the same time. Inthe monsoon climate system formed by the thermal contrast <strong>of</strong> land and sea, the impact <strong>of</strong>land surface state appears larger. By comparing the output <strong>of</strong> multiple climate models thatare generated on the DIAS and using the data <strong>of</strong> more ground surface that are created in thisproject including agricultural information, we will make clear the importance <strong>of</strong> land surfaceatmosphere interaction Including the effects <strong>of</strong> anthropogenic Asian monsoon In addition, forstudents <strong>of</strong> Asia, Myanmar, Vietnam and Bangladesh, we will provide education for appliedresearch using the next generation <strong>of</strong> climate change research and climate information.3.3. Climatic Changes and Evaluation <strong>of</strong> Their Effects on Agriculture Based on a FieldSurvey (Agriculture and Food Research Institute <strong>of</strong> Advanced Industrial Science andTechnology / University <strong>of</strong> Tokyo)As a target crops (rice, cassava, etc.) which farmers grow actually in Thailand or Indonesia,we will build a simulation system that can grow in various conditions different Cultivar,weather, cultivation management. This system will have the flexibility that can replace thecrops and crop model depending on the type and observation interval <strong>of</strong> observation dataavailable. By giving the effects <strong>of</strong> climate change in this system, we will assess the impact <strong>of</strong>climate change to target crops. The researchers and agricultural extension will be able tobrowse the simulation results from anywhere using the Web application.3.4. Development <strong>of</strong> Information Platform to Design Adaptation and Mitigation Strategies <strong>of</strong>Major Crops against the Predicted Climatic Changes (National Institute for Agro-Environmental Sciences)In the Asian monsoon region, rice is a main crop because available water is enough. Thisregion is also a zone <strong>of</strong> greenhouse gases such as methane in the agricultural sector. Inorder to ease the progress <strong>of</strong> global warming, we need to reduce the amount <strong>of</strong> greenhousegas emissions. The occurrence <strong>of</strong> high temperature damage to the major crops such as riceis also concerned by the progress <strong>of</strong> global warming. In order to construct future sustainablefood production systems in the Asian monsoon region, it is necessary to consider the trade<strong>of</strong>finitiatives <strong>of</strong> mitigation and adaptation technology to global warming. In this sub-theme,we will implement the development <strong>of</strong> information infrastructure and integration related toagriculture meteorology, soil, land use, land management which are necessary to formulatemitigation measures and adaptation to global warming <strong>of</strong> major food crops to climate change.With respect to agriculture meteorological data, soil temperature and soil moisture areimportant in order to understand climate scenarios and potential reduction <strong>of</strong> greenhousegases from crop production and agricultural land. We will verify the accuracy <strong>of</strong> soiltemperature and soil moisture estimated in the model by comparing the observed data.4. Effect expected in this projectIf we prepare the information infrastructure <strong>of</strong> agricultural meteorological data, we will be ableto provide the basic environmental information available to the various decision-making.When a detailed prediction <strong>of</strong> the effects to crops based on reliable future climate changeprediction is presented, technicians and administrative personnel in each country will be ableto get the information infrastructure which is necessary for mitigation measures and theformulation <strong>of</strong> adaptation to climate change. In addition, our project can be expected to trainyoung researchers who will lead the study <strong>of</strong> global warming mitigation measures andadaptation research and climate change in developing countries in the Asian monsoonregion.
5. Kick-<strong>of</strong>f meeting <strong>of</strong> researchersIn order to promote this project, a kick<strong>of</strong>f meeting “The First <strong>International</strong> Workshop <strong>of</strong>Climatic Changes and Their Effects on Agriculture in Asian Monsoon Region “ was held inBangkok, Thailand on March 3-5, 2012. Researchers in the Asian monsoon countriesdiscussed the research status and future cooperation. After the workshop, participants visitedthe experimental field <strong>of</strong> the University <strong>of</strong> JGSEE / KMUTT and discussed new observationsrequired by the GRENE.FIGURE 2: Local tours in the <strong>International</strong> Workshop (Rachaburi, Thailand, March 05, 2012)AcknowledgementsI would like to express my sincere thanks to "Green Network <strong>of</strong> Excellence" supported by theMinistry <strong>of</strong> Education,Culture,Sports,Science & Technology in JapanReferences:Climatic Changes and Evaluation <strong>of</strong> Their Effects on Agriculture in Asian Monsoon Region,http://grene.agrid.org/htdocs/Green Network <strong>of</strong> Excellence - environmental information 2011, http://grene.jp/
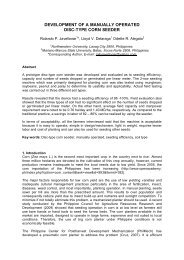
AbstractA Wireless Sensor Network for Precise Soil WaterManagement in an OrchardTakashi Togami 1 , Kyosuke Yamamoto 2 , Ryoei Ito 1 , Atsushi Hashimoto 1Takaharu Kameoka 1 *1 Mie Univeristy, 1577 Kurima-machiyacho, Tsu, Mie, 514-8507 Japan2 The Univeristy <strong>of</strong> Tokyo, 1-1-1 Yayoi, Bunkyo, Tokyo, 113-8657 Japan*Corresponding author. E-mail: kameoka@mie-u.ac.jpThe importance in field sensing and plant sensing including data measurement and collection<strong>of</strong> agrometeorological and micrometeorological data <strong>of</strong> the target field and plant informationhas been dramatically increasing in order to cultivate crops with required quality by optimalcultivation management or smart farming such as irrigation control. Field Server and weatherstation <strong>of</strong> eKo collect field representative value such as ambient temperature, humidity,amount <strong>of</strong> sunlight and precipitation, while sensors attached to each sensor node acquire theproperty value including soil information. It was decided to set up sensor nodes at threecritical points where it becomes irrigation index for the cultivation management, and thepoints were selected according to the soil moisture distribution map based on the researchon Time Domain Reflectrometry (TDR) soil moisture measurements <strong>of</strong> orchards. Toaccomplish our goals, we installed a wireless sensor network to support long-term, stableoperation, including optimal placement <strong>of</strong> sensor nodes, optimal installation <strong>of</strong> the sensorsand modification <strong>of</strong> network connections with Internet, and developed user-friendly FieldServer and eKo data browsing s<strong>of</strong>tware to support agricultural workers.Key words: A wireless sensor network, Smart farming, Field sensing, Plant sensing, FieldServer1. IntroductionSatsuma Mandarin cultivated in Nanki, Mie, Japan is one <strong>of</strong> the most excellent rareripes.However, lack <strong>of</strong> agricultural continuators makes the translation <strong>of</strong> special agricultural skillsmuch harder. Furthermore both external and internal qualities <strong>of</strong> fruits in pomiculture havebeen required in Japanese market since the adoption <strong>of</strong> marketing strategy such as fruitsorting by optical sensors, and a segregation strategy. Hence, the importance in field sensingincluding data measurement and collection <strong>of</strong> agrometeorological and micrometeorologicaldata <strong>of</strong> the target field and plant information has been dramatically increasing in order tocultivate crops with required quality by optimal cultivation management or smart farming suchas irrigation control (Togami et al., 2010a).We introduced an agricultural small stationary robot, Field Server (Fukatsu et al., 2005),which measures environmental and growing conditions in real time in the orchard, and Mulchand Driptube system, which produce high quality fruit with being unaffected by weather, as isshown in Fig. 1 (Fujita et al., 2011; Togami et al., 2011a).The aims <strong>of</strong> this study are to install a wireless sensor network to support long-term, stableoperation, including optimal placement <strong>of</strong> sensor nodes, optimal installation <strong>of</strong> the soilmoisture sensors and modification <strong>of</strong> network connections with Internet, and to develop userfriendlyField Server and eKo data browsing s<strong>of</strong>tware to support agricultural workers.2. Experimental Setup and Method2.1. Soil Moisture Content Distribution
FIGURE 1: Field Server and Mulch and Driptube system in the orchardWe found it very important to establish the cultivation diagnosis for the Mandarin productionby using the hardness <strong>of</strong> fruit, water stress measured, evapotranspiration, and soil moisturestress as well as meteorological measurements in the citrus groves to obtain a water stressindex <strong>of</strong> Satsuma Mandarin.Soil moisture influences greatly on sugar concentration in Satsuma mandarin fruits. For thisreason, irrigation management is essential to high quality mandarin orange production. Infact, mulch and drip irrigation method has been carried out at the target area. However, soilmoisture conditions vary even within the same field. Hence, it is significant to measure soilmoisture at various points within the target field. Thus, Time Domain Reflectometry (TDR)method was used to measure the soil moisture content and water stress <strong>of</strong> orange tree.FIGURE 2: Installation <strong>of</strong> soil moisture sensors
2.2. Construction <strong>of</strong> Sensor NetworkField Server and weather station <strong>of</strong> eKo (Crossbow Technology Inc., ES2000 WeatherStation Suite) collect field representative value such as ambient temperature, humidity,amount <strong>of</strong> sunlight and precipitation, while sensors attached to each sensor node acquire theproperty value including soil information. In order to utilize the convenient soil moisturesensor Watermark <strong>of</strong> eKo, we compared it with TDR and showed how to install the sensor atthe orchard in Fig. 2 (Irmak et al., 2006).We showed the demonstration experiment for achieving the agro-environmental monitoringconsidering plant physiology and farmer’s stance by utilizing Field Server and wirelesssensor network eKo developed for agricultural use. In concrete terms, we implemented theconstruction <strong>of</strong> sensor network for long-term and stable operation including the optimumplacement <strong>of</strong> sensor nodes, the optimum installation <strong>of</strong> sensors and the modification <strong>of</strong> thegateway.2.3. Development <strong>of</strong> Web ApplicationThe development <strong>of</strong> s<strong>of</strong>tware is very important for supporting farmers to make decision incultivation management. Nowadays, most <strong>of</strong> the devices come with unique s<strong>of</strong>tware.However, there are critical issues in the s<strong>of</strong>tware such as the limitation <strong>of</strong> function for dataanalysis, less utility, installation in each computer and installation time. These issues arise asa consequence <strong>of</strong> the device oriented architecture. However, demands should be consideredfirst to solve the issues. Therefore, new s<strong>of</strong>tware design concept, which is user-oriented andcomprehensive, and the development <strong>of</strong> s<strong>of</strong>tware as a web application that providesguideline and information visually are absolutely imperative. Fig. 3 shows the outline <strong>of</strong> thedata Integration on the web page.FIGURE 3: Data integration on the web pageFarming supervisors and experienced farmers <strong>of</strong>ten apply the data provided by weatherradars and the Automated Meteorological Data Acquisition System (AMeDAS) for cultivation.However, AMeDAS does not cover all local areas, and even if it covers the area, availabledata for cultivation is limited. Therefore, the web page development using the data acquiredby Field Server and weather station <strong>of</strong> eKo that enables users to browse and download datawas carried out based on weather observation statistics <strong>of</strong> Japan Meteorological Agency.
Additionally, modification <strong>of</strong> the s<strong>of</strong>tware for Field Server data that indicates latest sensorvalue and image and past data stored in the database was implemented. Furthermore, thedata acquired by each sensor node was organized to satisfy various requirements and webpages that provide graphic representations and display the latest sensor value weredeveloped. In detail, the data collected by weather station was packed as agrometeorologicaldata, and data measured by each soil moisture sensor and precipitation obtained by weatherstation were packed for the purpose <strong>of</strong> supporting irrigation management.3. Results and Discussion3.1. Sensor Nodes Allocation and Data Acquisition ProgramIt was decided to set up sensor nodes at three critical points where it becomes an irrigationindex for cultivation management, and the points were selected according to the soilmoisture distribution map based on the research on TDR soil moisture measurements <strong>of</strong>orchards shown in Fig.4(a) (Fujita et al., 2011). Fig. 4(b) shows the installation <strong>of</strong> sensornodes at mandarin orange farm at Kanayama Pilot in Kumano city, Mie-pref. Japan (N:33°51’ 47.97’’, E: 136°03’ 23.29’’) (Togami et al., 2011a). Considering the sufficient capability<strong>of</strong> communication range, the base radio and sensor nodes were placed about 3 m aboveground which is higher than mandarin orange trees. Four nodes were placed at the points asis described shown in Fig. 4(b). We implemented the construction <strong>of</strong> sensor network for longtermand stable operation including the optimum placement <strong>of</strong> sensor nodes, the optimuminstallation <strong>of</strong> sensors and the modification <strong>of</strong> the gateway. In the experiment, it was shownthat four sensor nodes were able to cover the area <strong>of</strong> about 1 ha with stable communications.(a) Soil Moisture Distribution Map(b) Allocation <strong>of</strong> Field Server andSensor NetworkFIGURE 4: Mandarin orange farm at Kanayama Pilot (N: 33°51’ 47.97’’, E: 136°03’ 23.29’’)The developed program <strong>of</strong> eKo data acquisition enabled to minimize data loss, which is,even if the master server breaks down, the data stored in the slave server remains. Moreover,internet security problem was alleviated because <strong>of</strong> the application <strong>of</strong> the Linux box andgeneral operating system. Furthermore, accessibility to the data and data-handling wereimproved due to the construction <strong>of</strong> the database server. In addition, the construction <strong>of</strong> the
database and the modification <strong>of</strong> eKo data acquisition system enabled to store and managedata collected from both Field Server and eKo in the same database. This progress mademanagement and utilization <strong>of</strong> data easier, and enabled to merge data collected fromdifferent devices on the web.3.3. Web ApplicationData acquired by Field Server were used in the web application. This s<strong>of</strong>tware wasdeveloped as a web application and consists <strong>of</strong> four pages. One is the current data reference.It displays the latest numerical data and the latest image. Second one is the reference <strong>of</strong>data archive. It enables to put images on a calendar by selecting year, month and time. Inaddition, temperature and relative humidity acquired by Field Server are displayed accordingto the selected time, and an image slideshow displays the one-day change. On this page,moreover, users can browse a graph <strong>of</strong> sensed data (Togami et al., 2010b).Web pages for eKo data enable us to check the operation <strong>of</strong> sensors. One example <strong>of</strong> webpage displaying the data graphically was shown in Fig. 5. Soil moisture values measured ateach sensor node location were coupled with precipitation obtained by weather station anddisplayed in graph form in neat chronological order in terms <strong>of</strong> supporting proper irrigationmanagement. Additionally, ambient temperature, humidity, amount <strong>of</strong> sunlight andprecipitation were packed as field representative data and displayed graphically. Thesegraphs also enable to display data by the period described for Field Server s<strong>of</strong>tware anddisplayed data can be downloaded in CSV format.FIGURE 5: Graphical representation <strong>of</strong> soil moisture and precipitationThe web application was developed to display numerical data <strong>of</strong> seasonal period <strong>of</strong> timecollected by both Field Server and the weather station. This web application was createdbased on the weather observation statistics mentioned in earlier section. Therefore, thisapplication was designed to provide past data by hourly, daily, monthly, seasonally andyearly, and AMeDAS based local data becomes available for users (Togami et al, 2011a).4. ConclusionThe system was constructed in consideration <strong>of</strong> precise soil water management in theorchard. Therefore, installation positions <strong>of</strong> sensor nodes, application <strong>of</strong> sensors and data
utilization were examined based on the soil moisture distribution map. We attempted theapplication <strong>of</strong> sensors from the plant physiological and farmer’s perspective. Both attemptsdescribed in this paper showed that more <strong>of</strong> the studies on collecting high precision data, therelation between the data and plant or fruits are much more required. In addition to thecollection <strong>of</strong> accurate data, it was revealed that the suitable usage <strong>of</strong> sensors in Japaneseagricultural fields, especially soil moisture sensors should be established.We developed web application s<strong>of</strong>tware providing data to users. The application wasdesigned to enable users for monitoring field, referring past data in both numerical andgraphic representations, and download data. Additionally, AMeDAS based data representingwebpage was developed for satisfying one <strong>of</strong> the farmer’s needs. By this attempt, we couldpresent one <strong>of</strong> the examples showing merging and utilizing data collected by differentdevices on the web. However, it was clarified that more <strong>of</strong> the studies on data utilizationbased on plant physiology are necessary for cultivation support and high quality mandarinproduction. Additionally, transforming from implicit knowledge into formal knowledge is alsonecessary. Then, web application should be developed with the composition <strong>of</strong> visual andcomprehensive information from the database and the mathematical models, and it shouldprovide users information for intuitive operation. Furthermore, sensor network and webapplication could also be applicable for smart viticulture management (Togami et al., 2011b).AcknowledgementsThis work was supported by KAKENHI (Grant-in-Aid for Scientific Research (B) 21380161).We also acknowledge financial support from MAFF for the execution <strong>of</strong> these studies.Reference listFujita, A., Nakamura, M., & Kameoka, T. (2011). Soil Moisture Measurementto SupportProduction <strong>of</strong> High-Quality Oranges for Information and Communication Technology (ICT)Application in Production Orchards(in Japanese), <strong>Agricultural</strong> Information Research (Japan),20(3), 86-94.Fukatsu, T., & Hirafuji, M. (2005). Field Monitoring Using Sensor-Nodes with a Web Server,Journal <strong>of</strong> Robotics and Mechatronics,17, 164-172.Irmak, S., J. O. Payero, D. E. Eisenhauer, W. L. Kranz, D. L. Martin, G. L. Zoubek, Rees, J.M., VanDeWalle, B., Christiansen, A. P., & Leininger, D. (2006). Watermark granular matrixsensor to measure soil matric potential for irrigation management, University <strong>of</strong> NebraskaEXTENSION, EC783:1-8.Togami, T., Motonaga, Y., Ito, R., Hashimoto, A., Kameoka, T., & Nakamoto, T. (2010a). Aweb strategy for cultural inheritance centered on agriculture case study approach: The OliveProject in Shodoshima Japan. In Ishida, T. (Ed.) Culture and Computing (pp. 200-213).Berlin: Springer.Togami, T., Sakakibara, Y., Yamamoto, K., Kimura, Y., Ito, R., Hashimoto, A., & Kameoka, T.(2010b). Visual guideware as an information tool in the farm, Proceedings <strong>of</strong> SICE Annual<strong>Conference</strong> 2010, 2910-2914.Togami, T., Ito, R., Hashimoto, A., & Kameoka, T. (2011a). Agro-Environmental MonitoringUsing A Wireless Sensor Network to Support Production <strong>of</strong> High Quality Mandarin Oranges(in Japanese), <strong>Agricultural</strong> Information Research (Japan), 20(3), 110-121.Togami, T., Yamamoto, K., Hashimoto, A., Watanabe, N., Takata, K., Nagai, H., & Kameoka,T. (2011b). A Wireless Sensor Network in A Vineyard for Smart Viticultural Management,Proceedings <strong>of</strong> SICE Annual <strong>Conference</strong> 2011, 2450-2454.
Effectiveness and Potential <strong>of</strong> a Web-based Sensor NetworkSystem for <strong>Agricultural</strong> Applications Using Image DataTokihiro Fukatsu 1 *, Masayuki Hirafuji 1 , Takuji Kiura 11 National Agriculture and Food Research Organization,3-1-1 Kannondai, Tsukuba, Ibaraki, 305-8666 Japan*Corresponding author. E-mail: fukatsu@affrc.go.jpAbstractImage data provide useful and helpful information for agricultural use, but it is difficult tocollect image data stably at field sites and to perform image analyses with the collectedimage data. To address these difficulties, we propose a practical image monitoring systemfor agricultural use with a Web-based sensor network system. The monitoring system withInternet cameras can be easily constructed by using Field Servers. For the image monitoring,we also devised a simple image analysis method that uses a combination <strong>of</strong> cropping,subtracting, and binarizing functions on the proposed system. We conducted severalexperiments to evaluate the monitoring system and the image analysis method in agriculturalapplications. The results demonstrated that practical and effective image monitoring can berealized with the proposed system.Key words: sensor network, Field Server, image analysis, Internet camera, field monitoring1. IntroductionMonitoring crop growth, field environments and farm operations is important in efforts toimprove crop yields and quality. The recent development <strong>of</strong> sensor network systems (Akyildizet al., 2002) has made it possible to conduct monitoring in open fields, but typical sensornetworks don’t have camera devices, because the systems are designed to reduce datatransmission to save power. Image data is one <strong>of</strong> the key technologies for gathering usefulinformation for agricultural use. Many image-data methods for agriculture have beenproposed, such as for checking crop conditions, estimating the influence <strong>of</strong> diseases,detecting vermin and recording farm operations (Bauchi & Rath, 2005; Boissard et al., 2008;Choi et al., 1995; Iwaya & Yamamoto, 2005; Tillett, 1991), but these methods are still at thelaboratory stage. A fundamental problem is the difficulty <strong>of</strong> collecting stable target image dataat field sites under harsh and varying conditions, as the image data collection in a fieldenvironment is affected by many types <strong>of</strong> disturbances (e.g., wind, rain, shadows, etc.). Thismakes it difficult to perform complicated image analyses without limiting the conditions orusing special individual settings.To address these problems, we propose a web-based sensor network system for imagemonitoring with Field Servers developed in our previous studies (Fukatsu & Hirafuji, 2005).Field Servers, one <strong>of</strong> the web-based sensor nodes, have a wireless LAN (local area network)to provide high-speed transmission and long-distance communication, a web-basedmonitoring unit with various meteorological sensors to perform easy management at aremote site via the Internet, and Internet cameras to collect high-resolution image data. Withthis system, we can easily realize stable image monitoring. The Field Servers are controlledby an autonomous management program called an “Agent System” that enables flexible dataanalysis with distributed web-processing modules according to users’ requirements (Fukatsuet al., 2006). Therefore, we can easily construct different types <strong>of</strong> image analyses andidentify a suitable method for the raw image data collected by the system. Here we providean introduction to the monitoring system and its use in several agricultural applications with asimple and practical analysis, and we describe its effectiveness, limitations, and potential.
2. Image Monitoring2.1. CameraWith the continuing advances in information technology, many types <strong>of</strong> high-performancecameras are now available at reasonable prices. Image monitoring for agriculturalapplications has included the occasional use <strong>of</strong> smart-phones and digital cameras to recorduseful information when agricultural staff encounters something <strong>of</strong> note in the field. Inaddition, digital cameras, USB cameras and Internet cameras are used to detect a certainchange or monitor the amount <strong>of</strong> crop growth for long periods at fixed point. The use <strong>of</strong>interval shooting and recording image data into a detachable memory card is a primitivetechnique to perform image monitoring, but someone must pick up data from the installedcamera, the camera might not record important information, and the camera cannot changeits target or adjust to environmental changes after deployment. Here we propose a systemthat does not have such limitations, as it performs real-time and interactive image monitoringwith cameras.Digital cameras provide high-quality and high-resolution image data. However, their powersupplies, shutter control and data uploading functions may not be adequate. Remote controls<strong>of</strong>tware such as “gPhoto2” improves shutter control and data uploading functions, but asmall computer for the s<strong>of</strong>tware must be added in a Field Server. Instead <strong>of</strong> the s<strong>of</strong>tware, awireless uploading card such as “Eye-Fi” can be easily used, because Field Servers provideWi-Fi hotspots at field sites. The advantage <strong>of</strong> using USB cameras is their small size andweight, which enable flexible deployment to collect target image data. This method alsoneeds a small computer installed with the device driver s<strong>of</strong>tware, and the cable lengthbetween the computer and the USB camera is limited to less than five meters. The use <strong>of</strong>network Internet cameras is the easiest way to realize the image monitoring, because theycan be controlled on a web-page via Field Servers. The only extra requirement is to connecta Power over Ethernet (PoE) cable to the nearest Field Server. Unfortunately, the resolution<strong>of</strong> the Internet cameras is inferior compared to that <strong>of</strong> the cameras mentioned above.2.2. SystemFigure 1 shows the architecture <strong>of</strong> the image monitoring system. Internet cameras arepractical for farmers in the field. There are two types <strong>of</strong> Internet cameras: with and withoutwireless function. The average power consumption <strong>of</strong> a wireless camera is about five Watts,and more than thirty-centimetres-square solar panels are needed for collecting one image’sdata (i.e., a few minutes’ running every hour), so we recommend the use <strong>of</strong> cameras that donot have a wireless function, unless a camera must be deployed without any cables. Forcameras that will be deployed at field sites, it is important that their casing protects them frominsects, birds, dust, rain, and so on. Sealed containers are good for the casing except whenthey present a heating problem, which can be solved by using Field Servers that can shutFIGURE 1: Architecture <strong>of</strong> the Web-based sensor network system
down the power supply <strong>of</strong> the camera with each cycle after its collection <strong>of</strong> image data.Internet cameras with pan-/tilt-/zoom (PTZ) function are effective for multi-point monitoringand long-term monitoring, because with them the attention point can be changed dependingon the growth stage <strong>of</strong> targets. Some low-cost cameras don’t have an auto-focus function,and their focus should be carefully set before they are deployed.At least one Field Server with a Wi-Fi/3G network card is usually deployed as a base unit(sink node) in a field site, and other Field Servers and cameras deployed at the same sitecan be accessed on the Internet via the base-unit Field Server. Image data and sensor dataare periodically collected by the Agent System at remote sites, and the interval time is setdepending on the network traffic, total power consumption, and countermeasures againstheat generation <strong>of</strong> the camera. In cases in which the image monitoring is being used todetect a specific change, a short interval time may be required so that the target detection isnot missed by the image collection, but a short interval time can result in a heavy load and alarge amount <strong>of</strong> extraneous image data. Some Internet cameras have motion detection andFTP functions. By modifying the Agent System to control the cameras and collect targetimage data in response to uploaded image data as a trigger, our proposed system can solvethe problem through the use <strong>of</strong> these functions on the cameras.2.3. TargetFor image monitoring in agricultural applications, image analyses are classified broadly intotwo types. One is for measuring the amount <strong>of</strong> a target change in image data by comparisonwith a specified standard such as scale, a color chart or a correction point. This type <strong>of</strong>image analysis is used mainly in applications such as vegetation cover rate calculations,maturity evaluations and growth diagnoses. In these scenarios, image data collection at longintervals (e.g., every hour or longer) is adequate, because the change in target plants isgenerally slow. However, image data collection at long intervals is easily influenced by thenoise <strong>of</strong> environmental changes, making it difficult to accurately analyze differences in theimage data.The other type <strong>of</strong> image analysis is for detecting a particular event based on a differencebetween real-time images and reference images. This type <strong>of</strong> image analysis is used mainlyin applications such as wild animal detection and farm operation recognition. In suchscenarios, the system must collect image data at a high frequency or in response to adetection signal <strong>of</strong> a certain sensor, so that it will not miss the targeted image data. Thesampling rate <strong>of</strong> collecting image data depends on how quickly the target appears anddisappears in a frame, and how precisely the system’s users want to extract usefulinformation from the image. For example, the detection <strong>of</strong> insects or diseases, which spreadslowly, does not need very frequent collection, in contrast to wild animal detection. Frequentimage data collection is not needed to judge whether a certain farm operation such asharvesting is complete, but it would be effective for gaining an understanding <strong>of</strong> how a farmerperforms his operation in detail.3. Application3.1. Image AnalysisMany types <strong>of</strong> image analysis have been developed for agricultural image monitoring, butsome complicated methods such as template matching, edge detection and optical flow arerelatively ineffective for collected image data at a field site because the quality <strong>of</strong> the imagedata is decreased by the effects <strong>of</strong> wind, rain and shadows that cause problems such asinterference <strong>of</strong> extraneous substances, image blurring, insufficient illumination, positionmisalignment, and so on. On the other hand, simple image analysis methods, such ascropping, subtracting and binarizing methods, are widely used for many applications as anaccessible analysis for users, and they are relatively effective for analyzing the collected
image data. By using these image analysis methods, we tried to realize a large part <strong>of</strong>alternative image analyses for measuring and detecting targets. For example, it is difficult fora basic image analysis to identify the type <strong>of</strong> insects on image data, but it is possible to judgewhether certain insects are on it or not. In the present study, we devised a simple and widelyavailable image analysis method that uses a combination <strong>of</strong> basic image analysis methods,and we evaluated the utility <strong>of</strong> the image analysis method in various practical applications(Fig. 2).FIGURE 2: Image analysis with three basic image processing and Agent SystemWe prepared three image analysis methods on the Internet, which perform cropping,subtracting, and binarizing processing to image data, as web application services for theproposed system. The cropping function cuts extraneous area from raw image dataaccording to a specified range assigned by a given mask image to lessen the effects <strong>of</strong>disturbance in large part. The subtracting function outputs the difference between two givenimage data by calculating the subtraction <strong>of</strong> each pixel to detect changes. It is mainly usedfor background- or time-differencing techniques. The binarizing function outputs binarizedimage data in which each pixel <strong>of</strong> a given image is converted to black or white based onspecified threshold values given by HSL, RGB, or grayscale. The total number <strong>of</strong> white pixels,whose value was in the range <strong>of</strong> the threshold value, is also calculated. The total number <strong>of</strong>white pixels is used mainly to measure the amount <strong>of</strong> plant growth and to evaluate changesfrom difference images.By accessing these web application image processing services on the Internet as needed,the Agent System can realize a requested image analysis. This distributed image processingapproach with Web application services enables flexible and on-demand image analyses. Inthis system, we only have to prepare a suitable Web application service, and various imageanalyses can be performed without changing or rebooting the system.3.2. ExperimentsTo evaluate our proposed system that can perform useful image monitoring with a basicimage analysis, we conducted several experiments with agricultural applications. First, weconstructed an application that calculates vegetation cover rate from collected image data(Fig. 3). After collecting image data, the Agent System accesses the cropping Webapplication service with the data and a mask image to pick up the target area. Then, theresult is sent to the binarizing Web application service with threshold values <strong>of</strong> HSLparameters. The vegetation cover rate is calculated based on the total number <strong>of</strong> white pixelsreceived from the service as the processing result. The requested application worked wellwith the proposed system, and the accuracy <strong>of</strong> the value depended on the quality <strong>of</strong>collected image data and the parameter tuning <strong>of</strong> the threshold values.
FIGURE 3: Vegetation cover rate applicationFIGURE 5: Insect counting applicationSecond, we constructed an application that detects farm operations (Fig. 4). In thisexperiment, we used the background difference technique with cropping, subtracting andbinarizing Web application services, in that order. When the total number <strong>of</strong> white pixelscalculated by the binarizing function was greater than a threshold value, the system judgedthat a certain farm operation was performed in the image data. However, the collected imagedata were affected by various disturbances, and sometimes certain farm operations were notdetected in the judged image data when checked manually. To find image data with a farmoperation from judged image data effectively, we also developed a browsing Web applicationthat can display filtered image data as a motion picture. With this application, we can filterimage data based on not only the total number <strong>of</strong> white pixels but also any values collectedas sensor data, such as rainfall. By using the filtering function, we can reduce the time spentchecking extraneous image data. For example, there were many misjudged image datawithout a farm operation in rainy conditions. If a user knew that farming operations werenever performed in rain conditions, the browsing Web application can be altered toadditionally filter judged image data in rain conditions.Third, we constructed an application that automatically counts target insects in pheromonetraps (Fig. 5). In general, insect-counting applications use 'pattern recognition' that identifiesthe shape <strong>of</strong> the target insect, but the collected image data at a field site makes it difficult toperform such a traditional image analysis. In contrast, our image monitoring can calculate thetotal number <strong>of</strong> white pixels after processing via the background difference technique withthe cropping, subtracting and binarizing Web application services. With the combination <strong>of</strong>FIGURE 4: Farm operation detecting application
the pheromone trap to attract target insects specifically and cropping a low-noise part <strong>of</strong> theimage area to allow easy analysis, we can estimate the number <strong>of</strong> target insects in imagedata on the proposed system. The number <strong>of</strong> target insects can be estimated with highaccuracy, and this simple image analysis worked well to reduce the labor needed forcounting and to easily handle a large mass <strong>of</strong> image data (Fukatsu et al., 2012).4. DiscussionWe have proposed a practical image data monitoring system for agricultural use with FieldServers, and we tested the monitoring system with several agricultural applications toevaluate the effectiveness and potential <strong>of</strong> the system. As a practical image analysis methodfor image data collected at a field site, we proposed a simple image analysis method thatuses a combination <strong>of</strong> basic image processing techniques (cropping, subtracting andbinarizing functions). Although it is generally difficult for simple image analyses to producedetailed and accurate results, our proposed image analysis method can provide usefulinformation, and it has the potential to be effective for various applications.In the application for detecting farm operation, we used our image analysis method to filterextraneous image data with the browsing Web application. It has been important but difficultto manually check collected image data for detecting targets, because most <strong>of</strong> the imagedata were extraneous. The filtering method is effective and practical for manual checking,and it reduces user effort. In the application for counting target insects, we estimated thenumber <strong>of</strong> targets by simply applying the results <strong>of</strong> the background-difference technique tothe part <strong>of</strong> the image data that excluded the area most susceptible to disturbance. Thecounting method is also flexible and applicable because it doesn’t require special individualsettings and parameters.In conclusion, we constructed a system that can be easily used by non-expert users. Themonitoring system facilitates the use <strong>of</strong> varied applications for many users, and the simpleimage analysis method facilitates the practical use <strong>of</strong> image monitoring for various targets.The more that image monitoring comes into wide use, the more that researchers will be ableto easily apply advanced image analyses for practical use, based on our system.Reference listAkyildiz, I.F., Su, W., Sankarasubramaniam, Y., & Cayirci, E. (2002). Wireless sensornetworks: a survey. Computer Networks, 38, 393-422.Bauchi, C., & Rath, T. (2005). Prototype <strong>of</strong> a vision based system for measurements <strong>of</strong> whitefly infestation. Acta Horticulturae (ISHS), 691, 773-780.Boissard, P., Martin, V., & Moisan, S. (2008). A cognitive vision approach to early pestdetection in greenhouse crops. Computers and Electronics in Agriculture, 62, 81-93.Choi, K., Lee, G., Han, Y.J., & Bun, J.M. (1995). Tomato Maturity Evaluation Using ColorImage Analysis. Transactions <strong>of</strong> the ASAE, 38, 171-176.Fukatsu, T., & Hirafuji, M. (2005). Field Monitoring Using Sensor-Nodes with a Web Server.Journal <strong>of</strong> Robotics and Mechatronics, 17, 164-172.Fukatsu, T., Watanabe, T., Hu, H., Yoichi, H., & Hirafuji, M. (2012) Field monitoring supportsystem for the occurrence <strong>of</strong> Leptocorisa chinensis Dallas (Hemiptera: Alydidae) usingsynthetic attractants, Field Servers, and image analysis. Computers and Electronics inAgriculture, 80, 8-16.Fukatsu, T., Hirafuji, M., & Kiura, T. (2006). An Agent System for Operating Web-basedSensor Nodes via the Internet. Journal <strong>of</strong> Robotics and Mechatronics, 18, 186-194.Iwaya, K., & Yamamoto, H. (2005). Diagnosis <strong>of</strong> Optimal Harvesting Time <strong>of</strong> Rice UsingDigital Imaging, Journal <strong>of</strong> <strong>Agricultural</strong> Meteorology, 60(2005) 981-984.Tillett, R.D. (1991). Image Analysis for <strong>Agricultural</strong> Processes: a Review <strong>of</strong> PotentialOpportunities. Journal <strong>of</strong> <strong>Agricultural</strong> <strong>Engineering</strong> Research, 50, 247-258.