Outdoor Air Pollution and Health in the Developing Countries of Asia ...
Outdoor Air Pollution and Health in the Developing Countries of Asia ...
Outdoor Air Pollution and Health in the Developing Countries of Asia ...

Create successful ePaper yourself
Turn your PDF publications into a flip-book with our unique Google optimized e-Paper software.
S P E C I A L R e p o r t 18H E A L T HE F F E CTSINSTITUTENovember 2010<strong>Outdoor</strong> <strong>Air</strong> <strong>Pollution</strong> <strong>and</strong> <strong>Health</strong><strong>in</strong> <strong>the</strong> Develop<strong>in</strong>g <strong>Countries</strong> <strong>of</strong> <strong>Asia</strong>:A Comprehensive ReviewHEI International Scientific Oversight Committee
<strong>Outdoor</strong> <strong>Air</strong> <strong>Pollution</strong> <strong>and</strong> <strong>Health</strong> <strong>in</strong> <strong>the</strong>Develop<strong>in</strong>g <strong>Countries</strong> <strong>of</strong> <strong>Asia</strong>:A Comprehensive ReviewHEI International Scientific Oversight CommitteeSpecial Report 18<strong>Health</strong> Effects InstituteBoston, MassachusettsTrusted Science ·Cleaner <strong>Air</strong> ·Better <strong>Health</strong>
Publish<strong>in</strong>g history: The Web version <strong>of</strong> this document was posted at www.heal<strong>the</strong>ffects.org <strong>in</strong> November 2010.Citation for document:HEI International Scientific Oversight Committee. 2010. <strong>Outdoor</strong> <strong>Air</strong> <strong>Pollution</strong> <strong>and</strong> <strong>Health</strong> <strong>in</strong><strong>the</strong> Develop<strong>in</strong>g <strong>Countries</strong> <strong>of</strong> <strong>Asia</strong>: A Comprehensive Review. Special Report 18. <strong>Health</strong> EffectsInstitute, Boston, MA.When specify<strong>in</strong>g a section <strong>of</strong> this report, cite it as a chapter <strong>of</strong> <strong>the</strong> whole document.© 2010 <strong>Health</strong> Effects Institute, Boston, Mass., U.S.A. Cameographics, Belfast, Me., Compositor. Pr<strong>in</strong>ted byRecycled Paper Pr<strong>in</strong>t<strong>in</strong>g, Boston, Mass. Library <strong>of</strong> Congress Number for <strong>the</strong> HEI Report Series: WA 754R432.Cover paper: made with at least 55% recycled content, <strong>of</strong> which at least 30% is post-consumer waste;free <strong>of</strong> acid <strong>and</strong> elemental chlor<strong>in</strong>e. Text paper: made with 100% post-consumer waste recycled content; acidfree; no chlor<strong>in</strong>e used <strong>in</strong> process<strong>in</strong>g. The book is pr<strong>in</strong>ted with soy-based <strong>in</strong>ks <strong>and</strong> is <strong>of</strong> permanent archivalquality.
ABOUT HEIThe <strong>Health</strong> Effects Institute is a nonpr<strong>of</strong>it corporation chartered <strong>in</strong> 1980 as an <strong>in</strong>dependentresearch organization to provide high-quality, impartial, <strong>and</strong> relevant science on <strong>the</strong> effects <strong>of</strong> airpollution on health. To accomplish its mission, <strong>the</strong> <strong>in</strong>stitute• Identifies <strong>the</strong> highest-priority areas for health effects research;• Competitively funds <strong>and</strong> oversees research projects;• Provides <strong>in</strong>tensive <strong>in</strong>dependent review <strong>of</strong> HEI-supported studies <strong>and</strong> relatedresearch;• Integrates HEI’s research results with those <strong>of</strong> o<strong>the</strong>r <strong>in</strong>stitutions <strong>in</strong>to broaderevaluations; <strong>and</strong>• Communicates <strong>the</strong> results <strong>of</strong> HEI’s research <strong>and</strong> analyses to public <strong>and</strong> privatedecision makers.HEI receives half <strong>of</strong> its core funds from <strong>the</strong> U.S. Environmental Protection Agency <strong>and</strong> halffrom <strong>the</strong> worldwide motor vehicle <strong>in</strong>dustry. Frequently, o<strong>the</strong>r public <strong>and</strong> private organizations <strong>in</strong><strong>the</strong> United States <strong>and</strong> around <strong>the</strong> world also support major projects or certa<strong>in</strong> researchprograms. The Public <strong>Health</strong> <strong>and</strong> <strong>Air</strong> <strong>Pollution</strong> <strong>in</strong> <strong>Asia</strong> (PAPA) Program was <strong>in</strong>itiated by <strong>the</strong> <strong>Health</strong>Effects Institute <strong>in</strong> part to support <strong>the</strong> Clean <strong>Air</strong> Initiative for <strong>Asia</strong>n Cities (CAI-<strong>Asia</strong>), apartnership <strong>of</strong> <strong>the</strong> <strong>Asia</strong>n Development Bank <strong>and</strong> <strong>the</strong> World Bank to <strong>in</strong>form regional decisionsabout improv<strong>in</strong>g air quality <strong>in</strong> <strong>Asia</strong>. Additional fund<strong>in</strong>g was obta<strong>in</strong>ed from <strong>the</strong> U.S. Agency forInternational Development <strong>and</strong> <strong>the</strong> William <strong>and</strong> Flora Hewlett Foundation.HEI has funded more than 280 research projects <strong>in</strong> North America, Europe, <strong>Asia</strong>, <strong>and</strong> Lat<strong>in</strong>America, <strong>the</strong> results <strong>of</strong> which have <strong>in</strong>formed decisions regard<strong>in</strong>g carbon monoxide, air toxics,nitrogen oxides, diesel exhaust, ozone, particulate matter, <strong>and</strong> o<strong>the</strong>r pollutants. These resultshave appeared <strong>in</strong> <strong>the</strong> peer-reviewed literature <strong>and</strong> <strong>in</strong> more than 200 comprehensive reportspublished by HEI.HEI’s <strong>in</strong>dependent Board <strong>of</strong> Directors consists <strong>of</strong> leaders <strong>in</strong> science <strong>and</strong> policy who arecommitted to foster<strong>in</strong>g <strong>the</strong> public–private partnership that is central to <strong>the</strong> organization. The<strong>Health</strong> Research Committee solicits <strong>in</strong>put from HEI sponsors <strong>and</strong> o<strong>the</strong>r stakeholders <strong>and</strong> workswith scientific staff to develop a Five-Year Strategic Plan, select research projects for fund<strong>in</strong>g, <strong>and</strong>oversee <strong>the</strong>ir conduct. The <strong>Health</strong> Review Committee, which has no role <strong>in</strong> select<strong>in</strong>g oroversee<strong>in</strong>g studies, works with staff to evaluate <strong>and</strong> <strong>in</strong>terpret <strong>the</strong> results <strong>of</strong> funded studies <strong>and</strong>related research.All project results <strong>and</strong> accompany<strong>in</strong>g comments by <strong>the</strong> <strong>Health</strong> Review Committee are widelydissem<strong>in</strong>ated through HEI’s Web site (www.heal<strong>the</strong>ffects.org), pr<strong>in</strong>ted reports, newsletters <strong>and</strong> o<strong>the</strong>rpublications, annual conferences, <strong>and</strong> presentations to legislative bodies <strong>and</strong> public agencies.iii
CONTENTSAbout HEIContributorsiiiixExecutive Summary 1SECTION I. INTRODUCTION 17SECTION II. DEVELOPMENT, AIR POLLUTION EXPOSURE,AND POPULATION HEALTH 21Trends <strong>in</strong> Development 21Broad Trends <strong>in</strong> Development 21Changes <strong>in</strong> Population Age Structures 24Status <strong>of</strong> <strong>and</strong> Trends <strong>in</strong> Disease Burden 24Trends <strong>in</strong> Environmental Risks 26Urbanization 28<strong>Air</strong> <strong>Pollution</strong>, Poverty, <strong>and</strong> <strong>Health</strong> 31Sources 31Common Sources <strong>of</strong> <strong>Air</strong> <strong>Pollution</strong> 37Trends <strong>in</strong> Energy Use <strong>and</strong> Projected Growth<strong>in</strong> Major Po<strong>in</strong>t Sources <strong>and</strong> Emissions 38Pollutant Concentrations 50Monitor<strong>in</strong>g Data 50Modeled Estimated Pollutant Concentrations<strong>and</strong> Projected Trends <strong>in</strong> Emissions 57Current Source-Apportionment Studies<strong>in</strong> <strong>Asia</strong> 60Overview <strong>of</strong> Exposure Issues 69Intake Fraction <strong>and</strong> <strong>the</strong> Role <strong>of</strong> HumanActivity 69Limitations <strong>of</strong> Ambient Pollutant Concentrationsas a Metric <strong>of</strong> Exposure 71Policy Issues <strong>in</strong> <strong>Air</strong> Quality Management 71Actions Taken to Reduce <strong>Air</strong> <strong>Pollution</strong> 71Cont<strong>in</strong>u<strong>in</strong>g Challenges 78New <strong>and</strong> Emerg<strong>in</strong>g Challenges 79Future Directions 80Summary 80The Size <strong>of</strong> <strong>the</strong> Vulnerable <strong>and</strong> PotentiallyExposed Population Is Increas<strong>in</strong>g. 80<strong>Asia</strong> Is Highly Dynamic <strong>and</strong> Heterogeneous,<strong>and</strong> Exposure to <strong>Air</strong> <strong>Pollution</strong> Is Becom<strong>in</strong>gIncreas<strong>in</strong>gly Varied <strong>and</strong> Complex AsDevelopment Progresses. 81Dramatic Increases <strong>in</strong> <strong>the</strong> Activities <strong>of</strong>Sources Are Occurr<strong>in</strong>g. 81Regional <strong>Air</strong> Quality <strong>and</strong> Climate ChangeAre Key Emerg<strong>in</strong>g Issues. 81SECTION III. SUMMARY OF CURRENT EVIDENCEON HEALTH EFFECTS OF AIR POLLUTION:IMPLICATIONS FOR ASIA 83Studies <strong>of</strong> Variability <strong>in</strong> Exposure 83Short-Term Temporal Variability 83Long-Term Spatial Variability 85Long-Term Temporal Variability 87
Special Report 18<strong>Air</strong> <strong>Pollution</strong>, Adverse Reproductive Outcomes,<strong>and</strong> Child <strong>Health</strong> 89Contribution <strong>of</strong> Copollutants 90Gaps <strong>and</strong> Limitations <strong>of</strong> Current Knowledge 90SECTION IV. UPDATED REVIEW OF THE ASIAN LITERATUREON AIR POLLUTION AND HEALTH 91Literature Review 91Search Methods 91Search Results 93SECTION V. QUANTITATIVE ASSESSMENT OFDAILY TIME-SERIES STUDIES 97Introduction 97Systematic Ascerta<strong>in</strong>ment <strong>of</strong> Relevant Time-SeriesStudies for APED 97Literature Search 97Data Abstraction 98Selection <strong>of</strong> Lag Times 98Multi-City Studies 99Meta-Analytic Methods 99Multiple Studies <strong>of</strong> a S<strong>in</strong>gle City 99Computation <strong>of</strong> Summary Estimates 99Investigation <strong>of</strong> Publication Bias 99Results 100Study Characteristics 100Geographic Distribution <strong>of</strong> <strong>the</strong> Studies 100<strong>Health</strong> Outcomes 100Pollutants 100Effect Estimates 100Summary Estimates 123Investigation <strong>of</strong> Sources <strong>of</strong> Heterogeneity 125Discussion 126Review <strong>of</strong> F<strong>in</strong>d<strong>in</strong>gs 126Comparison with Results from <strong>the</strong> PAPAStudies <strong>in</strong> Four <strong>Asia</strong>n Cities 127Comparison with Results from India 129Comparison with Results from O<strong>the</strong>rParts <strong>of</strong> <strong>the</strong> World 129Limitations <strong>of</strong> This Review 129Heterogeneity <strong>and</strong> Effect Modification 129Multi-Pollutant Models 130Studies <strong>of</strong> <strong>Pollution</strong> Episodes 130SECTION VI. STUDIES OF SELECTED EFFECTS OFLONG-TERM EXPOSURE TO AMBIENT AIR POLLUTION 131Methods 131Study Selection 131Quantification <strong>of</strong> Results 131Chronic Respiratory Disease 132Chronic Phlegm 132Pulmonary Function 141Asthma <strong>and</strong> Wheeze 148Lung Cancer 162Studies 162Discussion 165
Special Report 18Adverse Pregnancy Outcomes 165Preterm Delivery 165Low Birth Weight 168Discussion 173Summary <strong>and</strong> Conclusions 173SECTION VII. SUMMARY AND CONCLUSIONS 175The PAPA Studies 176Systematic <strong>and</strong> Critical Review <strong>of</strong> Studies <strong>of</strong> ChronicEffects <strong>of</strong> Long-Term Exposure to <strong>Air</strong> <strong>Pollution</strong> 177Implications for Assessment <strong>of</strong> <strong>Health</strong> Impacts 177Enhanced Evidence <strong>of</strong> Effects <strong>of</strong> <strong>Air</strong> <strong>Pollution</strong> <strong>in</strong> <strong>Asia</strong> 178Knowledge Gaps <strong>and</strong> Research Needs 179How Does <strong>the</strong> Nature <strong>of</strong> <strong>the</strong> <strong>Air</strong> <strong>Pollution</strong>Mixture Affect <strong>Air</strong> Quality, Exposure, <strong>and</strong><strong>Health</strong> Effects? 179What Are <strong>the</strong> Effects <strong>of</strong> Long-TermExposure to <strong>Air</strong> <strong>Pollution</strong>? 179What Do Results <strong>of</strong> Current Time-SeriesStudies <strong>in</strong> a Subset <strong>of</strong> <strong>Asia</strong>n Cities Tell UsAbout <strong>Health</strong> Effects <strong>of</strong> <strong>Air</strong> <strong>Pollution</strong>Exposure <strong>in</strong> O<strong>the</strong>r, As Yet Unstudied,<strong>Asia</strong>n Locales? 179What Role Does Indoor <strong>Air</strong> <strong>Pollution</strong>Play <strong>in</strong> <strong>the</strong> <strong>Health</strong> Effects <strong>of</strong> <strong>Outdoor</strong><strong>Air</strong> <strong>Pollution</strong>? 180What Role Does Poverty Play <strong>in</strong> <strong>the</strong><strong>Health</strong> Effects <strong>of</strong> <strong>Air</strong> <strong>Pollution</strong>? 180What Are <strong>the</strong> <strong>Health</strong> Consequences <strong>of</strong>Changes <strong>in</strong> <strong>Air</strong> <strong>Pollution</strong> Result<strong>in</strong>g fromClimate Changes <strong>and</strong> Efforts to ReduceEmissions <strong>of</strong> Climate-Forc<strong>in</strong>g Agents? 180REFERENCES 181APPENDICES 211Appendix A. Additional Analyses <strong>of</strong> DailyTime-Series Studies 211Appendix B. Additional Analyses <strong>of</strong> Effects <strong>of</strong>Long-Term Exposure 255ABBREVIATIONS AND OTHER TERMS 259CITIES, PROVINCES, AND COUNTRIES 261GLOSSARY 263Related HEI Publications 265HEI Board, Committees, <strong>and</strong> Staff 267
CONTRIBUTORSThis HEI Special Report was prepared on behalf <strong>of</strong> <strong>the</strong> International Scientific Oversight Committee (ISOC) <strong>of</strong> <strong>the</strong> Public<strong>Health</strong> <strong>and</strong> <strong>Air</strong> <strong>Pollution</strong> <strong>in</strong> <strong>Asia</strong> (PAPA) program, which oversaw its plann<strong>in</strong>g <strong>and</strong> production <strong>and</strong> reviewed its content <strong>and</strong>conclusions. The ISOC thanks <strong>the</strong> contribut<strong>in</strong>g authors who drafted <strong>the</strong> report <strong>and</strong> <strong>the</strong> eight peer reviewers whocommented on several drafts. The ISOC also thanks Davida Schiff (HEI 2006–2008 Research Assistant, currently a BostonUniversity Medical School student) for her early <strong>in</strong>volvement <strong>in</strong> search<strong>in</strong>g databases.HEI International Scientific Oversight CommitteeFrank Speizer, Chair Harvard Medical School, HarvardSchool <strong>of</strong> Public <strong>Health</strong>, HEI <strong>Health</strong> Research Committee(former member)H. Ross Anderson St. George’s, University <strong>of</strong> London, <strong>and</strong>Medical Research Council–<strong>Health</strong> Protection Agency Centrefor Environment <strong>and</strong> <strong>Health</strong>, HEI <strong>Health</strong> Review Committee(former member)Michael Brauer University <strong>of</strong> British Columbia, HEI <strong>Health</strong>Review CommitteeKenneth L. Demerjian State University <strong>of</strong> New York atAlbany, HEI <strong>Health</strong> Research Committee (former member)Jim<strong>in</strong>g Hao Ts<strong>in</strong>ghua UniversityJitendra N. P<strong>and</strong>e Sitaram Bhartia Institute <strong>of</strong> Science <strong>and</strong>ResearchC. Arden Pope III Brigham Young UniversityPaul Wise Stanford University Medical SchoolContribut<strong>in</strong>g AuthorsH. Ross Anderson St. George’s, University <strong>of</strong> London, <strong>and</strong>Medical Research Council–<strong>Health</strong> Protection Agency Centrefor Environment <strong>and</strong> <strong>Health</strong>, HEI <strong>Health</strong> Review Committee(former member), ISOCRichard Atk<strong>in</strong>son St. George’s, University <strong>of</strong> London, <strong>and</strong>Medical Research Council–<strong>Health</strong> Protection Agency Centrefor Environment <strong>and</strong> <strong>Health</strong>John Balbus National Institute <strong>of</strong> Environmental <strong>Health</strong>SciencesMichael Brauer University <strong>of</strong> British Columbia, HEI <strong>Health</strong>Review Committee, ISOCRobert Chapman College <strong>of</strong> Public <strong>Health</strong> Sciences,Chulalongkorn University, BangkokZohir Chowdhury San Diego State UniversityAaron Cohen <strong>Health</strong> Effects InstituteKenneth L. Demerjian State University <strong>of</strong> New York atAlbany, HEI <strong>Health</strong> Research Committee (former member),ISOCKrist<strong>in</strong> Ebi ConsultantGraziella Favarato St. George’s, University <strong>of</strong> London, <strong>and</strong>Medical Research Council–<strong>Health</strong> Protection Agency Centrefor Environment <strong>and</strong> <strong>Health</strong>Daniel S. Greenbaum <strong>Health</strong> Effects InstituteSumi Mehta <strong>Health</strong> Effects InstituteTiffany North <strong>Health</strong> Effects InstituteRobert M. O’Keefe <strong>Health</strong> Effects InstituteKiran Dev P<strong>and</strong>ey World BankC. Arden Pope III Brigham Young University, ISOCKirk R. Smith University <strong>of</strong> California at Berkeley,East-West InstituteFrank Speizer Harvard Medical School, HEI <strong>Health</strong>Research Committee (former member), ISOCMichael Walsh International Council on Clean TransportationJungfeng (Jim) Zhang University <strong>of</strong> Sou<strong>the</strong>rn California<strong>Health</strong> Effects Institute Special Report 18 © 2010ix
CONTRIBUTORSPeer ReviewersMajid Ezzati Harvard School <strong>of</strong> Public <strong>Health</strong>Philip K. Hopke Clarkson UniversityKazuhiko Ito New York University School <strong>of</strong> Medic<strong>in</strong>eSur<strong>in</strong>der K. J<strong>in</strong>dal Institute <strong>of</strong> Pulmonary Medic<strong>in</strong>eNguyen Oahn <strong>Asia</strong>n Institute <strong>of</strong> TechnologyRoger Peng Johns Hopk<strong>in</strong>s UniversityZhu Tong Pek<strong>in</strong>g UniversitySalim Yusuf McMaster UniversityHEI Publications StaffL. Virgi Hepner Project ManagerFrederic R. Howe Consult<strong>in</strong>g Pro<strong>of</strong>readerJenny Lamont Consult<strong>in</strong>g Science EditorFlannery Carey McDermott Editorial AssistantCarol A. Moyer Consult<strong>in</strong>g Science EditorRuth E. Shaw Consult<strong>in</strong>g CompositorTranslation ServicesHaidong Kan, Renjie Chen, Xia Meng School <strong>of</strong> Public<strong>Health</strong>, Fudan UniversityJungfeng (Jim) Zhang University <strong>of</strong> Sou<strong>the</strong>rn CaliforniaHui Hu Environmental <strong>Health</strong> Perspectivesx
EXECUTIVE SUMMARY<strong>Outdoor</strong> <strong>Air</strong> <strong>Pollution</strong> <strong>and</strong> <strong>Health</strong> <strong>in</strong> <strong>the</strong> Develop<strong>in</strong>g <strong>Countries</strong> <strong>of</strong> <strong>Asia</strong>:A Comprehensive ReviewEXECUTIVE SUMMARY<strong>Asia</strong> is undergo<strong>in</strong>g economic development at arapid rate, result<strong>in</strong>g <strong>in</strong> levels <strong>of</strong> urban air pollution<strong>in</strong> many cities that rival <strong>the</strong> levels that existed <strong>in</strong>Europe <strong>and</strong> North America <strong>in</strong> <strong>the</strong> first decades <strong>of</strong><strong>the</strong> 20th century. This development is also transform<strong>in</strong>g<strong>the</strong> demographic <strong>and</strong> epidemiologic characteristics<strong>of</strong> <strong>the</strong> population <strong>in</strong> ways that are likelyto affect its vulnerability to air pollution. Nearlytwo thirds <strong>of</strong> <strong>the</strong> estimated 800,000 deaths <strong>and</strong> 4.6million lost years <strong>of</strong> healthy life worldwide causedby exposure to urban air pollution <strong>in</strong> 2000occurred <strong>in</strong> <strong>the</strong> develop<strong>in</strong>g countries <strong>of</strong> <strong>Asia</strong> (alsoreferred to as “develop<strong>in</strong>g <strong>Asia</strong>”; World <strong>Health</strong>Organization [WHO*] 2002). In rural areas <strong>and</strong>urban slums, <strong>in</strong>door air pollution from <strong>the</strong> burn<strong>in</strong>g<strong>of</strong> solid fuels confers its own large burden <strong>of</strong> disease<strong>and</strong> contributes to <strong>in</strong>creased outdoor concentrations<strong>of</strong> pollutants <strong>in</strong> some locales. Develop<strong>in</strong>g<strong>Asia</strong>’s poorest populations are also susceptible to<strong>the</strong> unexpected effects <strong>of</strong> climate change,<strong>in</strong>clud<strong>in</strong>g possibly substantial health effects.Effective public policy responses to <strong>the</strong> publichealth challenges posed by air pollution <strong>in</strong> develop<strong>in</strong>g<strong>Asia</strong> require high-quality scientific evidenceon <strong>the</strong> health effects <strong>of</strong> air pollution <strong>in</strong> <strong>the</strong> region.Epidemiologic studies are among <strong>the</strong> most important<strong>and</strong> critical components <strong>of</strong> <strong>the</strong> required evidence;toge<strong>the</strong>r with toxicologic <strong>and</strong> cl<strong>in</strong>icalstudies, <strong>the</strong>y provide estimates <strong>of</strong> <strong>the</strong> quantitativerelation between exposure <strong>and</strong> disease. These estimatesboth demonstrate <strong>the</strong> existence <strong>of</strong> a publichealth hazard <strong>and</strong> allow its magnitude to be estimated.Ow<strong>in</strong>g to limitations <strong>of</strong> <strong>the</strong> available epidemiologicstudies <strong>in</strong> <strong>Asia</strong>, estimates fromassessments <strong>of</strong> <strong>the</strong> health impact <strong>of</strong> air pollution <strong>in</strong><strong>Asia</strong>n populations (e.g., <strong>the</strong> estimate from <strong>the</strong> WHOcited above), rely <strong>in</strong> large part on extrapolation,This document was made possible, <strong>in</strong> part, through support providedby <strong>the</strong> United States Agency for International Development(USAID) <strong>and</strong> <strong>the</strong> William <strong>and</strong> Flora Hewlett Foundation. Theop<strong>in</strong>ions expressed here<strong>in</strong> do not necessarily reflect <strong>the</strong> views <strong>of</strong>USAID or any o<strong>the</strong>r sponsors <strong>of</strong> HEI.* A list <strong>of</strong> abbreviations <strong>and</strong> o<strong>the</strong>r terms appears at <strong>the</strong> end <strong>of</strong> <strong>the</strong>summary.with considerable uncerta<strong>in</strong>ty, <strong>of</strong> <strong>the</strong> results <strong>of</strong>Western studies to <strong>Asia</strong>n populations (Cohen et al.2004; HEI International Scientific Oversight Committee[ISOC] 2004).HEI <strong>in</strong>itiated <strong>the</strong> Public <strong>Health</strong> <strong>and</strong> <strong>Air</strong> <strong>Pollution</strong><strong>in</strong> <strong>Asia</strong> (PAPA) program <strong>in</strong> 2002 to reduceuncerta<strong>in</strong>ties about <strong>the</strong> health effects <strong>of</strong> exposureto air pollution <strong>in</strong> <strong>the</strong> cities <strong>of</strong> develop<strong>in</strong>g <strong>Asia</strong>.The first major publication <strong>of</strong> <strong>the</strong> PAPA programwas Special Report 15, <strong>Health</strong> Effects <strong>of</strong> <strong>Outdoor</strong><strong>Air</strong> <strong>Pollution</strong> <strong>in</strong> Develop<strong>in</strong>g <strong>Countries</strong> <strong>of</strong> <strong>Asia</strong>: ALiterature Review (HEI ISOC 2004). That reportwas also <strong>the</strong> first comprehensive review <strong>of</strong> <strong>the</strong>peer-reviewed <strong>Asia</strong>n literature on <strong>the</strong> heal<strong>the</strong>ffects <strong>of</strong> air pollution, a literature that at that time(2004) comprised over 100 studies <strong>in</strong> n<strong>in</strong>e countries.On <strong>the</strong> basis <strong>of</strong> Special Report 15, <strong>the</strong> PAPAprogram <strong>in</strong>itiated a coord<strong>in</strong>ated set <strong>of</strong> analyses <strong>of</strong>air pollution <strong>and</strong> daily mortality <strong>in</strong> four selected<strong>Asia</strong>n cities (Hong Kong, Bangkok, Wuhan, <strong>and</strong>Shanghai). These studies have now been completed(HEI Public <strong>Health</strong> <strong>and</strong> <strong>Air</strong> <strong>Pollution</strong> <strong>in</strong><strong>Asia</strong> Program 2010), as have additional studies <strong>in</strong>India <strong>and</strong> Vietnam (Balakrishnan et al. 2010; Rajarathnamet al. 2010; Collaborative Work<strong>in</strong>g Groupon <strong>Air</strong> <strong>Pollution</strong>, Poverty, <strong>and</strong> <strong>Health</strong> <strong>in</strong> Ho ChiM<strong>in</strong>h City 2009).The current report is <strong>the</strong> second PAPA literaturereview, <strong>Outdoor</strong> <strong>Air</strong> <strong>Pollution</strong> <strong>and</strong> <strong>Health</strong> <strong>in</strong>Develop<strong>in</strong>g <strong>Countries</strong> <strong>of</strong> <strong>Asia</strong>: A ComprehensiveReview (HEI Special Report 18). It beg<strong>in</strong>s with abroad overview <strong>of</strong> <strong>the</strong> status <strong>of</strong> <strong>and</strong> trends <strong>in</strong> airpollution sources, emissions, concentrations, <strong>and</strong>exposures <strong>in</strong> <strong>the</strong> develop<strong>in</strong>g countries <strong>of</strong> <strong>Asia</strong>, aswell as factors related to urban development, populationhealth, <strong>and</strong> public policy that set <strong>the</strong> contextfor <strong>the</strong> health effects <strong>of</strong> air pollution. Next, <strong>the</strong>review describes <strong>the</strong> current scope <strong>of</strong> <strong>the</strong> <strong>Asia</strong>n literatureon <strong>the</strong> health effects <strong>of</strong> outdoor air pollution,enumerat<strong>in</strong>g <strong>and</strong> classify<strong>in</strong>g more than 400studies identified through 2007 via HEI’s Web-basedPublic <strong>Health</strong> <strong>and</strong> <strong>Air</strong> <strong>Pollution</strong> <strong>in</strong> <strong>Asia</strong> — ScienceAccess on <strong>the</strong> Net (PAPA–SAN) literature survey(HEI 2006). In addition, a systematic <strong>and</strong> quantitativeassessment (conducted us<strong>in</strong>g St, George’s <strong>Air</strong><strong>Health</strong> Effects Institute Special Report 18 © 20101
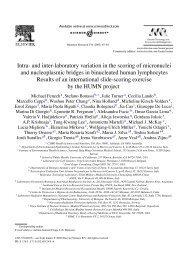
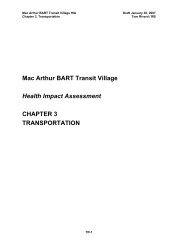
<strong>Outdoor</strong> <strong>Air</strong> <strong>Pollution</strong> <strong>and</strong> <strong>Health</strong> <strong>in</strong> <strong>the</strong> Develop<strong>in</strong>g <strong>Countries</strong> <strong>of</strong> <strong>Asia</strong>: A Comprehensive ReviewExecutive Summary Figure 1. Deaths <strong>and</strong> disability-adjusted life-years (DALYs) <strong>in</strong> <strong>Asia</strong> <strong>in</strong> 2004, by region <strong>and</strong> cause. “Sou<strong>the</strong>ast<strong>Asia</strong>” corresponds to WHO Sou<strong>the</strong>ast <strong>Asia</strong>n Region B; “South <strong>Asia</strong>” to WHO Sou<strong>the</strong>ast <strong>Asia</strong>n Region D; <strong>and</strong> “East <strong>Asia</strong>” to WHOWestern Pacific Region B. [Data compiled from WHO 2008.]<strong>Pollution</strong> Epidemiology Database [APED]) <strong>of</strong> 82 time-seriesstudies that estimate <strong>the</strong> effect <strong>of</strong> short-term exposure to airpollution on daily mortality <strong>and</strong> hospital admissions forcardiovascular <strong>and</strong> respiratory disease — four times <strong>the</strong>number <strong>of</strong> studies analyzed for Special Report 15. Thestudies covered <strong>in</strong> <strong>the</strong> current review <strong>in</strong>clude <strong>the</strong> coord<strong>in</strong>atedstudies <strong>of</strong> air pollution <strong>and</strong> daily mortality <strong>in</strong> four<strong>Asia</strong>n cities conducted as part <strong>of</strong> HEI’s PAPA research program,as well as a first-ever critical <strong>and</strong> qualitative analysis<strong>of</strong> <strong>Asia</strong>n studies <strong>of</strong> long-term exposure to air pollution <strong>and</strong>chronic respiratory disease, lung cancer, <strong>and</strong> adverse reproductiveoutcomes. The review concludes with a discussionthat places <strong>the</strong> <strong>Asia</strong>n health effects studies <strong>in</strong> <strong>the</strong> context <strong>of</strong><strong>the</strong> worldwide literature, identifies gaps <strong>in</strong> knowledge, <strong>and</strong>recommends approaches by which to address <strong>the</strong>m.THE ASIAN LITERATURE IN CONTEXTDevelopment, <strong>Air</strong> <strong>Pollution</strong>, <strong>and</strong> Population <strong>Health</strong>This review evaluates <strong>the</strong> evidence <strong>of</strong> health effects <strong>of</strong>outdoor air pollution <strong>in</strong> develop<strong>in</strong>g <strong>Asia</strong> <strong>in</strong> <strong>the</strong> context <strong>of</strong>ongo<strong>in</strong>g changes <strong>in</strong> both air quality <strong>and</strong> population health.The nature <strong>of</strong> <strong>the</strong> health risks associated with <strong>the</strong> natural<strong>and</strong> built environments changes as economic developmentoccurs. Economic development <strong>and</strong> attendant urbanizationhas been, <strong>and</strong> cont<strong>in</strong>ues to be, based <strong>in</strong> large part on<strong>the</strong> <strong>in</strong>creased combustion <strong>of</strong> fossil fuels. This pattern <strong>of</strong>development has led, <strong>in</strong> some countries, to impressivereductions <strong>in</strong> poverty levels <strong>and</strong> <strong>in</strong>creased life expectancy.Economic development <strong>and</strong> poverty reduction have alsoled to gradual decreases <strong>in</strong> environmental risks at <strong>the</strong>household level, such as <strong>in</strong>door air pollution from <strong>the</strong>burn<strong>in</strong>g <strong>of</strong> solid fuels <strong>and</strong> poor water quality, although <strong>the</strong>burden <strong>of</strong> disease associated with <strong>the</strong>se exposures <strong>in</strong>young children <strong>and</strong> women rema<strong>in</strong>s substantial. Therehave also been commendable improvements <strong>in</strong> urban airquality <strong>in</strong> many parts <strong>of</strong> <strong>Asia</strong>. At <strong>the</strong> same time, <strong>the</strong> size <strong>of</strong><strong>the</strong> exposed population that may be vulnerable to air pollutionis <strong>in</strong>creas<strong>in</strong>g, as is evidenced by a large <strong>and</strong> grow<strong>in</strong>gburden <strong>of</strong> disease from chronic noncommunicable diseases— such as ischemic heart disease (IHD), cerebrovasculardisease, chronic obstructive pulmonary disease(COPD), <strong>and</strong> cancer. The <strong>in</strong>creased population size is, <strong>in</strong>part, ow<strong>in</strong>g to larger numbers <strong>of</strong> people liv<strong>in</strong>g to older ages<strong>and</strong> to <strong>the</strong> <strong>in</strong>creased prevalence <strong>of</strong> tobacco smok<strong>in</strong>g, higherrates <strong>of</strong> obesity, <strong>and</strong> changes <strong>in</strong> dietary patterns (Figure 1).<strong>Air</strong> pollution has become a major policy issue <strong>in</strong> manyparts <strong>of</strong> <strong>Asia</strong> <strong>and</strong> has prompted actions to improve airquality. As a result, <strong>the</strong>re have been improvements <strong>in</strong> airquality across <strong>the</strong> region, even <strong>in</strong> <strong>the</strong> face <strong>of</strong> <strong>in</strong>creas<strong>in</strong>gfossil-fuel consumption. These improvements, however,have not occurred <strong>in</strong> all highly populated areas, <strong>and</strong> someareas have <strong>in</strong> fact been experienc<strong>in</strong>g deteriorat<strong>in</strong>g airquality. In general, air pollution concentrations <strong>in</strong> <strong>Asia</strong>ncities greatly exceed current WHO health-based air qualityguidel<strong>in</strong>es <strong>and</strong> many current national st<strong>and</strong>ards (Figure 2).In a large number <strong>of</strong> studies worldwide, air pollution hasbeen found to adversely affect people with chronic cardiovascular<strong>and</strong> respiratory diseases, <strong>and</strong> it may also contributeto <strong>the</strong> development <strong>of</strong> those diseases <strong>in</strong> o<strong>the</strong>rwise healthypeople. Thus, even as air quality has improved <strong>in</strong> some locations,<strong>the</strong>re rema<strong>in</strong>s an important adverse impact on publichealth, which may grow as populations age <strong>and</strong> rates <strong>of</strong>chronic disease <strong>and</strong> urbanization <strong>in</strong>crease.2
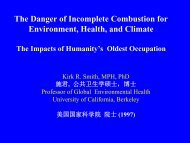
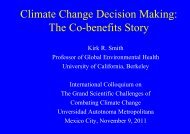
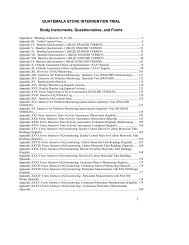
Executive Summary<strong>Air</strong> quality <strong>in</strong> <strong>Asia</strong> reflects complex <strong>and</strong> evolv<strong>in</strong>g relationsbetween <strong>in</strong>creased energy consumption for transport <strong>and</strong>power generation <strong>and</strong> measures be<strong>in</strong>g taken to improve airquality. Overall, estimates <strong>of</strong> pollution emissions as well asmeasured <strong>and</strong> estimated ambient concentrations <strong>in</strong>dicatethat air quality is improv<strong>in</strong>g throughout much <strong>of</strong> urban <strong>Asia</strong>(Figures 3 <strong>and</strong> 4). Trends <strong>in</strong> air quality have largely shownimprovement dur<strong>in</strong>g periods <strong>of</strong> dramatically <strong>in</strong>creasedenergy use <strong>in</strong> <strong>Asia</strong>, a testament to <strong>the</strong> impact <strong>of</strong> effective airExecutive Summary Figure 2. Five-year (2000–2004) average PM 10 , SO 2 , <strong>and</strong> NO 2 concentrations <strong>in</strong> selected <strong>Asia</strong>n cities. St<strong>and</strong>ards are from WHO <strong>Air</strong>Quality Guidel<strong>in</strong>es, 2005 Global Update (WHO 2006a): PM 10 annual average 20 µg/m 3 ; SO 2 24-hr average 20 µg/m 3 ; NO 2 annual average 40 µg/m 3 . PM 10 isparticulate matter 10 µm or smaller <strong>in</strong> aerodynamic diameter; SO 2 is sulfur dioxide; NO 2 is nitrogen dioxide. [Repr<strong>in</strong>ted with permission from Clean <strong>Air</strong>Initiative for <strong>Asia</strong>n Cities [CAI-<strong>Asia</strong>] Center (www.cleanairnet.org/caiasia; accessed January 2008).]Executive Summary Figure 3. SO 2 emissions <strong>in</strong> <strong>Asia</strong>, 1980–2005. Data are given <strong>in</strong> kilotons per year. Ch<strong>in</strong>a comprises ma<strong>in</strong>l<strong>and</strong> Ch<strong>in</strong>a, Hong Kong, <strong>and</strong>Taipei,Ch<strong>in</strong>a. O<strong>the</strong>r South <strong>Asia</strong> comprises Afghanistan, Bangladesh, Bhutan, Maldives, Nepal, Pakistan, <strong>and</strong> Sri Lanka. O<strong>the</strong>r Sou<strong>the</strong>ast <strong>Asia</strong> comprisesCambodia, Indonesia, Laos, Malaysia, Myanmar (Burma), Philipp<strong>in</strong>es, Thail<strong>and</strong>, Timor-Leste, <strong>and</strong> Vietnam. High-Income <strong>Asia</strong> comprises Brunei, Japan,South Korea, <strong>and</strong> S<strong>in</strong>gapore. Values for All <strong>Asia</strong> are weighted averages <strong>of</strong> <strong>the</strong> regions. [Adapted from <strong>the</strong> Frontier Research Center for Global Change2007 with additional material from T. Ohara (personal communication, May 26, 2008).]3
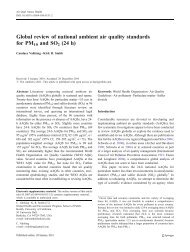
<strong>Outdoor</strong> <strong>Air</strong> <strong>Pollution</strong> <strong>and</strong> <strong>Health</strong> <strong>in</strong> <strong>the</strong> Develop<strong>in</strong>g <strong>Countries</strong> <strong>of</strong> <strong>Asia</strong>: A Comprehensive ReviewExecutive Summary Figure 4. Annual averages <strong>of</strong> PM 10 , SO 2 , <strong>and</strong> NO 2 aggregated among selected <strong>Asia</strong>n cities, 1993–2005. Thecities used for this figure are shown <strong>in</strong> Executive Summary Figure 2. The straight l<strong>in</strong>es are smoo<strong>the</strong>d estimates <strong>of</strong> trends <strong>in</strong> air pollutionlevels. [Repr<strong>in</strong>ted with permission from CAI-<strong>Asia</strong> (www.cleanairnet.org/caiasia; accessed January 2008).]quality management as well as improved energy efficiency<strong>and</strong> reduced <strong>in</strong>tensity <strong>of</strong> energy use.From past experience <strong>in</strong> Western countries, it seemsclear that substantial <strong>in</strong>creases <strong>in</strong> <strong>the</strong> combustion <strong>of</strong> fossilfuels for power generation <strong>and</strong> transportation can improveeconomic conditions but can also, if not controlled, haveimportant negative consequences for human health <strong>and</strong>environmental quality <strong>in</strong> <strong>Asia</strong> <strong>and</strong> elsewhere, throughtransboundary transport <strong>of</strong> pollutants. It is also clear thateffective approaches to controll<strong>in</strong>g <strong>and</strong> reduc<strong>in</strong>g pollutionexist. Investment <strong>in</strong> <strong>the</strong>se approaches need not necessarilyimpede economic growth <strong>and</strong>, on <strong>the</strong> basis <strong>of</strong> documentedexperience <strong>in</strong> developed countries <strong>and</strong> emerg<strong>in</strong>g evidence<strong>in</strong> <strong>Asia</strong>, <strong>the</strong> develop<strong>in</strong>g countries <strong>of</strong> <strong>Asia</strong> may be able toavert <strong>in</strong>creased environmental degradation <strong>and</strong> associatedadverse health impacts while reduc<strong>in</strong>g poverty <strong>and</strong> provid<strong>in</strong>geconomic security for <strong>the</strong>ir populations (Clean <strong>Air</strong>Initiative for <strong>Asia</strong>n Cities [CAI-<strong>Asia</strong>] Center 2008, U.S.Environmental Protection Agency [U.S. EPA] 2008).Climate change <strong>and</strong> emissions <strong>of</strong> climate-forc<strong>in</strong>g pollutantspresent a considerable challenge for <strong>Asia</strong> but are <strong>of</strong>feran additional rationale for cont<strong>in</strong>ued improvement <strong>in</strong> airquality, with near-term benefits for public health fromreductions <strong>of</strong> short-lived greenhouse gases (GHGs). Strategiesfor reduc<strong>in</strong>g GHG emissions, though directed towardclimate change, may also have direct impacts on local <strong>and</strong>regional air quality, result<strong>in</strong>g <strong>in</strong> faster <strong>and</strong> larger improvementsthan would o<strong>the</strong>rwise occur <strong>in</strong> <strong>the</strong> region.Review <strong>of</strong> Epidemiologic Studies <strong>of</strong> <strong>Air</strong> <strong>Pollution</strong>As a result <strong>of</strong> <strong>the</strong>se developments, <strong>the</strong> need for highqualityresearch on <strong>the</strong> health effects <strong>of</strong> air pollution <strong>in</strong><strong>Asia</strong> has never been greater, <strong>and</strong> <strong>the</strong> scientific communityis respond<strong>in</strong>g with an <strong>in</strong>creas<strong>in</strong>g number <strong>of</strong> studies <strong>of</strong> <strong>the</strong>effects <strong>of</strong> exposure to air pollution on morbidity <strong>and</strong> mortalitydue to cardiovascular or respiratory diseases,adverse reproductive outcomes, <strong>and</strong> o<strong>the</strong>r health effects.Systematic searches <strong>of</strong> <strong>the</strong> peer-reviewed literature <strong>in</strong>HEI’s PAPA–SAN database have identified over 400studies <strong>of</strong> <strong>the</strong> health effects <strong>of</strong> air pollution <strong>in</strong> <strong>Asia</strong> publishedfrom 1980 through 2007 (Figure 5). The studies havebeen conducted <strong>in</strong> 13 countries, <strong>and</strong> <strong>the</strong> rate <strong>of</strong> publicationhas <strong>in</strong>creased over <strong>the</strong> past 20 years. The spectrum <strong>of</strong>adverse health effects associated with air pollution exposureranges from acute <strong>and</strong> chronic respiratory symptoms <strong>and</strong>changes <strong>in</strong> pulmonary function to <strong>in</strong>creased mortality fromcardiovascular or respiratory diseases or lung cancer — <strong>the</strong>same spectrum <strong>of</strong> adverse health outcomes associated withair pollution <strong>in</strong> <strong>the</strong> West.Meta-Analyses <strong>of</strong> Daily Time-Series StudiesTime-series studies <strong>of</strong> <strong>the</strong> effects <strong>of</strong> short-term exposureon morbidity <strong>and</strong> mortality from cardiovascular or respiratorydiseases cont<strong>in</strong>ue to provide some <strong>of</strong> <strong>the</strong> most current<strong>and</strong> consistent evidence <strong>of</strong> serious adverse health effects <strong>of</strong>air pollution <strong>in</strong> <strong>Asia</strong>, with over 100 studies publisheds<strong>in</strong>ce 1980. This literature now <strong>in</strong>cludes <strong>the</strong> results <strong>of</strong> <strong>the</strong>4
Executive SummaryExecutive Summary Figure 5. Number <strong>of</strong> studies identified <strong>in</strong> <strong>the</strong> PAPA–SAN <strong>Asia</strong>n literature review, accord<strong>in</strong>g to country <strong>of</strong>study.coord<strong>in</strong>ated studies <strong>in</strong> four <strong>Asia</strong>n cities funded under <strong>the</strong>PAPA program (HEI Public <strong>Health</strong> <strong>and</strong> <strong>Air</strong> <strong>Pollution</strong> <strong>in</strong><strong>Asia</strong> Program 2010), consist<strong>in</strong>g <strong>of</strong> <strong>the</strong> type <strong>of</strong> evidence thathas contributed most importantly to <strong>in</strong>ternational guidel<strong>in</strong>es<strong>and</strong> science-based regulatory policies <strong>in</strong> Europe <strong>and</strong>North America (Samoli et al. 2008; WHO 2005). Meta-analyses<strong>of</strong> time-series studies <strong>and</strong> coord<strong>in</strong>ated multi-centerstudies <strong>of</strong> <strong>the</strong> effect on mortality <strong>of</strong> an <strong>in</strong>crease <strong>in</strong> <strong>the</strong> concentration<strong>of</strong> a given air pollutant (called “effect estimates”,shown here as <strong>the</strong> percent change <strong>in</strong> daily allnatural-causemortality), <strong>in</strong>clud<strong>in</strong>g those from <strong>the</strong> fourPAPA studies, are presented <strong>in</strong> Figure 6.The updated meta-analyses <strong>of</strong> <strong>Asia</strong>n time-series studiespresented <strong>in</strong> this review summarizes results from 82reports published through August 2007, more than threetimes <strong>the</strong> number <strong>in</strong> <strong>the</strong> 2004 review (HEI ISOC 2004), provid<strong>in</strong>gmore reliable <strong>and</strong> detailed estimates <strong>of</strong> <strong>the</strong> magnitude<strong>of</strong> <strong>the</strong> effect <strong>of</strong> exposure on daily mortality <strong>and</strong>hospital admissions <strong>in</strong> <strong>Asia</strong>n populations <strong>and</strong> allow<strong>in</strong>g formore def<strong>in</strong>itive comparisons <strong>of</strong> <strong>Asia</strong>n evidence withresults from o<strong>the</strong>r regions. Short-term exposure to particulatematter (PM) with an aerodynamic diameter 10 µm(PM 10 ) is estimated to <strong>in</strong>crease daily mortality from all naturalcauses by 0.27% (95% confidence <strong>in</strong>terval [CI], 0.12–0.42) per 10-µg/m 3 <strong>in</strong>crease <strong>in</strong> pollutant concentration, aneffect similar to that reported <strong>in</strong> meta-analyses <strong>and</strong> multicitystudies <strong>in</strong> Europe, North America, <strong>and</strong> Lat<strong>in</strong> America.Underly<strong>in</strong>g this estimate is <strong>the</strong> <strong>in</strong>creased daily mortalityfrom cardiovascular disease (chiefly IHD <strong>and</strong> stroke), <strong>the</strong>major current <strong>and</strong> future cause <strong>of</strong> death <strong>of</strong> adults <strong>in</strong> <strong>the</strong>region (Figure 7). Consistently larger exposure-related<strong>in</strong>creases <strong>in</strong> all-natural-cause, cardiovascular, <strong>and</strong> respiratorymortality were also observed among older people,who represent an <strong>in</strong>creas<strong>in</strong>gly large proportion <strong>of</strong> <strong>Asia</strong>npopulations.The PAPA StudiesThe PAPA studies constitute <strong>the</strong> first designed <strong>and</strong> coord<strong>in</strong>atedmulti-city set <strong>of</strong> studies <strong>of</strong> <strong>the</strong> health effects <strong>of</strong> airpollution <strong>in</strong> <strong>Asia</strong>. As such, <strong>the</strong>y provide a unique, if limited,picture <strong>of</strong> <strong>the</strong> short-term impact <strong>of</strong> current ambientconcentrations <strong>of</strong> particulate air pollution on mortality <strong>in</strong>four large metropolitan areas <strong>in</strong> East <strong>and</strong> Sou<strong>the</strong>ast <strong>Asia</strong>:Bangkok, Hong Kong, Shanghai, <strong>and</strong> Wuhan. In <strong>the</strong> comb<strong>in</strong>edanalysis <strong>of</strong> <strong>the</strong> city-specific results (Wong CM et al.2008; Wong CM <strong>and</strong> <strong>the</strong> PAPA Teams 2010a), a 10-µg/m 3<strong>in</strong>crease <strong>in</strong> PM 10 concentration was associated with an<strong>in</strong>crease <strong>of</strong> 0.6% (95% CI, 0.3–0.9) <strong>in</strong> <strong>the</strong> daily rate <strong>of</strong>death from all natural causes, estimates similar to orgreater than those reported <strong>in</strong> multi-city studies <strong>in</strong> <strong>the</strong>United States <strong>and</strong> Europe. This proportional <strong>in</strong>crease <strong>in</strong>daily mortality is seen at levels <strong>of</strong> exposure (mean PM 10concentration, 51.6–141.8 µg/m 3 ) several times higherthan those <strong>in</strong> most large Western cities, <strong>and</strong> <strong>in</strong> each <strong>of</strong> <strong>the</strong>four <strong>Asia</strong>n cities, daily mortality cont<strong>in</strong>ues to <strong>in</strong>creaseover a fairly large range <strong>of</strong> daily average ambient PM 10concentrations, up to several hundred micrograms percubic meter.5
<strong>Outdoor</strong> <strong>Air</strong> <strong>Pollution</strong> <strong>and</strong> <strong>Health</strong> <strong>in</strong> <strong>the</strong> Develop<strong>in</strong>g <strong>Countries</strong> <strong>of</strong> <strong>Asia</strong>: A Comprehensive ReviewExecutive Summary Figure 6. Estimates <strong>of</strong> percent change <strong>in</strong> daily mortality from all natural causes for selected meta-analyses<strong>and</strong> multi-city studies <strong>of</strong> daily changes <strong>in</strong> air pollution exposure, by study type <strong>and</strong> unit change <strong>in</strong> pollutant concentration. TSP istotal suspended particles; SPM is suspended particulate matter; O 3 is ozone; GAM is generalized additive model; PAHO is PanAmerican <strong>Health</strong> Organization; NMMAPS is National Morbidity, Mortality, <strong>and</strong> <strong>Air</strong> <strong>Pollution</strong> Study; APHEA2 is <strong>Air</strong> <strong>Pollution</strong> <strong>and</strong><strong>Health</strong>: A European Approach. [Adapted from Pope <strong>and</strong> Dockery 2006 with estimates added from <strong>the</strong> meta-analysis <strong>in</strong> this <strong>Asia</strong>nLiterature Review (diamond data po<strong>in</strong>ts; see Table 15 <strong>in</strong> <strong>the</strong> ma<strong>in</strong> report).]The summary estimate for PM 10 from <strong>the</strong> four cities <strong>of</strong> <strong>the</strong>PAPA studies exceeds <strong>the</strong> overall meta-analytic summaryestimate for <strong>the</strong> <strong>Asia</strong>n studies for all pollutants <strong>and</strong> outcomes(with <strong>the</strong> exception <strong>of</strong> respiratory mortality, for which <strong>the</strong>PAPA estimates are lower) (Figure 6). The reasons for <strong>the</strong>sedifferences are unclear but may be due to <strong>the</strong> higher estimates<strong>in</strong> Bangkok (for unknown reasons) or <strong>the</strong> systematic selection<strong>and</strong> quality control <strong>of</strong> air quality data accord<strong>in</strong>g to rigorous<strong>and</strong> explicit protocols <strong>in</strong> <strong>the</strong> PAPA studies. Stochastic variation,or <strong>the</strong> play <strong>of</strong> chance, is ano<strong>the</strong>r possible explanation.When <strong>the</strong> PAPA city-specific estimates are added to <strong>the</strong>meta-analyses, <strong>the</strong> summary estimate for all-natural-causemortality per 10-µg/m 3 <strong>in</strong>crease <strong>in</strong> PM 10 becomes 0.33%(95% CI, 0.16–0.51), versus 0.27% (95% CI, 0.12–0.42). Pre-6
Executive Summarylim<strong>in</strong>ary data from <strong>the</strong> PAPA-funded studies <strong>in</strong> two Indiancities, Delhi (Rajarathnam et al. 2010) <strong>and</strong> Chennai (Balakrishnanet al. 2010), also show <strong>in</strong>creased rates <strong>of</strong> all-natural-causemortality <strong>in</strong> association with short-term exposureto PM 10 , though <strong>the</strong> po<strong>in</strong>t estimate for Delhi, 0.15% (95% CI,0.07–0.23) per 10-µg/m 3 <strong>in</strong>crease <strong>in</strong> PM 10 concentration, isroughly half <strong>the</strong> meta-analytic summary estimate.The studies <strong>in</strong> Hong Kong, Wuhan, Shanghai <strong>and</strong>Bangkok were designed to provide a comb<strong>in</strong>ed picture <strong>of</strong><strong>the</strong> effects <strong>of</strong> short-term exposure to pollution on dailymortality across <strong>the</strong> four cities, but each study alsoexplored more detailed aspects <strong>of</strong> <strong>the</strong> epidemiology <strong>of</strong>exposure to air pollution <strong>in</strong> each location, provid<strong>in</strong>g additional<strong>in</strong>sight <strong>in</strong>to how factors such as wea<strong>the</strong>r <strong>and</strong> socialclass might modify <strong>the</strong> estimated relative risk <strong>of</strong> heal<strong>the</strong>ffects <strong>of</strong> air pollution. The study <strong>in</strong> Wuhan, one <strong>of</strong> Ch<strong>in</strong>a’s“oven cities” (cities that experience very high temperatures<strong>and</strong> humidity), found that <strong>the</strong> estimated relative riskmay <strong>in</strong>crease by a factor <strong>of</strong> 5 at extremely high temperatures,as compared with temperatures typical <strong>of</strong> temperatezones (Qian Z et al. 2008, 2010). The studies <strong>in</strong> Hong Kong(Wong CM et al. 2008, 2010b) <strong>and</strong> Shanghai (Kan H et al.2008, 2010) found evidence <strong>of</strong> higher relative risks among<strong>the</strong> economically disadvantaged <strong>and</strong> those with <strong>the</strong> leasteducation, respectively, corroborat<strong>in</strong>g <strong>the</strong> results <strong>of</strong> someearlier studies <strong>in</strong> Western cities (O’Neill et al. 2003).Critical, Quantitative Review <strong>of</strong> Chronic-Effects StudiesThe <strong>Asia</strong>n literature on <strong>the</strong> chronic effects <strong>of</strong> long-termexposure to air pollution is more limited than <strong>the</strong> literaturefrom Europe <strong>and</strong> North America, especially withregard to chronic cardiovascular disease. The design <strong>and</strong>quality <strong>of</strong> <strong>the</strong> studies also vary widely. None<strong>the</strong>less, <strong>the</strong>results <strong>of</strong> this review suggest that long-term exposure to airpollution from combustion sources is contribut<strong>in</strong>g toExecutive Summary Figure 7. Summary effect estimates for all-natural-cause, respiratory, <strong>and</strong> cardiovascularmortality per 10-µg/m 3 change <strong>in</strong> PM 10 concentration. Y-axis labels <strong>in</strong> bold specify <strong>the</strong> cause <strong>of</strong> death <strong>and</strong> <strong>the</strong> agegroup.7
<strong>Outdoor</strong> <strong>Air</strong> <strong>Pollution</strong> <strong>and</strong> <strong>Health</strong> <strong>in</strong> <strong>the</strong> Develop<strong>in</strong>g <strong>Countries</strong> <strong>of</strong> <strong>Asia</strong>: A Comprehensive Reviewchronic respiratory disease <strong>in</strong> both children <strong>and</strong> adults, tolung cancer, <strong>and</strong> to adverse reproductive outcomes <strong>in</strong><strong>Asia</strong>n populations.The prevalence <strong>of</strong> chronic phlegm, a major symptom <strong>of</strong>chronic respiratory disease <strong>in</strong>dicat<strong>in</strong>g long-term exposure to<strong>in</strong>haled irritants, was found to be associated with exposureto combustion-source air pollution both <strong>in</strong> qualitative comparisonsamong areas with differ<strong>in</strong>g concentrations <strong>of</strong> pollution<strong>and</strong> <strong>in</strong> quantitative comparisons <strong>of</strong> measuredconcentrations <strong>of</strong> air pollution. Studies that controlled formajor potential confound<strong>in</strong>g factors, <strong>in</strong>clud<strong>in</strong>g tobaccosmok<strong>in</strong>g <strong>and</strong> <strong>in</strong>door air pollution from <strong>the</strong> burn<strong>in</strong>g <strong>of</strong> solidfuels, reported relative risk estimates generally between 1.1<strong>and</strong> 5.0, regardless <strong>of</strong> how pollution was characterized. Associationswere observed with both PM, measured as PM 10 ,<strong>and</strong> gaseous combustion-source pollutants such as sulfur dioxide(SO 2 ) <strong>and</strong> nitrogen dioxide (NO 2 ). Similar associationswith pollution, after controll<strong>in</strong>g for smok<strong>in</strong>g, have been reported<strong>in</strong> many surveys <strong>in</strong> North America <strong>and</strong> Europe, <strong>in</strong>clud<strong>in</strong>gsome <strong>in</strong> which <strong>the</strong> sources <strong>and</strong> concentrations <strong>of</strong>pollutants were similar to those <strong>in</strong> some <strong>Asia</strong>n cities <strong>in</strong> thisreview. The <strong>in</strong>creased prevalence <strong>of</strong> chronic phlegm wasseen <strong>in</strong> both adults <strong>and</strong> children. In children, although it isnot an <strong>in</strong>dicator <strong>of</strong> chronic bronchitis or COPD (which arediseases <strong>of</strong> later life), chronic phlegm may be correlated withrepeated respiratory <strong>in</strong>fections, which <strong>in</strong> turn may result <strong>in</strong>reduced pulmonary function. Reduced lung function <strong>in</strong>childhood <strong>and</strong> early adulthood is associated with an <strong>in</strong>creasedrisk <strong>of</strong> develop<strong>in</strong>g COPD later <strong>in</strong> life (Fletcher <strong>and</strong>Peto 1977; Rennard <strong>and</strong> Vestbo 2008).Evidence from <strong>Asia</strong> regard<strong>in</strong>g air pollution effects onventilatory lung function is limited, <strong>and</strong> few studies <strong>of</strong>adults have used acceptable methods with regard to test<strong>in</strong>gprotocols or control for <strong>the</strong> effects <strong>of</strong> tobacco smok<strong>in</strong>g. Thestudies <strong>of</strong> children <strong>and</strong> non-smoker adults that have beenconducted suggest adverse effects <strong>of</strong> ambient exposures, butbecause <strong>the</strong>se studies are cross-sectional <strong>and</strong> because <strong>the</strong> airpollution exposures were estimated for whole geographicareas ra<strong>the</strong>r than for <strong>in</strong>dividuals, it is difficult to reach firmconclusions as to <strong>the</strong> impact <strong>of</strong> ambient pollution on pulmonaryfunction. Such cross-sectional studies suggest detrimentaleffects <strong>of</strong> exposure to air pollution on children’slung function, provid<strong>in</strong>g snapshots <strong>of</strong> events that are part<strong>of</strong> a dynamic process that affects lung growth <strong>and</strong> development.Longitud<strong>in</strong>al studies are needed to determ<strong>in</strong>ewhe<strong>the</strong>r <strong>the</strong> cross-sectional associations with air pollutionrepresent a slower-than-normal growth <strong>of</strong> lung functionthat results <strong>in</strong> permanent deficits (<strong>and</strong> might subsequentlylead to an accelerated decl<strong>in</strong>e <strong>in</strong> lung function <strong>in</strong> adulthood)or, as some studies <strong>in</strong> Western countries suggest, atransient worsen<strong>in</strong>g <strong>of</strong> pulmonary function with recovery aspollution concentrations improve. There is also <strong>the</strong> potentialfor residual confound<strong>in</strong>g, such as confound<strong>in</strong>g due to differencesamong factors related to socioeconomic status. Theseproblems are encountered <strong>in</strong> cross-sectional studies <strong>in</strong>Western counties as well as <strong>in</strong> <strong>Asia</strong>.A similarly diverse <strong>and</strong> overlapp<strong>in</strong>g collection <strong>of</strong> studiesalso provides some evidence for an <strong>in</strong>creased prevalence <strong>of</strong>asthma <strong>and</strong> asthma-related symptoms <strong>in</strong> association with exposureto air pollution from a variety <strong>of</strong> sources. Most studiesshow an elevated prevalence <strong>in</strong> association with air pollutionexposure, with estimated relative risks generally greaterthan 1.0 but less than 2 (Figure 8). Studies <strong>of</strong> long-term exposureto ambient air pollutants <strong>and</strong> asthma symptoms <strong>and</strong> diagnosesvary considerably <strong>in</strong> design. Differences <strong>in</strong>exposure have been estimated at between- <strong>and</strong> with<strong>in</strong>-citylevels, with <strong>the</strong> with<strong>in</strong>-city comparisons <strong>in</strong>clud<strong>in</strong>g roadsideexposures. The studies also vary widely <strong>in</strong> terms <strong>of</strong>statistical power, quality <strong>of</strong> exposure assessment, <strong>and</strong> degree<strong>of</strong> control <strong>of</strong> confound<strong>in</strong>g factors. Overall, however,<strong>the</strong> design <strong>and</strong> conduct <strong>of</strong> <strong>the</strong> studies are similar to thosefrom Western countries. Although <strong>the</strong> results <strong>of</strong> <strong>the</strong> studiesreviewed <strong>in</strong> this Special Report are not entirely consistent,<strong>the</strong>re is some evidence for a modest effect <strong>of</strong> air pollutionon asthma prevalence — <strong>and</strong> possibly more evidence than<strong>in</strong> current Western studies. We still know little about <strong>the</strong>reasons for this effect or for <strong>the</strong> observed heterogeneityamong <strong>the</strong> f<strong>in</strong>d<strong>in</strong>gs. Asthma prevalence ranges widelyamong children <strong>in</strong> <strong>Asia</strong>, but this variation seems unlikely,on <strong>the</strong> basis <strong>of</strong> <strong>the</strong> current evidence, to be expla<strong>in</strong>ed by <strong>the</strong>correspond<strong>in</strong>g range <strong>of</strong> ambient air pollution concentrations(Anderson et al. 2010).There is limited evidence regard<strong>in</strong>g air pollution <strong>and</strong>lung cancer <strong>in</strong> <strong>Asia</strong>n populations. The two studies that haveaddressed potential confound<strong>in</strong>g by strong risk factors, suchas tobacco smok<strong>in</strong>g <strong>and</strong> <strong>in</strong>door air pollution from <strong>the</strong>burn<strong>in</strong>g <strong>of</strong> solid fuels, report relative risks for lung cancer <strong>in</strong><strong>the</strong> range <strong>of</strong> 1.5 to 3.0, consistent with those from studies <strong>in</strong>Europe <strong>and</strong> North America; but more def<strong>in</strong>itive evidencewill require larger studies that directly assess <strong>the</strong> effects <strong>of</strong>exposure us<strong>in</strong>g measured, ra<strong>the</strong>r than estimated, concentrations<strong>of</strong> air pollutants (at <strong>the</strong> higher concentrations) <strong>and</strong> thatadequately control for potential confounders.The <strong>Asia</strong>n literature suggests that <strong>the</strong> risks <strong>of</strong> adversereproductive outcomes, such as low birth weight <strong>and</strong> pretermdelivery, <strong>in</strong> association with exposure to air pollutionare relatively small. Overall, <strong>the</strong> estimated relative risksare between 1.04 <strong>and</strong> 2.0. Exposure <strong>in</strong> early pregnancyappears to be most strongly associated with risk. Theseresults are generally consistent with those from <strong>the</strong> largerglobal literature on air pollution <strong>and</strong> adverse pregnancyoutcomes. However, <strong>the</strong> <strong>Asia</strong>n studies, like those con-8
Executive SummaryExecutive Summary Figure 8. Odds ratios (<strong>and</strong> 95% CIs) for asthma or wheeze from qualitative comparisons between areas withdiffer<strong>in</strong>g pollutant concentrations <strong>in</strong> studies <strong>of</strong> urban <strong>and</strong> rural locations, or between or with<strong>in</strong> cities. Y-axis labels give study <strong>in</strong>formation<strong>in</strong> <strong>the</strong> follow<strong>in</strong>g sequence: reference citation; location, outcome, pollutant levels or areas that were compared; <strong>and</strong> sex <strong>of</strong> subjects(female; male; or comb<strong>in</strong>ed). Possible outcomes were A-r (doctor-diagnosed or self-reported asthma with<strong>in</strong> <strong>the</strong> last 3 years), A-rns (doctor-diagnosed or self-reported asthma, whose time <strong>of</strong> diagnosis or self-report<strong>in</strong>g was unspecified or not recent), W-r (wheezesymptoms reported with<strong>in</strong> <strong>the</strong> last 3 years), W-rns (wheeze symptoms whose time <strong>of</strong> report<strong>in</strong>g is unspecified or not recent) or a comb<strong>in</strong>ation<strong>of</strong> asthma <strong>and</strong> wheeze (A+W-r <strong>and</strong> A+W-rns). CO is carbon monoxide; TSP is total suspended particles. A log scale is usedon <strong>the</strong> x axis to accommodate <strong>the</strong> range <strong>of</strong> estimates. Two studies reported “no significant association” with no odds ratio; data po<strong>in</strong>tsare shown here as triangles without CIs. For study details, see Table 19 <strong>of</strong> <strong>the</strong> ma<strong>in</strong> report.ducted elsewhere, are limited by <strong>in</strong>complete control forpotential confounders, such as maternal smok<strong>in</strong>g, <strong>and</strong> aresubject to exposure measurement error ow<strong>in</strong>g to <strong>the</strong> use <strong>of</strong>rout<strong>in</strong>ely collected health <strong>and</strong> air quality data. Somestudies have reported <strong>the</strong> risk per quantitative <strong>in</strong>creases <strong>in</strong>pollutant concentrations, but most have <strong>in</strong>stead characterizedexposure <strong>in</strong> terms <strong>of</strong> residential proximity to sources<strong>of</strong> pollution, ma<strong>in</strong>ly <strong>in</strong>dustrial sources, thus limit<strong>in</strong>g comparisons<strong>of</strong> <strong>the</strong>se studies with <strong>the</strong> larger <strong>in</strong>ternational body<strong>of</strong> studies that use ambient air pollution measurements tocharacterize exposure.IMPLICATIONS FOR ASSESSMENT OFHEALTH IMPACTSVery large populations are exposed to high concentrations<strong>of</strong> air pollution <strong>in</strong> develop<strong>in</strong>g <strong>Asia</strong>. Indeed, 30 millionpeople currently reside <strong>in</strong> just <strong>the</strong> first four citiesstudied <strong>in</strong> <strong>the</strong> PAPA research project. Thus, <strong>the</strong> estimatedeffects <strong>of</strong> both short- <strong>and</strong> longer-term exposures reviewed<strong>in</strong> this report, though small <strong>in</strong> relative terms, probablytranslate to large numbers <strong>of</strong> illnesses <strong>and</strong> deaths attributableto air pollution. The WHO estimated that over500,000 deaths <strong>in</strong> <strong>Asia</strong> <strong>in</strong> 2000 were due to outdoor airpollution exposure, account<strong>in</strong>g for approximately twothirds <strong>of</strong> <strong>the</strong> total global burden <strong>of</strong> deaths attributed to airpollution (WHO 2002). Indoor air pollution from use <strong>of</strong>solid fuel contributed an additional 1.1 million deaths.O<strong>the</strong>r impact assessments have reported similar estimates(World Bank <strong>and</strong> <strong>the</strong> Ch<strong>in</strong>ese State Environmental ProtectionAdm<strong>in</strong>istration [SEPA] 2007). That said, air pollutionis but one <strong>of</strong> many factors that affect <strong>the</strong> health <strong>of</strong> people <strong>in</strong>develop<strong>in</strong>g <strong>Asia</strong> (Ezzati et al. 2002). None<strong>the</strong>less, <strong>the</strong> substantialhealth impacts <strong>of</strong> exposure to air pollution areclearly a factor that should be considered <strong>in</strong> transportation<strong>and</strong> energy policy <strong>in</strong> <strong>the</strong> region.9
<strong>Outdoor</strong> <strong>Air</strong> <strong>Pollution</strong> <strong>and</strong> <strong>Health</strong> <strong>in</strong> <strong>the</strong> Develop<strong>in</strong>g <strong>Countries</strong> <strong>of</strong> <strong>Asia</strong>: A Comprehensive ReviewIn <strong>Asia</strong> <strong>and</strong> elsewhere, an <strong>in</strong>creased life expectancy is amajor social benefit <strong>of</strong> economic growth <strong>and</strong> its attendant, if<strong>of</strong>ten variable, reductions <strong>in</strong> poverty. Exposure to air pollutionacts to reduce healthy life expectancy, shorten<strong>in</strong>g livesby months <strong>and</strong> even years, on average, <strong>in</strong> some populations(Brunekreef et al. 2007). Although <strong>the</strong> time-series studiesreviewed here document <strong>the</strong> occurrence <strong>of</strong> excess mortalityrelated to short-term exposure, <strong>the</strong> study results cannot currentlybe used directly to estimate reductions <strong>in</strong> life expectancydue to extended exposure (Rabl 2006; Burnett et al.2003). Such estimates are provided by cohort studies, <strong>in</strong>which large numbers <strong>of</strong> <strong>in</strong>dividuals exposed to various concentrations<strong>of</strong> air pollution are observed for years <strong>and</strong> <strong>the</strong>mortality rates <strong>in</strong> each exposure group are compared. Suchstudies have been conducted <strong>in</strong> <strong>the</strong> United States <strong>and</strong>Western Europe, but to date, no cohort studies <strong>of</strong> long-termexposure to air pollution <strong>and</strong> mortality from chronic cardiovascularor respiratory disease appear to have been reported<strong>in</strong> <strong>Asia</strong>. As a result, recent estimates <strong>of</strong> <strong>the</strong> health impacts <strong>of</strong>air pollution <strong>in</strong> <strong>Asia</strong> (WHO 2002; World Bank <strong>and</strong> SEPA2007) are based on <strong>the</strong> results <strong>of</strong> a s<strong>in</strong>gle U.S. study (Pope etal. 2002).The broad consistency <strong>of</strong> <strong>the</strong> results <strong>of</strong> <strong>Asia</strong>n time-seriesstudies <strong>of</strong> mortality with those <strong>in</strong> Europe <strong>and</strong> NorthAmerica, <strong>in</strong>clud<strong>in</strong>g <strong>the</strong> evidence <strong>of</strong> greater rates <strong>of</strong> cardiovascularmorbidity <strong>and</strong> mortality among older people thanamong younger people, supports <strong>the</strong> cont<strong>in</strong>ued use <strong>of</strong> datafrom Western cohort studies to estimate <strong>the</strong> <strong>Asia</strong>n burden<strong>of</strong> disease attributable to air pollution. However, develop<strong>in</strong>g<strong>Asia</strong> currently differs from <strong>the</strong> United States <strong>and</strong>Europe with regard to energy use, air quality, <strong>and</strong> populationhealth, which are also dynamically chang<strong>in</strong>g. Thus,estimates <strong>of</strong> <strong>the</strong> impact <strong>of</strong> air pollution that are based on even<strong>the</strong> most carefully executed U.S. studies must be used withcaution. One key area <strong>of</strong> uncerta<strong>in</strong>ty is <strong>the</strong> shape <strong>of</strong> <strong>the</strong> concentration–responsefunction relat<strong>in</strong>g long-term exposure toair pollution <strong>and</strong> mortality from chronic disease. The concentrations<strong>of</strong> PM with an aerodynamic diameter 2.5 µm(PM 2.5 ) studied <strong>in</strong> <strong>the</strong> American Cancer Society (ACS) study(Pope et al. 2002) were much lower than <strong>the</strong> concentrations<strong>in</strong> major cities <strong>in</strong> Ch<strong>in</strong>a <strong>and</strong> India, requir<strong>in</strong>g that analystsextrapolat<strong>in</strong>g <strong>the</strong> ACS data to <strong>Asia</strong> make projectionsregard<strong>in</strong>g <strong>the</strong> shape <strong>of</strong> <strong>the</strong> concentration–response functionat much higher concentrations. The uncerta<strong>in</strong>ty <strong>in</strong> <strong>the</strong>result<strong>in</strong>g estimates, when quantified <strong>in</strong> sensitivity analyses,was substantial (Cohen et al. 2004).KNOWLEDGE GAPS AND RESEARCH NEEDSThe acute toxicity <strong>of</strong> short-term exposure to high air pollutionconcentrations has been appreciated s<strong>in</strong>ce <strong>the</strong> early20th century, <strong>and</strong> recent multi-city studies <strong>in</strong> Europe <strong>and</strong>North America have identified toxic effects at even lowerconcentrations. Therefore, <strong>the</strong> results <strong>of</strong> meta-analyses <strong>of</strong><strong>Asia</strong>n time-series studies <strong>of</strong> daily mortality <strong>and</strong> hospitaladmissions are not unexpected <strong>and</strong> can serve as an importantpart <strong>of</strong> <strong>the</strong> scientific basis <strong>and</strong> rationale for <strong>in</strong>terventionsto improve air quality. Never<strong>the</strong>less, <strong>the</strong>re is muchwe still need to learn <strong>in</strong> order to fully underst<strong>and</strong> <strong>the</strong> substantialair pollution challenges <strong>in</strong> <strong>Asia</strong>, <strong>and</strong> high-quality,credible science from locally relevant studies will be criticalto help<strong>in</strong>g decision makers choose which policies aremost likely to result <strong>in</strong> public health benefits.How Does <strong>the</strong> Nature <strong>of</strong> <strong>the</strong> <strong>Air</strong> <strong>Pollution</strong> Mixture Affect<strong>Air</strong> Quality, Exposure, <strong>and</strong> <strong>Health</strong> Effects?<strong>Health</strong> impacts <strong>in</strong> cities <strong>in</strong> develop<strong>in</strong>g countries <strong>of</strong> <strong>Asia</strong>result from exposure to a mixture <strong>of</strong> pollutants, both particles<strong>and</strong> gases, which are derived <strong>in</strong> large part from combustionsources (Harrison 2006). This is true <strong>in</strong> Europe <strong>and</strong>North America as well, but <strong>the</strong> specific sources <strong>and</strong> <strong>the</strong>irproportional contributions <strong>in</strong> <strong>Asia</strong> are different. Time–activity patterns, build<strong>in</strong>g characteristics, <strong>and</strong> proximity<strong>of</strong> susceptible populations to pollution sources <strong>in</strong> <strong>the</strong>region also differ from those <strong>in</strong> Western countries <strong>in</strong> waysthat may affect human exposure <strong>and</strong> health effects. Ourcurrent knowledge <strong>of</strong> <strong>the</strong>se issues is rudimentary, basedlargely on studies <strong>of</strong> <strong>in</strong>dividual pollutants, <strong>and</strong> additionalresearch is needed to <strong>in</strong>form effective <strong>and</strong> susta<strong>in</strong>able controlstrategies. Without such studies, epidemiologists willhave a difficult time assess<strong>in</strong>g <strong>the</strong> relative effects <strong>of</strong> variouspollution mixtures or specific pollution sources oreven <strong>in</strong>terpret<strong>in</strong>g patterns <strong>of</strong> variation.What Are <strong>the</strong> Effects <strong>of</strong> Long-Term Exposure to <strong>Air</strong><strong>Pollution</strong>?Although time-series studies will cont<strong>in</strong>ue to be importantpotential drivers <strong>of</strong> environmental <strong>and</strong> public policy,additional study designs, such as recent U.S. <strong>and</strong> Europeancohort studies, are needed <strong>in</strong> <strong>Asia</strong> to estimate <strong>the</strong>effects <strong>of</strong> long-term exposure on annual average rates <strong>of</strong>mortality from chronic cardiovascular or respiratory diseases<strong>and</strong> impacts on life expectancy, <strong>the</strong> metrics that maybe <strong>the</strong> most mean<strong>in</strong>gful <strong>and</strong> relevant to policy.Conduct<strong>in</strong>g such studies will be challeng<strong>in</strong>g, not leastbecause <strong>of</strong> rapidly chang<strong>in</strong>g air pollution concentrations<strong>and</strong> exposures <strong>in</strong> develop<strong>in</strong>g <strong>Asia</strong>, although as some U.S.studies suggest, if chronic effects are due to recent exposure,this problem may not be severe. Recent exposure willalso be most relevant <strong>in</strong> studies <strong>of</strong> adverse reproductiveoutcomes <strong>and</strong> effects on <strong>the</strong> health <strong>of</strong> young children. Adetailed quantitative review <strong>of</strong> <strong>the</strong> larger <strong>Asia</strong>n literature10
Executive Summary(<strong>in</strong>clud<strong>in</strong>g cross-sectional studies <strong>of</strong> chronic respiratorydisease <strong>and</strong> studies <strong>of</strong> lung cancer <strong>and</strong> adverse reproductiveoutcomes) may better <strong>in</strong>form extrapolations <strong>of</strong> <strong>the</strong>results from <strong>the</strong> Western studies; <strong>the</strong> same may be true <strong>of</strong><strong>the</strong> concentration–response functions describ<strong>in</strong>g shorttermexposure <strong>and</strong> daily mortality recently reported forthree Ch<strong>in</strong>ese cities (Wong CM et al. 2008; Wong CM <strong>and</strong><strong>the</strong> PAPA Teams 2010a), but long-term <strong>Asia</strong>n studies willprovide <strong>the</strong> most direct evidence. It may be possible to“retr<strong>of</strong>it” exist<strong>in</strong>g <strong>Asia</strong>n cohort studies, orig<strong>in</strong>allydesigned to address issues o<strong>the</strong>r than air pollution, wi<strong>the</strong>stimates <strong>of</strong> air pollution exposure, <strong>the</strong> approach used <strong>in</strong><strong>the</strong> ACS study. Retr<strong>of</strong>itt<strong>in</strong>g studies requires <strong>the</strong> build<strong>in</strong>g <strong>of</strong>multidiscipl<strong>in</strong>ary teams <strong>of</strong> <strong>in</strong>vestigators, with commitment<strong>of</strong> adequate, long-term resources, to work <strong>in</strong> collaborationwith government <strong>of</strong>ficials, <strong>the</strong>ir <strong>in</strong>dustrialcounterparts, <strong>and</strong> local stakeholders. In order to assess <strong>the</strong>current potential for such studies, HEI’s PAPA programissued a Request for Information <strong>and</strong> Qualifications(<strong>Health</strong> Effects Institute 2009) for teams <strong>of</strong> <strong>in</strong>vestigators toconduct such studies <strong>in</strong> develop<strong>in</strong>g countries <strong>of</strong> <strong>Asia</strong>.Based on <strong>the</strong> responses, <strong>the</strong>y concluded that <strong>the</strong> potentialexists <strong>in</strong> several locations.What Do Results <strong>of</strong> Current Time-Series Studies <strong>in</strong> aSubset <strong>of</strong> <strong>Asia</strong>n Cities Tell Us About <strong>Health</strong> Effects <strong>of</strong> <strong>Air</strong><strong>Pollution</strong> Exposure <strong>in</strong> O<strong>the</strong>r, As Yet Unstudied, <strong>Asia</strong>nLocales?The numbers <strong>of</strong> time-series studies be<strong>in</strong>g reported fromacross <strong>Asia</strong> is grow<strong>in</strong>g; <strong>the</strong> first Indian studies <strong>of</strong> shorttermexposure to respirable suspended particles (RSP) <strong>and</strong>daily mortality, part <strong>of</strong> <strong>the</strong> PAPA research program, willsoon be published (Balakrishnan et al. 2010; Rajarathnamet al. 2010). Even so, almost all current studies have beenconducted <strong>in</strong> ma<strong>in</strong>l<strong>and</strong> Ch<strong>in</strong>a, Taipei,Ch<strong>in</strong>a, <strong>and</strong> SouthKorea. Major population centers <strong>in</strong> South <strong>and</strong> Sou<strong>the</strong>ast<strong>Asia</strong> (India, Pakistan, Vietnam, Philipp<strong>in</strong>es, Indonesia,<strong>and</strong> Malaysia) are still largely understudied (with <strong>the</strong>exception <strong>of</strong> Bangkok). Differences <strong>in</strong> <strong>the</strong> relative prevalence<strong>of</strong> urban air pollution sources (such as open burn<strong>in</strong>g)<strong>and</strong> urban poverty may modify <strong>the</strong> effects <strong>of</strong> exposure.Exp<strong>and</strong>ed coord<strong>in</strong>ated multi-city studies, designed <strong>and</strong>analyzed consistently <strong>and</strong> conducted across <strong>the</strong> region,could provide more def<strong>in</strong>itive answers. In some cases, outcomeso<strong>the</strong>r than mortality, such as hospital admissions,may also be studied, enabl<strong>in</strong>g policy makers to betterquantify <strong>the</strong> health impacts <strong>of</strong> air pollution.What Role Does Indoor <strong>Air</strong> <strong>Pollution</strong> Play <strong>in</strong> <strong>the</strong> <strong>Health</strong>Effects <strong>of</strong> <strong>Outdoor</strong> <strong>Air</strong> <strong>Pollution</strong>?The magnitude <strong>and</strong> prevalence <strong>of</strong> exposure to <strong>in</strong>door airpollution are high <strong>in</strong> <strong>Asia</strong>n cities, especially among peopleliv<strong>in</strong>g <strong>in</strong> poverty. We need a better underst<strong>and</strong><strong>in</strong>g <strong>of</strong> how airpollution from <strong>in</strong>door sources contributes to concentrations<strong>of</strong> outdoor air pollution <strong>and</strong> how <strong>in</strong>door exposure to air pollutionfrom <strong>in</strong>door sources affects risk estimates for outdoorair pollution. Coord<strong>in</strong>ated measurements <strong>of</strong> exposure <strong>and</strong>coord<strong>in</strong>ated epidemiologic studies will be needed to address<strong>the</strong>se questions.What Role Does Poverty Play <strong>in</strong> <strong>the</strong> <strong>Health</strong> Effects <strong>of</strong> <strong>Air</strong><strong>Pollution</strong>?Limited evidence, largely from studies <strong>in</strong> Europe <strong>and</strong>North America, suggests that economic deprivation<strong>in</strong>creases <strong>the</strong> rates <strong>of</strong> morbidity <strong>and</strong> mortality related to airpollution. One reason may be <strong>the</strong> higher air pollutionexposures that people <strong>of</strong> lower socioeconomic status experience.The degree <strong>of</strong> vulnerability can also be affected byfactors related to socioeconomic status, such as health,nutritional status, <strong>and</strong> access to medical services. Studies<strong>of</strong> <strong>the</strong>se issues are relatively rare <strong>in</strong> <strong>Asia</strong>, where extremepoverty is more prevalent than <strong>in</strong> <strong>the</strong> West, so that results<strong>of</strong> <strong>the</strong> Western studies cannot be simply extrapolated,though <strong>the</strong> recent results <strong>of</strong> <strong>the</strong> PAPA studies <strong>in</strong> Shanghai<strong>and</strong> Hong Kong are welcome <strong>and</strong> much-needed additions(Kan H et al. 2008, 2010; Wong CM et al. 2008, 2010b).Some analyses <strong>of</strong> U.S. cohort studies suggest that lowlevels <strong>of</strong> atta<strong>in</strong>ed education were associated with largerestimated relative risks <strong>of</strong> air pollution–related mortality(Krewski et al. 2000), but more recent analyses based onextended follow-up <strong>of</strong> <strong>the</strong> largest cohort have not upheldthis pattern (Krewski et al. 2009). Studies <strong>in</strong> <strong>Asia</strong> thatexam<strong>in</strong>e <strong>the</strong> effect <strong>of</strong> exposure on morbidity <strong>and</strong> mortalityfrom diseases associated with poverty (such as acute lowerrespiratory <strong>in</strong>fection <strong>in</strong> children, <strong>and</strong> tuberculosis) <strong>and</strong>studies that estimate effects <strong>of</strong> exposure across socioeconomicstrata are needed. HEI’s recently completed study <strong>of</strong>hospital admissions for acute lower respiratory <strong>in</strong>fection<strong>in</strong> children <strong>in</strong> Ho Chi M<strong>in</strong>h City is, to our knowledge, <strong>the</strong>only example <strong>of</strong> such a study (Collaborative Work<strong>in</strong>gGroup on <strong>Air</strong> <strong>Pollution</strong>, Poverty, <strong>and</strong> <strong>Health</strong> <strong>in</strong> Ho ChiM<strong>in</strong>h City 2009).What Are <strong>the</strong> <strong>Health</strong> Consequences <strong>of</strong> Changes <strong>in</strong> <strong>Air</strong><strong>Pollution</strong> Result<strong>in</strong>g from Climate Change <strong>and</strong> Efforts toReduce Emissions <strong>of</strong> Climate-Forc<strong>in</strong>g Agents?Changes <strong>in</strong> air pollution result<strong>in</strong>g from climate change<strong>and</strong> from efforts to reduce emissions <strong>of</strong> climate-forc<strong>in</strong>gagents may have important consequences for health <strong>in</strong> <strong>the</strong>11
<strong>Outdoor</strong> <strong>Air</strong> <strong>Pollution</strong> <strong>and</strong> <strong>Health</strong> <strong>in</strong> <strong>the</strong> Develop<strong>in</strong>g <strong>Countries</strong> <strong>of</strong> <strong>Asia</strong>: A Comprehensive Reviewregion, especially <strong>in</strong> low- <strong>and</strong> middle-<strong>in</strong>come countries.However, major unknowns rema<strong>in</strong>, <strong>in</strong>clud<strong>in</strong>g (1) <strong>the</strong> quantitativeassociation between reductions <strong>in</strong> <strong>the</strong> concentrations<strong>of</strong> GHGs (such as carbon dioxide) <strong>and</strong> toxic airpollutants such as (PM 2.5 ), (2) <strong>the</strong> relative toxicity <strong>of</strong> shortlivedgreenhouse pollutants with opposite climate-forc<strong>in</strong>gpotentials (such as sulfate <strong>and</strong> black carbon), <strong>and</strong> (3) <strong>the</strong>impact <strong>of</strong> policy choices. There is also a need to underst<strong>and</strong>more fully how concentration–response functionsfor air pollution may vary with regard to global <strong>and</strong>with<strong>in</strong>-region differences <strong>in</strong> climate, demographics, <strong>and</strong>pollutant mixes.F<strong>in</strong>ally, although <strong>the</strong> ability to conduct research on <strong>the</strong>health effects <strong>of</strong> air pollution <strong>in</strong> develop<strong>in</strong>g <strong>Asia</strong> isimprov<strong>in</strong>g, it is still constra<strong>in</strong>ed by limitations <strong>in</strong> environmental<strong>and</strong> public health <strong>in</strong>frastructures. <strong>Air</strong> quality monitor<strong>in</strong>ghas <strong>in</strong>creased <strong>in</strong> <strong>the</strong> region, but <strong>the</strong>re is a need formore extensive monitor<strong>in</strong>g <strong>of</strong> urban air quality designed tosupport health effects studies <strong>and</strong> impact assessments <strong>and</strong> acorrespond<strong>in</strong>g need for more highly tra<strong>in</strong>ed pr<strong>of</strong>essionals <strong>in</strong>air quality monitor<strong>in</strong>g, exposure assessment, <strong>and</strong> environmentalepidemiology. Equally important, <strong>the</strong>re rema<strong>in</strong> considerabledeficiencies <strong>in</strong> registration <strong>of</strong> vital statistics <strong>in</strong> <strong>Asia</strong>,especially regard<strong>in</strong>g accurate <strong>and</strong> comprehensive assignment<strong>of</strong> causes <strong>of</strong> death. There is also a need to encourage cooperation<strong>and</strong> collaboration <strong>in</strong> health effects research betweenhealth <strong>and</strong> environmental scientists <strong>and</strong> public agencies.These deficiencies constitute a major impediment to environmentalhealth research <strong>and</strong>, more broadly, to <strong>the</strong> development<strong>of</strong> appropriate, evidence-based public health policy.SUMMARY AND CONCLUSIONS: ENHANCEDEVIDENCE OF EFFECTS OF AIR POLLUTIONIN ASIABased on f<strong>in</strong>d<strong>in</strong>gs from more than 80 <strong>Asia</strong>n time-seriesstudies, <strong>in</strong>clud<strong>in</strong>g coord<strong>in</strong>ated multi-city time-seriesstudies, <strong>the</strong> meta-analytic estimates appear consistent <strong>in</strong>both direction <strong>and</strong> magnitude with those from o<strong>the</strong>rregions. In broad terms, <strong>the</strong> effects <strong>of</strong> short-term exposure<strong>in</strong> <strong>Asia</strong>n cities are on a par with those observed <strong>in</strong> hundreds<strong>of</strong> studies worldwide. The same pollutants — RSP<strong>and</strong> gaseous pollutants such as ozone (O 3 ), SO 2 , <strong>and</strong> NO 2— affect older people with chronic cardiovascular or respiratorydisease. The adverse effects <strong>in</strong> some locales,reported <strong>in</strong> studies published <strong>in</strong> <strong>the</strong> 1980s <strong>and</strong> 1990s, mayreflect <strong>the</strong> effects <strong>of</strong> air pollution concentrations that havesubsequently decreased. However, more recent studiescont<strong>in</strong>ue to report adverse effects at lower levels <strong>in</strong> cities<strong>in</strong> Thail<strong>and</strong> <strong>and</strong> Japan, where air quality has improved, aswell as <strong>in</strong> heavily polluted Ch<strong>in</strong>ese <strong>and</strong> Indian cities.The results <strong>of</strong> our meta-analyses <strong>of</strong> time-series studiesshould serve to reduce concerns regard<strong>in</strong>g <strong>the</strong> generalizability<strong>of</strong> <strong>the</strong> results <strong>of</strong> <strong>the</strong> substantial, but largely Western,literature on <strong>the</strong> effects <strong>of</strong> short-term exposure to air pollution.They suggest that nei<strong>the</strong>r genetic factors nor longertermexposure to highly polluted air substantially modifies<strong>the</strong> effect <strong>of</strong> short-term exposure on daily mortality rates <strong>in</strong>major cities <strong>in</strong> develop<strong>in</strong>g <strong>Asia</strong>. This provides support for<strong>the</strong> notion, implicit <strong>in</strong> <strong>the</strong> approach taken <strong>in</strong> sett<strong>in</strong>g <strong>the</strong>WHO world air quality guidel<strong>in</strong>es (Krzyzanowski <strong>and</strong>Cohen 2008), that <strong>in</strong>cremental improvements <strong>in</strong> air qualityare expected to improve health, even <strong>in</strong> areas with relativelyhigh ambient concentrations. The results also suggestthat health benefits would result from fur<strong>the</strong>rreductions <strong>in</strong> exposure to pollution concentrations belowthose specified <strong>in</strong> <strong>the</strong> WHO guidel<strong>in</strong>es.The results <strong>of</strong> <strong>the</strong> chronic-effects studies reviewed <strong>in</strong>this report appear to be broadly consistent with those <strong>of</strong>studies <strong>in</strong> o<strong>the</strong>r regions, suggest<strong>in</strong>g that long-term exposureto air pollution promotes chronic pulmonary disease<strong>and</strong> o<strong>the</strong>r adverse effects that result <strong>in</strong> reduced life expectancy.Never<strong>the</strong>less, <strong>the</strong>se studies are more susceptible than<strong>the</strong> time-series studies to uncontrolled confound<strong>in</strong>g bystrong risk factors, such as tobacco smok<strong>in</strong>g, <strong>in</strong>door airpollution from <strong>the</strong> burn<strong>in</strong>g <strong>of</strong> solid fuels, <strong>and</strong> factorsrelated to socioeconomic status, such as diet. These riskfactors may also modulate <strong>the</strong> effect <strong>of</strong> air pollution,lead<strong>in</strong>g to larger effects <strong>in</strong> some population groups <strong>and</strong>smaller effects <strong>in</strong> o<strong>the</strong>rs. Some <strong>of</strong> <strong>the</strong>se factors, such asthose related to <strong>the</strong> level <strong>of</strong> economic development, maybe particularly important <strong>in</strong> develop<strong>in</strong>g <strong>Asia</strong>. If <strong>the</strong>y areignored or poorly measured, an <strong>in</strong>accurate estimate <strong>of</strong> <strong>the</strong>effects <strong>of</strong> air pollution may result, <strong>and</strong> real differencesamong study results <strong>in</strong> various regions may be obscured.This literature review documents a number <strong>of</strong> promis<strong>in</strong>gimprovements <strong>in</strong> air quality <strong>in</strong> <strong>Asia</strong>n cities, even <strong>in</strong> <strong>the</strong> context<strong>of</strong> economic growth. However, susceptibility to <strong>the</strong> effects<strong>of</strong> air pollution <strong>in</strong> <strong>Asia</strong> can be expected to rise becauserates <strong>of</strong> chronic cardiovascular <strong>and</strong> respiratory disease <strong>in</strong>creaseas populations age, exposure to combustion-sourceair pollution becomes more widespread ow<strong>in</strong>g to urbanization,vehicularization, <strong>and</strong> <strong>in</strong>dustrialization, <strong>and</strong> risk factors<strong>in</strong>crease <strong>in</strong> prevalence. In future assessments, <strong>the</strong>se changesmay yield larger health impacts <strong>in</strong> <strong>the</strong> region, although <strong>the</strong>effects <strong>of</strong> <strong>the</strong>se changes could be counterbalanced by improvedaccess to medical care <strong>and</strong> o<strong>the</strong>r improvements <strong>in</strong><strong>the</strong> st<strong>and</strong>ard <strong>of</strong> liv<strong>in</strong>g. Higher estimates <strong>of</strong> <strong>the</strong> magnitude <strong>of</strong>air pollution effects may also contribute to larger impact estimates.For example, <strong>the</strong> most recent publication from <strong>the</strong>ACS study (Krewski et al. 2009) reported larger estimates <strong>of</strong>12
Executive Summary<strong>the</strong> risks <strong>of</strong> cardiovascular mortality <strong>and</strong> lung cancer thanpreviously reported.This review demonstrates that <strong>the</strong> <strong>in</strong>formation on <strong>the</strong>health effects <strong>of</strong> air pollution <strong>in</strong> develop<strong>in</strong>g <strong>Asia</strong> is substantial<strong>and</strong> cont<strong>in</strong>ues to grow <strong>in</strong> both size <strong>and</strong> quality. Assuch, it provides an <strong>in</strong>creas<strong>in</strong>gly confident base <strong>of</strong> scientificevidence to <strong>in</strong>form critical decisions <strong>in</strong> <strong>the</strong> regionregard<strong>in</strong>g policies to protect public health while fur<strong>the</strong>r<strong>in</strong>geconomic development. Important gaps still rema<strong>in</strong> <strong>in</strong> <strong>the</strong>range <strong>of</strong> <strong>Asia</strong>n sett<strong>in</strong>gs studied <strong>and</strong> <strong>in</strong> <strong>the</strong> types <strong>of</strong> studiesthat need to be conducted <strong>in</strong> order to fully <strong>in</strong>form publicpolicy decisions. This need will only grow as <strong>the</strong> attention<strong>of</strong> policy makers <strong>and</strong> <strong>the</strong> public <strong>in</strong>creas<strong>in</strong>gly focuses onissues <strong>of</strong> regional importance, such as climate change <strong>and</strong>transboundary air pollution. HEI <strong>in</strong>tends that <strong>the</strong> publication<strong>of</strong> this Special Report, <strong>and</strong> cont<strong>in</strong>ued fund<strong>in</strong>g <strong>of</strong> a targetedprogram <strong>of</strong> research <strong>in</strong> <strong>Asia</strong> under <strong>the</strong> PAPAprogram, will improve underst<strong>and</strong><strong>in</strong>g <strong>of</strong> <strong>the</strong> problemsposed by air pollution <strong>in</strong> <strong>Asia</strong> <strong>and</strong> will fur<strong>the</strong>r develop <strong>the</strong>capacity <strong>of</strong> <strong>Asia</strong>n scientists to conduct additional scientificresearch toward solutions.REFERENCESAggarwal AN, Chaudhry K, Chhabra SK, D’Souza GA,Gupta D, J<strong>in</strong>dal SK, Katiyar SK, Kumar R, Shah B, VijayanVK for Asthma Epidemiology Study Group. 2006. Prevalence<strong>and</strong> risk factors for bronchial asthma <strong>in</strong> Indianadults: A multicentre study. Indian J Chest Dis Allied Sci48:13–22.Anderson HR, Ruggles R, P<strong>and</strong>ey KD, Kapetanakis V,Brunekreef B, Lai CK, Strachan DP, Weil<strong>and</strong> SK. 2010.Ambient particulate pollution <strong>and</strong> <strong>the</strong> world-wide prevalence<strong>of</strong> asthma, rh<strong>in</strong>oconjunctivitis <strong>and</strong> eczema <strong>in</strong> children:Phase one <strong>of</strong> <strong>the</strong> International Study <strong>of</strong> Asthma <strong>and</strong>Allergies <strong>in</strong> Childhood (ISAAC). Occup Environ Med67:293–300.Anderson HR, Atk<strong>in</strong>son RW, Peacock JL, Sweet<strong>in</strong>g MJ,Marston L. 2005. Ambient particulate matter <strong>and</strong> heal<strong>the</strong>ffects — Publication bias <strong>in</strong> studies <strong>of</strong> short-term associations.Epidemiology 16:155–163.Balakrishnan K, Ganguli B, Ghosh S, Sankar S, ThanasekaraanV, Rayudu VN, Caussy H. 2010. Short-TermEffects <strong>of</strong> <strong>Air</strong> <strong>Pollution</strong> on Mortality: Results from a Time-Series Analysis <strong>in</strong> Chennai, India. Research Report. <strong>Health</strong>Effects Institute, Boston, MA. In Press.Bell ML, McDermott A, Zeger SL, Samet JM, Dom<strong>in</strong>ici F.2004a. Ozone <strong>and</strong> short-term mortality <strong>in</strong> 95 US urbancommunities, 1987–2000. JAMA 292:2372–2378.Brunekreef B, Miller BG, Hurley JF. 2007. The brave newworld <strong>of</strong> lives sacrificed <strong>and</strong> saved, deaths attributed <strong>and</strong>avoided. Epidemiology 18:785–788.Burnett RT, Dewanji A, Dom<strong>in</strong>ici F, Goldberg MS, CohenA, Krewski D. 2003. On <strong>the</strong> relationship between timeseriesstudies, dynamic population studies, <strong>and</strong> estimat<strong>in</strong>gloss <strong>of</strong> life due to short-term exposure to environmentalrisks. Environ <strong>Health</strong> Perspect 111:1170–1174.Chen PC, Lai YM, Wang JD, Yang CY, Hwang JS, Kuo HW,Huang SL, Chan CC. 1998. Adverse effect <strong>of</strong> air pollutionon respiratory health <strong>of</strong> primary school children <strong>in</strong>Taiwan. Environ <strong>Health</strong> Perspect 106:331–336.Clean <strong>Air</strong> Initiative for <strong>Asia</strong>n Cities (CAI-<strong>Asia</strong>) Center.2008. <strong>Air</strong> <strong>Pollution</strong>, Poverty <strong>and</strong> <strong>Health</strong> Effects <strong>in</strong> Ho ChiM<strong>in</strong>h City (APPH) Policy Consultation Workshop. Lastupdated September 5, 2009. Available from www.cleanairnet.org/caiasia/1412/articles-72525_apph.pdf.Cohen AJ, Anderson HR, Ostro B, P<strong>and</strong>ey KD, KrzyzanowskiM, Künzli N, Gutschmidt K, Pope CA III, Romieu I,Samet JM, Smith KR. 2004. Urban air pollution. In: ComparativeQuantification <strong>of</strong> <strong>Health</strong> Risks: Global <strong>and</strong>Regional Burden <strong>of</strong> Disease Attributable to Selected MajorRisk Factors (Ezzati M, Lopez AD, Rodgers A, Murray CJL,eds.) pp. 1153–1433. World <strong>Health</strong> Organization, Geneva,Switzerl<strong>and</strong>.Collaborative Work<strong>in</strong>g Group on <strong>Air</strong> <strong>Pollution</strong>, Poverty, <strong>and</strong><strong>Health</strong> <strong>in</strong> Ho Chi M<strong>in</strong>h City. 2009. The Effects <strong>of</strong> Short-TermExposure on Hospital Admissions for Acute Lower RespiratoryInfections <strong>in</strong> Young Children <strong>of</strong> Ho Chi M<strong>in</strong>h City. DraftF<strong>in</strong>al Report. <strong>Health</strong> Effects Institute, Boston, MA.Dom<strong>in</strong>ici F, Daniels M, McDermott A, Zeger SL, Samet JM.2003a. Shape <strong>of</strong> <strong>the</strong> exposure–response relation <strong>and</strong> mortalitydisplacement <strong>in</strong> <strong>the</strong> NMMAPS database. In: RevisedAnalyses <strong>of</strong> Time-Series Studies <strong>of</strong> <strong>Air</strong> <strong>Pollution</strong> <strong>and</strong><strong>Health</strong>, pp. 91–96. Special Report. <strong>Health</strong> Effects Institute,Boston, MA.Ezzati M, Lopez AD, Rodgers A, V<strong>and</strong>er Hoorn S, MurrayCJL, <strong>the</strong> Comparative Risk Assessment Collaborat<strong>in</strong>gGroup. 2002. Selected major risk factors <strong>and</strong> global <strong>and</strong>regional burden <strong>of</strong> disease. Lancet 360:1347–1360.Fletcher C, Peto R. 1977. The natural history <strong>of</strong> chronic airflowobstruction. Brit Med J 1:1645–1648.13
<strong>Outdoor</strong> <strong>Air</strong> <strong>Pollution</strong> <strong>and</strong> <strong>Health</strong> <strong>in</strong> <strong>the</strong> Develop<strong>in</strong>g <strong>Countries</strong> <strong>of</strong> <strong>Asia</strong>: A Comprehensive ReviewHarrison RM. 2006. Sources <strong>of</strong> air pollution. In: <strong>Air</strong>Quality Guidel<strong>in</strong>es Global Update 2005, pp. 9–30. World<strong>Health</strong> Organization, Regional Office for Europe, Copenhagen.<strong>Health</strong> Effects Institute. 2009. Request for Applications.Spr<strong>in</strong>g 2009 Research Agenda. Accessed August 25, 2010.Available from www.heal<strong>the</strong>ffects.org/RFA/RFASpr<strong>in</strong>g2009.pdf. Last updated May 2009. <strong>Health</strong> Effects Institute,Boston, MA.HEI International Scientific Oversight Committee. 2004.<strong>Health</strong> Effects <strong>of</strong> <strong>Outdoor</strong> <strong>Air</strong> <strong>Pollution</strong> <strong>in</strong> Develop<strong>in</strong>g<strong>Countries</strong> <strong>of</strong> <strong>Asia</strong>: A Literature Review. Special Report 15.<strong>Health</strong> Effects Institute, Boston, MA.HEI Public <strong>Health</strong> <strong>and</strong> <strong>Air</strong> <strong>Pollution</strong> <strong>in</strong> <strong>Asia</strong> Program.2010. Public <strong>Health</strong> <strong>and</strong> <strong>Air</strong> <strong>Pollution</strong> <strong>in</strong> <strong>Asia</strong> (PAPA):Coord<strong>in</strong>ated Studies <strong>of</strong> Short-Term Exposure to <strong>Air</strong> <strong>Pollution</strong><strong>and</strong> Daily Mortality <strong>in</strong> Four Cities. Research Report154. <strong>Health</strong> Effects Institute, Boston, MA.Ho WC, Hartley WR, Myers L, L<strong>in</strong> MH, L<strong>in</strong> YS, Lien CH,L<strong>in</strong> RS. 2007. <strong>Air</strong> pollution, wea<strong>the</strong>r, <strong>and</strong> associated riskfactors related to asthma prevalence <strong>and</strong> attack rate.Environ Res 104:402–409.Hong SJ, Lee MS, Sohn MH, Shim JY, Han YS, Park KS,Ahn YM, Son BK, Lee HB. 2004b. Self-reported prevalence<strong>and</strong> risk factors <strong>of</strong> asthma among Korean adolescents: 5-year follow-up study, 1995–2000. Cl<strong>in</strong> Exp Allergy34:1556–1562.Kan H, London SJ, Chen G, Zhang Y, Song G, Zhao N, JiangL, Chen B. 2008. Season, sex, age <strong>and</strong> education as modifiers<strong>of</strong> <strong>the</strong> effects <strong>of</strong> outdoor air pollution on daily mortality<strong>in</strong> Shanghai, Ch<strong>in</strong>a: The Public <strong>Health</strong> <strong>and</strong> <strong>Air</strong><strong>Pollution</strong> <strong>in</strong> <strong>Asia</strong> (PAPA) Study. Environ <strong>Health</strong> Perspect116:1183–1188.Kan H, Chen B, Zhao N, London SJ, Song G, Chen G, ZhangY, Jiang L. 2010. Part 1. A time-series study <strong>of</strong> ambient airpollution <strong>and</strong> daily mortality <strong>in</strong> Shanghai, Ch<strong>in</strong>a. In:Public <strong>Health</strong> <strong>and</strong> <strong>Air</strong> <strong>Pollution</strong> <strong>in</strong> <strong>Asia</strong> (PAPA): Coord<strong>in</strong>atedStudies <strong>of</strong> Short-Term Exposure to <strong>Air</strong> <strong>Pollution</strong> <strong>and</strong>Daily Mortality <strong>in</strong> Four Cities. Research Report 154. <strong>Health</strong>Effects Institute, Boston, MA.Katsouyanni K, Touloumi G, Samoli E, Petasakis Y,Analitis A, Le Tertre A, Rossi G, Zmirou D, Ballester F,Boumghar A, Anderson HR, Wojtyniak B, Paldy A,Brauste<strong>in</strong> R, Pekkanen J, Sch<strong>in</strong>dler C, Schwartz J. 2003.Sensitivity analysis <strong>of</strong> various models <strong>of</strong> short-term effects<strong>of</strong> ambient particles on total mortality <strong>in</strong> 29 cities <strong>in</strong>APHEA2. In: Revised Analyses <strong>of</strong> Time-Series Studies <strong>of</strong><strong>Air</strong> <strong>Pollution</strong> <strong>and</strong> <strong>Health</strong>, pp. 157–164. <strong>Health</strong> EffectsInstitute, Boston, MA.Klemm RJ, Mason RM. 2003. Replication <strong>of</strong> reanalysis <strong>of</strong>Harvard Six-City Mortality Study. In: Revised Analyses <strong>of</strong>Time-Series Studies <strong>of</strong> <strong>Air</strong> <strong>Pollution</strong> <strong>and</strong> <strong>Health</strong>, pp. 165–172. Special Report. <strong>Health</strong> Effects Institute, Boston, MA.Krewski D, Burnett RT, Goldberg MS, Hoover K, SiemiatyckiJ, Jerrett M, Abrahamowicz M, White WH. 2000.Reanalysis <strong>of</strong> <strong>the</strong> Harvard Six Cities Study <strong>and</strong> <strong>the</strong> AmericanCancer Society Study <strong>of</strong> Particulate <strong>Air</strong> <strong>Pollution</strong> <strong>and</strong>Mortality. A Special Report <strong>of</strong> <strong>the</strong> Institute's Particle EpidemiologyReanalysis Project. <strong>Health</strong> Effects Institute,Cambridge, MA.Krewski D, Jerrett M, Burnett RT, Ma R, Hughes E, Shi Y,Turner MC, Pope CA III, Thurston G, Calle EE, Thun MJ.2009. Extended Analysis <strong>of</strong> <strong>the</strong> American Cancer SocietyStudy <strong>of</strong> Particulate <strong>Air</strong> <strong>Pollution</strong> <strong>and</strong> Mortality. ResearchReport 140. <strong>Health</strong> Effects Institute, Boston, MA.Krzyzanowski M, Cohen A. 2008. Update <strong>of</strong> WHO airquality guidel<strong>in</strong>es. <strong>Air</strong> Qual Atmos <strong>Health</strong> 1:7–13.Kuo HW LJ, Lee MC, Tai RC, Lee MC. 2002. Respiratoryeffects <strong>of</strong> air pollutants among asthmatics <strong>in</strong> centralTaiwan. Arch Environ <strong>Health</strong> 57:194–200.Le Tertre A, Quenel P, Eilste<strong>in</strong> D, Med<strong>in</strong>a S, Prouvost H,Pascal L, Boumghar A, Saviuc P, Zeghnoun A, Filleul L,Declercq C, Cassadou S, Le Goaster C. 2002. Short-termeffects <strong>of</strong> air pollution on mortality <strong>in</strong> n<strong>in</strong>e French cities: Aquantitative summary. Arch Environ <strong>Health</strong> 57:311–319.Lee JT, Kim H, Hong YC, Kwon HJ, Schwartz J, ChristianiDC. 2000. <strong>Air</strong> pollution <strong>and</strong> daily mortality <strong>in</strong> seven majorcities <strong>of</strong> Korea, 1991–1997. Environ Res 84:247–254.Levy JI, Hammitt JK, Spengler JD. 2000. Estimat<strong>in</strong>g <strong>the</strong>mortality impacts <strong>of</strong> particulate matter: What can belearned from between-study variability? Environ <strong>Health</strong>Perspect 108:109–117.L<strong>in</strong> RS, Sung FC, Huang SL, Gou YL, Ko YC, Gou HW,Shaw CK. 2001c. Role <strong>of</strong> urbanization <strong>and</strong> air pollution <strong>in</strong>adolescent asthma: A mass screen<strong>in</strong>g <strong>in</strong> Taiwan. J FormosMed Assoc 100:649–655.Omori T, Fujimoto G, Yoshimura I, Nitta H, Ono M. 2003.Effects <strong>of</strong> particulate matter on daily mortality <strong>in</strong> 13 Japanesecities. J Epidemiol 13:314–322.14
Executive SummaryO'Neill MS, Jerrett M, Kawachi L, Levy JL, Cohen AJ, GouveiaN, Wilk<strong>in</strong>son P, Fletcher T, Cifuentes L, Schwartz J;Workshop on <strong>Air</strong> <strong>Pollution</strong> <strong>and</strong> Socioeconomic Conditions.2003. <strong>Health</strong>, wealth, <strong>and</strong> air pollution: Advanc<strong>in</strong>g<strong>the</strong>ory <strong>and</strong> methods. Environ <strong>Health</strong> Perspect 111:1861–1870.Ostro B, Broadw<strong>in</strong> R, Green S, Feng WY, Lipsett M. 2006.F<strong>in</strong>e particulate air pollution <strong>and</strong> mortality <strong>in</strong> n<strong>in</strong>e Californiacounties: Results from CALFINE. Environ <strong>Health</strong>Perspect 114:29–33.Pan American <strong>Health</strong> Organization. 2005. An Assessment<strong>of</strong> <strong>Health</strong> Effects <strong>of</strong> Ambient <strong>Air</strong> <strong>Pollution</strong> <strong>in</strong> Lat<strong>in</strong>America <strong>and</strong> <strong>the</strong> Caribbean. PAHO, Santiago, Chile.Pope CA III, Burnett RT, Thun MJ, Calle EE, Krewski D, ItoK, Thurston GD. 2002. Lung cancer, cardiopulmonary mortality,<strong>and</strong> long-term exposure to f<strong>in</strong>e particulate air pollution.JAMA 287:1132–1141.Pope CA III, Dockery DW. 2006. <strong>Health</strong> effects <strong>of</strong> f<strong>in</strong>e particulateair pollution: L<strong>in</strong>es that connect. J <strong>Air</strong> WasteManage Assoc 56:709–742.Qian Z, Chapman RS, Hu W, Wei F, Korn LR, Zhang JJ.2004. Us<strong>in</strong>g air pollution based community clusters toexplore air pollution health effects <strong>in</strong> children. Environ Int30:611–620.Qian Z, Chapman RS, Tian Q, Chen Y, Lioy PJ, Zhang J.2000. Effects <strong>of</strong> air pollution on children's respiratoryhealth <strong>in</strong> three Ch<strong>in</strong>ese cities. Arch Environ <strong>Health</strong>55:126–133.Qian Z, He Q, L<strong>in</strong> HM, Kong L, Bentley CM, Liu W, ZhouD. 2008. High temperatures enhanced acute mortalityeffects <strong>of</strong> ambient air pollution <strong>in</strong> <strong>the</strong> “oven” city <strong>of</strong>Wuhan, Ch<strong>in</strong>a. Environ <strong>Health</strong> Perspect 11:1172–1178.Qian Z, He Q, L<strong>in</strong> H-M, Kong L, Zhou D, Liang S, Zhu Z,Liao D, Liu W, Bentley CM, Dan J, Wang B, Yang N, Xu S,Gong J, Wei H, Sun H, Q<strong>in</strong> Z. 2010. Part 2. Association <strong>of</strong>daily mortality with ambient air pollution, <strong>and</strong> effect modificationby extremely high temperature <strong>in</strong> Wuhan, Ch<strong>in</strong>a.In: Public <strong>Health</strong> <strong>and</strong> <strong>Air</strong> <strong>Pollution</strong> <strong>in</strong> <strong>Asia</strong> (PAPA): Coord<strong>in</strong>atedStudies <strong>of</strong> Short-Term Exposure to <strong>Air</strong> <strong>Pollution</strong><strong>and</strong> Daily Mortality <strong>in</strong> Four Cities. Research Report 154.<strong>Health</strong> Effects Institute, Boston, MA.Rabl A. 2006. Analysis <strong>of</strong> air pollution mortality <strong>in</strong> terms<strong>of</strong> life expectancy changes: Relation between time series,<strong>in</strong>tervention, <strong>and</strong> cohort studies. Environ <strong>Health</strong> 5:1–11.Rajarathnam U, Seghal M, Nairy S, Patnayak RC, ChhabraSK, Kilnani, Santhosh Ragavan KV. 2010. Time-SeriesStudy on <strong>Air</strong> <strong>Pollution</strong> <strong>and</strong> Mortality <strong>in</strong> Delhi. ResearchReport. <strong>Health</strong> Effects Institute, Boston, MA. In Press.Rennard SI, Vestbo J. 2008. Natural histories <strong>of</strong> chronicobstructive pulmonary disease. Proc Am Thorac Soc5:878–883.Samoli E, Peng R, Ramsay T, Pipikou M, Touloumi G,Dom<strong>in</strong>ici F, Burnett R, Cohen A, Krewski D, Samet J, KatsouyanniK. 2008. Acute effects <strong>of</strong> ambient particulatematter on mortality <strong>in</strong> Europe <strong>and</strong> North America: Resultsfrom <strong>the</strong> APHENA study. Environ <strong>Health</strong> Perspect116:1480–1486.Schwartz J. 2004. The effects <strong>of</strong> particulate air pollution ondaily deaths: A multi-city case crossover analysis. OccupEnviron Med 61:956–61.Schwartz J, Coull B. 2003. Control for confound<strong>in</strong>g <strong>in</strong> <strong>the</strong>presence <strong>of</strong> measurement error <strong>in</strong> hierarchical models.Biostatistics 4:539–553.Stieb DM, Judek S, Burnett RT. 2002. Meta-analysis <strong>of</strong>time-series studies <strong>of</strong> air pollution <strong>and</strong> mortality: Effects <strong>of</strong>gases <strong>and</strong> particles <strong>and</strong> <strong>the</strong> <strong>in</strong>fluence <strong>of</strong> cause <strong>of</strong> death,age, <strong>and</strong> season. J <strong>Air</strong> Waste Manage Assoc 52:470–484.Stieb DM, Judek S, Burnett RT. 2003. Meta-analysis <strong>of</strong>time-series studies <strong>of</strong> air pollution <strong>and</strong> mortality: Update<strong>in</strong> relation to <strong>the</strong> use <strong>of</strong> generalized additive models. J <strong>Air</strong>Waste Manage Assoc 53:258–261.U.S. Environmental Protection Agency. 2008. National <strong>Air</strong>Quality — Status <strong>and</strong> Trends Through 2007. EPA-454/R-08-006. Office <strong>of</strong> <strong>Air</strong> Quality Plann<strong>in</strong>g <strong>and</strong> St<strong>and</strong>ards,Research Triangle Park, NC.Wang TN, Ko YC, Chao YY, Huang CC, L<strong>in</strong> RS. 1999. Associationbetween <strong>in</strong>door <strong>and</strong> outdoor air pollution <strong>and</strong> adolescentasthma from 1995 to 1996 <strong>in</strong> Taiwan. Environ Res81:239–247.Wong C-M on behalf <strong>of</strong> <strong>the</strong> PAPA teams: Bangkok, HongKong, Shanghai, <strong>and</strong> Wuhan. 2010a. Part 5. Public <strong>Health</strong><strong>and</strong> <strong>Air</strong> <strong>Pollution</strong> <strong>in</strong> <strong>Asia</strong> (PAPA): A comb<strong>in</strong>ed analysis <strong>of</strong>four studies <strong>of</strong> air pollution <strong>and</strong> mortality. In: Public<strong>Health</strong> <strong>and</strong> <strong>Air</strong> <strong>Pollution</strong> <strong>in</strong> <strong>Asia</strong> (PAPA): Coord<strong>in</strong>atedStudies <strong>of</strong> Short-Term Exposure to <strong>Air</strong> <strong>Pollution</strong> <strong>and</strong> DailyMortality <strong>in</strong> Four Cities. Research Report 154. <strong>Health</strong>Effects Institute, Boston, MA.Wong C-M, Thach TQ, Chau PYK, Chan EKP, Chung RY-N,Ou C-Q, Yang L, Peiris JSM, Thomas GN, Lam T-H, Wong15
<strong>Outdoor</strong> <strong>Air</strong> <strong>Pollution</strong> <strong>and</strong> <strong>Health</strong> <strong>in</strong> <strong>the</strong> Develop<strong>in</strong>g <strong>Countries</strong> <strong>of</strong> <strong>Asia</strong>: A Comprehensive ReviewT-W, Hedley AJ. 2010b. Part 4. Interaction between air pollution<strong>and</strong> respiratory viruses: Time-series study <strong>of</strong> dailymortality <strong>and</strong> hospital admissions <strong>in</strong> Hong Kong. In: Public<strong>Health</strong> <strong>and</strong> <strong>Air</strong> <strong>Pollution</strong> <strong>in</strong> <strong>Asia</strong> (PAPA): Coord<strong>in</strong>atedStudies <strong>of</strong> Short-Term Exposure to <strong>Air</strong> <strong>Pollution</strong> <strong>and</strong> DailyMortality <strong>in</strong> Four Cities. Research Report 154. <strong>Health</strong>Effects Institute, Boston, MA.Wong CM, Vichit-Vadakan N, Kan HD, Qian ZM, PapaProject Teams. 2008. Public <strong>Health</strong> <strong>and</strong> <strong>Air</strong> <strong>Pollution</strong> <strong>in</strong> <strong>Asia</strong>(PAPA): A multi-city study <strong>of</strong> short-term effects <strong>of</strong> air pollutionon mortality. Environ <strong>Health</strong> Perspect 116:1195–1202.World Bank <strong>and</strong> State Environmental Protection Adm<strong>in</strong>istration.2007. Cost <strong>of</strong> <strong>Pollution</strong> <strong>in</strong> Ch<strong>in</strong>a: Economic Estimates<strong>of</strong> Physical Damages. Rural Development, NaturalResources <strong>and</strong> Environmental Management Unit, East <strong>Asia</strong><strong>and</strong> Pacific Region, World Bank, Wash<strong>in</strong>gton, DC, <strong>and</strong> StateEnvironmental Protection Adm<strong>in</strong>istration, P.R. Ch<strong>in</strong>a.World <strong>Health</strong> Organization. 2002. World <strong>Health</strong> Report2002: Reduc<strong>in</strong>g Risk, Promot<strong>in</strong>g <strong>Health</strong>y Life. WHO,Geneva, Switzerl<strong>and</strong>.World <strong>Health</strong> Organization. 2005. Effects <strong>of</strong> air pollutionon children's health <strong>and</strong> development: A review <strong>of</strong> <strong>the</strong> evidence.WHO European Centre for Environment <strong>and</strong> <strong>Health</strong>,WHO Regional Office for Europe, Bonn, Germany.World <strong>Health</strong> Organization. 2006a. <strong>Air</strong> Quality Guidel<strong>in</strong>es:Global Update 2005. WHO, Geneva, Switzerl<strong>and</strong>.World <strong>Health</strong> Organization. 2008. Global Burden <strong>of</strong> Disease2004 Update. WHO, Geneva, Switzerl<strong>and</strong>. www.who.<strong>in</strong>t/health<strong>in</strong>fo/global_burden_disease/2004_report_update/en/<strong>in</strong>dex.htmlYang CY, Wang JD, Chan CC, Chen PC, Huang JS, ChengMF. 1997. Respiratory <strong>and</strong> irritant health effects <strong>of</strong> a populationliv<strong>in</strong>g <strong>in</strong> a petrochemical-polluted area <strong>in</strong> Taiwan.Environ Res 74:145–149.Yang CY, Wang JD, Chan CC, Hwang JS, Chen PC. 1998.Respiratory symptoms <strong>of</strong> primary school children liv<strong>in</strong>g <strong>in</strong>a petrochemical polluted area <strong>in</strong> Taiwan. Pediatr Pulmonol25:299–303.ACSAPHEACAI-<strong>Asia</strong>CICOCOPDDALYsGAMGHGIHDISOCNMMAPSNO 2O 3ORPAHOPAPAABBREVIATIONS AND OTHER TERMSAmerican Cancer Society<strong>Air</strong> <strong>Pollution</strong> <strong>and</strong> <strong>Health</strong>: A EuropeanApproachClean <strong>Air</strong> Initiative for <strong>Asia</strong>n Citiesconfidence <strong>in</strong>tervalcarbon monoxidechronic obstructive pulmonary diseasedisability-adjusted life-yearsgeneralized additive modelgreenhouse gasischemic heart diseaseInternational Scientific Oversight CommitteeNational Morbidity, Mortality, <strong>and</strong> <strong>Air</strong> <strong>Pollution</strong>Studynitrogen dioxideozoneodds ratioPan American <strong>Health</strong> OrganizationPublic <strong>Health</strong> <strong>and</strong> <strong>Air</strong> <strong>Pollution</strong> <strong>in</strong> <strong>Asia</strong>PAPA–SAN Public <strong>Health</strong> <strong>and</strong> <strong>Air</strong> <strong>Pollution</strong> <strong>in</strong> <strong>Asia</strong> —Science Access on <strong>the</strong> NetPM particulate matterPM 2.5 PM with an aerodynamic diameter 2.5µmPM 10 PM with an aerodynamic diameter 10 µmRSP respirable suspended particlesSEPA Ch<strong>in</strong>ese State Environmental ProtectionAdm<strong>in</strong>istrationSO 2 sulfur dioxideTSP total suspended particlesU.S. EPA U.S. Environmental Protection AgencyWHO World <strong>Health</strong> Organization16
Section I. Introduction<strong>Asia</strong> is undergo<strong>in</strong>g economic development at a rapidrate, result<strong>in</strong>g <strong>in</strong> levels <strong>of</strong> urban air pollution <strong>in</strong> manycities that rival <strong>the</strong> levels that existed <strong>in</strong> Europe <strong>and</strong> NorthAmerica <strong>in</strong> <strong>the</strong> first decades <strong>of</strong> <strong>the</strong> 20th century. Thisdevelopment is also transform<strong>in</strong>g <strong>the</strong> demographic <strong>and</strong>epidemiologic characteristics <strong>of</strong> <strong>the</strong> population <strong>in</strong> waysthat are likely to affect its vulnerability to air pollution.Nearly two thirds <strong>of</strong> <strong>the</strong> estimated 800,000 deaths <strong>and</strong>4.6 million lost years <strong>of</strong> healthy life worldwide caused byexposure to urban air pollution <strong>in</strong> 2000 occurred <strong>in</strong> <strong>the</strong>develop<strong>in</strong>g countries <strong>of</strong> <strong>Asia</strong> (also referred to as “develop<strong>in</strong>g<strong>Asia</strong>”; World <strong>Health</strong> Organization [WHO] 2002). Inrural areas <strong>and</strong> urban slums, <strong>in</strong>door air pollution from <strong>the</strong>burn<strong>in</strong>g <strong>of</strong> solid fuels for cook<strong>in</strong>g <strong>and</strong> heat<strong>in</strong>g confers itsown large burden <strong>of</strong> disease <strong>and</strong> contributes to <strong>in</strong>creasedoutdoor concentrations <strong>of</strong> pollutants <strong>in</strong> some locales.Develop<strong>in</strong>g <strong>Asia</strong>’s poorest populations are also expected tosuffer <strong>the</strong> effects <strong>of</strong> global warm<strong>in</strong>g, <strong>in</strong>clud<strong>in</strong>g possiblysubstantial health effects, due largely to climate changealready caused by <strong>the</strong> emissions <strong>of</strong> wealthy, developedcountries. <strong>Asia</strong>’s contribution to global emissions from climateforc<strong>in</strong>g is great as well <strong>and</strong> is projected to <strong>in</strong>crease <strong>in</strong><strong>the</strong> future, with consequences for human health <strong>in</strong> <strong>the</strong>region that are likely to be considerable.Develop<strong>in</strong>g <strong>Asia</strong> is not a s<strong>in</strong>gle entity, however. Underly<strong>in</strong>g<strong>the</strong> broad trends <strong>in</strong> air pollution <strong>in</strong> <strong>the</strong> region is considerablevariation between <strong>and</strong> with<strong>in</strong> countries withregard to <strong>the</strong> current pace <strong>of</strong> economic <strong>and</strong> social development<strong>and</strong> <strong>the</strong> status <strong>of</strong> <strong>and</strong> trends <strong>in</strong> factors that determ<strong>in</strong>eair quality, human exposures to air pollution, <strong>and</strong> <strong>the</strong>resultant health impacts.Effective public policy responses to <strong>the</strong> public healthchallenges posed by air pollution <strong>in</strong> develop<strong>in</strong>g <strong>Asia</strong>require high-quality scientific evidence on <strong>the</strong> health effects<strong>of</strong> air pollution <strong>in</strong> <strong>the</strong> region. Epidemiologic studies are <strong>the</strong>most important <strong>and</strong> critical components <strong>of</strong> <strong>the</strong> required evidence;toge<strong>the</strong>r with toxicologic <strong>and</strong> cl<strong>in</strong>ical studies, <strong>the</strong>yprovide estimates <strong>of</strong> <strong>the</strong> quantitative relation between exposure<strong>and</strong> disease. These estimates both demonstrate <strong>the</strong>existence <strong>of</strong> a public health hazard <strong>and</strong> allow its magnitudeThis document was made possible, <strong>in</strong> part, through support provided by <strong>the</strong>United States Agency for International Development (USAID) <strong>and</strong> <strong>the</strong> William<strong>and</strong> Flora Hewlett Foundation. The op<strong>in</strong>ions expressed here<strong>in</strong> do notnecessarily reflect <strong>the</strong> views <strong>of</strong> USAID or any o<strong>the</strong>r sponsors <strong>of</strong> HEI.to be estimated. Ow<strong>in</strong>g to limitations <strong>of</strong> <strong>the</strong> available epidemiologicstudies <strong>in</strong> <strong>Asia</strong>, estimates from assessments <strong>of</strong> <strong>the</strong>health impact <strong>of</strong> air pollution <strong>in</strong> <strong>Asia</strong>n populations (e.g., <strong>the</strong>estimate from <strong>the</strong> WHO cited above), rely <strong>in</strong> large part onextrapolation, with considerable uncerta<strong>in</strong>ty, <strong>of</strong> <strong>the</strong> results <strong>of</strong>Western studies to <strong>Asia</strong>n populations (Cohen et al. 2004; HEIInternational Scientific Oversight Committee [ISOC] 2004).HEI <strong>in</strong>itiated <strong>the</strong> Public <strong>Health</strong> <strong>and</strong> <strong>Air</strong> <strong>Pollution</strong> <strong>in</strong> <strong>Asia</strong>(PAPA) program <strong>in</strong> 2002 to reduce uncerta<strong>in</strong>ties about <strong>the</strong>health effects <strong>of</strong> exposure to air pollution <strong>in</strong> <strong>the</strong> cities <strong>of</strong>develop<strong>in</strong>g <strong>Asia</strong>. The PAPA program is part <strong>of</strong> <strong>the</strong> Clean<strong>Air</strong> Initiative for <strong>Asia</strong>n Cities (CAI-<strong>Asia</strong>) — a partnership<strong>of</strong> lenders, governments, <strong>in</strong>dustry, environmentalists, <strong>and</strong>o<strong>the</strong>rs to improve <strong>Asia</strong>n air quality. The first major publication<strong>of</strong> <strong>the</strong> PAPA program was Special Report 15, <strong>Health</strong>Effects <strong>of</strong> <strong>Outdoor</strong> <strong>Air</strong> <strong>Pollution</strong> <strong>in</strong> Develop<strong>in</strong>g <strong>Countries</strong> <strong>of</strong><strong>Asia</strong>: A Literature Review (2004). That report was also <strong>the</strong>first comprehensive review <strong>of</strong> <strong>the</strong> peer-reviewed <strong>Asia</strong>n literatureon <strong>the</strong> health effects <strong>of</strong> air pollution, a literaturethat at that time comprised over 100 studies <strong>in</strong> n<strong>in</strong>e countries(HEI ISOC 2004).S<strong>in</strong>ce Special Report 15 was published, that literaturehas more than doubled <strong>in</strong> size. It now <strong>in</strong>cludes <strong>the</strong> results<strong>of</strong> <strong>the</strong> recently completed coord<strong>in</strong>ated set <strong>of</strong> analyses <strong>of</strong> airpollution <strong>and</strong> daily mortality <strong>in</strong> four <strong>Asia</strong>n cities (Bangkok,Hong Kong, Shanghai, <strong>and</strong> Wuhan) † (see Sidebar 1) <strong>and</strong> <strong>in</strong>India <strong>and</strong> Vietnam, studies that were funded by HEI’s PAPAprogram on <strong>the</strong> basis <strong>of</strong> Special Report 15. The current SpecialReport 18 is <strong>the</strong> second PAPA literature review, whichprovides an exp<strong>and</strong>ed assessment <strong>of</strong> <strong>the</strong> <strong>Asia</strong>n literature on<strong>the</strong> health effects <strong>of</strong> outdoor air pollution.This review beg<strong>in</strong>s with a broad overview <strong>of</strong> <strong>the</strong> status<strong>of</strong> <strong>and</strong> trends <strong>in</strong> air pollution sources, emissions, concentrations,<strong>and</strong> exposures <strong>in</strong> <strong>the</strong> develop<strong>in</strong>g countries <strong>of</strong><strong>Asia</strong>, as well as factors related to urban development, populationhealth, <strong>and</strong> public policy that set <strong>the</strong> context for<strong>the</strong> health effects <strong>of</strong> air pollution. Local examples are highlightedthroughout, to illustrate <strong>the</strong> diversity among countries.Next, <strong>the</strong> review describes <strong>the</strong> current scope <strong>of</strong> <strong>the</strong><strong>Asia</strong>n literature on <strong>the</strong> health effects <strong>of</strong> air pollution, enumerat<strong>in</strong>g<strong>and</strong> classify<strong>in</strong>g more than 400 studies. Thesestudies were identified through 2007 via HEI’s Web-basedPublic <strong>Health</strong> <strong>and</strong> <strong>Air</strong> <strong>Pollution</strong> <strong>in</strong> <strong>Asia</strong>–Science Access* A list <strong>of</strong> abbreviations <strong>and</strong> o<strong>the</strong>r terms appears at <strong>the</strong> end <strong>of</strong> <strong>the</strong> report. † A list <strong>of</strong> cities, prov<strong>in</strong>ces, <strong>and</strong> countries appears at <strong>the</strong> end <strong>of</strong> <strong>the</strong> report.<strong>Health</strong> Effects Institute Special Report 18 © 2010 17
<strong>Outdoor</strong> <strong>Air</strong> <strong>Pollution</strong> <strong>and</strong> <strong>Health</strong> <strong>in</strong> <strong>the</strong> Develop<strong>in</strong>g <strong>Countries</strong> <strong>of</strong> <strong>Asia</strong>Sidebar 1: PAPA-FUNDED TIME-SERIES STUDIES OF AIR POLLUTION AND MORTALITYBy bridg<strong>in</strong>g <strong>the</strong> gap between studies conducted locally <strong>in</strong> <strong>Asia</strong><strong>and</strong> those performed elsewhere, PAPA-funded studies <strong>in</strong> representativecities provide useful <strong>in</strong>formation to policy makers.The PAPA studies are designed <strong>and</strong> conducted by local <strong>in</strong>vestigators<strong>in</strong> concert with local air pollution <strong>and</strong> public health <strong>of</strong>ficials<strong>and</strong> <strong>in</strong>ternational experts. They exam<strong>in</strong>e relationsbetween daily changes <strong>in</strong> air pollution <strong>and</strong> mortality <strong>in</strong> citieswith vary<strong>in</strong>g climates <strong>and</strong> air pollution concentrations.The PAPA-funded studies <strong>in</strong> <strong>Asia</strong> were conducted us<strong>in</strong>g <strong>the</strong>same types <strong>of</strong> rout<strong>in</strong>ely collected adm<strong>in</strong>istrative data on mortality<strong>and</strong> air pollution concentrations used <strong>in</strong> time-seriesstudies throughout <strong>the</strong> world <strong>and</strong> with methodologic rigor thatmatches or exceeds that <strong>of</strong> most published studies. Importantfeatures <strong>of</strong> <strong>the</strong> studies <strong>in</strong>clude formal quality control <strong>in</strong> <strong>the</strong>form <strong>of</strong> detailed st<strong>and</strong>ard operat<strong>in</strong>g procedures for collection<strong>and</strong> analysis <strong>of</strong> data <strong>and</strong> external quality assurance audits <strong>of</strong><strong>the</strong> data overseen by HEI. These studies also benefited fromrecent efforts to streng<strong>the</strong>n <strong>and</strong> ref<strong>in</strong>e methods for <strong>the</strong> analysis<strong>of</strong> time-series data, <strong>and</strong> as a result are on a par methodologicallywith <strong>the</strong> most recent U.S. <strong>and</strong> European analyses(<strong>Health</strong> Effects Institute 2003).COORDINATED STUDIES IN HONG KONG, SHANGHAI, WUHAN,AND BANGKOKCoord<strong>in</strong>ated multi-city studies currently provide <strong>the</strong> most def<strong>in</strong>itiveepidemiologic evidence <strong>of</strong> <strong>the</strong> effects <strong>of</strong> short-term exposureto air pollution <strong>and</strong> as a result play a central role <strong>in</strong> healthimpact assessment <strong>and</strong> environmental policy. Although robust<strong>and</strong> consistent results have been observed <strong>in</strong> Europe <strong>and</strong>North America (Samet et al 2000b; Katsouyanni et al. 2001),few coord<strong>in</strong>ated, multi-city time-series studies have been conductedelsewhere.Four time-series studies <strong>of</strong> <strong>the</strong> health effects <strong>of</strong> air pollution —<strong>in</strong> Bangkok, Hong Kong, Shanghai, <strong>and</strong> Wuhan — <strong>in</strong>itiated by<strong>the</strong> PAPA program <strong>in</strong> 2003 represent <strong>the</strong> first coord<strong>in</strong>atedmulti-city analyses <strong>of</strong> air pollution <strong>and</strong> daily mortality everundertaken <strong>in</strong> local populations <strong>in</strong> <strong>Asia</strong>, as well as <strong>the</strong> firstphase <strong>of</strong> an effort to conduct a series <strong>of</strong> studies <strong>in</strong> <strong>Asia</strong>n citiesthat will deepen our underst<strong>and</strong><strong>in</strong>g <strong>of</strong> <strong>the</strong> effects <strong>of</strong> air pollutionon local populations <strong>and</strong> <strong>in</strong>form extrapolation <strong>of</strong> results from<strong>the</strong> extensive Western literature to <strong>Asia</strong>n sett<strong>in</strong>gs.These studies explore key aspects <strong>of</strong> <strong>the</strong> epidemiology <strong>of</strong> exposureto air pollution <strong>in</strong> each city. Issues <strong>of</strong> local as well as globalrelevance <strong>in</strong>clude <strong>the</strong> effects <strong>of</strong> exposure at high concentrations<strong>and</strong> at high temperatures, <strong>the</strong> potential <strong>in</strong>fluence <strong>of</strong> <strong>in</strong>fluenzaepidemics on <strong>the</strong> relation between air pollution <strong>and</strong>health, <strong>and</strong> <strong>the</strong> ways <strong>in</strong> which social class may modify risksassociated with air pollution. Taken toge<strong>the</strong>r, <strong>the</strong> four studies<strong>and</strong> <strong>the</strong> comb<strong>in</strong>ed analysis <strong>of</strong> <strong>the</strong>ir f<strong>in</strong>d<strong>in</strong>gs provide a relativelyconsistent, if limited, picture <strong>of</strong> <strong>the</strong> short-term impact on mortality<strong>of</strong> current ambient particulate air pollution <strong>in</strong> severallarge metropolitan areas <strong>in</strong> East <strong>and</strong> Sou<strong>the</strong>ast <strong>Asia</strong>.In <strong>the</strong> comb<strong>in</strong>ed analysis (Wong CM et al. 2008b, 2010a), a10-µg/m 3 <strong>in</strong>crease <strong>in</strong> PM 10 concentration was associated withan <strong>in</strong>crease <strong>of</strong> 0.6% (95% CI, 0.3–0.9) <strong>in</strong> daily all-natural-causemortality, with <strong>the</strong> city-specific estimates similar to or greaterthan those reported <strong>in</strong> U.S. <strong>and</strong> European multi-city studies. Proportional<strong>in</strong>creases <strong>in</strong> mortality rates <strong>in</strong> <strong>the</strong> four <strong>Asia</strong>n cities wereseen at mean PM 10 concentrations (51.6–141.8 µg/m 3 ) severaltimes higher than those <strong>in</strong> most large Western cities. In HongKong, Wuhan, <strong>and</strong> Bangkok (but not Shanghai), <strong>the</strong> pattern <strong>of</strong><strong>the</strong> exposure–response functions appears to be l<strong>in</strong>ear over afairly large range <strong>of</strong> ambient concentrations, up to <strong>and</strong> sometimesexceed<strong>in</strong>g 100 µg/m 3 (Figures 1.1 <strong>and</strong> 1.2).Despite <strong>the</strong> fact that only four cities were studied, <strong>the</strong>se resultsmay beg<strong>in</strong> to allay concerns regard<strong>in</strong>g <strong>the</strong> generalizability <strong>of</strong>results <strong>of</strong> <strong>the</strong> substantial but largely Western literature on <strong>the</strong>effects <strong>of</strong> short-term exposure to air pollution. These PAPAresults, which are broadly consistent with those from previousresearch (HEI ISOC 2004), suggest that nei<strong>the</strong>r genetic factorsnor longer-term exposure to highly polluted air substantially modifies<strong>the</strong> effect <strong>of</strong> short-term exposure on daily mortality <strong>in</strong> majorcities <strong>in</strong> develop<strong>in</strong>g <strong>Asia</strong>. This evidence provides support for <strong>the</strong>notion, implicit <strong>in</strong> <strong>the</strong> approach taken <strong>in</strong> <strong>the</strong> WHO’s air qualityguidel<strong>in</strong>es (Krzyzanowski <strong>and</strong> Cohen 2008), that <strong>in</strong>crementalimprovements <strong>in</strong> air quality are expected to improve health, even<strong>in</strong> areas with relatively high ambient concentrations.Cont<strong>in</strong>ued on next pageon <strong>the</strong> Net (PAPA–SAN) literature survey (<strong>Health</strong> EffectsInstitute 2008), part <strong>of</strong> HEI’s PAPA program, created tohelp researchers study<strong>in</strong>g <strong>the</strong> effects <strong>of</strong> air pollution <strong>in</strong><strong>Asia</strong> <strong>and</strong> to provide policymakers, <strong>in</strong>ternational lend<strong>in</strong>gorganizations, <strong>and</strong> o<strong>the</strong>r stakeholders with <strong>in</strong>formation tohelp <strong>the</strong>m make better-<strong>in</strong>formed decisions.The review <strong>the</strong>n focuses on an analysis <strong>of</strong> time-seriesstudies that estimate <strong>the</strong> effect <strong>of</strong> short-term exposure toair pollution on daily mortality <strong>and</strong> hospital admissionsfor cardiovascular <strong>and</strong> respiratory disease. Time-seriesstudies were chosen because <strong>the</strong>y have been conducted <strong>in</strong>many regions <strong>of</strong> <strong>the</strong> world, <strong>in</strong>clud<strong>in</strong>g Europe <strong>and</strong> NorthAmerica, where coord<strong>in</strong>ated multi-city studies have contributedgreatly to public policy decisions. It is <strong>the</strong>reforepossible to compare <strong>the</strong>ir results across regions. Such comparisonscould <strong>in</strong>form <strong>the</strong> extrapolation to <strong>Asia</strong>n populations<strong>of</strong> results from o<strong>the</strong>r types <strong>of</strong> epidemiologic studies <strong>of</strong>air pollution (e.g., studies <strong>of</strong> <strong>the</strong> effects <strong>of</strong> long-term exposureon mortality from chronic disease) that have only beenconducted <strong>in</strong> developed Western countries. Time-series18
HEI International Scientific Oversight CommitteeSidebar 1. PAPA-FUNDED TIME-SERIES STUDIES (Cont<strong>in</strong>ued)STUDIES IN INDIAIn recognition <strong>of</strong> <strong>the</strong> fact that India is a diverse, densely populatedcountry where <strong>the</strong> burden <strong>of</strong> disease attributable toambient air pollution is likely to be substantial, HEI extended<strong>the</strong> PAPA research program to <strong>in</strong>clude three studies <strong>of</strong> air pollution<strong>and</strong> all-cause mortality <strong>in</strong> Chennai, Delhi, <strong>and</strong> Ludhiana.The Indian studies focused on <strong>the</strong> association between<strong>in</strong>creased air pollution <strong>and</strong> all-natural-cause mortality <strong>in</strong>2002–2004. Because <strong>of</strong> key differences <strong>in</strong> <strong>the</strong> availability<strong>and</strong> completeness <strong>of</strong> data between <strong>the</strong> first four PAPA studies<strong>and</strong> <strong>the</strong> two Indian studies, however, <strong>the</strong> common protocoldeveloped for <strong>the</strong> first four studies was nei<strong>the</strong>r adequate norsufficient for use <strong>in</strong> India. Therefore, <strong>the</strong> Indian <strong>in</strong>vestigatorsadapted <strong>the</strong> common protocol by develop<strong>in</strong>g city-specificapproaches for us<strong>in</strong>g available air quality data to calculateestimates <strong>of</strong> daily exposure. Cont<strong>in</strong>ued on next pageFigure 1.1. Percent excess risk <strong>of</strong> mortality (<strong>and</strong> 95% CI) for a 10-µg/m 3 <strong>in</strong>crease <strong>in</strong> <strong>the</strong> average pollutant concentration (lag time, 0–1 day) <strong>in</strong><strong>the</strong> PAPA studies, accord<strong>in</strong>g to age group (<strong>in</strong> years) <strong>and</strong> city. Note that each panel has a different scale on <strong>the</strong> y-axis. [Repr<strong>in</strong>ted from Wong CMet al. 2008b.]studies that use rout<strong>in</strong>ely collected data are time-efficient,cost-efficient, <strong>and</strong> generally easy to implement comparedwith long-term follow-up studies <strong>of</strong> <strong>in</strong>dividuals (e.g.,cohort studies). For this reason, time-series studies areamong <strong>the</strong> most frequently conducted studies <strong>of</strong> <strong>the</strong> heal<strong>the</strong>ffects <strong>of</strong> air pollution <strong>in</strong> <strong>Asia</strong> <strong>and</strong> worldwide. A total <strong>of</strong> 82time-series studies are <strong>in</strong>cluded <strong>in</strong> this analysis, 4 times<strong>the</strong> number <strong>of</strong> studies analyzed <strong>in</strong> Special Report 15 (HEIISOC 2004). The analysis provides numeric <strong>and</strong> graphicsummaries by country, health outcome, air pollutant, <strong>and</strong>o<strong>the</strong>r study features.Although time-series studies provide important <strong>in</strong>formationabout <strong>the</strong> exacerbation <strong>of</strong> preexist<strong>in</strong>g disease, studies <strong>of</strong>long-term exposure to air pollution can provide <strong>in</strong>formationabout <strong>the</strong> <strong>in</strong>cidence <strong>of</strong> disease <strong>and</strong> <strong>the</strong> effects <strong>of</strong> exposure<strong>and</strong> loss <strong>of</strong> healthy years <strong>of</strong> life for use <strong>in</strong> health-impactassessments. This review <strong>in</strong>cludes a first-ever critical <strong>and</strong>qualitative analysis <strong>of</strong> <strong>Asia</strong>n studies <strong>of</strong> long-term exposureto air pollution <strong>and</strong> chronic respiratory disease, lungcancer, <strong>and</strong> adverse reproductive outcomes. The reviewconcludes with a discussion that places <strong>the</strong> <strong>Asia</strong>n heal<strong>the</strong>ffects studies <strong>in</strong> <strong>the</strong> context <strong>of</strong> <strong>the</strong> worldwide literature,19
<strong>Outdoor</strong> <strong>Air</strong> <strong>Pollution</strong> <strong>and</strong> <strong>Health</strong> <strong>in</strong> <strong>the</strong> Develop<strong>in</strong>g <strong>Countries</strong> <strong>of</strong> <strong>Asia</strong>Sidebar 1. PAPA-FUNDED TIME-SERIES STUDIES (Cont<strong>in</strong>ued)Results from Delhi <strong>and</strong> Chennai suggest a somewhat lowerrisk <strong>of</strong> mortality association with air pollution exposure thanfound <strong>in</strong> <strong>the</strong> first four studies. In <strong>the</strong> Delhi study, <strong>the</strong>re was a0.15% <strong>in</strong>crease <strong>in</strong> total all-natural-cause mortality for every10 µg/m 3 <strong>in</strong>crease <strong>in</strong> PM 10 concentration. The Chennai studyreported a 0.4% <strong>in</strong>crease for every 10 µg/m 3 <strong>in</strong>crease <strong>in</strong> PM 10concentration. Given substantial limitations <strong>and</strong> uncerta<strong>in</strong>ties<strong>in</strong> <strong>the</strong> Ludhiana data, it was not clear that an <strong>in</strong>terpretableresult would be possible; <strong>the</strong> study was term<strong>in</strong>ated early.Figure 1.2. Concentration–response curves for PM 10 <strong>and</strong> all-natural-cause mortality (lag time, 0–1 day) <strong>in</strong> <strong>the</strong> PAPA studies, accord<strong>in</strong>g tocity. The th<strong>in</strong> vertical l<strong>in</strong>es represent <strong>the</strong> <strong>in</strong>terquartile range <strong>of</strong> PM 10 concentrations. The thick vertical l<strong>in</strong>es represent <strong>the</strong> WHO guidel<strong>in</strong>es(WHO 2005a) <strong>of</strong> 20 µg/m 3 PM 10 for a 1-year averag<strong>in</strong>g time. [Repr<strong>in</strong>ted from Wong CM et al. 2008b.]identifies gaps <strong>in</strong> knowledge, <strong>and</strong> recommends approachesby which to address <strong>the</strong>m.As this review makes clear, scientific knowledge about<strong>the</strong> health effects <strong>of</strong> air pollution <strong>in</strong> develop<strong>in</strong>g <strong>Asia</strong> iscont<strong>in</strong>u<strong>in</strong>g to advance. However, gaps <strong>in</strong> scientific underst<strong>and</strong><strong>in</strong>gwith important implications for public policystill rema<strong>in</strong>. As PAPA’s ISOC noted <strong>in</strong> <strong>the</strong> <strong>in</strong>troduction to<strong>the</strong> first review, future research should cont<strong>in</strong>ue to bedesigned to address clear objectives that fill critical gaps <strong>in</strong><strong>the</strong> current evidence. Systematic, quantitative review <strong>of</strong><strong>the</strong> exist<strong>in</strong>g literature rema<strong>in</strong>s essential to identify<strong>in</strong>gthose gaps, <strong>in</strong>form<strong>in</strong>g <strong>the</strong> design <strong>of</strong> future research, <strong>and</strong>provid<strong>in</strong>g a critical assessment <strong>of</strong> currently available evidenceto <strong>in</strong>form present decisions.20
Section II. Development, <strong>Air</strong> <strong>Pollution</strong> Exposure, <strong>and</strong>Population <strong>Health</strong>TRENDS IN DEVELOPMENTDevelop<strong>in</strong>g <strong>Asia</strong> is <strong>in</strong> many ways <strong>the</strong> most dynamic part<strong>of</strong> <strong>the</strong> world. Although hundreds <strong>of</strong> millions <strong>of</strong> residentsstill live <strong>in</strong> poverty, slow<strong>in</strong>g <strong>of</strong> population growth <strong>and</strong>steady growth <strong>of</strong> per capita <strong>in</strong>come are real prospects. In<strong>the</strong> next decades, if current trends cont<strong>in</strong>ue, develop<strong>in</strong>g<strong>Asia</strong> may well be near<strong>in</strong>g <strong>the</strong> per capita <strong>in</strong>come <strong>of</strong> middle<strong>in</strong>comeLat<strong>in</strong> America (United Nations Economic <strong>and</strong>Social Affairs 2004a).Increased population growth, economic development, <strong>and</strong>urbanization are occurr<strong>in</strong>g, along with associated <strong>in</strong>creases<strong>in</strong> <strong>in</strong>dustrialization <strong>and</strong> vehicularization — result<strong>in</strong>g <strong>in</strong>shift<strong>in</strong>g patterns <strong>of</strong> environmental risk. In this section, wediscuss some <strong>of</strong> <strong>the</strong> major factors <strong>in</strong> <strong>Asia</strong> that are expected tomost strongly <strong>in</strong>fluence <strong>the</strong> health effects <strong>of</strong> exposure to airpollution over <strong>the</strong> next 20 to 30 years: broad demographictrends, urbanization (growth <strong>of</strong> cities <strong>and</strong> trends <strong>in</strong> ruraldevelopment), patterns <strong>of</strong> economic <strong>and</strong> social developmentvis-à-vis decisions regard<strong>in</strong>g energy use, population health<strong>and</strong> <strong>the</strong> <strong>in</strong>frastructure <strong>of</strong> health care systems, <strong>and</strong> <strong>the</strong> <strong>in</strong>tersection<strong>of</strong> air pollution, poverty, <strong>and</strong> health.In parts <strong>of</strong> this section, we differentiate among five major<strong>Asia</strong>n regions, roughly on <strong>the</strong> basis <strong>of</strong> geography <strong>and</strong><strong>in</strong>come level (Table 1). India <strong>and</strong> Ch<strong>in</strong>a (i.e., ma<strong>in</strong>l<strong>and</strong>Ch<strong>in</strong>a, Hong Kong, <strong>and</strong> Taipei,Ch<strong>in</strong>a) are each considered torepresent one region, ow<strong>in</strong>g to <strong>the</strong>ir large geographic areas<strong>and</strong> population sizes. The o<strong>the</strong>r three regions consideredTable 1. Def<strong>in</strong>itions <strong>of</strong> <strong>Asia</strong>n Regions Referred to <strong>in</strong>This SectionRegionIndiaCh<strong>in</strong>aHigh-Income<strong>Asia</strong>O<strong>the</strong>r South<strong>Asia</strong>O<strong>the</strong>r Sou<strong>the</strong>ast<strong>Asia</strong>CountryIndiaCh<strong>in</strong>a, Hong Kong, Taipei,Ch<strong>in</strong>aBrunei, Japan, South Korea, S<strong>in</strong>gaporeAfghanistan, Bangladesh, Bhutan,Maldives, Nepal, Pakistan, Sri LankaCambodia, Indonesia, Laos, Malaysia,Myanmar, Philipp<strong>in</strong>es, Thail<strong>and</strong>, Timor-Leste, Vietnamare O<strong>the</strong>r South <strong>Asia</strong>, compris<strong>in</strong>g Afghanistan, Bangladesh,Bhutan, Maldives, Nepal, Pakistan, <strong>and</strong> Sri Lanka;O<strong>the</strong>r Sou<strong>the</strong>ast <strong>Asia</strong>, compris<strong>in</strong>g Cambodia, Indonesia,Laos, Malaysia, Myanmar (Burma), Philipp<strong>in</strong>es, Thail<strong>and</strong>,Timor-Leste, <strong>and</strong> Vietnam; <strong>and</strong> High-Income <strong>Asia</strong>, compris<strong>in</strong>gBrunei, Japan, South Korea, <strong>and</strong> S<strong>in</strong>gapore. Thisreview is designed to present an overview <strong>of</strong> factors <strong>in</strong>fluenc<strong>in</strong>g<strong>the</strong> impact <strong>of</strong> air pollution on health across <strong>Asia</strong>.Although as units <strong>of</strong> evaluation <strong>the</strong> five regions capturesome <strong>of</strong> <strong>the</strong> heterogeneous nature <strong>of</strong> <strong>Asia</strong>, clearly <strong>the</strong>y donot capture all <strong>the</strong> differences among <strong>the</strong> regions across<strong>the</strong> cont<strong>in</strong>ent or all important with<strong>in</strong>-country differences.Broad Trends <strong>in</strong> DevelopmentSeveral conceptual frameworks have been developed todescribe broad trends <strong>in</strong> development over time. These<strong>in</strong>clude <strong>the</strong> demographic transition, <strong>the</strong> epidemiologic transition,<strong>and</strong> <strong>the</strong> environmental risk transition (see Figure 1).The demographic transition is a conceptual frameworkthat describes how changes <strong>in</strong> <strong>the</strong> rates <strong>of</strong> birth <strong>and</strong> deathaffect population size. In brief, <strong>in</strong>creased development isexpected to lead to decreased death rates, followed eventuallyby gradual decl<strong>in</strong>es <strong>in</strong> birth rates. The lag timebetween <strong>the</strong> two decl<strong>in</strong>es <strong>in</strong>itially results <strong>in</strong> a large population<strong>in</strong>crease. The lag time can be partially expla<strong>in</strong>ed by<strong>the</strong> fact that fertility tends to be higher <strong>in</strong> regions <strong>of</strong> lowdevelopment <strong>and</strong> poverty, where <strong>the</strong>re tends to be a lack <strong>of</strong>access to education <strong>and</strong> birth-control methods; <strong>the</strong>refore,only after development has affected daily life do <strong>the</strong> measureslimit<strong>in</strong>g fertility take effect. Over time, cont<strong>in</strong>ueddecreases <strong>in</strong> <strong>the</strong> birth <strong>and</strong> death rates result <strong>in</strong> a gradualfall <strong>in</strong> <strong>the</strong> rate <strong>of</strong> population <strong>in</strong>crease; <strong>the</strong> population mayshr<strong>in</strong>k <strong>and</strong> become <strong>in</strong>creas<strong>in</strong>gly older overall.Unlike <strong>the</strong> demographic transition, which focuses onlyon births <strong>and</strong> deaths, <strong>the</strong> epidemiologic transition takescause-<strong>of</strong>-death categories <strong>in</strong>to account. Under this framework,<strong>in</strong>creased development is associated with a shift <strong>in</strong>patterns <strong>of</strong> disease (<strong>and</strong> correspond<strong>in</strong>g mortality). As rates<strong>of</strong> <strong>in</strong>fectious diseases, <strong>in</strong>fant <strong>and</strong> child mortality, <strong>and</strong> epidemics(type I diseases) decl<strong>in</strong>e, rates <strong>of</strong> chronic diseases(<strong>in</strong>clud<strong>in</strong>g cardiovascular <strong>and</strong> respiratory disease [type IIdiseases]), especially those affect<strong>in</strong>g older populations,21
<strong>Outdoor</strong> <strong>Air</strong> <strong>Pollution</strong> <strong>and</strong> <strong>Health</strong> <strong>in</strong> <strong>the</strong> Develop<strong>in</strong>g <strong>Countries</strong> <strong>of</strong> <strong>Asia</strong>Sidebar 2. CARDIOVASCULAR ANDRESPIRATORY DISEASE IN ASIAShort- <strong>and</strong> long-term exposure to air pollution is associatedwith morbidity <strong>and</strong> mortality among people with preexist<strong>in</strong>gcardiovascular or respiratory disease, <strong>and</strong> limited evidencesuggests that long-term exposure may also <strong>in</strong>crease <strong>the</strong> risk<strong>of</strong> <strong>the</strong>se conditions (see Sidebar 13). For that reason, it isimportant to underst<strong>and</strong> <strong>the</strong> current levels <strong>of</strong>, <strong>and</strong> probabletrends <strong>in</strong>, cardiovascular <strong>and</strong> respiratory disease <strong>and</strong> <strong>the</strong>irmajor causes, such as tobacco smok<strong>in</strong>g <strong>and</strong> diet, <strong>in</strong> <strong>the</strong>develop<strong>in</strong>g countries <strong>of</strong> <strong>Asia</strong>.CARDIOVASCULAR DISEASEFigure 1. Integrated frameworks describ<strong>in</strong>g broad trends <strong>in</strong> development.The gray area designates <strong>the</strong> three ma<strong>in</strong> factors driv<strong>in</strong>g development.Solid arrows represent known relations; dashed arrows representpossible relations. See <strong>the</strong> text or Glossary for detailed descriptions <strong>of</strong> <strong>the</strong>three frameworks. [Adapted from <strong>the</strong> Annual Review <strong>of</strong> Environment <strong>and</strong><strong>the</strong> Resources, Smith <strong>and</strong> Ezzati 2005.]may take on proportionately greater importance because <strong>of</strong>changes <strong>in</strong> both age-specific death rates <strong>and</strong> population agestructure. Thus, <strong>the</strong> epidemiologic transition can bethought to drive <strong>the</strong> demographic transition. Sidebar 2describes <strong>the</strong> status <strong>and</strong> trends <strong>of</strong> respiratory <strong>and</strong> cardiovasculardisease <strong>in</strong> <strong>Asia</strong> that underlie <strong>the</strong> demographictransition.Similarly, <strong>the</strong> environmental risk transition focuses onchanges <strong>in</strong> underly<strong>in</strong>g environmental risk factors for disease<strong>and</strong> <strong>the</strong>refore may be a major trigger <strong>of</strong> current <strong>and</strong> futuretrends <strong>in</strong> disease patterns. Development <strong>of</strong>ten <strong>in</strong>volves severalprocesses — <strong>in</strong>clud<strong>in</strong>g urbanization, <strong>in</strong>dustrialization,agricultural modernization, <strong>and</strong> vehicularization. Thesetend to produce community exposures or potential environmentalhazards or risk factors such as outdoor air pollution,solid <strong>and</strong> hazardous waste, lead exposure, <strong>and</strong> pesticideuse. a It is worth not<strong>in</strong>g, however, that exposures may <strong>in</strong>creasebut <strong>the</strong> associated population-level risk may decreaseif disease c<strong>of</strong>actors such as health care reduce <strong>the</strong> potentialeffect or <strong>the</strong> size <strong>of</strong> <strong>the</strong> susceptible subpopulations. Asa Occupational risks seem to <strong>in</strong>crease as a result <strong>of</strong> <strong>the</strong>se hazards or risk factorsas well, although <strong>the</strong> occupational hazards <strong>of</strong> farm<strong>in</strong>g <strong>in</strong> traditional,poor communities <strong>in</strong> rural areas are not well documented. Occupationalrisks <strong>in</strong> <strong>the</strong> <strong>in</strong>formal unregulated sector <strong>of</strong> <strong>the</strong> urban economy are not welldescribed ei<strong>the</strong>r, although <strong>the</strong>y are probably considerable.Previously considered “diseases <strong>of</strong> affluence,” cardiovasculardiseases are now known to pose a serious health burden <strong>in</strong>develop<strong>in</strong>g countries (Ezzati et al. 2005; Yusuf 2001a,b; Goyal<strong>and</strong> Yusuf 2006; Reddy 2004; Abegunde 2007). Ischemic heartdisease (IHD) <strong>and</strong> cerebrovascular disease were <strong>the</strong> first <strong>and</strong>second lead<strong>in</strong>g causes <strong>of</strong> death, respectively, <strong>in</strong> low- <strong>and</strong>middle-<strong>in</strong>come countries <strong>in</strong> 2001, account<strong>in</strong>g for over 10 milliondeaths. Ischemic heart disease <strong>and</strong> cerebrovascular diseaseare estimated to have caused 23% <strong>and</strong> 20% <strong>of</strong> all deaths <strong>in</strong>2001 <strong>in</strong> East <strong>Asia</strong> <strong>and</strong> <strong>the</strong> Western Pacific region <strong>and</strong> <strong>the</strong> South<strong>Asia</strong>n region, respectively (Lopez et al. 2006).Several major risk factors for cardiovascular disease areprevalent <strong>and</strong> <strong>in</strong>creas<strong>in</strong>g across <strong>the</strong> region. Develop<strong>in</strong>g countries<strong>in</strong> <strong>Asia</strong> are experienc<strong>in</strong>g a rapid <strong>in</strong>crease <strong>in</strong> <strong>the</strong> prevalence<strong>of</strong> diabetes mellitus <strong>and</strong> metabolic syndrome.Hypercholesterolemia <strong>and</strong> dyslipidemia are particularly prevalentamong Indian adults; 37.4% <strong>of</strong> men aged 15 to 30years are affected (Nishtar 2002). The prevalence <strong>of</strong> abdom<strong>in</strong>alobesity <strong>and</strong> <strong>the</strong> consumption <strong>of</strong> a high-glycemic diet are<strong>in</strong>creas<strong>in</strong>g <strong>in</strong> both India <strong>and</strong> Ch<strong>in</strong>a, where <strong>the</strong>y are contribut<strong>in</strong>gto <strong>in</strong>creased risks <strong>of</strong> diabetes <strong>and</strong> cardiovascular disease(Goyal <strong>and</strong> Yusuf 2006; D<strong>in</strong>g <strong>and</strong> Malik 2008). Theestimated percentage <strong>of</strong> men aged 15 to 30 years withhypertension is also high: 36.4% <strong>in</strong> India, 17% <strong>in</strong> Pakistan<strong>and</strong> Sri Lanka, <strong>and</strong> 9.8% <strong>in</strong> Bangladesh (Nishtar 2002). Thetrend among women is similar, although rates with<strong>in</strong> countriesmay vary widely: Indian studies report a higher prevalence<strong>of</strong> hypertension <strong>in</strong> urban areas (20–40%) than <strong>in</strong> ruralareas (12–17%). This pattern has been noted <strong>in</strong> Pakistan <strong>and</strong>Sri Lanka as well (Ghaffar et al. 2004).The frequency <strong>of</strong> tobacco smok<strong>in</strong>g rema<strong>in</strong>s high <strong>in</strong> <strong>the</strong> develop<strong>in</strong>gcountries <strong>of</strong> <strong>Asia</strong>, with <strong>the</strong> prevalence <strong>in</strong> men farexceed<strong>in</strong>g that <strong>in</strong> women. The reported prevalence <strong>of</strong> smok<strong>in</strong>gamong men <strong>in</strong> India <strong>in</strong> 1998–1999 was 29.4% <strong>and</strong> <strong>in</strong> Indonesia<strong>in</strong> 2001 it was 69%, with a prevalence <strong>of</strong> 2.5–3% amongwomen <strong>in</strong> both countries. Economic data on tobacco consumptionshow decl<strong>in</strong>es <strong>in</strong> India <strong>and</strong> <strong>in</strong>creases <strong>in</strong> Indonesiaover <strong>the</strong> past 30 years, but <strong>the</strong>se data are not always reliable<strong>in</strong>dicators <strong>of</strong> actual tobacco use (Shafey et al. 2003).Surveys conducted by <strong>the</strong> Ch<strong>in</strong>ese government from 2002 to2003 reported smok<strong>in</strong>g prevalence <strong>of</strong> between 49.6% <strong>and</strong>Cont<strong>in</strong>ued on next page22
HEI International Scientific Oversight CommitteeSidebar 2. CARDIOVASCULAR AND RESPIRATORY DISEASE IN ASIA (Cont<strong>in</strong>ued)57.4% among males <strong>and</strong> between 2.6% <strong>and</strong> 3.0% amongwomen. S<strong>in</strong>ce 1990, economic data have <strong>in</strong>dicated decl<strong>in</strong>es <strong>in</strong>tobacco consumption, <strong>and</strong> national surveys have <strong>in</strong>dicateddecl<strong>in</strong>es <strong>in</strong> <strong>the</strong> reported prevalence <strong>of</strong> smok<strong>in</strong>g, with ratesdecl<strong>in</strong><strong>in</strong>g from 60.3% to 49.6% among males <strong>and</strong> 4.7% to 3.0%among females (L<strong>in</strong> HH et al. 2008).A role <strong>of</strong> genetic factors <strong>in</strong> <strong>the</strong> high prevalence <strong>of</strong> cardiovasculardisease <strong>in</strong> South <strong>Asia</strong>ns is suspected, but def<strong>in</strong>itive evidenceis lack<strong>in</strong>g. Numerous studies have reported a high<strong>in</strong>cidence <strong>of</strong> coronary artery disease (that is not expla<strong>in</strong>ed byconventional risk factors) among Indian immigrants <strong>in</strong> Canada,<strong>the</strong> United K<strong>in</strong>gdom, <strong>the</strong> United States, <strong>and</strong> <strong>the</strong> Caribbean(An<strong>and</strong> et al. 2000). A large case–control study <strong>of</strong> risk factorsfor myocardial <strong>in</strong>farction <strong>in</strong> 52 countries worldwide, <strong>in</strong>clude5000 cases <strong>in</strong> East, Sou<strong>the</strong>ast, <strong>and</strong> South <strong>Asia</strong>, found that <strong>the</strong>same constellation <strong>of</strong> risk factors — <strong>in</strong>clud<strong>in</strong>g abnormal lipidlevels, smok<strong>in</strong>g, hypertension, <strong>and</strong> obesity — accounted formore than 90% <strong>of</strong> <strong>the</strong> attributable risk <strong>in</strong> all regions (Yusuf etal. 2004). Previously, South <strong>Asia</strong>ns were reported to havehigher rates <strong>of</strong> myocardial <strong>in</strong>farction at younger ages than Europeans<strong>and</strong> Ch<strong>in</strong>ese. An analysis <strong>of</strong> 1700 cases <strong>of</strong> myocardial<strong>in</strong>farction <strong>in</strong> South <strong>Asia</strong> found that <strong>the</strong> cases occurr<strong>in</strong>g atyounger ages were largely attributable to <strong>the</strong> same constellation<strong>of</strong> risk factors, just at an earlier age (Joshi et al. 2007).CHRONIC RESPIRATORY DISEASEThe prevalence <strong>of</strong> chronic respiratory disease (<strong>in</strong>clud<strong>in</strong>g chronicobstructive pulmonary disease [COPD] <strong>and</strong> tuberculosis [TB]) <strong>in</strong>most <strong>Asia</strong>n countries is quite high, <strong>and</strong> its current contribution tomortality is substantial. COPD <strong>and</strong> TB are estimated to have led to15% <strong>of</strong> all deaths <strong>in</strong> <strong>the</strong> East <strong>Asia</strong> <strong>and</strong> Western Pacific region, <strong>and</strong>to 9% <strong>in</strong> South <strong>Asia</strong>, <strong>in</strong> 2001 (Lopez et al. 2006).COPD is predicted to <strong>in</strong>crease <strong>in</strong> importance as a cause <strong>of</strong> death<strong>in</strong> <strong>Asia</strong> <strong>in</strong> <strong>the</strong> next two decades because <strong>of</strong> <strong>the</strong> high prevalence<strong>of</strong> smok<strong>in</strong>g, both <strong>in</strong> <strong>the</strong> past <strong>and</strong> present (Murray <strong>and</strong> Lopez1997, L<strong>in</strong> HH et al. 2008). COPD is estimated to affect 3% <strong>of</strong> Ch<strong>in</strong>ese<strong>in</strong> 2003; this percentage is expected to <strong>in</strong>crease substantiallyto reflect an <strong>in</strong>crease <strong>in</strong> smok<strong>in</strong>g prevalence by a factor <strong>of</strong>10 between 1950 <strong>and</strong> 1990 (Zhang JF <strong>and</strong> Smith 2003). COPDis estimated to affect 6.7% <strong>of</strong> <strong>the</strong> population over 30 years <strong>of</strong>age <strong>in</strong> 12 <strong>Asia</strong>n Pacific countries (Regional COPD Work<strong>in</strong>g Group2003). In India, 11 population-based studies suggest that COPDaffects 5.0% <strong>of</strong> men <strong>and</strong> 2.7% <strong>of</strong> women over 30 years <strong>of</strong> age(J<strong>in</strong>dal et al. 2001). An asthma prevalence <strong>of</strong> 2.4% was reported<strong>in</strong> a four-city multi-center study <strong>in</strong> India (J<strong>in</strong>dal 2007).Tobacco smok<strong>in</strong>g <strong>in</strong>creases <strong>the</strong> risk <strong>of</strong> TB, <strong>and</strong> <strong>the</strong>re is<strong>in</strong>creas<strong>in</strong>g evidence that environmental tobacco smoke <strong>and</strong><strong>in</strong>door air pollution from <strong>the</strong> burn<strong>in</strong>g <strong>of</strong> solid fuels may do so aswell (Bates et al. 2007; L<strong>in</strong> HH et al. 2007). There is virtually no<strong>in</strong>formation on <strong>the</strong> effects <strong>of</strong> exposure to outdoor air pollutionon <strong>the</strong> risk <strong>of</strong> TB (Cohen <strong>and</strong> Mehta 2007).ALRI IN CHILDRENAcute lower respiratory <strong>in</strong>fection (ALRI) is <strong>the</strong> chief cause <strong>of</strong> deathamong children under 5 years <strong>of</strong> age worldwide, kill<strong>in</strong>g an estimated3 million <strong>in</strong> 2001 (Lopez et al. 2006). Although <strong>the</strong> diseaseaffects both young <strong>and</strong> old, pneumonia kills so manychildren younger than 2 years <strong>of</strong> age that <strong>the</strong> disease accountsfor a large number <strong>of</strong> lost life-years. ALRI accounted for 6.3% <strong>of</strong><strong>the</strong> global burden <strong>of</strong> disease <strong>in</strong> 2000, <strong>in</strong> terms <strong>of</strong> disabilityadjustedlife-years, mak<strong>in</strong>g it arguably <strong>the</strong> most important s<strong>in</strong>glecategory <strong>of</strong> disease <strong>in</strong> <strong>the</strong> world (WHO 2001).All young children worldwide appear to suffer similar rates <strong>of</strong>acute upper respiratory <strong>in</strong>fection (Rudan et al. 2004). In developedcountries, <strong>the</strong>se <strong>in</strong>fections are usually viral, mild, <strong>and</strong>self-limit<strong>in</strong>g. In contrast, most serious cases <strong>of</strong> ALRI <strong>in</strong> develop<strong>in</strong>gcountries are thought to be bacterial <strong>and</strong> consequentlytreatable by antibiotics. If untreated, <strong>the</strong>se bacterial <strong>in</strong>fectionsmay progress rapidly, <strong>and</strong> a large fraction <strong>of</strong> cases progress toserious <strong>and</strong> sometimes fatal ALRI, consist<strong>in</strong>g <strong>of</strong> bronchiolitis<strong>and</strong> pneumonia.There are several known risk factors for ALRI, <strong>the</strong> most important<strong>of</strong> which is malnutrition. The WHO Comparative RiskAssessment exercise (WHO 2002) estimated that some 40% <strong>of</strong>ALRI cases are directly attributable to prote<strong>in</strong> malnutrition <strong>in</strong><strong>the</strong> world <strong>and</strong> 16% <strong>of</strong> cases are due to z<strong>in</strong>c deficiency (Black2003). O<strong>the</strong>r risk factors <strong>in</strong>clude those that promote diarrhea,malaria, <strong>and</strong> measles, because children with those diseasesare more likely to contract severe ALRI. Crowd<strong>in</strong>g <strong>and</strong> chill<strong>in</strong>ghave also been associated with ALRI, but with less consistency.Exposure to high concentrations <strong>of</strong> <strong>in</strong>door air pollution from <strong>the</strong>burn<strong>in</strong>g <strong>of</strong> solid fuels <strong>in</strong>creases <strong>the</strong> risk <strong>of</strong> pneumonia by 80%(Dherani et al. 2008). As a result, nearly one third <strong>of</strong> globalALRI cases <strong>in</strong> children is attributed to <strong>in</strong>door air pollution <strong>in</strong>develop<strong>in</strong>g countries (Smith et al 2000a). About 1% is attributedto urban outdoor air pollution, though <strong>the</strong> epidemiologicevidence for this association is considerably weaker (WHO2002; Romieu et al. 2002).Vacc<strong>in</strong>es show <strong>in</strong>creas<strong>in</strong>g promise <strong>of</strong> prevent<strong>in</strong>g serious cases, especiallyif access to vacc<strong>in</strong>ations is ensured for people liv<strong>in</strong>g <strong>in</strong> poverty,but prevention through better nutrition <strong>and</strong> cleanerenvironments will also be essential to substantially reduce <strong>the</strong> <strong>in</strong>cidence<strong>of</strong> ALRI <strong>and</strong> its associated mortality (Mulholl<strong>and</strong> et al. 2008).countries modernize fur<strong>the</strong>r <strong>and</strong> environmental controlsare tightened, community-level exposures tend to decl<strong>in</strong>e.This decl<strong>in</strong>e leads to <strong>the</strong> third stage <strong>of</strong> <strong>the</strong> environmentalrisk transition, <strong>in</strong> which <strong>the</strong> richest countries contributemost to global risks that are due to greenhouse gas (GHG)emissions <strong>and</strong> o<strong>the</strong>r causes <strong>of</strong> global environmental change.Overall, exposures lead<strong>in</strong>g to potential environmentalhealth risks generally seem to decl<strong>in</strong>e with economicdevelopment, both <strong>in</strong> absolute <strong>and</strong> relative terms. Householdexposures are considerable <strong>in</strong> poor areas <strong>and</strong> decl<strong>in</strong>ewith <strong>in</strong>creas<strong>in</strong>g development; community exposures firstrise, as modern <strong>in</strong>dustrial economic development beg<strong>in</strong>s,23
<strong>Outdoor</strong> <strong>Air</strong> <strong>Pollution</strong> <strong>and</strong> <strong>Health</strong> <strong>in</strong> <strong>the</strong> Develop<strong>in</strong>g <strong>Countries</strong> <strong>of</strong> <strong>Asia</strong>Figure 2. Urban <strong>and</strong> rural populations <strong>in</strong> selected <strong>Asia</strong>n countries <strong>in</strong> 2005. [Data compiled from United Nations Population Fund 2007.]<strong>and</strong> <strong>the</strong>n decl<strong>in</strong>e (Smith <strong>and</strong> Ezzati 2005). Residents <strong>of</strong>urban areas liv<strong>in</strong>g <strong>in</strong> poverty, who are particularly numerous<strong>in</strong> <strong>Asia</strong>, experience considerable risk from both community<strong>and</strong> household exposures (Smith 1990). Such populationsare likely to have a larger environmental burden <strong>of</strong> disease,<strong>and</strong> a larger portion <strong>of</strong> <strong>the</strong>ir entire disease burden due toenvironmental risk factors, than do populations liv<strong>in</strong>g <strong>in</strong> <strong>the</strong>more developed regions (Smith et al. 1999).Figure 1 illustrates <strong>the</strong> <strong>in</strong>tegrated nature <strong>of</strong> <strong>the</strong> demographictransition, <strong>the</strong> epidemiologic transition, <strong>and</strong> <strong>the</strong>environmental risk transition. Although <strong>the</strong>se frameworkscan be used to aid <strong>the</strong> underst<strong>and</strong><strong>in</strong>g <strong>and</strong> management <strong>of</strong>environmental risks, <strong>the</strong>re can be significant local departuresfrom <strong>the</strong> overall trends predicted, because <strong>the</strong> processesdriv<strong>in</strong>g <strong>the</strong>se trends are dynamic <strong>and</strong> <strong>in</strong>terrelated.Changes <strong>in</strong> Population Age StructuresPopulation sizes <strong>in</strong> 2005 <strong>in</strong> major countries <strong>in</strong> <strong>Asia</strong> areprovided <strong>in</strong> Figure 2 by country; o<strong>the</strong>r than Ch<strong>in</strong>a <strong>and</strong>India, countries are grouped <strong>in</strong>to <strong>the</strong> three major <strong>Asia</strong>nregions: High-Income <strong>Asia</strong>, O<strong>the</strong>r South <strong>Asia</strong>, <strong>and</strong> O<strong>the</strong>rSou<strong>the</strong>ast <strong>Asia</strong>. About half <strong>the</strong> world lives <strong>in</strong> <strong>Asia</strong>, <strong>and</strong>approximately 80% <strong>of</strong> that half lives <strong>in</strong> India, Indonesia,or Ch<strong>in</strong>a. Evidence <strong>of</strong> a demographic transition can beseen <strong>in</strong> population projections for India, Indonesia, <strong>and</strong>Ch<strong>in</strong>a <strong>in</strong> Figure 3. At <strong>the</strong> earlier stages <strong>of</strong> development,<strong>the</strong> countries are characterized by a “youth bulge” (greaterpercentages <strong>of</strong> <strong>the</strong> population hav<strong>in</strong>g younger ages) <strong>in</strong><strong>the</strong>ir demographic pr<strong>of</strong>ile. Over time, as <strong>the</strong> younger populationages <strong>and</strong> as advances <strong>in</strong> health care <strong>and</strong> publichealth <strong>in</strong>frastructure promote <strong>in</strong>creased longevity <strong>of</strong> <strong>the</strong>older population, <strong>the</strong> population becomes more evenlydistributed across age groups.Status <strong>of</strong> <strong>and</strong> Trends <strong>in</strong> Disease BurdenIn <strong>the</strong> develop<strong>in</strong>g countries <strong>of</strong> <strong>Asia</strong>, <strong>the</strong> demographic<strong>and</strong> epidemiologic trends discussed above are reflected <strong>in</strong><strong>the</strong> burden <strong>of</strong> disease <strong>in</strong> terms <strong>of</strong> numbers <strong>of</strong> deaths <strong>in</strong> agiven year <strong>and</strong> lost years <strong>of</strong> healthy life (expressed as disability-adjustedlife-years [DALYs]) (Table 2). The burden<strong>of</strong> disease from communicable diseases, malnutrition, <strong>and</strong>maternal conditions (e.g., those related to childbear<strong>in</strong>g,such as from obstructed labor) or per<strong>in</strong>atal conditions persistsacross <strong>Asia</strong>, but at <strong>the</strong> same time, <strong>the</strong> burden <strong>of</strong> diseasefrom chronic noncommunicable diseases (such ashypertension, diabetes, ischemic heart disease [IHD], <strong>and</strong>cancer) is both substantial <strong>and</strong> <strong>in</strong>creas<strong>in</strong>g, ow<strong>in</strong>g to a variety<strong>of</strong> factors but most importantly to <strong>the</strong> <strong>in</strong>creased prevalence<strong>of</strong> tobacco smok<strong>in</strong>g, as well as <strong>in</strong>creas<strong>in</strong>g rates <strong>of</strong> obesity<strong>and</strong> changes <strong>in</strong> dietary patterns (Yusuf et al. 2001b; WHO2002; D<strong>in</strong>g <strong>and</strong> Malik 2008). Indoor air pollution result<strong>in</strong>gfrom domestic use <strong>of</strong> solid <strong>and</strong> fossil fuels is widespread,particularly <strong>in</strong> rural areas <strong>and</strong> urban slums, where itaccounts for a large fraction <strong>of</strong> cases <strong>of</strong> several diseases(<strong>in</strong>clud<strong>in</strong>g respiratory <strong>in</strong>fections <strong>and</strong> chronic obstructive24
HEI International Scientific Oversight CommitteeFigure 3. Past <strong>and</strong> projected population pyramids stratified by age groups for Ch<strong>in</strong>a, India, <strong>and</strong> Indonesia: 2000, 2025, <strong>and</strong> 2050. [Adapted from U.S. Census Bureau 2008.]25
<strong>Outdoor</strong> <strong>Air</strong> <strong>Pollution</strong> <strong>and</strong> <strong>Health</strong> <strong>in</strong> <strong>the</strong> Develop<strong>in</strong>g <strong>Countries</strong> <strong>of</strong> <strong>Asia</strong>Table 2. Deaths <strong>and</strong> DALYs <strong>in</strong> <strong>Asia</strong> <strong>in</strong> 2004, by WHO Region <strong>and</strong> Cause a Region bSou<strong>the</strong>ast <strong>Asia</strong> East <strong>Asia</strong> South <strong>Asia</strong> WorldPopulation (thous<strong>and</strong>s) 304,830 1,581,888 1,367,074 6,436,826Total deaths (thous<strong>and</strong>s) 2,741 10,995 12,539 58,772Total DALYs (thous<strong>and</strong>s) 70,721 248,631 372,258 1,523,259Cause <strong>of</strong>DeathNumber <strong>of</strong> Deaths (%)Number <strong>of</strong> DALYs (%) cCommunicable diseases,malnutrition, <strong>and</strong> maternal orper<strong>in</strong>atal conditions659 (24.0)19,644 (27.8)Lower respiratory <strong>in</strong>fections 168 (6.1)2,405 (3.4)Noncommunicable diseases 1,453 (53.0)35,476 (50.2)Malignant neoplasm 301 (11.0)3,533 (5.0)Tracheal, broncheal, orlung cancer51 (1.9)492 (0.7)Diabetes mellitus 81 (3.0)1,556 (2.2)Cardiovascular disease 642 (23.4)6,646 (9.4)Ischemic heart disease 277 (10.1)2,940 (4.2)COPD <strong>and</strong> asthma 131 (4.8)2,111 (3.0)Injury 629 (22.9)15,601 (22.1)1,432 (13.0)47,417 (19.1)346 (3.1)5,282 (2.1)8,452 (76.9)168,711 (67.9)2,023 (18.4)22,002 (8.8)425 (3.9)3,980 (1.6)192 (1.7)4,087 (1.6)3,708 (33.7)29,385 (11.8)898 (8.2)7,076 (2.8)1531 (13.9)14,530 (5.8)1,112 (10.1)32,503 (13.1)4,977 (39.7)165,233 (44.4)1,245 (9.9)25,916 (7.0)6,242 (49.8)159,809 (42.9)894 (7.1)10,606 (2.8)103 (0.8)1,007 (0.3)199 (1.6)3,336 (0.9)3,233 (25.8)35,415 (9.5)1,734 (13.8)18,643 (5.0)791 (6.3)11,712 ( 3.1)1,320 (10.5)47,217 (12.7)17,971 (30.6)603,993 (39.7)4,177 (7.1)94,511 (6.2)35,017 (59.6)731,652 (48.0)7,424 (12.6)77,812 (5.1)1,323 (2.3)11,766 (0.8)1,141 (1.9)19,705 (1.3)17,073 (29.0)151,377 (9.9)7,198 (12.2)62,587 (4.1)3,312 (5.6)46,513 (3.1)5,784 (9.8)187,614 (12.3)a Data compiled from WHO 2008.b For <strong>the</strong> follow<strong>in</strong>g WHO regions: “Sou<strong>the</strong>ast <strong>Asia</strong>” corresponds to Sou<strong>the</strong>ast <strong>Asia</strong>n Region B; “South <strong>Asia</strong>” to Sou<strong>the</strong>ast <strong>Asia</strong>n Region D; <strong>and</strong> “East <strong>Asia</strong>” toWestern Pacific Region B.c Data are shown as <strong>the</strong> number <strong>of</strong> deaths <strong>and</strong> number <strong>of</strong> DALYs from a given cause <strong>of</strong> death, each followed by <strong>the</strong> correspond<strong>in</strong>g regional percentage, whichis calculated as <strong>the</strong> number <strong>of</strong> deaths or DALYs divided by <strong>the</strong> total number <strong>of</strong> deaths or DALYs for <strong>the</strong> region, multiplied by 100.pulmonary disease [COPD]), especially among young children<strong>and</strong> women. High concentrations <strong>of</strong> outdoor air pollutionfrom stationary <strong>and</strong> mobile sources also contributeconsiderably to <strong>the</strong> burden <strong>of</strong> disease from disorders <strong>of</strong> <strong>the</strong>cardiovascular <strong>and</strong> respiratory systems (WHO 2002).Trends <strong>in</strong> Environmental RisksIn this section, we describe trends <strong>in</strong> household- <strong>and</strong> community-levelenvironmental exposures that illustrate <strong>the</strong>environmental risk transition <strong>in</strong> <strong>Asia</strong>. As described above,household environmental exposures generally decl<strong>in</strong>e with<strong>in</strong>creased development, whereas community-level exposures<strong>in</strong>crease <strong>in</strong>itially <strong>and</strong> <strong>the</strong>n gradually decl<strong>in</strong>e. The dist<strong>in</strong>ctionbetween household <strong>and</strong> community exposures may dependon whe<strong>the</strong>r <strong>the</strong> sett<strong>in</strong>g is urban or rural. For example, <strong>in</strong>urban areas, <strong>the</strong> use <strong>of</strong> solid fuel may contribute to bothhousehold <strong>and</strong> community exposures.Household Environmental Risks Household risks, suchas use <strong>of</strong> solid fuel b , unsafe dr<strong>in</strong>k<strong>in</strong>g water, <strong>and</strong> <strong>in</strong>adequatesanitation dom<strong>in</strong>ate <strong>the</strong> environmental burden for peopleliv<strong>in</strong>g <strong>in</strong> poverty. Because <strong>in</strong>frastructure is easier to establish<strong>and</strong> susta<strong>in</strong> <strong>in</strong> urban areas than rural areas, urban areas benefitsooner <strong>and</strong> <strong>of</strong>ten to a greater extent, particularly <strong>in</strong>b Household use <strong>of</strong> solid fuel is a common <strong>in</strong>dicator <strong>of</strong> <strong>in</strong>door air pollution<strong>in</strong> develop<strong>in</strong>g countries, where cook<strong>in</strong>g <strong>and</strong> heat<strong>in</strong>g with solid fuels is generallydone with <strong>in</strong>efficient stoves <strong>and</strong> <strong>in</strong>adequate ventilation. See HouseholdUse <strong>of</strong> Solid Fuels <strong>in</strong> Section II.26
HEI International Scientific Oversight Committeepoorer develop<strong>in</strong>g countries, from decreases <strong>in</strong> householdenvironmental risks associated with <strong>in</strong>creased economicdevelopment.Figure 4 <strong>and</strong> Figure 5 provide a cross-sectional view <strong>of</strong>household environmental risks <strong>in</strong> <strong>Asia</strong>n countries. Thepatterns shown are not representative <strong>of</strong> longitud<strong>in</strong>al patterns<strong>in</strong> environmental risk, but <strong>the</strong>y do suggest that substantialdecl<strong>in</strong>es <strong>in</strong> household use <strong>of</strong> solid fuel, <strong>in</strong>adequatesanitation, <strong>and</strong> unsafe dr<strong>in</strong>k<strong>in</strong>g water are associated with<strong>in</strong>creased <strong>in</strong>come. The difference <strong>in</strong> <strong>the</strong> environmentalrisks <strong>in</strong> rural <strong>and</strong> urban households is strik<strong>in</strong>g; most countrieswith average annual per capita <strong>in</strong>comes <strong>of</strong> more thanU.S. $5000 have elim<strong>in</strong>ated a large proportion <strong>of</strong> <strong>the</strong>household environmental risk <strong>in</strong> urban areas but not ruralareas. This is consistent with <strong>the</strong> notion that people liv<strong>in</strong>g<strong>in</strong> poverty, <strong>in</strong> both rural <strong>and</strong> urban areas, tend to bear alarger burden <strong>of</strong> environmental risk.Community-Level Risks Motor-vehicle ownership is one<strong>in</strong>dicator <strong>of</strong> <strong>the</strong> community-level risk associated with airpollution. Consistent with <strong>the</strong> environmental-risk-transitionframework, motor-vehicle ownership plotted aga<strong>in</strong>st<strong>in</strong>come yields a roughly S-shaped curve. Ownership<strong>in</strong>creases very slowly until it approaches a threshold, atwhich po<strong>in</strong>t <strong>the</strong>re is a sudden <strong>in</strong>crease <strong>and</strong> <strong>the</strong>n gradualattenuation. A cross-sectional comparison <strong>of</strong> develop<strong>in</strong>gcountries suggests that numbers <strong>of</strong> motorized vehicles<strong>in</strong>crease as <strong>the</strong> gross domestic product (GDP) per capita<strong>in</strong>creases (Figure 6). The data differ by type <strong>of</strong> motorvehicle; two-wheeled motor vehicles, which may(depend<strong>in</strong>g on <strong>the</strong> type <strong>of</strong> eng<strong>in</strong>e) have higher emissionsthan automobiles, tend to be more affordable <strong>and</strong> generallyare associated with a lower <strong>in</strong>come threshold at which <strong>the</strong>rate <strong>of</strong> ownership rises. One example <strong>of</strong> this is <strong>the</strong> relation<strong>of</strong> <strong>in</strong>come to vehicle ownership <strong>in</strong> Chennai, India, <strong>in</strong> 1993(Figure 7). More detailed <strong>in</strong>formation on motor-vehicleFigure 4. Trend <strong>of</strong> environmental risks <strong>in</strong> rural <strong>Asia</strong>, accord<strong>in</strong>g to household<strong>in</strong>come. PPP is purchas<strong>in</strong>g power parity, which is <strong>the</strong> GDP adjusted bylocal prices <strong>and</strong> normalized to U.S. conditions. [Data compiled from WHO2007b.]Figure 5. Trend <strong>of</strong> environmental risks <strong>in</strong> urban <strong>Asia</strong>, accord<strong>in</strong>g to household<strong>in</strong>come. PPP is purchas<strong>in</strong>g power parity, which is <strong>the</strong> GDP adjustedby local prices <strong>and</strong> normalized to U.S. conditions. [Data compiled fromWHO 2007b.]Figure 6. Motorization rates, accord<strong>in</strong>g to per capita <strong>in</strong>come. [Adaptedfrom World Bus<strong>in</strong>ess Council for Susta<strong>in</strong>able Development 2004.]Figure 7. Motor vehicle ownership <strong>in</strong> Chennai <strong>in</strong> 1993, accord<strong>in</strong>g tomonthly <strong>in</strong>come. [Adapted from World Bus<strong>in</strong>ess Council for Susta<strong>in</strong>ableDevelopment 2004.]27
<strong>Outdoor</strong> <strong>Air</strong> <strong>Pollution</strong> <strong>and</strong> <strong>Health</strong> <strong>in</strong> <strong>the</strong> Develop<strong>in</strong>g <strong>Countries</strong> <strong>of</strong> <strong>Asia</strong>Figure 8. Urban populations <strong>in</strong> <strong>the</strong> world <strong>and</strong> various regions <strong>of</strong> <strong>Asia</strong>,<strong>in</strong>clud<strong>in</strong>g future projections. [Data compiled from United Nations Economic<strong>and</strong> Social Affairs 2006.]ownership <strong>in</strong> <strong>Asia</strong> is provided later <strong>in</strong> Historic Patterns<strong>and</strong> Trends <strong>in</strong> Vehicle Production <strong>and</strong> Use <strong>of</strong> Motor Vehicles<strong>in</strong> Section II.Increased motor-vehicle ownership is also associatedwith <strong>in</strong>creased road-traffic fatalities. Projections suggestsubstantial <strong>in</strong>creases <strong>in</strong> motor vehicle–related fatalities,especially <strong>in</strong> <strong>Asia</strong> (Ma<strong>the</strong>rs <strong>and</strong> Loncar 2006).UrbanizationUrbanization is a major factor driv<strong>in</strong>g <strong>the</strong> environmentalrisk transition. As countries develop, <strong>the</strong>re is a tendency for<strong>in</strong>creased urbanization. Several years ago it was projectedthat by 2008, more than half <strong>of</strong> <strong>the</strong> world’s 3.3 billion peoplewould be liv<strong>in</strong>g <strong>in</strong> cities (United Nations Economic <strong>and</strong> SocialAffairs 2006; Figure 8). This population shift is especiallyFigure 9. Urban <strong>and</strong> rural fractions <strong>of</strong> <strong>the</strong> populations <strong>in</strong> <strong>Asia</strong>. Regionsare def<strong>in</strong>ed <strong>in</strong> Table 1. [Data compiled from WHO 2007b.]pronounced <strong>in</strong> <strong>Asia</strong>, where <strong>the</strong> urban population is expectedto double <strong>in</strong> <strong>the</strong> next 22 years, from 1.36 billion to 2.64billion. Figure 9 depicts current levels <strong>of</strong> urbanization <strong>in</strong> <strong>the</strong>five major <strong>Asia</strong>n regions (see Table 1). It is projected that by2030, <strong>Asia</strong>’s urban population will make up over half <strong>the</strong>world’s urban population.Patterns <strong>of</strong> urban growth differ around <strong>the</strong> world(United Nations Population Fund [UNFPA] 2007). Thoughurban growth is most <strong>of</strong>ten attributed to migration fromrural to urban areas, natural <strong>in</strong>creases <strong>in</strong> <strong>the</strong> urban population<strong>and</strong> reclassification <strong>of</strong> city boundaries also contributeto <strong>the</strong> <strong>in</strong>crease <strong>in</strong> city populations. For example, <strong>in</strong> India,natural <strong>in</strong>crease is <strong>the</strong> primary factor driv<strong>in</strong>g urbangrowth. In contrast, migration is <strong>the</strong> ma<strong>in</strong> factor driv<strong>in</strong>gurbanization <strong>in</strong> many Ch<strong>in</strong>ese cities, where populationgrowth is tightly regulated. Sidebar 3 describes various patterns<strong>of</strong> urbanization <strong>in</strong> several <strong>Asia</strong>n cities.Sidebar 3. CITIES IN TRANSITIONSHANGHAI, CHINAIn 2004, Shanghai was estimated to have a population <strong>of</strong>17.8 million people (<strong>Asia</strong> Pacific Energy Research Centre 2007;National Bureau <strong>of</strong> Statistics <strong>of</strong> Ch<strong>in</strong>a 2004). This is about1.3% <strong>of</strong> Ch<strong>in</strong>a’s total population <strong>of</strong> 1.3 billion. The city itselfcovers an area <strong>of</strong> about 6340 square kilometers, which isapproximately 0.06% <strong>of</strong> Ch<strong>in</strong>a’s total area. Consequently, <strong>the</strong>population density <strong>of</strong> Shanghai is quite high, with 2657 peopleper square kilometer (United Nations Economic <strong>and</strong> SocialCommission for <strong>Asia</strong> <strong>and</strong> <strong>the</strong> Pacific 2008).Shanghai was one <strong>of</strong> <strong>the</strong> first cities <strong>in</strong> Ch<strong>in</strong>a to experience anegative natural growth rate, <strong>and</strong> this trend cont<strong>in</strong>ues to <strong>the</strong>present. However, <strong>the</strong> total population <strong>of</strong> Shanghai is still<strong>in</strong>creas<strong>in</strong>g, ow<strong>in</strong>g to migration <strong>of</strong> people <strong>in</strong>to <strong>the</strong> city. In 1997,migration caused a net <strong>in</strong>crease <strong>of</strong> about 3.6 people per1000 population. In addition to migrants who permanentlysettle <strong>in</strong> Shanghai, <strong>the</strong> municipality also has a large float<strong>in</strong>gpopulation (def<strong>in</strong>ed as a population without household registry)that <strong>in</strong>cludes migrant workers <strong>and</strong> tourists.A low birth rate, coupled with an <strong>in</strong>creased life expectancy, hasled to an ag<strong>in</strong>g population <strong>in</strong> Shanghai. In 2000, just 12.91%<strong>of</strong> Shanghai’s population was below <strong>the</strong> age <strong>of</strong> 14 years, <strong>the</strong>lowest percentage <strong>of</strong> any Ch<strong>in</strong>ese city. However, Shanghai alsohad <strong>the</strong> highest proportion <strong>of</strong> people over <strong>the</strong> age <strong>of</strong> 65 years,11.53%, which is approximately 1.93 million people.The <strong>in</strong>crease <strong>in</strong> life expectancy is due to <strong>the</strong> decrease <strong>in</strong> mortalityrates. S<strong>in</strong>ce 1949, <strong>the</strong> mortality rate <strong>in</strong> Shanghai hasbeen steadily decreas<strong>in</strong>g to a level <strong>of</strong> about 6.2–6.7 deathsper 1000 people <strong>in</strong> 1990. However, with <strong>the</strong> ag<strong>in</strong>g populationCont<strong>in</strong>ued on next page28
HEI International Scientific Oversight CommitteeSidebar 3. CITIES IN TRANSITION(Cont<strong>in</strong>ued)Shanghai has also been experienc<strong>in</strong>g a trend toward <strong>the</strong>decentralization <strong>of</strong> population, employment, <strong>and</strong> <strong>in</strong>dustrialoutput s<strong>in</strong>ce 1990 (United Nations Human Settlements Program2004). Factors said to be contribut<strong>in</strong>g to this trend<strong>in</strong>clude high taxes, crime, congestion, <strong>and</strong> low environmentalquality with<strong>in</strong> <strong>the</strong> city, as well as <strong>the</strong> lower l<strong>and</strong> taxes <strong>and</strong> developmentcosts <strong>in</strong> <strong>the</strong> outskirts <strong>of</strong> <strong>the</strong> city. The improvement <strong>of</strong>transport systems has also allowed for <strong>the</strong> trend toward periurbanization.Increased decentralization <strong>and</strong> <strong>in</strong>creased urban growth havefueled <strong>the</strong> need for more private automobiles. Currently, Ch<strong>in</strong>ais <strong>the</strong> world’s second largest automobile market <strong>and</strong> <strong>the</strong>world’s third largest automobile manufacturer, home to plants<strong>of</strong> almost every car manufacturer <strong>in</strong> <strong>the</strong> world. In Shanghaialone, <strong>the</strong> number <strong>of</strong> private automobiles <strong>in</strong>creased from10,000 to 250,000 <strong>in</strong> just 8 years.HONG KONG, CHINAHong Kong’s population has been ris<strong>in</strong>g steadily for about <strong>the</strong>last half century, tripl<strong>in</strong>g from 1950 to about 2001. S<strong>in</strong>ce <strong>the</strong>n,however, <strong>the</strong> rate <strong>of</strong> population growth has decl<strong>in</strong>ed. The currentannual growth rate is estimated to be about 0.9%, whichfrom 2005 to 2006 represented <strong>the</strong> addition <strong>of</strong> 62,900people, for a total <strong>of</strong> 6.9 million. By 2031, <strong>the</strong> population isexpected to equal about 8.72 million.Underly<strong>in</strong>g much <strong>of</strong> <strong>the</strong> decrease <strong>in</strong> population growth is adecrease <strong>in</strong> <strong>the</strong> fertility rate among Hong Kong women. Thisdecl<strong>in</strong>e has been attributed to improved socioeconomic conditions,<strong>in</strong>creased numbers <strong>of</strong> women <strong>in</strong> <strong>the</strong> workforce, <strong>and</strong> atrend toward marry<strong>in</strong>g <strong>and</strong> rais<strong>in</strong>g children outside <strong>of</strong> HongKong. The decreas<strong>in</strong>g fertility rate coupled with a decreas<strong>in</strong>gdeath rate has led to <strong>the</strong> ag<strong>in</strong>g <strong>of</strong> <strong>the</strong> population. It is estimatedthat by 2031, a quarter <strong>of</strong> Hong Kong’s population willbe over <strong>the</strong> age <strong>of</strong> 65 (Figure 3.1) <strong>and</strong> <strong>the</strong> number <strong>of</strong> thoseover <strong>the</strong> age <strong>of</strong> 85 will triple (Census <strong>and</strong> Statistics Department2010).Hong Kong’s decreas<strong>in</strong>g growth rate, which contrasts stronglywith many cities <strong>in</strong> ma<strong>in</strong>l<strong>and</strong> Ch<strong>in</strong>a, is due not only to <strong>the</strong>decreas<strong>in</strong>g fertility rate but also to Hong Kong’s strict immigrationpolicy. This policy, termed <strong>the</strong> one-way permit scheme, restrictsimmigration <strong>in</strong>to Hong Kong to 150 people per day. This limit hasrema<strong>in</strong>ed unchanged s<strong>in</strong>ce its establishment <strong>in</strong> 1995. However,immigration still accounts for 93% <strong>of</strong> <strong>the</strong> population growth.BANGKOK, THAILANDBangkok’s population has been steadily grow<strong>in</strong>g for <strong>the</strong> lasthalf century <strong>and</strong> is expected to cont<strong>in</strong>ue to do so. However, itsportion <strong>of</strong> Thail<strong>and</strong>’s total urban population is decl<strong>in</strong><strong>in</strong>gFigure 3.1. Trends <strong>in</strong> <strong>the</strong> population <strong>of</strong> Hong Kong, 1971–2031. [Datafrom Hong Kong Annual Digest <strong>of</strong> Statistics, 2002 Edition; Hong KongMonthly Digest <strong>of</strong> Statistics, November 2002; <strong>and</strong> Projected Mid-Year Populationby Age Group <strong>and</strong> Sex for 2002–2031, Census <strong>and</strong> StatisticsDepartment (Government <strong>of</strong> Hong Kong Special Adm<strong>in</strong>istrative Region).]because <strong>the</strong> growth rate <strong>in</strong> smaller urban areas is <strong>in</strong>creas<strong>in</strong>gwhile Bangkok’s growth rate is decreas<strong>in</strong>g. From 1950, <strong>the</strong>population growth rate <strong>of</strong> Bangkok has halved. Yet Bangkok isstill <strong>the</strong> largest city <strong>in</strong> Thail<strong>and</strong>, with a population <strong>of</strong> about 8.1million people.Bangkok’s <strong>in</strong>ner-city population density decreased over 1970–1998, while <strong>the</strong> fr<strong>in</strong>ges <strong>of</strong> <strong>the</strong> city <strong>in</strong>creased <strong>in</strong> density. A study byMurakami <strong>and</strong> colleagues (2005) us<strong>in</strong>g various urbanization modelsclassified Bangkok as be<strong>in</strong>g on <strong>the</strong> br<strong>in</strong>k <strong>of</strong> suburbanization.CHENNAI, INDIAChennai is <strong>the</strong> fourth largest city <strong>in</strong> India, with an estimated 7.5million people <strong>and</strong> a population density <strong>of</strong> about 5847 peopleper square kilometer <strong>in</strong> 2006; <strong>in</strong> <strong>the</strong> same year, <strong>the</strong> urban population<strong>of</strong> Chennai was estimated at 4.3 million. In recentyears, Chennai’s growth rate has slowed to about less than 1%(World Bank 2005).The population <strong>of</strong> <strong>the</strong> Chennai slums has been particularly wellcharacterized. A 2001 population study <strong>of</strong> Chennai classifiedabout 0.8 million people as liv<strong>in</strong>g <strong>in</strong> slums, mak<strong>in</strong>g up approximately22% <strong>of</strong> <strong>the</strong> city’s population at that time (Census <strong>of</strong>India 2001). The Chennai residents liv<strong>in</strong>g <strong>in</strong> slums accountedfor 5% <strong>of</strong> India’s total slum population <strong>in</strong> 2001. Just 2 yearslater, <strong>in</strong> 2003, <strong>the</strong> slum population <strong>in</strong> Chennai was estimatedat 1.08 million people, account<strong>in</strong>g for over a quarter <strong>of</strong> <strong>the</strong>city’s total population (Ch<strong>and</strong>ramouli 2003). A survey <strong>of</strong>Chennai hous<strong>in</strong>g <strong>in</strong> areas classified as slums showed that 64%<strong>of</strong> <strong>the</strong> houses are permanent, with approximately 40% <strong>of</strong> <strong>the</strong>serented out ra<strong>the</strong>r than owner-occupied. Researchers believethis comb<strong>in</strong>ation <strong>of</strong> permanent homes be<strong>in</strong>g rental property isevidence <strong>of</strong> <strong>the</strong> presence <strong>of</strong> l<strong>and</strong>lords who pr<strong>of</strong>it from but donot ma<strong>in</strong>ta<strong>in</strong> <strong>the</strong>ir properties (Ch<strong>and</strong>ramouli 2003). Most <strong>of</strong><strong>the</strong> hous<strong>in</strong>g consists <strong>of</strong> one-room tenements, suggest<strong>in</strong>g asevere lack <strong>of</strong> space. Of <strong>the</strong> more than 1 million people liv<strong>in</strong>gunder such conditions <strong>in</strong> Chennai, only 26% have access todr<strong>in</strong>k<strong>in</strong>g water near <strong>the</strong>ir homes.29
<strong>Outdoor</strong> <strong>Air</strong> <strong>Pollution</strong> <strong>and</strong> <strong>Health</strong> <strong>in</strong> <strong>the</strong> Develop<strong>in</strong>g <strong>Countries</strong> <strong>of</strong> <strong>Asia</strong>Figure 10. Populations <strong>of</strong> various megacities (> 10 million <strong>in</strong>habitants) worldwide, <strong>in</strong>clud<strong>in</strong>g future projections. Megacities are ordered accord<strong>in</strong>g to<strong>the</strong>ir population size <strong>in</strong> 2003. [Adapted from United Nations Economic <strong>and</strong> Social Affairs 2004b.]City Size Megacities are cities with a population over10 million. As <strong>of</strong> 2000, over half <strong>the</strong> 20 megacities <strong>in</strong> <strong>the</strong>world were <strong>in</strong> <strong>Asia</strong>: Tokyo, Mumbai, Delhi, Shanghai,Kolkata, Jakarta, Dhaka, Osaka–Kobe, Karachi, Beij<strong>in</strong>g, <strong>and</strong>Manila (United Nations Economic <strong>and</strong> Social Affairs2004b). Six <strong>of</strong> <strong>the</strong>se megacities are among <strong>the</strong> top 10largest cities <strong>in</strong> <strong>the</strong> world. Although Tokyo is currently <strong>the</strong>only city <strong>in</strong> <strong>Asia</strong> with more than 20 million residents (i.e.,a metacity), it is projected that <strong>Asia</strong> will have five metacitiesby 2020 (United Nations Human Settlements Programme[UN-Habitat] 2006a) (see Figure 10).Despite <strong>the</strong> large size <strong>of</strong> megacities, <strong>the</strong>y are home toonly about 4% <strong>of</strong> <strong>the</strong> world’s urbanites (UN-Habitat2006b). Smaller towns <strong>and</strong> cities have rapidly <strong>in</strong>creas<strong>in</strong>gpopulations <strong>and</strong> account for <strong>the</strong> bulk <strong>of</strong> <strong>the</strong> trend <strong>in</strong> urbangrowth. The majority <strong>of</strong> people undergo<strong>in</strong>g <strong>the</strong> shift fromrural to urban areas come from <strong>the</strong> smaller cities <strong>and</strong> towns<strong>in</strong> <strong>the</strong> poorer develop<strong>in</strong>g world. About 53% <strong>of</strong> <strong>the</strong> worldwideurban population lives <strong>in</strong> cities with < 500,000 residents<strong>and</strong> ano<strong>the</strong>r 22% live <strong>in</strong> cities with 1–5 millionresidents. Moreover, despite <strong>the</strong> rapid growth <strong>in</strong> urban populations,<strong>Asia</strong> cont<strong>in</strong>ues to have a substantial rural population.As <strong>of</strong> 2005, 71% <strong>of</strong> all rural dwellers lived <strong>in</strong> <strong>Asia</strong>.Urban L<strong>and</strong> Use Urban sprawl can be categorized asresidential suburbanization or peri-urbanization. Residentialsuburbanization refers to planned growth consist<strong>in</strong>gmostly <strong>of</strong> hous<strong>in</strong>g for s<strong>in</strong>gle families <strong>in</strong> <strong>the</strong> middle to upperclasses built at low density away from <strong>the</strong> city center. Thissuburbanization can lead to <strong>in</strong>creased commut<strong>in</strong>g <strong>and</strong> associated<strong>in</strong>creases <strong>in</strong> energy use <strong>and</strong> vehicular pollution. Periurbanizationrefers to <strong>the</strong> unplanned expansion <strong>of</strong> economicactivities <strong>in</strong>to <strong>the</strong> areas surround<strong>in</strong>g an urban center;this occurs mostly <strong>in</strong> <strong>the</strong> transitional zones between urban<strong>and</strong> rural boundaries. In <strong>Asia</strong>, peri-urbanization is <strong>of</strong>tencharacterized by <strong>the</strong> <strong>in</strong>corporation <strong>of</strong> adjacent rural areas orsmall towns <strong>in</strong>to larger urban settlements. Peri-urbanizationis <strong>of</strong>ten associated with disorderly growth <strong>and</strong> lack <strong>of</strong> regulation,followed by environmental degradation.While urbanization <strong>in</strong> <strong>Asia</strong> is <strong>in</strong>creas<strong>in</strong>g, factors such asdecreases <strong>in</strong> family size <strong>and</strong> <strong>in</strong>creased car ownership arecontribut<strong>in</strong>g to decl<strong>in</strong><strong>in</strong>g urban density <strong>and</strong> greater urbansprawl <strong>and</strong> suburbanization. For example, from 1989–2001, while <strong>the</strong> Kuala Lumpur metropolitan area experienceda near-doubl<strong>in</strong>g <strong>in</strong> its built environment (<strong>the</strong> manmadestructures <strong>in</strong> an environment) <strong>and</strong> an <strong>in</strong>crease <strong>in</strong> itsurban population from 2.7 million to 5 million, <strong>the</strong> city’spopulation density decl<strong>in</strong>ed from 7130 to 6160 people persquare kilometer (Lea<strong>the</strong>r 2008). If <strong>Asia</strong> follows a Westernpathway <strong>of</strong> suburbanization, <strong>in</strong>creased sprawl may result<strong>in</strong> <strong>in</strong>creased formation <strong>of</strong> ozone (O 3 ), emissions <strong>of</strong> nitrogenoxides (NO x ) <strong>and</strong> carbon dioxide (CO 2 ), <strong>and</strong> more regionalair pollution.30
HEI International Scientific Oversight CommitteeFigure 11. Degree <strong>of</strong> urbanization accord<strong>in</strong>g to gross national <strong>in</strong>come(GNI) per capita <strong>in</strong> various <strong>Asia</strong>n countries <strong>in</strong> 2005. [Data compiled fromWHO 2007b.]A cross-sectional sampl<strong>in</strong>g <strong>of</strong> <strong>Asia</strong>n countries showsthat <strong>in</strong>creases <strong>in</strong> <strong>in</strong>come are associated with a larger proportion<strong>of</strong> <strong>the</strong> population liv<strong>in</strong>g <strong>in</strong> urban areas (Figure 11).This is particularly true at <strong>the</strong> lower end <strong>of</strong> <strong>in</strong>come <strong>and</strong>urbanization scales. Once approximately half <strong>the</strong> population<strong>in</strong> a given <strong>Asia</strong>n country lives <strong>in</strong> urban areas, <strong>the</strong>degree <strong>of</strong> wealth <strong>in</strong> that country ranges widely.While <strong>in</strong>creased economic growth is associated with<strong>in</strong>creased urbanization, <strong>the</strong> majority <strong>of</strong> urban populationgrowth <strong>in</strong> develop<strong>in</strong>g countries occurs among peopleliv<strong>in</strong>g <strong>in</strong> poverty <strong>and</strong> results <strong>in</strong> <strong>in</strong>creases <strong>in</strong> <strong>the</strong> number <strong>of</strong><strong>in</strong>formal settlements, called “slums,” ”shantytowns,” or“squatter hous<strong>in</strong>g.” A “slum household” is def<strong>in</strong>ed by <strong>the</strong>UN-Habitat as “a group <strong>of</strong> <strong>in</strong>dividuals liv<strong>in</strong>g under <strong>the</strong> samero<strong>of</strong> <strong>in</strong> an urban area who lack one or more <strong>of</strong> <strong>the</strong> follow<strong>in</strong>g:durable hous<strong>in</strong>g, sufficient liv<strong>in</strong>g area, access to improvedwater, access to sanitation <strong>and</strong> secure tenure” (UNFPA2007). Worldwide, <strong>the</strong>re are over 1 billion people liv<strong>in</strong>g <strong>in</strong>“slum households,” account<strong>in</strong>g for about one sixth <strong>of</strong> <strong>the</strong>total global population. The United Nations estimates that<strong>in</strong> 2001, 554 million people <strong>in</strong> <strong>Asia</strong> lived <strong>in</strong> such households— more than half <strong>the</strong> urban population — with 262million <strong>in</strong> South <strong>Asia</strong> alone (UN-Habitat 2003).<strong>Air</strong> <strong>Pollution</strong>, Poverty, <strong>and</strong> <strong>Health</strong>There is emerg<strong>in</strong>g evidence, largely from studies <strong>in</strong>Europe <strong>and</strong> North America, that economic deprivation<strong>in</strong>creases <strong>the</strong> magnitude <strong>of</strong> air pollution–related morbidity<strong>and</strong> mortality (Krewski et al. 2000). There are two majorreasons why this may be true (O’Neill et al. 2003): First,economically disadvantaged communities are exposed tohigher concentrations <strong>of</strong> air pollution; <strong>and</strong> second,because <strong>of</strong> poorer nutrition, less access to medical care,<strong>and</strong> o<strong>the</strong>r factors, people <strong>in</strong> <strong>the</strong>se communities experiencemore health impact per unit <strong>of</strong> pollution exposure (i.e., aremore vulnerable to health effects). In addition, air pollutioncould exacerbate <strong>the</strong> conditions <strong>of</strong> poverty. The relativeimpact <strong>of</strong> air pollution has been observed to be modified bygroup or neighborhood characteristics, such as liv<strong>in</strong>g <strong>in</strong>slums (Gouveia et al. 2004) or liv<strong>in</strong>g <strong>in</strong> highly polluted areas(Jerrett et al. 2004). At <strong>the</strong> same time, because <strong>of</strong> <strong>the</strong> challenges<strong>of</strong> expla<strong>in</strong><strong>in</strong>g <strong>the</strong> observed group-level effects, <strong>in</strong>dividualestimates <strong>of</strong> exposure <strong>and</strong> socioeconomic positioncont<strong>in</strong>ue to be used <strong>in</strong> analyses.Previous studies us<strong>in</strong>g characteristics <strong>of</strong> <strong>in</strong>dividuals toassess changes <strong>in</strong> <strong>the</strong> magnitude <strong>of</strong> <strong>the</strong> air pollution effectestimate (i.e., effect modification) by socioeconomic positionsuggest that a low level <strong>of</strong> education (Gouveia et al.2004; Jerrett et al. 2004) <strong>and</strong> low family <strong>in</strong>come (Gouveiaet al. 2004) are associated with <strong>in</strong>creased health effectsthat are related to air pollution. Evidence also suggests thatgroup-level <strong>in</strong>dicators, such as residence <strong>in</strong> a poor neighborhood,could be risk factors above <strong>and</strong> beyond <strong>the</strong> socioeconomicposition <strong>of</strong> an <strong>in</strong>dividual (Malmström et al.1999). This f<strong>in</strong>d<strong>in</strong>g underscores <strong>the</strong> importance <strong>of</strong> us<strong>in</strong>ganalyses that <strong>in</strong>clude hierarchical models that <strong>in</strong>tegrate<strong>in</strong>dividual <strong>and</strong> group-level <strong>in</strong>dicators <strong>of</strong> socioeconomicposition.The public health <strong>and</strong> social policy implications <strong>of</strong> <strong>the</strong>relations among health, air pollution, <strong>and</strong> poverty arelikely to be important, especially <strong>in</strong> areas such as <strong>Asia</strong>,where air pollution concentrations are high <strong>and</strong> many live<strong>in</strong> poverty. However, <strong>the</strong> <strong>in</strong>teraction between poverty <strong>and</strong><strong>the</strong> health effects <strong>of</strong> air pollution has been studied little <strong>in</strong>develop<strong>in</strong>g countries <strong>in</strong> general <strong>and</strong> <strong>in</strong> <strong>Asia</strong> <strong>in</strong> particular.Therefore, results from Western studies can only be extrapolatedwith considerable uncerta<strong>in</strong>ty (Cohen et al. 2004).The composition <strong>and</strong> relative contribution <strong>of</strong> <strong>in</strong>door <strong>and</strong>outdoor sources <strong>of</strong> exposure are likely to be very different<strong>in</strong> <strong>the</strong> West <strong>and</strong> <strong>in</strong> <strong>Asia</strong>, <strong>and</strong> <strong>the</strong> impacts <strong>of</strong> exposure, aswell as <strong>the</strong> <strong>in</strong>fluence <strong>of</strong> economic deprivation on thoseimpacts, may be greater <strong>in</strong> <strong>Asia</strong>. To help address this issue,HEI’s PAPA program, with support from <strong>the</strong> <strong>Asia</strong>n DevelopmentBank, conducted a study <strong>of</strong> air pollution, poverty,<strong>and</strong> health <strong>in</strong> Ho Chi M<strong>in</strong>h City, Vietnam, with results tobe published <strong>in</strong> 2011 (see Sidebar 4).SOURCESTo place air pollution <strong>in</strong> <strong>Asia</strong> <strong>in</strong> <strong>the</strong> context <strong>of</strong> ourexist<strong>in</strong>g knowledge, it is helpful to describe historical patterns<strong>of</strong> air pollution associated with development. <strong>Air</strong>pollution has traditionally been associated with reducedatmospheric visibility <strong>and</strong> <strong>in</strong>creased mortality <strong>and</strong> morbidity.For example, dur<strong>in</strong>g a pollution episode <strong>in</strong> London<strong>in</strong> December 1952, <strong>the</strong> concentration <strong>of</strong> British smoke (an<strong>in</strong>dicator <strong>of</strong> particulate matter [PM]) <strong>and</strong> sulfur dioxide(SO 2 ) exceeded 1000 µg/m 3 <strong>and</strong> <strong>the</strong>re were thous<strong>and</strong>s <strong>of</strong>31
<strong>Outdoor</strong> <strong>Air</strong> <strong>Pollution</strong> <strong>and</strong> <strong>Health</strong> <strong>in</strong> <strong>the</strong> Develop<strong>in</strong>g <strong>Countries</strong> <strong>of</strong> <strong>Asia</strong>Sidebar 4. THE PAPA STUDY IN VIETNAMWith extensive numbers <strong>of</strong> <strong>the</strong> world’s lowest-<strong>in</strong>come peopleliv<strong>in</strong>g <strong>in</strong> highly polluted areas <strong>of</strong> <strong>Asia</strong>’s cities, <strong>in</strong>creased effects<strong>of</strong> air pollution on <strong>the</strong> health <strong>of</strong> <strong>the</strong>se populations would havelarge impacts on both public health <strong>and</strong> relevant policy. However,few studies <strong>of</strong> <strong>the</strong> <strong>in</strong>teraction between poverty <strong>and</strong> <strong>the</strong>health effects <strong>of</strong> air pollution have been conducted <strong>in</strong> develop<strong>in</strong>gcountries <strong>in</strong> general <strong>and</strong> <strong>in</strong> <strong>Asia</strong> <strong>in</strong> particular. The abilityto conduct such studies is currently compromised by <strong>the</strong> relativelack <strong>of</strong> reliable <strong>and</strong> easily accessible data on health outcomes,rout<strong>in</strong>ely collected air quality data, <strong>and</strong> opportunitiesfor collaboration between <strong>the</strong> health <strong>and</strong> environment sectors.To date, no studies <strong>of</strong> this type have been conducted <strong>in</strong> <strong>the</strong>poorest Sou<strong>the</strong>ast <strong>Asia</strong>n countries: Laos, Cambodia, <strong>and</strong>Vietnam.In cooperation with <strong>the</strong> <strong>Asia</strong>n Development Bank, HEI’s PAPAprogram, <strong>and</strong> <strong>the</strong> Ho Chi M<strong>in</strong>h City People’s Committee, an<strong>in</strong>terdiscipl<strong>in</strong>ary team <strong>of</strong> local <strong>and</strong> <strong>in</strong>ternational expertslaunched a unique collaboration to assess <strong>the</strong> health effects<strong>of</strong> air pollution among residents <strong>of</strong> Ho Chi M<strong>in</strong>h City who live <strong>in</strong>poverty. The project consists <strong>of</strong> a hospital-based assessment<strong>of</strong> <strong>the</strong> effect <strong>of</strong> short-term exposure to air pollution on <strong>the</strong> respiratoryhealth <strong>of</strong> young children, as well as a household-basedcharacterization <strong>of</strong> exposures <strong>of</strong> people liv<strong>in</strong>g <strong>in</strong> poverty to multiplesources <strong>of</strong> pollution <strong>and</strong> an assessment <strong>of</strong> <strong>the</strong> correlationbetween ambient concentrations <strong>and</strong> personal exposures.The hospital component <strong>of</strong> <strong>the</strong> study estimated <strong>the</strong> effects <strong>of</strong>short-term exposure to air pollution on hospital admissions forALRI <strong>in</strong> young children (< 5 years) <strong>in</strong> Ho Chi M<strong>in</strong>h City. It alsocompared <strong>the</strong> magnitude <strong>of</strong> <strong>the</strong> effect <strong>of</strong> air pollution, particularlyPM 10 , on children liv<strong>in</strong>g <strong>in</strong> poverty with that among childrenwho do not live <strong>in</strong> poverty, us<strong>in</strong>g <strong>in</strong>dividual-level <strong>and</strong>group-level <strong>in</strong>dicators <strong>of</strong> socioeconomic status.The ambient monitors used to assess exposure <strong>in</strong> <strong>the</strong> hospitalcomponent <strong>of</strong> <strong>the</strong> study would not capture data that couldshow whe<strong>the</strong>r economically disadvantaged children experiencehigher actual exposures to air pollution than children whoare not economically disadvantaged. Therefore, <strong>the</strong> collaboratorsacknowledged <strong>the</strong> need to assess <strong>the</strong> extent to whichlocalized sources may contribute to error <strong>in</strong> <strong>the</strong> measurement<strong>of</strong> exposure aris<strong>in</strong>g from <strong>the</strong> use <strong>of</strong> ambient monitor<strong>in</strong>g data toestimate health impacts, particularly <strong>in</strong> subgroups.One objective <strong>of</strong> <strong>the</strong> household component <strong>of</strong> <strong>the</strong> study is toassess determ<strong>in</strong>ants <strong>of</strong> personal exposure for each economicgroup <strong>and</strong> to explore whe<strong>the</strong>r <strong>the</strong> use <strong>of</strong> ambient monitors as asurrogate for personal exposures results <strong>in</strong> exposure misclassificationacross socioeconomic strata.The broader objective <strong>of</strong> <strong>the</strong> household study is to characterize<strong>the</strong> exposures <strong>of</strong> residents <strong>of</strong> poor households <strong>in</strong> Ho Chi M<strong>in</strong>hCity to air pollution from multiple sources. Us<strong>in</strong>g monitor<strong>in</strong>g<strong>and</strong> model<strong>in</strong>g-based approaches, daily average PM 10 concentrationsfrom ambient monitor<strong>in</strong>g sites (Figure 4.1) are be<strong>in</strong>gcompared with repeated measures <strong>of</strong> personal exposures <strong>of</strong>residents from various socioeconomic groups resid<strong>in</strong>g close to<strong>the</strong> ambient monitors. Household surveys are be<strong>in</strong>g <strong>in</strong>tegratedwith repeated (longitud<strong>in</strong>al) measurements <strong>of</strong> personal exposuresto provide a better assessment <strong>of</strong> how exposure patternsvary by age, sex, <strong>and</strong> socioeconomic status.By compar<strong>in</strong>g more precise estimates <strong>of</strong> <strong>in</strong>dividual personalexposure with estimates based on ambient monitor<strong>in</strong>g data,<strong>the</strong> presence <strong>of</strong> systematic daily differences <strong>in</strong> <strong>the</strong> majorCont<strong>in</strong>ued on next pageexcess deaths per day (Brimblecombe 1987; Bell <strong>and</strong> Davis2001). This comb<strong>in</strong>ation <strong>of</strong> pollutants, called sulfurous orLondon smog, has largely disappeared from London <strong>and</strong>o<strong>the</strong>r cities <strong>in</strong> developed countries, because <strong>of</strong> <strong>the</strong> enactment<strong>of</strong> clean-air legislation that led to <strong>the</strong> markeddecrease <strong>in</strong> or outright elim<strong>in</strong>ation <strong>of</strong> <strong>the</strong> use <strong>of</strong> “dirty”coal. In many <strong>Asia</strong>n cities, however, uncontrolled combustion<strong>of</strong> coal <strong>and</strong> o<strong>the</strong>r dirty fuels still occurs on bothdomestic <strong>and</strong> <strong>in</strong>dustrial scales, result<strong>in</strong>g <strong>in</strong> pollutant concentrationssimilar to those observed dur<strong>in</strong>g London’s sulfuroussmog episodes <strong>of</strong> <strong>the</strong> 1950s.For example, <strong>the</strong> 95th-percentile values <strong>of</strong> <strong>the</strong> dailyaverage concentrations <strong>of</strong> total suspended particles (TSP)ranged from 493 to 1280 µg/m 3 <strong>in</strong> <strong>the</strong> Ch<strong>in</strong>ese cities <strong>of</strong>Chongq<strong>in</strong>g, Guangzhou, Lanzhou, <strong>and</strong> Wuhan dur<strong>in</strong>g1993–1996 (Qian ZM et al. 2001). The air pollution sourcescontribut<strong>in</strong>g to such TSP concentrations represent anopportunity for relatively straightforward actions toimprove air quality <strong>in</strong> <strong>Asia</strong>, follow<strong>in</strong>g on <strong>the</strong> efforts <strong>in</strong>North America <strong>and</strong> Western Europe that have been undertakenover <strong>the</strong> past 50 years. Develop<strong>in</strong>g countries <strong>in</strong> <strong>Asia</strong>have <strong>the</strong> potential to benefit from exist<strong>in</strong>g air pollutioncontrol technologies <strong>and</strong> previous experience with airquality management programs to improve air quality morerapidly than developed countries did. Of great relevance to<strong>Asia</strong> is that <strong>the</strong> North American <strong>and</strong> Western Europeanexperience demonstrates that air quality can be improveddur<strong>in</strong>g periods <strong>of</strong> rapid economic development.Ano<strong>the</strong>r important pollutant is photochemical smog orLos Angeles smog, as it was hypo<strong>the</strong>sized to be a component<strong>of</strong> <strong>the</strong> air pollution problem <strong>in</strong> Los Angeles <strong>in</strong> 1954.Photochemical smog is formed by complex chemical reactions<strong>of</strong> hydrocarbons <strong>and</strong> NO x <strong>in</strong> <strong>the</strong> presence <strong>of</strong> solar radiation.Secondary pollutants that arise from <strong>the</strong>sephotochemical reactions <strong>in</strong>clude O 3 <strong>and</strong> o<strong>the</strong>r oxidantssuch as peroxyacetyl nitrate, sulfuric acid, nitric acid,32
HEI International Scientific Oversight CommitteeSidebar 4. THE PAPA STUDY IN VIETNAM (Cont<strong>in</strong>ued)sources <strong>and</strong> levels <strong>of</strong> exposure across <strong>the</strong> spectrum <strong>of</strong> socioeconomicstatus can be assessed. This <strong>in</strong>formation will suggest<strong>the</strong> extent to which ambient monitor<strong>in</strong>g data reflectpersonal exposures among subpopulations. As such, it will aid<strong>in</strong> <strong>the</strong> <strong>in</strong>terpretation <strong>of</strong> <strong>the</strong> results from <strong>the</strong> hospital component,as well as <strong>the</strong> design <strong>of</strong> future epidemiologic studies <strong>of</strong>air pollution, poverty, <strong>and</strong> health <strong>in</strong> Ho Chi M<strong>in</strong>h City.Figure 4.1. Average daily PM 10 concentrations <strong>in</strong> Ho Chi M<strong>in</strong>h City, 2003–2005. The mean lag time was 1 to 7 days. [Source: CollaborativeWork<strong>in</strong>g Group on <strong>Air</strong> <strong>Pollution</strong>, Poverty, <strong>and</strong> <strong>Health</strong> <strong>in</strong> Ho Chi M<strong>in</strong>h City 2009 (Draft Investigators’ Report submitted to HEI).]sulfate (SO 4 2 ) <strong>and</strong> nitrate (NO 3 ) particles, <strong>and</strong> oxidizedorganic compounds. Automobile emissions are ma<strong>in</strong>ly responsiblefor <strong>the</strong> photochemical smog observed <strong>in</strong> Los Angeles.The number <strong>of</strong> automobiles has <strong>in</strong>creased around <strong>the</strong>world, especially <strong>in</strong> <strong>Asia</strong>n develop<strong>in</strong>g countries <strong>in</strong> recentyears. Thus, photochemical smog now is commonplace <strong>in</strong>many metropolitan areas <strong>of</strong> <strong>Asia</strong> (e.g., Beij<strong>in</strong>g, Guangzhou,Delhi, <strong>and</strong> Bangkok) (Oanh <strong>and</strong> Zhang 2004; Song Y et al.2007; Xu J et al. 2008). Photochemical smog is not limited tourban centers, but ra<strong>the</strong>r spreads throughout larger areas(Sidebars 5 <strong>and</strong> 6). Transport processes allow O 3 <strong>and</strong> PMwith an aerodynamic diameter 2.5 µm (PM 2.5 ) to travelgreat distances (i.e., more than thous<strong>and</strong>s <strong>of</strong> kilometers)away from <strong>the</strong>ir sources or <strong>the</strong> sources <strong>of</strong> <strong>the</strong>ir precursors(U.S. Environmental Protection Agency [U.S. EPA] 1993).The magnitude <strong>and</strong> duration <strong>of</strong> periods <strong>of</strong> overlapbetween sulfurous <strong>and</strong> photochemical smog may be muchlarger <strong>in</strong> cities <strong>in</strong> develop<strong>in</strong>g countries today than <strong>in</strong>Western cities historically, ow<strong>in</strong>g to <strong>the</strong> presence <strong>of</strong>sources that contribute to both types <strong>of</strong> pollution. Forexample, locations <strong>in</strong> which high-sulfur diesel fuel is <strong>in</strong>use also have considerable emissions <strong>of</strong> primary SO 2 4 ,<strong>and</strong> SO 2 (Santoso et al. 2008). Thus, motor vehicles maysimultaneously contribute to both sulfurous <strong>and</strong> photochemicalsmog.33
<strong>Outdoor</strong> <strong>Air</strong> <strong>Pollution</strong> <strong>and</strong> <strong>Health</strong> <strong>in</strong> <strong>the</strong> Develop<strong>in</strong>g <strong>Countries</strong> <strong>of</strong> <strong>Asia</strong>The Pearl River Delta, located ma<strong>in</strong>ly <strong>in</strong> Ch<strong>in</strong>a’sGuangdong Prov<strong>in</strong>ce, covers an area <strong>of</strong> approximately10,000 square kilometers <strong>and</strong> extends toHong Kong <strong>and</strong> Macao (Figure 5.1). The PearlRiver Delta has one <strong>of</strong> <strong>the</strong> highest population densities<strong>in</strong> Ch<strong>in</strong>a, account<strong>in</strong>g for approximately 38%<strong>of</strong> <strong>the</strong> total population (i.e., 83 million people) <strong>of</strong>Guangdong Prov<strong>in</strong>ce. The total population <strong>in</strong> <strong>the</strong>delta is estimated to be 39 million people,<strong>in</strong>clud<strong>in</strong>g about 7 million <strong>in</strong> Hong Kong <strong>and</strong>0.4 million <strong>in</strong> Macao.Before 1985, <strong>the</strong> Pearl River Delta area(exclud<strong>in</strong>g Hong Kong <strong>and</strong> Macao) was one <strong>of</strong> <strong>the</strong>ma<strong>in</strong> agricultural bases <strong>in</strong> Ch<strong>in</strong>a, with a GDP <strong>of</strong>U.S. $8 billion <strong>in</strong> 1980. The Pearl River Delta was<strong>the</strong> first region to become open to free-marketeconomic reform <strong>and</strong> thus experienced rapideconomic growth. In 2005, <strong>the</strong> region’s GDP wasapproximately U.S. $232 billion. The Pearl RiverDelta region is now <strong>the</strong> largest base <strong>of</strong> <strong>the</strong> manufactur<strong>in</strong>g<strong>in</strong>dustry <strong>in</strong> Ch<strong>in</strong>a, employ<strong>in</strong>g more than11 million workers <strong>in</strong> 2003, while still rema<strong>in</strong><strong>in</strong>gone <strong>of</strong> <strong>the</strong> ma<strong>in</strong> agricultural bases for rice production.The growth <strong>in</strong> <strong>the</strong> urban <strong>and</strong> <strong>in</strong>dustrialsectors has been dramatic <strong>and</strong> has led to<strong>in</strong>creased overall pollutant emissions as well asa greater spatial distribution <strong>of</strong> emissions (Figure 5.2).The Pearl River Delta has a subtropical climate, because <strong>the</strong>mounta<strong>in</strong>s <strong>in</strong> <strong>the</strong> north prevent cold air from com<strong>in</strong>g from thatdirection. South <strong>of</strong> <strong>the</strong> region lie <strong>the</strong> South Ch<strong>in</strong>a Sea <strong>and</strong> <strong>the</strong>Pacific Ocean; thus <strong>the</strong> climate <strong>of</strong> Pearl River Delta is affectedby seasonal monsoons. In <strong>the</strong> w<strong>in</strong>ter, prevalent w<strong>in</strong>ds are from<strong>the</strong> north; <strong>and</strong> <strong>in</strong> <strong>the</strong> summer, w<strong>in</strong>ds are ma<strong>in</strong>ly from <strong>the</strong> south.The region has long daylight hours (up to 14 hours <strong>in</strong> summer<strong>and</strong> 11 hours <strong>in</strong> w<strong>in</strong>ter) with 1900–2200 hours <strong>of</strong> daylight peryear on average <strong>and</strong> an average annual temperature <strong>of</strong> > 20C.This climate favors <strong>the</strong> formation <strong>of</strong> photochemical smog; O 3concentrations <strong>in</strong> Hong Kong tend to be higher <strong>in</strong> w<strong>in</strong>ter ow<strong>in</strong>gto cloud cover <strong>in</strong> <strong>the</strong> summer (wet) season.The rapid urbanization <strong>and</strong> <strong>in</strong>dustrialization <strong>in</strong> <strong>the</strong> Pearl RiverDelta have caused heavy air pollution, which is receiv<strong>in</strong>g<strong>in</strong>creas<strong>in</strong>g attention from <strong>the</strong> public <strong>and</strong> <strong>the</strong> government.Numerous air pollution studies have been conducted to characterizeair pollution <strong>in</strong> <strong>the</strong> region. All <strong>the</strong>se studies reported highconcentrations <strong>of</strong> PM <strong>and</strong> O 3 . For example, <strong>in</strong> Shenzhen <strong>in</strong> 2004,<strong>the</strong> 24-hour average summer PM 2.5 <strong>and</strong> PM 10 concentrationswere 35 µg/m 3 <strong>and</strong> 57 µg/m 3 , respectively, <strong>and</strong> w<strong>in</strong>ter PM 2.5<strong>and</strong> PM 10 concentrations were 99 µg/m 3 <strong>and</strong> 137 µg/m 3 ,respectively (Niu et al. 2006). In Guangzhou, <strong>the</strong> summer 24-hour average concentration <strong>of</strong> PM 2.5 was 97.5 µg/m 3 (Wang XH2006). An analysis <strong>of</strong> air quality <strong>in</strong> Guangzhou from 1981 to2005 reported that annual mean SO 2 concentrations fluctuatedabove <strong>and</strong> below <strong>the</strong> limit <strong>of</strong> <strong>the</strong> 60 µg/m 3 established as <strong>the</strong>Sidebar 5. THE PEARL RIVER DELTAFigure 5.1. Area <strong>and</strong> cities surround<strong>in</strong>g <strong>the</strong> Pearl River Delta. [Repr<strong>in</strong>ted with permission fromCroquant 2007 under license from http://creativecommons.org/licenses/by/3.0/deed.en.]Ch<strong>in</strong>ese secondary air quality st<strong>and</strong>ard. The same analysisshowed that annual mean NO x concentrations were higher than<strong>the</strong> Ch<strong>in</strong>ese secondary st<strong>and</strong>ard for NO x (50 µg/m 3 ) <strong>in</strong> all yearsstudied <strong>and</strong> even exceeded <strong>the</strong> tertiary st<strong>and</strong>ard (100 µg/m 3 ) <strong>in</strong>some years (Zhou et al. 2007).Many studies characteriz<strong>in</strong>g air pollution conducted <strong>in</strong> <strong>the</strong> PearlRiver Delta area used various source-apportionment techniquesto identify major sources <strong>and</strong> meteorologic conditions that affectambient concentrations <strong>of</strong> PM <strong>and</strong> PM constituents (e.g.,SO 2 4 , elemental carbon (EC), organic aerosols, <strong>and</strong> metals). InGuangzhou, a recent study estimated that SO 2 4 , organiccarbon (OC), <strong>and</strong> EC account for about 70–90% <strong>of</strong> <strong>the</strong>particulate mass. Two major sources contribut<strong>in</strong>g to <strong>the</strong> PM concentrationsmeasured <strong>in</strong> Guangzhou <strong>in</strong> <strong>the</strong> summer werevehicular emissions (account<strong>in</strong>g for approximately 38% <strong>of</strong> <strong>the</strong>measured concentration) <strong>and</strong> coal combustion (approximately26%) (Wang XH et al. 2006).Measurements <strong>of</strong> TSP <strong>and</strong> its metal constituents <strong>in</strong> urban <strong>and</strong>suburban areas <strong>of</strong> Hong Kong <strong>and</strong> Guangzhou, obta<strong>in</strong>ed fromDecember 2003 to January 2005, found elevatedconcentrations <strong>of</strong> metals, especially cadmium, lead,vanadium, <strong>and</strong> z<strong>in</strong>c, <strong>in</strong> Guangzhou as compared with HongKong; elevated concentrations were found <strong>in</strong> several o<strong>the</strong>rurban areas <strong>in</strong> <strong>Asia</strong> as well (Lee CSL et al. 2007a). Dist<strong>in</strong>ctseasonal patterns were observed <strong>in</strong> heavy-metal concentrations<strong>in</strong> Hong Kong, with higher concentrationsCont<strong>in</strong>ued on next page34
HEI International Scientific Oversight CommitteeSidebar 5. THE PEARL RIVERDELTA (Cont<strong>in</strong>ued)dur<strong>in</strong>g <strong>the</strong> w<strong>in</strong>ter monsoonperiod <strong>and</strong> lowerconcentrations dur<strong>in</strong>g <strong>the</strong>summer. However, seasonalvariations <strong>in</strong> metalconcentrations were lessdist<strong>in</strong>ct <strong>in</strong> Guangzhou,suggest<strong>in</strong>g <strong>the</strong> dom<strong>in</strong>ance <strong>of</strong>local sources <strong>of</strong> particulatemetal pollution around <strong>the</strong> city.This study also found that <strong>the</strong>enrichment <strong>of</strong> heavy metals <strong>in</strong>Hong Kong <strong>and</strong> Guangzhou wasclosely associated with an airmass from <strong>the</strong> north <strong>and</strong>nor<strong>the</strong>ast that orig<strong>in</strong>ated <strong>in</strong>nor<strong>the</strong>rn Ch<strong>in</strong>a, reflect<strong>in</strong>g <strong>the</strong>long-range transport <strong>of</strong> heavymetalcontam<strong>in</strong>ants from <strong>the</strong>nor<strong>the</strong>rn <strong>in</strong>l<strong>and</strong> areas <strong>of</strong> Ch<strong>in</strong>ato <strong>the</strong> Pearl River Delta (LeeCSL et al. 2007a).Because <strong>of</strong> <strong>the</strong> complexity <strong>of</strong>local sources <strong>and</strong> long-rangetransport, it is extremely difficultto develop effective source-controlstrategies for <strong>the</strong> Pearl RiverDelta region. For example,research has been conducted toaddress whe<strong>the</strong>r regional photochemicalsmog formation isdependent on NO x or volatileorganic compound (VOC) concentrations,yet <strong>the</strong>re is still no clearanswer. As <strong>the</strong> population <strong>in</strong> <strong>the</strong>Pearl River Delta undergoeschange, source characteristicsalso are chang<strong>in</strong>g rapidly. It isclear that <strong>the</strong> number <strong>of</strong> motorvehicles is still rapidly <strong>in</strong>creas<strong>in</strong>g,but emission controls on vehicularemissions are <strong>in</strong>creas<strong>in</strong>glybe<strong>in</strong>g tightened, <strong>and</strong> high-sulfurcoal is be<strong>in</strong>g replaced with lowersulfurcoal or even with liquid or gaseous fuels.The population <strong>of</strong> <strong>the</strong> Pearl River Delta has a large percentage<strong>of</strong> migrants, as do o<strong>the</strong>r areas undergo<strong>in</strong>g rapid <strong>in</strong>dustrialization<strong>and</strong> urbanization. People from rural areas <strong>and</strong> o<strong>the</strong>r countriesimmigrate for purposes <strong>of</strong> employment, <strong>and</strong> many will live<strong>in</strong> <strong>the</strong> area only for a short time. The prevalence <strong>of</strong> air-conditioneruse <strong>and</strong> <strong>in</strong>stallation <strong>of</strong> heat<strong>in</strong>g, ventilation, <strong>and</strong> air-condition<strong>in</strong>g(HVAC) systems is rapidly <strong>in</strong>creas<strong>in</strong>g, which will affect<strong>the</strong> proportion <strong>of</strong> time spent <strong>in</strong>doors as opposed to outdoors.Figure 5.2. L<strong>and</strong>sat images <strong>of</strong> <strong>the</strong> Pearl River Delta <strong>in</strong> 1979 <strong>and</strong> 2003, show<strong>in</strong>g <strong>the</strong> expansion <strong>of</strong> urban <strong>and</strong><strong>in</strong>dustrial areas. Red <strong>in</strong>dicates vegetation, blue <strong>in</strong>dicates water, <strong>and</strong> gray <strong>in</strong>dicates build<strong>in</strong>gs or paved surfaces.[Images provided by <strong>the</strong> National Aeronautics <strong>and</strong> Space Adm<strong>in</strong>istration Earth Observatory (2007) <strong>and</strong> created byJesse Allen. L<strong>and</strong>sat 3 MSS data provided by <strong>the</strong> University <strong>of</strong> Maryl<strong>and</strong>’s Global L<strong>and</strong> Cover Facility. L<strong>and</strong>sat 7ETM+ data provided courtesy <strong>of</strong> <strong>the</strong> L<strong>and</strong>sat Project Science Office, NASA/Goddard Space Flight Center.]People <strong>in</strong> <strong>the</strong> delta region who do not have air condition<strong>in</strong>g athome typically spend <strong>the</strong>ir even<strong>in</strong>gs (<strong>and</strong> even entire nights)outside <strong>in</strong> summer. The use <strong>of</strong> air condition<strong>in</strong>g or HVACdecreases <strong>the</strong> rate <strong>of</strong> outdoor–<strong>in</strong>door air exchange. Therefore,even when people stay <strong>in</strong>doors, air-condition<strong>in</strong>g use decreases<strong>the</strong> penetration <strong>of</strong> outdoor pollutants <strong>in</strong>to <strong>the</strong> <strong>in</strong>door environment,lead<strong>in</strong>g to decreased total exposure to pollutants <strong>of</strong> outdoororig<strong>in</strong>. On <strong>the</strong> o<strong>the</strong>r h<strong>and</strong>, <strong>the</strong> use <strong>of</strong> air condition<strong>in</strong>g <strong>and</strong>HVAC may <strong>in</strong>crease exposure to pollutants generated <strong>in</strong>doors.35
<strong>Outdoor</strong> <strong>Air</strong> <strong>Pollution</strong> <strong>and</strong> <strong>Health</strong> <strong>in</strong> <strong>the</strong> Develop<strong>in</strong>g <strong>Countries</strong> <strong>of</strong> <strong>Asia</strong>Sidebar 6. ATMOSPHERIC BROWN CLOUDS AND MINERAL-DUST STORMSATMOSPHERIC BROWN CLOUDSThe Indian Ocean Experiment (INDOEX)study (Gupta PK et al. 2001b), conducted <strong>in</strong>2001 <strong>in</strong> <strong>the</strong> Maldives <strong>and</strong> <strong>the</strong> nearby IndianOcean, found very high concentrations <strong>of</strong>black carbon (BC), suggest<strong>in</strong>g an <strong>in</strong>fluence<strong>of</strong> anthropogenic sources <strong>of</strong> pollution over<strong>the</strong> Indian Ocean. This study led to <strong>the</strong> concept<strong>of</strong> <strong>the</strong> atmospheric brown cloud, whichis thought to consist <strong>of</strong> carbonaceous aerosolsemitted from anthropogenic sourcesthat rema<strong>in</strong> <strong>in</strong> <strong>the</strong> atmosphere over much <strong>of</strong><strong>the</strong> region <strong>in</strong> South <strong>and</strong> Sou<strong>the</strong>ast <strong>Asia</strong>(Ramanathan et al. 2001). As this <strong>and</strong>related research has evolved, it has becomeevident from remote sens<strong>in</strong>g that suchclouds exist downw<strong>in</strong>d <strong>of</strong> nearly all denselypopulated regions <strong>of</strong> <strong>the</strong> world (Figure 6.1).In <strong>Asia</strong>, <strong>in</strong> addition to <strong>the</strong> orig<strong>in</strong>al cloud identifiedover <strong>the</strong> Indian Ocean, dust fromCh<strong>in</strong>a <strong>and</strong> Mongolia is transported over <strong>the</strong>Pacific Ocean <strong>and</strong> eventually reachesNorth America.Today it is recognized that atmosphericbrown clouds are, by def<strong>in</strong>ition, very largeair masses conta<strong>in</strong><strong>in</strong>g contam<strong>in</strong>ants at concentrationssimilar to those found <strong>in</strong> pollutedair <strong>in</strong> heavily populated regions(Ramanathan <strong>and</strong> Crutzen 2003). Suchclouds result from <strong>the</strong> transport <strong>of</strong> pollutantsfrom source regions. The INDOEX measurementcampaign <strong>and</strong> related studieshave shown that <strong>the</strong> atmospheric browncloud located <strong>in</strong> sou<strong>the</strong>rn <strong>Asia</strong> is derivedfrom a mixture <strong>of</strong> pollutants ma<strong>in</strong>ly fromfossil-fuel combustion (especially <strong>in</strong> motorvehicles) <strong>and</strong> residential burn<strong>in</strong>g <strong>of</strong> biomass.Although <strong>the</strong> relative contribution <strong>of</strong><strong>the</strong>se major sources varies depend<strong>in</strong>g on<strong>the</strong> specific location <strong>and</strong> on meteorologicconditions, studies <strong>of</strong> chemical compositionsuggest a greater contribution <strong>of</strong> fossil-fuelcombustion than biomass burn<strong>in</strong>g, despite<strong>the</strong> greater emissions <strong>of</strong> biomass-combustion products <strong>in</strong>India <strong>and</strong> nearby countries. As discussed later <strong>in</strong> Trends <strong>in</strong>Energy Use <strong>and</strong> Projected Growth <strong>in</strong> Major Po<strong>in</strong>t Sources <strong>and</strong>Emissions (<strong>in</strong> Section II), trends <strong>in</strong> emissions suggest that pollutantsfrom residential burn<strong>in</strong>g <strong>of</strong> biomass may have begun tostabilize, whereas fossil-fuel emissions, especially <strong>in</strong> India <strong>and</strong>Ch<strong>in</strong>a, are <strong>in</strong>creas<strong>in</strong>g.Although <strong>the</strong> health impacts <strong>of</strong> <strong>the</strong> <strong>Asia</strong>n atmospheric browncloud have not been directly measured, studies <strong>of</strong> mixturesFigure 6.1. Global distribution <strong>of</strong> atmospheric brown clouds, composed <strong>of</strong> f<strong>in</strong>e <strong>and</strong> coarse PM,accord<strong>in</strong>g to <strong>the</strong> MODIS satellite measurements <strong>of</strong> aerosol optical thickness. The boxes labeled witha letter <strong>in</strong>dicate <strong>the</strong> locations <strong>of</strong> atmospheric brown clouds. [Repr<strong>in</strong>ted from Kaufman et al. 2002with permission from Nature Publish<strong>in</strong>g Group, Macmillan Publishers Ltd.]thought to contribute to <strong>the</strong> atmospheric brown cloud haveshown adverse health effects similar to those <strong>of</strong> combustionbasedparticles observed throughout <strong>the</strong> world. A recent healthimpactanalysis suggested that <strong>the</strong> <strong>Asia</strong>n atmospheric browncloud has major effects on health (United Nations EnvironmentProgramme 2008). For example, assum<strong>in</strong>g a 20-µg/m 3<strong>in</strong>crease <strong>in</strong> PM 2.5 concentration result<strong>in</strong>g from <strong>the</strong> atmosphericCont<strong>in</strong>ued on next page36
HEI International Scientific Oversight CommitteeSidebar 6. ATMOSPHERIC BROWN CLOUDS (Cont<strong>in</strong>ued)brown cloud <strong>and</strong> assum<strong>in</strong>g that half <strong>the</strong> populations<strong>of</strong> Ch<strong>in</strong>a <strong>and</strong> India are exposed, this exposure wouldresult <strong>in</strong> 337,000 excess deaths per year (95% CI,181,000–492,000).MINERAL-DUST STORMSM<strong>in</strong>eral-dust storms orig<strong>in</strong>at<strong>in</strong>g <strong>in</strong> <strong>the</strong> Gobi Desert,nor<strong>the</strong>rn <strong>and</strong> western Ch<strong>in</strong>a, <strong>and</strong> Mongolia, especiallydur<strong>in</strong>g spr<strong>in</strong>g, have been studied extensively(Lim <strong>and</strong> Chun 2006). They have been shown toimpact air quality <strong>in</strong> South Korea (Lee BK 2006a),Japan (M<strong>in</strong>oura et al. 2006), Taipei,Ch<strong>in</strong>a (Liu et al.2006), ma<strong>in</strong>l<strong>and</strong> Ch<strong>in</strong>a (VanCuren 2006), <strong>and</strong> NorthAmerica (VanCuren 2006). For example, m<strong>in</strong>eral dusthas been estimated to account for up to 20% <strong>of</strong>PM 2.5 concentrations <strong>in</strong> Beij<strong>in</strong>g <strong>in</strong> summer <strong>and</strong> 37%<strong>in</strong> w<strong>in</strong>ter (Sun 2004). Figure 6.2 shows <strong>the</strong> majordust-transport patterns <strong>in</strong> Nor<strong>the</strong>ast <strong>Asia</strong>. A forecast<strong>in</strong>gsystem (Uno et al. 2003) to predict episodes<strong>of</strong> <strong>Asia</strong>n dust <strong>and</strong> anthropogenic aerosols is operatedby <strong>the</strong> Japanese National Institute for EnvironmentalStudies (www-cfors.nies.go.jp/~cfors/<strong>in</strong>dex.html).A number <strong>of</strong> studies have exam<strong>in</strong>ed <strong>the</strong> health impacts <strong>of</strong> m<strong>in</strong>eral-dustepisodes with<strong>in</strong> <strong>Asia</strong> (reviewed <strong>in</strong> Bell et al. 2007).Although <strong>the</strong> f<strong>in</strong>d<strong>in</strong>gs have not been entirely consistent, <strong>the</strong>reFigure 6.2. Patterns <strong>of</strong> m<strong>in</strong>eral-dust transport <strong>in</strong> Nor<strong>the</strong>ast <strong>Asia</strong>. [Adapted from Sun JM et al.2001 with permission from American Geophysical Union.]appears to be a general association between adverse cardiopulmonaryeffects <strong>and</strong> elevated concentrations <strong>of</strong> coarse particlesdur<strong>in</strong>g dust events.Common Sources <strong>of</strong> <strong>Air</strong> <strong>Pollution</strong>Common sources <strong>of</strong> air pollution are <strong>in</strong>dustrial <strong>and</strong>domestic stationary sources, mobile sources, mar<strong>in</strong>e emissions,solid-waste burn<strong>in</strong>g, rural area sources, <strong>and</strong> terrestrial<strong>and</strong> transport sources.Stationary SourcesIndustrial Industrial sources <strong>of</strong> air pollution <strong>in</strong>clude coalfiredpower plants that may or may not be equipped wi<strong>the</strong>mission controls. Often, <strong>the</strong>se plants burn high-sulfur coal,lead<strong>in</strong>g to high emissions <strong>of</strong> SO 2 <strong>and</strong> PM. These sourcesalso <strong>in</strong>clude combustion facilities such as large-scale boilers<strong>in</strong> <strong>in</strong>dustrial sett<strong>in</strong>gs.Domestic Domestic sources <strong>in</strong>clude boilers for heat<strong>in</strong>gcommercial build<strong>in</strong>gs <strong>and</strong> stoves for household heat<strong>in</strong>g <strong>and</strong>cook<strong>in</strong>g. Fuels used for this purpose vary by location,depend<strong>in</strong>g ma<strong>in</strong>ly on <strong>the</strong> affordability as well as fuel availability<strong>and</strong> reliability <strong>of</strong> <strong>the</strong> fuel supply. A mix <strong>of</strong> fuel types,<strong>in</strong>clud<strong>in</strong>g coal, wood, liquefied petroleum gas (LPG), coalgas, <strong>and</strong> natural gas, can <strong>of</strong>ten be found <strong>in</strong> a s<strong>in</strong>gle city. Restaurantemissions, consist<strong>in</strong>g <strong>of</strong> both cook<strong>in</strong>g fumes <strong>and</strong>fuel-combustion products, appear to be an important contribut<strong>in</strong>gsource to PM <strong>in</strong> some cities (Zhao et al. 2007).Mobile Sources Mobile sources <strong>in</strong>clude emissions frommotor vehicles <strong>and</strong> road dust generated from <strong>the</strong> vehiculartraffic. An important characteristic <strong>of</strong> vehicles <strong>in</strong> develop<strong>in</strong>gcountries is <strong>the</strong> large variation (both with<strong>in</strong> <strong>and</strong>between cities) <strong>in</strong> <strong>the</strong> degree <strong>of</strong> emission controls on vehicles.For example, three- <strong>and</strong> two-wheeled motor vehiclesare commonly seen on <strong>the</strong> streets <strong>of</strong> Bangkok <strong>and</strong> Delhi butnot <strong>in</strong> Beij<strong>in</strong>g. In some areas <strong>of</strong> <strong>Asia</strong>, many <strong>of</strong> <strong>the</strong>se vehiclesare powered by two-stroke eng<strong>in</strong>es, which emit a largeamount <strong>of</strong> hydrocarbons (from unburned fuel) that can be amajor contributor to O 3 formation. Two-stroke eng<strong>in</strong>es mayalso be a major source <strong>of</strong> ultraf<strong>in</strong>e <strong>and</strong> f<strong>in</strong>e metal oxide particles,<strong>of</strong>ten result<strong>in</strong>g <strong>in</strong> visible tailpipe emissions <strong>of</strong> whitesmoke. In Dhaka, <strong>the</strong> replacement <strong>of</strong> two-stroke, threewheeledtaxis fueled by compressed natural gas (CNG)resulted <strong>in</strong> a 25% reduction <strong>in</strong> PM 2.5 concentrations <strong>in</strong> ahigh-traffic area (Begum et al. 2008). Leaded gasol<strong>in</strong>e hasbeen phased out recently <strong>in</strong> some, but not all, cities <strong>in</strong> Asi<strong>and</strong>evelop<strong>in</strong>g countries. As <strong>the</strong> number <strong>of</strong> motor vehiclesgrows exponentially, contributions from mobile sources toboth local <strong>and</strong> regional air pollution are <strong>in</strong>creas<strong>in</strong>g.Mar<strong>in</strong>e Emissions In port cities, emissions from mar<strong>in</strong>evessels may be important sources <strong>of</strong> air pollution. Mar<strong>in</strong>eemissions, especially those aris<strong>in</strong>g from <strong>the</strong> burn<strong>in</strong>g <strong>of</strong> furnace37
<strong>Outdoor</strong> <strong>Air</strong> <strong>Pollution</strong> <strong>and</strong> <strong>Health</strong> <strong>in</strong> <strong>the</strong> Develop<strong>in</strong>g <strong>Countries</strong> <strong>of</strong> <strong>Asia</strong>fuel oil (<strong>the</strong> most common bunker fuel), <strong>in</strong>clude substantialamounts <strong>of</strong> PM (<strong>in</strong> <strong>the</strong> form <strong>of</strong> black carbon <strong>and</strong> primarySO 42), hydrocarbons, <strong>and</strong> SO 2 . These emissions have beenestimated to make substantial contributions to health impacts<strong>of</strong> air pollution <strong>in</strong> coastal cities <strong>of</strong> <strong>Asia</strong> (Corbett et al. 2007).Solid-Waste Burn<strong>in</strong>g Open burn<strong>in</strong>g <strong>of</strong> solid wastemay be a major source <strong>of</strong> air pollution <strong>in</strong> outly<strong>in</strong>g or periurbanareas <strong>of</strong> major cities <strong>and</strong> <strong>in</strong> smaller cities wherewaste collection is not efficient. There is limited <strong>in</strong>formationabout <strong>the</strong> impact <strong>of</strong> waste burn<strong>in</strong>g on air quality, butsource-apportionment studies suggest it can be a large contributorto airborne particle concentrations.Rural Area Sources In develop<strong>in</strong>g countries, <strong>the</strong> ruralpopulation still relies ma<strong>in</strong>ly on solid fuels (biomass <strong>and</strong>coal) for cook<strong>in</strong>g <strong>and</strong> household heat<strong>in</strong>g. Solid fuels aredifficult to burn <strong>in</strong> simple combustion devices, such ashousehold stoves, without substantial emissions <strong>of</strong> pollutants,because <strong>of</strong> <strong>the</strong> difficulty <strong>of</strong> completely premix<strong>in</strong>g <strong>the</strong>air <strong>and</strong> fuel dur<strong>in</strong>g burn<strong>in</strong>g. Solid-fuel combustion <strong>in</strong>household stoves not only leads to high <strong>in</strong>door concentrations<strong>of</strong> PM, carbon monoxide (CO), <strong>and</strong> SO 2 (especiallywith coal burn<strong>in</strong>g), but also collectively, from numeroushouseholds, contributes to neighborhood concentrations<strong>of</strong> air pollution <strong>and</strong> possibly local <strong>and</strong> regional air pollution.Burn<strong>in</strong>g <strong>of</strong> crop residues, long recognized as a source<strong>of</strong> air pollution <strong>in</strong> many parts <strong>of</strong> <strong>Asia</strong>, may <strong>in</strong> fact becomemore widespread with <strong>in</strong>creas<strong>in</strong>g cultivation <strong>and</strong> as o<strong>the</strong>rsolid fuels become available <strong>and</strong> affordable. For example,<strong>in</strong> wealthier regions <strong>of</strong> Ch<strong>in</strong>a (<strong>and</strong> perhaps o<strong>the</strong>r countries),farmers are becom<strong>in</strong>g reluctant to ga<strong>the</strong>r biomassresidues from <strong>the</strong> field <strong>and</strong> store <strong>the</strong>m for use throughout<strong>the</strong> year, preferr<strong>in</strong>g easier-to-h<strong>and</strong>le fuels such as coal briquettesor LPG. This shift to modern fuels creates an excess<strong>of</strong> crop residues, which are commonly burned <strong>in</strong> <strong>the</strong> field,result<strong>in</strong>g <strong>in</strong> widespread ambient pollution that affectsnearby urban areas <strong>in</strong> some seasons. Ano<strong>the</strong>r phenomenon<strong>of</strong> <strong>the</strong> develop<strong>in</strong>g rural economy is <strong>the</strong> growth <strong>of</strong> local<strong>in</strong>dustry, typically equipped with outdated, heavily pollut<strong>in</strong>gmach<strong>in</strong>ery <strong>and</strong> facilities. Pollutants generated <strong>in</strong>rural areas may be transported to nearby cities.Terrestrial <strong>and</strong> Transport Sources Terrestrial <strong>and</strong>transport sources <strong>of</strong> air pollution <strong>in</strong>clude natural emissions<strong>of</strong> precursors <strong>of</strong> photochemical smog (Mouli et al.2006) <strong>and</strong> also episodes <strong>of</strong> “<strong>Asia</strong>n dust” (also known ass<strong>and</strong>storms or dust storms) (Arimoto et al. 2006; Wang KY2007; see Sidebar 6). These sources are highly seasonal. Forexample, episodes <strong>of</strong> <strong>Asia</strong>n dust typically occur <strong>in</strong> earlyspr<strong>in</strong>g when <strong>the</strong> wea<strong>the</strong>r is dry <strong>and</strong> <strong>the</strong> w<strong>in</strong>d blows out <strong>of</strong><strong>the</strong> Gobi Desert (Arimoto et al. 2006). In contrast, hydrocarbonsemitted by trees <strong>and</strong> o<strong>the</strong>r vegetation contribute to O 3<strong>and</strong> PM concentrations dur<strong>in</strong>g warmer wea<strong>the</strong>r (Mouli et al.2006; Wang KY 2007). Although <strong>Asia</strong>n dust consists pr<strong>in</strong>cipally<strong>of</strong> coarse particles <strong>in</strong> <strong>the</strong> ground-level atmosphere(below ~2 km above sea level), <strong>the</strong> dust is usually mixedwith anthropogenic pollutants, <strong>in</strong>clud<strong>in</strong>g f<strong>in</strong>e <strong>and</strong> ultraf<strong>in</strong>eparticles (Arimoto et al. 2006).Trends <strong>in</strong> Energy Use <strong>and</strong> Projected Growth <strong>in</strong> MajorPo<strong>in</strong>t Sources <strong>and</strong> EmissionsTo help assess <strong>the</strong> potential future air pollutant concentrations<strong>in</strong> <strong>Asia</strong>, this section focuses on two types <strong>of</strong> trendsassociated with degraded air quality: trends <strong>in</strong> <strong>in</strong>puts to<strong>the</strong> econometric Global Model for Ambient Particulates(GMAPs) that is used to predict PM concentrations <strong>in</strong><strong>Asia</strong>n cities (described fur<strong>the</strong>r <strong>in</strong> Modeled Estimated PollutantConcentrations <strong>and</strong> Projected Trends <strong>in</strong> Emissions<strong>in</strong> Section II), <strong>and</strong> recent trends <strong>in</strong> pollutant emissionsaccord<strong>in</strong>g to <strong>the</strong> Regional Emissions Inventory <strong>in</strong> <strong>Asia</strong>(REAS; Frontier Research Center for Global Change 2007).Trends <strong>in</strong> Energy Use <strong>and</strong> Fuel ConsumptionAlthough recent evidence (Gustafsson et al. 2009) suggeststhat biomass combustion is an important contributor toregional air pollution, for example <strong>in</strong> South <strong>Asia</strong>, combustion<strong>of</strong> fossil fuels is <strong>the</strong> primary source <strong>of</strong> anthropogenicf<strong>in</strong>e PM <strong>in</strong> much <strong>of</strong> <strong>Asia</strong>, especially <strong>in</strong> urban areas. Fur<strong>the</strong>rmore,fossil-fuel combustion is likely to ga<strong>in</strong> <strong>in</strong> importancebecause <strong>of</strong> <strong>in</strong>creased fuel use <strong>and</strong> decreased biomass combustionaccompany<strong>in</strong>g development. The InternationalEnergy Agency annually compiles “energy balances” forover 130 countries, <strong>in</strong> collaboration with national governments.The energy balance for each country provides anaccount<strong>in</strong>g <strong>of</strong> <strong>the</strong> total available supply <strong>of</strong> energy for eachfuel type, its transformation <strong>in</strong>to o<strong>the</strong>r forms <strong>of</strong> energy, <strong>and</strong><strong>the</strong> f<strong>in</strong>al consumption <strong>of</strong> energy by various sectors <strong>of</strong> <strong>the</strong>economy. The total primary energy supply provides <strong>the</strong> mostcomprehensive measure <strong>of</strong> <strong>the</strong> total energy consumed <strong>in</strong> acountry. Figure 12 shows <strong>the</strong> distribution <strong>of</strong> total primaryFigure 12. Total primary energy consumption <strong>in</strong> <strong>Asia</strong> <strong>in</strong> 2005. The valuesfor each country or region are thous<strong>and</strong>s <strong>of</strong> metric tons <strong>of</strong> oil equivalent.Regions are def<strong>in</strong>ed <strong>in</strong> Table 1. [Data compiled from International EnergyAgency 2007.]38
HEI International Scientific Oversight Committeeenergy consumption across <strong>Asia</strong> <strong>in</strong> 2005. Accord<strong>in</strong>g to thismeasure, Ch<strong>in</strong>a accounts for approximately 49% <strong>of</strong> <strong>the</strong> totalenergy consumption <strong>in</strong> <strong>Asia</strong>, followed by High-Income <strong>Asia</strong>with 21% <strong>of</strong> <strong>the</strong> total, O<strong>the</strong>r Sou<strong>the</strong>ast <strong>Asia</strong> with 12%, Indiawith 14%, <strong>and</strong> O<strong>the</strong>r South <strong>Asia</strong> with <strong>the</strong> rema<strong>in</strong><strong>in</strong>g 3%.From 1990 through 2005, <strong>the</strong> total primary energy consumptionfor <strong>Asia</strong> <strong>in</strong>creased by 75%, at an annual averagerate <strong>of</strong> 3.9% (Figure 13). Overall, <strong>the</strong> total primary energysupply <strong>in</strong>creased fastest <strong>in</strong> O<strong>the</strong>r Sou<strong>the</strong>ast <strong>Asia</strong> <strong>and</strong> Ch<strong>in</strong>a,with a near doubl<strong>in</strong>g dur<strong>in</strong>g <strong>the</strong> 15-year period. O<strong>the</strong>rSou<strong>the</strong>ast <strong>Asia</strong> has shown a steady <strong>in</strong>crease throughout <strong>the</strong>period except for a temporary dip <strong>in</strong> <strong>the</strong> late 1990s associatedwith <strong>the</strong> <strong>Asia</strong>n economic crisis. In contrast, Ch<strong>in</strong>a’smarked economic growth has primarily occurred <strong>in</strong> <strong>the</strong> last5 years, over which time its total primary energy supply hasgrown at an annual average rate <strong>of</strong> 11%.Although economic growth has been <strong>the</strong> primary driver<strong>of</strong> <strong>in</strong>creased energy consumption <strong>in</strong> <strong>Asia</strong>, <strong>the</strong> <strong>in</strong>crease hasnot been <strong>in</strong> proportion to <strong>the</strong> <strong>in</strong>crease <strong>in</strong> level <strong>of</strong> economicactivity. Figure 14 shows <strong>the</strong> <strong>in</strong>tensity <strong>of</strong> energy use, measuredas <strong>the</strong> ratio <strong>of</strong> <strong>the</strong> total primary energy supply (<strong>in</strong>millions <strong>of</strong> metric tons <strong>of</strong> oil equivalent) to each unit <strong>of</strong> <strong>the</strong>GDP (<strong>in</strong> constant U.S. dollars normalized to 2005 U.S. dollars).While most countries <strong>in</strong> <strong>Asia</strong> have shown marg<strong>in</strong>alimprovements <strong>in</strong> <strong>the</strong> <strong>in</strong>tensity <strong>of</strong> energy use dur<strong>in</strong>g <strong>the</strong>15-year period, a few countries have become more energy<strong>in</strong>tensive: <strong>the</strong> <strong>in</strong>tensity <strong>of</strong> energy use <strong>in</strong> O<strong>the</strong>r South <strong>Asia</strong>,O<strong>the</strong>r Sou<strong>the</strong>ast <strong>Asia</strong>, <strong>and</strong> High-Income <strong>Asia</strong> changed by
<strong>Outdoor</strong> <strong>Air</strong> <strong>Pollution</strong> <strong>and</strong> <strong>Health</strong> <strong>in</strong> <strong>the</strong> Develop<strong>in</strong>g <strong>Countries</strong> <strong>of</strong> <strong>Asia</strong>period. Similarly, Pakistan took steps to reduce its oilimports by promot<strong>in</strong>g <strong>the</strong> use <strong>of</strong> CNG <strong>and</strong> LPG <strong>in</strong> <strong>the</strong> transport,agriculture, <strong>and</strong> power sectors <strong>and</strong> to make naturalgas <strong>the</strong> fuel <strong>of</strong> choice for power generation.Vehicular pollution is an important source <strong>of</strong> pollution<strong>in</strong> many urban areas. Rapid urbanization <strong>and</strong> <strong>in</strong>creasedmotorization has led to <strong>in</strong>creased consumption <strong>of</strong> gasol<strong>in</strong>e<strong>and</strong> diesel <strong>in</strong> <strong>the</strong> transport sector. Figure 15 shows <strong>the</strong>Figure 14. Energy <strong>in</strong>tensity <strong>in</strong> <strong>Asia</strong>, 1990–2005. The energy <strong>in</strong>tensity <strong>in</strong>dex is <strong>the</strong> ratio <strong>of</strong> <strong>the</strong> total primary energy consumption (<strong>in</strong> millions <strong>of</strong> metric tons<strong>of</strong> oil equivalent) <strong>and</strong> each unit <strong>of</strong> <strong>the</strong> GDP (<strong>in</strong> constant U.S. dollars normalized to 2005 U.S. dollars; i.e., 2005 values are equal to 100, as shown). Regionsare def<strong>in</strong>ed <strong>in</strong> Table 1. Values for All <strong>Asia</strong> are weighted averages <strong>of</strong> <strong>the</strong> regions. [Data compiled from International Energy Agency 2007.]Figure 15. Fuel consumption <strong>in</strong> <strong>the</strong> transport sector <strong>in</strong> <strong>Asia</strong>, 1990–2005. The energy use <strong>in</strong>dex is a unitless measure <strong>of</strong> total primary energy consumptionfor which <strong>the</strong> value <strong>in</strong> 1990 is equal to 100. Jet fuel is excluded. Regions are def<strong>in</strong>ed <strong>in</strong> Table 1. Values for All <strong>Asia</strong> are weighted averages <strong>of</strong> <strong>the</strong> regions.[Data compiled from International Energy Agency 2007.]40
HEI International Scientific Oversight CommitteeTable 3. Fuel Mix Trends <strong>in</strong> <strong>Asia</strong> by Region, 1990–2005 aMetric Tons (thous<strong>and</strong>s)(% <strong>of</strong> Total)Fuel1990 1995 2000 2005Total <strong>Asia</strong>Coal 768,908 (37) 945,590 (37) 993,757 (35) 1,564,052 (42)Oil 619,658 (30) 813,887 (32) 935,374 (33) 1,068,981 (29)Combustible, renewable fuel 471,958 (23) 494,289 (19) 521,375 (18) 555,013 (15)Natural gas 117,893 (6) 170,656 (7) 234,636 (8) 313,295 (8)O<strong>the</strong>r fuel 107,041 (5) 144,737 (6) 171,867 (6) 205,562 (6)Total 2,085,458 (100) 2,569,159 (100) 2,857,009 (100) 3,706,903 (100)IndiaCoal 106,069 (33) 138,682 (36) 164,346 (36) 207,979 (39)Oil 62,647 (20) 84,002 (22) 114,365 (25) 128,582 (24)Combustible, renewable fuel 133,459 (42) 140,003 (36) 148,793 (32) 158,119 (29)Natural gas 9,833 (3) 16,256 (4) 20,991 (5) 28,841 (5)O<strong>the</strong>r fuel 7,762 (2) 8,323 (2) 10,809 (2) 13,112 (2)Total 319,770 (100) 387,266 (100) 459,304 (100) 536,633 (100)Ch<strong>in</strong>aCoal 545,265 (59) 673,067 (60) 658,790 (55) 1,133,078 (62)Oil 141,533 (15) 199,375 (18) 267,659 (22) 373,247 (20)Combustible, renewable fuel 200,474 (22) 205,717 (18) 214,387 (18) 224,637 (12)Natural gas 14,539 (2) 18,661 (2) 28,671 (2) 50,948 (3)O<strong>the</strong>r fuel 20,167 (2) 29,702 (3) 34,287 (3) 59,075 (3)Total 921,978 (100) 1,126,522 (100) 1,203,794 (100) 1,840,985 (100)High-Income <strong>Asia</strong>Coal 102,768 (19) 111,429 (17) 137,402 (19) 161,545 (21)Oil 318,506 (58) 383,674 (58) 388,036 (53) 372,804 (48)Combustible, renewable fuel 5,723 (1) 6,166 (1) 7,240 (1) 8,456 (1)Natural gas 48,559 (9) 65,002 (10) 85,690 (12) 105,678 (14)O<strong>the</strong>r fuel 74,723 (14) 100,670 (15) 120,174 (16) 124,714 (16)Total 550,279 (100) 666,941 (100) 738,542 (100) 773,197 (100)O<strong>the</strong>r South <strong>Asia</strong>Coal 2,424 (4) 2,743 (3) 2,599 (3) 4,652 (4)Oil 14,427 (21) 20,578 (25) 26,883 (27) 26,198 (22)Combustible, renewable fuel 34,971 (52) 38,409 (46) 42,881 (43) 48,310 (41)Natural gas 13,801 (20) 18,648 (22) 24,040 (24) 35,987 (30)O<strong>the</strong>r fuel 1,953 (3) 2,637 (3) 2,495 (3) 3,916 (3)Total 67,576 (100) 83,015 (100) 98,898 (100) 119,063 (100)O<strong>the</strong>r Sou<strong>the</strong>ast <strong>Asia</strong>Coal 12,382 (5) 19,669 (6) 30,620 (9) 56,798 (13)Oil 82,545 (37) 126,258 (41) 138,431 (39) 168,150 (38)Combustible, renewable fuel 97,331 (43) 103,994 (34) 108,074 (30) 115,491 (26)Natural gas 31,161 (14) 52,089 (17) 75,244 (21) 91,841 (21)O<strong>the</strong>r fuel 2,436 (1) 3,405 (1) 4,102 (1) 4,745 (1)Total 225,855 (100) 305,415 (100) 356,471 (100) 437,025 (100)a Regions are def<strong>in</strong>ed <strong>in</strong> Table 1. Data are given as thous<strong>and</strong>s <strong>of</strong> metric tons <strong>of</strong> oil equivalent (with percentage <strong>of</strong> total <strong>in</strong> paren<strong>the</strong>ses). Data compiled fromInternational Energy Agency 2007.41
<strong>Outdoor</strong> <strong>Air</strong> <strong>Pollution</strong> <strong>and</strong> <strong>Health</strong> <strong>in</strong> <strong>the</strong> Develop<strong>in</strong>g <strong>Countries</strong> <strong>of</strong> <strong>Asia</strong>Table 4. Transport Sector’s Market Share <strong>of</strong> Gasol<strong>in</strong>eConsumption <strong>in</strong> <strong>Asia</strong>, 1990–2005 aRegionMarket Share (%)1990 1995 2000 2005India 16 15 24 29Ch<strong>in</strong>a 68 68 57 52High-<strong>in</strong>come <strong>Asia</strong> 51 50 54 55O<strong>the</strong>r South <strong>Asia</strong> 21 17 16 19O<strong>the</strong>r Sou<strong>the</strong>ast <strong>Asia</strong> 47 43 45 48All <strong>Asia</strong> b 48 46 48 49a Regions are def<strong>in</strong>ed <strong>in</strong> Table 1. Data compiled from International EnergyAgency 2007.b Each percentage for All <strong>Asia</strong> is a weighted average <strong>of</strong> <strong>the</strong> market shares forregions.trends <strong>in</strong> fuel consumption (exclud<strong>in</strong>g jet fuel) <strong>in</strong> <strong>the</strong>transport sector <strong>in</strong> <strong>Asia</strong>, for 1990–2005. The total consumption<strong>of</strong> gasol<strong>in</strong>e <strong>and</strong> diesel approximately doubled <strong>in</strong><strong>Asia</strong> overall <strong>and</strong> more than tripled <strong>in</strong> Ch<strong>in</strong>a. In contrast,<strong>the</strong> growth <strong>in</strong> fuel consumption <strong>in</strong> <strong>the</strong> transport sector <strong>in</strong>India was similar to that <strong>in</strong> high-<strong>in</strong>come <strong>Asia</strong>. The proportion<strong>of</strong> gasol<strong>in</strong>e <strong>in</strong> <strong>the</strong> overall fuel mix rema<strong>in</strong>ed relativelyunchanged for most countries <strong>in</strong> <strong>Asia</strong> (Table 4). However,Ch<strong>in</strong>a <strong>and</strong> India are notable exceptions: <strong>the</strong> market share<strong>of</strong> diesel fuel rapidly decreased <strong>in</strong> Ch<strong>in</strong>a s<strong>in</strong>ce 1997 but<strong>in</strong>creased <strong>in</strong> India as <strong>of</strong> 1995.Emissions The REAS <strong>in</strong>ventory is a comprehensive emissions<strong>in</strong>ventory for <strong>Asia</strong>, cover<strong>in</strong>g past, present, <strong>and</strong> futureemissions. Major anthropogenic emissions sources <strong>in</strong> <strong>the</strong><strong>in</strong>ventory <strong>in</strong>clude (1) <strong>the</strong> combustion <strong>of</strong> fossil fuels <strong>and</strong> bi<strong>of</strong>uelas part <strong>of</strong> power production, transport, <strong>and</strong> domestic <strong>and</strong><strong>in</strong>dustrial activities; <strong>and</strong> (2) noncombustion sources such as<strong>in</strong>dustrial processes (e.g., oil extraction <strong>and</strong> solvent production),agricultural activities (e.g., till<strong>in</strong>g <strong>of</strong> soil <strong>and</strong> practicesrelated to livestock), <strong>and</strong> natural soil emissions. Emissionsfrom <strong>in</strong>ternational shipp<strong>in</strong>g <strong>and</strong> aviation with<strong>in</strong> <strong>Asia</strong>,although not assigned to specific countries or regions, are<strong>in</strong>cluded <strong>in</strong> <strong>the</strong> total for <strong>the</strong> cont<strong>in</strong>ent. The <strong>in</strong>ventory doesnot <strong>in</strong>clude emissions from open-air burn<strong>in</strong>g <strong>of</strong> biomass (e.g.,agricultural burn<strong>in</strong>g or wildfires) that may make substantialregional <strong>and</strong> local seasonal contributions to air pollution.Emissions are estimated as <strong>the</strong> product <strong>of</strong> source activity,emission factors, <strong>and</strong> <strong>the</strong> removal efficiency <strong>of</strong> emission controls(Ohara et al. 2007). In <strong>the</strong> absence <strong>of</strong> enhanced emissioncontrols <strong>and</strong> air quality management programs, future emissionsare likely to follow <strong>the</strong>se historical trajectories.Given <strong>the</strong> importance <strong>of</strong> PM <strong>and</strong> O 3 to <strong>the</strong> health impacts<strong>of</strong> air pollution, <strong>in</strong> this section we focus on emissions <strong>of</strong> PMas well as major gaseous precursors (SO 2 <strong>and</strong> NO x ) <strong>and</strong> O 3precursors (NO x <strong>and</strong> non-methane volatile organic compounds[NMVOCs]). BC emissions are presented as a marker<strong>of</strong> primary particle production via combustion processes(Figure 16). Increased emissions <strong>of</strong> crustal PM result<strong>in</strong>g from<strong>in</strong>creas<strong>in</strong>gly frequent <strong>and</strong> <strong>in</strong>tense dust storms have also beendescribed (Sidebar 6). Dom<strong>in</strong>ant sources <strong>of</strong> BC emissions aredomestic combustion <strong>of</strong> biomass <strong>and</strong> coal, with <strong>the</strong> relativebiomass contribution be<strong>in</strong>g nearly 80% <strong>in</strong> India, 40% <strong>in</strong>Ch<strong>in</strong>a, <strong>and</strong> 60% across all <strong>of</strong> <strong>Asia</strong> (Ohara et al. 2007). Data onparticle emissions <strong>in</strong> India suggest that 80% <strong>of</strong> carbonaceousaerosols emitted from <strong>the</strong> country orig<strong>in</strong>ate from biomasscombustion (Parashar et al. 2005). The dom<strong>in</strong>ant contribution<strong>of</strong> biomass to particle emissions <strong>in</strong> India is based on <strong>the</strong>importance <strong>of</strong> biomass to <strong>the</strong> rural energy supply, as biomasssupplies 70–80% <strong>of</strong> rural energy needs. Gupta PK <strong>and</strong> colleagues(2001b) used state-level data on food consumption<strong>and</strong> energy required for cook<strong>in</strong>g <strong>in</strong> India <strong>and</strong> estimated <strong>the</strong>overall contributions to <strong>the</strong> total biomass emissions from BC(estimated as 220 gigagrams/yr [95% confidence <strong>in</strong>terval[CI], 65–760) as 75% from wood, 16% from dung cakes, <strong>and</strong>9% from crop waste. For India, <strong>the</strong>refore, BC is a good <strong>in</strong>dicator<strong>of</strong> PM emissions from biomass.Although <strong>the</strong> relative contribution <strong>of</strong> biomass to overallair pollution is larger <strong>in</strong> India than <strong>in</strong> Ch<strong>in</strong>a, total BC emissionsare higher <strong>in</strong> Ch<strong>in</strong>a, with <strong>the</strong> majority orig<strong>in</strong>at<strong>in</strong>g fromcoal combustion <strong>in</strong> <strong>the</strong> <strong>in</strong>dustrial sector (33%) <strong>and</strong> <strong>the</strong> residentialsector (35%), residential combustion <strong>of</strong> wood (12%)<strong>and</strong> agricultural waste (7%), <strong>and</strong> agricultural burn<strong>in</strong>g (7%)(Cao GL et al. 2006). The importance <strong>of</strong> residential sources <strong>of</strong>air pollution <strong>in</strong> Ch<strong>in</strong>a — mostly coal <strong>and</strong> coal briquettes <strong>and</strong>,to a lesser degree, biomass — was also identified by Streets<strong>and</strong> colleagues (2003), who estimated a residential-sourcecontribution (for 2000) <strong>of</strong> 54.5% <strong>of</strong> total BC emissions.An analysis <strong>of</strong> trends <strong>in</strong> BC emissions (Figure 16) <strong>in</strong>dicates<strong>the</strong> dom<strong>in</strong>ance <strong>of</strong> emissions from Ch<strong>in</strong>a <strong>and</strong> India <strong>and</strong>some stabilization <strong>of</strong> emission levels, especially <strong>in</strong> Ch<strong>in</strong>a,due to decreases <strong>in</strong> coal use by households <strong>and</strong> <strong>in</strong>dustry(Streets et al. 2003). Emissions from elsewhere <strong>in</strong> <strong>Asia</strong>(except High-Income <strong>Asia</strong>) still appear to be <strong>in</strong>creas<strong>in</strong>gslowly, <strong>and</strong> Ch<strong>in</strong>ese emissions have <strong>in</strong>creased s<strong>in</strong>ce 2000due to recent <strong>in</strong>creases <strong>in</strong> emissions from <strong>in</strong>dustrial coalburn<strong>in</strong>g <strong>and</strong> diesel vehicles. Similar trends are evident foremissions <strong>of</strong> organic carbon (OC), although overall, 90% <strong>of</strong>OC emissions derive from domestic biomass combustion(Ohara et al. 2007).SO 2 emissions are used as an <strong>in</strong>dicator <strong>of</strong> combustion <strong>of</strong>fossil fuels, especially coal. Although recent data on emissionstrends suggest a stabilization <strong>of</strong> BC emissions <strong>in</strong> India,<strong>the</strong>re has been a cont<strong>in</strong>ued <strong>in</strong>crease <strong>in</strong> fossil-fuel (SO 2 )emissions <strong>in</strong> India <strong>and</strong> Ch<strong>in</strong>a, most recently characterizedby a period <strong>of</strong> stabilized SO 2 emissions followed by aperiod <strong>of</strong> extremely rapid growth <strong>in</strong> emissions (Figure 17).Overall, <strong>the</strong>se trends suggest that combustion <strong>of</strong> biomass is42
HEI International Scientific Oversight CommitteeFigure 16. BC emissions <strong>in</strong> <strong>Asia</strong>, 1980–2005. Data are given <strong>in</strong> kilotons per year. Regions are def<strong>in</strong>ed <strong>in</strong> Table 1. Values for All <strong>Asia</strong> are weighted averages<strong>of</strong> <strong>the</strong> regions. [Adapted from <strong>the</strong> Frontier Research Center for Global Change 2007 with additional material from T. Ohara (personal communication, May26, 2008).]Figure 17. SO 2 emissions <strong>in</strong> <strong>Asia</strong>, 1980–2005. Data are given <strong>in</strong> kilotons per year. Regions are def<strong>in</strong>ed <strong>in</strong> Table 1. Values for All <strong>Asia</strong> are weighted averages<strong>of</strong> <strong>the</strong> regions. [Adapted from <strong>the</strong> Frontier Research Center for Global Change 2007 with additional material from T. Ohara (personal communication, May26, 2008).]43
<strong>Outdoor</strong> <strong>Air</strong> <strong>Pollution</strong> <strong>and</strong> <strong>Health</strong> <strong>in</strong> <strong>the</strong> Develop<strong>in</strong>g <strong>Countries</strong> <strong>of</strong> <strong>Asia</strong>Figure 18. NO x emissions <strong>in</strong> <strong>Asia</strong>, 1980–2005. Data are given <strong>in</strong> kilotons per year. Regions are def<strong>in</strong>ed <strong>in</strong> Table 1. Values for All <strong>Asia</strong> are weighted averages<strong>of</strong> <strong>the</strong> regions. [Adapted from <strong>the</strong> Frontier Research Center for Global Change 2007 with additional material from T. Ohara (personal communication,May 26, 2008).]reach<strong>in</strong>g a plateau across <strong>Asia</strong>, whereas contributions fromfossil-fuel combustion (as evidenced by SO 2 <strong>and</strong> NO xemissions, as shown <strong>in</strong> Figure 17 <strong>and</strong> Figure 18, respectively)are <strong>in</strong>creas<strong>in</strong>g, especially <strong>in</strong> Ch<strong>in</strong>a <strong>and</strong> India.SO 2 emissions <strong>in</strong> Ch<strong>in</strong>a, by far <strong>the</strong> largest component <strong>of</strong><strong>Asia</strong>n emissions, stabilized dur<strong>in</strong>g 1995–2000 ow<strong>in</strong>g todecreases <strong>in</strong> coal use result<strong>in</strong>g from an economic slowdown,<strong>and</strong> a switch to lower-sulfur coal (Streets et al.2003) <strong>and</strong> desulfurized coal. For example, <strong>the</strong> averagesulfur content <strong>of</strong> coal <strong>in</strong> Ch<strong>in</strong>a has decreased from 1.35%before 1985 to 1.12% <strong>in</strong> 1995 <strong>and</strong> 1.08% <strong>in</strong> 2000 (Ohara etal. 2007). Despite <strong>the</strong>se improvements <strong>in</strong> fuel quality, SO 2emissions from Ch<strong>in</strong>a have <strong>in</strong>creased dramatically s<strong>in</strong>ce2002, because <strong>of</strong> <strong>in</strong>creased coal combustion. In Ch<strong>in</strong>a, <strong>the</strong>contribution <strong>of</strong> power plants to SO 2 emissions <strong>in</strong>creasedfrom 28% to 51% dur<strong>in</strong>g 1980–2005. As <strong>of</strong> 2004, roughly35% <strong>of</strong> Ch<strong>in</strong>ese coal-fired power plants had desulfurizationcapability, <strong>in</strong>dicat<strong>in</strong>g a substantial ability to fur<strong>the</strong>rreduce SO 2 emissions from this sector (National Academy<strong>of</strong> Eng<strong>in</strong>eer<strong>in</strong>g [NAE] <strong>and</strong> National Research Council[NRC] 2008). SO 2 emissions from India cont<strong>in</strong>ue to<strong>in</strong>crease gradually. The steady <strong>in</strong>crease (55%) <strong>in</strong> SO 2 emissions<strong>in</strong> India <strong>in</strong> 1990–2000 contrasts with <strong>the</strong> much lower<strong>in</strong>crease (<strong>of</strong> 10%) <strong>in</strong> BC emissions <strong>in</strong> India over <strong>the</strong> sameperiod (Figure 17). In Ch<strong>in</strong>a, which accounted for 70% <strong>of</strong><strong>the</strong> SO 2 emissions <strong>in</strong> <strong>Asia</strong> <strong>in</strong> 2003, coal combustion <strong>in</strong>power plants <strong>and</strong> <strong>in</strong>dustrial sources was responsible formore than 80% <strong>of</strong> <strong>the</strong>se emissions (Ohara et al. 2007),whereas <strong>in</strong> India, which accounted for 13% <strong>of</strong> <strong>the</strong> 2003<strong>Asia</strong>n emissions <strong>of</strong> SO 2 , coal burn<strong>in</strong>g was responsible forroughly 60%. Emissions from High-Income <strong>Asia</strong> cont<strong>in</strong>ueto decrease.Major sources <strong>of</strong> NO x emissions <strong>in</strong> <strong>Asia</strong> <strong>in</strong>clude transport<strong>and</strong> coal combustion <strong>in</strong> power plans <strong>and</strong> <strong>in</strong>dustrialfacilities. S<strong>in</strong>ce <strong>the</strong> mid-1990s, NO x emissions <strong>in</strong> Ch<strong>in</strong>a,India, <strong>and</strong> O<strong>the</strong>r Sou<strong>the</strong>ast <strong>Asia</strong> have <strong>in</strong>creased cont<strong>in</strong>uouslyow<strong>in</strong>g to <strong>in</strong>creased motor-vehicle use <strong>and</strong> power generation,with accelerated growth <strong>in</strong> Ch<strong>in</strong>a <strong>in</strong> recent years,<strong>in</strong>clud<strong>in</strong>g a 15% <strong>in</strong>crease <strong>in</strong> 2005 alone. In Ch<strong>in</strong>a, emissions<strong>in</strong>creased by 395% between 1980 <strong>and</strong> 2005. Emissionsfrom High-Income <strong>Asia</strong> have stabilized but accountedfor a relatively low proportion (11%) <strong>of</strong> <strong>the</strong> total NO x emissions<strong>in</strong> 2005. Although transport-related emissions rema<strong>in</strong>a major source <strong>of</strong> NO x emissions (32% <strong>of</strong> <strong>the</strong> 2005 total),<strong>the</strong> contribution <strong>of</strong> power plants <strong>in</strong>creased from 17% <strong>in</strong>1980 to 35% <strong>in</strong> 2005 <strong>and</strong> <strong>the</strong>y are now <strong>the</strong> lead<strong>in</strong>g source <strong>of</strong>NO x emissions <strong>in</strong> <strong>Asia</strong> (Ohara et al. 2007). Measurements<strong>of</strong> nitrogen dioxide (NO 2 ) concentrations <strong>in</strong> <strong>the</strong> troposphere<strong>of</strong> have shown even larger <strong>in</strong>creases <strong>in</strong> NO 2 <strong>in</strong>Ch<strong>in</strong>a (e.g., a 40% <strong>in</strong>crease between 1996 <strong>and</strong> 2002) thanthose estimated from emissions <strong>in</strong>ventories (Richter et al.2005). The importance <strong>of</strong> motor-vehicle emissions to NO 244
HEI International Scientific Oversight Committeeconcentrations <strong>in</strong> Ch<strong>in</strong>a was demonstrated <strong>in</strong> a 2-dayperiod when traffic-reduction measures (estimated to haveremoved 30% <strong>of</strong> <strong>the</strong> fleet) were implemented <strong>in</strong> Beij<strong>in</strong>gdur<strong>in</strong>g <strong>the</strong> S<strong>in</strong>o-<strong>Asia</strong>n Summit. Remote-sens<strong>in</strong>g measurementsdur<strong>in</strong>g this period detected a decrease <strong>in</strong> NO 2 concentrationsby as much as 40% (Wang YX et al. 2007).Figure 19 presents <strong>in</strong>formation about trends <strong>in</strong> emissions<strong>of</strong> NMVOCs, one <strong>of</strong> <strong>the</strong> major precursors (along with NO x ) <strong>of</strong>O 3 . NMVOC emissions have <strong>in</strong>creased steadily throughout<strong>Asia</strong>, because <strong>of</strong> <strong>in</strong>creased automobile use <strong>and</strong> growth <strong>in</strong> <strong>the</strong>production <strong>and</strong> use <strong>of</strong> chemicals, solvents, <strong>and</strong> petroleumproducts. Unlike <strong>the</strong> o<strong>the</strong>r pollutants discussed above, <strong>of</strong>which both Ch<strong>in</strong>a <strong>and</strong> India are clearly <strong>the</strong> major producers,O<strong>the</strong>r Sou<strong>the</strong>ast <strong>Asia</strong> is an important source <strong>of</strong> NMVOCs,account<strong>in</strong>g for 30% <strong>of</strong> <strong>the</strong> total emissions.Historic Patterns <strong>and</strong> Trends <strong>in</strong> Vehicle Production <strong>and</strong>Use <strong>of</strong> Motor Vehicles The three primary causes <strong>of</strong><strong>in</strong>creases <strong>in</strong> <strong>the</strong> world’s vehicle fleets are population growth,<strong>in</strong>creased urbanization, <strong>and</strong> economic improvement. Asdescribed above, all three are occurr<strong>in</strong>g <strong>in</strong> <strong>Asia</strong> as well as globally.As a result, <strong>the</strong> global vehicle population, which wasestimated to have exceeded one billion units <strong>in</strong> 2002, is predictedto cont<strong>in</strong>ue to grow steadily <strong>and</strong> substantially, follow<strong>in</strong>g<strong>the</strong> historical trends illustrated <strong>in</strong> Figure 20.Data on motor-vehicle production are useful as surrogates<strong>of</strong> vehicle emissions <strong>and</strong> <strong>the</strong> overall composition <strong>of</strong>vehicle fleets with<strong>in</strong> countries. Motor-vehicle productionhas gradually exp<strong>and</strong>ed from North America to Europes<strong>in</strong>ce <strong>the</strong> 1950s <strong>and</strong> to <strong>Asia</strong> more recently. Nowhere has<strong>the</strong> growth been greater than <strong>in</strong> Ch<strong>in</strong>a, as illustrated <strong>in</strong>Figure 21. Ch<strong>in</strong>a is now estimated to be <strong>the</strong> third largestproducer <strong>of</strong> cars, trucks, <strong>and</strong> buses <strong>in</strong> <strong>the</strong> world <strong>and</strong> is rapidlybecom<strong>in</strong>g a major market as well; it is also far <strong>and</strong>away <strong>the</strong> largest producer <strong>of</strong> motorcycles.Numerous forecasts have <strong>in</strong>dicated that <strong>the</strong> motorvehiclepopulation <strong>in</strong> <strong>Asia</strong>n countries that are not members<strong>of</strong> <strong>the</strong> Organisation for Economic Co-operation <strong>and</strong>Development (OECD; only Japan <strong>and</strong> Korea are members)will cont<strong>in</strong>ue to grow rapidly for <strong>the</strong> foreseeable future,especially <strong>in</strong> Ch<strong>in</strong>a <strong>and</strong> India. One <strong>of</strong> <strong>the</strong> most comprehensiveassessments was carried out by <strong>the</strong> World Bus<strong>in</strong>essCouncil for Susta<strong>in</strong>able Development (2004). As illustrated<strong>in</strong> Figure 22, more than a doubl<strong>in</strong>g <strong>of</strong> <strong>the</strong> vehiclepopulation is forecast to occur between 2000 <strong>and</strong> 2025,with Ch<strong>in</strong>a driv<strong>in</strong>g this growth.One <strong>of</strong> <strong>the</strong> most dist<strong>in</strong>ctive characteristics <strong>of</strong> <strong>the</strong> regionis <strong>the</strong> dom<strong>in</strong>ant role played by two-wheeled vehicles <strong>in</strong>many <strong>Asia</strong>n cities. Throughout most <strong>of</strong> non-OECD <strong>Asia</strong>,<strong>the</strong>re are many more motorcycles <strong>and</strong> scooters than cars(Figure 23). But this pattern is shift<strong>in</strong>g rapidly, as <strong>the</strong> rateFigure 19. NMVOC emissions <strong>in</strong> <strong>Asia</strong>, 1980–2005. Data are given <strong>in</strong> kilotons per year. Regions are def<strong>in</strong>ed <strong>in</strong> Table 1. Values for All <strong>Asia</strong> are weighted averages<strong>of</strong> <strong>the</strong> regions. [Adapted from <strong>the</strong> Frontier Research Center for Global Change 2007 with additional material from T. Ohara (personal communication,May 26, 2008).]45
<strong>Outdoor</strong> <strong>Air</strong> <strong>Pollution</strong> <strong>and</strong> <strong>Health</strong> <strong>in</strong> <strong>the</strong> Develop<strong>in</strong>g <strong>Countries</strong> <strong>of</strong> <strong>Asia</strong>Figure 20. Motor-vehicle production worldwide, 1930–2005. [Data compiledfrom Ward’s Automotive Group 2008.]Figure 21. Motor-vehicle production <strong>in</strong> Ch<strong>in</strong>a, 1980–2005. [Data compiledfrom Ward’s Automotive Group 2008.]Figure 22. Past <strong>and</strong> projected distribution <strong>of</strong> <strong>the</strong> motor-vehicle population<strong>in</strong> non-OECD <strong>Asia</strong>, 2000–2025. (Only Japan <strong>and</strong> Korea are members<strong>of</strong> <strong>the</strong> OECD.) [Data compiled from World Bus<strong>in</strong>ess Council for Susta<strong>in</strong>ableDevelopment 2004.]<strong>of</strong> growth <strong>of</strong> <strong>the</strong> car population eclipses that <strong>of</strong> motorizedtwo-wheelers. As discussed above, emissions are substantiallygreater from two-stroke than from four-stroke vehicles,<strong>and</strong> it is <strong>the</strong> eng<strong>in</strong>e type ra<strong>the</strong>r than <strong>the</strong> number <strong>of</strong>wheels that is <strong>the</strong> greatest determ<strong>in</strong>ant <strong>of</strong> emissions (seeSidebar 7).Stationary Sources: Current Status <strong>and</strong> ProjectedTrends Stationary sources are fixed-site producers <strong>of</strong>pollution. Industrial sources <strong>in</strong> <strong>Asia</strong> that emit air pollution<strong>in</strong>clude large-scale power plants <strong>and</strong> manufactur<strong>in</strong>g facilitiesas well as small, family-owned manufactur<strong>in</strong>g shops— which are numerous <strong>and</strong> difficult to control, <strong>and</strong> whoseemissions are widespread throughout <strong>Asia</strong>n cities. In somelocations (e.g., Hanoi, Dhaka, <strong>and</strong> Kathm<strong>and</strong>u), numeroussmall sources, such as brick kilns, collectively make majorcontributions to air pollution (CAI-<strong>Asia</strong> Center 2002; Co etal. 2009). Larger <strong>in</strong>dustrial sources typically have ductedemissions, but some also have fugitive dust <strong>and</strong> nonductedFigure 23. Past <strong>and</strong> projected trends <strong>in</strong> <strong>the</strong> motor-vehicle population <strong>in</strong>non-OECD <strong>Asia</strong>, 2000–2025, accord<strong>in</strong>g to type <strong>of</strong> vehicle. (Only Japan<strong>and</strong> Korea are members <strong>of</strong> <strong>the</strong> OECD.) [Data compiled from World Bus<strong>in</strong>essCouncil for Susta<strong>in</strong>able Development 2004.]emissions from various processes, which collectively pollute<strong>the</strong> air. Fuels used by larger stationary sources aremostly coal, furnace oil, LPG, <strong>and</strong> natural gas. Coal- <strong>and</strong>oil-fired power plants are usually <strong>the</strong> largest sources <strong>of</strong>SO 2 emissions with<strong>in</strong> a city because <strong>of</strong> <strong>the</strong> large amount <strong>of</strong>fuel <strong>the</strong>y consume. <strong>Air</strong> pollution control technologies forlarge stationary sources <strong>in</strong>clude use <strong>of</strong> lower-sulfur fuelsas well as end-<strong>of</strong>-<strong>the</strong>-pipe control equipment such as electrostaticprecipitators, scrubbers, baghouses (a type <strong>of</strong>fabric filter), <strong>and</strong> flue-gas desulfurization units. Eventhough large stationary sources such as power plants may46
HEI International Scientific Oversight CommitteeSidebar 7. MOTOR-VEHICLE PROFILES IN CHINA AND INDIAData on emerg<strong>in</strong>g motor-vehicle markets <strong>in</strong> <strong>Asia</strong> are collected bySegment Y Automotive Intelligence, a Dutch company operat<strong>in</strong>gout <strong>of</strong> India. The follow<strong>in</strong>g country pr<strong>of</strong>iles are based on recentdata provided to <strong>the</strong> <strong>Asia</strong>n Development Bank by Segment Y.CHINACh<strong>in</strong>a has <strong>the</strong> fastest grow<strong>in</strong>g vehicle population <strong>in</strong> <strong>the</strong> world.Figure 7.1 provides a detailed breakdown <strong>of</strong> <strong>the</strong> known <strong>and</strong>expected vehicle population from 2005 to 2025. This forecastshows rapid growth <strong>in</strong> <strong>the</strong> car population but also <strong>in</strong>dicatesthat <strong>the</strong> two-wheeled vehicle population will likely rema<strong>in</strong> <strong>the</strong>largest segment <strong>of</strong> motor vehicles through 2025. However, <strong>the</strong>growth rate for cars is greater than <strong>the</strong> growth rates for o<strong>the</strong>rvehicles; <strong>the</strong> projection <strong>in</strong> Figure 7.2 suggests an <strong>in</strong>crease <strong>in</strong><strong>the</strong> numbers <strong>of</strong> cars by a factor <strong>of</strong> n<strong>in</strong>e, <strong>and</strong> an <strong>in</strong>crease <strong>in</strong> <strong>the</strong>numbers <strong>of</strong> light commercial vehicles by a factor <strong>of</strong> four,between 2005 <strong>and</strong> 2025. Vehicle growth is estimated to beroughly evenly divided between gasol<strong>in</strong>e <strong>and</strong> diesel vehicles(Figure 7.3). However, <strong>the</strong> absolute number <strong>of</strong> gasol<strong>in</strong>e vehiclesis expected to far outweigh that <strong>of</strong> diesel vehicles dur<strong>in</strong>g thisperiod (Figure 7.4). In <strong>the</strong> future, <strong>the</strong> pressure to curtail oilCont<strong>in</strong>ued on next pageFigure 7.3. Current <strong>and</strong> projected <strong>in</strong>creases <strong>in</strong> motor-vehicle populations <strong>in</strong>Ch<strong>in</strong>a compared with 2005, accord<strong>in</strong>g to fuel type. Values are multiples <strong>of</strong><strong>the</strong> number <strong>of</strong> vehicles present <strong>in</strong> 2005 (<strong>the</strong> basel<strong>in</strong>e). (Based on data presented<strong>in</strong> Figures 20 <strong>and</strong> 21.)Figure 7.1. Current <strong>and</strong> projected <strong>in</strong>creases <strong>of</strong> number <strong>of</strong> motor vehicles <strong>in</strong>Ch<strong>in</strong>a (<strong>in</strong> millions), accord<strong>in</strong>g to vehicle type. [Data compiled from <strong>Asia</strong>nDevelopment Bank 2006c.]Figure 7.2. Current <strong>and</strong> projected <strong>in</strong>creases <strong>in</strong> motor-vehicle populations <strong>in</strong>Ch<strong>in</strong>a compared with 2005, accord<strong>in</strong>g to vehicle type. Values are multiples<strong>of</strong> <strong>the</strong> number <strong>of</strong> vehicles present <strong>in</strong> 2005 (<strong>the</strong> basel<strong>in</strong>e). (Based on datapresented <strong>in</strong> Figures 20 <strong>and</strong> 21.)Figure 7.4. Current <strong>and</strong> projected <strong>in</strong>creases <strong>in</strong> number <strong>of</strong> motor vehicle <strong>in</strong>Ch<strong>in</strong>a, accord<strong>in</strong>g to fuel type. All values are <strong>in</strong> millions. [Data compiled from<strong>Asia</strong>n Development Bank 2006c.]47
<strong>Outdoor</strong> <strong>Air</strong> <strong>Pollution</strong> <strong>and</strong> <strong>Health</strong> <strong>in</strong> <strong>the</strong> Develop<strong>in</strong>g <strong>Countries</strong> <strong>of</strong> <strong>Asia</strong>Sidebar 7. MOTOR-VEHICLE PROFILES IN CHINA AND INDIA(Cont<strong>in</strong>ued)imports through fuel-efficient technologies may come to outweigh<strong>the</strong> pressure to reduce air pollution; if so, clean dieselvehicles could become available <strong>in</strong> Ch<strong>in</strong>a, <strong>in</strong> which case <strong>the</strong>recould be a dramatic <strong>in</strong>crease <strong>in</strong> <strong>the</strong> diesel-car population.INDIAFigure 7.5 shows that <strong>the</strong> vehicle population <strong>in</strong> India is alsogrow<strong>in</strong>g very rapidly, with a predicted <strong>in</strong>crease by nearly afactor <strong>of</strong> five from 2005 to 2025.Figure 7.5. Current <strong>and</strong> projected <strong>in</strong>creases <strong>in</strong> number <strong>of</strong> motor vehicles<strong>in</strong> India (<strong>in</strong> millions) compared with 2005, accord<strong>in</strong>g to vehicletype. [Data compiled from <strong>Asia</strong>n Development Bank 2006c.]be responsible for a majority <strong>of</strong> pollutant emissions, comparedwith mobile sources or smaller-scale po<strong>in</strong>t sources,<strong>the</strong>ir impact on local concentrations <strong>and</strong> exposures may beless important if emissions occur above <strong>the</strong> atmosphericlayer <strong>in</strong> which pollutant mix<strong>in</strong>g occurs.<strong>Asia</strong>’s rapid urbanization is result<strong>in</strong>g <strong>in</strong> <strong>in</strong>creas<strong>in</strong>g airpollution threats <strong>in</strong> its cities. In <strong>the</strong> power-generationsector, Ch<strong>in</strong>a <strong>and</strong> India dom<strong>in</strong>ate <strong>Asia</strong>n consumption,us<strong>in</strong>g <strong>the</strong> largest amounts <strong>of</strong> fuel to produce electricity.India has recently overtaken Japan as <strong>the</strong> second largestconsumer <strong>of</strong> fuel to generate power, <strong>and</strong> this trend is projectedto cont<strong>in</strong>ue <strong>in</strong> <strong>the</strong> future. In <strong>the</strong> <strong>in</strong>dustrial sector,Ch<strong>in</strong>a, Japan, India, <strong>and</strong> Sou<strong>the</strong>ast <strong>Asia</strong>n countries use <strong>the</strong>most fuel, whereas <strong>in</strong> <strong>the</strong> domestic sector, Ch<strong>in</strong>a <strong>and</strong> Japanuse <strong>the</strong> most fuel, followed by Sou<strong>the</strong>ast <strong>Asia</strong>n countries.Waste <strong>in</strong>c<strong>in</strong>eration may also be an important stationarysource <strong>of</strong> air pollution <strong>in</strong> urban areas. Among <strong>Asia</strong>n countries,<strong>the</strong>re is great diversity <strong>in</strong> <strong>the</strong> degree <strong>of</strong> development <strong>of</strong>municipal waste <strong>in</strong>c<strong>in</strong>eration; <strong>the</strong>se differences are reflective<strong>of</strong> <strong>the</strong> vary<strong>in</strong>g levels <strong>of</strong> <strong>in</strong>dustrialization, scarcity <strong>of</strong>l<strong>and</strong> for l<strong>and</strong>fills, consumption habits, <strong>and</strong> wealth (Hunsickeret al. 1996). Open burn<strong>in</strong>g <strong>of</strong> solid waste is also animportant source <strong>of</strong> air pollution <strong>in</strong> some locations <strong>in</strong> <strong>Asia</strong>that lack modern waste-management practices.A description <strong>of</strong> <strong>the</strong> stationary sources <strong>in</strong> selected countries,represent<strong>in</strong>g <strong>the</strong> range <strong>of</strong> <strong>in</strong>dustrial developmentwith<strong>in</strong> <strong>Asia</strong>, is provided below.Ch<strong>in</strong>a In l<strong>in</strong>e with <strong>the</strong> rapid expansion <strong>of</strong> <strong>the</strong> Ch<strong>in</strong>eseeconomy after <strong>the</strong> late 1970s, <strong>the</strong>re has been an <strong>in</strong>creas<strong>in</strong>gdem<strong>and</strong> for electricity. The situation <strong>in</strong> Shanghai providesan example <strong>of</strong> how this energy dem<strong>and</strong> has affected airpollutant emissions <strong>and</strong> concentrations.Energy use <strong>in</strong> Shanghai, Ch<strong>in</strong>a’s ma<strong>in</strong> <strong>in</strong>dustrial city, hastraditionally been dom<strong>in</strong>ated by coal, which accounted forabout 70% <strong>of</strong> total energy consumption <strong>in</strong> <strong>the</strong> early 1990s.In Shanghai, <strong>the</strong> <strong>in</strong>dustrial sector was <strong>the</strong> s<strong>in</strong>gle largestenergy-consum<strong>in</strong>g sector <strong>in</strong> 1995, us<strong>in</strong>g about 50% <strong>of</strong> <strong>the</strong>total energy, whereas power plants used about one third <strong>of</strong><strong>the</strong> total (Li et al. 2004). Li <strong>and</strong> colleagues projected thatpower generation will account for 50% <strong>of</strong> <strong>the</strong> dem<strong>and</strong> forfuel <strong>in</strong> Shanghai by 2020. Along with this shift, <strong>in</strong> <strong>the</strong> last10 years, heavy <strong>in</strong>dustries have relocated from urban centersto less-populated, remote areas; coal-fired <strong>in</strong>dustrialboilers have been replaced by those that use cleaner fuels;<strong>and</strong> emission controls have been <strong>in</strong>stalled at large powerplants. These changes have led to reduced emissions <strong>of</strong> airpollutants from stationary sources. Semi-dry scrubbers<strong>and</strong> baghouses are <strong>the</strong> preferred means for meet<strong>in</strong>g emissionst<strong>and</strong>ards.India In India, <strong>the</strong> majority <strong>of</strong> electricity is generatedfrom coal-based <strong>the</strong>rmal power plants (88%), with smallamounts produced by gas plants (9%) <strong>and</strong> oil-based plants(3%) (Bharati 1997; Reddy <strong>and</strong> Venkataraman 2002). Inaddition, India has primary <strong>and</strong> secondary producers <strong>of</strong>steel that use coal as <strong>the</strong>ir major fuel (with small quantities<strong>of</strong> oil <strong>and</strong> gaseous fuels) (Steel Authority <strong>of</strong> India 1998).Mumbai, <strong>the</strong> most <strong>in</strong>dustrialized Indian city, has 183 airpollut<strong>in</strong>g <strong>in</strong>dustries; 70 are large scale, 37 are mediumscale, <strong>and</strong> 76 are small scale. In addition, <strong>the</strong>re are 32stone-crush<strong>in</strong>g plants <strong>in</strong> <strong>the</strong> region (Bhanarkar et al. 2005).Nepal The ma<strong>in</strong> stationary sources <strong>of</strong> airborne pollutants<strong>in</strong> Nepal are <strong>the</strong> combustion <strong>of</strong> fossil fuels for heat<strong>in</strong>g <strong>and</strong>48
HEI International Scientific Oversight Committeepower <strong>and</strong> <strong>the</strong> release <strong>of</strong> waste gases <strong>and</strong> dust from <strong>in</strong>dustrialprocesses. Kathm<strong>and</strong>u Valley is <strong>the</strong> site <strong>of</strong> about 50%<strong>of</strong> <strong>the</strong> total <strong>in</strong>dustries <strong>in</strong> Nepal (Devkota <strong>and</strong> Neupane1994). In <strong>the</strong> Kathm<strong>and</strong>u Valley, brick kiln operations are<strong>the</strong> major source <strong>of</strong> airborne PM. Industries like carpet <strong>and</strong>garment producers <strong>and</strong> pr<strong>in</strong>t<strong>in</strong>g shops are more centralized<strong>in</strong> <strong>the</strong> Kathm<strong>and</strong>u Valley than <strong>in</strong> o<strong>the</strong>r parts <strong>of</strong> <strong>the</strong> country.In <strong>the</strong> <strong>in</strong>dustrial sector <strong>in</strong> Nepal, <strong>the</strong> ma<strong>in</strong> fuel burned iscoal (78%), followed by wood (17%), with brick-mak<strong>in</strong>gaccount<strong>in</strong>g for most <strong>of</strong> <strong>the</strong> total fuel use (75%), followed by<strong>the</strong> cement <strong>in</strong>dustry (16%) (Shrestha <strong>and</strong> Malla 2007).Japan Japan’s economy is mature, with an advanced<strong>in</strong>dustrial sector <strong>and</strong> strictly enforced emission st<strong>and</strong>ards.The ma<strong>in</strong> stationary sources <strong>of</strong> air pollution <strong>in</strong> Japan are<strong>the</strong> motor-vehicle <strong>in</strong>dustry, petrochemical plants, <strong>and</strong>electronics manufactur<strong>in</strong>g facilities. Japan performs morewaste <strong>in</strong>c<strong>in</strong>eration than o<strong>the</strong>r <strong>Asia</strong>n countries <strong>and</strong> has one<strong>of</strong> <strong>the</strong> highest percentages <strong>of</strong> power plants that are wasteto-energyfacilities <strong>in</strong> <strong>the</strong> world.Table 5. Major Indoor Sources <strong>of</strong> <strong>Air</strong> <strong>Pollution</strong> aSourceKey PollutantsHousehold solid PM 2.5 , CO, PAHs, NO x , VOCs,fuel usesemi-VOCsCoalPM 2.5 , NO x , sulfur oxides,arsenic, fluor<strong>in</strong>eTobacco smoke PM 2.5 , CO, PAHs, VOCs, semi-VOCsCook<strong>in</strong>gPM 2.5 , PAHs, NO x , VOCs, semi-VOCs, aldehydesClean<strong>in</strong>g PM 2.5Incense <strong>and</strong> mosquito PM 2.5coilsConsumer products VOCs, semi-VOCs, pesticidesConstruction materials VOCs, semi-VOCs, aldehydes,used <strong>in</strong> remodel<strong>in</strong>g or asbestos, lead, radondemolitionBuild<strong>in</strong>gcharacteristics relatedto moisture,ventilation, <strong>and</strong>furnish<strong>in</strong>gsSoil, rock, <strong>and</strong> watersources underbuild<strong>in</strong>gIndoor chemicalprocessesBiologic pollutants (fungalspores, mites, cockroaches,endotox<strong>in</strong>s, glucans)Radona Adapted from Zhang JF <strong>and</strong> Smith 2003.Free radicals <strong>and</strong> o<strong>the</strong>r shortlived,highly reactivecompoundsIndoor <strong>Air</strong> <strong>Pollution</strong> Major sources <strong>of</strong> <strong>in</strong>door air pollutionare summarized <strong>in</strong> Table 5. Some are also described below.Household Use <strong>of</strong> Solid Fuels The use <strong>of</strong> solid fuels,namely biomass <strong>and</strong> coal, is <strong>the</strong> most widespread traditionalsource <strong>of</strong> <strong>in</strong>door air pollution. Indeed, nearly 3 billionpeople cont<strong>in</strong>ue to rely on solid fuels for cook<strong>in</strong>g <strong>and</strong> heat<strong>in</strong>g(Smith et al. 2004; Bruce et al. 2006), with <strong>the</strong> combustion <strong>of</strong>fuels <strong>in</strong> open fires or low-efficiency, unvented stoves <strong>of</strong>tenresult<strong>in</strong>g <strong>in</strong> <strong>the</strong> release <strong>of</strong> smoke directly <strong>in</strong>to <strong>the</strong> home environment.Women <strong>and</strong> children <strong>of</strong>ten experience <strong>the</strong> greatestexposures, as well as <strong>the</strong> greatest health impacts, because<strong>the</strong>y spend more time than men <strong>in</strong>doors <strong>in</strong> close proximity to<strong>the</strong> stove or cook<strong>in</strong>g fire. Despite rapid <strong>in</strong>creases <strong>in</strong> urbanization<strong>and</strong> shifts to modern lifestyles, household use <strong>of</strong> solidfuel rema<strong>in</strong>s responsible for a substantial burden <strong>of</strong> disease<strong>in</strong> develop<strong>in</strong>g countries <strong>of</strong> <strong>Asia</strong> (Table 6).Table 6. Household Use <strong>of</strong> Solid Fuel <strong>and</strong> AssociatedBurdens <strong>of</strong> Disease <strong>in</strong> Selected <strong>Asia</strong>n <strong>Countries</strong> <strong>in</strong> 2002 aRegion b /CountrySolid FuelDiseaseUse (%) c Deaths d Burden (%) eIndia 82 407,100 3.5Ch<strong>in</strong>a 80 380,700 1.6High-Income <strong>Asia</strong>Japan < 5South Korea < 5S<strong>in</strong>gapore < 5O<strong>the</strong>r South <strong>Asia</strong>Afghanistan > 95 23,900 4.9Bangladesh 89 46,000 3.6Nepal 81 7,500 2.7Pakistan 81 70,700 4.6Sri Lanka 67 3,100 1.3O<strong>the</strong>r Sou<strong>the</strong>ast <strong>Asia</strong>Cambodia > 95 1,600 1Indonesia 72 15,300 0.7Laos > 95 2,400 3.5Malaysia < 5 < 100 0Myanmar > 95 14,700 3.2Philipp<strong>in</strong>es 45 6,900 1.6Thail<strong>and</strong> 72 4,600 0.8Vietnam 70 10,600 1.2a Data compiled from WHO 2007a.b Regions are def<strong>in</strong>ed <strong>in</strong> Table 1.c The percentage <strong>of</strong> <strong>the</strong> total household fuel used <strong>in</strong> <strong>the</strong> country.d The number <strong>of</strong> deaths attributable to household use <strong>of</strong> solid fuel.e The percentage <strong>of</strong> <strong>the</strong> country’s total burden <strong>of</strong> disease.49
<strong>Outdoor</strong> <strong>Air</strong> <strong>Pollution</strong> <strong>and</strong> <strong>Health</strong> <strong>in</strong> <strong>the</strong> Develop<strong>in</strong>g <strong>Countries</strong> <strong>of</strong> <strong>Asia</strong>Modern Sources With <strong>in</strong>creased economic development,households gradually shift to cleaner gaseous fuels, butthis shift is slow <strong>and</strong> largely conf<strong>in</strong>ed to high- <strong>and</strong> middle<strong>in</strong>comefamilies. In addition, as <strong>the</strong> hous<strong>in</strong>g stock goesfrom temporary structures to more permanent ones, o<strong>the</strong>r<strong>in</strong>door sources <strong>of</strong> air pollution, especially those related tohousehold furnish<strong>in</strong>gs, build<strong>in</strong>g materials, <strong>and</strong> clean<strong>in</strong>gagents, become more prevalent. In general, <strong>the</strong>se result <strong>in</strong>substantially lower exposures than household solid fueluse, however.Incense Burn<strong>in</strong>g Incense burn<strong>in</strong>g also contributes to high<strong>in</strong>door air pollution concentrations <strong>in</strong> both homes <strong>and</strong>religious centers (Tung et al. 1999). PM with an aerodynamicdiameter 10 µm (PM 10 ), PM 2.5 , volatile organiccompounds (VOCs), CO, CO 2 , NO x , SO 2 , methane (CH 4 ),<strong>and</strong> polycyclic aromatic hydrocarbons (PAHs) have beendetected <strong>in</strong> <strong>in</strong>cense smoke (Jetter et al. 2002; Lung <strong>and</strong> Hu2003; Lee SC <strong>and</strong> Wang B 2004). The generation <strong>of</strong> PM <strong>and</strong>associated PAHs from <strong>in</strong>cense burn<strong>in</strong>g varies among<strong>in</strong>cense sticks with<strong>in</strong> <strong>the</strong> same class <strong>of</strong> <strong>in</strong>cense, among <strong>the</strong>various classes <strong>of</strong> <strong>in</strong>cense, <strong>and</strong> among segments with<strong>in</strong> <strong>the</strong>same <strong>in</strong>cense stick (Lung <strong>and</strong> Hu 2003). S<strong>in</strong>ce <strong>in</strong>cense<strong>in</strong>gredients used can vary across cultures, a better underst<strong>and</strong><strong>in</strong>gis needed <strong>of</strong> which <strong>in</strong>cense <strong>in</strong>gredients releaseharmful compounds when burned (Chang YC et al. 2007).Environmental Tobacco Smoke Tobacco smoke, a form<strong>of</strong> biomass combustion, is likely to be <strong>the</strong> most importantsource <strong>of</strong> <strong>in</strong>door air pollution <strong>in</strong> households not us<strong>in</strong>gsolid fuels for cook<strong>in</strong>g or heat<strong>in</strong>g. Although smokersexperience <strong>the</strong> highest exposures, nonsmokers shar<strong>in</strong>g anenvironment with smokers also <strong>in</strong>hale environmentaltobacco smoke (ETS). As <strong>in</strong> <strong>the</strong> West, studies <strong>in</strong> <strong>Asia</strong> (e.g.,Hong Kong <strong>and</strong> cities <strong>in</strong> India) report acute effects <strong>of</strong> exposureto ETS (Lam et al. 2000; Gupta D et al. 2002; McGheeet al. 2002).Because household conditions (<strong>in</strong>clud<strong>in</strong>g ventilation)vary dramatically by <strong>in</strong>come, culture, <strong>and</strong> climate, generaliz<strong>in</strong>gabout emissions trends <strong>in</strong> <strong>the</strong> absence <strong>of</strong> field surveysis difficult. Few data are available regard<strong>in</strong>g <strong>in</strong>doorair pollution concentrations <strong>in</strong> schools, occupational sett<strong>in</strong>gs(especially <strong>the</strong> so-called <strong>in</strong>formal sector that is sizeable<strong>in</strong> poor countries), public build<strong>in</strong>gs, motor vehiclesused for transport, <strong>and</strong> o<strong>the</strong>r non-household <strong>in</strong>door locationswhere people spend much time.POLLUTANT CONCENTRATIONSMonitor<strong>in</strong>g DataStatus <strong>and</strong> Trends <strong>in</strong> Ambient Concentrations Asnoted <strong>in</strong> previous reports (HEI ISOC 2004; WHO 2006a),air quality levels <strong>in</strong> <strong>Asia</strong>n cities rema<strong>in</strong> well above <strong>the</strong>maximum levels set by national <strong>and</strong> <strong>in</strong>ternational st<strong>and</strong>ards<strong>and</strong> pose a great challenge to <strong>Asia</strong>n megacities as<strong>the</strong>ir economies cont<strong>in</strong>ue to grow at a record pace.Figure 24 shows summary 5-year average concentrations(from 2000–2004) <strong>of</strong> PM 10 , SO 2 , <strong>and</strong> NO 2 <strong>in</strong> 20 <strong>Asia</strong>ncities. PM 10 is <strong>the</strong> rout<strong>in</strong>ely monitored air pollutant <strong>of</strong>greatest concern <strong>in</strong> all <strong>the</strong>se cities, with Beij<strong>in</strong>g, Dhaka,Figure 24. Five-year (2000–2004) average PM 10 , SO 2 , <strong>and</strong> NO 2 concentrations <strong>in</strong> selected <strong>Asia</strong>n cities. St<strong>and</strong>ards from WHO air quality guidel<strong>in</strong>e, 2005Global Update (WHO 2006): PM 10 annual average, 20 µg/m 3 ; SO 2 24-hr average, 20 µg/m 3 ; <strong>and</strong> NO 2 annual average, 40 µg/m 3 . [Repr<strong>in</strong>ted with permissionfrom CAI-<strong>Asia</strong> (www.cleanairnet.org/caiasia; accessed January 2008).]50
HEI International Scientific Oversight CommitteeFigure 25. Annual averages <strong>of</strong> PM 10 , SO 2 , <strong>and</strong> NO 2 aggregated among selected <strong>Asia</strong>n cities, 1993–2005. Data averaged among <strong>the</strong> cities listed <strong>in</strong> Figure24. The straight l<strong>in</strong>es are smoo<strong>the</strong>d estimates <strong>of</strong> trends <strong>in</strong> air pollution levels. [Repr<strong>in</strong>ted with permission from CAI-<strong>Asia</strong> (www.cleanairnet.org/caiasia;accessed January 2008).]Hanoi, Kathm<strong>and</strong>u, Kolkata, New Delhi, <strong>and</strong> Shanghaireport<strong>in</strong>g annual averages > 5 times <strong>the</strong> WHO guidel<strong>in</strong>es’limit on PM 10 <strong>of</strong> 20 µg/m 3 . Although PM 2.5 is not yet part<strong>of</strong> most regulatory ambient air quality monitor<strong>in</strong>g networks<strong>in</strong> <strong>Asia</strong>, several studies have conducted systematicmonitor<strong>in</strong>g <strong>of</strong> PM 2.5 <strong>and</strong> PM 10 <strong>in</strong> <strong>Asia</strong>n cities (Oanh et al.2006; Hopke et al. 2008). These reports suggest that annualaverage PM 2.5 concentrations are generally above 25 µg/m 3<strong>and</strong> as high as 150 µg/m 3 , with PM 2.5 :PM 10 ratios rang<strong>in</strong>gfrom roughly 0.4 to 0.7 <strong>in</strong> urban areas <strong>of</strong> rapidly develop<strong>in</strong>gcountries <strong>in</strong> <strong>Asia</strong>. On <strong>the</strong> basis <strong>of</strong> <strong>the</strong>se studies, longtermconcentrations well above <strong>the</strong> WHO guidel<strong>in</strong>es’PM 2.5 limit <strong>of</strong> 10 µg/m 3 would appear to be <strong>the</strong> norm <strong>in</strong>urban areas throughout much <strong>of</strong> <strong>Asia</strong>. Short-term concentrations<strong>and</strong> concentrations measured at high-impact locations(e.g., <strong>in</strong> traffic) <strong>in</strong>dicate that concentrations <strong>of</strong> PMmuch higher than <strong>the</strong> estimated annual average are alsopresent <strong>in</strong>termittently or <strong>in</strong> specific geographic areas.The WHO limits for SO 2 <strong>and</strong> NO 2 are 50 µg/m 3 <strong>and</strong> 40µg/m 3 , respectively, with only Beij<strong>in</strong>g exceed<strong>in</strong>g <strong>the</strong> SO 2limit <strong>and</strong> 9 cities (Bangkok, Busan, Hong Kong, Jakarta,Kolkata, Seoul, Shanghai, Taipei, <strong>and</strong> Tokyo) <strong>of</strong> 20 majorcities exceed<strong>in</strong>g <strong>the</strong> NO 2 limit (Figure 24).Annual trends <strong>in</strong> air quality (1993–2005) across major<strong>Asia</strong>n cities suggest a significant downward trend <strong>in</strong> annualaverage SO 2 concentrations <strong>in</strong> urban areas <strong>in</strong> contrast to <strong>the</strong><strong>in</strong>crease <strong>in</strong> overall country-level emissions (Figure 25), with<strong>the</strong> exception <strong>of</strong> an average <strong>in</strong>crease <strong>in</strong> SO 2 concentrationdur<strong>in</strong>g 2005. These SO 2 reductions occurred <strong>in</strong> spite <strong>of</strong><strong>in</strong>creas<strong>in</strong>g fuel consumption. Regulations requir<strong>in</strong>g <strong>the</strong> use<strong>of</strong> low-sulfur fuels <strong>and</strong> relocation <strong>of</strong> major coal-fired powerplants <strong>and</strong> <strong>in</strong>dustrial facilities to outside <strong>of</strong> cities wereresponsible for <strong>the</strong>se decreases. Overall, <strong>the</strong> trends <strong>in</strong> urbanair quality measurements <strong>of</strong> SO 2 broadly follow <strong>the</strong> emissionestimates described earlier <strong>in</strong> this section. However, <strong>the</strong>emission estimates suggest a substantial <strong>in</strong>crease <strong>in</strong> SO 2emissions at <strong>the</strong> country level <strong>in</strong> <strong>Asia</strong> that has been driven by<strong>in</strong>creases <strong>in</strong> <strong>in</strong>dustrial emissions <strong>in</strong> Ch<strong>in</strong>a s<strong>in</strong>ce 2002 — atrend confirmed by <strong>the</strong> Ch<strong>in</strong>ese State EnvironmentalProtection Adm<strong>in</strong>istration (SEPA; NAE <strong>and</strong> NRC 2008). SO 2concentrations measured <strong>in</strong> Ch<strong>in</strong>ese cities also reflect <strong>the</strong>emissions trends, show<strong>in</strong>g large decreases until 2000 but<strong>in</strong>creases <strong>in</strong> some cities (particularly <strong>in</strong> north Ch<strong>in</strong>a) after2000 (Hao <strong>and</strong> Wang LT 2005). Figure 26 shows trends <strong>in</strong> SO 2concentrations <strong>in</strong> several large Ch<strong>in</strong>ese cities for 1980–2005.PM 10 concentrations <strong>in</strong> <strong>Asia</strong> also have been decl<strong>in</strong><strong>in</strong>g(Figure 25); <strong>the</strong> aggregated annual average <strong>in</strong> <strong>Asia</strong>n citiesdecreased by approximately 25% between 1993 <strong>and</strong> 2005,as compared with <strong>the</strong> reduction by about 50% <strong>in</strong> SO 2 concentrationsover <strong>the</strong> same period. More recent data from<strong>the</strong> capital cities <strong>of</strong> several Ch<strong>in</strong>ese prov<strong>in</strong>ces, over 2003–2006 (Figure 27), do not show consistent decreases,although some local reductions <strong>in</strong> PM 10 concentrationshave been reported. For example, <strong>in</strong> Hua<strong>in</strong>an (NAE <strong>and</strong>NRC 2008), an <strong>in</strong>dustrial city <strong>of</strong> 2.3 million people,<strong>in</strong>creased government regulation <strong>and</strong> clos<strong>in</strong>g <strong>of</strong> highlypollut<strong>in</strong>g sites resulted <strong>in</strong> decreases <strong>in</strong> PM 10 concentrationsbetween 2002 <strong>and</strong> 2005, although concentrationsstill exceed <strong>the</strong> Ch<strong>in</strong>ese class II limits <strong>of</strong> 100 µg/m 3 as <strong>the</strong>annual average.51
<strong>Outdoor</strong> <strong>Air</strong> <strong>Pollution</strong> <strong>and</strong> <strong>Health</strong> <strong>in</strong> <strong>the</strong> Develop<strong>in</strong>g <strong>Countries</strong> <strong>of</strong> <strong>Asia</strong>Figure 26. Annual average SO 2 concentrations <strong>in</strong> several large cities <strong>in</strong> Ch<strong>in</strong>a. [Adapted from National Academy <strong>of</strong> Eng<strong>in</strong>eer<strong>in</strong>g <strong>and</strong> National ResearchCouncil 2008, with permission from <strong>the</strong> National Academies Press, National Academy <strong>of</strong> Sciences.]Figure 27. PM 10 concentrations <strong>in</strong> capital cities <strong>of</strong> Ch<strong>in</strong>ese prov<strong>in</strong>ces, 2003–2006. [Data supplied by National Statistic Communiqué, National Bureau <strong>of</strong>Statistics <strong>of</strong> Ch<strong>in</strong>a 2004. Data supplied by National Statistic Communiqué 2008.]The downward trend <strong>in</strong> <strong>the</strong> aggregate annual averageNO 2 concentration (Figure 25) is quite modest, < 10% from1993 through 2005. Overall, estimates <strong>of</strong> NO x emissions<strong>in</strong>dicate steady <strong>in</strong>creases, especially <strong>in</strong> Ch<strong>in</strong>a, over thissame period. Remote sens<strong>in</strong>g also <strong>in</strong>dicates even greater<strong>in</strong>creases <strong>in</strong> NO x concentrations than predicted by <strong>the</strong>REAS emissions <strong>in</strong>ventory, especially <strong>in</strong> Ch<strong>in</strong>a (bothurban <strong>and</strong> rural areas) (He Y et al. 2007).The apparent discrepancy between <strong>the</strong> stable ordecreas<strong>in</strong>g concentrations measured <strong>in</strong> urban areas <strong>and</strong><strong>the</strong> sharply <strong>in</strong>creas<strong>in</strong>g emission trends <strong>and</strong> remote-sens<strong>in</strong>g(satellite-based) measurements is likely related to large<strong>in</strong>creases <strong>in</strong> NO x concentrations throughout <strong>the</strong> YangtzeRiver Delta (27% per year for 2000–2005) <strong>and</strong> <strong>in</strong> ruralareas <strong>of</strong> eastern Ch<strong>in</strong>a (18% per year), beg<strong>in</strong>n<strong>in</strong>g <strong>in</strong> 2000(He Y et al. 2007). These areas are less likely than urban52
HEI International Scientific Oversight CommitteeSidebar 8. AIR QUALITY TRENDS IN BANGKOK, THAILAND, A METROPOLITAN AREAOF DEVELOPING ASIATrends <strong>in</strong> annual gasol<strong>in</strong>e <strong>and</strong> diesel fuel consumption (for1992–2005) with<strong>in</strong> Bangkok, <strong>the</strong> Bangkok metropolitan region,<strong>and</strong> Thail<strong>and</strong> overall are shown <strong>in</strong> Figure 8.1. Increases <strong>in</strong><strong>the</strong> consumption <strong>of</strong> fuel results <strong>in</strong> <strong>in</strong>creased emissions <strong>of</strong> SO 2 ,CO, <strong>and</strong> NO x <strong>and</strong> should subsequently result <strong>in</strong> <strong>in</strong>creased ambientconcentrations <strong>of</strong> <strong>the</strong>se pollutant species. In <strong>the</strong> case <strong>of</strong><strong>the</strong> Bangkok’s air quality, however, it is apparent that <strong>the</strong>seambient concentrations have been partially mitigated by <strong>the</strong>emission-control strategies implemented <strong>in</strong> <strong>the</strong> city over <strong>the</strong>past decade. Ambient concentrations <strong>of</strong> CO <strong>and</strong> NO 2(Figure 8.2) <strong>and</strong> <strong>of</strong> SO 2 <strong>and</strong> PM 10 (not shown) measured bytraffic <strong>and</strong> roadside monitors <strong>in</strong> Bangkok suggest a trend <strong>of</strong> reducedemissions, with dist<strong>in</strong>ct downward trends <strong>in</strong> annual ambientconcentrations <strong>of</strong> CO <strong>and</strong> SO 2 <strong>and</strong> smaller reductions <strong>in</strong>annual NO 2 <strong>and</strong> PM 10 concentrations.The emission controls <strong>in</strong> use <strong>in</strong> Bangkok <strong>in</strong>clude (1) <strong>the</strong> <strong>in</strong>stallation<strong>of</strong> catalytic converters on all cars after 1993, result<strong>in</strong>gfrom <strong>the</strong> adoption <strong>of</strong> vehicle-emissions st<strong>and</strong>ards; (2) <strong>in</strong>centivesto shift from two-stroke to four-stroke eng<strong>in</strong>es; (3) roadside<strong>in</strong>spection <strong>of</strong> vehicles visibly emitt<strong>in</strong>g gross amounts <strong>of</strong>exhaust; (4) establishment <strong>of</strong> a rout<strong>in</strong>e <strong>in</strong>spection <strong>and</strong> ma<strong>in</strong>tenanceprogramsCont<strong>in</strong>ued on next pageFigure 8.1. Annual gasol<strong>in</strong>e <strong>and</strong> diesel fuel consumption <strong>in</strong> Bangkok, <strong>the</strong> Bangkok metropolitan region, <strong>and</strong> Thail<strong>and</strong>, 1992–2005. [Repr<strong>in</strong>ted from<strong>Asia</strong>n Development Bank <strong>and</strong> CAI-<strong>Asia</strong> 2006b, with permission from CAI-<strong>Asia</strong>.]areas to have data on <strong>the</strong> impact <strong>of</strong> <strong>the</strong>se emissions on airquality. Also contribut<strong>in</strong>g to this discrepancy may be emissionestimates that (1) do not adequately consider recentchanges <strong>in</strong> emission factors associated with urban airquality, regulations <strong>and</strong> management programs, <strong>and</strong>improved technology, or (2) are regional or national ra<strong>the</strong>rthan city-specific <strong>and</strong> <strong>the</strong>refore do not capture city-levelmanagement efforts, or (3) emissions that occur above <strong>the</strong>atmospheric layer <strong>in</strong> which pollutant mix<strong>in</strong>g occurs. Fur<strong>the</strong>rmore,Figure 25 presents data aggregated across major<strong>Asia</strong>n cities, whereas <strong>the</strong> <strong>in</strong>crease <strong>in</strong> NO x emissions isdom<strong>in</strong>ated by <strong>in</strong>creases <strong>in</strong> Ch<strong>in</strong>a specifically. F<strong>in</strong>e PM(PM 2.5 ) concentrations <strong>in</strong> cities, if measured (as <strong>the</strong>y havebeen only recently <strong>in</strong> select <strong>Asia</strong>n cities), would also beexpected to show a downward trend, reflect<strong>in</strong>g <strong>the</strong> lowerambient SO 2 concentrations <strong>in</strong> many urban areas <strong>and</strong>reduced secondary, f<strong>in</strong>e-particle SO 42 production.To better underst<strong>and</strong> <strong>the</strong>se trends <strong>and</strong> <strong>the</strong> air quality challenge<strong>Asia</strong>n cities face <strong>in</strong> light <strong>of</strong> <strong>in</strong>creas<strong>in</strong>g populations,energy consumption, <strong>and</strong> vehicle numbers <strong>and</strong> vehicle-milestraveled, Sidebar 8 presents a case study <strong>of</strong> air quality trends<strong>in</strong> Bangkok — one <strong>of</strong> <strong>the</strong> <strong>Asia</strong>n cities considered <strong>in</strong> <strong>the</strong> aggregatetrends <strong>in</strong> Figure 25. This case contrasts with trends <strong>in</strong>concentrations <strong>of</strong> photochemical oxidants <strong>and</strong> oxidant precursors<strong>in</strong> Tokyo, which is discussed <strong>in</strong> Sidebar 9. In Tokyo,Japanese emission controls have resulted <strong>in</strong> reduced oxidant-precursorconcentrations over several decades, withsubsequent reductions <strong>in</strong> oxidant concentrations, but <strong>in</strong>recent years oxidant concentrations have begun to <strong>in</strong>creasewhile precursor concentrations cont<strong>in</strong>ue to fall. This shiftmay be expla<strong>in</strong>ed by cont<strong>in</strong>ually <strong>in</strong>creas<strong>in</strong>g concentrations<strong>of</strong> oxidants (correspond<strong>in</strong>g to <strong>in</strong>creased emissions) <strong>in</strong> <strong>the</strong>region <strong>and</strong> <strong>in</strong>creas<strong>in</strong>g concentrations <strong>of</strong> transported oxidantsfrom neighbor<strong>in</strong>g countries upw<strong>in</strong>d.53
<strong>Outdoor</strong> <strong>Air</strong> <strong>Pollution</strong> <strong>and</strong> <strong>Health</strong> <strong>in</strong> <strong>the</strong> Develop<strong>in</strong>g <strong>Countries</strong> <strong>of</strong> <strong>Asia</strong>Sidebar 8: AIR QUALITY TRENDS IN BANGKOK (Cont<strong>in</strong>ued)for all registered vehicles; (5) <strong>in</strong>troduction <strong>of</strong> natural gas as analternative fuel for <strong>the</strong> transport sector <strong>in</strong> 2003; (6) removal <strong>of</strong>lead from gasol<strong>in</strong>e <strong>and</strong> reduction <strong>of</strong> <strong>the</strong> sulfur content <strong>of</strong> dieselfuel from 1.0% to 0.5% by weight <strong>in</strong> 1996; <strong>and</strong> (7) a cap on <strong>the</strong>sulfur content <strong>of</strong> fuel oil numbers 1 <strong>and</strong> 2, such that it cannotexceed 2% by weight.The reduction <strong>in</strong> CO concentrations measured by roadsidemonitors after 1993 (Figure 8.2), when catalytic converterswere <strong>in</strong>troduced, <strong>and</strong> <strong>the</strong> reduction <strong>in</strong> SO 2 concentrationsafter 1996, when sulfur content <strong>of</strong> diesel fuel was reduced,are both apparent <strong>in</strong> <strong>the</strong> trend data. The small downwardtrends <strong>in</strong> roadside NO x <strong>and</strong> PM 10 concentrations may also beassociated with <strong>the</strong> <strong>in</strong>troduction <strong>of</strong> catalytic converters <strong>and</strong>lower-sulfur diesel as well as <strong>the</strong> shift from two-stroke to fourstrokeeng<strong>in</strong>es. But <strong>the</strong>se trends are not much more pronouncedthan <strong>the</strong> <strong>in</strong>terannual variability <strong>in</strong> <strong>the</strong> data, <strong>and</strong> <strong>the</strong>trend for PM 10 is more affected by regional contributions thanlocal contributions <strong>and</strong> does not vary significantly with <strong>the</strong> contributionfrom roadside emissions. Several more years <strong>of</strong> datawill be needed to detect a statistically significant trend. It isalso worth not<strong>in</strong>g that <strong>the</strong> dip <strong>in</strong> fuel consumption <strong>in</strong> Bangkok<strong>in</strong> 1998 (Figure 8.1) has been associated with <strong>the</strong> <strong>Asia</strong>n economiccrisis <strong>and</strong> also reflects a major reduction <strong>in</strong> new-vehicleregistrations <strong>in</strong> Bangkok <strong>in</strong> that year.Figure 8.2. Annual CO <strong>and</strong> NO 2 concentrations measured by roadside <strong>and</strong> urban ambient monitors <strong>in</strong> Bangkok. Note <strong>the</strong> difference <strong>in</strong> <strong>the</strong> range<strong>of</strong> years on <strong>the</strong> x axes. [Repr<strong>in</strong>ted from <strong>Asia</strong>n Development Bank <strong>and</strong> CAI-<strong>Asia</strong> 2006b, with permission from CAI-<strong>Asia</strong>.]54
HEI International Scientific Oversight CommitteeSidebar 9. PHOTOCHEMICAL OXIDANTS IN JAPANThe mitigation <strong>of</strong> photochemical oxidants, O 3 <strong>in</strong> particular,rema<strong>in</strong>s a challenge to major metropolitan areas around <strong>the</strong>world. From 1970–1990, Tokyo reduced ambient oxidant concentrationsby nearly 50% through <strong>the</strong> implementation <strong>of</strong> aggressiveemission controls on <strong>the</strong> oxidant precursors VOCs <strong>and</strong> NO x(Figure 9.1). But reductions lessened after 1990, result<strong>in</strong>g <strong>in</strong> an<strong>in</strong>crease <strong>in</strong> <strong>the</strong> O 3 concentration <strong>in</strong> 2003 by approximately 40%over <strong>the</strong> 1989 annual mean low <strong>of</strong> 0.018 ppm.Figure 9.2 shows <strong>the</strong> annual oxidant data for Tokyo <strong>in</strong> terms <strong>of</strong><strong>the</strong> number <strong>of</strong> hours <strong>in</strong> which <strong>the</strong> concentrations exceeded <strong>the</strong>air quality st<strong>and</strong>ard. These data show <strong>the</strong> reversal <strong>in</strong> <strong>the</strong> downwardtrend <strong>in</strong> oxidant concentrations, beg<strong>in</strong>n<strong>in</strong>g around 1989.They also show a significant <strong>and</strong> unprecedented <strong>in</strong>creases<strong>in</strong>ce 2000 <strong>in</strong> <strong>the</strong> number <strong>of</strong> hours <strong>in</strong> which oxidant concentrationsexceed 0.12 ppmV, suggest<strong>in</strong>g that, on average, oxidantepisodes are more severe than <strong>in</strong> <strong>the</strong> past 30 years.There are at least two possible explanations for <strong>the</strong> reversal<strong>in</strong> <strong>the</strong> oxidant trend observed <strong>in</strong> metropolitan Tokyo. The firstrelates to changes <strong>in</strong> <strong>the</strong> ambient VOC/NO x ratio <strong>in</strong> Tokyo,which has decreased from about 14:1 <strong>in</strong> <strong>the</strong> mid-1970s toabout 6.5:1 <strong>in</strong> <strong>the</strong> past decade. The chang<strong>in</strong>g ratios move <strong>the</strong>oxidant-control environment from a VOC-limited regime (<strong>in</strong> <strong>the</strong>1970s–1980s) to a NO x -limited regime (from <strong>the</strong> 1990s–present). The changes <strong>in</strong> <strong>the</strong> VOC/NO x ratio can affect <strong>the</strong>production <strong>of</strong> photochemical oxidants <strong>and</strong> <strong>the</strong> efficiency <strong>of</strong>precursor-control strategies, which <strong>in</strong> turn can alter <strong>the</strong> spatialdistribution <strong>of</strong> oxidants with<strong>in</strong> <strong>the</strong> metropolitan area. LowerVOC/NO x ratios typically delay oxidant formation, result<strong>in</strong>g <strong>in</strong>concentrations peak<strong>in</strong>g at far<strong>the</strong>r distances from <strong>the</strong> urbanemission sources. This explanation for <strong>in</strong>creas<strong>in</strong>g oxidant concentrations<strong>in</strong> Tokyo is conceivable but unlikely, becausedecreas<strong>in</strong>g concentrations <strong>of</strong> both precursor componentswould most likely result <strong>in</strong> a net decrease <strong>in</strong> oxidant concentrationswhen averaged over space <strong>and</strong> time.The second possible explanation relates to potential oxidant<strong>in</strong>creases over <strong>the</strong> past decade <strong>in</strong> <strong>the</strong> air that flows <strong>in</strong>to <strong>the</strong>Tokyo metropolitan area from o<strong>the</strong>r regions. The rapidlygrow<strong>in</strong>g economies <strong>in</strong> <strong>the</strong> regions surround<strong>in</strong>g Tokyo haveresulted <strong>in</strong> significant <strong>in</strong>creases <strong>in</strong> precursor emissions thathave likely <strong>in</strong>creased oxidant concentrations <strong>in</strong> those regions(see Trends <strong>in</strong> Energy Use <strong>and</strong> Projected Growth <strong>in</strong> Major Po<strong>in</strong>tSources <strong>and</strong> Emissions <strong>in</strong> Section II for discussion <strong>of</strong> trends <strong>in</strong>NO x <strong>and</strong> NMVOC emissions). Those higher oxidant concentrationshave most likely resulted <strong>in</strong> higher background concentrations<strong>and</strong> <strong>the</strong>refore enhanced <strong>in</strong>terregional transport <strong>of</strong>oxidants <strong>in</strong>to <strong>the</strong> Tokyo area. For ano<strong>the</strong>r example, based onsatellite observations, NO 2 concentrations <strong>in</strong> Ch<strong>in</strong>a have been<strong>in</strong>creas<strong>in</strong>g significantly <strong>in</strong> <strong>the</strong> past decade as well (Figure 9.3;van der A et al. 2006).Cont<strong>in</strong>ued on next pageFigure 9.1. Annual average concentrations <strong>of</strong> oxidants <strong>and</strong> <strong>the</strong>ir precursors <strong>in</strong> Tokyo, 1970–2003. Data are <strong>the</strong> averages <strong>of</strong> measurements at 23 stations.[Adapted from <strong>the</strong> Report <strong>of</strong> <strong>the</strong> Committee on Photochemical Oxidant Control, Tokyo Metropolitan Government 2007.]55
<strong>Outdoor</strong> <strong>Air</strong> <strong>Pollution</strong> <strong>and</strong> <strong>Health</strong> <strong>in</strong> <strong>the</strong> Develop<strong>in</strong>g <strong>Countries</strong> <strong>of</strong> <strong>Asia</strong>Sidebar 9. PHOTOCHEMICAL OXIDANTS IN JAPAN (Cont<strong>in</strong>ued)Figure 9.2. Annual numbers <strong>of</strong> hours <strong>in</strong> which oxidant concentrations [<strong>in</strong> parts per million by volume] <strong>in</strong> Tokyo exceeded <strong>the</strong> air quality st<strong>and</strong>ard.[Adapted from <strong>the</strong> Report <strong>of</strong> <strong>the</strong> Committee on Photochemical Oxidant Control, Tokyo Metropolitan Government 2007.]Figure 9.3. Trend <strong>in</strong> annual tropospheric NO 2 concentrations, 1996–2005. Data are derived from observations recorded by GOME <strong>and</strong> SCIAMACHYsatellites. Light gray areas are those for which no significant trend was found, <strong>and</strong> dark gray areas are those for which not enough observationswere available to construct a time series. [Repr<strong>in</strong>ted from van der A et al. 2006 with permission from American Geophysical Union.]56
HEI International Scientific Oversight CommitteeCurrent Capabilities <strong>and</strong> Coverage <strong>of</strong> <strong>Air</strong> QualityMonitor<strong>in</strong>g <strong>Air</strong> quality monitor<strong>in</strong>g capabilities acrossmajor <strong>Asia</strong>n urban centers have improved dramaticallyover <strong>the</strong> past decade. The deployment <strong>of</strong> air quality networkshas improved both <strong>in</strong> terms <strong>of</strong> <strong>the</strong> <strong>in</strong>strumentationtechnologies used <strong>and</strong> <strong>the</strong> proportion <strong>of</strong> <strong>the</strong> populationliv<strong>in</strong>g <strong>in</strong> areas with monitor<strong>in</strong>g networks. In addition,many develop<strong>in</strong>g countries have <strong>in</strong>troduced sophisticatedmeasurement networks through collaborations <strong>and</strong> partner<strong>in</strong>garrangements with developed countries. Table 7summarizes <strong>the</strong> key features <strong>of</strong> <strong>the</strong> monitor<strong>in</strong>g networks <strong>in</strong>select <strong>Asia</strong>n cities: <strong>the</strong> number <strong>of</strong> monitor<strong>in</strong>g stationswith<strong>in</strong> <strong>the</strong> city centers, <strong>the</strong> key pollutants measured, <strong>the</strong>proximity <strong>of</strong> monitors to local sources (e.g., with<strong>in</strong> traffic,at <strong>the</strong> roadside, or at <strong>in</strong>dustrial sites), an estimate <strong>of</strong> <strong>the</strong>overall city population <strong>and</strong> population coverage by <strong>the</strong>monitor<strong>in</strong>g site, <strong>the</strong> sampl<strong>in</strong>g frequency <strong>and</strong> averag<strong>in</strong>g time(<strong>the</strong> period over which pollution concentrations are averaged<strong>in</strong> an analysis) used for <strong>the</strong> measurements, <strong>and</strong> Websites that provide access to metadata or measurements.Modeled Estimated Pollutant Concentrations <strong>and</strong>Projected Trends <strong>in</strong> EmissionsAs discussed <strong>in</strong> <strong>the</strong> previous section, ambient concentrations<strong>of</strong> pollutants are typically measured through a network<strong>of</strong> fixed monitor<strong>in</strong>g stations. The cost <strong>of</strong> ma<strong>in</strong>ta<strong>in</strong><strong>in</strong>gsuch a network, <strong>in</strong>clud<strong>in</strong>g expenses related to ma<strong>in</strong>ta<strong>in</strong><strong>in</strong>g<strong>the</strong> technical capacity to use <strong>in</strong>formation generated fromsuch networks, has limited <strong>the</strong> number <strong>of</strong> monitors <strong>and</strong>monitor<strong>in</strong>g networks. The number <strong>of</strong> monitor<strong>in</strong>g stationshas grown rapidly <strong>in</strong> <strong>the</strong> past few years, but most urbanareas <strong>in</strong> <strong>Asia</strong> still lack adequate numbers <strong>of</strong> stations. Fur<strong>the</strong>rmore,<strong>the</strong> limited monitor<strong>in</strong>g data are <strong>of</strong>ten not publiclyavailable or accessible for use <strong>in</strong> a systematicexam<strong>in</strong>ation <strong>of</strong> pollutant concentrations across cities orover time. For <strong>in</strong>stance, <strong>the</strong> Global Burden <strong>of</strong> Disease ComparativeRisk Assessment study conducted by WHO(Cohen et al. 2004) reported on 304 cities worldwide withmonitored data for TSP or PM 10 , with only 32 <strong>of</strong> <strong>the</strong>secities <strong>in</strong> <strong>Asia</strong>.For purposes <strong>of</strong> exam<strong>in</strong><strong>in</strong>g temporal trends <strong>in</strong> ambientconcentrations <strong>in</strong> <strong>Asia</strong>, we used results from <strong>the</strong> GMAPs.This model was used <strong>in</strong> 2002 to estimate <strong>the</strong> global burden<strong>of</strong> disease from outdoor urban air pollution.GMAPs is a fixed-effects model designed to predict PM 10concentrations <strong>in</strong> residential areas <strong>of</strong> world cities with populationsover 100,000, by determ<strong>in</strong><strong>in</strong>g <strong>the</strong> relation betweenemissions <strong>and</strong> ambient concentrations. It is specificallybased on <strong>the</strong> relation between monitored PM concentrationsat fixed locations <strong>and</strong> national <strong>and</strong> local factorsaffect<strong>in</strong>g ambient pollution dur<strong>in</strong>g <strong>the</strong> 1985–1999 period.The national factors represented are per capita <strong>in</strong>come,total energy consumption, <strong>the</strong> fuel mix <strong>in</strong> use, <strong>the</strong> amounts<strong>of</strong> fuels used for transportation, <strong>and</strong> a composite factor<strong>in</strong>clud<strong>in</strong>g fuel types, total population, <strong>and</strong> populationdensity. c The local factors represented are <strong>the</strong> overall citypopulation, <strong>the</strong> city population density, <strong>and</strong> a suite <strong>of</strong> 18variables reflect<strong>in</strong>g geographic <strong>and</strong> long-term climaticcharacteristics <strong>and</strong> <strong>the</strong> location <strong>of</strong> <strong>the</strong> monitor<strong>in</strong>g sites. dThe GMAPs expla<strong>in</strong>s 88% <strong>of</strong> <strong>the</strong> observed variation <strong>in</strong>PM 10 concentrations <strong>in</strong> <strong>the</strong> 304 cities with monitor<strong>in</strong>gdata, <strong>in</strong>clud<strong>in</strong>g <strong>the</strong> 32 cities <strong>in</strong> <strong>Asia</strong>. The correlation coefficient(r) between model predictions <strong>and</strong> actual monitor<strong>in</strong>gdata for PM 10 <strong>in</strong> <strong>Asia</strong>n cities was 0.82, based on 95estimates from 15 cities <strong>in</strong> South, Sou<strong>the</strong>ast, <strong>and</strong> East <strong>Asia</strong><strong>and</strong> <strong>the</strong> Western Pacific (exclud<strong>in</strong>g Australia <strong>and</strong> NewZeal<strong>and</strong>). The correlation for TSP was 0.84, based on 213estimates <strong>in</strong> 26 cities. The model estimates <strong>in</strong>dicate thathigher energy consumption <strong>and</strong> greater reliance on dirtierfuels such as coal <strong>and</strong> biomass result <strong>in</strong> higher PM concentrations.On <strong>the</strong> o<strong>the</strong>r h<strong>and</strong>, as countries have grownricher, <strong>the</strong>y have successfully put <strong>in</strong> place polices <strong>and</strong> regulatoryregimens to reduce ambient PM concentrations fora given level <strong>of</strong> combustion activity — such as str<strong>in</strong>gentst<strong>and</strong>ards for diesel <strong>in</strong> India, <strong>the</strong> phas<strong>in</strong>g out <strong>of</strong> vehiclesthat are old or require dirty fuel <strong>in</strong> Bangkok (Sidebar 8),<strong>and</strong> mov<strong>in</strong>g <strong>in</strong>dustrial sites away from population centers<strong>in</strong> Katm<strong>and</strong>u (CAI-<strong>Asia</strong> Center 2006b). The model resultsalso <strong>in</strong>dicate decl<strong>in</strong>es <strong>in</strong> PM concentrations <strong>of</strong> between 1%<strong>and</strong> 3.5% per year over <strong>and</strong> above those that can be directlyattributable to combustion sources or to historical improvements<strong>in</strong> policies as <strong>in</strong>come levels rose, suggest<strong>in</strong>g thatcountries are more proactive <strong>in</strong> manag<strong>in</strong>g air pollution than<strong>in</strong> <strong>the</strong> past. This unexpla<strong>in</strong>ed decl<strong>in</strong>e <strong>in</strong> PM concentrationsc The national variables <strong>in</strong> <strong>the</strong> GMAPs <strong>in</strong>clude per capita consumption <strong>of</strong>coal, oil, natural gas, nuclear power, hydroelectric power, <strong>and</strong> combustiblerenewables <strong>and</strong> wastes to account for total energy consumption <strong>and</strong> <strong>the</strong> fuelmix; rates <strong>of</strong> emissions from various sources; economic activity; <strong>and</strong> <strong>in</strong>tensity<strong>of</strong> fuel use. All <strong>the</strong>se national variables are compared across countries.National factors also <strong>in</strong>clude per capita gasol<strong>in</strong>e <strong>and</strong> diesel use <strong>in</strong> <strong>the</strong> transportsector, an important source <strong>of</strong> particle emissions.d Local variables <strong>in</strong>clude: <strong>the</strong> annual averages (<strong>and</strong> st<strong>and</strong>ard deviations,represent<strong>in</strong>g seasonal changes) <strong>of</strong> monthly mean temperatures, diurnaltemperatures, precipitation, barometric pressure, w<strong>in</strong>d speed, percentcloud cover, <strong>and</strong> frequencies <strong>of</strong> wet days, sunny days <strong>and</strong> frosty days. Theclimatic variables were constructed from a global mean monthly climatologymap with a resolution <strong>of</strong> 0.5 0.5 latitude <strong>and</strong> longitude, developedby researchers at <strong>the</strong> Climate Research Unit <strong>of</strong> <strong>the</strong> University <strong>of</strong> East Anglia(New et al. 1999). For each city, all <strong>the</strong> climate variables were based onestimated conditions at <strong>the</strong> city center. In addition, two meteorologic variablesrelated to energy dem<strong>and</strong> — heat<strong>in</strong>g <strong>and</strong> cool<strong>in</strong>g degree-days (<strong>in</strong>Fahrenheit) — were estimated from <strong>the</strong> mean monthly temperature foreach city. Elevation <strong>and</strong> distance from <strong>the</strong> coast were <strong>in</strong>cluded to considertopographic factors related to atmospheric dispersion <strong>and</strong> transport <strong>of</strong> pollutants.The model also <strong>in</strong>cluded a measure <strong>of</strong> <strong>the</strong> local population density,calculated on <strong>the</strong> basis <strong>of</strong> population grids from a map <strong>of</strong> <strong>the</strong> world population(Center for International Earth Science Information Network 2004).57
<strong>Outdoor</strong> <strong>Air</strong> <strong>Pollution</strong> <strong>and</strong> <strong>Health</strong> <strong>in</strong> <strong>the</strong> Develop<strong>in</strong>g <strong>Countries</strong> <strong>of</strong> <strong>Asia</strong>Table 7. Summary <strong>of</strong> Monitor<strong>in</strong>g Systems <strong>in</strong> Selected <strong>Asia</strong>n Cities aCity <strong>and</strong>CountryStations(n)PollutantsMeasured bSiteCharacteristicsTotal Population(millions) <strong>and</strong>Population Density(persons per km 2 )Sampl<strong>in</strong>gFrequency <strong>and</strong>Averag<strong>in</strong>g TimeRelevantWeb Site cBangkok,Thail<strong>and</strong>Beij<strong>in</strong>g,Ch<strong>in</strong>aDhaka,BangladeshHanoi,VietnamHo Chi M<strong>in</strong>hCity,VietnamHong Kong,Ch<strong>in</strong>aMumbai,India17 CO, NO, NO x ,NO 2 , SO 2 ,O 3 , PM 1027 CO, NO 2 , SO 2 ,O 3 , TSP,PM 10 , lead1 CO, NO, NO x ,SO 2 , O 3 ,PM 10 , PM 2.57 CO, NO, NO x ,SO 2 , O 3 ,TSP, PM 109 CO, NO, NO x ,SO 2 , O 3 ,TSP, PM 1014 CO, NO, NO x ,NO 2 , SO 2 , O 3 ,TSP, PM 10 ,lead3 NO 2 , SO 2 ,SPM,RSP/PM 10 ,hydrogensulfide,ammoniaDelhi, India 10 NO 2 , SO 2 ,SPM,RSP/PM 10Seoul, SouthKoreaShanghai,Ch<strong>in</strong>a13 Urban,4 <strong>in</strong> traffic,<strong>and</strong> 13 withmeteorology14 Urban <strong>and</strong>13 o<strong>the</strong>r sites1 at citycenter5 Urban,2 <strong>in</strong> traffic,<strong>and</strong> 1 withmeteorology5 Urban,4 <strong>in</strong> traffic,1 withmeteorology11 Urban,3 <strong>in</strong> traffic,<strong>and</strong> 14 withmeteorology2 Residential<strong>and</strong>1 <strong>in</strong>dustrial11 Total,divided <strong>in</strong>toresidential,<strong>in</strong>dustrial,<strong>and</strong> trafficlevel27 CO, NO x , SO 2 ,O 3 , PM 10 ,dust, lead44 CO, NO x , SO 2 , 21 AutomatedO 3 , TSP, PM 10 , stationsdust, leadTaipei,Ch<strong>in</strong>a 8 CO, NO 2 , SO 2 ,O 3 , PM 10Wuhan,Ch<strong>in</strong>a7 NO 2 , SO 2 ,PM 105 Automatedstations7 Automatedstations(4 urban <strong>and</strong>3 regional<strong>in</strong>dustrial)5.6~ 370010.9~ 65012~ 40,0004.0~ 44004.85~ 23007.0~630017.3~ 39,80014.2~ 96009.7~ 16,00012.8~ 20002.5~ 92009.7~ 947Cont<strong>in</strong>uous 1-hr average gaseouspollutants <strong>and</strong> PM 10Cont<strong>in</strong>uous 1-hr average gaseouspollutants <strong>and</strong> PM 10 , 24-hraverage TSP <strong>and</strong> lead sampledevery 6th dayCont<strong>in</strong>uous 1-hr average gaseouspollutants <strong>and</strong> 24-hr average PMsampled every 3rd <strong>and</strong> every6th dayCont<strong>in</strong>uous 1-hr average gaseouspollutants <strong>and</strong> 24-hr average PMsampled every 3rd <strong>and</strong> every6th dayCont<strong>in</strong>uous 1-hr average gaseouspollutants <strong>and</strong> 24-hr average PMsampled every 3rd <strong>and</strong> every6th dayCont<strong>in</strong>uous 1-hr average gaseouspollutants <strong>and</strong> RSP (PM 10 ), 24-hraverage TSP sampled every 3rd<strong>and</strong> every 6th day24-hr average concentrationssampled twice per week(104 samples/year)4-hr average gaseous pollutantsover 24 hr, <strong>and</strong> 8-hr average PMsampled twice per week(104 samples/year)Cont<strong>in</strong>uous 1-hr average gaseouspollutants <strong>and</strong> PM 10Cont<strong>in</strong>uous 1-hr average gaseouspollutants <strong>and</strong> PM 10 <strong>and</strong>24-hr average gaseous pollutants<strong>and</strong> PM 10 (except O 3 , for which8-hr averag<strong>in</strong>g was performed[10AM–6PM])Cont<strong>in</strong>uous 1-hr average gaseouspollutants <strong>and</strong> PM 10Cont<strong>in</strong>uous 1-hr average gaseouspollutants <strong>and</strong> PM 10www.aqnis.pcd.go.th/station/allstation.htmwww.pcd.go.thwww.bjepb.gov.cnwww.doe-bd.orgwww.cleanairnet.org/caiasia/1412/csr/vietnam.pdfwww.hepa.gov.vnwww.epd-asg.gov.hkwww.cpcb.nic.<strong>in</strong>/<strong>Air</strong>/monitor<strong>in</strong>gNetwork.htmlwww.cpcb.nic.<strong>in</strong>/<strong>Air</strong>/monitor<strong>in</strong>gNetwork.htmlwww.cpcb.nic.<strong>in</strong>/<strong>Air</strong>/air_quality_<strong>of</strong>_delhi.htmlwww.cleanairnet.org/caiasia/1412/article-58984.htmlwww.sepb.gov.cn/english/ma<strong>in</strong>.jspwww.epa.gov.tw/en/www.whepb.gov.cn/CMSWEB/default.aspxa Data compiled from CAI-<strong>Asia</strong> 2006b, Schwela et al. 2006, <strong>and</strong> <strong>the</strong> Web sites listed.b Not all pollutants are measured at all stations <strong>in</strong> <strong>the</strong> city. In addition, some sites report total hydrocarbons/VOCs, methane, non-methane hydrocarbons,<strong>and</strong> selected air toxics. All stations typically report meteorologic parameters: w<strong>in</strong>d speed <strong>and</strong> direction, temperature, relative humidity, barometricpressure, <strong>and</strong> solar radiation.c All Web sites were accessed <strong>in</strong> January 2008.58
HEI International Scientific Oversight Committeeis <strong>of</strong> greater magnitude <strong>in</strong> poorer countries (a 3.5% decl<strong>in</strong>eat per capita <strong>in</strong>comes <strong>of</strong> U.S. $300, vs. a 1% decl<strong>in</strong>e at percapita <strong>in</strong>comes <strong>of</strong> U.S. $10,000).The GMAPs can be used to predict PM concentrations <strong>in</strong>a city on <strong>the</strong> basis <strong>of</strong> economic activity, energy efficiency,emission factors, <strong>and</strong> city-specific, time-<strong>in</strong>variant geoclimaticfactors. The predictions assume that cities located <strong>in</strong>similar climatic <strong>and</strong> geographic environments would havesimilar PM concentrations for any given level <strong>of</strong> economic<strong>and</strong> combustion activity. The model can also be used topredict changes <strong>in</strong> PM concentrations for cities on <strong>the</strong>basis <strong>of</strong> changes <strong>in</strong> <strong>the</strong> city population <strong>and</strong> <strong>in</strong> national<strong>in</strong>come, energy consumption, fuel mix, <strong>and</strong> a time trendspecific to national <strong>in</strong>come level. Model estimates for acity for a given year are based on <strong>the</strong> impact <strong>of</strong> <strong>the</strong> geoclimaticfactors <strong>and</strong> <strong>the</strong> observed variations <strong>in</strong> <strong>the</strong> timevary<strong>in</strong>gcountry-level variables. S<strong>in</strong>ce <strong>the</strong> model accountsfor differences <strong>in</strong> economic activity with<strong>in</strong> a country <strong>in</strong> alimited manner, <strong>the</strong> estimates for cities with monitor<strong>in</strong>gdata are improved by adjust<strong>in</strong>g <strong>the</strong> PM 10 estimates by <strong>the</strong>average residual between monitored data <strong>and</strong> predicteddata. The GMAPs estimates that are provided <strong>in</strong> this report,however, are based on <strong>in</strong>put data <strong>and</strong> measurement datathat have not been updated beyond 2000. Accord<strong>in</strong>gly, <strong>the</strong>estimates for <strong>the</strong> more recent years may <strong>in</strong>clude greaterlevels <strong>of</strong> uncerta<strong>in</strong>ty. There is considerable uncerta<strong>in</strong>tyaround <strong>the</strong> estimates <strong>in</strong> general, especially for countrieswith no or limited monitor<strong>in</strong>g data; never<strong>the</strong>less, <strong>the</strong>GMAPs results can be a useful first estimate, especially forcountries without monitor<strong>in</strong>g networks.Figure 28 shows <strong>the</strong> time trend <strong>in</strong> <strong>the</strong> city population–weighted average PM 10 concentrations for various regions<strong>in</strong> <strong>Asia</strong>, based on predictions from <strong>the</strong> GMAPs. Overall,<strong>the</strong> average concentrations <strong>in</strong> Ch<strong>in</strong>a, India, <strong>and</strong> O<strong>the</strong>rSou<strong>the</strong>ast <strong>Asia</strong> are more than double those <strong>in</strong> High-Income<strong>Asia</strong>. The average concentration <strong>in</strong> O<strong>the</strong>r South <strong>Asia</strong> isnearly twice those <strong>in</strong> Ch<strong>in</strong>a, India, <strong>and</strong> O<strong>the</strong>r Sou<strong>the</strong>ast<strong>Asia</strong>. Overall, PM 10 concentrations have been decl<strong>in</strong><strong>in</strong>g <strong>in</strong>all regions <strong>in</strong> <strong>Asia</strong>, despite <strong>in</strong>creased energy consumption.Three primary factors are likely to be driv<strong>in</strong>g this downwardtrend: <strong>in</strong>creased energy efficiency, switch<strong>in</strong>g <strong>of</strong> fuelfrom biomass <strong>and</strong> refuse toward cleaner fuels, <strong>and</strong>decl<strong>in</strong>es <strong>in</strong> emission factors associated with chang<strong>in</strong>gtechnology.The extent <strong>of</strong> <strong>the</strong> decl<strong>in</strong>e <strong>in</strong> PM 10 concentrations <strong>in</strong> <strong>Asia</strong>varies from region to region <strong>and</strong> is greatest <strong>in</strong> O<strong>the</strong>r South<strong>Asia</strong>, which had <strong>the</strong> highest <strong>in</strong>itial concentrations. A largepart <strong>of</strong> <strong>the</strong> decl<strong>in</strong>e <strong>in</strong> O<strong>the</strong>r South <strong>Asia</strong> is a direct result <strong>of</strong>Figure 28. Trends <strong>in</strong> urban ambient PM 10 concentrations <strong>in</strong> urban areas <strong>in</strong> <strong>Asia</strong>. Data are estimates from GMAPs. Regions are def<strong>in</strong>ed <strong>in</strong> Table 1. Valuesfor All <strong>Asia</strong> are weighted averages <strong>of</strong> <strong>the</strong> regions. [Data compiled from World Bank 2008.]59
<strong>Outdoor</strong> <strong>Air</strong> <strong>Pollution</strong> <strong>and</strong> <strong>Health</strong> <strong>in</strong> <strong>the</strong> Develop<strong>in</strong>g <strong>Countries</strong> <strong>of</strong> <strong>Asia</strong>steps taken by Pakistan to reduce its oil imports by promot<strong>in</strong>glocal CNG <strong>and</strong> LPG for use <strong>in</strong> <strong>the</strong> transport, agriculture,<strong>and</strong> power sectors <strong>and</strong> to make CNG <strong>the</strong> fuel <strong>of</strong> choicefor power generation.Average PM concentrations <strong>in</strong> Ch<strong>in</strong>a decl<strong>in</strong>ed graduallythroughout <strong>the</strong> 1990s, despite <strong>the</strong> steady rise <strong>in</strong> totalenergy consumption, partially as a result <strong>of</strong> changes <strong>in</strong>government policy. These changes <strong>in</strong>cluded relocat<strong>in</strong>gpollution sources away from population centers <strong>and</strong> <strong>in</strong>troduc<strong>in</strong>gmore str<strong>in</strong>gent vehicle <strong>and</strong> stationary-source emissionst<strong>and</strong>ards, such as desulfurization <strong>of</strong> power plants(NAE <strong>and</strong> NRC 2008). Exist<strong>in</strong>g policies have not been sufficientto mitigate <strong>the</strong> emissions result<strong>in</strong>g from <strong>the</strong> sharply<strong>in</strong>creas<strong>in</strong>g energy dem<strong>and</strong> s<strong>in</strong>ce 2000. As a result, population-weightedaverage PM concentrations <strong>in</strong> 2005 wereapproximately <strong>the</strong> same as those <strong>in</strong> 2000. Fur<strong>the</strong>rmore, <strong>the</strong>strategy <strong>of</strong> relocat<strong>in</strong>g sources outside <strong>of</strong> populated areas asan approach to reduce exposure may not be susta<strong>in</strong>able ifnew urban areas develop adjacent to <strong>the</strong> relocated facilities.PM concentrations have most likely been ris<strong>in</strong>g <strong>in</strong>many Ch<strong>in</strong>ese cities over <strong>the</strong> same period dur<strong>in</strong>g which<strong>the</strong>y have been fall<strong>in</strong>g <strong>in</strong> o<strong>the</strong>rs.Average PM concentrations <strong>in</strong> India have decl<strong>in</strong>ed with<strong>the</strong> decl<strong>in</strong><strong>in</strong>g share <strong>of</strong> diesel <strong>in</strong> <strong>the</strong> transport sector s<strong>in</strong>ce<strong>the</strong> early 1990s as a result <strong>of</strong> various measures taken by <strong>the</strong>government, <strong>in</strong>clud<strong>in</strong>g progressively more str<strong>in</strong>gent emissionst<strong>and</strong>ards, fuel quality improvements, <strong>and</strong> <strong>in</strong>centivesto convert transport vehicles from diesel fuel to CNG.Reduced reliance on biomass fuels has also contributedto <strong>the</strong> steady decl<strong>in</strong>e. Similarly, PM concentrations <strong>in</strong>O<strong>the</strong>r Sou<strong>the</strong>ast <strong>Asia</strong> decl<strong>in</strong>ed steadily dur<strong>in</strong>g <strong>the</strong> early1990s, leveled <strong>of</strong>f for a few years around <strong>the</strong> time <strong>of</strong> <strong>the</strong><strong>Asia</strong>n economic crisis (<strong>the</strong> late 1990s), <strong>and</strong> have s<strong>in</strong>ce cont<strong>in</strong>ued<strong>the</strong>ir downward trajectory.Overall, estimates <strong>of</strong> emissions, as well as measurements<strong>and</strong> estimates <strong>of</strong> pollutant concentrations, <strong>in</strong>dicate that airquality is improv<strong>in</strong>g throughout much <strong>of</strong> urban <strong>Asia</strong>. Theimprovement <strong>in</strong> air quality dur<strong>in</strong>g periods <strong>of</strong> dramatically<strong>in</strong>creased energy use <strong>in</strong> <strong>Asia</strong> is a testament to <strong>the</strong> impact <strong>of</strong>effective air quality management as well as improved efficiency<strong>and</strong> reduced <strong>in</strong>tensity <strong>of</strong> energy use. Climate change<strong>and</strong> <strong>the</strong> emission <strong>of</strong> GHGs present an important challenge for<strong>Asia</strong> but are also an opportunity for cont<strong>in</strong>ued improvement<strong>in</strong> air quality. Specific strategies for GHG-emission reduction,though directed toward climate change, may also havea direct impact on local <strong>and</strong> regional air quality (Sidebar 10).International fund<strong>in</strong>g for reduc<strong>in</strong>g GHG emissions mayresult <strong>in</strong> faster <strong>and</strong> larger improvements <strong>in</strong> air quality thanwould o<strong>the</strong>rwise occur <strong>in</strong> <strong>the</strong> region.Current Source-Apportionment Studies <strong>in</strong> <strong>Asia</strong>Source apportionment quantitatively relates sourceemissions to <strong>the</strong>ir impact on ambient air pollution. Themethod is useful for relat<strong>in</strong>g observed concentrations <strong>and</strong>trends <strong>in</strong> concentrations to categories <strong>of</strong> emission sources.Source apportionment can be performed with dispersionmodel<strong>in</strong>g or receptor model<strong>in</strong>g. In dispersion model<strong>in</strong>g, apollutant emission rate <strong>and</strong> meteorologic <strong>in</strong>formation areused to predict <strong>the</strong> result<strong>in</strong>g pollutant concentration at apo<strong>in</strong>t <strong>in</strong> space <strong>and</strong> time. In receptor model<strong>in</strong>g, chemicallyspeciated ambient air contam<strong>in</strong>ants measured at a particularlocation are used to identify <strong>and</strong> quantify <strong>the</strong> sourcescontribut<strong>in</strong>g to <strong>the</strong> measured pollutant concentration at thatreceptor location. Although both model<strong>in</strong>g approaches areused <strong>in</strong> source apportionment, receptor model<strong>in</strong>g is mostcommon. In <strong>Asia</strong>n cities, source apportionment based onreceptor model<strong>in</strong>g is particularly useful, s<strong>in</strong>ce it does notrequire detailed emissions <strong>in</strong>ventories, which are costly <strong>and</strong>time consum<strong>in</strong>g to conduct.Source-Apportionment Studies <strong>in</strong> <strong>Asia</strong> In this section,we summarize studies <strong>in</strong> <strong>Asia</strong>n countries, conducteds<strong>in</strong>ce 1995, that have used receptor model<strong>in</strong>g to estimatesource contributions. Although many <strong>of</strong> <strong>the</strong>se studies havea limited number <strong>of</strong> samples <strong>and</strong> should <strong>the</strong>refore be <strong>in</strong>terpretedwith caution, <strong>the</strong>y provide useful quantitative<strong>in</strong>sight <strong>in</strong>to <strong>the</strong> source makeup <strong>of</strong> air pollution <strong>in</strong> many<strong>Asia</strong>n cities. We identified <strong>the</strong> studies by search<strong>in</strong>g <strong>the</strong>peer-reviewed literature through <strong>the</strong> Web <strong>of</strong> Science,PubMed, <strong>and</strong> Google Scholar, with supplementarysearches <strong>of</strong> major air pollution journals (Table 8).60
HEI International Scientific Oversight CommitteeTable 8. Source-Apportionment Studies <strong>in</strong> <strong>Asia</strong>, 1995–2007Country/City PM Type Study Period Site Type Method a CitationBangladeshDhaka F<strong>in</strong>e, coarse 2001–2002 Semi-residential,traffic hot-spotPMF,CMBRajshahi F<strong>in</strong>e, coarse 2001–2002 Urban PMF Begum et al. 2004Begum et al. 2004, 2005,2007Ch<strong>in</strong>aHong Kong F<strong>in</strong>e 2000–2001 Urban, rural CMB Zheng M et al. 2006PM 10 PMF Lee E et al. 1999TSP PCA Fung <strong>and</strong> Wong 1995Beij<strong>in</strong>g F<strong>in</strong>e 1999–2000 Downtown,Chemical He KB et al. 2001residentialUrban, rural Duan et al. 2004F<strong>in</strong>e 2000 Urban, rural,CMB Zheng M et al. 2005roadsideF<strong>in</strong>e 2000 Urban, rural,roadsidePMF Song Y et al. 2006Kaohsiung County F<strong>in</strong>e W<strong>in</strong>ter 2003 Residential,<strong>in</strong>dustrialGausiantrajectorymodelTsai YI <strong>and</strong> Chen CL 2006IndiaDelhi F<strong>in</strong>e 2001 Residential CMB Chowdhury et al. 2007Mumbai F<strong>in</strong>e 2001 Residential CMB Chowdhury et al. 2007Kolkata F<strong>in</strong>e 2001 Residential CMB Chowdhury et al. 2007Ch<strong>and</strong>igarh F<strong>in</strong>e 2001 Residential CMB Chowdhury et al. 2007Chennai F<strong>in</strong>e, coarse 2001–2004 Urban CMB Oanh et al. 2006, 2007IndonesiaB<strong>and</strong>ung F<strong>in</strong>e, coarse 2001–2004 Urban CMB Oanh et al. 2006, 2007South KoreaSeoul TSP Urban residential,suburban,<strong>and</strong> <strong>in</strong>dustrialPCA Kim KH et al. 2006,Baek et al. 1997Gosan F<strong>in</strong>e Spr<strong>in</strong>g 2002 Background PMF Han et al. 2006Sihwa <strong>in</strong>dustrial F<strong>in</strong>e 1998–1999 Residential,CMB Park SS et al. 2001area<strong>in</strong>dustrialBusan F<strong>in</strong>e W<strong>in</strong>ter 2002 Background Chemical Kim KH et al. 2006Maldives <strong>and</strong> IndianOceanVarious backgroundsitesF<strong>in</strong>e 2001 Background Chemical Ramanathan et al. 2001Chowdhury et al. 2001Philipp<strong>in</strong>esManila F<strong>in</strong>e, coarse 2001–2004 Urban CMB Oanh et al. 2006, 2007Thail<strong>and</strong>Bangkok F<strong>in</strong>e, coarse 1995–1996 Urban, suburban PMF Chue<strong>in</strong>ta et al. 2000residentialF<strong>in</strong>e, coarse 2001–2004 Urban CMB Oanh et al. 2006, 2007VietnamHo Chi M<strong>in</strong>h City F<strong>in</strong>e, coarse 1992–1996 Urban PCA Hien et al. 1999, 2001Hanoi F<strong>in</strong>e, coarse 2001–2004 Urban CMB Oanh et al. 2006, 2007a CMB <strong>in</strong>dicates chemical mass balance; PCA <strong>in</strong>dicates pr<strong>in</strong>cipal-components analysis; PMF <strong>in</strong>dicates positive matrix factorization. Thechemical method quantifies <strong>the</strong> chemical makeup <strong>of</strong> <strong>the</strong> air pollution sources from ambient chemical elements or compounds used astracers.61
<strong>Outdoor</strong> <strong>Air</strong> <strong>Pollution</strong> <strong>and</strong> <strong>Health</strong> <strong>in</strong> <strong>the</strong> Develop<strong>in</strong>g <strong>Countries</strong> <strong>of</strong> <strong>Asia</strong>Sidebar 10. HEALTH CO-BENEFITS OF POTENTIAL ADAPTATION AND MITIGATION MEASURESFOR CLIMATE CHANGE IN ASIABACKGROUNDIn <strong>the</strong>ir 2007 report, <strong>the</strong> Intergovernmental Panel on ClimateChange concluded that “<strong>the</strong>re is high agreement <strong>and</strong> muchevidence that <strong>in</strong> all analyzed world regions near-term healthco-benefits from reduced air pollution, as a result <strong>of</strong> actions toreduce GHG emissions, can be substantial <strong>and</strong> may <strong>of</strong>fset asubstantial fraction <strong>of</strong> mitigation costs.” <strong>Health</strong> co-benefits, orancillary benefits, <strong>of</strong> GHG mitigation policies are def<strong>in</strong>ed ashealth improvements o<strong>the</strong>r than those caused directly byreductions <strong>in</strong> GHG emissions <strong>in</strong> particular that arise as a consequence<strong>of</strong> mitigation policies (Davis et al. 2000). Potentialhealth co-benefits are not limited to those from air quality mitigation;for example, <strong>the</strong> promotion <strong>of</strong> walk<strong>in</strong>g, cycl<strong>in</strong>g, <strong>and</strong>o<strong>the</strong>r active modes <strong>of</strong> transport ra<strong>the</strong>r than driv<strong>in</strong>g will likelyprevent some <strong>of</strong> <strong>the</strong> 1.9 million annual deaths associated withphysical <strong>in</strong>activity <strong>and</strong> <strong>the</strong> 1.2 million deaths due to roadtrafficaccidents. Incentives to use bi<strong>of</strong>uels could affect foodavailability <strong>and</strong> prices, <strong>in</strong> turn, could affect <strong>the</strong> 3.5 millionannual deaths from under-nutrition.The WHO <strong>and</strong> o<strong>the</strong>r agencies are beg<strong>in</strong>n<strong>in</strong>g to describe <strong>in</strong> qualitativeterms <strong>the</strong> range <strong>of</strong> l<strong>in</strong>ks between energy policies <strong>and</strong>health. Better underst<strong>and</strong><strong>in</strong>g <strong>of</strong> <strong>the</strong>se l<strong>in</strong>ks will help <strong>in</strong>formdecision makers about <strong>the</strong> potential health benefits <strong>and</strong>harms <strong>of</strong> various policies to mitigate GHG emissions. However,assessments <strong>of</strong> <strong>the</strong>se l<strong>in</strong>ks have not been systematic, havenot typically used st<strong>and</strong>ard methods developed for outdoor<strong>and</strong> <strong>in</strong>door air pollution, <strong>and</strong> have not <strong>in</strong>cluded all sectors thatcan affect health. The economic benefits (<strong>and</strong> potential costs)<strong>of</strong> <strong>the</strong> l<strong>in</strong>ks between policy <strong>and</strong> health are likely to be realizedlong before <strong>the</strong> benefits <strong>of</strong> climate change mitigation efforts.The accurate <strong>and</strong> comprehensive assessment <strong>of</strong> co-benefits a<strong>the</strong>refore a critical component <strong>of</strong> decision-mak<strong>in</strong>g about climatepolicy <strong>and</strong> lends urgency to <strong>the</strong> development <strong>of</strong> methods<strong>and</strong> research agendas to close knowledge gaps <strong>in</strong> this area.ASSOCIATIONS BETWEEN ENERGY USE AND AIR POLLUTIONMore than any o<strong>the</strong>r sector, energy production <strong>and</strong> use is associatedwith environmentally mediated, premature morbidity<strong>and</strong> mortality, primarily through exposure to harmful <strong>in</strong>door<strong>and</strong> outdoor air pollutants (Smith <strong>and</strong> Haigler 2008). TheWHO’s global Comparative Quantification <strong>of</strong> <strong>Health</strong> Risksproject estimated that approximately 2.4 million prematuredeaths <strong>in</strong> 2000 were associated with <strong>in</strong>door <strong>and</strong> outdoor particulatesfrom <strong>the</strong> combustion <strong>of</strong> fuels, <strong>in</strong>clud<strong>in</strong>g both biomass<strong>and</strong> fossil fuels (Ezzati et al. 2004). A substantial scientific literaturehas established that <strong>the</strong> greatest impacts are occurr<strong>in</strong>g<strong>in</strong> populations nearest to emission sources: people liv<strong>in</strong>g<strong>in</strong> poverty worldwide who use dirty biomass fuels for <strong>in</strong>doorcook<strong>in</strong>g <strong>and</strong> heat<strong>in</strong>g, as well as those who reside or work <strong>in</strong>close proximity to major roadways.In addition to harm from exposure to air pollution, patterns <strong>of</strong>energy use <strong>and</strong> transport may also contribute to morbidity <strong>and</strong>mortality through accidents (both occupational <strong>and</strong> non-occupational)<strong>and</strong> unhealthful changes <strong>in</strong> physical activity.Figure 10.1 portrays some <strong>of</strong> <strong>the</strong> l<strong>in</strong>ks between energy use<strong>and</strong> population health.REVIEW OF THE LITERATURE ASSESSING HEALTH CO-BENEFITS IN ASIAA number <strong>of</strong> studies have assessed <strong>the</strong> health co-benefitsaccru<strong>in</strong>g from reductions <strong>in</strong> GHGs <strong>in</strong> <strong>Asia</strong>. The most detailedstudies have come from Ch<strong>in</strong>a.Garbaccio <strong>and</strong> colleagues (2000) assessed <strong>the</strong> health co-benefitsaris<strong>in</strong>g from <strong>the</strong> hypo<strong>the</strong>tical imposition <strong>of</strong> a tax oncarbon <strong>in</strong> Ch<strong>in</strong>a. They modeled <strong>the</strong> effects <strong>of</strong> carbon taxes sufficientto achieve 5% <strong>and</strong> 10% reductions <strong>in</strong> CO 2 emissions<strong>and</strong> <strong>the</strong> consequent decrease <strong>in</strong> PM emissions. Separat<strong>in</strong>gemission sources on <strong>the</strong> basis <strong>of</strong> <strong>the</strong> height <strong>of</strong> <strong>the</strong> smokestackor tailpipe from which <strong>the</strong>y are released, <strong>the</strong> authors estimateda decl<strong>in</strong>e by 3.4% <strong>in</strong> <strong>the</strong> average urban concentration <strong>of</strong>PM 10 <strong>in</strong> <strong>the</strong> first year <strong>of</strong> a 5% reduction policy, with a result<strong>in</strong>gdrop <strong>of</strong> approximately 4.5% <strong>in</strong> <strong>the</strong> <strong>in</strong>cidence <strong>of</strong> prematuredeaths <strong>and</strong> o<strong>the</strong>r adverse health outcomes. The authors notethat <strong>in</strong>creas<strong>in</strong>g wealth <strong>of</strong> <strong>the</strong> population <strong>and</strong> differencesamong <strong>the</strong> sources <strong>of</strong> PM emissions most sensitive to <strong>the</strong>carbon taxes would result <strong>in</strong> a decl<strong>in</strong>e <strong>in</strong> <strong>the</strong> relative amount <strong>of</strong>health co-benefits over time (as modeled for 15-year <strong>and</strong> 25-year time spans).In South Korea, a U.S. EPA <strong>in</strong>itiative revealed that modestreductions <strong>in</strong> GHG emissions can have significant health benefitsthrough PM 10 reductions. A reduction <strong>of</strong> GHG emissionsby 5–15% <strong>in</strong> South Korea’s energy sector by 2020 could prevent40–120 premature deaths <strong>and</strong> 2800–8300 cases <strong>of</strong>asthma <strong>and</strong> o<strong>the</strong>r respiratory disease per year <strong>in</strong> <strong>the</strong> Seoulmetropolitan area (Joh et al. 2001).A 2004 study <strong>in</strong> Shanxi Prov<strong>in</strong>ce, Ch<strong>in</strong>a (Aunan et al. 2004),calculated <strong>the</strong> health benefits <strong>of</strong> CO 2 mitigation relat<strong>in</strong>g tocoal consumption, weigh<strong>in</strong>g <strong>the</strong> co-benefits <strong>of</strong> six mitigationoptions (coal wash<strong>in</strong>g, briquett<strong>in</strong>g, improved operations management,boiler replacement, co-generation, <strong>and</strong> modifiedboiler design) <strong>in</strong> terms <strong>of</strong> effectiveness <strong>in</strong> improv<strong>in</strong>g local airquality. Net co-benefits ranged from U.S. $1.03 billion for briquett<strong>in</strong>gto U.S. $10.3 million for co-generation. The authorsranked <strong>the</strong>se six mitigation options <strong>in</strong> terms <strong>of</strong> relative cost–benefit ratios <strong>and</strong> found that although briquett<strong>in</strong>g had <strong>the</strong>greatest marg<strong>in</strong>al costs, <strong>the</strong> net social benefits also weregreatest for this option. The authors po<strong>in</strong>ted out <strong>the</strong> relevance<strong>of</strong> co-benefit assessments for develop<strong>in</strong>g countries <strong>and</strong> <strong>the</strong>Cont<strong>in</strong>ued on next page62
HEI International Scientific Oversight CommitteeSidebar 10. CO-BENEFITS OF MITIGATION MEASURES FOR CLIMATE CHANGE IN ASIA (Cont<strong>in</strong>ued)potential for a greater awareness <strong>of</strong> co-benefits to motivatedevelop<strong>in</strong>g countries to participate <strong>in</strong> GHG mitigation programs.Chen CH <strong>and</strong> colleagues (2006a) modeled <strong>the</strong> changes <strong>in</strong> airpollution <strong>and</strong> consequent health co-benefits from caps <strong>of</strong>50 million tons <strong>and</strong> 45 million tons on coal use <strong>in</strong> Shanghai,Ch<strong>in</strong>a. The authors noted that although both caps would result<strong>in</strong> <strong>in</strong>creased emissions <strong>of</strong> PM <strong>and</strong> SO 2 by 2020, <strong>the</strong> <strong>in</strong>creaseswould be substantially less than those under <strong>the</strong> counterfactual“bus<strong>in</strong>ess-as-usual” scenario. The health impacts <strong>of</strong> <strong>the</strong>changes <strong>in</strong> air pollution were not estimated <strong>in</strong> <strong>the</strong> study.In a second study, Chen CH <strong>and</strong> colleagues (2007) modeled<strong>the</strong> health co-benefits <strong>of</strong> four energy scenarios (“bus<strong>in</strong>ess asusual,” <strong>in</strong>creased energy efficiency, use <strong>of</strong> gas <strong>in</strong>stead <strong>of</strong> coal,<strong>and</strong> generation <strong>of</strong> electricity by w<strong>in</strong>d) <strong>in</strong> 2010 <strong>and</strong> 2020 forShanghai, Ch<strong>in</strong>a. They found significant potential economicbenefits associated with decreases <strong>in</strong> PM pollution, rang<strong>in</strong>gfrom U.S. $2642 million to U.S. $6192 million. Most <strong>of</strong> <strong>the</strong>dose–response coefficients <strong>and</strong> economic values used <strong>in</strong> <strong>the</strong>analysis were derived from Ch<strong>in</strong>ese studies.Cao J <strong>and</strong> colleagues (2008) used an <strong>in</strong>tegrated model<strong>in</strong>gapproach to compare <strong>the</strong> health co-benefits <strong>of</strong> three environmentaltax options for Ch<strong>in</strong>a: a carbon tax, a fuel tax, <strong>and</strong> anenergy-output tax. Comb<strong>in</strong><strong>in</strong>g a top-down macroeconomicmodel with a bottom-up energy-sector model, <strong>the</strong> authors estimatedthat health co-benefits <strong>in</strong> <strong>the</strong> year 2020 would be substantial,rang<strong>in</strong>g from 10.3 billion yuan for <strong>the</strong> energy-outputtax to 49.6 billion yuan for <strong>the</strong> carbon tax. The authors notedthat although health co-benefits per ton <strong>of</strong> carbon reductionwere greatest for <strong>the</strong> output tax, <strong>the</strong> co-benefits came at <strong>the</strong>Cont<strong>in</strong>ued on next pageFigure 10.1. L<strong>in</strong>ks between energy <strong>and</strong> health. [Repr<strong>in</strong>ted from Wilk<strong>in</strong>son et al. 2007 from The Lancet with permission from Elsevier.]63
<strong>Outdoor</strong> <strong>Air</strong> <strong>Pollution</strong> <strong>and</strong> <strong>Health</strong> <strong>in</strong> <strong>the</strong> Develop<strong>in</strong>g <strong>Countries</strong> <strong>of</strong> <strong>Asia</strong>Sidebar 10. CO-BENEFITS OF MITIGATION MEASURES FOR CLIMATE CHANGE IN ASIA (Cont<strong>in</strong>ued)expense <strong>of</strong> more modest carbon reductions. They concludedthat <strong>the</strong> optimal policy would be a comb<strong>in</strong>ation <strong>of</strong> a national taxwith caps on <strong>the</strong> output <strong>of</strong> specific energy sectors.Smith <strong>and</strong> Haigler (2008) provide an <strong>in</strong>itial, detailed consideration<strong>of</strong> a framework for assessments <strong>of</strong> health co-benefitsdesigned to compare cost reductions associated with healthco-benefits <strong>and</strong> those from o<strong>the</strong>r economic assessments <strong>in</strong>cost–benefit analyses <strong>of</strong> GHG-reduction policies. One example,<strong>of</strong> provid<strong>in</strong>g cook stoves that are biomass gasifiers <strong>in</strong> Ch<strong>in</strong>a toreplace stoves that use direct combustion <strong>of</strong> fossil fuels, wasfound to have comb<strong>in</strong>ed climate <strong>and</strong> health benefits that werehighly cost-effective, with a cost–benefit ratio <strong>of</strong> 6.SELECTED STUDIES OF HEALTH CO-BENEFITS INOTHER REGIONSCifuentes <strong>and</strong> colleagues (2001a,b) found significant neartermpublic health benefits from reductions <strong>in</strong> O 3 <strong>and</strong> ambientPM associated with policies to reduce GHG emissions <strong>in</strong>Mexico City, Santiago (Chile), São Paolo, <strong>and</strong> New York. Theauthors concluded that immediately undertak<strong>in</strong>g policies toachieve modest reductions <strong>in</strong> GHG emissions <strong>in</strong> <strong>the</strong> four citiescould prevent a total <strong>of</strong> 64,000 premature deaths, 65,000cases <strong>of</strong> chronic bronchitis, 91,000 hospital admissions,787,000 emergency room visits, 6.1 million asthma attacks,<strong>and</strong> 37 million person-days <strong>of</strong> lost work or restricted activityover <strong>the</strong> next few decades.A 2006 study by West <strong>and</strong> colleagues found that reduc<strong>in</strong>g totalanthropogenic methane emissions by 20% beg<strong>in</strong>n<strong>in</strong>g <strong>in</strong> 2010would prevent about 30,000 deaths from all causes, ow<strong>in</strong>g toreduced O 3 concentrations, by 2030 <strong>and</strong> about 370,000deaths from all natural causes by 2030. Cost-effectiveness calculationssuggest that benefits to air quality <strong>and</strong> health can justifyreductions <strong>in</strong> methane emissions that are undertaken toreduce global warm<strong>in</strong>g, irrespective <strong>of</strong> o<strong>the</strong>r benefits <strong>of</strong>methane <strong>and</strong> O 3 reductions.Nishioka <strong>and</strong> associates (2006) used life-cycle assessment(analysis <strong>of</strong> <strong>the</strong> total environmental impact <strong>of</strong> a given product)<strong>and</strong> risk assessment to evaluate <strong>the</strong> net impacts <strong>of</strong> a change <strong>in</strong>energy policy <strong>and</strong> to compare health impacts <strong>of</strong> reduced PMconcentrations, changes <strong>in</strong> GHG emissions, <strong>and</strong> changes <strong>in</strong><strong>in</strong>come. Theirs was among <strong>the</strong> first studies to quantify heal<strong>the</strong>nd po<strong>in</strong>ts associated with both environmental <strong>and</strong> economicchanges related to energy policy. They quantified <strong>the</strong> economicsav<strong>in</strong>gs for homeowners, <strong>the</strong> PM-related impacts <strong>of</strong> <strong>in</strong>creasedresidential <strong>in</strong>sulation <strong>and</strong> its associated energy sav<strong>in</strong>gs, <strong>and</strong><strong>the</strong> changes <strong>in</strong> GHG emissions, health effects associated withclimate change, <strong>and</strong> disposable <strong>in</strong>come <strong>of</strong> homeowners over<strong>the</strong> life cycle <strong>of</strong> <strong>the</strong> <strong>in</strong>sulation <strong>and</strong> o<strong>the</strong>r energy-efficiency products.The authors converted <strong>the</strong> morbidity <strong>and</strong> mortality associatedwith PM <strong>and</strong> GHG emissions <strong>and</strong> <strong>in</strong>come changes <strong>in</strong>toDALYs. Their analysis demonstrated <strong>the</strong> feasibility <strong>of</strong> compar<strong>in</strong>g<strong>the</strong> three pathways — reductions PM emissions, reductions <strong>in</strong>GHG emissions, <strong>and</strong> <strong>in</strong>come change — through a comb<strong>in</strong>ation<strong>of</strong> risk assessment <strong>and</strong> life-cycle assessment <strong>and</strong> found that allthree pathways result <strong>in</strong> positive net benefits over <strong>the</strong> life <strong>of</strong> an<strong>in</strong>sulated home. Because <strong>the</strong> estimated benefits are similar <strong>in</strong>magnitude among all three pathways, <strong>the</strong>y concluded that nopathway can be ruled out at this time.A number <strong>of</strong> <strong>the</strong>mes emerge from <strong>the</strong> limited literature <strong>in</strong> thisarea. First, <strong>the</strong> health co-benefits <strong>of</strong> GHG mitigation activitiescan be substantial, dom<strong>in</strong>at<strong>in</strong>g <strong>the</strong> overall cost–benefitassessment. Second, <strong>the</strong> health co-benefits occur over a relativelyshort time, mak<strong>in</strong>g <strong>the</strong>m potentially powerful drivers <strong>and</strong>justifiers <strong>of</strong> specific mitigation policies. Third, although co-benefitsrelated to air quality may be <strong>the</strong> best characterized, <strong>the</strong>reare multiple o<strong>the</strong>r l<strong>in</strong>ks between GHG mitigation policies <strong>and</strong>health, <strong>in</strong>clud<strong>in</strong>g changes <strong>in</strong> physical activity patterns, changes<strong>in</strong> rates <strong>of</strong> physical <strong>in</strong>jury, <strong>and</strong> changes <strong>in</strong> nutritional health(related both to bi<strong>of</strong>uels <strong>and</strong> policies limit<strong>in</strong>g development <strong>of</strong>cattle operations <strong>and</strong> those <strong>of</strong> o<strong>the</strong>r rum<strong>in</strong>ant livestock). Afourth <strong>the</strong>me specific to studies <strong>of</strong> less-developed countries is<strong>the</strong> question <strong>of</strong> transferability <strong>of</strong> dose–response relations <strong>and</strong>economic valuations from studies <strong>of</strong> a wealthy region, such as<strong>the</strong> United States or Europe, to a less wealthy nation, such asCh<strong>in</strong>a. This transfer leads to greater uncerta<strong>in</strong>ties because <strong>of</strong>disparities <strong>in</strong> economic status, underly<strong>in</strong>g demographic <strong>and</strong>disease-<strong>in</strong>cidence patterns, <strong>and</strong> cultural attitudes.CRITICAL RESEARCH GAPSCritical uncerta<strong>in</strong>ties throughout <strong>the</strong> current literature <strong>in</strong>clude<strong>the</strong> quantitative association between reductions <strong>in</strong> GHGs <strong>and</strong>those <strong>of</strong> criteria air pollutants. In general, policies that lead torelatively simple reductions <strong>in</strong> energy generation, such as<strong>in</strong>creased efficiency <strong>of</strong> <strong>the</strong> generation or use <strong>of</strong> electric power,allow for a simple proportional analytic approach. Fuel substitutionsare <strong>of</strong>ten more difficult to assess, ow<strong>in</strong>g to <strong>in</strong>sufficientdata on emissions related to alternative fuels <strong>in</strong> many cases. Indeveloped countries, a common source <strong>of</strong> uncerta<strong>in</strong>ty is <strong>the</strong><strong>in</strong>teraction between regulatory controls for criteria pollutants<strong>and</strong> new GHG-reduction policies. For example, automobileemissions st<strong>and</strong>ards are set <strong>in</strong>dependently <strong>of</strong> fuel-economyst<strong>and</strong>ards. If fuel-economy st<strong>and</strong>ards are <strong>in</strong>creased to reduceGHG emissions, it is unclear whe<strong>the</strong>r automobile manufacturerswill simply adjust controls for criteria-pollutant emissionsCont<strong>in</strong>ued on next page64
HEI International Scientific Oversight CommitteeSidebar 10. CO-BENEFITS OF MITIGATION MEASURES FOR CLIMATE CHANGE IN ASIA (Cont<strong>in</strong>ued)<strong>in</strong> order to cont<strong>in</strong>ue to meet emissions st<strong>and</strong>ards only orwhe<strong>the</strong>r <strong>the</strong>y would take advantage <strong>of</strong> <strong>the</strong> lower concentrations<strong>of</strong> pollutants delivered to catalytic converters <strong>and</strong> o<strong>the</strong>rcontrol technology <strong>and</strong> produce automobiles with appreciablylower GHG emissions. Similarly, if emissions from power plantswere capped, it is not clear whe<strong>the</strong>r <strong>the</strong> reduced dem<strong>and</strong> forelectricity due to energy-efficiency measures would lead toreductions below <strong>the</strong> cap for criteria pollutants.Research that provides more <strong>in</strong>sight <strong>in</strong>to <strong>the</strong> variability <strong>of</strong>dose–response relations <strong>in</strong> association with differences <strong>in</strong> climate,population demographics, <strong>and</strong> pollutant mixes isneeded. Region-specific data on will<strong>in</strong>gness-to-pay <strong>and</strong> cost-<strong>of</strong>illnessvalues are also lack<strong>in</strong>g. In addition, <strong>the</strong>re is an immediateneed to develop a consensus on methods <strong>and</strong> assumptionsfor conduct<strong>in</strong>g co-benefits assessments, <strong>in</strong>clud<strong>in</strong>gelements such as discount rates <strong>and</strong> time horizons.The majority <strong>of</strong> co-benefits research has focused on reductions<strong>in</strong> concentrations <strong>of</strong> conventional air pollutants. Additional ancillarybenefits from GHG mitigation measures need to be betterquantified, potentially <strong>in</strong>clud<strong>in</strong>g <strong>in</strong>creased physical activity from<strong>in</strong>creased use <strong>of</strong> active means <strong>of</strong> transport, changes <strong>in</strong> patterns<strong>of</strong> vehicular <strong>in</strong>jury ow<strong>in</strong>g to shifts <strong>in</strong> modes <strong>of</strong> transport, <strong>and</strong>changes <strong>in</strong> patterns <strong>of</strong> <strong>in</strong>jury occurr<strong>in</strong>g dur<strong>in</strong>g fuel-cycle activity<strong>in</strong> association with <strong>in</strong>creased development <strong>and</strong> use <strong>of</strong> renewableenergy sources. O<strong>the</strong>r, unrecognized health co-benefitsprobably also exist. ExternE, a research project <strong>of</strong> <strong>the</strong> EuropeanCommission focus<strong>in</strong>g on <strong>the</strong> external costs <strong>of</strong> energy (i.e., costsnot rout<strong>in</strong>ely accounted for <strong>in</strong> market transactions), has characterizedsome <strong>of</strong> <strong>the</strong> underly<strong>in</strong>g health risks associated wi<strong>the</strong>nergy production <strong>and</strong> use (European Commission 2005).These external costs need to be more broadly <strong>in</strong>corporated <strong>in</strong>economic models <strong>of</strong> GHG mitigation policies.IMPLICATIONS FOR IMPROVED PUBLIC HEALTH POLICYDecisions made with<strong>in</strong> <strong>the</strong> energy <strong>and</strong> transport sectors toreduce GHGs must be made with a clear underst<strong>and</strong><strong>in</strong>g <strong>of</strong> <strong>the</strong>implications <strong>of</strong> those decisions on human health. In manycases, <strong>the</strong>re are trade-<strong>of</strong>fs, both obvious <strong>and</strong> subtle, that ifunaddressed may result <strong>in</strong> human suffer<strong>in</strong>g <strong>and</strong> net economicloss <strong>and</strong> may underm<strong>in</strong>e <strong>the</strong> effectiveness <strong>of</strong> envisioned GHGreductions. Examples <strong>in</strong>clude <strong>the</strong> promotion <strong>and</strong> substitution<strong>of</strong> diesel cars for gasol<strong>in</strong>e cars without consideration <strong>of</strong> <strong>the</strong>consequences for urban air pollution (Walsh 2008) or <strong>the</strong> substitution<strong>of</strong> corn ethanol for gasol<strong>in</strong>e without consideration <strong>of</strong><strong>the</strong> consequences for food supplies or O 3 air pollution.GHGs are complex, have a short life, <strong>and</strong> depend on local conditions— all <strong>of</strong> which factors make it difficult, if not impossible, toestablish <strong>the</strong> potential role <strong>of</strong> GHGs <strong>in</strong> reduc<strong>in</strong>g global warm<strong>in</strong>gfor purposes <strong>of</strong> policy mak<strong>in</strong>g. At present, <strong>the</strong>y are not <strong>in</strong>cluded<strong>in</strong> most policy deliberations. This omission is <strong>in</strong>creas<strong>in</strong>gly problematicas <strong>the</strong> world seeks ways to reduce <strong>the</strong> risks <strong>of</strong> globalwarm<strong>in</strong>g <strong>in</strong> ways that are both cost-effective <strong>and</strong> compatiblewith o<strong>the</strong>r goals, such as protection from outdoor air pollutants.There are large health benefits from reduc<strong>in</strong>g <strong>the</strong> emissions <strong>of</strong>carbon-conta<strong>in</strong><strong>in</strong>g aerosols, <strong>and</strong> a recent study suggests thatblack carbon may cause climate forc<strong>in</strong>g that accounts forroughly 30% <strong>of</strong> <strong>the</strong> climate forc<strong>in</strong>g from all <strong>the</strong> major GHGscomb<strong>in</strong>ed (Ramanathan <strong>and</strong> Carmichael 2008). Reductions <strong>in</strong>BC concentrations may have specific co-benefits for <strong>Asia</strong>,because deposition <strong>of</strong> BC <strong>in</strong> <strong>the</strong> snowcap <strong>of</strong> <strong>the</strong> Himalayas isbelieved to be contribut<strong>in</strong>g to <strong>the</strong> accelerated melt<strong>in</strong>g <strong>of</strong> Himalayanglaciers. Although climate benefits from reduc<strong>in</strong>g concentrations<strong>of</strong> BC may be partially <strong>of</strong>fset by simultaneousreductions <strong>in</strong> concentrations <strong>of</strong> OC <strong>and</strong> SO 2 4 aerosols, whichcool <strong>the</strong> atmosphere, <strong>the</strong> health co-benefits from reduc<strong>in</strong>g BCrema<strong>in</strong> substantial.<strong>Health</strong> damages are <strong>the</strong> largest component <strong>of</strong> <strong>the</strong> external costs<strong>of</strong> energy (European Commission 2005). Reductions <strong>in</strong> healthrelatedcosts <strong>of</strong> co-benefits can cancel out <strong>the</strong> expense <strong>of</strong> GHGmitigation policies. For example, Barker <strong>and</strong> Rosendahl (2000)modeled <strong>the</strong> ancillary benefits from Western Europe’s meet<strong>in</strong>gits Kyoto Protocol targets. On <strong>the</strong> basis <strong>of</strong> ExternE estimates <strong>of</strong>“damage costs” (e.g., health impacts <strong>of</strong> PM), <strong>the</strong> authors estimated<strong>the</strong> ancillary benefits would be worth 9 billion Euros peryear dur<strong>in</strong>g 2008–2012, constitut<strong>in</strong>g 15–35% <strong>of</strong> <strong>the</strong> change <strong>in</strong>GDP due to <strong>the</strong> mitigation policies. These yearly benefits <strong>in</strong>clude104,000 saved life-years <strong>and</strong> 5.4 million avoided days <strong>of</strong>restricted activity. Ano<strong>the</strong>r study, conducted by Burtraw <strong>and</strong> colleagues(2001), evaluated <strong>the</strong> co-benefits aris<strong>in</strong>g from a carbontax <strong>in</strong> <strong>the</strong> electricity sector <strong>in</strong> <strong>the</strong> United States. They found that atax <strong>of</strong> U.S. $25 per metric ton <strong>of</strong> carbon would result <strong>in</strong> U.S. $12–14 per metric ton <strong>of</strong> carbon <strong>of</strong> ancillary benefits, <strong>of</strong> which U.S. $8per ton would come from health benefits due to reductions <strong>in</strong>NO x concentrations. A cost–benefit analysis <strong>of</strong> <strong>the</strong> U.S. Clean <strong>Air</strong>Act fur<strong>the</strong>r supports <strong>the</strong> magnitude <strong>of</strong> benefits that can resultfrom environmental policies: a benefit–cost ratio <strong>of</strong> 4:1 <strong>in</strong> 2000,result<strong>in</strong>g from <strong>the</strong> U.S. $71 billion <strong>of</strong> monetized benefits, most <strong>of</strong>which would be health related (U.S. EPA 2000).A fuller account<strong>in</strong>g <strong>of</strong> <strong>the</strong>se public health benefits should be<strong>in</strong>cluded <strong>in</strong> decisions <strong>of</strong> climate-change policy. In addition, recognition<strong>of</strong> <strong>the</strong> aggregate health sav<strong>in</strong>gs may justify greaterGHG reductions <strong>and</strong> promote more aggressive strategies, ultimatelyprotect<strong>in</strong>g <strong>the</strong> public’s health aga<strong>in</strong>st negative externalcosts <strong>of</strong> energy, <strong>in</strong> <strong>the</strong> short term, <strong>and</strong> aga<strong>in</strong>st adverse effects<strong>of</strong> climate change, <strong>in</strong> <strong>the</strong> long term.65
<strong>Outdoor</strong> <strong>Air</strong> <strong>Pollution</strong> <strong>and</strong> <strong>Health</strong> <strong>in</strong> <strong>the</strong> Develop<strong>in</strong>g <strong>Countries</strong> <strong>of</strong> <strong>Asia</strong>Particle-Size Distribution Given that combustion processeslargely contribute to <strong>the</strong> f<strong>in</strong>e (PM 2.5 ) fraction <strong>of</strong> PM,<strong>the</strong> particle-size distribution can be used as one measure todifferentiate <strong>the</strong> contributions <strong>of</strong> source categories to airquality. As discussed previously (<strong>in</strong> Current Capabilities<strong>and</strong> Coverage <strong>of</strong> <strong>Air</strong> Quality Monitor<strong>in</strong>g <strong>in</strong> Section II), rout<strong>in</strong>egovernment monitor<strong>in</strong>g <strong>of</strong> particle concentrations <strong>in</strong><strong>Asia</strong> is ma<strong>in</strong>ly limited to measurement <strong>of</strong> PM 10 . Throughspecific studies, however, <strong>the</strong> ratios <strong>of</strong> PM 2.5 concentrationsto PM 10 concentrations for various <strong>Asia</strong>n cities havebeen measured <strong>and</strong> may be used to <strong>in</strong>fer PM 2.5 concentrationsfrom PM 10 measurements. Table 9 provides a summary<strong>of</strong> <strong>the</strong>se ratios for some major cities <strong>in</strong> <strong>Asia</strong>, asderived from <strong>the</strong> cited references. This ratio rangesbetween 0.23 <strong>and</strong> 0.35 <strong>in</strong> <strong>the</strong> O<strong>the</strong>r South <strong>Asia</strong>n cities <strong>of</strong>Dhaka, Rajshahi, Chennai, <strong>and</strong> Islamabad, where roaddust, soil dust, <strong>and</strong> uncontrolled construction dust dom<strong>in</strong>ate<strong>in</strong> <strong>the</strong> ambient air (Begum et al. 2004, 2005; Oanh etal. 2006, 2007; Shah et al. 2006). With progressive development<strong>in</strong> recent years, this ratio is probably shift<strong>in</strong>g towardequal portions <strong>of</strong> both f<strong>in</strong>e <strong>and</strong> coarse fractions, as seen <strong>in</strong>many East <strong>Asia</strong>n cities. In Bangkok, Beij<strong>in</strong>g, Taipei,Ch<strong>in</strong>a,<strong>and</strong> B<strong>and</strong>ung, <strong>the</strong> f<strong>in</strong>e fraction has become slightly greaterthan <strong>the</strong> coarse fraction as vehicle emissions <strong>and</strong> <strong>in</strong>dustrialactivity have progressively <strong>in</strong>creased over <strong>the</strong> lastdecade (Oanh et al. 2006, 2007; Tsai YI <strong>and</strong> Chen CL 2006).In <strong>the</strong> more developed countries <strong>of</strong> South Korea <strong>and</strong> Japan,<strong>the</strong> ratio is as high as 0.77 (Wang XL et al. 2005; Kim KH etal. 2006a), most likely reflect<strong>in</strong>g <strong>the</strong> control <strong>of</strong> coarse-fractionemissions, whereas <strong>the</strong> even higher ratio observed <strong>in</strong>Table 9. Ratios <strong>of</strong> PM 2.5 to PM 10 <strong>in</strong> Various <strong>Asia</strong>n CitiesCountry /CityRatio <strong>of</strong> PM 2.5 to PM 10Average M<strong>in</strong>imum MaximumCitationBangladeshDhaka 0.34 0.34 0.34 Begum et al. 2007Rajshahi 0.35 0.35 0.35 Begum et al. 2004Ch<strong>in</strong>aBeij<strong>in</strong>g 0.63 0.58 0.73 Oanh et al. 2006Taipei,Ch<strong>in</strong>a 0.62 0.61 0.63 Tsai YI <strong>and</strong> Chen CL 2006IndiaChennai 0.31 0.26 0.35 Oanh et al. 2006IndonesiaB<strong>and</strong>ung 0.63 0.52 0.73 Oanh et al. 2006JapanKanazawa 0.71 0.71 0.71 Wang XL et al. 2005PakistanIslamabad 0.23 0.23 0.23 Shah et al. 2006Philipp<strong>in</strong>esManila 0.73 0.61 0.81 Oanh et al. 2006South KoreaSeoul 0.77 0.77 0.77 Kim KH et al. 2006Busan 0.56 0.56 0.56 Kim KH et al. 2006Sihwa 0.75 0.75 0.75 Park SS et al. 2001Thail<strong>and</strong>Bangkok 0.59 0.47 0.68 Oanh et al. 2006VietnamHanoi 0.78 0.62 0.95 Oanh et al. 2006Ho Chi M<strong>in</strong>h City 0.34 0.34 0.34 Hien et al. 200166
HEI International Scientific Oversight CommitteeHanoi <strong>and</strong> Manila suggest an important contribution <strong>of</strong>fossil-fuel combustion <strong>in</strong> <strong>the</strong>se cities (Oanh et al. 2006,2007). Typical ratios <strong>in</strong> populated areas <strong>of</strong> developedcountries <strong>in</strong> Europe <strong>and</strong> North America are 0.7 or more(Gehrig <strong>and</strong> Buchmann 2003; U.S. EPA 2004).Source Categories More detailed receptor model<strong>in</strong>g<strong>in</strong>volves <strong>the</strong> measurement <strong>of</strong> chemical composition,mostly as related to PM. Us<strong>in</strong>g <strong>the</strong> results <strong>of</strong> such model<strong>in</strong>g,we can illustrate <strong>and</strong> compare <strong>the</strong> sources <strong>of</strong> PM <strong>in</strong>various <strong>Asia</strong>n cities <strong>and</strong> at some representative backgroundsites (Figure 28) on <strong>the</strong> basis <strong>of</strong> available data.Because <strong>of</strong> differences <strong>in</strong> <strong>the</strong> source-apportionmentmethods <strong>and</strong> sources identified <strong>in</strong> each study, five majoremissions categories have been designated: mobile, stationary,biomass, fugitive, <strong>and</strong> o<strong>the</strong>r. Mobile-source emissionsconsist <strong>of</strong> emissions from gasol<strong>in</strong>e, diesel, <strong>and</strong> twostrokeeng<strong>in</strong>es. Stationary-source emissions consist <strong>of</strong> all<strong>in</strong>dustrial emissions as well as emissions from solid-wastecombustion <strong>and</strong> refuse <strong>in</strong>c<strong>in</strong>eration. Fugitive emissionsconsist <strong>of</strong> soil dust, road dust, <strong>and</strong> construction dust.O<strong>the</strong>r emissions consist mostly <strong>of</strong> emissions from o<strong>the</strong>runidentified sources, as well as secondary organics, secondarysulfates, secondary nitrates, <strong>and</strong> secondary ammoniumcompounds (formed <strong>in</strong> <strong>the</strong> atmosphere) that couldnot be apportioned to specific sources.Rajshahi, Bangladesh (population 700,000), <strong>and</strong> Ch<strong>and</strong>igarh,India (population 900,000), are <strong>the</strong> only backgroundsites where detailed source apportionment wasconducted, as identified <strong>in</strong> <strong>the</strong> literature review. Eventhough <strong>the</strong>se locations have fairly large populations byWestern st<strong>and</strong>ards, <strong>the</strong>y are still relatively small comparedwith major cities <strong>in</strong> <strong>Asia</strong>. The Sihwa <strong>in</strong>dustrial area, SouthKorea, is believed to have a PM makeup heavily <strong>in</strong>fluencedby long-range transport <strong>of</strong> air pollution from Ch<strong>in</strong>a.From Figure 29, it is evident that both source contributionsto <strong>and</strong> concentrations <strong>of</strong> f<strong>in</strong>e PM differ greatly among<strong>Asia</strong>n cities. Beij<strong>in</strong>g, Delhi, Kolkata, Kaohsiung County(adjacent to Kaohsiung City <strong>in</strong> Taipei,Ch<strong>in</strong>a), Mumbai, <strong>and</strong>Hanoi have <strong>the</strong> highest concentrations <strong>of</strong> f<strong>in</strong>e PM. ForBeij<strong>in</strong>g, <strong>the</strong> predom<strong>in</strong>ant source <strong>of</strong> PM 2.5 is mostly secondaryPM <strong>in</strong> nature, with considerable fugitive emissions,whereas Delhi, Kolkata, Taipei, <strong>and</strong> Mumbai, haveno s<strong>in</strong>gle predom<strong>in</strong>ant source, but ra<strong>the</strong>r a mixture <strong>of</strong>sources from each <strong>of</strong> <strong>the</strong> five major categories: mobile, stationary,biomass, fugitive, <strong>and</strong> o<strong>the</strong>r emissions. On <strong>the</strong>o<strong>the</strong>r h<strong>and</strong>, <strong>in</strong> Hanoi, biomass burn<strong>in</strong>g appears to be quitean important source, as is also <strong>the</strong> case <strong>in</strong> several o<strong>the</strong>rcities, such as Bangkok, B<strong>and</strong>ung, <strong>and</strong> Rajshahi. Selectlocation-specific results are described <strong>in</strong> more detailbelow.Ch<strong>in</strong>a In addition to <strong>the</strong> studies <strong>in</strong> Hong Kong, described<strong>in</strong> Sidebar 5, several studies have identified possiblesources <strong>of</strong> PM <strong>in</strong> Beij<strong>in</strong>g. He KB <strong>and</strong> colleagues (2001)identified dust storms, vehicle emissions, <strong>and</strong> biomassburn<strong>in</strong>g as <strong>the</strong> ma<strong>in</strong> sources <strong>of</strong> f<strong>in</strong>e-particle air pollution atresidential <strong>and</strong> downtown sites <strong>in</strong> Beij<strong>in</strong>g. Duan <strong>and</strong> colleagues(2004) also noted an important contribution <strong>of</strong> biomasscombustion, as well as traffic <strong>and</strong> <strong>in</strong>dustrialemissions, <strong>the</strong> major contributors to OC <strong>and</strong> elementalcarbon (EC) concentrations dur<strong>in</strong>g summer, with coal combustionbe<strong>in</strong>g <strong>the</strong> dom<strong>in</strong>ant contributor dur<strong>in</strong>g w<strong>in</strong>ter.Song Y <strong>and</strong> colleagues (2006) identified <strong>the</strong> contributionto PM 2.5 mass <strong>of</strong> eight sources <strong>in</strong> Beij<strong>in</strong>g <strong>in</strong> 2000: biomassburn<strong>in</strong>g (11%), secondary SO 2 4 (17%), secondary NO 3(14%), coal combustion (19%), <strong>in</strong>dustry (6%), motor vehicles(6%), road dust (9%), <strong>and</strong> o<strong>the</strong>r (18%) — which<strong>in</strong>cludes yellow dust (dust from nonroad sources).India Chowdhury <strong>and</strong> colleagues (2007) recently completeda comprehensive source-apportionment study <strong>in</strong>India us<strong>in</strong>g a source-apportionment model based onmolecular markers to quantify <strong>the</strong> primary-source contributionsto <strong>the</strong> PM 2.5 mass concentrations <strong>in</strong> each <strong>of</strong> <strong>the</strong>four seasons <strong>in</strong> Delhi, Mumbai, <strong>and</strong> Kolkata <strong>and</strong> <strong>in</strong>summer <strong>in</strong> Ch<strong>and</strong>igarh. Five primary sources were identified<strong>and</strong> quantified: diesel eng<strong>in</strong>e exhaust, gasol<strong>in</strong>e eng<strong>in</strong>eexhaust, road dust, coal combustion, <strong>and</strong> biomass combustion.Important trends <strong>in</strong> <strong>the</strong> seasonal <strong>and</strong> spatial patterns<strong>of</strong> <strong>the</strong> impacts <strong>of</strong> <strong>the</strong>se five sources were observed. Onaverage, primary emissions from combustion <strong>of</strong> fossil fuels(coal, diesel, <strong>and</strong> gasol<strong>in</strong>e) were responsible for about 25–33% <strong>of</strong> <strong>the</strong> PM 2.5 mass <strong>in</strong> Delhi, 21–36% <strong>in</strong> Mumbai, 37–57% <strong>in</strong> Kolkata, <strong>and</strong> 28% <strong>in</strong> Ch<strong>and</strong>igarh. The correspond<strong>in</strong>gcontributions <strong>of</strong> biomass combustion to ambientPM 2.5 were 7–20%, 7–20%, 13–18%, <strong>and</strong> 8%. Although<strong>the</strong> relative contributions from diesel, gasol<strong>in</strong>e, <strong>and</strong> coalcombustion varied by location <strong>and</strong> season, diesel wasresponsible for approximately 20–25% <strong>of</strong> <strong>the</strong> fossil-fuelcontributions <strong>in</strong> <strong>the</strong> larger Indian cities, with <strong>in</strong>creasedcontributions from coal combustion <strong>in</strong> w<strong>in</strong>ter. Ch<strong>and</strong>igarhis <strong>the</strong> only smaller Indian city where source apportionmenthas been conducted <strong>and</strong> can be viewed as a typicalbackground location <strong>in</strong> India. Diesel (13%), gasol<strong>in</strong>e(16%), road dust (32%), <strong>and</strong> biomass (8%) were <strong>the</strong> majorcontributors to PM 2.5 , with a secondary-particle contribution<strong>of</strong> 24%.Bangladesh Extensive studies <strong>in</strong> Dhaka (Begum et al.2004, 2005, 2007), identified major coarse-particle contributionsto PM 2.5 from soil dust <strong>and</strong> road dust (total contribution,50%). The motor-vehicle source apportionmentwas approximately 40%; <strong>the</strong> rema<strong>in</strong><strong>in</strong>g 10% consisted <strong>of</strong>67
<strong>Outdoor</strong> <strong>Air</strong> <strong>Pollution</strong> <strong>and</strong> <strong>Health</strong> <strong>in</strong> <strong>the</strong> Develop<strong>in</strong>g <strong>Countries</strong> <strong>of</strong> <strong>Asia</strong>Figure 29. Source apportionment <strong>of</strong> average annual PM 2.5 mass <strong>in</strong> representative urban <strong>and</strong> rural locations <strong>in</strong> <strong>Asia</strong>. The data given for Ch<strong>and</strong>igarh <strong>and</strong> Kaohsiung are seasonal averages forsummer <strong>and</strong> w<strong>in</strong>ter, respectively, ra<strong>the</strong>r than <strong>the</strong> average annual PM 2.5 mass. [Data compiled by Zohir Chowdhury (http://chowdhuryonl<strong>in</strong>e.net/zohir/BAQ_Source_Apportionment.pdf).]68
HEI International Scientific Oversight Committeeemissions from two-stroke eng<strong>in</strong>es, sea salt, <strong>and</strong> metalsmelt<strong>in</strong>gemissions. Motor-vehicle emissions <strong>in</strong> whichemissions from two-stroke eng<strong>in</strong>es were <strong>in</strong>cludedaccounted for about 48% <strong>of</strong> <strong>the</strong> PM 2.5 mass. In a hot-spottraffic area <strong>in</strong> central Dhaka, Begum <strong>and</strong> colleagues (2005)estimated that approximately 50% <strong>of</strong> <strong>the</strong> total f<strong>in</strong>e-particlemass could be attributed to motor vehicles, <strong>in</strong>clud<strong>in</strong>gthose with two-stroke eng<strong>in</strong>es. In Rajshahi, a smaller city<strong>in</strong> <strong>the</strong> western part <strong>of</strong> Bangladesh, wood burn<strong>in</strong>g contributed50% <strong>of</strong> <strong>the</strong> f<strong>in</strong>e-particle mass, with a 23% contributionfrom motor vehicles.Thail<strong>and</strong> Oanh <strong>and</strong> colleagues (2006, 2007) estimated<strong>the</strong> source contributions <strong>in</strong> Bangkok <strong>in</strong> both <strong>the</strong> dry <strong>and</strong>wet seasons. They reported a mobile-source contributionto PM 2.5 pollution <strong>of</strong> 35% <strong>in</strong> <strong>the</strong> dry season <strong>and</strong> 21% <strong>in</strong><strong>the</strong> wet season, <strong>and</strong> a biomass-combustion contribution <strong>of</strong>31% <strong>in</strong> <strong>the</strong> dry season <strong>and</strong> 29% <strong>in</strong> <strong>the</strong> wet season. Considerableamounts <strong>of</strong> secondary PM (29–36%) were also identified<strong>and</strong> quantified <strong>in</strong> <strong>the</strong>se studies.OVERVIEW OF EXPOSURE ISSUESHuman exposure to a pollutant occurs when a personcomes <strong>in</strong>to contact with <strong>the</strong> pollutant for a certa<strong>in</strong> period<strong>of</strong> time. The occurrence <strong>of</strong> exposure, hence, requires <strong>the</strong>coexistence <strong>of</strong> <strong>the</strong> person <strong>and</strong> <strong>the</strong> pollutant <strong>in</strong> <strong>the</strong> samespace at <strong>the</strong> same time. However, ambient concentrationsmay be measured without consideration <strong>of</strong> this coexistence.For example, although air pollutant concentrationsare very high near a large coal-fired power-plant stack,very few people may be actually exposed if <strong>the</strong> stack is at aremote site. From <strong>the</strong> st<strong>and</strong>po<strong>in</strong>t <strong>of</strong> health effects, exposureis a better predictor or determ<strong>in</strong>ant than ambient concentrations,as it is closer to health effects <strong>in</strong> thisconceptual source–to–health effects cont<strong>in</strong>uum:Source emissions → Ambient (outdoor) concentrations →Exposure (<strong>in</strong>take) → Dose → <strong>Health</strong> effectsThe average population exposure reflects <strong>the</strong> number <strong>of</strong>people exposed at different concentrations for differentperiods <strong>of</strong> time: <strong>the</strong> number <strong>of</strong> people <strong>the</strong> pollutant concentration <strong>the</strong> exposure duration. The term exposurerefers to contact with any part <strong>of</strong> <strong>the</strong> exterior <strong>of</strong> <strong>the</strong> humanbody — not just via <strong>the</strong> <strong>in</strong>halation route alone. The term<strong>in</strong>take may be more exclusively used to describe <strong>in</strong>halationexposure to airborne pollutants. The dose, or <strong>the</strong>amount <strong>of</strong> pollutant that actually crosses <strong>the</strong> exteriorboundary <strong>of</strong> <strong>the</strong> body or is absorbed by a body tissue ororgan, is even more directly related to health effects. However,estimat<strong>in</strong>g <strong>the</strong> dose requires knowledge <strong>of</strong> manyadditional parameters (e.g., <strong>in</strong>halation rate, absorptionrate) at <strong>the</strong> <strong>in</strong>dividual level.Ambient (outdoor) concentrations have <strong>of</strong>ten been used<strong>in</strong> epidemiologic <strong>in</strong>vestigations <strong>of</strong> <strong>the</strong> health effects <strong>of</strong>urban air pollution. An underly<strong>in</strong>g assumption <strong>of</strong> <strong>the</strong>sestudies is that measurements or model estimates <strong>of</strong>ambient concentrations serve as a proxy <strong>of</strong> populationexposure to air pollution. How accurate this assumption isdepends on a large number <strong>of</strong> factors (see below) concern<strong>in</strong>g<strong>the</strong> <strong>in</strong>take fraction — a unify<strong>in</strong>g concept that hasevolved over <strong>the</strong> past two decades (Bennett et al. 2002).Intake Fraction <strong>and</strong> <strong>the</strong> Role <strong>of</strong> Human ActivityThe purpose <strong>of</strong> <strong>the</strong> <strong>in</strong>take fraction is to provide a simpledescription <strong>of</strong> <strong>the</strong> relation between emissions <strong>and</strong> exposureby <strong>in</strong>corporat<strong>in</strong>g major parameters that affect <strong>the</strong> cont<strong>in</strong>uum<strong>of</strong> source emissions to ambient concentrations toexposure levels (Zhang JJ <strong>and</strong> Lioy 2002).The <strong>in</strong>take fractionfor a primary air pollutant is def<strong>in</strong>ed as <strong>the</strong> total mass<strong>in</strong>haled from a particular emission source divided by <strong>the</strong>total mass emitted from <strong>the</strong> emission source. For a givenemission source (e.g., <strong>in</strong>dustrial stack, cigarette, motorvehicle fleet, or household stove) <strong>and</strong> pollutant (e.g., CO orPM 2.5 ), <strong>the</strong> <strong>in</strong>take fraction is <strong>the</strong> cumulative mass <strong>in</strong>haledby <strong>the</strong> exposed population (e.g., <strong>the</strong> total population <strong>of</strong> acity or <strong>the</strong> children resid<strong>in</strong>g <strong>in</strong> a city) over a def<strong>in</strong>ed timeperiod divided by <strong>the</strong> total mass emitted over <strong>the</strong> sametime period.One <strong>of</strong> <strong>the</strong> most important factors affect<strong>in</strong>g <strong>the</strong> <strong>in</strong>takefraction is whe<strong>the</strong>r <strong>the</strong> pollutant is released with<strong>in</strong> a conf<strong>in</strong>edspace (<strong>in</strong>doors) or <strong>in</strong> an open environment (outdoors).Because people <strong>in</strong> developed countries, onaverage, spend more than 85% <strong>of</strong> <strong>the</strong>ir time <strong>in</strong>doors, pollutantsreleased <strong>in</strong>to occupied <strong>in</strong>door environments willproduce much higher exposures even if <strong>in</strong>door concentrationsare <strong>the</strong> same as outdoor concentrations. In mostcases, however, <strong>in</strong>door releases <strong>of</strong> pollutants (e.g., fromcook<strong>in</strong>g stoves or cigarettes) generate substantially high<strong>in</strong>door concentrations. Hav<strong>in</strong>g evaluated typical <strong>in</strong>takefractions for nonreactive air pollutants emitted <strong>in</strong> variousscenarios (e.g., <strong>in</strong>to a mov<strong>in</strong>g vehicle, <strong>in</strong>to a residence,from a ground-level l<strong>in</strong>e source [i.e., vehicular traffic]),Marshall <strong>and</strong> Nazar<strong>of</strong>f (2007) concluded that <strong>the</strong> typicaldifference <strong>in</strong> <strong>in</strong>take fraction between <strong>in</strong>door <strong>and</strong> outdoorreleases is about three orders <strong>of</strong> magnitude, <strong>in</strong>formallyreferred to as <strong>the</strong> rule <strong>of</strong> 1000. That is, regard<strong>in</strong>g pollutant<strong>in</strong>take, 1 gram <strong>of</strong> emissions <strong>in</strong>to <strong>in</strong>door environments isroughly equivalent to 1000 grams <strong>of</strong> emissions <strong>in</strong>to outdoorenvironments. This is consistent with <strong>the</strong> wellknownfact that for an air pollutant that has <strong>in</strong>doorsources, outdoor concentrations generally account for only69
<strong>Outdoor</strong> <strong>Air</strong> <strong>Pollution</strong> <strong>and</strong> <strong>Health</strong> <strong>in</strong> <strong>the</strong> Develop<strong>in</strong>g <strong>Countries</strong> <strong>of</strong> <strong>Asia</strong>a small fraction <strong>of</strong> <strong>the</strong> total exposure <strong>and</strong> thus generally arepoor predictors <strong>of</strong> total personal exposure.Even if two outdoor sources emit <strong>the</strong> same mass <strong>of</strong> pollutant,if one source is <strong>in</strong> a densely populated urban area<strong>and</strong> <strong>the</strong> o<strong>the</strong>r is <strong>in</strong> a remote rural area, <strong>the</strong> pollutantemitted by <strong>the</strong> urban source will have a substantiallyhigher <strong>in</strong>take fraction. Based on several estimates fromdeveloped countries, <strong>in</strong>take fractions are as low as 0.1 permillion people for outdoor emissions <strong>in</strong> remote rural areas,roughly 10 per million for near-ground outdoor emissions<strong>in</strong> urban areas, <strong>and</strong> approximately 5000 per million for<strong>in</strong>door releases <strong>in</strong> occupied build<strong>in</strong>gs (Marshall <strong>and</strong> Nazar<strong>of</strong>f2007). Such a large range <strong>of</strong> <strong>in</strong>take fractions is <strong>the</strong>result <strong>of</strong> <strong>the</strong> “three Ps”: population, proximity, <strong>and</strong> persistence,or <strong>the</strong> size <strong>of</strong> exposed population, <strong>the</strong> proximity <strong>of</strong><strong>the</strong> source to <strong>the</strong> exposed population, <strong>and</strong> <strong>the</strong> persistence<strong>of</strong> <strong>the</strong> pollutant <strong>in</strong> <strong>the</strong> atmosphere, respectively. Thesethree parameters can significantly affect <strong>the</strong> relation <strong>of</strong>emissions to exposure. More persistent pollutants aremore likely to be transported <strong>in</strong>to <strong>the</strong> atmosphere <strong>and</strong>reach more people. In contrast, pollutants that are veryreactive or readily scavenged via <strong>the</strong> processes <strong>of</strong> wet <strong>and</strong>dry deposition are less likely to affect people who are not<strong>in</strong> <strong>the</strong> immediate vic<strong>in</strong>ity <strong>of</strong> <strong>the</strong> emission source.Few studies have <strong>in</strong>voked <strong>the</strong> concept <strong>of</strong> <strong>in</strong>take fractionto evaluate source–<strong>in</strong>take relations <strong>in</strong> develop<strong>in</strong>g countries.However, developed <strong>and</strong> develop<strong>in</strong>g <strong>Asia</strong>n countriesdiffer greatly <strong>in</strong> <strong>the</strong> density <strong>and</strong> distribution <strong>of</strong> <strong>the</strong>ir populations,<strong>in</strong> source characteristics (especially those thataffect <strong>the</strong> proximity <strong>of</strong> sources to <strong>the</strong> population), <strong>and</strong> <strong>in</strong>time–activity patterns. For example, by evaluat<strong>in</strong>g 17power plants <strong>in</strong> Hunan prov<strong>in</strong>ce <strong>in</strong> Ch<strong>in</strong>a, Li <strong>and</strong> Hao(2003) estimated average <strong>in</strong>take fractions with<strong>in</strong> 500 km <strong>of</strong>sources as 9.73, 2.39, <strong>and</strong> 2.47 per million people for primaryf<strong>in</strong>e PM, SO 42, <strong>and</strong> NO 3, respectively. The estimatedPM <strong>in</strong>take fraction <strong>of</strong> 9.73 per million people is forPM emitted by coal-fired power plants. This Ch<strong>in</strong>ese estimateis 1 to 2 orders <strong>of</strong> magnitude higher than <strong>the</strong> fractionsestimated for U.S. coal-fired power plants <strong>and</strong> is similar to<strong>the</strong> fractions for U.S. near-ground urban emissions (Smith1993; Marshall <strong>and</strong> Nazar<strong>of</strong>f 2007). The <strong>in</strong>take fraction forCh<strong>in</strong>ese power plants is higher because more people livecloser to power plants <strong>the</strong>re than <strong>in</strong> <strong>the</strong> United States.Ano<strong>the</strong>r example <strong>of</strong> <strong>the</strong> fact that <strong>the</strong> proximity <strong>of</strong> <strong>the</strong>population to PM-emitt<strong>in</strong>g sources affects <strong>the</strong> source–<strong>in</strong>take relation is provided by an analysis <strong>of</strong> <strong>the</strong> majorsources <strong>of</strong> nonoccupational PM 10 exposures <strong>in</strong> Ch<strong>in</strong>a(Florig et al. 2002). Models <strong>of</strong> pollutant emissions,pollutant dispersion, <strong>the</strong> location <strong>of</strong> <strong>the</strong> population, <strong>and</strong><strong>the</strong> time–activity patterns <strong>of</strong> <strong>the</strong> population weredeveloped to estimate total PM 10 exposure for six majortypes <strong>of</strong> sources <strong>and</strong> four population subgroups <strong>in</strong> bothurban <strong>and</strong> rural sett<strong>in</strong>gs. The PM 10 sources evaluated wereETS, cook<strong>in</strong>g stoves, heat<strong>in</strong>g stoves, heat<strong>in</strong>g boilersserv<strong>in</strong>g entire urban districts, on-road vehicles, <strong>and</strong> coalfiredpower plants. The four subgroups considered werebased on age: preschool-aged children, schoolchildren,work<strong>in</strong>g adults, <strong>and</strong> older persons. For typical urban areaswith cold w<strong>in</strong>ters, residential heat<strong>in</strong>g systems were <strong>the</strong>most important source <strong>of</strong> exposure to PM 10 for all foursubgroups, followed by ETS, cook<strong>in</strong>g stoves, on-roadvehicles, <strong>and</strong> coal-fired power plants. In rural areas,cook<strong>in</strong>g <strong>and</strong> heat<strong>in</strong>g sources produced <strong>the</strong> largest PM 10exposures, with an additional, significant contribution byETS. Except for cook<strong>in</strong>g, <strong>the</strong>re was little source-to-sourcevariation <strong>in</strong> contributions across <strong>the</strong> subgroups. Exposures<strong>of</strong> preschool children <strong>and</strong> older persons to PM 10 fromcook<strong>in</strong>g stoves were approximately 45% <strong>and</strong> 30% higherthan those <strong>of</strong> schoolchildren <strong>and</strong> work<strong>in</strong>g adults,respectively, because preschool children <strong>and</strong> olderpersons spend more time <strong>in</strong> <strong>the</strong> cook<strong>in</strong>g area. This analysiswas designed to reflect <strong>the</strong> typical 1990s urban <strong>and</strong> rurallifestyles <strong>in</strong> Ch<strong>in</strong>a. However, <strong>the</strong> <strong>in</strong>creased use <strong>of</strong> naturalgas <strong>and</strong> LPG as cook<strong>in</strong>g fuels will likely have resulted <strong>in</strong>reduced PM 10 exposure, <strong>and</strong> <strong>the</strong> source rank<strong>in</strong>g forpopulation exposure to PM 10 today may be quite different,at least <strong>in</strong> urban areas. The PM 10 exposures from on-roadvehicles may be greater today as well, given <strong>the</strong> rapidgrowth <strong>in</strong> <strong>the</strong> number <strong>of</strong> motor vehicles.Underst<strong>and</strong><strong>in</strong>g source–<strong>in</strong>take relations (i.e., <strong>in</strong>take fractions)can provide useful <strong>in</strong>sights about <strong>the</strong> relationbetween ambient concentrations <strong>and</strong> exposure. Because<strong>the</strong> three Ps (population, proximity, <strong>and</strong> persistence) are<strong>the</strong> major factors that affect <strong>the</strong> <strong>in</strong>take fraction, <strong>the</strong>y can beused to evaluate <strong>the</strong> appropriateness <strong>of</strong> <strong>the</strong> selection <strong>of</strong>ambient monitor<strong>in</strong>g stations. To best capture a population’sexposure, monitor<strong>in</strong>g stations should be placed asclose as possible to where <strong>the</strong> exposed population spendsmost <strong>of</strong> its time.Urban ambient monitor<strong>in</strong>g stations are <strong>of</strong>ten selected torepresent “average” urban background concentrations <strong>of</strong>air pollution. In some cases, monitors are sited at putativehot spots to characterize worst-case scenarios. From anexposure st<strong>and</strong>po<strong>in</strong>t, urban background emissions areonly one component <strong>of</strong> a person’s total exposure. O<strong>the</strong>rcomponents <strong>in</strong>clude localized outdoor emissions (e.g.,emissions at bus term<strong>in</strong>als or roadside emissions), whichmay be captured by hot-spot monitors, or <strong>in</strong>door emissions(e.g., from stoves, ETS, or build<strong>in</strong>g materials) <strong>and</strong> emissionsfrom personal activities (e.g., smok<strong>in</strong>g, clean<strong>in</strong>g, orcook<strong>in</strong>g), which are not measured by ambient monitor<strong>in</strong>g.70
HEI International Scientific Oversight CommitteeLimitations <strong>of</strong> Ambient Pollutant Concentrations as aMetric <strong>of</strong> ExposureTime-series studies <strong>and</strong> o<strong>the</strong>r studies <strong>of</strong> <strong>the</strong> heal<strong>the</strong>ffects <strong>of</strong> air pollution <strong>of</strong>ten attempt to assess <strong>the</strong> impact <strong>of</strong>urban background air pollution by us<strong>in</strong>g average pollutantconcentrations that are measured at multiple fixed monitor<strong>in</strong>gstations across <strong>the</strong> city. In densely populated <strong>Asia</strong>ncities, monitor<strong>in</strong>g stations tend to be close to majorroadways. This placement results <strong>in</strong> record<strong>in</strong>g higher“average” ambient concentrations, ow<strong>in</strong>g to contributions<strong>of</strong> roadside emissions, than those obta<strong>in</strong>ed from monitorslocated far<strong>the</strong>r from major roadways. Therefore, a10-µg/m 3 change <strong>in</strong> an ambient pollutant concentrationmay represent quite different magnitudes <strong>of</strong> overallpopulation exposure <strong>in</strong> various cities, ow<strong>in</strong>g to vary<strong>in</strong>gdistances between monitor<strong>in</strong>g stations <strong>and</strong> majorroadways. This variation makes it difficult to directlycompare <strong>the</strong> effect estimates (i.e., <strong>the</strong> changes <strong>in</strong> relativerisk [RR] per 10-µg/m 3 change <strong>in</strong> pollutant concentration)<strong>of</strong> <strong>Asia</strong>n cities <strong>of</strong> vary<strong>in</strong>g population densities with <strong>the</strong>effect estimates <strong>of</strong> Western cities.Exposure to pollutants <strong>of</strong> outdoor orig<strong>in</strong> occurs whenpeople spend time outdoors <strong>and</strong> also when <strong>the</strong>y are<strong>in</strong>doors if pollutants enter <strong>the</strong> <strong>in</strong>door environment. Highpopulation densities force many people <strong>in</strong> develop<strong>in</strong>g<strong>Asia</strong>n cities to work or spend time outdoors at roadsides,where a mix <strong>of</strong> air pollution sources can be found: <strong>the</strong>urban motor-vehicle fleet, charcoal- or coal-burn<strong>in</strong>g stovesused by street-food vendors, as well as tuk-tuks (motorizedrickshaws) <strong>and</strong> motorcycles. People who work at roadsidesare exposed to <strong>the</strong> highest concentrations <strong>of</strong> outdoorair pollution for <strong>the</strong> longest time on a daily basis. Also,subst<strong>and</strong>ard residences along <strong>the</strong> roadsides are likely tohave cracks <strong>in</strong> <strong>the</strong> walls <strong>and</strong> broken or loose w<strong>in</strong>dows <strong>and</strong>doors, result<strong>in</strong>g <strong>in</strong> considerable penetration <strong>of</strong> outdoor airpollution <strong>in</strong>to <strong>the</strong> <strong>in</strong>door environment <strong>and</strong> subsequentexposure. This implies that <strong>the</strong> <strong>in</strong>take fraction fromground-level l<strong>in</strong>e sources (i.e., vehicular traffic) is probablymarkedly higher <strong>in</strong> cities <strong>in</strong> develop<strong>in</strong>g <strong>Asia</strong> than <strong>in</strong>Western cities (Lai et al. 2000).On <strong>the</strong> o<strong>the</strong>r h<strong>and</strong>, a grow<strong>in</strong>g number <strong>of</strong> modern build<strong>in</strong>gsthat <strong>in</strong>clude residences are be<strong>in</strong>g erected <strong>in</strong> <strong>Asia</strong>ncities. Modern build<strong>in</strong>gs are typically air-tight <strong>and</strong>equipped with air conditioners; thus, <strong>the</strong>y have a low rate<strong>of</strong> exchange <strong>of</strong> outdoor <strong>and</strong> <strong>in</strong>door air. People work<strong>in</strong>g orliv<strong>in</strong>g <strong>in</strong> new build<strong>in</strong>gs will be exposed to a smaller fraction<strong>of</strong> outdoor air pollution while stay<strong>in</strong>g <strong>in</strong>doors. Thisheterogeneity makes citywide average pollutant concentrationsless accurate representations <strong>of</strong> “average” populationexposure.Some 28–59% <strong>of</strong> people <strong>in</strong> <strong>Asia</strong>n cities are estimated tolive <strong>in</strong> urban slums (UN-Habitat 2003). Many households<strong>in</strong> <strong>the</strong>se areas rely on solid fuels (e.g., coal or wood) forcook<strong>in</strong>g, which may expose residents to high concentrations<strong>of</strong> <strong>in</strong>door air pollution <strong>in</strong> addition to <strong>the</strong>ir high roadsideexposures (HEI ISOC 2004). On <strong>the</strong> o<strong>the</strong>r h<strong>and</strong>,modern urban residences <strong>in</strong> <strong>Asia</strong>n cities, <strong>in</strong> general, usemodern fuels (e.g., electricity, natural gas, or LPG) that aresubstantially cleaner than solid fuels. Therefore, exposuresresult<strong>in</strong>g from <strong>in</strong>door air pollution may vary substantiallyacross households with<strong>in</strong> a city (Mestl et al. 2007). Giventhat <strong>the</strong> gap between people liv<strong>in</strong>g <strong>in</strong> poverty <strong>and</strong> peoplewith wealth seems to be <strong>in</strong>creas<strong>in</strong>g cont<strong>in</strong>uously <strong>in</strong> manycities <strong>in</strong> develop<strong>in</strong>g countries, this <strong>in</strong>equality <strong>in</strong> urban airpollution exposure may not dim<strong>in</strong>ish for some time. Such<strong>in</strong>equality also has important implications for us<strong>in</strong>g citywideaverages <strong>of</strong> ambient pollutant concentrations <strong>in</strong>studies <strong>of</strong> <strong>the</strong> health effects <strong>of</strong> air pollution, because<strong>in</strong>door emissions from solid fuel, as well as roadside emissions,have substantially higher <strong>in</strong>take fractions than backgroundemissions from urban outdoor sources. Theassumption <strong>of</strong> a constant relation between source <strong>and</strong><strong>in</strong>take (or ambient concentration <strong>and</strong> <strong>in</strong>take) for <strong>the</strong> entirepopulation with<strong>in</strong> a city may be reasonable <strong>in</strong> Westerncities where high roadside <strong>and</strong> <strong>in</strong>door solid-fuel exposuresappear to affect few people, but <strong>the</strong> situation is clearly different<strong>in</strong> many develop<strong>in</strong>g <strong>Asia</strong>n cities.POLICY ISSUES IN AIR QUALITY MANAGEMENTActions Taken to Reduce <strong>Air</strong> <strong>Pollution</strong><strong>Countries</strong> throughout <strong>Asia</strong> have taken action to address<strong>the</strong> problem <strong>of</strong> air pollution over <strong>the</strong> past decade. This actionwas prompted by <strong>the</strong> development <strong>of</strong> monitor<strong>in</strong>g systemsthat document air pollution concentrations (albeit withwidely vary<strong>in</strong>g comprehensiveness <strong>and</strong> sophistication) <strong>and</strong>grow<strong>in</strong>g public awareness <strong>of</strong> <strong>the</strong> high concentrations <strong>of</strong> airpollution experienced <strong>in</strong> everyday life, especially <strong>in</strong> congestedcities.Many <strong>Asia</strong>n countries have adopted National Ambient<strong>Air</strong> Quality St<strong>and</strong>ards (NAAQS) for several air pollutants,such as SO 2 , PM, <strong>and</strong>, <strong>in</strong> some cases, O 3 (Figure 30). Somecountries, such as India, have now begun to reconsider<strong>the</strong>ir st<strong>and</strong>ards <strong>in</strong> light <strong>of</strong> current air quality guidel<strong>in</strong>es <strong>of</strong><strong>the</strong> WHO (Sidebar 11).In addition, some countries have begun to reduce emissionsfrom specific sources, most notably motor vehicles,<strong>in</strong>dustries, <strong>and</strong> electricity-generat<strong>in</strong>g facilities (seewww.cleanairnet.org/caiasia/1412/channel.html). Forexample, many <strong>Asia</strong>n countries now require that newautomobiles sold meet m<strong>in</strong>imum st<strong>and</strong>ards equivalent to71
<strong>Outdoor</strong> <strong>Air</strong> <strong>Pollution</strong> <strong>and</strong> <strong>Health</strong> <strong>in</strong> <strong>the</strong> Develop<strong>in</strong>g <strong>Countries</strong> <strong>of</strong> <strong>Asia</strong>Figure 30. Timetable for emissions st<strong>and</strong>ards for new light-duty vehicles <strong>in</strong> <strong>Asia</strong> (as <strong>of</strong> April 2009). European Union (top row) is provided for comparison.[Data compiled from CAI-<strong>Asia</strong> 2007b.]72
HEI International Scientific Oversight CommitteeSidebar 11. THE WHO AIR QUALITY GUIDELINESIn October 2006, <strong>the</strong> WHO issued its new air quality guidel<strong>in</strong>es(Table 11.1), which suggest that reduc<strong>in</strong>g concentrations <strong>of</strong>one pollutant — PM 10 — could reduce deaths <strong>in</strong> polluted citiesby as much as 15% every year (WHO 2006b). The 2006 WHOguidel<strong>in</strong>es were <strong>the</strong> first to address all regions <strong>of</strong> <strong>the</strong> world.They are more restrictive than <strong>the</strong> national st<strong>and</strong>ards currentlyapplied <strong>in</strong> most <strong>of</strong> <strong>Asia</strong>, <strong>and</strong> <strong>the</strong>ir application <strong>in</strong> some citieswould mean reduc<strong>in</strong>g current pollution concentrations bymore than two thirds. For example, <strong>in</strong> many cities <strong>of</strong> develop<strong>in</strong>gcountries, <strong>the</strong> average annual PM 10 concentrations (<strong>the</strong>ma<strong>in</strong> source <strong>of</strong> which is <strong>the</strong> burn<strong>in</strong>g <strong>of</strong> fossil <strong>and</strong> o<strong>the</strong>r fuels)exceed 70 µg/m 3 , <strong>and</strong> <strong>in</strong> <strong>Asia</strong>, <strong>the</strong> concentrations can be substantiallyhigher. To prevent adverse health effects, <strong>the</strong> WHOguidel<strong>in</strong>e for PM 10 is set at 20 µg/m 3 .The guidel<strong>in</strong>es were based on <strong>the</strong> latest scientific evidence <strong>and</strong>set targets for air quality that would protect <strong>the</strong> large majority <strong>of</strong><strong>in</strong>dividuals from <strong>the</strong> health effects <strong>of</strong> air pollution. They wereestablished after consultation with more than 80 expert scientists,<strong>and</strong> reviews <strong>of</strong> thous<strong>and</strong>s <strong>of</strong> recent studies, from allregions <strong>of</strong> <strong>the</strong> world. As such, <strong>the</strong> guidel<strong>in</strong>es present <strong>the</strong> mostwidely agreed on <strong>and</strong> up-to-date assessment <strong>of</strong> health effects<strong>of</strong> air pollution, recommend<strong>in</strong>g targets for air quality at whichhealth risks are significantly reduced. However, it should be recognizedthat <strong>the</strong>se guidel<strong>in</strong>es are not levels <strong>of</strong> absolute safety.The underly<strong>in</strong>g scientific evidence <strong>in</strong>dicates adverse heal<strong>the</strong>ffects at levels throughout <strong>the</strong> range <strong>of</strong> ambient concentrations<strong>in</strong> <strong>the</strong> guidel<strong>in</strong>es, suggest<strong>in</strong>g that effects also occur at concentrationsbelow <strong>the</strong> strictest guidel<strong>in</strong>es.Recogniz<strong>in</strong>g <strong>the</strong> need for governments to set national st<strong>and</strong>ardsaccord<strong>in</strong>g to <strong>the</strong>ir own particular circumstances, <strong>the</strong>WHO guidel<strong>in</strong>es provide <strong>the</strong> basis for all countries to build<strong>the</strong>ir own air quality st<strong>and</strong>ards <strong>and</strong> health policies accord<strong>in</strong>g tosolid, scientific evidence. Specifically, <strong>the</strong> guidel<strong>in</strong>es proposeprogressively strict <strong>in</strong>terim targets <strong>and</strong> milestones to achievebetter air quality. The guidel<strong>in</strong>es <strong>and</strong> <strong>in</strong>terim targets aim toallow countries to measure <strong>the</strong>ir distance from <strong>the</strong>se objectives<strong>and</strong> estimate <strong>the</strong> health impacts <strong>of</strong> current pollution concentrations<strong>and</strong> <strong>the</strong> health ga<strong>in</strong>s achieved by reduc<strong>in</strong>g <strong>the</strong>m.Table 11.1. WHO <strong>Air</strong> Quality Guidel<strong>in</strong>es aPollutant <strong>and</strong>Averag<strong>in</strong>g TimeGuidel<strong>in</strong>ePM 2.51 Year 10 µg/m 324 Hours (99th percentile) 20 µg/m 3PM 101 Year 20 µg/m 324 Hours (99th percentile) 50 µg/m 3O 38Hours, daily maximum 100 µg/m 3NO 21 Year 40 µg/m 31 Hour 200 µg/m 3SO 224 Hours 20 µg/m 310 M<strong>in</strong>utes 500 µg/m 3a Data compiled from WHO 2006a.Euro 1 st<strong>and</strong>ards; several countries also require or areplann<strong>in</strong>g to require compliance with more advanced Europeanst<strong>and</strong>ards (Table 10). S<strong>in</strong>ce 2001, <strong>the</strong>se efforts havebeen augmented by <strong>the</strong> formation <strong>of</strong> CAI-<strong>Asia</strong>, which wasorganized with assistance from <strong>the</strong> <strong>Asia</strong>n DevelopmentBank <strong>and</strong> <strong>the</strong> World Bank to promote shar<strong>in</strong>g <strong>of</strong> technicaladvice among regulatory agencies, <strong>in</strong>dustries, nongovernmentalorganizations, <strong>and</strong> o<strong>the</strong>r key stakeholders <strong>in</strong> <strong>Asia</strong>.In addition, municipal fuel-switch<strong>in</strong>g programs for publictransitfleets have been shown to reduce concentrations <strong>of</strong>urban air pollutants. In Delhi, for example, switch<strong>in</strong>g toCNG has resulted <strong>in</strong> both local air quality improvements<strong>and</strong> reductions <strong>in</strong> emissions related to climate change, anexample <strong>of</strong> a co-benefit (Reynolds <strong>and</strong> K<strong>and</strong>likar 2008).Relocation <strong>of</strong> <strong>in</strong>dustries away from populated city centers,<strong>and</strong> <strong>in</strong> some cases <strong>the</strong>ir replacement with cleaner<strong>in</strong>dustrial processes, has also been an effective mechanism<strong>of</strong> manag<strong>in</strong>g urban air quality — for example, <strong>in</strong> Dalian,Ch<strong>in</strong>a (Bai 2002) — <strong>and</strong> was a major component, along withtraffic restriction, <strong>of</strong> <strong>the</strong> actions taken to improve air quality<strong>in</strong> Beij<strong>in</strong>g <strong>in</strong> preparation for <strong>the</strong> 2008 Olympic games(Sidebar 12). Relocation that is not accompanied by o<strong>the</strong>rstrategies to reduce emissions may result <strong>in</strong> <strong>the</strong> transformation<strong>of</strong> a local air quality problem <strong>in</strong>to a regional concern,<strong>and</strong> reductions <strong>in</strong> exposure may not be susta<strong>in</strong>ed if urbangrowth eventually occurs at <strong>the</strong> relocation site.Actions to improve air quality have resulted <strong>in</strong> measurabledecl<strong>in</strong>es <strong>in</strong> <strong>the</strong> concentrations <strong>of</strong> some pollutants73
<strong>Outdoor</strong> <strong>Air</strong> <strong>Pollution</strong> <strong>and</strong> <strong>Health</strong> <strong>in</strong> <strong>the</strong> Develop<strong>in</strong>g <strong>Countries</strong> <strong>of</strong> <strong>Asia</strong>Table 10. PM St<strong>and</strong>ards <strong>in</strong> <strong>Asia</strong> aPM 10 (µg/m 3 ) PM 2.5 (µg/m 3 )Location1 Hr 24 Hr 1 Yr 24 Hr 1 YrSt<strong>and</strong>ards for Comparison, 2006WHO — 50 20 25 10European Union — 50 40 — —U.S. EPA — 150 — 35 15Country or City St<strong>and</strong>ards, 2007Afghanistan — — — — —Bangladesh — 150 50 65 15Bhutan — — — — —Cambodia — — — — —Hong Kong — 180 55 — —India b — 100 60 — —Indonesia — 150 — — —Japan 200 100 — — —Laos — — — — —Malaysia — 150 50 — —Mongolia — — — — —Nepal —120— — —Pakistan — — — — —Ch<strong>in</strong>a c — 150 100 — —South Korea — 150 70 — —S<strong>in</strong>gapore — 150 50 65 15Sri Lanka — — — — —Thail<strong>and</strong> — 120 50 — —Vietnam — 150 50 — —a Adapted from CAI-<strong>Asia</strong> 2007c. The PM concentrations are current as <strong>of</strong> July 10, 2007, unless o<strong>the</strong>rwise stated. WHO, European Union, <strong>and</strong> U.S.EPA st<strong>and</strong>ards (updated on December 17, 2006) are given for comparison.b Indian st<strong>and</strong>ards are for residential, rural, <strong>and</strong> “o<strong>the</strong>r” areas.c Ch<strong>in</strong>ese st<strong>and</strong>ards are based on <strong>the</strong> Class 2 category.74
HEI International Scientific Oversight CommitteeSidebar 12. AIR POLLUTION REDUCTION DURING THE 2008 BEIJING OLYMPICSBeij<strong>in</strong>g, capital <strong>of</strong> Ch<strong>in</strong>a, is regarded as one <strong>of</strong> <strong>the</strong> world’smost-polluted cities. From 2000 to 2007, a large proportion <strong>of</strong>days each year were considered days on which air qualityguidel<strong>in</strong>es were not atta<strong>in</strong>ed (Table 12.1). Dur<strong>in</strong>g this periodBeij<strong>in</strong>g, as well as Ch<strong>in</strong>a as a whole, experienced susta<strong>in</strong>ed<strong>and</strong> rapid economic growth. Despite <strong>the</strong> fact that <strong>the</strong> number<strong>of</strong> motor vehicles <strong>in</strong> Beij<strong>in</strong>g more than doubled from 2000 to2007, <strong>the</strong> number <strong>of</strong> days <strong>of</strong> atta<strong>in</strong>ment <strong>of</strong> air-quality guidel<strong>in</strong>eshas been <strong>in</strong>creas<strong>in</strong>g every year (from 177 days <strong>in</strong> 2000 to246 days <strong>in</strong> 2007). This <strong>in</strong>crease is due to many actions to controlair pollution, <strong>in</strong>clud<strong>in</strong>g <strong>the</strong> closure or relocation <strong>of</strong> high-pollut<strong>in</strong>g<strong>in</strong>dustrial facilities (e.g., oil ref<strong>in</strong>eries <strong>and</strong> steel-mak<strong>in</strong>gfactories); <strong>the</strong> change from a coal-based energy <strong>in</strong>frastructureto natural gas pipel<strong>in</strong>es, result<strong>in</strong>g <strong>in</strong> <strong>the</strong> phase-out <strong>of</strong>numerous coal-fired boilers <strong>and</strong> domestic stoves; <strong>the</strong> control<strong>of</strong> w<strong>in</strong>d-blown dust from construction sites; <strong>the</strong> implementation<strong>of</strong> stricter vehicle-emission st<strong>and</strong>ards; <strong>the</strong> replacement <strong>of</strong>older fleets <strong>of</strong> buses, passenger cars, <strong>and</strong> trucks with newer<strong>and</strong> cleaner fleets; <strong>and</strong> <strong>the</strong> <strong>in</strong>stallation or upgrade <strong>of</strong> stackemission-control devices <strong>in</strong> power plants.However, before <strong>the</strong> 2008 Beij<strong>in</strong>g Olympics, ambient concentrations<strong>of</strong> common pollutants were still far above healthbasedst<strong>and</strong>ards <strong>and</strong> several times as high as concentrationstypically measured <strong>in</strong> cities <strong>in</strong> developed countries. This situationcaused serious concerns <strong>in</strong> <strong>the</strong> <strong>in</strong>ternational communityabout <strong>the</strong> health <strong>and</strong> performance <strong>of</strong> Olympic athletes. Extensivemedia coverage <strong>of</strong> this topic preceded <strong>the</strong> commencement<strong>of</strong> <strong>the</strong> Beij<strong>in</strong>g Olympics.To ensure reasonably good air quality dur<strong>in</strong>g <strong>the</strong> Olympics(held from August 8–24, 2008) <strong>and</strong> <strong>the</strong> Paralympics (fromSeptember 6–16, 2008), <strong>the</strong> Ch<strong>in</strong>ese government launched aseries <strong>of</strong> aggressive measures to reduce pollutant emissions<strong>in</strong> Beij<strong>in</strong>g <strong>and</strong> <strong>the</strong> surround<strong>in</strong>g areas for a period <strong>of</strong> more than2 months, <strong>in</strong>clud<strong>in</strong>g <strong>the</strong> time <strong>of</strong> <strong>the</strong> games. Start<strong>in</strong>g on July 1,2008, all vehicles that failed to meet <strong>the</strong> Euro 1 st<strong>and</strong>ards forexhaust emissions were banned from travel<strong>in</strong>g on Beij<strong>in</strong>g’sroads. M<strong>and</strong>atory restrictions for private vehicles were <strong>in</strong>effect from July 20 through September 20. Dur<strong>in</strong>g this period,private vehicles <strong>in</strong> Beij<strong>in</strong>g were permitted to be driven everyo<strong>the</strong>r day (with <strong>the</strong> day assigned on <strong>the</strong> basis <strong>of</strong> whe<strong>the</strong>r <strong>the</strong>license-plate number was odd or even), with a slight relaxation<strong>of</strong> this control measure dur<strong>in</strong>g <strong>the</strong> Paralympics, when privatecars could be used without restriction outside <strong>the</strong> Sixth R<strong>in</strong>gRoad. As a result, traffic on <strong>the</strong> Sixth R<strong>in</strong>g Road was reducedby 32% on average <strong>in</strong> August as compared with June, lead<strong>in</strong>gto a decrease <strong>of</strong> vehicular emissions <strong>of</strong> various pollutants(such as CO, NO x , VOCs, <strong>and</strong> PM 10 ) by about 50%, as estimatedfrom roadside emissions data collected by a researchteam at Ts<strong>in</strong>ghua University.The control actions were not limited to traffic emissions.Dur<strong>in</strong>g <strong>the</strong> same period, o<strong>the</strong>r area <strong>and</strong> po<strong>in</strong>t sources <strong>in</strong>Beij<strong>in</strong>g were placed under strict control. Several heavy-pollut<strong>in</strong>gfactories were m<strong>and</strong>ated to reduce levels <strong>of</strong> operation orcompletely shut down dur<strong>in</strong>g <strong>the</strong> games, with approximately50% <strong>of</strong> <strong>the</strong> <strong>in</strong>dustrial boilers halted. Construction activitieswere all paused, gasol<strong>in</strong>e stations were renovated to m<strong>in</strong>imizegasol<strong>in</strong>e evaporation, <strong>and</strong> pa<strong>in</strong>t<strong>in</strong>g activities <strong>in</strong> <strong>the</strong> furnituremak<strong>in</strong>g<strong>and</strong> car-mak<strong>in</strong>g <strong>in</strong>dustries were restricted. Powerplants <strong>in</strong> Beij<strong>in</strong>g were required to reduce <strong>the</strong>ir emissions by30% from <strong>the</strong>ir June levels, even if <strong>the</strong>y had already met <strong>the</strong>Ch<strong>in</strong>ese emission st<strong>and</strong>ards. The smokestacks <strong>of</strong> selectedpower plants were monitored by <strong>the</strong> Ts<strong>in</strong>ghua Universityresearchers to verify <strong>the</strong> effectiveness <strong>of</strong> <strong>the</strong> control policies.Emission controls on large <strong>in</strong>dustrial sources were alsoapplied <strong>in</strong> Tianj<strong>in</strong> <strong>and</strong> surround<strong>in</strong>g prov<strong>in</strong>ces (e.g., Inner Mongolia,Shanxi, Hebei, <strong>and</strong> Sh<strong>and</strong>ong). The Ts<strong>in</strong>ghua researchteam estimated that, as a result <strong>of</strong> all <strong>the</strong> emission-reductionCont<strong>in</strong>ued on next pageTable 12.1. Atta<strong>in</strong>ment <strong>of</strong> Ch<strong>in</strong>ese <strong>Air</strong> Quality Guidel<strong>in</strong>es <strong>and</strong> Annual Mean Concentrations <strong>of</strong> Pollutants <strong>in</strong> Beij<strong>in</strong>g,2000–2007 aYearAtta<strong>in</strong>ment Daysn (% <strong>of</strong> year)PM 10(µg/m 3 )SO 2(µg/m 3 )NO 2(µg/m 3 )CO(mg/m 3 )2000 177 (48.5) 162 71 71 2.72001 185 (50.7) 165 64 71 2.62002 203 (55.6) 166 67 76 2.52003 224 (61.4) 141 61 72 2.42004 229 (62.7) 149 55 72 2.22005 234 (64.1) 142 50 66 2.02006 241 (66.0) 161 53 66 2.12007 246 (67.4) 148 47 66 2.0a From J Zhang (personal communication, 2009).75
<strong>Outdoor</strong> <strong>Air</strong> <strong>Pollution</strong> <strong>and</strong> <strong>Health</strong> <strong>in</strong> <strong>the</strong> Develop<strong>in</strong>g <strong>Countries</strong> <strong>of</strong> <strong>Asia</strong>Sidebar 12: AIR POLLUTION REDUCTION DURING THE 2008 BEIJING OLYMPICS (Cont<strong>in</strong>ued)Table 12.2. Means (±SD) <strong>of</strong> 24-Hour Average Concentrations <strong>of</strong> Pollutants Measured Before <strong>and</strong> Dur<strong>in</strong>g <strong>the</strong> 2008Beij<strong>in</strong>g Olympics at a Site <strong>in</strong> Central Beij<strong>in</strong>g aPollutantConcentration BeforeOlympics (June 26–July 6)Concentration Dur<strong>in</strong>gOlympics (August 8–24)PercentChangePM 2.5 (µg/m 3 ) 96.9 ± 60.4 44.6 ± 30.4 54SO 2 (ppb) 9.6 ± 9.1 5.9 ± 13.3 39NO (ppb) 5.0 ± 2.5 1.8 ± 0.8 64NO 2 (ppb) 27.4 ± 9.7 12.1 ± 2.1 56NO x (ppb) 32.1 ± 12.8 13.7 ± 2.6 57CO (ppm) 1.3 ± 0.64 0.6 ± 0.20 55O 3 (ppb) 32.2 ± 27.5 38.3 ± 15.6 + 19O 3 (ppb, 1-hr maximum) 57.6 ± 34.9 81.3 ± 28.1 + 41a From J Zhang (personal communication, 2009).measures, total emissions <strong>of</strong> NO x , SO 2 , VOCs, PM 10 werereduced from <strong>the</strong>ir concentrations dur<strong>in</strong>g <strong>the</strong> same period <strong>in</strong>2007 by 55%, 58%, 59%, <strong>and</strong> 61%, respectively.These emission reductions were directly reflected <strong>in</strong> markedlyreduced ambient concentrations <strong>of</strong> common pollutants. On<strong>the</strong> basis <strong>of</strong> data from <strong>the</strong> Measurement <strong>of</strong> <strong>Pollution</strong> <strong>in</strong> <strong>the</strong> Troposphere(MOPITT) sensor on <strong>the</strong> Terra satellite <strong>of</strong> <strong>the</strong> U.S.National Aeronautics <strong>and</strong> Space Adm<strong>in</strong>istration (NASA), <strong>the</strong>rewas a decrease <strong>in</strong> CO concentrations by approximately 20%<strong>and</strong> <strong>in</strong> NO 2 concentrations by approximately 50% <strong>in</strong> Beij<strong>in</strong>gdur<strong>in</strong>g August 2008 as compared with <strong>the</strong> average for August2005, 2006, <strong>and</strong> 2007 (NASA 2009). In <strong>the</strong> <strong>Health</strong> Effects <strong>of</strong><strong>Air</strong> <strong>Pollution</strong> Reduction Trial (HEART) — c<strong>of</strong>unded by HEI <strong>and</strong><strong>the</strong> U.S. National Institute <strong>of</strong> Environmental <strong>Health</strong> SciencesInstitute, National Institutes <strong>of</strong> <strong>Health</strong> — researchers fromPek<strong>in</strong>g University <strong>and</strong> <strong>the</strong> University <strong>of</strong> Medic<strong>in</strong>e <strong>and</strong> Dentistry<strong>of</strong> New Jersey measured ambient concentrations <strong>of</strong> air pollutantsat a monitor<strong>in</strong>g site located <strong>in</strong> central Beij<strong>in</strong>g. Prelim<strong>in</strong>aryresults (Table 12.2) showed that concentrations <strong>of</strong> PM 2.5 ,NO 2 , NO x , SO 2 , <strong>and</strong> CO dur<strong>in</strong>g <strong>the</strong> Olympics were 54%, 56%,57%, 39%, <strong>and</strong> 55% lower than <strong>the</strong> respective concentrationsbefore <strong>the</strong> Olympics.The only pollutant with <strong>in</strong>creased concentrations dur<strong>in</strong>g <strong>the</strong>Olympics was O 3 , for which <strong>the</strong> 24-hour average <strong>and</strong> 1-hourmaximum concentrations <strong>in</strong>creased (Table 12.1). Despite <strong>the</strong><strong>in</strong>crease, O 3 concentrations at <strong>the</strong> HEART site were below both<strong>the</strong> Ch<strong>in</strong>ese air quality st<strong>and</strong>ard <strong>and</strong> <strong>the</strong> U.S. air quality st<strong>and</strong>arddur<strong>in</strong>g <strong>the</strong> Olympics. The <strong>in</strong>crease <strong>in</strong> O 3 was due to <strong>the</strong>so-called NO-titration phenomenon <strong>in</strong> urban areas. Nitric oxide(NO) reacts rapidly with O 3 , serv<strong>in</strong>g as an effective O 3 s<strong>in</strong>k.Dur<strong>in</strong>g <strong>the</strong> Olympics, <strong>the</strong> major source <strong>of</strong> NO, motor-vehicleCont<strong>in</strong>ued on next page76
HEI International Scientific Oversight CommitteeSidebar 12: AIR POLLUTION REDUCTION DURING THE 2008 BEIJING OLYMPICS (Cont<strong>in</strong>ued)emissions, was reduced substantially at <strong>the</strong> study site,result<strong>in</strong>g <strong>in</strong> a 64% reduction <strong>in</strong> <strong>the</strong> NO concentration. Thisf<strong>in</strong>d<strong>in</strong>g should be <strong>in</strong>terpreted with caution, however. O 3 , a secondarypollutant result<strong>in</strong>g from photochemical reactions <strong>in</strong> <strong>the</strong>atmosphere, typically has large temporal <strong>and</strong> spatial variability.For example, measurements made at a suburban Beij<strong>in</strong>g siteby <strong>the</strong> Ts<strong>in</strong>ghua University research team showed that O 3 concentrationswere reduced dur<strong>in</strong>g <strong>the</strong> Olympics as comparedwith O 3 concentrations measured <strong>in</strong> June <strong>and</strong> July 2008 (datanot shown) <strong>and</strong> concentrations measured <strong>in</strong> June <strong>and</strong> July <strong>in</strong>both 2006 <strong>and</strong> 2007 (see Table 12.3). More careful spatial<strong>and</strong> temporal analyses <strong>of</strong> O 3 are needed to better underst<strong>and</strong>this complex pollutant <strong>and</strong> o<strong>the</strong>r secondary pollutants.In general, <strong>the</strong> data from <strong>the</strong> suburban monitor<strong>in</strong>g site collectedby <strong>the</strong> Ts<strong>in</strong>ghua University research team showed similarresults for pollutants o<strong>the</strong>r than O 3 (Table 12.3). In addition toconcentrations <strong>of</strong> PM 2.5 , CO, <strong>and</strong> NO x , those <strong>of</strong> black carbon(BC) <strong>and</strong> total carbon <strong>in</strong> PM 2.5 were significantly lower dur<strong>in</strong>g<strong>the</strong> Olympics than <strong>the</strong>ir average concentrations before <strong>the</strong>games. The degree <strong>of</strong> <strong>the</strong> observed reductions exceed <strong>the</strong>reductions that would be expected on <strong>the</strong> basis <strong>of</strong> meteorologicvariation alone, confirm<strong>in</strong>g <strong>the</strong> effectiveness <strong>of</strong> <strong>the</strong> emissionreductionmeasures implemented <strong>in</strong> Beij<strong>in</strong>g dur<strong>in</strong>g <strong>the</strong> Olympics<strong>and</strong> Paralympics.Whe<strong>the</strong>r <strong>the</strong> drastic reduction <strong>in</strong> air pollution dur<strong>in</strong>g <strong>the</strong> Beij<strong>in</strong>gOlympics resulted <strong>in</strong> improved health is an important questionregard<strong>in</strong>g <strong>the</strong> accountability <strong>of</strong> <strong>the</strong> control policies used. InHEART, physiologic <strong>and</strong> molecular changes are be<strong>in</strong>g measured<strong>in</strong> Beij<strong>in</strong>g residents <strong>in</strong> relation to air pollution changes. It ishypo<strong>the</strong>sized that cleaner air dur<strong>in</strong>g <strong>the</strong> Beij<strong>in</strong>g Olympics directlytranslated <strong>in</strong>to reduced oxidative stress, reduced levels <strong>of</strong> pulmonary<strong>and</strong> systemic <strong>in</strong>flammation, <strong>and</strong> improved cardiovascularfunction (represented by various biomarkers). Confirmation <strong>of</strong>this hypo<strong>the</strong>sis will provide objective <strong>and</strong> direct evidence <strong>of</strong> <strong>the</strong>improvement <strong>of</strong> public health by means <strong>of</strong> air pollution <strong>in</strong>terventions.HEART will also provide evidence to support or refuteseveral prom<strong>in</strong>ent hypo<strong>the</strong>ses concern<strong>in</strong>g <strong>the</strong> biological mechanism<strong>of</strong> health effects <strong>of</strong> air pollution.12.3. Changes <strong>in</strong> Ambient Concentrations <strong>of</strong> PollutantsMeasured at a Site <strong>in</strong> Suburban Beij<strong>in</strong>g Dur<strong>in</strong>g <strong>the</strong>Olympics <strong>and</strong> Paralympics Compared with Before <strong>the</strong>Olympics (Basel<strong>in</strong>e) aPollutantPercent Change from Basel<strong>in</strong>eConcentration bOlympicsAugust 8–24,2008ParalympicsSeptember 6–17,2008PM 2.5 40 28BC 37 21O 3 34 23Total carboncomponent <strong>of</strong> PM c 2.5CO cNO c xa From J Zhang (personal communication, 2009).455053b Basel<strong>in</strong>e concentration is <strong>the</strong> average <strong>of</strong> <strong>the</strong> concentrations from June20 through July 20, 2008, except for O 3 (a secondary pollutant withnatural month-to-month variations), for which <strong>the</strong> basel<strong>in</strong>econcentration is <strong>the</strong> average <strong>of</strong> <strong>the</strong> concentrations from June 20 throughJuly 20 <strong>in</strong> both 2006 <strong>and</strong> 2007.c The periods for total carbon, CO, <strong>and</strong> NO x are from basel<strong>in</strong>e to ei<strong>the</strong>rAugust or September 2008.77
<strong>Outdoor</strong> <strong>Air</strong> <strong>Pollution</strong> <strong>and</strong> <strong>Health</strong> <strong>in</strong> <strong>the</strong> Develop<strong>in</strong>g <strong>Countries</strong> <strong>of</strong> <strong>Asia</strong>Figure 31. Decl<strong>in</strong>es <strong>in</strong> air pollution levels <strong>in</strong> <strong>Asia</strong>, 1992–2006, due to air quality management <strong>and</strong> substantial economic growth. [Adapted with permissionfrom CAI-<strong>Asia</strong> 2008b.]even dur<strong>in</strong>g a period <strong>of</strong> substantial economic growth <strong>in</strong><strong>Asia</strong> (Figure 31). In countries that have removed lead fromgasol<strong>in</strong>e, both exposures to lead <strong>and</strong> blood lead levels <strong>in</strong>children <strong>and</strong> o<strong>the</strong>r exposed groups have decl<strong>in</strong>ed markedly(e.g., Vichit-Vadakan <strong>and</strong> Sasivimolkul 2002). Inmany areas, efforts to control sulfur concentrations <strong>in</strong> fuel<strong>and</strong> to reduce emissions from coal-burn<strong>in</strong>g <strong>in</strong>dustries <strong>and</strong>electricity-generat<strong>in</strong>g facilities have resulted <strong>in</strong> evenlonger-term reductions <strong>in</strong> ambient SO 2 concentrations(Hedley et al. 2002). And <strong>in</strong> some locations (e.g., Bangkok),comprehensive programs target<strong>in</strong>g motor vehicles <strong>and</strong>o<strong>the</strong>r sources have resulted <strong>in</strong> substantial reductions <strong>in</strong>concentrations <strong>of</strong> several pollutants that were historicallyvery high.Cont<strong>in</strong>u<strong>in</strong>g ChallengesDespite this progress, however, considerable challenges toimprov<strong>in</strong>g air quality <strong>in</strong> <strong>Asia</strong> rema<strong>in</strong>. Few <strong>Asia</strong>n countrieshave systematic air quality management programs to setst<strong>and</strong>ards, identify actions to meet those st<strong>and</strong>ards, implementthose actions, <strong>and</strong> <strong>the</strong>n monitor <strong>the</strong> air quality todeterm<strong>in</strong>e whe<strong>the</strong>r <strong>the</strong> actions have been successful (CAI-<strong>Asia</strong> Center 2004).Although st<strong>and</strong>ards for new models <strong>of</strong> motor vehicleshave been tightened, a substantial number <strong>of</strong> older, highemitt<strong>in</strong>gmotor vehicles are still operat<strong>in</strong>g <strong>in</strong> most <strong>of</strong> <strong>Asia</strong>.In addition, <strong>the</strong> quality <strong>of</strong> automotive fuel cont<strong>in</strong>ues to bea barrier to retr<strong>of</strong>itt<strong>in</strong>g air pollution controls onto exist<strong>in</strong>gvehicles or apply<strong>in</strong>g <strong>the</strong> best available controls to newdesigns. Reduc<strong>in</strong>g emissions from exist<strong>in</strong>g sources willrequire extensive <strong>in</strong>terventions: ma<strong>in</strong>tenance <strong>and</strong> <strong>in</strong>spectionprograms, enhanced fuels to reduce emissions, retr<strong>of</strong>itt<strong>in</strong>gwith control technologies, <strong>and</strong> use <strong>of</strong> alternativefuels <strong>and</strong> technologies. In addition, <strong>the</strong> rapid growth <strong>of</strong>motor-vehicle fleets <strong>in</strong> many <strong>Asia</strong>n countries, <strong>and</strong> <strong>the</strong>advent <strong>of</strong> even cheaper vehicle alternatives (e.g., <strong>the</strong>78
HEI International Scientific Oversight Committee1-lakh [approximately U.S. $2500] car <strong>in</strong> India), will <strong>of</strong>fsetat least some <strong>of</strong> <strong>the</strong> ga<strong>in</strong>s made, unless <strong>the</strong> growth isaccompanied by cont<strong>in</strong>u<strong>in</strong>g enhancement <strong>and</strong> upgrad<strong>in</strong>g<strong>of</strong> st<strong>and</strong>ards for fuels <strong>and</strong> vehicles. A recent, extensivepolicy analysis by CAI-<strong>Asia</strong> — A Roadmap for CleanerFuels <strong>and</strong> Vehicles <strong>in</strong> <strong>Asia</strong> — lays out <strong>the</strong> many opportunitiesfor cont<strong>in</strong>u<strong>in</strong>g to improve emissions as fleets exp<strong>and</strong>(CAI-<strong>Asia</strong> Center 2007a).A second important <strong>and</strong> grow<strong>in</strong>g source <strong>of</strong> emissions is<strong>the</strong> rapid expansion <strong>of</strong> electricity-generat<strong>in</strong>g facilities,<strong>of</strong>ten fueled by coal, to meet <strong>the</strong> growth <strong>in</strong> electricitydem<strong>and</strong> from exp<strong>and</strong><strong>in</strong>g economies. Recently, some countries,especially Ch<strong>in</strong>a, have set ambitious targets forreduc<strong>in</strong>g overall emissions from <strong>the</strong>se facilities, evenwhen allow<strong>in</strong>g for <strong>in</strong>dustrial growth (e.g., <strong>the</strong> current Ch<strong>in</strong>eseFive-Year Plan calls for a 10% reduction <strong>in</strong> total SO 2emissions). However, implement<strong>in</strong>g <strong>the</strong>se plans <strong>and</strong>enforc<strong>in</strong>g <strong>the</strong>ir completion cont<strong>in</strong>ues to be a challenge.In addition to more common mobile <strong>and</strong> stationarysources, <strong>Asia</strong>n cities face a wide array <strong>of</strong> diffuse, difficultto-controlsources (e.g., open burn<strong>in</strong>g, emissions fromcombustion <strong>of</strong> low-quality <strong>in</strong>door fuels, <strong>and</strong> large numbers<strong>of</strong> unregulated small bus<strong>in</strong>esses <strong>and</strong> <strong>in</strong>dustries). There arealso a number <strong>of</strong> noncombustion sources (e.g., constructiondust <strong>and</strong> desert s<strong>and</strong> blown from great distances) thatalso are associated with considerable health impacts.Although dust from natural events may not be easily controlled,dust from human activities such as construction,garbage from construction sites deposited on streets, <strong>and</strong>poor agricultural practices can <strong>and</strong> have been successfullycontrolled <strong>in</strong> many countries.A fur<strong>the</strong>r challenge for <strong>Asia</strong> is <strong>the</strong> transport <strong>of</strong> air pollutionfrom one region to <strong>the</strong> o<strong>the</strong>r <strong>and</strong> <strong>the</strong> challenges thatposes for local jurisdictions that want to control emissionsbut do not have authority over <strong>the</strong> sources. This can be aproblem with<strong>in</strong> one country (e.g., <strong>the</strong> effects <strong>of</strong> emissionsfrom <strong>the</strong> Pearl River Delta on air quality <strong>in</strong> Hong Kong;Sidebar 5), between countries (e.g., <strong>the</strong> transport <strong>of</strong> pollutant-ladendusts from Ch<strong>in</strong>a to Japan), <strong>and</strong> globally (e.g.,<strong>the</strong> transport <strong>of</strong> <strong>Asia</strong>n pollutants all <strong>the</strong> way to <strong>the</strong> WestCoast <strong>of</strong> <strong>the</strong> United States).Beyond sett<strong>in</strong>g st<strong>and</strong>ards for <strong>the</strong> control <strong>of</strong> <strong>in</strong>dividualsources, <strong>the</strong>re are two o<strong>the</strong>r major challenges: ensur<strong>in</strong>gsufficient <strong>in</strong>stitutional capacity <strong>and</strong> obta<strong>in</strong><strong>in</strong>g adequate airquality <strong>and</strong> health data.Institutional Capacity Key elements <strong>of</strong> success for airquality management <strong>in</strong>clude hav<strong>in</strong>g <strong>the</strong> staff, resources,<strong>and</strong> legal tools necessary to enforce <strong>the</strong> st<strong>and</strong>ards <strong>and</strong> ensurea level play<strong>in</strong>g field for all sources. This is a major challenge<strong>in</strong> <strong>Asia</strong> where, although some countries have enacted legislative<strong>and</strong> regulatory frameworks, o<strong>the</strong>r countries (e.g.,Vietnam) have not yet done so, <strong>and</strong> <strong>in</strong> all <strong>Asia</strong>n countries,environmental agencies are severely understaffed.Adequate <strong>Air</strong> Quality <strong>and</strong> <strong>Health</strong> Data Although <strong>the</strong>rehas been major progress <strong>in</strong> implement<strong>in</strong>g more modern airquality monitor<strong>in</strong>g systems, <strong>the</strong>re are still many areas <strong>of</strong><strong>Asia</strong> where <strong>the</strong> quality <strong>and</strong> reliability <strong>of</strong> monitor<strong>in</strong>g is seriouslydeficient. Even more so, <strong>the</strong> availability <strong>of</strong> regularlycollected data on health outcomes (e.g., hospitalizations ormortality) is very limited. These deficiencies h<strong>in</strong>der <strong>the</strong>ability to both set <strong>and</strong> track success <strong>in</strong> achiev<strong>in</strong>g air qualitypolicies <strong>and</strong> reduce <strong>the</strong> ability <strong>of</strong> <strong>the</strong> scientific communityto conduct regular <strong>and</strong> enhanced studies <strong>of</strong> <strong>the</strong> heal<strong>the</strong>ffects <strong>of</strong> air pollution to support future analyses <strong>of</strong> healthimpacts <strong>and</strong> air quality decisions.New <strong>and</strong> Emerg<strong>in</strong>g ChallengesIn addition to <strong>the</strong>se cont<strong>in</strong>u<strong>in</strong>g challenges for air qualitymanagement <strong>in</strong> <strong>Asia</strong>, <strong>the</strong>re are two major, rapidlyemerg<strong>in</strong>g challenges that will require approaches that aresubstantially more comprehensive: traffic <strong>and</strong> l<strong>and</strong> use<strong>and</strong> climate change.Traffic <strong>and</strong> L<strong>and</strong> Use The rapid motorization <strong>of</strong> many<strong>Asia</strong>n cities has substantial implications for air quality<strong>and</strong>, as noted above, will require more systematic efforts toimprove fuels <strong>and</strong> vehicle emissions. These trends, however,have greater significance for urban development,traffic congestion, safety <strong>and</strong> noise, <strong>and</strong> <strong>the</strong> future quality<strong>of</strong> life <strong>in</strong> <strong>Asia</strong>n cities. Address<strong>in</strong>g <strong>the</strong>se issues will requiremore comprehensive approaches, engag<strong>in</strong>g not only environmentalagencies but also transport, economic development,<strong>and</strong> plann<strong>in</strong>g authorities.Climate Change The streng<strong>the</strong>n<strong>in</strong>g world consensusabout <strong>the</strong> need to address climate change has substantialimplications for air quality management <strong>in</strong> <strong>Asia</strong>, as discussedabove <strong>and</strong> <strong>in</strong> Sidebar 10. First, it is becom<strong>in</strong>g<strong>in</strong>creas<strong>in</strong>gly apparent that climate change is likely to exacerbateexposures to certa<strong>in</strong> air pollutants (e.g., O 3 ) (RoyalSociety 2008) <strong>and</strong> will make reduc<strong>in</strong>g those air pollutantsmore difficult. Second, <strong>the</strong>re is <strong>the</strong> potential for significantco-benefits from <strong>in</strong>tegrated air quality <strong>and</strong> climate actions(e.g., potential health benefits from reduc<strong>in</strong>g emissions <strong>of</strong><strong>the</strong> BC component <strong>of</strong> PM, which, at <strong>the</strong> same time, couldreduce climate forc<strong>in</strong>g). F<strong>in</strong>ally, address<strong>in</strong>g <strong>the</strong>se comb<strong>in</strong>edchallenges will require more comprehensive <strong>and</strong> coord<strong>in</strong>ateddevelopment <strong>of</strong> energy <strong>and</strong> environmental policy.79
<strong>Outdoor</strong> <strong>Air</strong> <strong>Pollution</strong> <strong>and</strong> <strong>Health</strong> <strong>in</strong> <strong>the</strong> Develop<strong>in</strong>g <strong>Countries</strong> <strong>of</strong> <strong>Asia</strong>Future DirectionsTo date, <strong>the</strong> decision to take action to improve airquality <strong>in</strong> <strong>Asia</strong> has been driven by a number <strong>of</strong> factors: (1)grow<strong>in</strong>g public awareness <strong>of</strong> (<strong>and</strong> negative reaction to)very high, visible concentrations <strong>of</strong> pollution; (2) underst<strong>and</strong><strong>in</strong>g<strong>of</strong> <strong>the</strong> health effects <strong>of</strong> air pollution derived fromEuropean <strong>and</strong> North American studies (<strong>and</strong> most notablyfrom <strong>the</strong> WHO air quality guidel<strong>in</strong>es [WHO 2005b] basedon that literature); <strong>and</strong> (3) a small but grow<strong>in</strong>g number <strong>of</strong>local health studies conducted <strong>in</strong> <strong>Asia</strong>n cities that havedocumented health effects <strong>of</strong> air pollution. In a few<strong>in</strong>stances, action has also been spurred by concern over<strong>the</strong> effect <strong>of</strong> air pollution on historical monuments (e.g.,<strong>the</strong> Taj Mahal <strong>in</strong> Agra, India) <strong>and</strong> overall visibility.Actions have, for <strong>the</strong> most part, been taken by legislatures<strong>and</strong> regulatory agencies <strong>in</strong> <strong>Asia</strong> on <strong>the</strong> basis <strong>of</strong>reviews <strong>of</strong> exist<strong>in</strong>g <strong>in</strong>formation <strong>and</strong> technologies. Themost notable progress <strong>in</strong> this regard has been (<strong>in</strong> somecountries) <strong>the</strong> removal <strong>of</strong> lead from gasol<strong>in</strong>e <strong>and</strong> <strong>the</strong> adoption<strong>of</strong> <strong>in</strong>creas<strong>in</strong>gly str<strong>in</strong>gent emissions st<strong>and</strong>ards for newautomobiles.The speed <strong>and</strong> strength <strong>of</strong> such actions has, however,been lessened by several factors: <strong>the</strong> need <strong>of</strong> <strong>Asia</strong>n governmentsto focus on a wide variety <strong>of</strong> o<strong>the</strong>r challenges(<strong>in</strong>clud<strong>in</strong>g o<strong>the</strong>r environmental public health challenges,such as waterborne diseases); <strong>the</strong> perceived conflictbetween objectives for economic growth <strong>and</strong> potentialcosts <strong>of</strong> environmental actions; <strong>and</strong> a reluctance to extrapolate<strong>the</strong> results <strong>of</strong> studies conducted <strong>in</strong> Western countriesto assess probable health effects <strong>of</strong> air pollution <strong>in</strong> <strong>Asia</strong>. Insome cases (especially recently <strong>in</strong> India), frustration with<strong>the</strong> slow pace <strong>of</strong> action has led to <strong>in</strong>tervention by <strong>the</strong>courts, which have given direct orders to take action (e.g.,ban <strong>the</strong> driv<strong>in</strong>g <strong>of</strong> older motor vehicles <strong>and</strong> require conversionsto cleaner, alternative fuels).Despite <strong>the</strong>se challenges, several <strong>Asia</strong>n cities have madesubstantial progress <strong>in</strong> implement<strong>in</strong>g new measures, most<strong>of</strong>ten when those activities were <strong>in</strong>formed by targetedefforts to document <strong>the</strong> local health consequences <strong>of</strong> air pollution<strong>and</strong> to estimate <strong>the</strong> economic impact. For example,air quality agencies <strong>in</strong> both Thail<strong>and</strong> <strong>and</strong> Hong Kong havesponsored health studies <strong>and</strong> economic analyses by localscientists; <strong>the</strong>se studies have provided some rationale forsubstantial <strong>in</strong>terventions to improve <strong>in</strong>dustrial fuel quality,to improve vehicle emission st<strong>and</strong>ards, <strong>and</strong> to take o<strong>the</strong>ractions. As a result, both Bangkok <strong>and</strong> Hong Kong havebeen among <strong>the</strong> leaders <strong>in</strong> <strong>Asia</strong> <strong>in</strong> implement<strong>in</strong>g comprehensiveair quality management programs.Over <strong>the</strong> past several years, o<strong>the</strong>r efforts have beenundertaken to better quantify <strong>the</strong> impact <strong>of</strong> air pollutionon health <strong>and</strong> <strong>the</strong> economy, both <strong>in</strong> <strong>Asia</strong> <strong>and</strong> around <strong>the</strong>world. As part <strong>of</strong> its Integrated Environmental Strategiesprogram, <strong>the</strong> U.S. EPA has worked with <strong>in</strong>vestigators <strong>in</strong>Shanghai, Ch<strong>in</strong>a; Hyderabad, India; Manila, Philipp<strong>in</strong>es;<strong>and</strong> o<strong>the</strong>rs to conduct systematic analyses <strong>of</strong> <strong>the</strong> health<strong>and</strong> economic consequences <strong>of</strong> alternative energy use <strong>and</strong>air pollution control policies (National Renewable EnergyLaboratory 2008).These U.S. EPA analyses have attempted to use localhealth studies to estimate <strong>the</strong> health impact <strong>of</strong> air pollution.In many cases, however, <strong>the</strong> absence <strong>of</strong> local data hasnecessitated <strong>the</strong> extrapolation to <strong>Asia</strong>n populations <strong>of</strong>effect estimates from North American <strong>and</strong> Europeanstudies. In 2002, <strong>the</strong> WHO also published <strong>the</strong> results <strong>of</strong> itsGlobal Burden <strong>of</strong> Disease project (WHO 2002). WHO estimatesthat <strong>in</strong> 2000, <strong>Asia</strong>n urban air pollution was responsiblefor approximately 520,000 premature deaths (WHO2002). Although <strong>the</strong> analysis was conducted carefully, italso relied on U.S. data <strong>and</strong> modeled, ra<strong>the</strong>r than measured,air pollution concentrations to achieve a consistentset <strong>of</strong> analyses across all countries. Substantial improvement<strong>of</strong> local studies <strong>of</strong> <strong>the</strong> health effects <strong>of</strong> air pollutionwill be an important contribution to all future analyses <strong>of</strong><strong>the</strong> health <strong>and</strong> economic consequences <strong>of</strong> actions toimprove air quality.CAI-<strong>Asia</strong> has organized extensive networks <strong>of</strong> local <strong>and</strong>national <strong>of</strong>ficials, environmentalists, <strong>in</strong>dustry representatives,scientists, <strong>and</strong> eng<strong>in</strong>eers to identify <strong>the</strong> most effectiveactions for cleaner air <strong>and</strong>, through regular workshops<strong>and</strong> <strong>the</strong> biannual Better <strong>Air</strong> Quality conference, have providedample opportunity for <strong>the</strong> transfer <strong>of</strong> knowledge <strong>of</strong>air quality management to <strong>the</strong> wide range <strong>of</strong> stakeholdersnecessary for action to be taken.SUMMARYThe Size <strong>of</strong> <strong>the</strong> Vulnerable <strong>and</strong> Potentially ExposedPopulation Is Increas<strong>in</strong>g.Demographic <strong>and</strong> disease trends occurr<strong>in</strong>g <strong>in</strong> rapidlydevelop<strong>in</strong>g countries <strong>of</strong> <strong>Asia</strong> suggest that <strong>the</strong> size <strong>of</strong> <strong>the</strong>population vulnerable to <strong>the</strong> adverse health impacts <strong>of</strong> airpollution is <strong>in</strong>creas<strong>in</strong>g. Specifically, larger numbers <strong>of</strong>people liv<strong>in</strong>g <strong>in</strong> cities <strong>and</strong> surviv<strong>in</strong>g to older ages, an<strong>in</strong>creased prevalence <strong>of</strong> tobacco smok<strong>in</strong>g, <strong>in</strong>creas<strong>in</strong>g rates<strong>of</strong> obesity, <strong>and</strong> changes <strong>in</strong> dietary patterns are lead<strong>in</strong>g to<strong>in</strong>creases <strong>in</strong> <strong>the</strong> burden <strong>of</strong> disease from cardiovascular disease,COPD, <strong>and</strong> cancer. Because air pollution can contributeto <strong>the</strong> <strong>in</strong>cidence <strong>of</strong> <strong>the</strong>se diseases <strong>and</strong> accelerate<strong>the</strong>ir progression, it is likely that <strong>the</strong> burden <strong>of</strong> diseaserelated to air pollution <strong>in</strong> <strong>Asia</strong> will <strong>in</strong>crease, even if airquality improves.80
HEI International Scientific Oversight Committee<strong>Asia</strong> Is Highly Dynamic <strong>and</strong> Heterogeneous, <strong>and</strong>Exposure to <strong>Air</strong> <strong>Pollution</strong> Is Becom<strong>in</strong>g Increas<strong>in</strong>glyVaried <strong>and</strong> Complex As Development Progresses.Although this report provides an overview <strong>of</strong> air pollutionexposure with<strong>in</strong> <strong>Asia</strong>, <strong>the</strong> situation is highly complex<strong>and</strong> variable, both spatially <strong>and</strong> temporally, mak<strong>in</strong>g it difficultto accurately predict future trends <strong>in</strong> air pollutionconcentrations <strong>in</strong> <strong>the</strong> region. For example, global <strong>and</strong>regional economic downturns may slow <strong>the</strong> pace <strong>of</strong> <strong>in</strong>dustrialdevelopment <strong>and</strong> temporarily reduce <strong>the</strong> rate <strong>of</strong><strong>in</strong>crease <strong>in</strong> emissions or provide opportunities for <strong>the</strong>adoption <strong>of</strong> more efficient <strong>and</strong> lower-emission technologies.The opposite may also occur, depend<strong>in</strong>g on nationalor local priorities. In addition, depend<strong>in</strong>g on specific localstages <strong>of</strong> development, environmental management, <strong>and</strong>regional <strong>in</strong>fluences, evidence suggests that ambient airquality is improv<strong>in</strong>g <strong>in</strong> some areas but may be worsen<strong>in</strong>g<strong>in</strong> o<strong>the</strong>rs. <strong>Air</strong> pollution exposure is even more complex<strong>and</strong> is not well understood. For example, <strong>the</strong> impact <strong>of</strong>urbanization <strong>and</strong> poverty on air pollution exposures <strong>in</strong><strong>Asia</strong> requires fur<strong>the</strong>r research to make generalizationsregard<strong>in</strong>g specific groups that have elevated exposures <strong>and</strong>might <strong>the</strong>refore be at <strong>in</strong>creased risk <strong>of</strong> health impacts.Dramatic Increases <strong>in</strong> <strong>the</strong> Activities <strong>of</strong> Sources AreOccurr<strong>in</strong>g.Despite this fact, however, pollutant concentrations <strong>in</strong>most large urban areas have generally stabilized or aredecreas<strong>in</strong>g (albeit with some notable exceptions). Generaltrends <strong>in</strong> air quality, reflect<strong>in</strong>g its heterogeneous naturewith<strong>in</strong> <strong>Asia</strong>, suggest that air pollutant concentrations aredecreas<strong>in</strong>g or have stabilized <strong>in</strong> most large urban areas <strong>in</strong><strong>Asia</strong>. These reductions <strong>in</strong> air pollution have occurred <strong>in</strong>spite <strong>of</strong> dramatic <strong>in</strong>creases <strong>in</strong> source activity (e.g., powergeneration, vehicle production, <strong>and</strong> vehicle ownership),demonstrat<strong>in</strong>g <strong>the</strong> effectiveness <strong>of</strong> air quality management,especially with<strong>in</strong> large urban areas, <strong>and</strong> <strong>the</strong> adoption <strong>of</strong>more efficient energy use. Along with <strong>the</strong>se improvements<strong>in</strong> air quality is recent evidence <strong>of</strong> <strong>in</strong>creases <strong>in</strong> air pollutantconcentrations at some locations <strong>and</strong> <strong>of</strong> <strong>the</strong> persistent<strong>and</strong> <strong>in</strong>creas<strong>in</strong>g importance <strong>of</strong> degradation <strong>of</strong> regionalair quality.Regional <strong>Air</strong> Quality <strong>and</strong> Climate Change Are KeyEmerg<strong>in</strong>g Issues.Some strategies <strong>of</strong> air quality management, however,may lead to new air quality issues for <strong>Asia</strong>. For example,relocation <strong>of</strong> power generation <strong>and</strong> <strong>in</strong>dustrial po<strong>in</strong>tsources outside <strong>of</strong> urban areas may improve urban airquality while lead<strong>in</strong>g to <strong>the</strong> overall degradation <strong>of</strong> regionalair quality. As total air pollution sources <strong>and</strong> overall emissions<strong>in</strong>crease, yet become more dispersed, regional, <strong>and</strong>transboundary air quality issues are likely to become<strong>in</strong>creas<strong>in</strong>gly important <strong>in</strong> <strong>Asia</strong>.Climate change <strong>and</strong> <strong>the</strong> emission <strong>of</strong> GHG pollutantspresent not only an important challenge for <strong>Asia</strong> but alsoan opportunity for cont<strong>in</strong>ued improvement <strong>in</strong> air quality.As discussed above, trends <strong>in</strong> air quality have largelyshown improvement dur<strong>in</strong>g periods <strong>of</strong> dramatically<strong>in</strong>creased energy use <strong>in</strong> <strong>Asia</strong>, a testament to <strong>the</strong> impact <strong>of</strong>effective air quality management as well as improved efficiency<strong>and</strong> reduced <strong>in</strong>tensity <strong>of</strong> energy use. Strategies forreduction <strong>in</strong> <strong>the</strong> emissions <strong>of</strong> GHG pollutants, althoughdirected toward climate change, may also have directimpacts on local <strong>and</strong> regional air quality, result<strong>in</strong>g <strong>in</strong> faster<strong>and</strong> larger improvements than would o<strong>the</strong>rwise occur <strong>in</strong><strong>the</strong> region, with <strong>the</strong> potential for improved public health.The actual benefits to climate <strong>and</strong> public health that mightaccrue, however, will depend on which GHG pollutantsare reduced, <strong>the</strong>ir relative potential for climate forc<strong>in</strong>g,<strong>and</strong> <strong>the</strong>ir relative toxicities — matters that are still <strong>in</strong>completelyunderstood.81
Section III. Summary <strong>of</strong> Current Evidence on <strong>Health</strong>Effects <strong>of</strong> <strong>Air</strong> <strong>Pollution</strong>: Implications for <strong>Asia</strong>The past 10 to 15 years have seen a remarkable <strong>in</strong>crease<strong>in</strong> research on <strong>the</strong> effects <strong>of</strong> air pollution on health. It isnow widely accepted that exposure to outdoor air pollutionis associated with a broad range <strong>of</strong> acute <strong>and</strong> chronichealth effects, rang<strong>in</strong>g from m<strong>in</strong>or physiologic perturbationsto death from respiratory or cardiovascular disease(Bascom et al. 1996; American Thoracic Society [ATS]2000). This knowledge is based on observational epidemiologicstudies <strong>of</strong> disease occurrence <strong>in</strong> human populations,<strong>in</strong> vivo experimental studies with animals <strong>and</strong>humans, <strong>and</strong> <strong>in</strong> vitro studies with human <strong>and</strong> animal tissues<strong>and</strong> cells. Epidemiologic research on <strong>the</strong> heal<strong>the</strong>ffects <strong>of</strong> air pollution provides estimates <strong>of</strong> <strong>the</strong> heal<strong>the</strong>ffects <strong>of</strong> both short- <strong>and</strong> long-term exposure to a variety <strong>of</strong>air pollutants <strong>in</strong> human populations <strong>in</strong> many parts <strong>of</strong> <strong>the</strong>world. Because <strong>the</strong>se estimates apply to humans liv<strong>in</strong>g <strong>in</strong>real-world conditions, <strong>the</strong>y have been <strong>the</strong> scientific basis<strong>of</strong> <strong>in</strong>creas<strong>in</strong>gly str<strong>in</strong>gent air quality regulations for somepollutants.Epidemiologic studies <strong>of</strong> air pollution harness variousdimensions <strong>of</strong> exposure variability that are observable <strong>in</strong>real-world sett<strong>in</strong>gs (Pope <strong>and</strong> Burnett 2007). Individualepidemiologic studies <strong>of</strong>ten focus on only one dimension<strong>of</strong> exposure variability at a time with<strong>in</strong> a population. Wellover 100 published studies have used short-term temporalvariation (over one or a few days) <strong>in</strong> air pollution concentrationsto estimate effects on daily morbidity <strong>and</strong> mortality.Spatial variation <strong>in</strong> long-term mean concentrations<strong>of</strong> air pollutants has been <strong>the</strong> basis for cross-sectional <strong>and</strong>cohort studies <strong>of</strong> long-term exposure. A much smallernumber <strong>of</strong> studies have used longer-term temporal variation(over weeks or months) result<strong>in</strong>g from natural experiments(naturally occurr<strong>in</strong>g events) or <strong>in</strong>terventions(deliberate manipulation <strong>of</strong> conditions through direct or<strong>in</strong>direct actions) or have used relatively long lag times <strong>in</strong>time-series studies to explore time scales <strong>of</strong> exposurelonger than just a few days but shorter than years. A moreextensive summary <strong>and</strong> analysis <strong>of</strong> <strong>the</strong> results from <strong>the</strong>sestudies has been published (Pope <strong>and</strong> Dockery 2006).STUDIES OF VARIABILITY IN EXPOSUREShort-Term Temporal VariabilityIn air pollution epidemiology, <strong>the</strong> most studied dimension<strong>of</strong> exposure variability is short-term temporal variability.Episodes <strong>in</strong> which concentrations <strong>of</strong> air pollution<strong>in</strong>creased rapidly <strong>and</strong> rema<strong>in</strong>ed markedly elevated for aperiod <strong>of</strong> days occurred <strong>in</strong> Europe <strong>and</strong> <strong>the</strong> United States <strong>in</strong><strong>the</strong> mid–20th century. These episodes provided some <strong>of</strong><strong>the</strong> earliest epidemiologic evidence <strong>of</strong> <strong>the</strong> health effects <strong>of</strong>short-term exposure to air pollution (Anderson 1999).Today, such episodes are much less frequent <strong>in</strong> developedWestern countries (Wichmann et al. 1989; Anderson et al.1995), but <strong>in</strong> <strong>Asia</strong>, very high concentrations <strong>of</strong> air pollutiondue to burn<strong>in</strong>g <strong>of</strong> biomass can still result <strong>in</strong> high dailypollutant concentrations <strong>in</strong> some cities.In <strong>the</strong> early 1990s, <strong>the</strong> results <strong>of</strong> several daily time-seriesstudies were reported (Fairley 1990; Schwartz <strong>and</strong> Marcus1990; Schwartz 1991; Dockery et al. 1992; Pope et al. 1992;Schwartz <strong>and</strong> Dockery 1992a,b; Schwartz 1993). Thesestudies used time-series data <strong>and</strong> Poisson regressionmodels to estimate <strong>the</strong> association between changes <strong>in</strong>daily mortality <strong>and</strong> daily changes <strong>in</strong> pollution while controll<strong>in</strong>gfor o<strong>the</strong>r time-dependent covariables that werepotential confounders. These studies found small but statisticallysignificant effects <strong>of</strong> air pollution on mortality,even at relatively low concentrations. The orig<strong>in</strong>alresearch was reanalyzed <strong>and</strong> largely replicated (Samet etal. 1995), with similar associations observed <strong>in</strong> o<strong>the</strong>r citieswith different climates, different model<strong>in</strong>g approachesused to describe wea<strong>the</strong>r conditions, different pollutionmixes, <strong>and</strong> different demographic characteristics (Pope<strong>and</strong> Kalkste<strong>in</strong> 1996; Samet et al. 1998; Pope <strong>and</strong> Dockery1999; Bell et al. 2004a).There have been concerns regard<strong>in</strong>g <strong>the</strong> specifics <strong>of</strong> <strong>the</strong>various model<strong>in</strong>g approaches used to assess short-termvariability <strong>in</strong> exposure. However, over time, <strong>in</strong>creas<strong>in</strong>glyrigorous model<strong>in</strong>g techniques have been used <strong>in</strong> attemptsto better estimate pollution–mortality associations whilecontroll<strong>in</strong>g for seasonality, o<strong>the</strong>r long-term time trends,83
<strong>Outdoor</strong> <strong>Air</strong> <strong>Pollution</strong> <strong>and</strong> <strong>Health</strong> <strong>in</strong> <strong>the</strong> Develop<strong>in</strong>g <strong>Countries</strong> <strong>of</strong> <strong>Asia</strong><strong>and</strong> wea<strong>the</strong>r variables such as temperature <strong>and</strong> relativehumidity (Dom<strong>in</strong>ici et al. 2003c; Dom<strong>in</strong>ici 2004). Ano<strong>the</strong>rmethodologic approach, <strong>the</strong> case–crossover study design(Maclure 1991), has also been applied to study<strong>in</strong>g effectson morbidity <strong>and</strong> mortality <strong>of</strong> daily changes <strong>in</strong> particulateair pollution (Lee JT <strong>and</strong> Schwartz 1999; Neas et al. 1999;Pope <strong>and</strong> Dockery 2006). The case–crossover design is anadaptation <strong>of</strong> <strong>the</strong> common retrospective case–controldesign. Exposures <strong>of</strong> study subjects at <strong>the</strong> time <strong>of</strong> <strong>the</strong> event(<strong>the</strong> case period) are matched with one or more periodswhen <strong>the</strong> event did not occur (control periods), <strong>and</strong> <strong>the</strong>potential excess risk associated with <strong>the</strong> event are estimatedus<strong>in</strong>g conditional logistic regression. Individualsessentially serve as <strong>the</strong>ir own controls. By strategicallychoos<strong>in</strong>g control periods, this approach restructures <strong>the</strong>analysis such that day <strong>of</strong> week, seasonality, <strong>and</strong> long-termtime trends are controlled for by <strong>the</strong> study design ra<strong>the</strong>rthan by statistical model<strong>in</strong>g (Janes et al. 2005). Usefulreviews <strong>and</strong> discussions <strong>of</strong> <strong>the</strong> statistical techniques thathave been used <strong>in</strong> <strong>the</strong>se time-series <strong>and</strong> related studies havebeen published (Dom<strong>in</strong>ici et al. 2003c; Dom<strong>in</strong>ici 2004).The most recent studies <strong>of</strong> short-term exposure havefound associations between concentrations <strong>of</strong> airborne PM<strong>and</strong> a large range <strong>of</strong> outcomes, which have been reviewedextensively (Pope <strong>and</strong> Dockery 1999; Pope et al. 2006). PMpollution has been associated with daily rate <strong>of</strong> mortality(from all natural causes, respiratory causes, or cardiovascularcauses), hospital admission for respiratory disease(from all natural causes, COPD, asthma, or pneumonia),<strong>and</strong> hospital admission for cardiovascular diseases (acutemyocardial <strong>in</strong>farction or congestive heart failure). Themagnitude <strong>of</strong> <strong>the</strong> estimated RRs from time-series studies <strong>of</strong>daily mortality depends on <strong>the</strong> approach used to modelboth <strong>the</strong> temporal pattern <strong>of</strong> exposure (Braga et al. 2001)<strong>and</strong> potential confounders that vary with time (such asseason <strong>and</strong> wea<strong>the</strong>r) (<strong>Health</strong> Effects Institute 2003).The majority <strong>of</strong> <strong>the</strong> daily time-series mortality studieshave been conducted <strong>in</strong> North American or Western Europeancities, where air pollution concentrations are low <strong>and</strong>still fall<strong>in</strong>g <strong>and</strong> Western lifestyles <strong>and</strong> patterns <strong>of</strong> diseasepredom<strong>in</strong>ate (Stieb et al. 2002; Cohen et al. 2004). Fewerstudies have been conducted <strong>in</strong> Central <strong>and</strong> South Americancountries <strong>and</strong> <strong>Asia</strong>n countries. In virtually all localesthat have been studied, however, daily mortality is positivelyassociated with short-term (several days’) exposureto approximately <strong>the</strong> same degree.S<strong>in</strong>ce <strong>the</strong> publication <strong>of</strong> numerous s<strong>in</strong>gle-city dailytime-series mortality studies, many quantitative reviews<strong>and</strong> meta-analyses <strong>of</strong> data from <strong>the</strong>se studies have beenperformed, to estimate <strong>the</strong> effect on mortality or o<strong>the</strong>rhealth measures <strong>of</strong> an <strong>in</strong>crease <strong>in</strong> <strong>the</strong> concentration <strong>of</strong> agiven air pollutant (called <strong>the</strong> effect estimate). The pooledeffect estimates for mortality (<strong>in</strong> this report, usually shownas <strong>the</strong> percent change <strong>in</strong> daily mortality) from several <strong>of</strong><strong>the</strong>se meta-analyses <strong>and</strong> reviews are presented <strong>in</strong> Figure 32.For example, a meta-analysis was applied to 29 estimates<strong>of</strong> <strong>the</strong> effect <strong>of</strong> PM 10 on mortality from 21 publishedstudies to yield pooled estimates <strong>and</strong> to evaluate whe<strong>the</strong>rvarious study-specific factors expla<strong>in</strong>ed some <strong>of</strong> <strong>the</strong> variability<strong>in</strong> <strong>the</strong> effect estimates across <strong>the</strong> studies (Levy et al.2000). Elevated concentrations <strong>of</strong> PM 10 were associatedFigure 32. Estimates <strong>of</strong> percent change <strong>in</strong> daily mortality from all naturalcauses for selected meta-analyses <strong>and</strong> multi-city studies <strong>of</strong> daily changes<strong>in</strong> air pollution exposure, by study type <strong>and</strong> unit change <strong>in</strong> pollutant concentration.[Adapted from Pope <strong>and</strong> Dockery 2006 with estimates addedfrom this <strong>Asia</strong>n Literature Review meta-analysis (Table 15).]84
HEI International Scientific Oversight Committeewith <strong>in</strong>creased numbers <strong>of</strong> deaths (Figure 32) <strong>and</strong> PMeffect estimates for mortality were greater <strong>in</strong> cities <strong>in</strong>which PM 2.5 makes up a higher proportion <strong>of</strong> <strong>the</strong> PM 10 .Stieb <strong>and</strong> colleagues (2002, 2003) extracted effect estimatesfrom reports <strong>of</strong> 109 time-series studies <strong>and</strong> calculated<strong>the</strong> r<strong>and</strong>om-effects pooled estimates <strong>of</strong> excessmortality. Statistically significant positive associationswere observed between daily mortality <strong>and</strong> various measures<strong>of</strong> air pollution, <strong>in</strong>clud<strong>in</strong>g PM 10 , but differences <strong>in</strong>effect estimates were observed, accord<strong>in</strong>g to <strong>the</strong> model<strong>in</strong>gapproach used. One concern regard<strong>in</strong>g air pollution effectestimates for mortality from published s<strong>in</strong>gle-city studiesis <strong>the</strong> potential for city-selection <strong>and</strong> publication bias.Anderson <strong>and</strong> colleagues (2005) explored <strong>the</strong> existence <strong>of</strong>city-selection <strong>and</strong> publication bias <strong>in</strong> a meta-analysis <strong>of</strong> 74time-series studies <strong>of</strong> daily mortality <strong>in</strong> s<strong>in</strong>gle cities. Summaries<strong>of</strong> effect estimates were obta<strong>in</strong>ed, summarized, <strong>and</strong>exam<strong>in</strong>ed for publication bias us<strong>in</strong>g an analysis <strong>of</strong> asymmetry<strong>in</strong> funnel plots (<strong>in</strong> which estimates are plottedaga<strong>in</strong>st <strong>the</strong>ir st<strong>and</strong>ard errors). Although <strong>the</strong>re was someevidence <strong>of</strong> publication bias, <strong>the</strong> effect estimates were notsubstantially altered after us<strong>in</strong>g a trim-<strong>and</strong>-fill method tocorrect for this bias (Figure 32).Recently, large studies have been conducted us<strong>in</strong>g uniformmethods for assembl<strong>in</strong>g <strong>and</strong> analyz<strong>in</strong>g data frommultiple cities. <strong>Pollution</strong> effect estimates for mortalityfrom <strong>the</strong>se multi-city studies are also presented <strong>in</strong> Figure32. The studies represented <strong>in</strong>clude analyses <strong>of</strong> 6 U.S.cities (Klemm <strong>and</strong> Mason 2003), 10 U.S. cities (Schwartz2000, Schwartz <strong>and</strong> Coull 2003), a study <strong>of</strong> 8 <strong>of</strong> Canada’slargest cities (Burnett et al. 2000), <strong>and</strong> a study <strong>of</strong> 9 Californiacities (Ostro et al. 2006). A multi-city study thatused <strong>the</strong> case–crossover study design was conducted us<strong>in</strong>gdata from 14 U.S. cities (Schwartz 2004). As can be seen <strong>in</strong>Figure 32, statistically significant PM 10 –mortality associationswere found, similar to those estimated us<strong>in</strong>g <strong>the</strong>time-series approach.One <strong>of</strong> <strong>the</strong> largest multi-city daily time-series studies is<strong>the</strong> National Morbidity, Mortality, <strong>and</strong> <strong>Air</strong> <strong>Pollution</strong> Study(NMMAPS). This study began with efforts to replicate severalearly s<strong>in</strong>gle-city time-series studies (Samet et al. 1995)<strong>and</strong> was designed to address concerns about city-selectionbias, publication bias, <strong>and</strong> confound<strong>in</strong>g by copollutants.Results <strong>of</strong> various analyses <strong>of</strong> <strong>the</strong>se data have beenreported (Samet et al. 2000a; Dom<strong>in</strong>ici et al. 2000, 2003b,c;Peng et al. 2005). The PM–mortality effect estimates weresomewhat sensitive to various model<strong>in</strong>g <strong>and</strong> city-selectionchoices. However, relatively small but statistically significantPM–mortality associations <strong>of</strong> a size comparable tothose reported <strong>in</strong> Dom<strong>in</strong>ici et al. 2003a were consistentlyobserved (Figure 32). The NMMAPS analysis also directlyevaluated <strong>the</strong> <strong>in</strong>fluence <strong>of</strong> copollutants <strong>and</strong> found littleevidence that <strong>the</strong> PM–mortality effect was attributable toany <strong>of</strong> <strong>the</strong> copollutants studied (NO 2 , CO, SO 2 , or O 3 ).Never<strong>the</strong>less, as <strong>in</strong>dicated <strong>in</strong> Figure 32, an additionalNMMAPS analysis detected associations <strong>of</strong> mortality withO 3 (Bell et al. 2004a). Multi-city time-series studies werealso conducted <strong>in</strong> Europe. As part <strong>of</strong> <strong>the</strong> <strong>Air</strong> <strong>Pollution</strong> <strong>and</strong><strong>Health</strong>: A European Approach (APHEA) <strong>and</strong> APHEA2projects, various analyses were used to exam<strong>in</strong>e <strong>the</strong> shorttermPM–mortality effects <strong>in</strong> 15–29 European cities (Katsouyanniet al. 1996, 1997, 2001, 2003; Zmirou et al. 1998;Samoli et al. 2001, 2003; Aga et al. 2003; Analitis et al.2006) <strong>and</strong> PM was found to be significantly associatedwith daily mortality (see Katsouyanni et al. 2003 <strong>and</strong>Figure 32). Similar results were observed <strong>in</strong> a study <strong>of</strong> n<strong>in</strong>eFrench cities (Le Tertre et al. 2002).Three <strong>Asia</strong>n multi-city studies — one <strong>of</strong> 7 major SouthKorean cities (Lee JT et al. 2000), one <strong>of</strong> 13 Japanese cities(Omori et al. 2003), <strong>and</strong> <strong>the</strong> PAPA studies <strong>in</strong> four cities <strong>in</strong>East <strong>and</strong> Sou<strong>the</strong>ast <strong>Asia</strong> (Wong CM et al. 2008b, 2010a, <strong>and</strong>Sidebar 1) — have also reported associations <strong>of</strong> daily mortalitywith measures <strong>of</strong> PM. As shown <strong>in</strong> Figure 32, <strong>the</strong>PM–mortality effect estimates from <strong>the</strong>se multi-citystudies <strong>in</strong> <strong>Asia</strong> do not appear to be substantially differentfrom effect estimates from comparable studies <strong>in</strong> o<strong>the</strong>rparts <strong>of</strong> <strong>the</strong> world. In Section V. Quantitative Assessment<strong>of</strong> Daily Time-Series Studies, <strong>the</strong> <strong>Asia</strong>n multi-city studiesare discussed fur<strong>the</strong>r <strong>in</strong> <strong>the</strong> context <strong>of</strong> <strong>the</strong> time-seriesmeta-analysis.O<strong>the</strong>r approaches have also been used to study <strong>the</strong> acutehealth effects <strong>of</strong> short-term exposure to air pollution. Forexample, <strong>in</strong> panel studies, small groups (or panels) <strong>of</strong> subjectsare followed over short <strong>in</strong>tervals, <strong>and</strong> health outcomes,exposure to air pollution, <strong>and</strong> potential confounders areascerta<strong>in</strong>ed for each subject on one or more occasions. Panelstudies have generally reported that exposure to outdoor airpollution is associated with <strong>in</strong>creased upper <strong>and</strong> lower respiratorysymptoms, small transient decl<strong>in</strong>es <strong>in</strong> lung function,<strong>and</strong> <strong>in</strong>creased rates <strong>of</strong> asthma attacks <strong>and</strong> asthmamedication use (Pope <strong>and</strong> Dockery 1999). In addition, severalcase–crossover studies from <strong>the</strong> United States <strong>and</strong>Europe have observed that short-term exposure to PM 2.5 isassociated with an <strong>in</strong>creased risk <strong>of</strong> acute IHD events(Peters A et al. 2001; D’Ippoliti et al. 2003; Zanobetti <strong>and</strong>Schwartz 2005; von Klot et al. 2005; Pope et al. 2006).Long-Term Spatial VariabilityAno<strong>the</strong>r important source <strong>of</strong> exposure variability is spatial(or cross-sectional) variability that <strong>in</strong>cludes differences<strong>in</strong> <strong>the</strong> long-term (i.e., 1 year or more) average85
<strong>Outdoor</strong> <strong>Air</strong> <strong>Pollution</strong> <strong>and</strong> <strong>Health</strong> <strong>in</strong> <strong>the</strong> Develop<strong>in</strong>g <strong>Countries</strong> <strong>of</strong> <strong>Asia</strong>ambient concentrations across metropolitan areas as wellas differences <strong>in</strong> average concentrations across smallercommunities or neighborhoods with<strong>in</strong> metropolitan areas.In <strong>the</strong> 1970s <strong>and</strong> 1980s, various population-based crosssectionalstudies found that mortality rates <strong>in</strong> U.S. citieswere associated with PM 2.5 (Lave <strong>and</strong> Sesk<strong>in</strong> 1970; Evanset al. 1984; Özkaynak <strong>and</strong> Thurston 1987).Several prospective cohort studies (<strong>in</strong> which large numbers<strong>of</strong> <strong>in</strong>dividuals exposed to various concentrations <strong>of</strong>air pollution are followed-up for years <strong>and</strong> <strong>the</strong>ir mortalityrates are compared) have also <strong>in</strong>vestigated spatial variability<strong>in</strong> long-term average concentrations <strong>of</strong> air pollution.PM–mortality effect estimates from <strong>the</strong>se studies aresummarized <strong>in</strong> Figure 33. Orig<strong>in</strong>al reports <strong>of</strong> <strong>the</strong> HarvardSix Cities (Dockery et al. 1993) <strong>and</strong> <strong>the</strong> American CancerSociety (ACS) (Pope et al. 1995) prospective cohort studies<strong>in</strong>dicated that mortality was strongly associated with spatialdifferences <strong>in</strong> long-term average concentrations <strong>of</strong>PM 2.5 , even after controll<strong>in</strong>g for cigarette smok<strong>in</strong>g <strong>and</strong>numerous o<strong>the</strong>r <strong>in</strong>dividual risk factors. Extensive reanalyses(Krewski et al. 2000) <strong>and</strong> extended analyses (Pope etal. 2002; Jerrett et al. 2005; Laden et al. 2006) <strong>of</strong> f<strong>in</strong>d<strong>in</strong>gsfrom <strong>the</strong>se two early prospective cohort studies demonstratedthat <strong>the</strong> PM 2.5 –mortality effect estimates wereremarkably robust to various model<strong>in</strong>g specifications <strong>and</strong>to controll<strong>in</strong>g for <strong>in</strong>dividual risk factors <strong>in</strong>clud<strong>in</strong>g age, sex,race, smok<strong>in</strong>g status, alcohol use, marital status, education,body-mass <strong>in</strong>dex, occupational exposures, <strong>and</strong> diet.Even analyses that <strong>in</strong>cluded spatial smooth<strong>in</strong>g (Pope et al.2002) or ecologic (<strong>in</strong>clud<strong>in</strong>g socioeconomic) variables(Krewski et al. 2000, 2009; Jerrett et al. 2005) found littleevidence <strong>of</strong> spatial confound<strong>in</strong>g or confound<strong>in</strong>g by “contextualconditions” at <strong>the</strong> neighborhood level. The twostudies that also <strong>in</strong>cluded with<strong>in</strong>-city variability <strong>in</strong> exposure,by Jerrett <strong>and</strong> colleagues (2005) <strong>and</strong> Miller <strong>and</strong> associates(2007) (Figure 34), observed that <strong>the</strong> estimatedpollution effects were relatively large — suggest<strong>in</strong>g thatstudies that evaluate differences <strong>in</strong> exposure only acrossmetropolitan areas may be underestimat<strong>in</strong>g <strong>the</strong> effects <strong>of</strong>pollution.O<strong>the</strong>r prospective cohort studies <strong>of</strong> adult mortality havegenerally observed positive, but less consistent or less statisticallysignificant, PM–mortality associations (Abbey etal. 1999; McDonnell et al. 2000; Enstrom 2005). PM 2.5 wasmore closely associated with mortality than PM 10 or TSP(sometimes referred to as suspended particulate matter[SPM]). Results <strong>of</strong> a study conducted <strong>in</strong> <strong>the</strong> Ne<strong>the</strong>rl<strong>and</strong>s(Beelen et al. 2008), an extended analysis <strong>of</strong> a cohort <strong>of</strong>U.S. Veterans Adm<strong>in</strong>istration patients <strong>in</strong> <strong>the</strong> United States(Lipfert et al. 2006), <strong>and</strong> a Norwegian cohort study (Nafstadet al. 2004) suggest effects <strong>of</strong> long-term exposure to airpollution, particularly air pollution related to road traffic.Figure 33. Estimates <strong>of</strong> percent change <strong>in</strong> daily all-natural-cause mortalityfrom selected studies <strong>of</strong> long-term air pollution exposure, by studytype <strong>and</strong> unit change <strong>in</strong> pollutant concentration. [Adapted from Pope <strong>and</strong>Dockery 2006.]Figure 34. Estimates <strong>of</strong> percent change <strong>in</strong> risk <strong>of</strong> cardiovascular mortalityper 10-µg/m 3 change <strong>in</strong> annual average PM 2.5 concentration fromselected cohort studies <strong>of</strong> long-term exposure. [Adapted from Pope <strong>and</strong>Dockery 2006.]86
HEI International Scientific Oversight CommitteeInterest<strong>in</strong>gly, two studies have also observed similar pollution-related<strong>in</strong>creases <strong>in</strong> post-neonatal <strong>in</strong>fant mortality(Woodruff TJ et al. 1997, 2006b).Analyses <strong>of</strong> <strong>the</strong> prospective cohort studies accord<strong>in</strong>g tospecific causes <strong>of</strong> death <strong>in</strong>dicate that <strong>the</strong> long-term PMexposure is most consistently associated with cardiopulmonaryor cardiovascular mortality, or both (Pope et al.2004). Figure 34 presents adjusted RRs for cardiovascularmortality associated with PM 2.5 for various analyses <strong>of</strong> <strong>the</strong>Harvard Six Cities data (Dockery et al. 1993; Laden et al.2006) <strong>and</strong> <strong>the</strong> ACS data (Pope et al. 1995, 2002, 2004; Jerrettet al. 2005). Also shown are adjusted RRs for nonfatal<strong>and</strong> fatal cardiovascular events estimated from a largecohort study <strong>of</strong> postmenopausal women without previouscardiovascular disease (Miller et al. 2007). A limitation <strong>of</strong>all <strong>of</strong> <strong>the</strong>se cohort studies <strong>of</strong> mortality, however, is that nosimilar studies have been conducted <strong>in</strong> develop<strong>in</strong>g countries,<strong>and</strong> thus global estimates made from <strong>the</strong>se studiescarry large uncerta<strong>in</strong>ties (Cohen et al. 2004). Recently, HEIfunded a pilot study <strong>in</strong> which <strong>the</strong> <strong>in</strong>vestigators attemptedto retrospectively estimate long-term exposure to particulateair pollution <strong>in</strong> an exist<strong>in</strong>g cohort <strong>of</strong> older residents <strong>of</strong>Guangzhou, Ch<strong>in</strong>a. Despite careful execution, <strong>the</strong> <strong>in</strong>vestigatorswere unable to identify a population with an <strong>in</strong>formativecontrast <strong>in</strong> exposure us<strong>in</strong>g exist<strong>in</strong>g data fromGuangzhou’s air monitor<strong>in</strong>g network — thus highlight<strong>in</strong>g<strong>the</strong> difficulties <strong>in</strong> conduct<strong>in</strong>g studies <strong>of</strong> <strong>the</strong> chronic effects<strong>of</strong> long-term exposure <strong>in</strong> many <strong>Asia</strong>n sett<strong>in</strong>gs (Sidebar 13).Long-Term Temporal VariabilityThe PM–mortality effect estimates from long-term prospectivecohort studies (Figure 33) are substantially largerthan those from <strong>the</strong> daily time-series <strong>and</strong> case–crossoverstudies (Figure 32). Much <strong>of</strong> <strong>the</strong> difference <strong>in</strong> <strong>the</strong> PM–mortalityassociations observed between <strong>the</strong> daily time-series<strong>and</strong> <strong>the</strong> prospective cohort studies may be due to <strong>the</strong> dramaticallydifferent time scales <strong>of</strong> exposure (a few days vs.years). Several epidemiologic studies <strong>of</strong> air pollution haveattempted to evaluate <strong>in</strong>termediate scales <strong>of</strong> exposure byus<strong>in</strong>g medium-term temporal variability <strong>in</strong> exposure (overweeks to months). Examples <strong>in</strong>clude several studies <strong>of</strong> naturalexperiments or <strong>of</strong> <strong>in</strong>terventions.In <strong>the</strong> Utah Valley region <strong>of</strong> <strong>the</strong> United States, abruptreductions <strong>in</strong> air pollution that accompanied a 13-monthperiod <strong>of</strong> closure <strong>of</strong> a steel mill were associated with reductions<strong>in</strong> hospitalizations <strong>and</strong> mortality (Pope et al. 1992,Pope 1996). Substantial reductions <strong>in</strong> air pollution result<strong>in</strong>gfrom a ban on <strong>the</strong> use <strong>of</strong> coal burn<strong>in</strong>g <strong>in</strong> Dubl<strong>in</strong>, Irel<strong>and</strong>(Clancy et al. 2002), resulted <strong>in</strong> reductions <strong>in</strong> respiratory<strong>and</strong> cardiovascular deaths. Reductions <strong>in</strong> seasonal mortalitywere observed <strong>in</strong> <strong>the</strong> first 12 months after restrictions wereimposed on <strong>the</strong> sulfur content <strong>of</strong> fuel <strong>in</strong> Hong Kong(Hedley et al. 2002). Also, a recent analysis <strong>in</strong>dicated thatsmall but statistically significant drops <strong>in</strong> mortality wereassociated with one historical event: an 8.5-month strikeby employees at a copper smelter that resulted <strong>in</strong> sharpreductions <strong>in</strong> SO 2 4 <strong>and</strong> PM concentrations <strong>and</strong> concentrations<strong>of</strong> related air pollutants across four states <strong>in</strong> <strong>the</strong>southwestern United States (Pope et al. 2007). This resultwas quite robust to <strong>the</strong> statistical control <strong>of</strong> time trends,mortality <strong>in</strong> border<strong>in</strong>g states, <strong>and</strong> nationwide numbers <strong>of</strong>deaths from <strong>in</strong>fluenza or pneumonia, cardiovascularcauses, <strong>and</strong> o<strong>the</strong>r respiratory causes.Ano<strong>the</strong>r approach to analyz<strong>in</strong>g daily time-series data fortime scales <strong>of</strong> exposure substantially longer than just a fewdays is <strong>the</strong> use <strong>of</strong> extended distributed-lag times <strong>in</strong> timeseriesanalyses. Schwartz (2000) used distributed-lagmodels to evaluate associations over periods <strong>of</strong> 1 to 5 daysus<strong>in</strong>g data from 10 U.S. cities. Distributed-lag models wereused to estimate associations for up to 40 days us<strong>in</strong>g datafrom 10 European cities (Zanobetti et al. 2002, 2003) <strong>and</strong>Dubl<strong>in</strong>, Irel<strong>and</strong> (Goodman et al. 2004). In all <strong>of</strong> <strong>the</strong>se analyses,<strong>the</strong> cumulative PM–mortality effect was larger whentime scales longer than a few days were used.Figure 35 compares <strong>the</strong> percent changes <strong>in</strong> risk <strong>of</strong> mortalityassociated with PM, estimated for various timescales <strong>of</strong> exposure, <strong>in</strong>tegrat<strong>in</strong>g <strong>the</strong> evidence from <strong>the</strong>studies discussed above. The estimated percent change <strong>in</strong>risk <strong>of</strong> mortality associated with a change <strong>of</strong> 10 µg/m 3Figure 35. Comparison <strong>of</strong> percent changes <strong>in</strong> risk <strong>of</strong> associated with achange <strong>of</strong> 10 µg/m 3 PM 2.5 , 20 µg/m 3 PM 10 , or 20 µg/m 3 black smoke concentrationsacross various time scales <strong>of</strong> exposure. [Adapted from Pope2007.]87
<strong>Outdoor</strong> <strong>Air</strong> <strong>Pollution</strong> <strong>and</strong> <strong>Health</strong> <strong>in</strong> <strong>the</strong> Develop<strong>in</strong>g <strong>Countries</strong> <strong>of</strong> <strong>Asia</strong>Sidebar 13. A PILOT STUDY IN GHANGZHOUAlthough long-term cohort studies provide <strong>in</strong>formation about<strong>the</strong> effects <strong>of</strong> long-term exposure to air pollution, currentlyavailable data from Western countries, such as from <strong>the</strong> U.S.-based ACS cohort study, <strong>in</strong>form <strong>the</strong> air pollution concentration–responsefunction only up to around 30 µg/m 3 PM 2.5 .Because <strong>of</strong> <strong>the</strong> dearth <strong>of</strong> data from regions exposed to <strong>the</strong> relativelyhigher concentrations <strong>of</strong> air pollution found <strong>in</strong> <strong>Asia</strong>, however,data from <strong>the</strong> ACS cohort are rout<strong>in</strong>ely used <strong>in</strong> healthimpact assessments regard<strong>in</strong>g ambient air pollution <strong>in</strong> regionsaround <strong>the</strong> world (Cohen et al. 2004).To assess <strong>the</strong> effects <strong>of</strong> long-term exposure to <strong>the</strong> relatively highpollution concentrations found <strong>in</strong> <strong>Asia</strong>, <strong>the</strong> PAPA programfunded a pilot study to assess <strong>the</strong> feasibility <strong>of</strong> conduct<strong>in</strong>g a prospectivecohort study <strong>of</strong> <strong>the</strong> effect <strong>of</strong> long- <strong>and</strong> short-term exposureto air pollution on morbidity <strong>and</strong> mortality from respiratory<strong>and</strong> cardiovascular diseases among older people <strong>in</strong> Guangzhou,Ch<strong>in</strong>a.Dr. Tai H<strong>in</strong>g Lam <strong>and</strong> colleagues at <strong>the</strong> University <strong>of</strong> Hong Kongexplored whe<strong>the</strong>r <strong>the</strong> available data were adequate to characterizelong-term, cumulative exposure to air pollution <strong>in</strong> <strong>the</strong>study population <strong>of</strong> approximately 10,000 older Guangzhouresidents (Figure 13.1). Unfortunately, <strong>the</strong> <strong>in</strong>vestigators wereunable to demonstrate a sufficient gradient <strong>of</strong> exposures <strong>in</strong>Guangzhou, as even <strong>the</strong> relatively clean area <strong>in</strong> <strong>the</strong> study hadPM 10 concentrations <strong>of</strong> 135 µg/m 3 dur<strong>in</strong>g <strong>the</strong> study period,<strong>and</strong> because even <strong>in</strong> <strong>the</strong> w<strong>in</strong>ter, when <strong>the</strong> most extreme gradient<strong>of</strong> pollution was observed (Figure 13.2), <strong>the</strong>re was verylittle variation among <strong>the</strong> exposures <strong>of</strong> <strong>the</strong> study population.Assess<strong>in</strong>g <strong>the</strong> effects <strong>of</strong> long-term exposure to air pollution <strong>in</strong><strong>Asia</strong> rema<strong>in</strong>s a key research priority.Figure 13.1. Geographic distribution <strong>of</strong> patients <strong>in</strong> Guangzhou. [Repr<strong>in</strong>tedfrom Lam et al. 2009.]Figure 13.2. Predicted w<strong>in</strong>ter concentrations <strong>of</strong> PM 10 (mg/m 3 ) <strong>in</strong> Guangzhou.[Adapted from Lam et al. 2009.]PM 2.5 , 20 µg/m 3 PM 10 , or 20 µg/m 3 black smoke is plottedaccord<strong>in</strong>g to <strong>the</strong> exposure period (approximate number <strong>of</strong>days, on a log scale). The PM effects <strong>in</strong>crease with <strong>in</strong>creas<strong>in</strong>gduration <strong>of</strong> exposure, <strong>and</strong> <strong>the</strong> most recent exposures have<strong>the</strong> largest effects (thus <strong>the</strong> need for a log scale for time).With regard to <strong>the</strong> natural experiments <strong>and</strong> <strong>in</strong>terventionstudies <strong>in</strong> <strong>the</strong> Utah Valley, <strong>in</strong> Dubl<strong>in</strong>, <strong>and</strong> at <strong>the</strong> SouthwesternU.S. copper smelter, <strong>the</strong> expected drop <strong>in</strong> <strong>the</strong> risk <strong>of</strong>mortality due to a reduction <strong>in</strong> exposure may not be completelyrealized over <strong>the</strong> relatively short period — just 6 to13 months. However, extended analyses <strong>of</strong> <strong>the</strong> Harvard SixCities Study suggest that <strong>the</strong> reduction <strong>in</strong> mortality risks88
HEI International Scientific Oversight Committeemay be largely realized with<strong>in</strong> as short a time as 1 to 2 years.Regardless, <strong>the</strong> evidence suggests that <strong>the</strong> short-term exposurestudies capture only a small amount <strong>of</strong> <strong>the</strong> overallhealth effects <strong>of</strong> long-term, repeated exposure to PM.Adverse health effects are dependent on both exposureconcentrations <strong>and</strong> length <strong>of</strong> exposure, <strong>and</strong> long-termexposures have larger, more persistent cumulative effectsthan short-term exposures. (For a more detailed discussion,see Pope <strong>and</strong> Dockery 2006 <strong>and</strong> Pope 2007.)<strong>the</strong>ir growth <strong>of</strong> lung function that <strong>in</strong>creased as residentialdistance to major roadways decreased (Figure 36). Theextent to which <strong>the</strong>se deficits <strong>in</strong> growth <strong>of</strong> lung functionwill affect <strong>the</strong> long-term health <strong>of</strong> <strong>the</strong>se children is not fullyunderstood, but given <strong>the</strong> importance <strong>of</strong> lung function as adeterm<strong>in</strong>ant <strong>of</strong> morbidity <strong>and</strong> mortality throughout adulthood,<strong>the</strong>se pollution-related deficits <strong>in</strong> growth between 10<strong>and</strong> 18 years <strong>of</strong> age are a substantial concern.AIR POLLUTION, ADVERSE REPRODUCTIVEOUTCOMES, AND CHILD HEALTHAs noted above <strong>and</strong> <strong>in</strong>dicated <strong>in</strong> Figure 33, air pollutionhas been associated with postneonatal <strong>in</strong>fant mortality(Woodruff TJ et al. 1997; 2006b). Recent reviews have generallyconcluded that PM air pollution exposure is fairlyconsistently associated with postneonatal respiratory mortalitybut that <strong>the</strong>re is less compell<strong>in</strong>g evidence <strong>of</strong> a l<strong>in</strong>kbetween PM <strong>and</strong> sudden <strong>in</strong>fant death syndrome (Gl<strong>in</strong>ianaiaet al. 2004a; Tong <strong>and</strong> Colditz 2004; Lacasana et al.2005; American Academy <strong>of</strong> Pediatrics Committee onEnvironmental <strong>Health</strong> 2004; Dales et al. 2004; Maisonet etal. 2004; Šrám et al. 2005). Time-series studies <strong>of</strong> dailymortality <strong>in</strong> Mexico, Thail<strong>and</strong>, <strong>and</strong> Brazil have reportedassociations between short-term exposure to particulatepollution <strong>and</strong> daily mortality from all natural causes oracute respiratory <strong>in</strong>fections <strong>in</strong> children less than 5 years <strong>of</strong>age (Romieu et al. 2002; Cohen et al. 2004). A rapidlygrow<strong>in</strong>g literature about <strong>the</strong> effects <strong>of</strong> air pollution onadverse reproductive outcomes such as low birth weight,premature birth, fetal growth retardation, <strong>in</strong>trauter<strong>in</strong>emortality, <strong>and</strong> birth defects (American Academy <strong>of</strong> PediatricsCommittee on Environmental <strong>Health</strong> 2004; Maisonetet al. 2004; Šrám et al. 2005) suggest that air pollutionexposure impacts fetal growth, premature birth, <strong>and</strong>related birth outcomes, though important gaps <strong>in</strong> ourknowledge rema<strong>in</strong> regard<strong>in</strong>g <strong>the</strong>se associations.With regard to air pollution <strong>and</strong> <strong>the</strong> health <strong>of</strong> grow<strong>in</strong>gchildren, several studies provide evidence that childrenwith long-term exposure to air pollution experienceslower growth <strong>in</strong> lung function. For example, a study <strong>of</strong>U.S. <strong>and</strong> Canadian children was conducted <strong>in</strong> <strong>the</strong> 1990s(Raizenne et al. 1996) <strong>and</strong> a more recent long-term prospectivestudy was performed with children 10 to 18 years<strong>of</strong> age liv<strong>in</strong>g <strong>in</strong> 12 sou<strong>the</strong>rn California communities (Gaudermanet al. 2004, 2007). Gauderman <strong>and</strong> colleagues (2004)reported that children liv<strong>in</strong>g <strong>in</strong> communities with relativelyhigh concentrations <strong>of</strong> air pollution have relativelylow levels <strong>of</strong> growth <strong>in</strong> lung function <strong>and</strong> an <strong>in</strong>creased risk<strong>of</strong> hav<strong>in</strong>g a forced expiratory volume <strong>in</strong> 1 second [FEV 1 ] <strong>of</strong>< 80% <strong>of</strong> <strong>the</strong> predicted value (Figure 36). Fur<strong>the</strong>r analysis<strong>of</strong> <strong>the</strong>se children (Gauderman et al. 2007) showed deficits <strong>in</strong>Figure 36. Data from <strong>the</strong> Children’s <strong>Health</strong> Study regard<strong>in</strong>g <strong>the</strong> effect <strong>of</strong>air pollution exposure on lung development. A: Percent <strong>of</strong> children withgrowth <strong>in</strong> lung function (measured as FEV 1 ) <strong>of</strong> < 80% <strong>of</strong> <strong>the</strong> predictedvalue, accord<strong>in</strong>g to community mean PM 2.5 concentrations. B: Mean(95% CI) change <strong>in</strong> growth <strong>of</strong> lung function (measured as FVC, FEV 1 , <strong>and</strong>MMEF) at <strong>the</strong> end <strong>of</strong> an 8-year period, as compared with <strong>the</strong> start <strong>of</strong> <strong>the</strong>period, accord<strong>in</strong>g to distance <strong>of</strong> residence from major roadways.[Adapted from Gauderman et al. 2004 (A), 2007 (B).]89
<strong>Outdoor</strong> <strong>Air</strong> <strong>Pollution</strong> <strong>and</strong> <strong>Health</strong> <strong>in</strong> <strong>the</strong> Develop<strong>in</strong>g <strong>Countries</strong> <strong>of</strong> <strong>Asia</strong>CONTRIBUTION OF COPOLLUTANTSAs noted above, fairly consistent associations betweenPM 2.5 <strong>and</strong> various cardiopulmonary health endpo<strong>in</strong>tshave been observed, yet <strong>the</strong> roles <strong>of</strong> specific constituents<strong>of</strong> PM 2.5 <strong>and</strong> <strong>the</strong> role <strong>of</strong> various gaseous copollutants haveyet to be fully resolved. Measured concentrations <strong>of</strong> PM 2.5can <strong>in</strong> many contexts be thought <strong>of</strong> as an <strong>in</strong>dex <strong>of</strong> combustion-relatedair pollutants that <strong>in</strong>clude copollutants suchas O 3 , CO, SO 2 , <strong>and</strong> NO 2 .There is substantial evidence, however, that combustion-relatedcopollutants also contribute <strong>in</strong>dependently orsynergistically to <strong>the</strong> observed health effects. To date, <strong>in</strong>addition to PM, <strong>the</strong> evidence has led to a focus on threeadditional, related types or sources <strong>of</strong> pollution: troposphericO 3 , traffic-related pollutants, <strong>and</strong> sulfur oxides.As noted earlier <strong>and</strong> as <strong>in</strong>dicated <strong>in</strong> Figure 32, analysis<strong>of</strong> <strong>the</strong> NMMAPS data suggested daily changes <strong>in</strong> mortalityassociated with daily changes <strong>in</strong> O 3 concentrations (Bell etal. 2004a). A recent extended analysis <strong>of</strong> data from <strong>the</strong>ACS cohort attempted to evaluate <strong>the</strong> contribution <strong>of</strong> longtermO 3 exposure to air pollution–related mortality(Krewski et al. 2009). Although cardiovascular mortalityappeared to be more strongly associated with PM 2.5 pollutionthan O 3 , O 3 exposure appeared to be associated withan <strong>in</strong>creased risk <strong>of</strong> respiratory mortality, even after controll<strong>in</strong>gfor PM 2.5 exposure.Exposure to PM from traffic sources <strong>in</strong>cludes exposure tosubstantial secondary NO 3 <strong>and</strong> coexposure to NO 2 <strong>and</strong>CO. There is grow<strong>in</strong>g evidence <strong>of</strong> a role <strong>of</strong> traffic-relatedexposures more generally. The analyses by Lipfert <strong>and</strong> colleagues(2006) <strong>of</strong> U.S. Veterans Adm<strong>in</strong>istration data for acohort <strong>of</strong> male patients with hypertension suggested thattraffic density was a more “significant <strong>and</strong> robust predictor<strong>of</strong> survival <strong>in</strong> this cohort” than PM 2.5 . A recent Dutch study(Beelen et al. 2008) <strong>and</strong> o<strong>the</strong>rs (Adar et al. 2007; Samet2007) have found that <strong>in</strong>dicators <strong>of</strong> traffic-related exposuresuch as NO 2 , NO x , <strong>and</strong> traffic density <strong>and</strong> liv<strong>in</strong>g near majorroads are associated with an <strong>in</strong>creased risk <strong>of</strong> mortality.Likewise, exposure to pollution from coal-burn<strong>in</strong>gsources (or <strong>the</strong> burn<strong>in</strong>g <strong>of</strong> any sulfur-conta<strong>in</strong><strong>in</strong>g fuels) typically<strong>in</strong>cludes substantial exposure to secondary SO 42 <strong>and</strong>exposure to SO 2 , <strong>in</strong> addition to PM exposure, <strong>and</strong> <strong>the</strong>re isample evidence that sulfur oxide–related pollution contributesto health effects. As examples, <strong>in</strong> <strong>the</strong> Harvard Six CitiesStudy (Dockery et al. 1993) <strong>and</strong> <strong>the</strong> ACS cohort study(Krewski et al. 2000; Pope et al. 2002), mortality was associatedwith both PM 2.5 <strong>and</strong> various sulfur oxides (<strong>in</strong>clud<strong>in</strong>gSO 4 <strong>and</strong> SO 2 ). The mortality reductions associated with <strong>the</strong>8.5-month strike at a copper smelter (mentioned above)appeared to be due to reductions <strong>in</strong> <strong>the</strong> concentrations <strong>of</strong>SO 42 <strong>and</strong> related air pollutants across four Southwesternstates (Pope et al. 2007). Also, at a workshop on sourceapportionment, several <strong>in</strong>dependent research teams thatevaluated effects <strong>of</strong> short-term exposure found that <strong>the</strong>SO 4 2 -related components <strong>of</strong> PM 2.5 were most consistentlyassociated with daily mortality (Thurston et al. 2005).Depend<strong>in</strong>g on <strong>the</strong> source <strong>of</strong> pollution, concentrations <strong>of</strong>O 3 , SO 2 , NO 2 , or CO may be reasonable <strong>in</strong>dexes <strong>of</strong> exposureto pollution from various sources <strong>and</strong> are <strong>of</strong>ten associatedwith adverse health effects similar to those fromPM. However, <strong>the</strong> literature has yet to provide evidencethat a s<strong>in</strong>gle constituent or source <strong>of</strong> PM is responsible for<strong>the</strong> health effects (WHO 2006a, 2007c). Though <strong>the</strong>re isample evidence that various related copollutants contributeto observed health effects, <strong>the</strong> <strong>in</strong>dependent, additive,or synergistic effects <strong>of</strong> gaseous copollutants are notfully understood <strong>and</strong> rema<strong>in</strong> a matter <strong>of</strong> debate. A substantialchallenge regard<strong>in</strong>g air pollution studies <strong>in</strong> many parts<strong>of</strong> <strong>Asia</strong> has to do with limited air pollution monitor<strong>in</strong>g <strong>of</strong>PM 2.5 , O 3 , <strong>and</strong> various o<strong>the</strong>r pollutants.GAPS AND LIMITATIONS OF CURRENT KNOWLEDGEMuch has been learned about <strong>the</strong> adverse health effects<strong>of</strong> outdoor air pollution <strong>in</strong> <strong>the</strong> past 25 years, with epidemiologicresearch play<strong>in</strong>g a critical role <strong>in</strong> <strong>the</strong> growth <strong>of</strong> thisknowledge. None<strong>the</strong>less, important gaps rema<strong>in</strong> — especially<strong>the</strong> follow<strong>in</strong>g questions that are critical to publicpolicy. Which constituents <strong>of</strong> <strong>the</strong> pollutant mix, <strong>and</strong>which sources contribut<strong>in</strong>g to it, are <strong>the</strong> most toxic? Whichdiseases, social conditions, or genetic factors place peopleat <strong>in</strong>creased risk when <strong>the</strong>y are exposed to air pollution?To what extent does long-term exposure, especially dur<strong>in</strong>gchildhood, affect <strong>the</strong> development <strong>of</strong> chronic, life-threaten<strong>in</strong>gdisease? The answers to <strong>the</strong>se questions may well bedifferent <strong>in</strong> <strong>Asia</strong> than <strong>in</strong> <strong>the</strong> developed West, where to date<strong>the</strong> vast majority <strong>of</strong> studies have been conducted.Of particular relevance to <strong>Asia</strong> is <strong>the</strong> current uncerta<strong>in</strong>tyregard<strong>in</strong>g <strong>the</strong> shape <strong>of</strong> <strong>the</strong> air pollution concentration–response function for long-term exposure <strong>and</strong> mortalityfrom chronic cardiovascular <strong>and</strong> respiratory disease atlevels <strong>in</strong> major <strong>Asia</strong>n cities that exceed, by several orders<strong>of</strong> magnitude, <strong>the</strong> levels that are observed <strong>in</strong> contemporaryU.S. <strong>and</strong> European studies.90
Section IV. Updated Review <strong>of</strong> <strong>the</strong> <strong>Asia</strong>n Literatureon <strong>Air</strong> <strong>Pollution</strong> <strong>and</strong> <strong>Health</strong>LITERATURE REVIEWThe objective <strong>of</strong> this section is to describe <strong>the</strong> epidemiologicstudies <strong>of</strong> <strong>the</strong> health effects <strong>of</strong> air pollution <strong>in</strong> <strong>Asia</strong> thatwere reported <strong>in</strong> peer-reviewed literature from 1980 through2007. For this Special Report, we chose three regions <strong>of</strong> <strong>Asia</strong>:East <strong>Asia</strong> (<strong>in</strong>clud<strong>in</strong>g Ch<strong>in</strong>a [ma<strong>in</strong>l<strong>and</strong> Ch<strong>in</strong>a, Hong Kong, <strong>and</strong>Taipei,Ch<strong>in</strong>a], Japan, <strong>and</strong> South Korea), South <strong>Asia</strong>(<strong>in</strong>clud<strong>in</strong>g India), <strong>and</strong> Sou<strong>the</strong>ast <strong>Asia</strong> (<strong>in</strong>clud<strong>in</strong>g Indonesia<strong>and</strong> Thail<strong>and</strong>).S<strong>in</strong>ce <strong>the</strong> first comprehensive literature review was completed<strong>and</strong> reported on <strong>in</strong> Special Report 15 (HEI ISOC 2004),HEI has regularly updated <strong>and</strong> ma<strong>in</strong>ta<strong>in</strong>ed a database <strong>of</strong> <strong>the</strong>relevant epidemiologic studies through its PAPA–SAN program.At <strong>the</strong> time <strong>of</strong> this publication, <strong>the</strong> PAPA–SAN Website (www.heal<strong>the</strong>ffects.org/<strong>Asia</strong>/papasan-home.htm) conta<strong>in</strong>edsummaries <strong>of</strong> over 400 publications <strong>of</strong> air pollution<strong>and</strong> health conducted across <strong>Asia</strong> that were systematicallycompiled from <strong>the</strong> peer-reviewed scientific literature. Inorder to provide policy makers, <strong>in</strong>ternational lend<strong>in</strong>g organizations,<strong>and</strong> o<strong>the</strong>r key stakeholders with easy access to<strong>the</strong> latest air pollution research from across <strong>Asia</strong>, <strong>the</strong>PAPA–SAN results are summarized on <strong>the</strong> HEI Web site(<strong>Health</strong> Effects Institute 2008). For each report, PAPA–SANprovides <strong>the</strong> citation, a summary <strong>of</strong> f<strong>in</strong>d<strong>in</strong>gs, o<strong>the</strong>r keydata <strong>and</strong>, when available, a l<strong>in</strong>k to <strong>the</strong> abstract. Summariesare presented <strong>in</strong> table form, sorted by country or region,study design, pollutant, <strong>and</strong> health outcome; <strong>the</strong>y also areprovided <strong>in</strong> written form by country.SEARCH METHODSThe first step <strong>in</strong> <strong>the</strong> literature review was to update <strong>the</strong>PAPA–SAN database by identify<strong>in</strong>g all studies <strong>of</strong> populations<strong>in</strong> <strong>the</strong> <strong>Asia</strong>n region. In January <strong>and</strong> August 2007,searches <strong>of</strong> <strong>the</strong> peer-reviewed literature were performed toidentify any new, relevant studies on <strong>the</strong> health effects <strong>of</strong>outdoor air pollution <strong>in</strong> <strong>Asia</strong> published from 1980 through2007. Structured literature searches <strong>of</strong> <strong>the</strong> PubMed(www.ncbi.nlm.nih.gov/entrez/query.fcgi?db=PubMed),Web <strong>of</strong> Science (http://isiweb<strong>of</strong>knowledge.com/), <strong>and</strong>EMBASE (www.embase.com/) databases were conducted.Table 11 shows <strong>the</strong> medical subject head<strong>in</strong>gs (MeSH; <strong>the</strong>Table 11. Search Str<strong>in</strong>gs Used <strong>in</strong> <strong>the</strong> PAPA-SAN <strong>Asia</strong>nLiterature Search for 1983–2007, by Search Eng<strong>in</strong>eSearchEng<strong>in</strong>ePubMedEMBASEWeb <strong>of</strong>ScienceSearch Str<strong>in</strong>g(<strong>Asia</strong> or Ch<strong>in</strong>a or Hong Kong or India orIndonesia or Japan or Korea or Malaysia orPhilipp<strong>in</strong>es or S<strong>in</strong>gapore or Taiwan orThail<strong>and</strong> or Vietnam or Bangladesh orBhutan or Nepal or Sri Lanka or Cambodiaor Burma or Laos)<strong>and</strong>(air pollution or air pollutants or air qualityor dust or smog or smoke or vehicleemissions)<strong>and</strong>(health or mortality or morbidity or adverseeffects or prevalence or epidemiology)(<strong>Asia</strong> or Ch<strong>in</strong>a or Hong Kong or India orIndonesia or Japan or Korea or Malaysia orPhilipp<strong>in</strong>es or S<strong>in</strong>gapore or Taiwan orThail<strong>and</strong> or Vietnam or Bangladesh orBhutan or Nepal or Sri Lanka or Cambodiaor Burma or Laos)<strong>and</strong>(air pollution or air pollutants or airquality)<strong>and</strong>(health or mortality or morbidity or adverseeffects or prevalence or epidemiology)(<strong>Asia</strong> or Ch<strong>in</strong>a or Hong Kong or India orIndonesia or Japan or Korea or Malaysia orPhilipp<strong>in</strong>es or S<strong>in</strong>gapore or Taiwan orThail<strong>and</strong> or Vietnam or Bangladesh orBhutan or Nepal or Sri Lanka or Cambodiaor Burma or Laos)<strong>and</strong>(air pollution or air pollutants or airquality)<strong>and</strong>(health or mortality or morbidity or adverseeffects or prevalence or epidemiology)91
<strong>Outdoor</strong> <strong>Air</strong> <strong>Pollution</strong> <strong>and</strong> <strong>Health</strong> <strong>in</strong> <strong>the</strong> Develop<strong>in</strong>g <strong>Countries</strong> <strong>of</strong> <strong>Asia</strong>Figure 37. Steps <strong>of</strong> <strong>the</strong> PAPA–SAN <strong>Asia</strong>n literature review.National Library <strong>of</strong> Medic<strong>in</strong>e’s controlled vocabulary usedfor <strong>in</strong>dex<strong>in</strong>g articles) <strong>and</strong> o<strong>the</strong>r terms that were used tosearch each <strong>of</strong> <strong>the</strong> three databases.Searches <strong>of</strong> lead<strong>in</strong>g preventive medic<strong>in</strong>e <strong>and</strong> epidemiologyjournals <strong>in</strong> Ch<strong>in</strong>ese <strong>and</strong> South Korean languages were alsoconducted us<strong>in</strong>g <strong>the</strong> Ch<strong>in</strong>a National Knowledge Infrastructure(www.cnki.net) <strong>and</strong> KoreaMed (www.koreamed.org). Amanual search <strong>of</strong> <strong>the</strong> International Society for EnvironmentalEpidemiology (ISEE) <strong>and</strong> o<strong>the</strong>r <strong>in</strong>stitutional Websites was conducted to identify conference proceed<strong>in</strong>gs<strong>and</strong> Web publications pert<strong>in</strong>ent to PAPA–SAN. These <strong>in</strong>clude<strong>the</strong> follow<strong>in</strong>g: WHO regional <strong>and</strong> national <strong>of</strong>fices,<strong>the</strong> United Nations Environment Programme (UNEP), CAI-<strong>Asia</strong>, <strong>the</strong> World Bank, <strong>and</strong> <strong>the</strong> <strong>Asia</strong>n Development Bank.The results <strong>of</strong> <strong>the</strong> searches from each database, <strong>in</strong>clud<strong>in</strong>g<strong>the</strong> full reference <strong>and</strong> abstract (if available), were comb<strong>in</strong>ed<strong>in</strong>to a master database us<strong>in</strong>g Procite s<strong>of</strong>tware.Figure 37 shows <strong>the</strong> flow chart used for evaluat<strong>in</strong>g relevantstudies <strong>and</strong> remov<strong>in</strong>g duplicate results. We excludedstudies if (1) <strong>the</strong>y were conducted <strong>in</strong> countries that werenot relevant to PAPA–SAN, (2) <strong>the</strong>y perta<strong>in</strong>ed to exposureso<strong>the</strong>r than ambient outdoor air pollution (i.e., <strong>in</strong>door oroccupational exposures), (3) <strong>the</strong>y conducted animal toxicologyor cl<strong>in</strong>ical studies with humans, or (4) <strong>the</strong>yassessed or measured only concentrations <strong>of</strong> air pollutants<strong>and</strong> not health effects. In addition, articles that did notreport orig<strong>in</strong>al research or reported only estimates <strong>of</strong> ei<strong>the</strong>rhealth effects or air pollution effects but not both were alsoexcluded. F<strong>in</strong>ally, specific key words that were used toexclude studies from <strong>the</strong> review were as follows: Turkey,Israel, Lebanon, Saudi Arabia, Kuwait, Iraq, Iran, Uzbekistan,Kazakhstan; <strong>in</strong>door, tobacco, cigarette, smok<strong>in</strong>g,cook<strong>in</strong>g; radiation, radioactive, radon, arsenic, diox<strong>in</strong>,cadmium, formaldehyde, mercury, mite, mold, fungi,pollen, asbestos; rat, mice, <strong>in</strong>sect, <strong>in</strong> vitro; occupational,workplace, workers, <strong>in</strong>dustry, laboratory; cl<strong>in</strong>ic, sickbuild<strong>in</strong>g, social, tree, plant, diet, war, x-ray, acid ra<strong>in</strong>; <strong>and</strong>policy, education, review, case report, accident, cost–benefit,economic, <strong>and</strong> meta-analysis.After all <strong>of</strong> <strong>the</strong> searches were complete <strong>and</strong> <strong>the</strong> relevantpapers were identified, results were compared with <strong>the</strong> St.George’s <strong>Air</strong> <strong>Pollution</strong> Epidemiology Database (APED;92
HEI International Scientific Oversight CommitteeFigure 38. Studies identified <strong>in</strong> <strong>the</strong> PAPA–SAN <strong>Asia</strong>n literature review,accord<strong>in</strong>g to year <strong>of</strong> publication, 1980–2007.described below <strong>in</strong> more detail <strong>in</strong> Section V. QuantitativeAssessment <strong>of</strong> Daily Time-Series Studies), which conta<strong>in</strong>sa body <strong>of</strong> time-series <strong>and</strong> panel studies that is periodicallyupdated us<strong>in</strong>g systematic search methods. Referencesidentified <strong>in</strong> ei<strong>the</strong>r PAPA–SAN or APED, but not both,were shared, <strong>and</strong> <strong>the</strong> reasons for <strong>the</strong> omission <strong>in</strong> one databasewere exam<strong>in</strong>ed. Discrepancies between <strong>the</strong> list<strong>in</strong>gs <strong>of</strong>a given study <strong>in</strong> <strong>the</strong> two databases were also reconciled.A form was developed for extract<strong>in</strong>g key <strong>in</strong>formationfrom each pert<strong>in</strong>ent study. The key <strong>in</strong>formation <strong>in</strong>cluded<strong>the</strong> author or authors, publication journal <strong>and</strong> year; studylocation, design, study period, population, exposure, <strong>and</strong>outcomes; <strong>and</strong> major f<strong>in</strong>d<strong>in</strong>gs as reported <strong>and</strong> summarizedby <strong>the</strong> authors. For quality control, data extraction wasconducted <strong>in</strong>dependently by two reviewers tra<strong>in</strong>ed <strong>in</strong> epidemiology.Any discrepancies were resolved by consensus<strong>of</strong> <strong>the</strong> reviewers. All relevant publications were added toan Access (Micros<strong>of</strong>t Corp., Redmond, WA) database <strong>and</strong>summary statistics were tallied us<strong>in</strong>g Statistical Packagefor <strong>the</strong> Social Sciences s<strong>of</strong>tware, version 15.0.Table 12. Studies Identified <strong>in</strong> <strong>the</strong> PAPA-SAN <strong>Asia</strong>nLiterature Review, by Location Studied aLocationPublications(n)Bangladesh 2Ch<strong>in</strong>a 110Hong Kong 25India 43Indonesia 10Japan 60South Korea 51Malaysia 3Pakistan 3S<strong>in</strong>gapore 10Sri Lanka 3Taiwan b 80Thail<strong>and</strong> 26a Three <strong>of</strong> <strong>the</strong> 423 studies spanned multiple countries <strong>and</strong> are counted wi<strong>the</strong>ach country, hence 426 <strong>in</strong> this table.b Taiwan was used as a search term for Taipei,Ch<strong>in</strong>a.SEARCH RESULTSThe current database <strong>in</strong>cludes results <strong>of</strong> a search conducted<strong>in</strong> January 2007 <strong>and</strong> ano<strong>the</strong>r <strong>in</strong> August 2007 thatidentified 144 publications, br<strong>in</strong>g<strong>in</strong>g <strong>the</strong> total number <strong>of</strong>publications <strong>in</strong> <strong>the</strong> PAPA–SAN database to over 400 thatwere published between 1980 <strong>and</strong> 2007 (Figure 38). Thesepublications <strong>in</strong>cluded studies from 11 <strong>Asia</strong>n countries:Bangladesh, Ch<strong>in</strong>a (ma<strong>in</strong>l<strong>and</strong> Ch<strong>in</strong>a, Hong Kong, <strong>and</strong>Taipei,Ch<strong>in</strong>a), India, Indonesia, Japan, South Korea,Malaysia, Pakistan, S<strong>in</strong>gapore, Sri Lanka, <strong>and</strong> Thail<strong>and</strong>.Table 12 <strong>and</strong> Figure 39 show <strong>the</strong> number <strong>of</strong> publicationsaccord<strong>in</strong>g to <strong>the</strong> country <strong>in</strong> which <strong>the</strong> study was conducted.For <strong>the</strong> first time, <strong>the</strong> search identified studiesfrom Bangladesh, Pakistan, <strong>and</strong> Sri Lanka. Most <strong>of</strong> <strong>the</strong>newly identified publications focused on respiratory <strong>and</strong>cardiovascular outcomes, which cont<strong>in</strong>ue to illustrate <strong>the</strong>adverse effects <strong>of</strong> ambient pollution <strong>in</strong> <strong>the</strong> area. In addition,27 publications summarized <strong>the</strong> public healthimpacts <strong>of</strong> air pollution, with some studies <strong>in</strong>clud<strong>in</strong>g estimates<strong>of</strong> <strong>the</strong> public health costs <strong>in</strong> economic terms.Studies exam<strong>in</strong><strong>in</strong>g subcl<strong>in</strong>ical markers <strong>of</strong> lead exposure(21) <strong>and</strong> benzene exposure (11) were also identified.93
<strong>Outdoor</strong> <strong>Air</strong> <strong>Pollution</strong> <strong>and</strong> <strong>Health</strong> <strong>in</strong> <strong>the</strong> Develop<strong>in</strong>g <strong>Countries</strong> <strong>of</strong> <strong>Asia</strong>Figure 39. Number <strong>of</strong> studies identified <strong>in</strong> <strong>the</strong> PAPA–SAN <strong>Asia</strong>n literature review, accord<strong>in</strong>g to country <strong>of</strong> study.Over half <strong>of</strong> <strong>the</strong> studies (216) estimated <strong>the</strong> health effects<strong>of</strong> exposure to both PM <strong>and</strong> gaseous pollutants, <strong>and</strong> o<strong>the</strong>rsestimated <strong>the</strong> effects <strong>of</strong> exposure to PM only (50) or gaseouspollutants only (30). Collectively, <strong>the</strong> studies exam<strong>in</strong>edhealth outcomes that span <strong>the</strong> range <strong>of</strong> health effectsrecently identified as “adverse” by <strong>the</strong> ATS (2000)(<strong>in</strong>clud<strong>in</strong>g death, respiratory symptoms, lung function, <strong>and</strong>adverse pregnancy outcomes) (Table 13). Several also exam<strong>in</strong>edbiomarkers <strong>of</strong> exposure <strong>and</strong> <strong>in</strong>termediate effects,<strong>in</strong>clud<strong>in</strong>g hospital admissions. The studies used a variety <strong>of</strong>designs (Table 13). Cross-sectional studies (chiefly <strong>of</strong> respiratorysymptoms <strong>and</strong> pulmonary function) <strong>and</strong> time-seriesstudies (<strong>in</strong>clud<strong>in</strong>g episode studies) made up approximately63% <strong>of</strong> <strong>the</strong> total.A detailed quantitative review was conducted for asubset <strong>of</strong> <strong>the</strong> 423 studies identified, focus<strong>in</strong>g on <strong>the</strong> timeseriesstudies <strong>of</strong> daily mortality <strong>and</strong> hospital admissions.On <strong>the</strong> basis <strong>of</strong> <strong>the</strong> results as reported by <strong>the</strong> authors <strong>and</strong>summarized <strong>in</strong> <strong>the</strong> PAPA–SAN database, we found thatmost studies conducted <strong>in</strong> <strong>Asia</strong> report that air pollution isassociated with an <strong>in</strong>creased risk or prevalence <strong>of</strong> a widevariety <strong>of</strong> adverse health outcomes <strong>in</strong> adults <strong>and</strong> children(ATS 2000). Given <strong>the</strong> wide diversity <strong>of</strong> study designs <strong>and</strong>data sources, <strong>the</strong> quality <strong>of</strong> each <strong>of</strong> <strong>the</strong> 423 studies was notassessed, with <strong>the</strong> exception <strong>of</strong> <strong>the</strong> daily time-seriesstudies (which were <strong>the</strong> focus <strong>of</strong> APED). In this <strong>in</strong>itialreview, it was also not possible to assess <strong>the</strong> likelihoodthat only, or predom<strong>in</strong>antly, positive studies had beenpublished (i.e., <strong>the</strong> likelihood <strong>of</strong> publication bias) for <strong>the</strong>literature as a whole.94
HEI International Scientific Oversight CommitteeTable 13. Characteristics <strong>of</strong> <strong>the</strong> 423 Studies Identified <strong>in</strong><strong>the</strong> PAPA-SAN <strong>Asia</strong>n Literature Review, 1980–2007CharacteristicStudies(n)<strong>Health</strong> Outcome aDeath 99Hospital admission, visit, or discharge 46Respiratory symptoms, lung function, 174or asthmaBiomarker 47Adverse pregnancy outcomes 23Lung cancer 18Economic assessment <strong>in</strong>dex 22O<strong>the</strong>r 44Study DesignCross-sectional 168Time series b 98Cohort 28Panel 28Case–control 10Case crossover 20<strong>Health</strong> impact 44Ecologic 24Descriptive 2Unspecified 1Exposure aTSP, RSP, SPM 118PM 10 147PM 2.5 52NO x 73SO 2 207CO 86O 3 104Lead 21Unspecified 34O<strong>the</strong>r 44a Studies could have addressed more than one health outcome or exposure.b Time-series studies <strong>in</strong>cluded episode studies.95
Section V. Quantitative Assessment <strong>of</strong> DailyTime-Series StudiesINTRODUCTIONTime-series studies <strong>of</strong> daily mortality have been conducted<strong>in</strong> a wide range <strong>of</strong> cities <strong>and</strong> countries around <strong>the</strong>world us<strong>in</strong>g broadly similar methods <strong>of</strong> analysis <strong>and</strong>report<strong>in</strong>g <strong>of</strong> results. The evidence <strong>the</strong>y provide contributesto public policy decisions at national <strong>and</strong> <strong>in</strong>ternationallevels. The contribution <strong>of</strong> <strong>the</strong> <strong>Asia</strong>n time-series literatureto this <strong>in</strong>ternational body <strong>of</strong> evidence was critically evaluated<strong>in</strong> 2004 (HEI ISOC 2004). This section presentsupdated results for <strong>the</strong> quantitative analysis <strong>of</strong> <strong>the</strong> timeseriesstudies <strong>of</strong> daily mortality <strong>and</strong> hospital admissions <strong>in</strong><strong>Asia</strong>. Publications <strong>of</strong> time-series studies <strong>in</strong> English <strong>and</strong><strong>Asia</strong>n languages were identified <strong>in</strong> <strong>the</strong> PAPA–SAN literaturesearch, as described above, <strong>and</strong> <strong>in</strong> APED, which isdetailed below. We first describe <strong>the</strong> general characteristics<strong>of</strong> <strong>the</strong>se studies (<strong>the</strong>ir locations, population characteristics,<strong>and</strong> details <strong>of</strong> exposures) <strong>and</strong> <strong>the</strong>n discuss <strong>in</strong> greaterdetail studies <strong>of</strong> selected comb<strong>in</strong>ations <strong>of</strong> pollutants <strong>and</strong>health outcomes. Where appropriate (<strong>and</strong> possible), weassessed variation (heterogeneity) <strong>in</strong> <strong>the</strong> direction <strong>and</strong>sizes <strong>of</strong> <strong>the</strong> effect estimates extracted from <strong>the</strong>se studiesbefore calculat<strong>in</strong>g summary estimates. We also evaluated<strong>the</strong> possibility that publication bias may have <strong>in</strong>fluenced<strong>the</strong> results <strong>of</strong> <strong>the</strong> meta-analysis.Two search strategies were used to identify appropriatestudies for <strong>in</strong>clusion <strong>in</strong> this review. The first, used to construct<strong>the</strong> PAPA–SAN database, focused on <strong>the</strong> identification<strong>of</strong> air pollution studies on health <strong>in</strong> <strong>Asia</strong>. The secondsearch strategy, used to construct <strong>the</strong> APED at St. George’s,University <strong>of</strong> London, focused on <strong>the</strong> identification <strong>of</strong>daily time-series studies <strong>of</strong> <strong>the</strong> short-term health effects <strong>of</strong>air pollution worldwide. Results from <strong>the</strong> two databaseswere <strong>the</strong>n comb<strong>in</strong>ed to arrive at a def<strong>in</strong>itive list <strong>of</strong> <strong>Asia</strong>ntime-series studies, as described above.SYSTEMATIC ASCERTAINMENT OF RELEVANT TIME-SERIES STUDIES FOR APEDLiterature SearchThe search strategy used <strong>in</strong> APED aimed to identify publishedtime-series studies <strong>in</strong>dexed <strong>in</strong> PubMed, EMBASE,<strong>and</strong> Web <strong>of</strong> Science. Search str<strong>in</strong>gs were developed toidentify time-series studies on <strong>the</strong> basis <strong>of</strong> study design,pollutants, <strong>and</strong> health outcomes. An example <strong>of</strong> <strong>the</strong>sesearch str<strong>in</strong>gs is as follows (<strong>the</strong> syntax varies slightlyamong <strong>the</strong> three search eng<strong>in</strong>es; see Figure 37): “(air pollutionor pollution or smog or particle or particulate or ozoneor black smoke or sulfate or sulfur dioxide or nitric oxideor nitrogen dioxide or carbon monoxide) <strong>and</strong> (timeseriesor time-series or time series or daily) <strong>and</strong> (mortality ordeath or dy<strong>in</strong>g or hospital admission or admission oremergency room or visit or attendance or ‘a&e’ or ‘a <strong>and</strong> e’or accident <strong>and</strong> emergency or general pract or physician orconsultation or emergency department)”. The studiesidentified <strong>in</strong> <strong>the</strong> three search eng<strong>in</strong>es were downloaded<strong>in</strong>to Reference Manager s<strong>of</strong>tware, version 11 (ThompsonReuters, Carlsbad CA), where <strong>the</strong>y were comb<strong>in</strong>ed <strong>and</strong>duplicates removed (see Figure 37).The results <strong>of</strong> <strong>the</strong> APED searches were <strong>the</strong>n comb<strong>in</strong>edwith <strong>the</strong> results <strong>of</strong> searches <strong>of</strong> time-series studies <strong>in</strong> particularfor PAPA–SAN. The result<strong>in</strong>g list was supplemented bystudies identified by local <strong>in</strong>vestigators <strong>and</strong> from searches <strong>of</strong>local <strong>Asia</strong>n Web-based literature databases, as describedabove.A two-stage selection process was <strong>the</strong>n used to remove<strong>the</strong> studies that were not obviously time-series studies <strong>and</strong><strong>the</strong>n to identify, from study abstracts, those that were def<strong>in</strong>itelytime-series studies. Pr<strong>in</strong>ted copies were <strong>the</strong>nobta<strong>in</strong>ed <strong>and</strong> <strong>the</strong>ir suitability for <strong>in</strong>clusion <strong>in</strong> APED wasassessed. The result <strong>of</strong> this sift<strong>in</strong>g process was a list <strong>of</strong>time-series studies that may or may not provide numericalestimates <strong>of</strong> <strong>the</strong> short-term effects <strong>of</strong> air pollution onhealth. The utility <strong>of</strong> <strong>the</strong>se studies depended on <strong>the</strong> details<strong>of</strong> <strong>the</strong> study design, statistical methods, <strong>and</strong> presentation<strong>of</strong> results. The studies were <strong>the</strong>n checked to see whe<strong>the</strong>r<strong>the</strong>y met <strong>the</strong> selection criteria, all <strong>of</strong> which had to be metfor <strong>in</strong>clusion:• The study was based on at least 1 year <strong>of</strong> daily data.• The analysis <strong>in</strong>cluded some attempt to control forimportant confound<strong>in</strong>g factors (such as season <strong>and</strong>long-term time trends <strong>in</strong> <strong>the</strong> data).• The study reported sufficient <strong>in</strong>formation for <strong>the</strong> calculation<strong>of</strong> a st<strong>and</strong>ardized effect estimate for comparison<strong>in</strong> <strong>the</strong> quantitative analysis (i.e., effect estimates97
<strong>Outdoor</strong> <strong>Air</strong> <strong>Pollution</strong> <strong>and</strong> <strong>Health</strong> <strong>in</strong> <strong>the</strong> Develop<strong>in</strong>g <strong>Countries</strong> <strong>of</strong> <strong>Asia</strong>for a st<strong>and</strong>ard <strong>in</strong>crement <strong>in</strong> pollution). For this to bepossible, regression coefficients must have beenreported. (A study that reported only correlation coefficientswould not meet this criterion.)• The study focused on a general population. Studies <strong>of</strong>any k<strong>in</strong>d <strong>of</strong> subgroup <strong>of</strong> <strong>the</strong> general population, suchas smokers, women, or people with heart disease didnot meet <strong>the</strong> criterion.Data AbstractionFor each time-series study that provided sufficientnumerical <strong>in</strong>formation to enable <strong>the</strong>ir effect estimates to best<strong>and</strong>ardized, a data extraction form was completed. Eachform was divided <strong>in</strong>to two parts, <strong>the</strong> first part conta<strong>in</strong><strong>in</strong>gstudy <strong>in</strong>formation <strong>and</strong> <strong>the</strong> second part, estimate <strong>in</strong>formation.Study <strong>in</strong>formation <strong>in</strong>cluded <strong>the</strong> study identifier (ReferenceManager identification number), title, authors, <strong>and</strong> fullreference list<strong>in</strong>g. Estimate <strong>in</strong>formation <strong>in</strong>cluded detailsabout <strong>the</strong> health outcome <strong>and</strong> pollutant be<strong>in</strong>g studied plusmany more data necessary for quantification <strong>and</strong> st<strong>and</strong>ardization,such as <strong>the</strong> units <strong>of</strong> measurement, <strong>the</strong> duration <strong>of</strong>each daily measurement (e.g., 24 hours or 1 hour), <strong>and</strong> <strong>the</strong>range used to scale <strong>the</strong> effect estimates.The <strong>in</strong>formation on each data extraction form was <strong>the</strong>nentered <strong>in</strong>to a Micros<strong>of</strong>t Access (version 2002) database.Data related to <strong>the</strong> study as a whole <strong>in</strong>cluded study title,authors, journal name, volume <strong>and</strong> page numbers, length <strong>of</strong><strong>the</strong> study period, year <strong>of</strong> <strong>the</strong> study, <strong>and</strong> <strong>the</strong> cont<strong>in</strong>ent <strong>and</strong><strong>Asia</strong>n region <strong>in</strong> which <strong>the</strong> study occurred. Data specific toeach regression coefficient that quantified <strong>the</strong> change <strong>in</strong> agiven health outcome per unit change <strong>in</strong> a given pollutantwere also recorded. These data were used to calculate st<strong>and</strong>ardizedeffect estimates <strong>and</strong> <strong>the</strong>ir 95% CIs.The studies reported RRs, regression coefficients, or percentchanges <strong>in</strong> <strong>the</strong> mean number <strong>of</strong> events per day as measures<strong>of</strong> <strong>the</strong> association between pollutant concentrations<strong>and</strong> health outcomes. In order to make results comparableacross <strong>the</strong> studies, we used Micros<strong>of</strong>t Access queries to convertestimates <strong>in</strong>to a st<strong>and</strong>ard form: <strong>the</strong> percent change <strong>in</strong> <strong>the</strong>mean number <strong>of</strong> daily events associated with a 10-µg/m 3<strong>in</strong>crease <strong>in</strong> pollutant concentration (or a 1-mg/m 3 <strong>in</strong>creasefor CO), which, for simplicity, we refer to as estimates.When <strong>the</strong> logarithm <strong>of</strong> pollutant concentration was usedas <strong>the</strong> measure <strong>of</strong> exposure <strong>in</strong> <strong>the</strong> model, <strong>the</strong> estimateswere calculated for a 10-µg/m 3 <strong>in</strong>crease above <strong>the</strong> mean ormedian pollutant concentration (or a 1-mg/m 3 <strong>in</strong>crease forCO).Selection <strong>of</strong> Lag TimesThe short-term relations between air pollution <strong>and</strong>health effects are complex <strong>and</strong> not wholly captured by <strong>the</strong>regression techniques generally used. The number <strong>of</strong> hospitaladmissions or deaths on any one day is likely to havebeen affected by exposure to air pollution on <strong>the</strong> same day<strong>and</strong> on several previous days. Also, air pollution on a particularday is likely to affect health on a number <strong>of</strong> subsequentdays. In time-series analyses, <strong>the</strong> cumulative effects <strong>of</strong> severaldays <strong>of</strong> previous exposure are sometimes <strong>in</strong>vestigatedby means <strong>of</strong> a cumulative lag time, <strong>in</strong> which exposures areaveraged over 2 or more previous days. More recently, distributed-lagmodels have been used to estimate <strong>the</strong> <strong>in</strong>dependentcontribution to health outcomes on a given day <strong>of</strong> each<strong>of</strong> several previous days. Both analytic approaches tend toestimate larger effects than analyses based on s<strong>in</strong>gle-day lagtimes (Samet et al. 2000b; Zanobetti et al. 2002), althoughs<strong>in</strong>gle-day lag times are used far more commonly.Investigators vary <strong>in</strong> which lag time (s<strong>in</strong>gle, cumulative,or distributed) <strong>the</strong>y choose to analyze <strong>and</strong> present <strong>in</strong> publications.They may systematically choose results that <strong>in</strong>dicatelarger or smaller effects. Particularly <strong>in</strong> studies withlow statistical power, <strong>the</strong> play <strong>of</strong> chance (r<strong>and</strong>om error)will lead to a wider scatter <strong>of</strong> estimates from which tochoose. This fact has led some analysts to test or report arelatively restricted range <strong>of</strong> lagged estimates. Many studiesreport on one or more s<strong>in</strong>gle-day models, but <strong>the</strong> results arenot generally chosen or presented <strong>in</strong> a consistent way. Forthis reason, we could not select a particular lag time (e.g., 1day before <strong>the</strong> health event <strong>of</strong> <strong>in</strong>terest) a priori withouthav<strong>in</strong>g to remove studies from <strong>the</strong> analysis. We <strong>the</strong>reforeadopted <strong>the</strong> follow<strong>in</strong>g approach for select<strong>in</strong>g a lag time foranalysis. First, we focused our selection on s<strong>in</strong>gle-pollutantra<strong>the</strong>r than multi-pollutant models. S<strong>in</strong>gle-pollutant analysesare reported <strong>in</strong> virtually all studies. The pollutants<strong>in</strong>cluded <strong>in</strong> multi-pollutant models tend to vary amongstudies; <strong>the</strong>refore, <strong>the</strong>ir results are more difficult to compare.However, when only results from multi-pollutantmodels were given, <strong>the</strong> results from <strong>the</strong> model with <strong>the</strong>most pollutants were selected <strong>and</strong> recorded. This act simplified<strong>the</strong> abstraction <strong>of</strong> data from papers <strong>in</strong> which manycomb<strong>in</strong>ations <strong>of</strong> pollutants were exam<strong>in</strong>ed.Us<strong>in</strong>g this approach, we identified selected lag timesfrom <strong>the</strong> results presented <strong>in</strong> <strong>the</strong> papers. If an estimate <strong>of</strong>only one lagged time was presented (because only one wasei<strong>the</strong>r analyzed or reported), this estimate was recorded <strong>in</strong><strong>the</strong> Access database for <strong>the</strong> outcome–pollutant pair. Ifmore than one lag measure was presented, we selected onefor meta-analysis:• The lag time that <strong>the</strong> author focused on or stated a priori,• The lag time that was <strong>the</strong> most statistically significant(whe<strong>the</strong>r positive or negative), or• The lag time with <strong>the</strong> largest effect estimate (whe<strong>the</strong>rpositive or negative).98
HEI International Scientific Oversight CommitteeResults for a lag time <strong>of</strong> 0 days (lag 0) <strong>and</strong> 1 day (lag 1)were also recorded (if different from results for <strong>the</strong>selected lag time). When available, results for a cumulativelag time (i.e., <strong>the</strong> average <strong>of</strong> pollution measures over 2 ormore days) chosen accord<strong>in</strong>g to <strong>the</strong> same selection criteriawere also recorded.Multi-City StudiesSeveral studies presented <strong>the</strong> results <strong>of</strong> meta-analyses,<strong>in</strong>clud<strong>in</strong>g effect estimates for <strong>in</strong>dividual locations, multiplelocations, <strong>and</strong> summary estimates (i.e., effect estimatesfor all <strong>the</strong> locations toge<strong>the</strong>r). If such studies usedpreviously published data, we recorded only <strong>the</strong> summaryestimates. If previously unpublished city-specific resultswere presented, we recorded those as well as <strong>the</strong> summaryestimates. The city-specific results were <strong>the</strong>n processed<strong>and</strong> assessed as if <strong>the</strong>y came from a s<strong>in</strong>gle-city study.META-ANALYTIC METHODSMultiple Studies <strong>of</strong> a S<strong>in</strong>gle CityA number <strong>of</strong> studies have been conducted <strong>in</strong> <strong>the</strong> samecity, with vary<strong>in</strong>g degrees <strong>of</strong> overlap <strong>in</strong> <strong>the</strong> years studied.Some studies are by <strong>the</strong> same <strong>in</strong>vestigators; o<strong>the</strong>rs are not.We recorded all results from all studies. However, whencalculat<strong>in</strong>g summary estimates across cities, we used <strong>the</strong>most recent estimate for each city, on <strong>the</strong> basis that itwould be <strong>the</strong> most likely to reflect current analytic techniques<strong>and</strong> recent pollution concentrations. By not<strong>in</strong>clud<strong>in</strong>g several estimates from one city <strong>in</strong> <strong>the</strong> meta-analysis,we avoided weight<strong>in</strong>g that city disproportionately, at<strong>the</strong> cost <strong>of</strong> los<strong>in</strong>g <strong>in</strong>formative estimates.Computation <strong>of</strong> Summary EstimatesFor pollutant–outcome pairs for which <strong>the</strong>re were fouror more estimates, we computed summary estimates <strong>of</strong> <strong>the</strong>percent changes <strong>and</strong> <strong>the</strong>ir 95% CIs us<strong>in</strong>g a fixed-effectsmodel (with <strong>in</strong>verse variance weight<strong>in</strong>g), as well as ar<strong>and</strong>om-effects model us<strong>in</strong>g <strong>the</strong> method <strong>of</strong> DerSimonian<strong>and</strong> Laird (1986). The metan procedure <strong>in</strong> <strong>the</strong> s<strong>of</strong>twarepackage STATA was used to calculate <strong>the</strong> summary estimatesfrom <strong>the</strong> specific regression coefficients <strong>and</strong> <strong>the</strong>irassociated SEs. These statistics were determ<strong>in</strong>ed from <strong>the</strong>RRs presented <strong>in</strong> <strong>the</strong> studies. Summary estimates fromboth <strong>the</strong> fixed-effects <strong>and</strong> r<strong>and</strong>om-effects models are presented<strong>in</strong> forest plots. We tested <strong>the</strong> study-specific estimatesfor evidence <strong>of</strong> differences <strong>in</strong> result size or direction(heterogeneity) us<strong>in</strong>g <strong>the</strong> 2 test for heterogeneity. Because<strong>of</strong> <strong>the</strong> relatively low power <strong>of</strong> this test to detect such differences,P values less than 0.2 were considered to <strong>in</strong>dicateevidence <strong>of</strong> heterogeneity.Investigation <strong>of</strong> Publication BiasThe meta-analysis used results published <strong>in</strong> peerreviewedjournals. These may not represent all availableevidence, because some relevant reports may be published<strong>in</strong> o<strong>the</strong>r formats or may not be published at all. The exclusion<strong>of</strong> representation <strong>of</strong> <strong>the</strong>se reports could affect ourf<strong>in</strong>d<strong>in</strong>gs: Publication bias refers to <strong>the</strong> tendency for f<strong>in</strong>d<strong>in</strong>gsthat support a particular hypo<strong>the</strong>sis (<strong>in</strong> this case, thatair pollution has an adverse effect) to be published preferentially<strong>in</strong> peer-reviewed journals (Sterl<strong>in</strong>g 1959;Mahoney 1977; Simes 1986; Begg <strong>and</strong> Berl<strong>in</strong> 1989; Dickers<strong>in</strong>1997). Publication bias could have two consequencesfor our results. First, it could lead to a false conclusionregard<strong>in</strong>g <strong>the</strong> degree <strong>of</strong> support <strong>in</strong> <strong>the</strong> literature for anassociation between air pollution <strong>and</strong> a health outcome.Second, it could cause <strong>the</strong> size <strong>of</strong> a true association to beestimated <strong>in</strong>accurately.Time-series studies <strong>of</strong> rout<strong>in</strong>e health data may be particularlysubject to publication bias. One reason is that <strong>the</strong>data are relatively cheap to obta<strong>in</strong> <strong>and</strong> analyze, so thatauthors (hav<strong>in</strong>g <strong>in</strong>vested relatively little effort to conduct<strong>the</strong> analysis) may be less <strong>in</strong>cl<strong>in</strong>ed to publish f<strong>in</strong>d<strong>in</strong>gsthought to be un<strong>in</strong>terest<strong>in</strong>g or to contradict <strong>the</strong> prevail<strong>in</strong>gscientific consensus. Ano<strong>the</strong>r reason is that <strong>the</strong> analytictechniques used <strong>in</strong> time-series studies affect <strong>the</strong> results tosome extent; analysts may choose <strong>the</strong> techniques that give<strong>the</strong> results that <strong>the</strong>y th<strong>in</strong>k are most plausible. F<strong>in</strong>ally, asdiscussed above, time-series studies have <strong>the</strong> potential togenerate a large number <strong>of</strong> results for various outcomes,pollutants, <strong>and</strong> lag times; <strong>the</strong> author’s preexist<strong>in</strong>g beliefsmay affect <strong>the</strong> choice <strong>of</strong> which results to present. Publicationbias may be mitigated <strong>in</strong> planned multi-city studies(such as APHEA <strong>and</strong> NMMAPS) that commit to publish<strong>in</strong>gresults from all locations <strong>and</strong> that adopt an a priori lagtimespecification.Until recently, little attention has been paid to this possiblesource <strong>of</strong> bias <strong>in</strong> <strong>the</strong> air pollution literature(Anderson et al. 2005). One method for <strong>in</strong>vestigat<strong>in</strong>g <strong>the</strong>extent <strong>of</strong> publication bias is <strong>the</strong> funnel plot, <strong>in</strong> which estimatesare plotted aga<strong>in</strong>st <strong>the</strong>ir SEs. If <strong>the</strong> data lack publicationbias, <strong>the</strong>y will be scattered symmetrically <strong>in</strong> a funnelshape (Light <strong>and</strong> Pillemer 1984). Apparent asymmetry <strong>in</strong><strong>the</strong> funnel plot, <strong>in</strong>itial evidence <strong>of</strong> publication bias, can beverified by perform<strong>in</strong>g one <strong>of</strong> two types <strong>of</strong> regression analysison <strong>the</strong> data aga<strong>in</strong>st <strong>the</strong> <strong>in</strong>verse <strong>of</strong> <strong>the</strong> SE: an adjustedrank-correlationmethod, called <strong>the</strong> Begg test for asymmetry(with cont<strong>in</strong>uity correction) (Begg 1997) <strong>and</strong> aregression approach called <strong>the</strong> Egger test for publicationbias (Egger et al. 1997). Both approaches were used foreach meta-analysis; results are reported as P values <strong>in</strong>dicat<strong>in</strong>g<strong>the</strong> strength <strong>of</strong> <strong>the</strong> evidence for asymmetry <strong>in</strong> <strong>the</strong>funnel plot.99
<strong>Outdoor</strong> <strong>Air</strong> <strong>Pollution</strong> <strong>and</strong> <strong>Health</strong> <strong>in</strong> <strong>the</strong> Develop<strong>in</strong>g <strong>Countries</strong> <strong>of</strong> <strong>Asia</strong>RESULTSStudy CharacteristicsA total <strong>of</strong> 115 time-series studies <strong>in</strong>dexed <strong>in</strong> medicaldatabases (up to August 2007) were identified by <strong>the</strong>PAPA–SAN <strong>and</strong> APED search strategies. The 115 studieswere divided <strong>in</strong>to those that yielded usable numerical estimates<strong>of</strong> <strong>the</strong> effects <strong>of</strong> air pollution on health <strong>and</strong> thosewhose content was closely related to this topic but notappropriate for a quantitative systematic review. The publishedarticle for one study could not be found. Of <strong>the</strong> 114studies for which a copy <strong>of</strong> <strong>the</strong> published article wasfound, 82 were deemed to be suitable for quantitativemeta-analysis. The details <strong>of</strong> <strong>the</strong>se studies are given <strong>in</strong>Appendix Table A.1. Of <strong>the</strong> 32 studies not <strong>in</strong>cluded, 17 didnot meet <strong>the</strong> <strong>in</strong>clusion criteria, six did not provide numericalestimates, <strong>and</strong> n<strong>in</strong>e focused on <strong>the</strong> health effects <strong>of</strong>dust storms. (Studies <strong>of</strong> <strong>the</strong> health effects <strong>of</strong> dust stormswere not considered, because <strong>the</strong>y are not <strong>in</strong>vestigations <strong>of</strong>day-to-day effects <strong>of</strong> rout<strong>in</strong>e exposure to air pollution butra<strong>the</strong>r focus on <strong>the</strong> health effects <strong>of</strong> unusual pollution episodes.)The details <strong>of</strong> <strong>the</strong> 32 excluded studies are given <strong>in</strong>Appendix Table A.2.Two time-series study designs were applied to <strong>the</strong> dataobta<strong>in</strong>ed from <strong>the</strong> 82 time-series studies identified, forpurposes <strong>of</strong> quantitative analysis: conventional ecologicstudies based on numbers <strong>of</strong> health events, <strong>and</strong> case–crossover studies. Both study designs provide regressioncoefficients suitable for fur<strong>the</strong>r quantitative analysis <strong>and</strong>both use data from all days with<strong>in</strong> <strong>the</strong> study period — thatis, <strong>the</strong>y do not focus on isolated pollution episodes.Geographic Distribution <strong>of</strong> <strong>the</strong> StudiesThe majority <strong>of</strong> <strong>the</strong> 82 time-series studies selected forquantitative analysis were from Ch<strong>in</strong>a (46 <strong>in</strong> all: 16 <strong>in</strong>Taipei,Ch<strong>in</strong>a, 10 <strong>in</strong> Hong Kong, 8 <strong>in</strong> Shanghai, 7 <strong>in</strong> Beij<strong>in</strong>g, 2<strong>in</strong> Wuhan, <strong>and</strong> 1 each <strong>in</strong> Benxi, Chongq<strong>in</strong>g, <strong>and</strong> Shenyang).The vast majority <strong>of</strong> <strong>the</strong> 28 studies <strong>of</strong> South Korean citieswere <strong>of</strong> Seoul. The o<strong>the</strong>r studies were conducted <strong>in</strong> Japan(3), Thail<strong>and</strong> (2), India (1), S<strong>in</strong>gapore (1), <strong>and</strong> Malaysia (1).<strong>Health</strong> OutcomesA range <strong>of</strong> health outcomes were studied. We categorized<strong>the</strong>m as cause-specific mortality <strong>and</strong> cause-specifichospital admissions (Appendix Table A.3), as well ascause-specific community care. Among <strong>the</strong> studies <strong>of</strong> mortality,<strong>the</strong> most common outcome was mortality (38 studies)from all natural causes <strong>of</strong> death, followed by mortalityfrom cardiovascular disease (24) <strong>and</strong> all respiratory diseases(20). A smaller group <strong>of</strong> mortality studies exam<strong>in</strong>edmore specific causes <strong>of</strong> cardiovascular <strong>and</strong> respiratorymortality, such as cerebrovascular events or COPD. Studies<strong>of</strong> hospital admissions (<strong>in</strong>clud<strong>in</strong>g emergency room admissionsbut not visits) covered a range <strong>of</strong> respiratory <strong>and</strong> cardiovasculardiagnoses, <strong>the</strong> most common s<strong>in</strong>gle diagnosisbe<strong>in</strong>g asthma (13 studies), followed by cerebrovascularevents (6), <strong>and</strong> IHD (5). Studies <strong>of</strong> community care werefewer; outcomes <strong>in</strong> those studies <strong>in</strong>cluded emergencytransport, emergency room visit, primary care consultation,<strong>and</strong> absence from school.Mortality studies tended to <strong>in</strong>clude ei<strong>the</strong>r people <strong>of</strong> allages or people 65 years <strong>of</strong> age or older, <strong>the</strong> group <strong>in</strong> whichmost deaths occur. Studies also reported results for o<strong>the</strong>rage groups (Appendix Table A.4). Fur<strong>the</strong>rmore, <strong>in</strong> some<strong>Asia</strong>n countries <strong>and</strong> cities, <strong>in</strong>fant mortality is substantial.In some <strong>of</strong> <strong>the</strong>se locations, researchers have been able tostudy <strong>the</strong> association between air pollution <strong>and</strong> mortality<strong>in</strong> <strong>in</strong>fants <strong>and</strong> children. In many studies, hospital admissionstend to be subdivided by age to reflect <strong>the</strong> relativeimportance <strong>of</strong> admissions <strong>in</strong> younger age groups <strong>and</strong> <strong>the</strong>fact that some conditions (such as asthma) differ <strong>in</strong> <strong>the</strong>ircl<strong>in</strong>ical presentation between young <strong>and</strong> older patients.PollutantsMost pollutants studied <strong>in</strong> North America <strong>and</strong> Europewere represented <strong>in</strong> <strong>the</strong> 82 selected studies, with <strong>the</strong>exception <strong>of</strong> black smoke (which is measured us<strong>in</strong>g reflectance<strong>and</strong> is measured almost exclusively <strong>in</strong> Europe).O<strong>the</strong>r pollutants studied were SO 2 (63 studies), O 3 (52),NO 2 (48), PM 10 (56), PM 2.5 (9), TSP (23), <strong>and</strong> CO (32). ForO 3 , 24-hour, maximum 8-hour, <strong>and</strong> maximum 1-hourperiods were used as averag<strong>in</strong>g times <strong>and</strong> runn<strong>in</strong>g meanswere calculated.Effect EstimatesEffect estimates for <strong>the</strong> ma<strong>in</strong> pollutant–outcome pairsfor subjects <strong>of</strong> all ages from <strong>the</strong> time-series studies aresummarized <strong>in</strong> “forest plots” (Figures 40 to 60 <strong>and</strong> AppendixFigures A.1 to A.30). The estimates are presented as<strong>the</strong> percent change <strong>in</strong> <strong>the</strong> mean number <strong>of</strong> daily deaths orhospital admissions per 10-µg/m 3 <strong>in</strong>crease <strong>in</strong> mean pollutantconcentration (except for CO, for which <strong>the</strong> unit <strong>in</strong>creasestudied was 1 mg/m 3 ) <strong>and</strong> <strong>the</strong> associated 95% CI,which <strong>in</strong>dicates <strong>the</strong> precision <strong>of</strong> <strong>the</strong> estimate. For eachpollutant, estimates were plotted separately for daily numbers<strong>of</strong> deaths from all natural causes, deaths from respiratorycauses, deaths from cardiovascular causes, hospitaladmissions for respiratory causes, <strong>and</strong> hospital admissionsfor cardiovascular causes. With<strong>in</strong> <strong>the</strong>se broad groups, alldiagnoses for which estimates were available are plotted.Each estimate is labeled with <strong>the</strong> publication citation, <strong>and</strong>study location, <strong>and</strong> where applicable, cause <strong>of</strong> death or admission,age group, <strong>and</strong> averag<strong>in</strong>g time (for O 3 ).100
HEI International Scientific Oversight CommitteePM 10 Fifteen estimates for <strong>the</strong> association betweenPM 10 <strong>and</strong> all-natural-cause mortality at all ages werereported from eight cities (Figure 40). The majority <strong>of</strong> estimateswere positive, <strong>in</strong>dicat<strong>in</strong>g <strong>in</strong>creases (<strong>of</strong> < 1%) <strong>in</strong>mean numbers <strong>of</strong> deaths per day per 10-µg/m 3 <strong>in</strong>crease <strong>in</strong>PM 10 . Twelve <strong>of</strong> <strong>the</strong> fifteen estimates had lower confidencelimits that were greater than zero. Only one estimatewas negative (i.e., suggest<strong>in</strong>g that an <strong>in</strong>crease <strong>in</strong> <strong>the</strong> pollutionconcentration results <strong>in</strong> a decrease <strong>in</strong> <strong>the</strong> mortalityrate). All-natural-cause mortality was also studied <strong>in</strong> a range<strong>of</strong> age groups (Appendix Figure A.1a), <strong>in</strong>clud<strong>in</strong>g fourstudies <strong>of</strong> mortality <strong>in</strong> children <strong>and</strong> <strong>in</strong>fants (AppendixFigure A.1b).Figure 40. Percent change <strong>in</strong> <strong>the</strong> mean number <strong>of</strong> daily deaths from all natural causesper 10-µg/m 3 change <strong>in</strong> 24-hr mean PM 10 concentration among persons <strong>of</strong> all ages.Y-axis labels give study <strong>in</strong>formation <strong>in</strong> <strong>the</strong> follow<strong>in</strong>g sequence: reference citation <strong>and</strong>study location.101
<strong>Outdoor</strong> <strong>Air</strong> <strong>Pollution</strong> <strong>and</strong> <strong>Health</strong> <strong>in</strong> <strong>the</strong> Develop<strong>in</strong>g <strong>Countries</strong> <strong>of</strong> <strong>Asia</strong>Sixteen estimates <strong>of</strong> <strong>the</strong> association between PM 10 <strong>and</strong>deaths from respiratory diseases were available from eightcities (Figure 41). The majority <strong>of</strong> studies exam<strong>in</strong>ed deathsfrom all respiratory diseases, with only a few assess<strong>in</strong>gassociations for specific respiratory conditions such asasthma or COPD. The effect estimates tended to be largerthan those observed for all-natural-cause mortality (rang<strong>in</strong>gfrom <strong>in</strong>creases <strong>of</strong> 0% to 3% per 10-µg/m 3 <strong>in</strong>creases <strong>in</strong> PM 10 )<strong>and</strong> all but one were positive. Regard<strong>in</strong>g age-specific respiratorymortality, estimates from 25 reports were found(Appendix Figure A.2).Figure 41. Percent change <strong>in</strong> <strong>the</strong> mean number <strong>of</strong> daily deaths from respiratory causes per 10-µg/m 3 change <strong>in</strong> 24-hr meanPM 10 concentration among persons <strong>of</strong> all ages. Y-axis labels give study <strong>in</strong>formation <strong>in</strong> <strong>the</strong> follow<strong>in</strong>g sequence: reference citation,study location, <strong>and</strong> cause <strong>of</strong> death.102
HEI International Scientific Oversight CommitteeAnalyses <strong>of</strong> all mortality from cardiovascular diseaseyielded 23 PM 10 effect estimates from eight cities(Figure 42) for a range <strong>of</strong> cardiovascular endpo<strong>in</strong>ts. A fur<strong>the</strong>r30 PM 10 effect estimates from 16 cities were reportedfor specific age groups for a range <strong>of</strong> cardiovascular diseases<strong>in</strong>clud<strong>in</strong>g cardiac disease, stroke, <strong>and</strong> pulmonary heartdisease (Appendix Figure A.3). For mortality from cardiovasculardisease at any age, 13 reports were found; all buttwo <strong>of</strong> <strong>the</strong>se estimates were positive.Figure 42. Percent change <strong>in</strong> <strong>the</strong> mean number <strong>of</strong> daily deaths from cardiovascular causes per 10-µg/m 3 change <strong>in</strong> 24-hr mean PM 10concentration among persons <strong>of</strong> all ages. Y-axis labels give study <strong>in</strong>formation <strong>in</strong> <strong>the</strong> follow<strong>in</strong>g sequence: reference citation, study location,<strong>and</strong> cause <strong>of</strong> death.103
<strong>Outdoor</strong> <strong>Air</strong> <strong>Pollution</strong> <strong>and</strong> <strong>Health</strong> <strong>in</strong> <strong>the</strong> Develop<strong>in</strong>g <strong>Countries</strong> <strong>of</strong> <strong>Asia</strong>Also shown is <strong>the</strong> substantial body <strong>of</strong> evidence for positiveassociations between PM 10 <strong>and</strong> hospital admissions forrespiratory disease (Figure 43 <strong>and</strong> Appendix Figure A.4)<strong>and</strong> from cardiovascular disease (Figure 44 <strong>and</strong> AppendixFigure A.5). These results are presented for all ages <strong>and</strong>also for specific age groups.Figure 43. Percent change <strong>in</strong> <strong>the</strong> mean number <strong>of</strong> daily hospital admissions from respiratory causesper 10-µg/m 3 change <strong>in</strong> 24-hr mean PM 10 concentration among persons <strong>of</strong> all ages. Y-axis labels givestudy <strong>in</strong>formation <strong>in</strong> <strong>the</strong> follow<strong>in</strong>g sequence: reference citation, study location, <strong>and</strong> cause <strong>of</strong> admission.104
HEI International Scientific Oversight CommitteeFigure 44. Percent change <strong>in</strong> <strong>the</strong> mean number <strong>of</strong> daily hospital admissions from cardiovascular causes per 10-µg/m 3 change <strong>in</strong> 24-hrmean PM 10 concentration among persons <strong>of</strong> all ages. Y-axis labels give study <strong>in</strong>formation <strong>in</strong> <strong>the</strong> follow<strong>in</strong>g sequence: reference citation,study location, <strong>and</strong> cause <strong>of</strong> admission.105
<strong>Outdoor</strong> <strong>Air</strong> <strong>Pollution</strong> <strong>and</strong> <strong>Health</strong> <strong>in</strong> <strong>the</strong> Develop<strong>in</strong>g <strong>Countries</strong> <strong>of</strong> <strong>Asia</strong>PM 2.5 Studies <strong>of</strong> PM 2.5 analyzed all-natural-cause <strong>and</strong>cause-specific mortality as well as hospital admissions forcerebrovascular, ischemic, <strong>and</strong> hemorrhagic stroke, IHD,asthma, pneumonia, <strong>and</strong> diabetes. All estimates are shown<strong>in</strong> Figure 45. The majority <strong>of</strong> estimates were positive; however,negative associations between hospital admissions<strong>and</strong> PM 2.5 were observed by Bell <strong>and</strong> colleagues (2007)<strong>and</strong> Chan <strong>and</strong> associates (2006).Figure 45. Percent change <strong>in</strong> <strong>the</strong> mean number <strong>of</strong> daily general practitioner consultations or emergency hospital admissions for, ordeaths from, respiratory or cardiovascular causes per 10-µg/m 3 change <strong>in</strong> 24-hour mean PM 2.5 concentration. Y-axis labels givestudy <strong>in</strong>formation <strong>in</strong> <strong>the</strong> follow<strong>in</strong>g sequence: reference citation, study location, cause <strong>of</strong> death or admission, <strong>and</strong> age group: All Ages(AA), Children (C), or years <strong>of</strong> age. “O<strong>the</strong>r” cause <strong>of</strong> death denotes death from o<strong>the</strong>r respiratory or cardiovascular causes.106
HEI International Scientific Oversight CommitteeTSP We identified 30 estimates for <strong>the</strong> association <strong>of</strong>TSP <strong>and</strong> all-natural-cause mortality, 17 for all ages from10 cities (Appendix Figure A.6), <strong>and</strong> 13 for specific agegroups (Appendix Figure A.7). For all-age, all-natural-causemortality, sixteen <strong>of</strong> <strong>the</strong>se estimates were positive, with <strong>the</strong>majority reflect<strong>in</strong>g <strong>in</strong>creases <strong>of</strong> less than 0.5% per 10-µg/m 3<strong>in</strong>crease <strong>in</strong> TSP. Regard<strong>in</strong>g cause-specific mortality, a smallernumber <strong>of</strong> studies (eight <strong>in</strong> total) reported results. These coveredboth cardiovascular <strong>and</strong> respiratory mortality across allage groups (Appendix Figures A.8 <strong>and</strong> A.9).Only 2 studies (Cho et al. 2000; Im et al. 2000) analyzedTSP <strong>and</strong> hospital admissions (Appendix Figure A.10). Noestimates <strong>of</strong> <strong>the</strong> effect <strong>of</strong> TSP on cardiovascular admissionswere found.NO 2 All studies <strong>of</strong> NO 2 <strong>and</strong> mortality used a 24-hourdaily averag<strong>in</strong>g time. We found 11 estimates <strong>of</strong> <strong>the</strong> effect onall-natural-cause mortality, from seven different cities for allages. These results are shown <strong>in</strong> Figure 46: all were positive<strong>and</strong> represented <strong>in</strong>creases <strong>in</strong> <strong>the</strong> number <strong>of</strong> deaths <strong>of</strong> lessFigure 46. Percent change <strong>in</strong> <strong>the</strong> mean number <strong>of</strong> daily deaths from all natural causes per 10-µg/m 3change <strong>in</strong> 24-hr mean NO 2 concentration among persons <strong>of</strong> all ages. Y-axis labels give study <strong>in</strong>formation<strong>in</strong> <strong>the</strong> follow<strong>in</strong>g sequence: reference citation <strong>and</strong> study location.107
<strong>Outdoor</strong> <strong>Air</strong> <strong>Pollution</strong> <strong>and</strong> <strong>Health</strong> <strong>in</strong> <strong>the</strong> Develop<strong>in</strong>g <strong>Countries</strong> <strong>of</strong> <strong>Asia</strong>than 2% per 10-µg/m 3 <strong>in</strong>crease <strong>in</strong> NO 2 . A number <strong>of</strong> differentage ranges were also studied (Appendix Figure A.11).For death from any respiratory disease, 7 studies exam<strong>in</strong>edassociations with NO 2 <strong>in</strong> 6 different locations(Figure 47) <strong>and</strong> 2 studies exam<strong>in</strong>ed age- <strong>and</strong> disease-specificassociations yield<strong>in</strong>g 5 estimates (Appendix Figure A.12).Most <strong>of</strong> <strong>the</strong>se associations were positive <strong>and</strong> typically<strong>in</strong>dicate an <strong>in</strong>crease <strong>in</strong> <strong>the</strong> number <strong>of</strong> deaths <strong>of</strong> less than5% per 10-µg/m 3 <strong>in</strong>crease <strong>in</strong> NO 2 .Figure 47. Percent change <strong>in</strong> <strong>the</strong> mean number <strong>of</strong> daily deaths from respiratory causes per 10-µg/m 3 change <strong>in</strong>24-hr mean NO 2 concentration among persons <strong>of</strong> all ages. Y-axis labels give study <strong>in</strong>formation <strong>in</strong> <strong>the</strong> follow<strong>in</strong>gsequence: reference citation, study location, <strong>and</strong> cause <strong>of</strong> death.108
HEI International Scientific Oversight CommitteeStudies <strong>of</strong> <strong>the</strong> associations between NO 2 <strong>and</strong> cardiovasculardeaths were more common: 18 estimates were foundfor all age groups (Figure 48), as were 6 age-specific estimates(Appendix Figure A.13).Figure 48. Percent change <strong>in</strong> <strong>the</strong> mean number <strong>of</strong> daily deaths from cardiovascular causes per 10-µg/m 3 change<strong>in</strong> 24-hr mean NO 2 concentration among persons <strong>of</strong> all ages. Y-axis labels give study <strong>in</strong>formation <strong>in</strong> <strong>the</strong> follow<strong>in</strong>gsequence: reference citation, study location, <strong>and</strong> cause <strong>of</strong> death.109
<strong>Outdoor</strong> <strong>Air</strong> <strong>Pollution</strong> <strong>and</strong> <strong>Health</strong> <strong>in</strong> <strong>the</strong> Develop<strong>in</strong>g <strong>Countries</strong> <strong>of</strong> <strong>Asia</strong>Only 1 study (Chang CH et al. 2002) reported associationsfor <strong>the</strong> maximum1-hour-average NO 2 concentration <strong>and</strong>hospital admissions, all o<strong>the</strong>rs choos<strong>in</strong>g to focus on 24-houraverages. S<strong>in</strong>ce Chang <strong>and</strong> colleagues also reported estimatesfor 24-hour average NO 2 concentrations, we focusedour meta-analyses on <strong>the</strong> 24-hour averages. We found 12estimates <strong>of</strong> <strong>the</strong> association between NO 2 <strong>and</strong> admission to ahospital for respiratory disease, across all ages (Figure 49) —5 for any respiratory disease, 3 for asthma, 2 for COPD, <strong>and</strong>2 for pneumonia. Most <strong>of</strong> <strong>the</strong>se associations were positive<strong>and</strong> represented an <strong>in</strong>crease <strong>in</strong> <strong>the</strong> number <strong>of</strong> admissions <strong>of</strong>up to 3% per 10-µg/m 3 <strong>in</strong>crease <strong>in</strong> NO 2 . A number <strong>of</strong> comb<strong>in</strong>ations<strong>of</strong> diseases <strong>and</strong> age groups were also analyzed(Appendix Figure A.14). Two estimates were negative, <strong>the</strong>rest positive. For cardiovascular admissions related toNO 2 , a number <strong>of</strong> studies reported positive associationswith cardiovascular diseases (Figure 50), <strong>in</strong>clud<strong>in</strong>g IHD (4estimates), heart failure (1), <strong>and</strong> cardiac disease (1). Associationsfor admissions <strong>in</strong> adults are shown <strong>in</strong> AppendixFigure A.15.Figure 49. Percent change <strong>in</strong> <strong>the</strong> mean number <strong>of</strong> daily hospital admissions from respiratory causes per10-µg/m 3 change <strong>in</strong> 24-hr mean NO 2 concentration among persons <strong>of</strong> all ages. Y-axis labels give study <strong>in</strong>formation<strong>in</strong> <strong>the</strong> follow<strong>in</strong>g sequence: reference citation, study location, <strong>and</strong> cause <strong>of</strong> admission.110
HEI International Scientific Oversight CommitteeFigure 50. Percent change <strong>in</strong> <strong>the</strong> mean number <strong>of</strong> daily hospital admissions from cardiovascular causes per10-µg/m 3 change <strong>in</strong> 24-hr mean NO 2 concentration among persons <strong>of</strong> all ages. Y-axis labels give study <strong>in</strong>formation<strong>in</strong> <strong>the</strong> follow<strong>in</strong>g sequence: reference citation, study location, <strong>and</strong> cause <strong>of</strong> admission.111
<strong>Outdoor</strong> <strong>Air</strong> <strong>Pollution</strong> <strong>and</strong> <strong>Health</strong> <strong>in</strong> <strong>the</strong> Develop<strong>in</strong>g <strong>Countries</strong> <strong>of</strong> <strong>Asia</strong>O 3 A total <strong>of</strong> 52 studies reported results for O 3 , with 12report<strong>in</strong>g results for <strong>the</strong> maximum 1-hour averages, 28 for24-hour averages, <strong>and</strong> 14 for <strong>the</strong> 8-hour averages. Thesemetrics are usually correlated temporally, but we have notattempted to make adjustments <strong>in</strong> order to comb<strong>in</strong>e resultsfor <strong>the</strong> different metrics.Figure 51 shows <strong>the</strong> results for all-natural-cause mortality:five used maximum 1-hour estimates, five 24-hourestimates, <strong>and</strong> four 8-hour estimates. Four estimates werenegatively associated with daily numbers <strong>of</strong> deaths, with<strong>the</strong> rest positive, <strong>and</strong> all but one estimated <strong>in</strong>crease wasless than 1% for a 10-µg/m 3 <strong>in</strong>crease <strong>in</strong> O 3 . Age-specificassociations were dom<strong>in</strong>ated by estimates based on maximum8-hour estimates (Appendix Figure A.16).Figure 51. Percent change <strong>in</strong> <strong>the</strong> mean number <strong>of</strong> daily deaths from all natural causes per 10-µg/m 3change <strong>in</strong> mean O 3 concentration among persons <strong>of</strong> all ages. Y-axis labels give study <strong>in</strong>formation <strong>in</strong><strong>the</strong> follow<strong>in</strong>g sequence: reference citation, study location, <strong>and</strong> O 3 averag<strong>in</strong>g time.112
HEI International Scientific Oversight CommitteeFor cause-specific mortality, <strong>the</strong> majority <strong>of</strong> resultsreported were for respiratory or cardiovascular mortalityat all ages, <strong>and</strong> <strong>the</strong>se were dom<strong>in</strong>ated by 8-hour results(Figures 52 <strong>and</strong> 53 <strong>and</strong> Appendix Figures A.17 <strong>and</strong> A.18).In both disease groups, <strong>the</strong> majority <strong>of</strong> estimates were positive.Despite <strong>the</strong> variation <strong>in</strong> averag<strong>in</strong>g times, <strong>the</strong>re weresufficient estimates (i.e., four or more) for summary estimatesto be calculated for respiratory <strong>and</strong> cardiovascularmortality.Figure 52. Percent change <strong>in</strong> <strong>the</strong> mean number <strong>of</strong> daily deaths from respiratory causes per 10-µg/m 3change <strong>in</strong> mean O 3 concentration among persons <strong>of</strong> all ages. Y-axis labels give study <strong>in</strong>formation <strong>in</strong> <strong>the</strong>follow<strong>in</strong>g sequence: reference citation, study location, O 3 averag<strong>in</strong>g time, <strong>and</strong> cause <strong>of</strong> death.113
<strong>Outdoor</strong> <strong>Air</strong> <strong>Pollution</strong> <strong>and</strong> <strong>Health</strong> <strong>in</strong> <strong>the</strong> Develop<strong>in</strong>g <strong>Countries</strong> <strong>of</strong> <strong>Asia</strong>Figure 53. Percent change <strong>in</strong> <strong>the</strong> mean number <strong>of</strong> daily deaths from cardiovascular causes per 10-µg/m 3 change<strong>in</strong> mean O 3 concentration among persons <strong>of</strong> all ages. Y-axis labels give study <strong>in</strong>formation <strong>in</strong> <strong>the</strong> follow<strong>in</strong>gsequence: reference citation, study location, O 3 averag<strong>in</strong>g time, <strong>and</strong> cause <strong>of</strong> death.114
HEI International Scientific Oversight CommitteeA large number <strong>of</strong> studies have reported associationsbetween measures <strong>of</strong> O 3 <strong>and</strong> respiratory <strong>and</strong> cardiovascularadmissions, accord<strong>in</strong>g to specific diseases <strong>and</strong> ages(Figures 54 <strong>and</strong> 55, respectively, <strong>and</strong> Appendix FiguresA.19 <strong>and</strong> A.20, respectively). We found 13 estimates <strong>of</strong> <strong>the</strong>association between respiratory admissions <strong>and</strong> O 3 <strong>and</strong> 17estimates for specific age groups. All associations — irrespective<strong>of</strong> averag<strong>in</strong>g time, age, or respiratory diseasegroup — were positive. A similar number <strong>of</strong> reports werefound for cardiovascular admissions related to O 3 , withsimilarly positive associations overall, albeit with a smallnumber <strong>of</strong> suggested negative associations.Figure 54. Percent change <strong>in</strong> <strong>the</strong> mean number <strong>of</strong> daily hospital admissions from respiratory causes per 10-µg/m 3 change <strong>in</strong>mean O 3 concentration among persons <strong>of</strong> all ages. Y-axis labels give study <strong>in</strong>formation <strong>in</strong> <strong>the</strong> follow<strong>in</strong>g sequence: referencecitation, study location, O 3 averag<strong>in</strong>g time, <strong>and</strong> cause <strong>of</strong> admission.115
<strong>Outdoor</strong> <strong>Air</strong> <strong>Pollution</strong> <strong>and</strong> <strong>Health</strong> <strong>in</strong> <strong>the</strong> Develop<strong>in</strong>g <strong>Countries</strong> <strong>of</strong> <strong>Asia</strong>Figure 55. Percent change <strong>in</strong> <strong>the</strong> mean number <strong>of</strong> daily hospital admissions from cardiovascular causes per10-µg/m 3 change <strong>in</strong> mean O 3 concentration among persons <strong>of</strong> all ages. Y-axis labels give study <strong>in</strong>formation <strong>in</strong> <strong>the</strong> follow<strong>in</strong>gsequence: reference citation, study location, O 3 averag<strong>in</strong>g time, <strong>and</strong> cause <strong>of</strong> admission.116
HEI International Scientific Oversight CommitteeSO 2 Numerous studies have reported associationsbetween SO 2 <strong>and</strong> daily mortality. Twenty-five estimates forall-natural-cause mortality at all ages were found (Figure56). Nearly all <strong>of</strong> <strong>the</strong>se data, collected from studies <strong>in</strong>15 different cities, show positive associations between<strong>in</strong>creases <strong>in</strong> SO 2 <strong>and</strong> <strong>in</strong>creases <strong>in</strong> daily numbers <strong>of</strong> deathsfrom all natural causes. Associations were also reportedfor age-specific mortality (Appendix Figure A.21).Figure 56. Percent change <strong>in</strong> <strong>the</strong> mean number <strong>of</strong> daily deaths from all natural causes per 10-µg/m 3change <strong>in</strong> 24-hr mean SO 2 concentration among persons <strong>of</strong> all ages. Y-axis labels give study <strong>in</strong>formation<strong>in</strong> <strong>the</strong> follow<strong>in</strong>g sequence: reference citation <strong>and</strong> study location.117
<strong>Outdoor</strong> <strong>Air</strong> <strong>Pollution</strong> <strong>and</strong> <strong>Health</strong> <strong>in</strong> <strong>the</strong> Develop<strong>in</strong>g <strong>Countries</strong> <strong>of</strong> <strong>Asia</strong>Numerous studies reported associations between SO 2<strong>and</strong> respiratory mortality for all ages (Figure 57) <strong>and</strong> alsospecific age groups (Appendix Figure A.22). The estimatesfor all ages were positive, with one exception. The estimatesfor mortality from all respiratory diseases tended tobe smaller than <strong>the</strong> estimates for specific conditions.Figure 57. Percent change <strong>in</strong> <strong>the</strong> mean number <strong>of</strong> daily deaths from respiratory causes per 10-µg/m 3 change <strong>in</strong> 24-hrmean SO 2 concentration among persons <strong>of</strong> all ages. Y-axis labels give study <strong>in</strong>formation <strong>in</strong> <strong>the</strong> follow<strong>in</strong>g sequence: referencecitation, study location, <strong>and</strong> cause <strong>of</strong> death.118
HEI International Scientific Oversight CommitteeA range <strong>of</strong> cardiovascular outcomes was studied <strong>in</strong> relationto SO 2 . These <strong>in</strong>cluded mortality from all cardiovasculardiseases or from specific disease subgroups such ascardiac or cerebrovascular disease, IHD, or stroke. Themajority <strong>of</strong> reports were for all ages (Figure 58). Most <strong>of</strong><strong>the</strong>se associations were positive, with 10-µg/m 3 <strong>in</strong>crements<strong>in</strong> SO 2 associated with <strong>in</strong>creases <strong>in</strong> mean daily numbers <strong>of</strong>deaths <strong>of</strong> between 0 <strong>and</strong> 3%. Fewer reports were found forspecific age groups (Appendix Figure A.23).Figure 58. Percent change <strong>in</strong> <strong>the</strong> mean number <strong>of</strong> daily deaths from cardiovascular causes per 10-µg/m 3 change <strong>in</strong>24-hr mean SO 2 concentration among persons <strong>of</strong> all ages. Y-axis labels give study <strong>in</strong>formation <strong>in</strong> <strong>the</strong> follow<strong>in</strong>gsequence: reference citation, study location, <strong>and</strong> cause <strong>of</strong> death.119
<strong>Outdoor</strong> <strong>Air</strong> <strong>Pollution</strong> <strong>and</strong> <strong>Health</strong> <strong>in</strong> <strong>the</strong> Develop<strong>in</strong>g <strong>Countries</strong> <strong>of</strong> <strong>Asia</strong>Admissions to <strong>the</strong> hospital for respiratory conditionshave been studied by a number <strong>of</strong> <strong>in</strong>vestigators. We foundseven articles report<strong>in</strong>g results for a range <strong>of</strong> respiratoryoutcomes, <strong>in</strong>clud<strong>in</strong>g all respiratory conditions, COPD,pneumonia, <strong>and</strong> asthma. Effect estimates from <strong>the</strong>sestudies are given <strong>in</strong> Figure 59; most <strong>in</strong>dicate positive associationswith SO 2 . Results for hospital admissions <strong>in</strong> specificage categories tended to be positive <strong>and</strong> more variable<strong>in</strong> size than <strong>the</strong> estimates for all age groups comb<strong>in</strong>ed, asillustrated <strong>in</strong> Appendix Figure A.24.Figure 59. Percent change <strong>in</strong> <strong>the</strong> mean number <strong>of</strong> daily hospital admissions from respiratory causesper 10-µg/m 3 change <strong>in</strong> 24-hr mean SO 2 concentration among persons <strong>of</strong> all ages. Y-axis labels givestudy <strong>in</strong>formation <strong>in</strong> <strong>the</strong> follow<strong>in</strong>g sequence: reference citation, study location, <strong>and</strong> cause <strong>of</strong> death.120
HEI International Scientific Oversight CommitteeA smaller number <strong>of</strong> studies exam<strong>in</strong>ed associationsbetween SO 2 <strong>and</strong> admissions for cardiovascular diseases: 10estimates for admissions <strong>in</strong> all age groups are shown <strong>in</strong>Figure 60, as are 9 estimates for specific age groups <strong>in</strong>Appendix Figure A.25. A small number <strong>of</strong> <strong>the</strong>se associationswere negative, with upper confidence limits just greater than0. Most estimates were positive, however, represent<strong>in</strong>g<strong>in</strong>creases <strong>in</strong> <strong>the</strong> number <strong>of</strong> admissions <strong>of</strong> between 0 <strong>and</strong> 5%.CO Estimates from studies <strong>of</strong> CO are illustrated <strong>in</strong> AppendixA. We found eight studies report<strong>in</strong>g associationsbetween CO <strong>and</strong> all-natural-cause mortality, ei<strong>the</strong>r acrossall age groups or for specific age groups (Appendix FigureA.26). One <strong>of</strong> <strong>the</strong> 11 estimates was negative <strong>and</strong> two, forchildren under 1 year <strong>of</strong> age, were imprecisely estimated;<strong>the</strong> rema<strong>in</strong><strong>in</strong>g 8 estimates were positive, <strong>in</strong>dicat<strong>in</strong>g <strong>in</strong>creases<strong>in</strong> <strong>the</strong> number <strong>of</strong> deaths <strong>of</strong> between 0% <strong>and</strong> 5%per 1-mg/m 3 <strong>in</strong>crease <strong>in</strong> CO. Fewer estimates were availablefor cause-specific mortality associated with CO, fromfive reports <strong>of</strong> respiratory mortality (Appendix FigureA.27) <strong>and</strong> five reports <strong>of</strong> cardiovascular mortality (AppendixFigure A.28). These effect estimates suggest generallyFigure 60. Percent change <strong>in</strong> <strong>the</strong> mean number <strong>of</strong> daily hospital admissions from cardiovascular causes per10-µg/m 3 change <strong>in</strong> 24-hr mean SO 2 concentration among persons <strong>of</strong> all ages. Y-axis labels give study <strong>in</strong>formation<strong>in</strong> <strong>the</strong> follow<strong>in</strong>g sequence: reference citation, study location, <strong>and</strong> cause <strong>of</strong> admission.121
<strong>Outdoor</strong> <strong>Air</strong> <strong>Pollution</strong> <strong>and</strong> <strong>Health</strong> <strong>in</strong> <strong>the</strong> Develop<strong>in</strong>g <strong>Countries</strong> <strong>of</strong> <strong>Asia</strong>positive associations between <strong>in</strong>creases <strong>in</strong> CO concentrations<strong>and</strong> respiratory mortality <strong>and</strong> more equivocal resultsfor cardiovascular mortality.Hospital admissions have been studied <strong>in</strong> relation toCO, with 5 studies report<strong>in</strong>g effect estimates for respiratoryadmissions (Appendix Figure A.29) <strong>and</strong> three for cardiovascularadmissions (Appendix Figure A.30).Table 14. Summary Effect Estimates <strong>of</strong> <strong>the</strong> Percent Change <strong>in</strong> RR <strong>of</strong> Various Mortality <strong>and</strong> Admissions Outcomes <strong>in</strong>Various Age Groups Due to a Change <strong>in</strong> Pollutant Concentration, by Pollutant <strong>and</strong> Outcome aP ValuePollutant <strong>and</strong>OutcomePercent Change(95% CI)Fixed Effect /R<strong>and</strong>om EffectEstimates(n) 2Value 2 TestforHeterogeneityEgger TestforPublicationBiasBegg Testfor Asymmetry(withCont<strong>in</strong>uityCorrection)PM 10MortalityAll causesAll ages 0.14 (0.09 to 0.19)0.27 (0.12 to 0.42) 65 yr 0.48 (0.38 to 0.57)0.45 (0.29 to 0.61)RespiratoryAll ages 0.41 (0.23 to 0.59)0.86 (0.34 to 1.39) 65 yr 1.22 (1.08 to 1.37)1.09 (0.55 to 1.63)CardiovascularAll ages 0.22 (0.11 to 0.33)0.36 (0.09 to 0.62) 65 yr 0.55 (0.41 to 0.70)0.53 (0.31 to 0.75)TSPMortalityAll causes, all ages 0.21 (0.14 to 0.27)0.21 (0.14 to 0.27)NO 2MortalityAll causes, all ages 0.83 (0.64 to 1.01)0.98 (0.54 to 1.42)Respiratory, all ages 1.74 (0.85 to 2.63)1.74 (0.85 to 2.63)Cardiovascular, all ages 1.03 (0.67 to 1.40)1.08 (0.59 to 1.56)AdmissionsRespiratory, all ages 0.37 (0.19 to 0.54)0.92 (0.17 to 1.68)8 30.4 < 0.001 0.127 1.00015 26.3 0.016 0.371 0.9138 25.3 0.001 0.085 0.90215 78.1 < 0.001 0.621 0.3228 18.7 0.009 0.405 0.66614 19.8 0.101 0.440 0.4439 4.3 0.833 0.971 0.9177 17.7 0.007 0.484 0.5486 1.1 0.901 0.524 0.2216 8.0 0.236 0.946 1.0005 41.4 < 0.001 0.129 0.221Table cont<strong>in</strong>ues next pagea The change <strong>in</strong> pollutant concentration was 10 µg/m 3 for all pollutants except CO, for which <strong>the</strong> change was 1 mg/m 3 . Two estimates are given for eachpollutant–outcome pair — <strong>the</strong> fixed-effects estimate followed by <strong>the</strong> r<strong>and</strong>om-effects estimate.122
HEI International Scientific Oversight CommitteeSummary EstimatesSummary effect estimates were calculated when four ormore studies provided estimates for <strong>in</strong>dividual pollutant–outcome pairs. If more than one estimate was available fora city, <strong>the</strong> most recent result published was used. Thefixed-effects <strong>and</strong> r<strong>and</strong>om-effects summary estimates for<strong>the</strong> pollutant–outcome pairs are shown <strong>in</strong> Table 14.Table 14 (Cont<strong>in</strong>ued). Summary Effect Estimates <strong>of</strong> <strong>the</strong> Percent Change <strong>in</strong> RR <strong>of</strong> Various Mortality <strong>and</strong> AdmissionsOutcomes <strong>in</strong> Various Age Groups Due to a Change <strong>in</strong> Pollutant Concentration, by Pollutant <strong>and</strong> Outcome aP ValuePollutant <strong>and</strong>OutcomePercent Change(95% CI)Fixed Effect /R<strong>and</strong>om EffectEstimates(n) 2Value 2 TestforHeterogeneityEgger TestforPublicationBiasBegg Testfor Asymmetry(withCont<strong>in</strong>uityCorrection)O 3 , 8-hr Averag<strong>in</strong>g TimeMortalityAll causes, all ages 0.07 (0.16 to 0.30)0.07 (0.16 to 0.30)Respiratory, all ages 0.73 (0.30 to 1.16)0.73 (0.30 to 1.16)Cardiovascular, all ages 0.16 (0.11 to 0.44)0.12 (0.29 to 0.54)O 3 , 24-hr Averag<strong>in</strong>g TimeMortalityAll causes, all ages 0.07 (0.07 to 0.21)0.14 (0.19 to 0.47)AdmissionsRespiratory, all ages 0.26 (0.06 to 0.59)0.26 (0.06 to 0.59)SO 2MortalityAll causes, all ages 0.35 (0.26 to 0.45)0.68 (0.40 to 0.95)Respiratory, all ages 1.00 (0.60 to 1.40)1.00 (0.60 to 1.40)COPD, all ages 0.93 (0.46 to 1.40)1.72 (0.10 to 3.36)Cardiovascular, all ages 0.32 (0.16 to 0.49)0.95 (0.30 to 1.60)AdmissionsRespiratory, all ages 0.22 (0.10 to 0.54)0.51 (0.17 to 1.19)COMortalityAll causes, all ages 0.34 (0.11 to 0.57)1.89 (1.59 to 5.50)4 16.0 0.000 0.240 1.0004 1.8 0.615 0.693 1.0004 5.5 0.138 0.648 0.7344 2.1 0.559 0.156 0.3084 2.9 0.400 0.016 0.30815 78.2 < 0.001 0.010 0.0487 3.2 0.777 0.224 1.0004 8.4 0.038 0.218 0.7349 28.7 < 0.001 0.078 0.9176 18.1 0.003 0.044 0.1334 60.4 < 0.001 0.474 1.000a The change <strong>in</strong> pollutant concentration was 10 µg/m 3 for all pollutants except CO, for which <strong>the</strong> change was 1 mg/m 3 . Two estimates are given for eachpollutant–outcome pair — <strong>the</strong> fixed-effects estimate followed by <strong>the</strong> r<strong>and</strong>om-effects estimate.123
<strong>Outdoor</strong> <strong>Air</strong> <strong>Pollution</strong> <strong>and</strong> <strong>Health</strong> <strong>in</strong> <strong>the</strong> Develop<strong>in</strong>g <strong>Countries</strong> <strong>of</strong> <strong>Asia</strong>PM 10 For each 10-µg/m 3 <strong>in</strong>crease <strong>in</strong> PM 10 concentration,accord<strong>in</strong>g to r<strong>and</strong>om-effects estimates, <strong>the</strong> me<strong>and</strong>aily all-natural-cause mortality <strong>in</strong> all age groups<strong>in</strong>creased by 0.27% (95% CI, 0.12–0.42); respiratory mortality,by 0.86% (95% CI, 0.34–1.39); <strong>and</strong> cardiovascularmortality, by 0.36% (95% CI, 0.09–0.62) (Figure 61 <strong>and</strong>Table 14). These r<strong>and</strong>om-effects estimates were each basedon eight estimates; with<strong>in</strong> each set <strong>of</strong> estimates, <strong>the</strong>re wasevidence <strong>of</strong> heterogeneity.Figure 61. Summary effect estimates for all-natural-cause, respiratory, <strong>and</strong> cardiovascular mortalityper 10-µg/m 3 change <strong>in</strong> PM 10 concentration. Y-axis labels <strong>in</strong> bold type specify <strong>the</strong> cause <strong>of</strong> death <strong>and</strong><strong>the</strong> age group.124
HEI International Scientific Oversight CommitteeThere were also sufficient numbers <strong>of</strong> estimates to calculatesummary effect estimates for <strong>the</strong> age group <strong>of</strong> 65 years orolder (Figure 61). Associations <strong>in</strong> this age group tended to belarger than those for all ages comb<strong>in</strong>ed <strong>and</strong> were also heterogeneous.For all pollutant–outcome pairs analyzed, <strong>the</strong>lower CIs were above zero.TSP For TSP, sufficient estimates for <strong>in</strong>clusion <strong>in</strong> <strong>the</strong>meta-analysis were available for only a s<strong>in</strong>gle health outcome.For a 10-µg/m 3 <strong>in</strong>crease <strong>in</strong> TSP concentration, <strong>the</strong>daily mean all-natural-cause mortality <strong>in</strong> all age groups<strong>in</strong>creased by 0.21% (95% CI, 0.14–0.27), on <strong>the</strong> basis <strong>of</strong>n<strong>in</strong>e estimates.PM 2.5 For PM 2.5 , none <strong>of</strong> <strong>the</strong> pollutant–outcome pairsprovided sufficient data for meta-analysis.NO 2 For NO 2 , <strong>the</strong>re were 7, 6, <strong>and</strong> 7 estimates availablefor meta-analysis across all age groups for all-naturalcause,respiratory, <strong>and</strong> cardiovascular mortality, respectively.The r<strong>and</strong>om-effects summary estimates were 0.98%(95% CI, 0.54–1.42), 1.74% (95% CI, 0.85–2.63), <strong>and</strong>1.08% (95% CI, 0.59–1.56) per 10-µg/m 3 <strong>in</strong>crease <strong>in</strong> NO 2 .A meta-analysis <strong>of</strong> <strong>the</strong> results for all-natural-cause mortalitysuggested significant heterogeneity among <strong>the</strong> estimates.However, <strong>in</strong>corporat<strong>in</strong>g this uncerta<strong>in</strong>ty <strong>in</strong> ar<strong>and</strong>om-effects model did not yield results that were substantiallydifferent from those derived from <strong>the</strong> fixedeffectsmodel. No evidence <strong>of</strong> heterogeneity was found forcause-specific mortality. A s<strong>in</strong>gle summary estimate forhospital admissions was also positive: a 0.92% (95% CI,0.17–1.68) <strong>in</strong>crease <strong>in</strong> respiratory admissions associatedwith a 10-µg/m 3 <strong>in</strong>crease <strong>in</strong> NO 2 . This r<strong>and</strong>om-effects estimatewas considerably larger than <strong>the</strong> correspond<strong>in</strong>gfixed-effects estimate (<strong>of</strong> 0.37% [95% CI, 0.19–0.54]). All<strong>the</strong> fixed-effects <strong>and</strong> r<strong>and</strong>om-effects summary estimatescalculated had lower CI limits above 0.O 3 Summary estimates for O 3 were available for anumber <strong>of</strong> pollutant–outcome pairs <strong>and</strong> for both 24-hour<strong>and</strong> maximum 8-hour averag<strong>in</strong>g times. The summary estimates,each based on just four results, were all positive,<strong>and</strong> <strong>the</strong> lower confidence limits were below 0 <strong>in</strong> all butone case. Evidence <strong>of</strong> heterogeneity was found for all-natural-causemortality only; <strong>the</strong> r<strong>and</strong>om-effects estimate was0.07% (95% CI, 0.16 to 0.30) per 10-µg/m 3 <strong>in</strong>crease <strong>in</strong><strong>the</strong> maximum 8-hour O 3 concentration.SO 2 For each 10-µg/m 3 <strong>in</strong>crease <strong>in</strong> SO 2 concentration,daily mean numbers <strong>of</strong> deaths from all natural causes, respiratorycauses, <strong>and</strong> cardiovascular causes <strong>in</strong>creased by0.68% (95% CI, 0.40–0.95), 1.00% (95% CI, 0.60–1.40),<strong>and</strong> 0.95% (95% CI, 0.30–1.60), respectively. Theser<strong>and</strong>om-effect estimates were based on 15, 7, <strong>and</strong> 9 results,respectively, <strong>and</strong> evidence for heterogeneity among <strong>the</strong>estimates was found for both all-natural-cause mortality<strong>and</strong> cardiovascular mortality. Four reports for deaths fromCOPD resulted <strong>in</strong> a summary estimate very similar to thatfor all respiratory diseases. Meta-analysis <strong>of</strong> results fromsix studies <strong>of</strong> hospital admissions for respiratory diseaseproduced a summary estimate <strong>of</strong> 0.51% (95% CI, 0.17 to1.19), a result based on a r<strong>and</strong>om-effects model.CO For CO, sufficient estimates for <strong>in</strong>clusion <strong>in</strong> <strong>the</strong>meta-analysis were available for only a s<strong>in</strong>gle health outcome.For each 1-mg/m 3 <strong>in</strong>crease <strong>in</strong> CO concentration,daily mean numbers <strong>of</strong> deaths from all natural causes<strong>in</strong>creased by 1.89% (95% CI, 1.59 to 5.50) — a resultwith a high degree <strong>of</strong> heterogeneity, as <strong>in</strong>dicated by <strong>the</strong>wide CI, based on n<strong>in</strong>e reports.Investigation <strong>of</strong> Sources <strong>of</strong> HeterogeneitySeveral summary estimates highlighted above werederived from a r<strong>and</strong>om-effects model. This model takes<strong>in</strong>to account variation <strong>in</strong> effect estimates among citieswhen calculat<strong>in</strong>g <strong>the</strong> summary estimate <strong>and</strong> its precision.Evidence <strong>of</strong> heterogeneity <strong>in</strong> a collection <strong>of</strong> city-specificeffect estimates suggests that <strong>the</strong> variation among cities isnot simply r<strong>and</strong>om variation. Potential reasons for <strong>the</strong>variation may be <strong>the</strong> composition, physical characteristics,<strong>and</strong> sources <strong>of</strong> <strong>the</strong> pollution to which <strong>the</strong> population isexposed, <strong>the</strong> health status <strong>and</strong> health care systems <strong>of</strong> <strong>the</strong>study population, <strong>and</strong> variation <strong>in</strong> meteorologic conditionsor <strong>the</strong> analytic strategy adopted by <strong>the</strong> <strong>in</strong>vestigators.Some relevant data are available from <strong>the</strong> articles <strong>the</strong>mselves.For example, <strong>the</strong> year <strong>of</strong> publication could be an<strong>in</strong>dicator <strong>of</strong> <strong>the</strong> statistical protocols used (because <strong>the</strong>irsophistication has <strong>in</strong>creased over time), <strong>the</strong> time periodstudied (because recently published studies tend to usemore recent data), or both. O<strong>the</strong>r relevant data <strong>in</strong>cludeaverage pollution concentrations (because <strong>the</strong> effects <strong>of</strong>pollution may be greater <strong>in</strong> more-polluted cities) <strong>and</strong> geographicregion (as <strong>in</strong>dicated by <strong>the</strong> region classificationsassigned by <strong>the</strong> WHO).125
<strong>Outdoor</strong> <strong>Air</strong> <strong>Pollution</strong> <strong>and</strong> <strong>Health</strong> <strong>in</strong> <strong>the</strong> Develop<strong>in</strong>g <strong>Countries</strong> <strong>of</strong> <strong>Asia</strong>Figure 62. Effect estimates for all-natural-cause mortality per 10-µg/m 3change <strong>in</strong> 24-hr mean PM 10 concentration, among persons <strong>of</strong> all ages,accord<strong>in</strong>g to daily mean PM 10 concentration. The data are also shown <strong>in</strong>Figure 63 with reference citations.Figure 63. Effect estimates for all-natural-cause mortality per 10-µg/m 3change <strong>in</strong> 24-hr mean PM 10 concentration, among persons <strong>of</strong> all ages,accord<strong>in</strong>g to publication. The data are also shown <strong>in</strong> Figure 62. Y-axislabels give study <strong>in</strong>formation <strong>in</strong> <strong>the</strong> follow<strong>in</strong>g sequence: reference citation<strong>and</strong> study location.The city-specific estimates for PM 10 used <strong>in</strong> <strong>the</strong> calculation<strong>of</strong> <strong>the</strong> summary estimate are shown accord<strong>in</strong>g to pollutantconcentration (Figure 62) <strong>and</strong> year <strong>of</strong> publication(Figure 63). Similar plots for <strong>the</strong> o<strong>the</strong>r pollutant–outcomepairs for which it was possible to calculate summary estimatesare shown <strong>in</strong> Appendix A (Figures A.31 to A.40).None <strong>of</strong> <strong>the</strong>se figures suggests that ei<strong>the</strong>r pollutant concentrationor year <strong>of</strong> publication was associated with <strong>the</strong> magnitude<strong>of</strong> <strong>the</strong> pollutant effect estimates observed. Therewere <strong>in</strong>sufficient numbers <strong>of</strong> estimates from <strong>the</strong> differentWHO regions to <strong>in</strong>vestigate whe<strong>the</strong>r effect estimatesvaried accord<strong>in</strong>g to WHO region.Ano<strong>the</strong>r possible source <strong>of</strong> heterogeneity among studyestimates that we cannot rule out <strong>in</strong> our review may be <strong>the</strong>lag times selected by <strong>the</strong> authors for presentation <strong>in</strong> <strong>the</strong>irpapers (Anderson et al. 2005).DISCUSSIONReview <strong>of</strong> F<strong>in</strong>d<strong>in</strong>gsIn this review, we identified over 100 daily time-seriesstudies <strong>of</strong> <strong>the</strong> health effects <strong>of</strong> short-term exposure to airpollutants <strong>in</strong> <strong>Asia</strong>. This represents a substantial <strong>in</strong>crease<strong>in</strong> <strong>the</strong> body <strong>of</strong> evidence from this k<strong>in</strong>d <strong>of</strong> study with<strong>in</strong> <strong>Asia</strong>s<strong>in</strong>ce <strong>the</strong> last review, when 45 studies were identified. Theadditional studies have allowed us to calculate summaryeffect estimates for more outcomes <strong>and</strong> to base <strong>the</strong>se summarymeasures on more data. Our review protocol dictatedthat we select <strong>the</strong> most recently published estimates fromeach city for <strong>in</strong>clusion <strong>in</strong> <strong>the</strong> meta-analysis. Hence,although <strong>the</strong> numbers <strong>of</strong> studies have <strong>in</strong>creased substantially,<strong>the</strong> evidence may still be concentrated <strong>in</strong> relativelyfew cities with<strong>in</strong> <strong>Asia</strong>.A comparison <strong>of</strong> Table 20 <strong>in</strong> <strong>the</strong> 2004 literature review(Special Report 15; HEI ISOC 2004) <strong>and</strong> Table 14 <strong>in</strong> this126
HEI International Scientific Oversight Committeereport shows that <strong>the</strong> number <strong>of</strong> <strong>in</strong>dividual estimates (forall-natural-cause mortality <strong>in</strong> all age groups) <strong>in</strong>cluded <strong>in</strong><strong>the</strong> summary estimates <strong>in</strong>creased from 4 to 8 for PM 10 <strong>and</strong>from 11 to 15 for SO 2 . These additional data enabled us tocalculate summary estimates for more pollutants <strong>and</strong> formore outcomes. Notably, all pollutants were positivelyassociated with adverse health effects, <strong>and</strong> <strong>the</strong> majority <strong>of</strong><strong>the</strong> summary estimates have lower confidence limits thatare above zero (show<strong>in</strong>g a percent <strong>in</strong>crease <strong>in</strong> <strong>the</strong> RR <strong>of</strong> <strong>the</strong>outcome) <strong>and</strong> upper limits that <strong>in</strong>dicate estimates <strong>of</strong> an<strong>in</strong>crease <strong>in</strong> <strong>the</strong> RR <strong>of</strong> between 1% <strong>and</strong> 4% per unit <strong>in</strong>crease<strong>in</strong> pollutant concentration. A new f<strong>in</strong>d<strong>in</strong>g from this reviewis <strong>the</strong> suggestion that associations between PM 10 <strong>and</strong>death are greater for persons 65 years <strong>of</strong> age or older thanfor those <strong>of</strong> all ages — a pattern observed for all-naturalcausemortality <strong>and</strong> mortality from respiratory causes orcardiovascular diseases. In each case, <strong>the</strong> po<strong>in</strong>t estimatefor <strong>the</strong> 65-year age group is greater than <strong>the</strong> po<strong>in</strong>t estimatesfor <strong>the</strong> correspond<strong>in</strong>g all-ages group, although <strong>the</strong>CIs overlap (Figure 61). This is an important f<strong>in</strong>d<strong>in</strong>g, given<strong>the</strong> ag<strong>in</strong>g population <strong>in</strong> <strong>Asia</strong>. Recent evidence from <strong>the</strong> <strong>Air</strong><strong>Pollution</strong> <strong>and</strong> <strong>Health</strong>: A European <strong>and</strong> North AmericanApproach (APHENA) study (Katsouyanni <strong>and</strong> Samet et al.2009) also suggests a higher degree <strong>of</strong> risk <strong>in</strong> <strong>the</strong> older populationthan among younger adults. Some f<strong>in</strong>d<strong>in</strong>gs suggest <strong>the</strong>contrary, however, at least for hospital admissions. In a studyby Anderson <strong>and</strong> colleagues (2003), no evidence was foundto suggest that short-term exposure to air pollutants<strong>in</strong>creased <strong>the</strong> risk <strong>of</strong> admission <strong>in</strong> older people — though <strong>the</strong>attributable risk was higher <strong>in</strong> that group than <strong>in</strong> youngergroups because <strong>of</strong> <strong>the</strong> greater numbers <strong>of</strong> people at risk.Comparison with Results from <strong>the</strong> PAPA Studies <strong>in</strong> Four<strong>Asia</strong>n CitiesThe HEI PAPA program <strong>in</strong>itially funded a set <strong>of</strong> timeseriesstudies <strong>of</strong> daily mortality <strong>in</strong> four large <strong>Asia</strong>n cities.The project followed a common design <strong>and</strong> data management<strong>and</strong> statistical protocols to coord<strong>in</strong>ate <strong>in</strong>vestigation<strong>of</strong> <strong>the</strong> associations between daily all-natural-cause mortalityor daily cause-specific mortality, <strong>and</strong> PM 10 , NO 2 , O 3 ,<strong>and</strong> SO 2 <strong>in</strong> Bangkok (from 1999 to 2003), Hong Kong (from1996 to 2002), Shanghai (from 2001 to 2004), <strong>and</strong> Wuhan(from 2001 to 2004). (The results from <strong>the</strong>se importantstudies were <strong>in</strong> press at <strong>the</strong> time this analysis was be<strong>in</strong>gconducted, but <strong>the</strong>y are discussed here because <strong>the</strong>y br<strong>in</strong>gimportant new evidence to this area [HEI Public <strong>Health</strong><strong>and</strong> <strong>Air</strong> <strong>Pollution</strong> <strong>in</strong> <strong>Asia</strong> Program 2010].)Table 15 compares <strong>the</strong> summary measures calculated forall <strong>Asia</strong>n time-series studies <strong>of</strong> all-natural-cause mortality,with <strong>the</strong> meta-analytic estimates <strong>of</strong> <strong>the</strong> four cities <strong>in</strong> <strong>the</strong>PAPA studies reported by Wong CM <strong>and</strong> colleagues(2008b, 2010a). A clear <strong>and</strong> consistent pattern is evident:summary estimates from <strong>the</strong> PAPA studies for all-naturalcause<strong>and</strong> cardiovascular mortality are higher than thosecalculated from <strong>the</strong> systematic review <strong>of</strong> <strong>the</strong> published literaturefor each <strong>of</strong> <strong>the</strong> four pollutants <strong>in</strong>vestigated (PM 10 ,NO 2 , O 3 , <strong>and</strong> SO 2 ). Conversely, except for SO 2 , <strong>the</strong> PAPAsummary estimates are lower than <strong>the</strong> review estimates forrespiratory mortality (although <strong>the</strong> CIs overlap substantially).For PM 10 , NO 2 , <strong>and</strong> SO 2 , <strong>the</strong>se differences do notalter <strong>the</strong> conclusions one might draw regard<strong>in</strong>g <strong>the</strong> evidencefor a potential hazard; <strong>in</strong> each case, <strong>the</strong> associationswere positive, with lower confidence limits above zero.However, <strong>the</strong> differences <strong>in</strong> <strong>the</strong> magnitude <strong>of</strong> <strong>the</strong> associationsare relevant to <strong>the</strong> calculations <strong>of</strong> <strong>the</strong> public healthimpact <strong>of</strong> air pollution <strong>and</strong> <strong>the</strong>refore are important. Theone exception is O 3 : <strong>the</strong> summary estimate for all-naturalcausemortality <strong>and</strong> <strong>the</strong> daily maximum 8-hour averagesobta<strong>in</strong>ed from our meta-analysis was 0.07% (95% CI,0.16 to 0.30); <strong>the</strong> correspond<strong>in</strong>g estimate derived from<strong>the</strong> four PAPA cities was 0.38% (95% CI, 0.23–0.53).Each <strong>of</strong> <strong>the</strong> four cities <strong>in</strong> <strong>the</strong> PAPA program has beenstudied previously, <strong>and</strong> estimates for all or some <strong>of</strong> <strong>the</strong>secities are <strong>in</strong>cluded <strong>in</strong> <strong>the</strong> summary estimates presented <strong>in</strong><strong>the</strong> current report. To update <strong>the</strong> currently reported estimates,we replaced <strong>the</strong> previous estimates for Bangkok,Hong Kong, Shanghai, <strong>and</strong> Wuhan with those from <strong>the</strong>PAPA studies (or added <strong>the</strong>m, if none was previously<strong>in</strong>cluded), as appropriate (Table 15). These new data from<strong>the</strong> PAPA studies were especially selected because <strong>of</strong> <strong>the</strong>irimportance to <strong>the</strong> study <strong>of</strong> <strong>the</strong> health effects <strong>of</strong> outdoor airpollution <strong>in</strong> <strong>Asia</strong>. There may be o<strong>the</strong>r time-series studies<strong>of</strong> <strong>Asia</strong>n cities <strong>in</strong> progress with imm<strong>in</strong>ent publication thathave not been <strong>in</strong>cluded <strong>in</strong> this update <strong>of</strong> <strong>the</strong> evidence.It is unclear why estimates from <strong>the</strong> PAPA studies forall-natural-cause <strong>and</strong> cause-specific mortality were higherthan those obta<strong>in</strong>ed from <strong>the</strong> exist<strong>in</strong>g <strong>Asia</strong>n literature foreach <strong>of</strong> <strong>the</strong> pollutants studied. We expected some degree <strong>of</strong>publication bias <strong>in</strong> <strong>the</strong> exist<strong>in</strong>g literature, lead<strong>in</strong>g to anupward bias <strong>in</strong> summary effect estimates (Anderson et al.2006). However, <strong>the</strong>re was little systematic evidence <strong>of</strong>publication bias (as <strong>in</strong>dicated by <strong>the</strong> Begg <strong>and</strong> Egger statisticaltests) <strong>in</strong> mortality effect estimates for any <strong>of</strong> <strong>the</strong> pollutants.The PAPA studies used a common protocol,<strong>in</strong>corporat<strong>in</strong>g current methodologic approaches <strong>and</strong>knowledge, both for data collection <strong>and</strong> statistical analysis<strong>in</strong> each <strong>of</strong> <strong>the</strong> four participat<strong>in</strong>g cities. The PAPA protocolshared one important feature with <strong>the</strong> APHEA study protocol(Katsouyanni et al. 1996) — <strong>the</strong> appropriate controlfor seasonality (us<strong>in</strong>g natural spl<strong>in</strong>es for data smooth<strong>in</strong>g)was determ<strong>in</strong>ed us<strong>in</strong>g <strong>the</strong> partial autocorrelation function(PACF). However, it is unlikely that this was a significantfactor <strong>in</strong> <strong>the</strong> difference between <strong>the</strong> PAPA results <strong>and</strong> <strong>the</strong>current results. The APHENA study (Samoli et al. 2008)assessed a range <strong>of</strong> statistical models <strong>and</strong> reported littlechange <strong>in</strong> <strong>the</strong> overall summary estimates for PM 10 <strong>and</strong>127
<strong>Outdoor</strong> <strong>Air</strong> <strong>Pollution</strong> <strong>and</strong> <strong>Health</strong> <strong>in</strong> <strong>the</strong> Develop<strong>in</strong>g <strong>Countries</strong> <strong>of</strong> <strong>Asia</strong>Table 15. Summary Effect Estimates <strong>of</strong> <strong>the</strong> Percent Change <strong>in</strong> RR <strong>of</strong> Mortality <strong>in</strong> All Age Groups Due to Change <strong>in</strong>Pollutant Concentration, by Meta-Analysis aCurrent Review <strong>of</strong>Recalculated Estimates After<strong>Asia</strong>n Literature PAPA Studies b Incorporation <strong>of</strong> PAPA Study ResultsPollutant <strong>and</strong>Cause <strong>of</strong> DeathRR PercentChange(95% CI)StudieswithData (n)RR PercentChange(95% CI)StudieswithData (n)RR PercentChange(95% CI)StudieswithData (n)Estimates Replaced or AddedPM 10All causes 0.27(0.12 to 0.42)Respiratory 0.86(0.34 to 1.39)Cardiovascular 0.36(0.09 to 0.62)8 0.55(0.26 to 0.85)8 0.62(0.22 to 1.02)8 0.58(0.22 to 0.93)4 0.33(0.16 to 0.51)4 0.64(0.26 to 1.02)4 0.41(0.15 to 0.67)8 Replaced Bangkok, Hong Kong,Shanghai, <strong>and</strong> Wuhanestimates8 Replaced Bangkok, Hong Kong,Shanghai, <strong>and</strong> Wuhanestimates8 Replaced Bangkok, Hong Kong,Shanghai, <strong>and</strong> WuhanestimatesNO 2All causes 0.98(0.54 to 1.42)Respiratory 1.74(0.85 to 2.63)Cardiovascular 1.08(0.59 to 1.56)7 1.23(0.84 to 1.62)6 1.48(0.68 to 2.28)7 1.36(0.89 to 1.82)4 1.02(0.71 to 1.34)4 1.38(0.93 to 1.83)4 1.14(0.76 to 1.53)8 Replaced Hong Kong, Shanghai,<strong>and</strong> Wuhan estimates; addedBangkok estimate9 Replaced Wuhan estimate;added Bangkok, Hong Kong,<strong>and</strong> Shanghai estimates8 Replaced Hong Kong, Shanghai,<strong>and</strong> Wuhan estimates; addedBangkok estimateO 3 , 8-hr Averag<strong>in</strong>g TimeAll causes 0.07(0.16 to 0.30)Respiratory 0.73(0.30 to1.16)Cardiovascular 0.12(0.29 to 0.54)4 0.38(0.23 to 0.53)4 0.34(0.07 to 0.75)4 0.37(0.01 to 0.73)4 0.25(0.07 to 0.56)4 0.34(0.07 to 0.75)4 0.36(0.03 to 0.69)5 Replaced Hong Kong, Shanghai,<strong>and</strong> Wuhan estimates; addedBangkok estimate5 Replaced Hong Kong, Shanghai,<strong>and</strong> Wuhan estimates; addedBangkok estimate5 Replaced Hong Kong, Shanghai,<strong>and</strong> Wuhan estimates; addedBangkok estimateSO 2All causes 0.68(0.40 to 0.95)Respiratory 1.00(0.60 to1.40)Cardiovascular 0.95(0.30 to1.60)15 1.00(0.75 to 1.24)7 1.47(0.85 to 2.08)9 1.09(0.71 to 1.47)4 0.75(0.48 to 1.02)4 1.12(0.76 to 1.47)4 1.16(0.53 to 1.80)16 Replaced Hong Kong, Shanghai,<strong>and</strong> Wuhan estimates; addedBangkok estimate9 Replaced Hong Kong <strong>and</strong> Wuhanestimates; added Bangkok <strong>and</strong>Shanghai estimates10 Replaced Hong Kong, Shanghai,<strong>and</strong> Wuhan estimates; addedBangkok estimatea The change <strong>in</strong> pollutant concentration was 10 µg/m 3 for all pollutants except CO, for which <strong>the</strong> change was 1 mg/m 3 .b The PAPA study <strong>in</strong>cluded results from Bangkok, Hong Kong, Shanghai, <strong>and</strong> Wuhan (Wong CM et al. 2008b, 2010a).all-natural-cause mortality on <strong>the</strong> basis <strong>of</strong> various methods<strong>of</strong> select<strong>in</strong>g <strong>the</strong> degree <strong>of</strong> adjustment for season <strong>in</strong> <strong>the</strong>models. For example, similar effect estimates resulted from<strong>the</strong> use <strong>of</strong> an a priori 8 degrees <strong>of</strong> freedom per year to controlfor season, compared with <strong>the</strong> number <strong>of</strong> degrees <strong>of</strong>freedom determ<strong>in</strong>ed us<strong>in</strong>g <strong>the</strong> PACF criterion (by m<strong>in</strong>imiz<strong>in</strong>g<strong>the</strong> sum <strong>of</strong> <strong>the</strong> sample’s PACFs): 0.9% (95% CI, 0.3–1.4) <strong>and</strong> 1.1% (95% CI, 0.6–1.6) per 10-µg/m 3 <strong>in</strong>crement <strong>in</strong>PM 10 concentration, respectively (Katsouyanni <strong>and</strong> Sametet al. 2009).128
HEI International Scientific Oversight CommitteeAno<strong>the</strong>r possible reason why <strong>the</strong> estimates from <strong>the</strong>PAPA studies for all-natural-cause <strong>and</strong> cause-specific mortalitywere higher than those calculated on <strong>the</strong> basis <strong>of</strong> <strong>the</strong>exist<strong>in</strong>g <strong>Asia</strong>n literature may be that <strong>the</strong> PAPA studiesused <strong>the</strong> most recent data available <strong>and</strong> that <strong>the</strong> adversehealth effects <strong>of</strong> air pollution are <strong>in</strong>creas<strong>in</strong>g over time.However, as Figure 63 <strong>and</strong> Appendix Figure A.36 <strong>and</strong> A.37show, <strong>the</strong>re is little evidence <strong>of</strong> such a temporal trend <strong>in</strong><strong>the</strong> exist<strong>in</strong>g <strong>Asia</strong>n literature.In <strong>the</strong>ir report <strong>of</strong> <strong>the</strong> PAPA studies <strong>in</strong> four cities, WongCM <strong>and</strong> colleagues (2008b, 2010a) noted that estimates forBangkok were generally higher than those for <strong>the</strong> threeCh<strong>in</strong>ese cities (Hong Kong, Shanghai, <strong>and</strong> Wuhan) <strong>and</strong><strong>the</strong>refore <strong>the</strong>y also calculated summary effect estimates for<strong>the</strong> three Ch<strong>in</strong>ese cities only. These summary estimateswere generally lower than those based on all four cities<strong>and</strong> were more <strong>in</strong> l<strong>in</strong>e with <strong>the</strong> meta-analytic estimatescalculated <strong>in</strong> this review. The large effect estimates forBangkok <strong>in</strong> <strong>the</strong> PAPA studies (Vichit-Vadakan et al. 2008,2010) <strong>the</strong>refore seem to account for most <strong>of</strong> <strong>the</strong> differencesbetween <strong>the</strong> two sets <strong>of</strong> summary effect estimates.Comparison with Results from IndiaTwo additional PAPA reports were <strong>in</strong> press at <strong>the</strong> time <strong>of</strong>this writ<strong>in</strong>g <strong>and</strong> <strong>the</strong>refore were not <strong>in</strong>cluded <strong>in</strong> this metaanalysis.The first, by Rajarathnam <strong>and</strong> colleagues (2010),reported results from Delhi from 2002 through 2004,record<strong>in</strong>g a 0.15% <strong>in</strong>crease <strong>in</strong> <strong>the</strong> RR <strong>of</strong> all-natural-causemortality associated with a 10-µg/m 3 <strong>in</strong>crease <strong>in</strong> PM 10 .The second study, <strong>in</strong> Chennai (Balakrishnan et al. 2010)<strong>and</strong> also conducted from 2002 through 2004, reported anassociation that was estimated to be 0.4% per 10-µg/m 3<strong>in</strong>crease <strong>in</strong> PM 10 . These results fall below <strong>and</strong> above <strong>the</strong>summary estimate from <strong>the</strong> current review, respectively,<strong>and</strong> below <strong>the</strong> meta-analytic estimate from <strong>the</strong> PAPAstudies <strong>in</strong> <strong>the</strong> four cities.Comparison with Results from O<strong>the</strong>r Parts <strong>of</strong> <strong>the</strong> WorldAn authoritative <strong>and</strong> comprehensive review published<strong>in</strong> 2006 by Pope <strong>and</strong> Dockery (2006) summarized timeseriesresults from key studies <strong>of</strong> PM 10 <strong>and</strong> mortality, <strong>and</strong>reported results for not only PM 10 but also PM 2.5 , blacksmoke, TSP, <strong>and</strong> SPM. Figure 32 shows <strong>the</strong> result<strong>in</strong>g range<strong>of</strong> effect estimates, with <strong>the</strong> f<strong>in</strong>d<strong>in</strong>gs from <strong>the</strong> current literaturereview fall<strong>in</strong>g <strong>in</strong>to <strong>the</strong> lower end <strong>of</strong> <strong>the</strong> range. Thus,although <strong>the</strong> summary estimate for PM 10 from <strong>the</strong> currentsystematic review <strong>of</strong> <strong>the</strong> <strong>Asia</strong>n literature is on <strong>the</strong> low side,it is consistent with <strong>the</strong> range <strong>of</strong> observed effects found <strong>in</strong>o<strong>the</strong>r parts <strong>of</strong> <strong>the</strong> world.Limitations <strong>of</strong> This ReviewS<strong>in</strong>ce <strong>the</strong> first review <strong>of</strong> <strong>the</strong> <strong>Asia</strong>n literature published<strong>in</strong> 2004 (HEI ISOC 2004), new search procedures, used <strong>in</strong>our updated review, have been developed <strong>and</strong> ref<strong>in</strong>ed. Akey improvement has been contact with local <strong>in</strong>vestigatorswho are able to identify <strong>and</strong> translate studies publishedlocally with<strong>in</strong> <strong>Asia</strong>, usually not <strong>in</strong> English. Every effort hasbeen made to identify all relevant studies, but some mayhave been missed, so we cannot claim to have fully represented<strong>the</strong> actual body <strong>of</strong> evidence <strong>in</strong> this field. We know<strong>of</strong> one article that was identified <strong>in</strong> <strong>the</strong> literature search,but <strong>the</strong> full article could not be obta<strong>in</strong>ed.Although <strong>the</strong> number <strong>of</strong> time-series studies publishedhas <strong>in</strong>creased substantially s<strong>in</strong>ce <strong>the</strong> previous review (115vs. 45), <strong>the</strong>re rema<strong>in</strong>s a disappo<strong>in</strong>t<strong>in</strong>g lack <strong>of</strong> publicationson PM 2.5 . We were able to identify only eight such studies(compared with one <strong>in</strong> <strong>the</strong> 2004 review) report<strong>in</strong>g effectestimates that could be <strong>in</strong>cluded <strong>in</strong> a quantitative metaanalysis.After stratification by outcome, disease, <strong>and</strong> age,<strong>the</strong> results did not yield sufficient estimates to calculate asummary effect estimate for PM 2.5 . The relative paucity <strong>of</strong>studies <strong>of</strong> PM 2.5 represents a substantial shortcom<strong>in</strong>g <strong>in</strong><strong>the</strong> accumulat<strong>in</strong>g body <strong>of</strong> evidence from <strong>Asia</strong>, particularlys<strong>in</strong>ce PM 2.5 is a better measure <strong>of</strong> particle pollution fromcombustion sources than ei<strong>the</strong>r TSP or PM 10 . In addition,little new evidence regard<strong>in</strong>g TSP has been publisheds<strong>in</strong>ce 2004 — probably ow<strong>in</strong>g to <strong>in</strong>creased monitor<strong>in</strong>g <strong>of</strong>PM 10 , ra<strong>the</strong>r than <strong>of</strong> TSP, <strong>in</strong> <strong>the</strong> region.Heterogeneity <strong>and</strong> Effect ModificationMany pollutant–outcome relations reported here showedconsiderable heterogeneity. Heterogeneity can result fromdifferences <strong>in</strong> <strong>the</strong> quality <strong>of</strong> <strong>the</strong> data or <strong>the</strong> methods <strong>of</strong> analysis.For example, errors <strong>in</strong> measurement <strong>of</strong> exposureamong cities can produce <strong>the</strong> appearance <strong>of</strong> differences <strong>in</strong>effects where none truly exist (Samet et al. 2000a). Heterogeneitycan also reflect effect modification: real differences<strong>in</strong> <strong>the</strong> magnitude <strong>of</strong> <strong>the</strong> effect estimate. Effect modificationcan be related to factors such as differences <strong>in</strong> <strong>the</strong> underly<strong>in</strong>gvulnerability <strong>of</strong> <strong>the</strong> population to air pollution or differences<strong>in</strong> <strong>the</strong> toxicity <strong>of</strong> <strong>the</strong> air pollution mixture amongcities. The small number <strong>of</strong> studies <strong>in</strong> <strong>the</strong> <strong>Asia</strong>n literature<strong>and</strong> <strong>the</strong> lack <strong>of</strong> data on possible effect-modify<strong>in</strong>g factorsprecluded a detailed evaluation <strong>of</strong> effect modification <strong>in</strong>this review, but <strong>the</strong> results <strong>of</strong> large multi-city studies <strong>in</strong> <strong>the</strong>U.S. <strong>and</strong> Europe (Samet et al. 2000b; Katsouyanni et al.2001) <strong>and</strong> recent meta-analyses <strong>of</strong> <strong>the</strong> broader literature(Levy et al. 2000) suggest that such factors exist. We didexam<strong>in</strong>e, graphically, <strong>the</strong> possibility that average pollutionconcentrations <strong>in</strong> <strong>the</strong> cities represented <strong>in</strong> <strong>the</strong> <strong>Asia</strong>n literaturemay expla<strong>in</strong> variation <strong>in</strong> effect estimates among <strong>the</strong>129
<strong>Outdoor</strong> <strong>Air</strong> <strong>Pollution</strong> <strong>and</strong> <strong>Health</strong> <strong>in</strong> <strong>the</strong> Develop<strong>in</strong>g <strong>Countries</strong> <strong>of</strong> <strong>Asia</strong>cities, but we found no evidence to support this hypo<strong>the</strong>sis.Appendix Figure A.34 suggested a possible trendtoward <strong>in</strong>creas<strong>in</strong>g effect size with <strong>in</strong>creas<strong>in</strong>g O 3 concentrations.However, because only four estimates were plotted,<strong>in</strong>terpretation should be cautious. We also <strong>in</strong>vestigatedwhe<strong>the</strong>r year <strong>of</strong> publication, a surrogate for a number <strong>of</strong>potential effect modifiers (e.g., statistical method or trends<strong>in</strong> pollution concentrations), was associated with effectsize; we found no evidence to support this possibility. As<strong>the</strong> <strong>Asia</strong>n literature grows, <strong>the</strong> <strong>in</strong>vestigation <strong>of</strong> sources <strong>of</strong>heterogeneity <strong>and</strong> potential effect modifiers will becomean <strong>in</strong>formative <strong>and</strong> valuable area for fur<strong>the</strong>r research.Multi-Pollutant ModelsA substantial number (44) <strong>of</strong> <strong>the</strong> studies <strong>in</strong>cluded <strong>in</strong> thisreview have reported results from analyses <strong>of</strong> multi-pollutantmodels. The numbers <strong>of</strong> studies report<strong>in</strong>g results(irrespective <strong>of</strong> outcome) for each pollutant are as follows:26 for PM 10 , 4 for PM 2.5 , 27 for O 3 , 24 for NO 2 , 32 for SO 2 ,<strong>and</strong> 12 for TSP. No multi-pollutant analyses <strong>in</strong>volved datafor CO.In many <strong>of</strong> <strong>the</strong>se studies, various comb<strong>in</strong>ations <strong>of</strong> pollutantswere evaluated. However, <strong>the</strong> numbers <strong>of</strong> estimatesavailable for comparison tend to fall substantially when<strong>the</strong> studies target specific outcomes, ages <strong>of</strong> subjects, diseases,<strong>and</strong> pollutant comb<strong>in</strong>ations. In some papers, resultsfrom multi-pollutant models were presented graphically,<strong>in</strong> which case it was not always possible to obta<strong>in</strong> <strong>the</strong>numerical values <strong>of</strong> <strong>the</strong> estimates <strong>and</strong> associated measures<strong>of</strong> precision for <strong>in</strong>clusion <strong>and</strong> st<strong>and</strong>ardization <strong>in</strong> APED. Ino<strong>the</strong>r cases, many comb<strong>in</strong>ations were reported, butaccord<strong>in</strong>g to <strong>the</strong> APED data-extraction protocol, only some<strong>of</strong> <strong>the</strong> results were entered <strong>in</strong>to APED. Hence, <strong>the</strong> completearticles should be consulted to obta<strong>in</strong> a complete picture<strong>of</strong> <strong>the</strong> robustness <strong>of</strong> <strong>the</strong> pollutant–outcomeassociations.The most relevant publication that reports results for acomprehensive set <strong>of</strong> multi-pollutant models is <strong>the</strong> PAPAstudies <strong>of</strong> daily mortality <strong>in</strong> Bangkok, Hong Kong,Shanghai, <strong>and</strong> Wuhan (Wong CM et al. 2008b, 2010a; HEIPublic <strong>Health</strong> <strong>and</strong> <strong>Air</strong> <strong>Pollution</strong> <strong>in</strong> <strong>Asia</strong> 2010). The authors<strong>in</strong>vestigated <strong>the</strong> robustness <strong>of</strong> <strong>the</strong> associations between allnatural-causemortality, or cause-specific mortality, <strong>and</strong>PM 10 or NO 2 to <strong>the</strong> <strong>in</strong>clusion <strong>of</strong> <strong>the</strong> o<strong>the</strong>r pollutants <strong>in</strong> <strong>the</strong>model (i.e., PM 10 or NO 2 , SO 2 , or O 3 ). These results,reported <strong>in</strong> supplementary material published on <strong>the</strong> Web,suggest that <strong>the</strong> associations between NO 2 <strong>and</strong> mortalitywere robust to <strong>the</strong> <strong>in</strong>clusion <strong>of</strong> SO 2 <strong>and</strong> O 3 <strong>in</strong>dividually,whereas <strong>the</strong> associations between PM 10 <strong>and</strong> mortalitywere reduced to almost zero by <strong>the</strong> <strong>in</strong>clusion <strong>of</strong> NO 2 (butnot SO 2 or O 3 ). These f<strong>in</strong>d<strong>in</strong>gs are only partially <strong>in</strong> l<strong>in</strong>ewith those from studies <strong>in</strong> North America <strong>and</strong> Europe.Peng <strong>and</strong> colleagues (2005) reported results from analyses<strong>of</strong> data from 45 cities <strong>in</strong> <strong>the</strong> NMMAPS study <strong>in</strong> NorthAmerica <strong>and</strong> concluded that associations between PM 10<strong>and</strong> mortality were unaffected by <strong>the</strong> <strong>in</strong>clusion <strong>in</strong> <strong>the</strong>model <strong>of</strong> data for SO 2 , O 3 , <strong>and</strong> NO 2 . A similar f<strong>in</strong>d<strong>in</strong>g wasreported by <strong>the</strong> APHEA <strong>in</strong>vestigators <strong>in</strong> a study <strong>of</strong> 29 Europeancities (Katsouyanni et al. 2001). A detailed analysis <strong>of</strong>this complex issue is warranted.Studies <strong>of</strong> <strong>Pollution</strong> EpisodesIn this review <strong>of</strong> <strong>the</strong> time-series literature, we havefocused on studies <strong>of</strong> <strong>the</strong> health effects <strong>of</strong> short-term(daily) exposure to outdoor air pollutants. As part <strong>of</strong> <strong>the</strong>process <strong>of</strong> identify<strong>in</strong>g appropriate studies, we found 9studies <strong>of</strong> <strong>the</strong> health effects <strong>of</strong> pollution dur<strong>in</strong>g periods <strong>of</strong>dust storms or forest fires. Our search procedures were notdesigned to identify <strong>the</strong>se studies; thus, this number maybe an underestimate. None<strong>the</strong>less, it is worth not<strong>in</strong>g <strong>the</strong>grow<strong>in</strong>g literature on this subject <strong>and</strong>, <strong>in</strong> particular, <strong>the</strong>impact <strong>the</strong>se <strong>in</strong>creas<strong>in</strong>gly frequent events may have on <strong>the</strong>health <strong>of</strong> <strong>the</strong> <strong>Asia</strong>n population.130
Section VI. Studies <strong>of</strong> Selected Effects <strong>of</strong> Long-TermExposure to Ambient <strong>Air</strong> <strong>Pollution</strong>The health effects <strong>of</strong> long-term exposure to ambient airpollution range from reduced life expectancy (through<strong>in</strong>creased <strong>in</strong>cidences <strong>of</strong> various diseases or conditions) toasymptomatic physiologic abnormalities (such as reducedlung function) (ATS 2000; WHO 2006a). Much <strong>of</strong> <strong>the</strong> evidencecomes from epidemiologic studies <strong>of</strong> long-termexposure that most <strong>of</strong>ten <strong>in</strong>volve comparisons <strong>of</strong> <strong>the</strong> <strong>in</strong>cidenceor prevalence <strong>of</strong> health outcomes among areas thatvary <strong>in</strong> <strong>the</strong>ir current or historical ambient concentrations<strong>of</strong> air pollution. The PAPA–SAN database was used toidentify such studies <strong>of</strong> <strong>Asia</strong>n populations published <strong>in</strong><strong>the</strong> peer-reviewed literature from January 1980 throughAugust 2007. Search results were verified by <strong>in</strong>dependentsearches conducted by APED (described earlier) <strong>and</strong> a consultant,Dr. Robert Chapman, <strong>of</strong> Chulalongkorn University,Bangkok. We focused on studies <strong>of</strong> selected respiratorysymptoms, pulmonary function, <strong>and</strong> illness prevalence(described <strong>in</strong> more detail below), lung cancer, <strong>and</strong> adversepregnancy outcomes (i.e., low birth weight [< 2500 g] <strong>and</strong>preterm delivery [at < 37 weeks’ gestational age]). Theseendpo<strong>in</strong>ts have been studied previously <strong>in</strong> o<strong>the</strong>r regions<strong>and</strong> are considered likely to contribute to <strong>the</strong> burden <strong>of</strong>disease from air pollution <strong>in</strong> <strong>Asia</strong>.In contrast to <strong>the</strong> <strong>Asia</strong>n time-series studies (reviewedabove <strong>in</strong> Section V. Quantitative Assessment <strong>of</strong> Daily Time-Series Studies), <strong>the</strong> studies <strong>of</strong> <strong>the</strong> chronic effects <strong>of</strong> longtermexposure are fewer <strong>and</strong> vary widely with respect tostudy design, analytic methods, <strong>and</strong> overall scientificrigor. For <strong>the</strong>se reasons, no summary estimates were calculated.Ra<strong>the</strong>r, quantitative estimates for selected outcomesare described <strong>and</strong> plotted to evaluate <strong>the</strong> evidence fromstudies <strong>in</strong> <strong>Asia</strong> about <strong>the</strong> effects <strong>of</strong> long-term exposure toambient air pollution on selected chronic health effects<strong>and</strong> to assess whe<strong>the</strong>r it can be compared with <strong>the</strong> evidencefrom <strong>the</strong> broader literature.Most studies contrasted <strong>the</strong> prevalence or, <strong>in</strong> <strong>the</strong> case <strong>of</strong>lung cancer, <strong>the</strong> occurrence <strong>of</strong> outcomes among populationsthat lived or attended schools <strong>in</strong> areas that differedwith regard to <strong>the</strong> presence <strong>of</strong> major sources <strong>of</strong> air pollution,<strong>the</strong> concentrations <strong>of</strong> ambient air pollution, or both(case–control design). The sources <strong>in</strong> many studies werestationary — <strong>in</strong>dustrial facilities or power plants — butseveral studies focused on residential proximity to busyroads. In some studies, various cities or areas (e.g., urbanvs. suburban or rural) were compared, whereas <strong>in</strong> o<strong>the</strong>rs<strong>the</strong> comparison was among various parts <strong>of</strong> <strong>the</strong> same city;still o<strong>the</strong>rs comb<strong>in</strong>ed both designs. The studies also differed<strong>in</strong> <strong>the</strong> extent to which potential confound<strong>in</strong>g factorswere controlled by <strong>the</strong> design or analysis.METHODSThis section describes general features <strong>of</strong> <strong>the</strong> methodsused <strong>in</strong> this review for <strong>the</strong> studies <strong>of</strong> long-term exposure.Fur<strong>the</strong>r methodologic details regard<strong>in</strong>g studies <strong>of</strong> specifichealth outcomes are discussed <strong>in</strong> <strong>the</strong> relevant sections below.Study SelectionStudies were identified on <strong>the</strong> basis <strong>of</strong> <strong>the</strong> most recentupdate <strong>of</strong> <strong>the</strong> PAPA–SAN database, described above. AdditionalPubMed searches were also conducted, us<strong>in</strong>g <strong>the</strong>search terms specified <strong>in</strong> <strong>the</strong> PAPA–SAN Literature ReviewManual (HEI Public <strong>Health</strong> <strong>and</strong> <strong>Air</strong> <strong>Pollution</strong> <strong>in</strong> <strong>Asia</strong>2006). Studies were <strong>in</strong>cluded <strong>in</strong> this review if <strong>the</strong>y:1. Presented ei<strong>the</strong>r new data or a reanalysis <strong>of</strong> a researchdata set;2. (a) Presented effect estimates <strong>in</strong> relation to <strong>in</strong>crements<strong>in</strong> <strong>the</strong> concentrations <strong>of</strong> specific air pollutants or conta<strong>in</strong>eddata from which such effect estimates could beestimated, or (b) provided estimates <strong>of</strong> relative rank<strong>in</strong>gs<strong>of</strong> exposure <strong>in</strong> qualitative terms (e.g., for urbanvs. rural areas);3. Presented <strong>the</strong> methods <strong>of</strong> data collection <strong>and</strong> analysiswith sufficient clarity to allow <strong>the</strong>m to be understoodwith reasonable confidence; <strong>and</strong>4. Reported, or gave sufficient <strong>in</strong>formation to derive, CIsfor <strong>the</strong> effect estimates (e.g., SEs <strong>of</strong> logistic regressioncoefficients, CIs around <strong>the</strong>se coefficients, or unadjustedcounts <strong>of</strong> symptoms or illnesses at different airpollution concentrations).Quantification <strong>of</strong> ResultsMost quantitative results are presented <strong>in</strong> terms <strong>of</strong> oddsratios (ORs) that estimate <strong>the</strong> RR <strong>of</strong> <strong>the</strong> health outcome <strong>in</strong>131
<strong>Outdoor</strong> <strong>Air</strong> <strong>Pollution</strong> <strong>and</strong> <strong>Health</strong> <strong>in</strong> <strong>the</strong> Develop<strong>in</strong>g <strong>Countries</strong> <strong>of</strong> <strong>Asia</strong>association with a given <strong>in</strong>crement <strong>in</strong> exposure, <strong>in</strong> crosssectionalstudies or <strong>in</strong> studies <strong>of</strong> <strong>in</strong>cidence or mortality.Effects on pulmonary function are usually quantified <strong>in</strong>terms <strong>of</strong> average changes <strong>in</strong> <strong>the</strong> level <strong>of</strong> lung function. Thestatistical precision <strong>of</strong> <strong>the</strong> estimates presented is <strong>in</strong>dicatedby <strong>the</strong> width <strong>of</strong> <strong>the</strong> 95% CI or can be <strong>in</strong>ferred from <strong>the</strong>P value from statistical tests, if presented. The ORs (<strong>and</strong>95% CIs) for <strong>the</strong> one or more estimates from each study aredisplayed <strong>in</strong> forest plots.This review presents two types <strong>of</strong> OR estimates that differwith regard to how exposure to air pollution is characterized.• The first type is estimates based on exposure contrasts(differences <strong>in</strong> exposures to air pollution) among populations<strong>in</strong> areas classified qualitatively as more pollutedor less polluted. Examples <strong>in</strong>clude comparisons<strong>of</strong> <strong>the</strong> prevalence <strong>of</strong> respiratory symptoms <strong>in</strong> residents<strong>of</strong> <strong>in</strong>dustrial versus non<strong>in</strong>dustrial areas or areas thatvary <strong>in</strong> proximity to major roads; <strong>the</strong> OR <strong>the</strong>n estimates<strong>the</strong> proportional <strong>in</strong>crease <strong>in</strong> <strong>the</strong> outcome associatedwith residence <strong>in</strong> <strong>the</strong> more-polluted areas ascompared with <strong>the</strong> less-polluted areas.• The second type is estimates based on differences <strong>in</strong>ambient air pollution concentrations. In studies wheresuch estimates were reported, <strong>the</strong>y were recorded foranalysis here. Some studies, however, <strong>in</strong>stead reportedsimply <strong>the</strong> average concentrations <strong>of</strong> pollutants <strong>in</strong> variousgeographic areas, with most be<strong>in</strong>g communityaverageconcentrations calculated over a period <strong>of</strong>months or years. From <strong>the</strong>se averages, when possible,we calculated an OR that estimated <strong>the</strong> proportional<strong>in</strong>crease <strong>in</strong> risk <strong>of</strong> <strong>the</strong> health outcome associated withan <strong>in</strong>cremental difference <strong>in</strong> <strong>the</strong> ambient concentration.To do so, <strong>the</strong> reported concentrations were st<strong>and</strong>ardizedto 10 µg/m 3 for particles <strong>and</strong> most gases(except CO, which was st<strong>and</strong>ardized to 100 µg/m 3 ). ee For studies report<strong>in</strong>g modeled ORs <strong>and</strong> sufficient variance-related <strong>in</strong>formation<strong>and</strong> for studies <strong>in</strong> which unadjusted counts were used, <strong>the</strong> naturallogs <strong>of</strong> modeled ORs <strong>and</strong> CIs (or SEs) were derived. Intercommunity differences<strong>in</strong> <strong>the</strong> reported average ambient air pollutant concentrations werealso calculated <strong>in</strong> <strong>the</strong> units <strong>in</strong> which <strong>the</strong>y were reported (e.g., ppb, ppm,µg/m 3 ). The number <strong>of</strong> designated <strong>in</strong>crements (100 µg/m 3 for CO <strong>and</strong>10 µg/m 3 for all o<strong>the</strong>r pollutants) <strong>in</strong> each <strong>of</strong> <strong>the</strong> <strong>in</strong>tercommunity differences<strong>in</strong> concentrations was <strong>the</strong>n calculated for purposes <strong>of</strong> st<strong>and</strong>ardization.Thus, for example, if an <strong>in</strong>tercommunity difference <strong>in</strong> reported NO 2 concentrationswas 15.7 ppb, <strong>the</strong> conversion from ppb to µg/m 3 <strong>and</strong> <strong>the</strong> rescal<strong>in</strong>gto a 10-unit <strong>in</strong>crement ([15.7 ppb 1.88 µg/m 3 per ppb] 10) wouldyield 2.95 designated <strong>in</strong>crements between <strong>the</strong> communities. The naturallogs <strong>of</strong> reported ORs <strong>and</strong> <strong>the</strong>ir CIs (or SEs) were <strong>the</strong>n divided by <strong>the</strong> <strong>in</strong>tercommunitydifference <strong>in</strong> average pollutant concentration, expressed as <strong>the</strong>number <strong>of</strong> designated <strong>in</strong>crements, to yield natural logs for <strong>the</strong> st<strong>and</strong>ardizedpollutant <strong>in</strong>crements (st<strong>and</strong>ardized logs). (For <strong>in</strong>stance, <strong>the</strong> st<strong>and</strong>ardizedlogs for NO 2 <strong>in</strong> <strong>the</strong> example above would be <strong>the</strong> result <strong>of</strong> divid<strong>in</strong>g <strong>the</strong> naturallogs <strong>of</strong> <strong>the</strong> reported OR <strong>and</strong> its CI by 2.95.) The result<strong>in</strong>g estimates wereexponentiated to yield st<strong>and</strong>ardized ORs <strong>and</strong> CIs. This procedure wasapplied to results from prevalence studies, to case–control studies <strong>of</strong> lungcancer, <strong>and</strong> for each pollutant reported. Information was taken from s<strong>in</strong>glepollutantmodels only; multiple-pollutant models were not used for thispurpose.CHRONIC RESPIRATORY DISEASEThis section focuses on four respiratory-disease outcomes:(1) chronic phlegm (for 3 months/year, unless o<strong>the</strong>rwisenoted) as an <strong>in</strong>dicator <strong>of</strong> <strong>the</strong> presence <strong>of</strong> chronicrespiratory disease, (2) pulmonary function, (3) physici<strong>and</strong>iagnosedasthma, <strong>and</strong> (4) wheeze. These specific outcomeswere selected because <strong>the</strong>y are <strong>in</strong>dicators <strong>of</strong> <strong>the</strong> prevalence<strong>of</strong> COPD <strong>and</strong> asthma, <strong>the</strong> two chronic, nonmalignant respiratorydiseases <strong>of</strong> greatest public health importance <strong>and</strong> <strong>of</strong>greatest <strong>in</strong>terest with regard to air pollution.In <strong>the</strong> studies that assessed specific respiratory symptoms<strong>and</strong> disease prevalence, questionnaires were used fordata collection, with parents report<strong>in</strong>g on behalf <strong>of</strong> youngchildren. Most questionnaires covered <strong>the</strong> same basicsymptoms: cough, phlegm, breathlessness, wheeze, <strong>and</strong>diagnoses <strong>of</strong> acute <strong>and</strong> chronic conditions such as asthma<strong>and</strong> COPD. In <strong>the</strong> vast majority <strong>of</strong> <strong>the</strong> studies, <strong>the</strong> questionnaireswere based on exist<strong>in</strong>g st<strong>and</strong>ardized <strong>and</strong> validatedquestionnaires, with or without modification for local conditions.Details <strong>of</strong> <strong>the</strong> questionnaires <strong>of</strong>ten varied fromstudy to study. For example, different studies <strong>of</strong>ten useddifferent questions to identify asthma, with fur<strong>the</strong>r qualification<strong>in</strong> some studies <strong>of</strong> <strong>the</strong> severity or period <strong>of</strong> disease(e.g., lifetime, or 12 months).Chronic PhlegmA total <strong>of</strong> 27 studies estimated <strong>the</strong> effects <strong>of</strong> exposure toair pollution from mobile <strong>and</strong> stationary sources on <strong>the</strong>prevalence <strong>of</strong> chronic phlegm, a major symptom <strong>of</strong> chronicrespiratory diseases characterized by chronic, productivecough (e.g., chronic bronchitis, or tuberculosis [TB]) (Table16). A study was considered to have reported credible estimatesfor chronic phlegm if <strong>the</strong> questionnaire requested<strong>in</strong>formation about phlegm production <strong>of</strong> 3 months/year,as was <strong>the</strong> case <strong>in</strong> <strong>the</strong> large majority <strong>of</strong> studies, or aboutano<strong>the</strong>r <strong>in</strong>dicator <strong>of</strong> phlegm production over an extendedperiod. Of such studies, 17 met <strong>the</strong> four criteria for <strong>in</strong>clusionas a study <strong>of</strong> selected effects <strong>of</strong> long-term exposure(specified <strong>in</strong> Study Selection earlier <strong>in</strong> Section VI). Ten <strong>of</strong><strong>the</strong>se studies attempted to control for potential confounders,<strong>in</strong>clud<strong>in</strong>g age, cigarette smok<strong>in</strong>g, ETS, <strong>and</strong> <strong>in</strong>doorburn<strong>in</strong>g <strong>of</strong> solid fuels. Four studies were conducted <strong>in</strong>ma<strong>in</strong>l<strong>and</strong> Ch<strong>in</strong>a, one <strong>in</strong> Hong Kong, one <strong>in</strong> Taipei,Ch<strong>in</strong>a,three <strong>in</strong> Japan, <strong>and</strong> one <strong>in</strong> India. Of <strong>the</strong> 10 studies, 7 focusedon adults (Nitta et al. 1993; Xu X <strong>and</strong> Wang L 1993; Yang CYet al. 1997; Nakai et al. 1999; Zhang J et al. 1999; Kumar R etal. 2004; Sek<strong>in</strong>e et al. 2004) <strong>and</strong> 3 on children (Yu TS et al.2001; Zhang JF et al. 2002; Qian Z et al. 2004). The studiesare discussed <strong>in</strong> detail below, grouped accord<strong>in</strong>g to whichbroad category <strong>of</strong> air pollution sources was studied.132
HEI International Scientific Oversight CommitteeTable 16. Studies <strong>of</strong> Chronic PhlegmCitationStudyLocationStudyYearsChhabra et al.2001Delhi,India1988–1998Duki et al.2003Kagamimoriet al. 1986Jakarta,B<strong>and</strong>ar,<strong>and</strong>Lampung,IndonesiaAwaramachi,Japan1996–19971970–1979Kagamimoriet al. 1990Awaramachi,Japan1971–1979Karita et al.2001Bangkok<strong>and</strong>Ayutthaya,Thail<strong>and</strong>1998–1999Karita et al.2004Bangkok,Thail<strong>and</strong>1998–1999StudySample4171 M <strong>and</strong> Fresidents(> 17 years)16,663 M <strong>and</strong>F children–mo<strong>the</strong>r pairsM <strong>and</strong> F children(6–14years)M <strong>and</strong> F children(6–14years)78 M trafficpolicemen<strong>and</strong> 128 Mnon-trafficpolicemen530 M policeman-<strong>and</strong>-wifecouples<strong>Pollution</strong>VariablesTSP, SO 2 , <strong>and</strong> NO 2 concentrations <strong>in</strong>high pollution <strong>and</strong> low pollutionzones with<strong>in</strong> DelhiNO 2 concentrations <strong>and</strong> distance<strong>of</strong> residence from road (< 20 <strong>and</strong> 20 m)NO 2 <strong>and</strong> SO 2 trends (follow<strong>in</strong>g antipollutionmeasures) <strong>in</strong> two areasnear power plants (Aware <strong>and</strong> Honjyodistricts) compared to a third district(Kitakata)SPM, NO 2 , <strong>and</strong> SO 2 concentrations(follow<strong>in</strong>g anti-pollution measures) <strong>in</strong>two areas near power plants (Aware<strong>and</strong> Honjyo districts) compared to athird district (Kitakata)Traffic policemen <strong>in</strong> an urban area(Bangkok) compared to generalpolicemen with<strong>in</strong> <strong>the</strong> urban area<strong>and</strong> a rural area (Ayutthaya)Traffic policemen <strong>and</strong> <strong>the</strong>ir wivesresid<strong>in</strong>g with<strong>in</strong> 40 m <strong>of</strong> <strong>the</strong>center <strong>of</strong> Bangkok <strong>and</strong> groupedby distance from <strong>the</strong> city center<strong>and</strong> PM 10 concentrationsQuestionnairesUsed to AssessChronicPhlegm ResultsATS, BMRC,<strong>and</strong> NHLBIThe prevalence <strong>of</strong> chronic phlegm did notdiffer significantly between <strong>the</strong> two areas<strong>in</strong> a multi-variable regression analysis.ATS The prevalence <strong>of</strong> "phlegm without cold"respiratory symptoms was associated withboth NO 2 concentration <strong>and</strong> residence< 20 m from busy road.BMRC The prevalence <strong>of</strong> "subacute phlegm" wasassociated with exposure to air pollution,especially <strong>in</strong> children with a positiveresponse to a sk<strong>in</strong> test for dust mites.BMRC The prevalence <strong>of</strong> "subacute phlegm"<strong>in</strong>creased after air quality deteriorated <strong>in</strong>association with <strong>the</strong> construction <strong>of</strong> anoil-fired power plant.ATS Chronic phlegm was more prevalent amongpolicemen assigned to traffic duty (17%)than among non-traffic policemen (2.6%).~ 45% <strong>of</strong> subjects <strong>in</strong> each group weresmokers.ATS Policemen work<strong>in</strong>g <strong>in</strong> heavy-traffic areas(vs. light-traffic areas) had an <strong>in</strong>creasedprevalence <strong>of</strong> chronic phlegm (OR, 2.19;95% CI, 1.47–3.26). Chronic phlegm <strong>in</strong><strong>the</strong>ir wives was associated with air pollutionconcentrations at <strong>the</strong>ir place <strong>of</strong> residence(OR for high vs. low concentrations,1.53; 95% CI, 1.10–2.13).Table cont<strong>in</strong>ues next page133
<strong>Outdoor</strong> <strong>Air</strong> <strong>Pollution</strong> <strong>and</strong> <strong>Health</strong> <strong>in</strong> <strong>the</strong> Develop<strong>in</strong>g <strong>Countries</strong> <strong>of</strong> <strong>Asia</strong>Table 16 (Cont<strong>in</strong>ued). Studies <strong>of</strong> Chronic PhlegmCitationStudyLocationStudyYearsStudySampleKumar Ret al. 2004M<strong>and</strong>iGob<strong>in</strong>dgarh<strong>and</strong>Mor<strong>in</strong>da,India1999–20013603 M <strong>and</strong> Fresidents(> 15 years)Langkulsen etal. 2006Bangkok,Thail<strong>and</strong>2004 878 M <strong>and</strong> Fchildren(10–15 years)Maeda et al.1991–1992Tokyo,Japan1987–19902600 F residents(30–60years) <strong>and</strong>360 M <strong>and</strong> Fchildren(3–6 years)Nakai et al.1999Tokyo,Japan1987–19901986 Fresidents(30–59 years)Nitta et al.1993Tokyo,Japan1979-19834822 Fresidents(40–59 years)<strong>Pollution</strong>VariablesTSP, PM 10 , NO x , SO 2 , CO, <strong>and</strong> O 3concentrations <strong>in</strong> a high-pollutionarea (M<strong>and</strong>i Gob<strong>in</strong>dgarh) <strong>and</strong> alow-pollution area (Mor<strong>in</strong>da)PM 10 concentrations <strong>in</strong> three highpollutionareas <strong>and</strong> a low-pollutionarea with<strong>in</strong> BangkokNO 2 gradient based on distance <strong>of</strong>residence from road <strong>in</strong> Sumida Ward,Tokyo (< 20 <strong>and</strong> 20–150 m)<strong>and</strong> a residential suburb <strong>of</strong> Tokyo(Higashiyamato)NO 2 gradient based on distance <strong>of</strong>residence from road <strong>in</strong> Sumida Ward,Tokyo (< 20 <strong>and</strong> 20–150 m)<strong>and</strong> a residential suburb <strong>of</strong> Tokyo(Higashiyamato)Distance from road (< 20, 20–50, <strong>and</strong>50–100 m)QuestionnairesUsed to AssessChronicPhlegm ResultsBMRC Prevalence <strong>of</strong> chronic phlegm was<strong>in</strong>creased <strong>in</strong> an <strong>in</strong>dustrial vs. a non-<strong>in</strong>dustrialtown (OR, 1.37; 95% CI, 0.96–1.97);chronic phlegm was associated with a 10-µg/m 3 <strong>in</strong>crease <strong>in</strong> PM 10 concentration(OR, 1.09; 95% CI, 0.99–1.20).Potential residual confound<strong>in</strong>g by smok<strong>in</strong>gstatus.ATS Prevalence <strong>of</strong> "persistent phlegm" was<strong>in</strong>creased among elementary-school childrenliv<strong>in</strong>g <strong>in</strong> highly polluted roadsideareas vs. less-polluted areas (2.5% vs.0.9%; P > 0.05) <strong>and</strong> vs. highly pollutedareas <strong>in</strong> general (9% vs. 0.9%, P < 0.05).ATS Prevalence <strong>of</strong> chronic phlegm was elevatedamong those liv<strong>in</strong>g < 20 m from busyroads vs. <strong>in</strong> a residential district with nobusy roads: 7.2% vs. 3.6% <strong>in</strong> analysis controlledfor age, years at residence, occupation,smok<strong>in</strong>g status, <strong>and</strong> type <strong>of</strong> heat. Novariance estimate was provided.Results not adjusted for smok<strong>in</strong>g status.ATS Prevalence <strong>of</strong> chronic phlegm was<strong>in</strong>creased <strong>in</strong> women liv<strong>in</strong>g < 20 m from abusy road vs. <strong>in</strong> a suburban area (OR, 1.79;95% CI, 1.07–3.01), <strong>and</strong> was associatedwith an <strong>in</strong>crement <strong>of</strong> 10 µg/m 3 <strong>in</strong> NO 2concentration (OR, 1.12; 95% CI, 1.01–1.25).Extension <strong>of</strong> Maeda et al. 1991–1992.Results not adjusted for smok<strong>in</strong>g status.ATS Prevalence <strong>of</strong> chronic phlegm was<strong>in</strong>creased <strong>in</strong> women liv<strong>in</strong>g < 20 m vs.> 20–50 m from busy road: OR, 1.26 (95%CI, 0.94–1.70).Table cont<strong>in</strong>ues next page134
HEI International Scientific Oversight CommitteeTable 16 (Cont<strong>in</strong>ued). Studies <strong>of</strong> Chronic PhlegmCitationStudyLocationStudyYearsStudySampleOng et al.1991Hong Kong,Ch<strong>in</strong>a1989 3846 M <strong>and</strong> FprimaryschoolchildrenPeters Jet al. 1996Hong Kong,Ch<strong>in</strong>a1989–19913521 M <strong>and</strong>F children(8–12 years)Qian Zet al. 2000Qian Zet al. 2004Sek<strong>in</strong>e et al.2004.Chongq<strong>in</strong>g,Guangzhou,Lanzhou,<strong>and</strong>Wuhan,Ch<strong>in</strong>aGuangzhou,Lanzhou,<strong>and</strong>Wuhan,Ch<strong>in</strong>aTokyo,Japan1985–19881993–19961987–19942789 M <strong>and</strong>F children(5–14 years)7058 M <strong>and</strong>F schoolchildren(5–16 years)5682 Fresidents(30–59 years)Shima et al.2003ChibaPrefecture,Japan1992 2506 M <strong>and</strong> Fchildren(6–9 years)<strong>Pollution</strong>VariablesTSP, RSP, SO 2 , <strong>and</strong> NO 2 concentrations<strong>in</strong> a high-pollution area (KwaTs<strong>in</strong>g district) <strong>and</strong> a low-pollutionarea (sou<strong>the</strong>rn district)TSP, RSP, SO 2 , <strong>and</strong> NO 2 trends(follow<strong>in</strong>g anti-pollution measures)<strong>in</strong> a high-pollution area (Kwa Ts<strong>in</strong>gdistrict) <strong>and</strong> a low-pollution area(sou<strong>the</strong>rn district)TSP, SO 2 , <strong>and</strong> NO 2 concentrations <strong>in</strong>high-pollution areas (Langzhou <strong>and</strong>urban Wuhan) <strong>and</strong> low-pollution areas(Guanzhou <strong>and</strong> suburban Wuhan)TSP, PM 10–2.5 , PM 2.5 , SO 2 , <strong>and</strong> NO xconcentrations <strong>in</strong> high- (urban) <strong>and</strong>low- (suburban) pollution districtclustersProximity to traffic: roadside areasgrouped by NO 2 <strong>and</strong> SPM concentrationsSPM <strong>and</strong> NO 2 concentrations <strong>and</strong> distancefrom road (0–49 m <strong>and</strong> > 49 m)<strong>in</strong> urban areas (Chiba, Funabashi,Kashiwa, Ichikawa) compared withrural areas (Ichikawa, Tateyawa,Mobara, Kisarazu)QuestionnairesUsed to AssessChronicPhlegm ResultsWHOrecommended,unspecifiedWHO<strong>and</strong> BMRCIn a district with high levels <strong>of</strong> emissionsfrom factories, primary-school childrenhad significantly higher rates <strong>of</strong> chronicphlegm than did those <strong>in</strong> a control groupwho lived <strong>in</strong> a less-polluted district (10%vs. 7.8%, P = 0.05).Differences <strong>in</strong> <strong>the</strong> prevalence <strong>of</strong> chronicphlegm among children <strong>in</strong> two districtsdecreased after improvements <strong>in</strong> air quality<strong>in</strong> <strong>the</strong> most-polluted district. The ORbefore sulfur reduction was 1.11 (95% CI,0.96–1.30) <strong>and</strong> after reduction was 0.88(95% CI, 0.68–1.13).ATS TSP levels were significantly associatedwith chronic phlegm <strong>in</strong> three Ch<strong>in</strong>ese cities.ATS Chronic phlegm was more prevalent amongchildren <strong>in</strong> <strong>the</strong> high-pollution area vs. <strong>the</strong>low-pollution area (OR, 5.44; 95% CI,3.38–8.78).ATS Chronic phlegm was more prevalent amongwomen liv<strong>in</strong>g < 20 m from a busy road vs.<strong>in</strong> areas <strong>of</strong> low traffic (OR, 1.78; 95% CI,1.26–2.53).ATS The prevalence <strong>of</strong> chronic phlegm was loweramong male children liv<strong>in</strong>g 0–49 m frombusy road (0.0%) than among those liv<strong>in</strong>g> 49 m away (1.3%) or <strong>in</strong> rural areas (1.3%)(P trend = 0.555); <strong>the</strong> same pattern was foundamong female children (1.15% vs. 1.7%<strong>and</strong> 1.9%; P trend = 0.848).Table cont<strong>in</strong>ues next page135
<strong>Outdoor</strong> <strong>Air</strong> <strong>Pollution</strong> <strong>and</strong> <strong>Health</strong> <strong>in</strong> <strong>the</strong> Develop<strong>in</strong>g <strong>Countries</strong> <strong>of</strong> <strong>Asia</strong>Table 16 (Cont<strong>in</strong>ued). Studies <strong>of</strong> Chronic PhlegmCitationStudyLocationStudyYearsStudySampleTam et al.1994Hong Kong,Ch<strong>in</strong>a1989–1990423 M <strong>and</strong> Fchildren(10–12 years)Wongsurakiatet al. 1999Xu X <strong>and</strong>Wang L1993Bangkok,Thail<strong>and</strong>Beij<strong>in</strong>g,Ch<strong>in</strong>a1996–1997620 M trafficpolicemen(20–60 years)<strong>and</strong> 303 Mcontrols(students<strong>and</strong> o<strong>the</strong>rworkers)1986 1576 M <strong>and</strong> Fadult neversmokers(40–69 years)Yang CYet al. 1997L<strong>in</strong>-yuan<strong>and</strong> Taihsi,Taipei,Ch<strong>in</strong>a1995 2036 M <strong>and</strong>F adultresidents <strong>of</strong>L<strong>in</strong>-yuan<strong>and</strong> 1976controls(30–64 years)Yano et al.1986Kushira,Sakurajima,<strong>and</strong>Oura,Japan1980 2006 F residents(30–59 years)<strong>Pollution</strong>VariablesSO 2 , NO 2 , <strong>and</strong> RSP concentrations<strong>in</strong> a high-pollution area (Kwa Ts<strong>in</strong>gdistrict) <strong>and</strong> a low-pollution area(sou<strong>the</strong>rn district)Traffic policemen (with <strong>and</strong> withoutprotective masks) <strong>and</strong> controlswith<strong>in</strong> BangkokParticulates <strong>in</strong> <strong>in</strong>dustrial, residential<strong>and</strong> suburban areasPM 10 , NO 2 , <strong>and</strong> SO 2 concentrations<strong>in</strong> a high-pollution area (L<strong>in</strong>-yuan)<strong>and</strong> a low-pollution area (Taihsi)TSP <strong>and</strong> SO 2 concentrations <strong>in</strong> areasaffected by volcanic ash (Kushira<strong>and</strong> Sakurajima) compared to acontrol area (Oura)QuestionnairesUsed to AssessChronicPhlegm ResultsNo st<strong>and</strong>ardquestionnaireLittle evidence <strong>of</strong> <strong>in</strong>creased prevalence <strong>of</strong>chronic phlegm found <strong>in</strong> more-pollutedvs. less-polluted district: 7% vs. 5%, P =0.50.BMRC Nonsmoker traffic policemen had a higherprevalence <strong>of</strong> "cough or phlegm" thannonsmoker controls (OR, 2.4; 95% CI, 1.3–4.6). Use vs. nonuse <strong>of</strong> a mask showed littleevidence <strong>of</strong> a protective effect amongnonsmoker traffic policemen (OR, 0.79;95% CI, 0.3–2.3).No st<strong>and</strong>ardquestionnaireResidence <strong>in</strong> <strong>in</strong>dustrial area vs. suburbanarea was associated with <strong>in</strong>creased prevalence<strong>of</strong> chronic phlegm among neversmokers(OR, 1.60; 95% CI, 1.00–2.80). An<strong>in</strong>crement <strong>of</strong> 10 µg/m 3 <strong>in</strong> SO 2 concentrationwas associated with <strong>in</strong>creased prevalence<strong>of</strong> chronic phlegm (OR, 1.12; 95%CI, 1.01–1.25).ATS The prevalence <strong>of</strong> chronic phlegm washigher <strong>in</strong> association with residence <strong>in</strong> apetrochemical <strong>in</strong>dustrial area vs. controlarea (OR, 2.01; 95% CI, 1.19–3.42); an<strong>in</strong>crease <strong>of</strong> 10 µg/m 3 <strong>in</strong> PM 10 concentrationwas associated with <strong>in</strong>creased prevalence<strong>of</strong> chronic phlegm (OR, 1.25; 95%CI, 1.06–1.49).ATS Exposure to volcanic ash was not significantlyassociated with <strong>in</strong>creased prevalence<strong>of</strong> chronic phlegm (or o<strong>the</strong>r chronicrespiratory symptoms) after control forage, occupational dust exposure, or smok<strong>in</strong>g(0.6% vs. 0.9% <strong>in</strong> control area;P > 0.05).Table cont<strong>in</strong>ues next page136
HEI International Scientific Oversight CommitteeTable 16 (Cont<strong>in</strong>ued). Studies <strong>of</strong> Chronic PhlegmCitationStudyLocationStudyYearsStudySampleYu TSet al. 2001Hong Kong,Ch<strong>in</strong>a1994–19951660 M <strong>and</strong>F children(8–12 years)Yu ITet al. 2004Hong Kong,Ch<strong>in</strong>aNotspecified821 M <strong>and</strong>F children(8–13 years)Zhang Jet al. 1999Guangzhou,Lanzhou,<strong>and</strong>Wuhan,Ch<strong>in</strong>a1985–19884108 M <strong>and</strong>F adultsZhang JFet al. 2002Zhou Wet al. 2001Chongq<strong>in</strong>g,Guangzhou,Lanzhou,<strong>and</strong>Wuhan,Ch<strong>in</strong>aShanghai,Ch<strong>in</strong>a1993–19967621 M <strong>and</strong>F children(5–12 years)1998 745 M <strong>and</strong> Ftaxi <strong>and</strong> busdrivers orconductors(19–55 years)<strong>and</strong> 532 M<strong>and</strong> Fcontrols(unexposedresidents)<strong>Pollution</strong>VariablesSO 2 , NO 2 , <strong>and</strong> RSP concentrations <strong>in</strong> ahigh-pollution area (Kwun Tongdistrict) <strong>and</strong> a low-pollution area(Shat<strong>in</strong> district)SO 2 , NO 2 , <strong>and</strong> RSP concentrations<strong>in</strong> a high-pollution area (Kwun Tongdistrict) <strong>and</strong> a low-pollution area(Shat<strong>in</strong> district)TSP, NO x , <strong>and</strong> SO 2 concentrations <strong>in</strong>urban (Lanzhou <strong>and</strong> urban Wuhan)<strong>and</strong> suburban (Guangzhou <strong>and</strong> suburbanWuhan) areasPM 2.5 , PM 10–2.5 , PM 10 , TSP, SO 2 , <strong>and</strong>NO x concentrations <strong>in</strong> urban <strong>and</strong>suburban areas with<strong>in</strong> each <strong>of</strong> <strong>the</strong>citiesTraffic-exposed workers <strong>and</strong> controlswith<strong>in</strong> ShanghaiQuestionnairesUsed to AssessChronicPhlegm ResultsATS Chronic phlegm was more prevalent amongchildren <strong>in</strong> <strong>the</strong> high-pollution vs. low-pollutionarea (OR, 1.84; 95% CI, 1.06–3.19).ATS Weak evidence <strong>of</strong> <strong>in</strong>creased prevalence <strong>of</strong>chronic phlegm was found <strong>in</strong> high-pollutionvs. low-pollution districts: 9% vs.6%, P = 0.13.ATS The prevalence <strong>of</strong> chronic phlegm was elevated<strong>in</strong> <strong>the</strong> most-polluted city (Lanzhou)vs. <strong>the</strong> least-polluted city (Guangzhou)among men (OR, 12.62; 95% CI, 5.23–30.44) <strong>and</strong> women (OR, 7.41; 95% CI,2.24–24.56).ATS Increased prevalence <strong>of</strong> chronic phlegmwas found among children per 39-µg/m 3<strong>in</strong>crease <strong>in</strong> PM 2.5 concentration (OR, 2.41;95% CI, 0.85–6.86) <strong>and</strong> per 42-µg/m 3<strong>in</strong>crease <strong>in</strong> PM 10–2.5 (OR, 2.83; 95% CI,1.93–4.16).ATS The prevalence <strong>of</strong> chronic phlegm washigher among Shanghai taxi <strong>and</strong> busdrivers than among controls <strong>in</strong> analysesadjusted for age, smok<strong>in</strong>g status, <strong>and</strong><strong>in</strong>door air pollution level (OR, 3.9; 95%CI, 2.6–5.8). Prevalence was directlyrelated to duration <strong>of</strong> employment as adriver.137
<strong>Outdoor</strong> <strong>Air</strong> <strong>Pollution</strong> <strong>and</strong> <strong>Health</strong> <strong>in</strong> <strong>the</strong> Develop<strong>in</strong>g <strong>Countries</strong> <strong>of</strong> <strong>Asia</strong>Studies <strong>of</strong> Traffic-Related Exposure Three studiesevaluated <strong>the</strong> prevalence <strong>of</strong> chronic phlegm with respectto residential proximity to major roads <strong>in</strong> Japan amongwomen <strong>of</strong> various ages (rang<strong>in</strong>g from 30–59 years,depend<strong>in</strong>g on <strong>the</strong> study) (Nitta et al. 1993; Nakai et al.1999; Sek<strong>in</strong>e et al 2004). In two studies, <strong>the</strong> highest level <strong>of</strong>exposure was residence < 20 m from a major road <strong>and</strong> <strong>the</strong>lowest level was residence ei<strong>the</strong>r 20–150 m or 50–150 mfrom a major road (Nitta et al. 1993) or <strong>in</strong> a suburban location(Nakai et al. 1999). Measured ambient concentrations<strong>of</strong> pollutants were used to corroborate <strong>the</strong> residentialexposure categories. Sek<strong>in</strong>e <strong>and</strong> colleagues (2004) comparedpopulations liv<strong>in</strong>g with<strong>in</strong> 20 m <strong>of</strong> roads that varied<strong>in</strong> traffic density <strong>and</strong> measured roadside concentrations <strong>of</strong>PM 10 <strong>and</strong> NO 2 . In all three studies, estimated ORs wereadjusted to account for major potential confounders suchas age, tobacco smok<strong>in</strong>g, hous<strong>in</strong>g characteristics, <strong>and</strong>sociodemographic factors.The prevalence <strong>of</strong> chronic phlegm was associated withresidential proximity to major roads <strong>in</strong> all three studies(Figure 64). The largest effects on <strong>the</strong> prevalence <strong>of</strong> symptomswere consistently seen <strong>in</strong> those liv<strong>in</strong>g closest to busyroads (Nitta et al. 1993; Nakai et al. 1999) or near <strong>the</strong>busiest roads (Sek<strong>in</strong>e et al. 2004). Analyses based on measuredpollutant data from Nakai <strong>and</strong> colleagues (1999) estimatedthat an <strong>in</strong>crease <strong>in</strong> <strong>the</strong> average roadside NO 2concentration <strong>of</strong> 10 µg/m 3 was, over <strong>the</strong> period <strong>of</strong> <strong>the</strong>study, associated with a 12% <strong>in</strong>crease <strong>in</strong> prevalence (OR,1.12; 95% CI, 1.01–1.25). Analyses based on measured pollutantdata from Sek<strong>in</strong>e <strong>and</strong> colleagues (2004) estimatedthat <strong>in</strong>creases <strong>in</strong> <strong>the</strong> roadside concentrations <strong>of</strong> 8-yearaverage PM 10 <strong>and</strong> 5-year average NO 2 <strong>of</strong> 10 µg/m 3 wereassociated with an <strong>in</strong>crease <strong>in</strong> prevalence <strong>of</strong> 60% (OR,1.59; 95% CI, 1.20–2.11) <strong>and</strong> 16% (OR, 1.16; 95% CI, 1.06–1.26), respectively. However, <strong>the</strong> prevalence data were collectedas long as 7 years before <strong>the</strong> averag<strong>in</strong>g periods forPM 10 <strong>and</strong> NO 2 . A fourth study by Shima <strong>and</strong> colleagues(2003) did not observe higher reported rates <strong>of</strong> chronicphlegm to be associated with residential proximity to busyroads <strong>in</strong> ei<strong>the</strong>r boys or girls 6–9 years <strong>of</strong> age, but <strong>the</strong>ir analysesdid not control for risk factors o<strong>the</strong>r than sex, such asparental smok<strong>in</strong>g.Studies <strong>of</strong> Proximity to Stationary or Mixed SourcesStudies that evaluated <strong>the</strong> prevalence <strong>of</strong> chronic phlegm <strong>in</strong>adults <strong>and</strong> children with respect to residential proximityto <strong>in</strong>dustrial sources were conducted <strong>in</strong> Ch<strong>in</strong>a (Xu X <strong>and</strong>Wang L 1993), Taipei,Ch<strong>in</strong>a (Yang CY et al. 1997), <strong>and</strong>India (Kumar R et al. 2004) (Table 16).Xu X <strong>and</strong> Wang L (1993) studied 1576 adult neversmokersaged 40–69 years <strong>in</strong> 1986. The never-smokerswere a subpopulation <strong>of</strong> a larger sample surveyed, with a96% response rate. Exposure was classified accord<strong>in</strong>g toresidence <strong>in</strong> three areas <strong>of</strong> Beij<strong>in</strong>g: an <strong>in</strong>dustrial area, anurban residential area, <strong>and</strong> a suburban control area. The 5-year annual average SO 2 concentration (1981–1985) washigher <strong>in</strong> <strong>the</strong> urban residential area than <strong>the</strong> <strong>in</strong>dustrial area(128 µg/m 3 vs. 57 µg/m 3 ) <strong>and</strong> lowest <strong>in</strong> <strong>the</strong> suburban area(18 µg/m 3 ). PM, measured as TSP, had <strong>the</strong> highest concentration<strong>in</strong> <strong>the</strong> <strong>in</strong>dustrial area (449 µg/m 3 ) <strong>and</strong> <strong>the</strong> lowest <strong>in</strong><strong>the</strong> suburban area (261 µg/m 3 ), but <strong>the</strong>re was considerableseasonal variation. The prevalence <strong>of</strong> chronic phlegm was60%; <strong>the</strong> prevalence was 20% higher <strong>in</strong> <strong>the</strong> urban residentialarea than <strong>in</strong> <strong>the</strong> control area (Figure 65) (Xu X <strong>and</strong>Wang L 1993) <strong>in</strong> analyses that controlled for age, sex, exposureto <strong>in</strong>door air pollution <strong>and</strong> occupational dust, <strong>and</strong>socioeconomic status. Analyses based on measured pollutantdata estimated that <strong>in</strong>creases <strong>of</strong> 10 µg/m 3 <strong>in</strong> <strong>the</strong>average SO 2 <strong>and</strong> TSP concentrations over <strong>the</strong> study periodwere associated with <strong>in</strong>creases <strong>in</strong> prevalence <strong>of</strong> 12% (OR,1.12; 95% CI, 1.01–1.25) <strong>and</strong> 3% (OR, 1.03; 95% CI, 1.00–1.06), respectively.Yang CY <strong>and</strong> colleagues (1997) <strong>and</strong> Kumar R <strong>and</strong> associates(2004) also observed <strong>in</strong>creases <strong>in</strong> <strong>the</strong> prevalence <strong>of</strong>chronic phlegm among adults <strong>in</strong> Taipei,Ch<strong>in</strong>a, <strong>and</strong>nor<strong>the</strong>rn India, respectively, that compared an <strong>in</strong>dustrializedarea <strong>and</strong> a non-<strong>in</strong>dustrialized area. Yang CY <strong>and</strong> colleagues(1997) observed a 200% <strong>in</strong>crease (OR, 2.01; 95%CI, 1.19–3.42) <strong>in</strong> <strong>the</strong> prevalence <strong>of</strong> chronic phlegm <strong>and</strong> a63% <strong>in</strong>crease <strong>in</strong> that <strong>of</strong> chronic bronchitis (OR, 1.63; 95%CI, 0.67–2.59) among adult residents <strong>of</strong> neighborhoodsnear a petrochemical facility as compared with those <strong>in</strong> anon-<strong>in</strong>dustrialized (control) area (Figure 65) <strong>in</strong> analysesadjusted for age, tobacco smok<strong>in</strong>g, <strong>and</strong> socioeconomic factors.Analyses based on measured pollutant data estimatedthat annual average PM 10 , SO 2 , <strong>and</strong> NO 2 concentrationswere each associated with <strong>in</strong>creased prevalence <strong>of</strong> chronicbronchitis <strong>and</strong> chronic phlegm. The ORs for a 10-µg/m 3<strong>in</strong>crease <strong>in</strong> pollutant concentration were most pronouncedfor chronic phlegm: 1.25, 1.39, <strong>and</strong> 1.50 for PM 10 , SO 2 , <strong>and</strong>NO 2 , respectively.Kumar R <strong>and</strong> colleagues (2004) studied residents <strong>of</strong> an<strong>in</strong>dustrial town <strong>and</strong> those <strong>of</strong> a non-<strong>in</strong>dustrial town. Concentrations<strong>of</strong> PM <strong>and</strong> gaseous pollutants measured at varioustimes over 1 year were consistently higher <strong>in</strong> <strong>the</strong><strong>in</strong>dustrial town. PM 10 concentrations were 112.8 µg/m 3 ,versus 75.8 µg/m 3 <strong>in</strong> <strong>the</strong> non-<strong>in</strong>dustrial town, but measurementswere obta<strong>in</strong>ed on only 37 days <strong>in</strong> <strong>the</strong> <strong>in</strong>dustrialtown <strong>and</strong> 15 days <strong>in</strong> <strong>the</strong> reference town. The authorsreported an <strong>in</strong>creased prevalence <strong>of</strong> chronic phlegm <strong>in</strong>men, but not women, who resided <strong>in</strong> <strong>the</strong> <strong>in</strong>dustrial town(4.8%, vs. 2.9% <strong>in</strong> <strong>the</strong> non-<strong>in</strong>dustrial town; P < 0.05), <strong>in</strong> an138
HEI International Scientific Oversight CommitteeFigure 64. ORs (<strong>and</strong> 95% CIs) for chronic phlegm among women liv<strong>in</strong>g with<strong>in</strong> 20 m <strong>of</strong> abusy road. Y-axis labels give <strong>the</strong> reference citations. The ORs were estimated relative towomen liv<strong>in</strong>g far<strong>the</strong>r from a busy road (Nitta et al. 1993), with<strong>in</strong> 20 m <strong>of</strong> less-busy roads(Nakai et al. 1999; Sek<strong>in</strong>e et al. 2004), or with<strong>in</strong> 20 m <strong>of</strong> less-busy roads per an NO 2 concentration<strong>in</strong>crement <strong>of</strong> 10 µg/m 3 (Nakai et al. 1999). For study details, see Table 16.Figure 65. ORs (<strong>and</strong> 95% CIs) for chronic phlegm <strong>in</strong> association with stationary or mixed sources <strong>of</strong> pollutants. Y-axis labels give study <strong>in</strong>formation<strong>in</strong> <strong>the</strong> follow<strong>in</strong>g sequence: reference citation; population (<strong>in</strong> some cases), <strong>and</strong> areas or locations compared or pollutant <strong>in</strong>crement studied. Y-axislabels <strong>in</strong> bold type specify <strong>the</strong> age group. For study details, see Table 16.139
<strong>Outdoor</strong> <strong>Air</strong> <strong>Pollution</strong> <strong>and</strong> <strong>Health</strong> <strong>in</strong> <strong>the</strong> Develop<strong>in</strong>g <strong>Countries</strong> <strong>of</strong> <strong>Asia</strong>analysis without adjustment for potential confounders(e.g., <strong>the</strong> use <strong>of</strong> biomass fuels for cook<strong>in</strong>g [more common<strong>in</strong> <strong>the</strong> non-<strong>in</strong>dustrial town], vs. <strong>the</strong> cleaner fuel liquidpetroleum [more common <strong>in</strong> <strong>the</strong> <strong>in</strong>dustrial town]). In alogistic regression analysis that did control for potentialconfounders, <strong>the</strong> comb<strong>in</strong>ed prevalence <strong>of</strong> chronic respiratorysymptoms (phlegm, cough, wheeze, <strong>and</strong> shortness <strong>of</strong>breath) was <strong>in</strong>creased <strong>in</strong> <strong>the</strong> <strong>in</strong>dustrial town (OR, 1.5; 95%CI, 1.2–1.8).Four studies — three <strong>in</strong> Ch<strong>in</strong>a (Zhang J et al. 1999, 2002;Qian Z et al. 2004) <strong>and</strong> one <strong>in</strong> Hong Kong (Yu TS et al.2001) — estimated <strong>the</strong> effect <strong>of</strong> residence <strong>in</strong> pollutedurban areas on <strong>the</strong> prevalence <strong>of</strong> chronic phlegm. <strong>Pollution</strong>was presumed to be <strong>the</strong> result <strong>of</strong> emissions from avariety <strong>of</strong> sources, both stationary <strong>and</strong> mobile.Zhang J <strong>and</strong> colleagues (1999) studied 4108 adults <strong>in</strong>1988 <strong>in</strong> four districts <strong>of</strong> three Ch<strong>in</strong>ese cities: Guangzhou,Wuhan, <strong>and</strong> Lanzhou. Four-year mean (1985–1988) concentrations<strong>of</strong> TSP, NO x , <strong>and</strong> SO 2 calculated from ambientmonitor<strong>in</strong>g data <strong>in</strong> <strong>the</strong> least- <strong>and</strong> most-polluted cities(Guangzhou <strong>and</strong> Lanzhou, respectively) ranged from 296–1067 µg/m 3 TSP, 89–92 µg/m 3 NO 2 , <strong>and</strong> 110–121 µg/m 3SO 2 . Prevalence <strong>of</strong> persistent cough <strong>and</strong> phlegm <strong>and</strong> selfreportedbronchitis was elevated <strong>in</strong> both men <strong>and</strong> women<strong>in</strong> Lanzhou relative to Guangzhou <strong>in</strong> analyses that controlledfor multiple potential confounders <strong>in</strong>clud<strong>in</strong>gtobacco smok<strong>in</strong>g <strong>and</strong> <strong>in</strong>door air pollution from coalburn<strong>in</strong>g (Figure 65).Respiratory symptoms <strong>in</strong> children were <strong>in</strong>vestigated <strong>in</strong>three studies. In <strong>the</strong> mid-1990s, Zhang JF <strong>and</strong> colleagues(2002) studied 7621 schoolchildren, 5–12 years <strong>of</strong> age, <strong>in</strong>urban <strong>and</strong> suburban districts <strong>of</strong> Guangzhou, Wuhan, <strong>and</strong>Lanzhou, as well as Chongq<strong>in</strong>g. Each district had 2-year(1995–1996) average PM 10 , PM 2.5 , <strong>and</strong> PM 10–2.5 concentrations<strong>and</strong> 4-year average TSP, NO x , <strong>and</strong> SO 2 concentrations.Across all 8 districts studied, an <strong>in</strong>terquartile range <strong>in</strong>crement<strong>in</strong> both PM 2.5 <strong>and</strong> PM 10–2.5 , but not <strong>in</strong> <strong>the</strong> gaseous pollutants,was associated with an <strong>in</strong>creased prevalence <strong>of</strong>chronic phlegm (def<strong>in</strong>ed as phlegm for at least 1month/year) <strong>in</strong> analyses adjusted for <strong>in</strong>door burn<strong>in</strong>g <strong>of</strong> solidfuel, parental smok<strong>in</strong>g, <strong>and</strong> socioeconomic status (Figure65). Chronic phlegm was also associated with <strong>in</strong>terquartilerange <strong>in</strong>crements <strong>in</strong> long-term average concentrations <strong>of</strong> PM,NO x , <strong>and</strong> SO 2 <strong>in</strong> analyses that compared urban <strong>and</strong> suburb<strong>and</strong>istricts with<strong>in</strong> each city. The ORs for develop<strong>in</strong>gchronic phlegm ranged from 1.8 (for <strong>the</strong> <strong>in</strong>crease <strong>in</strong> PM 10–2.5concentration) to 1.3 (for <strong>the</strong> <strong>in</strong>crease <strong>in</strong> NO x concentration),but none were significant at <strong>the</strong> P = 0.05 level, <strong>and</strong>nei<strong>the</strong>r SEs nor CIs were presented.Qian Z <strong>and</strong> colleagues (2004) published additional analyses<strong>of</strong> <strong>the</strong> data collected by Zhang JF <strong>and</strong> associates(2002), <strong>in</strong> which <strong>the</strong>y grouped <strong>the</strong> eight districts <strong>in</strong>to fourclusters based on <strong>the</strong> concentrations <strong>of</strong> both PM <strong>and</strong> gaseouspollutants. The prevalence <strong>of</strong> phlegm <strong>in</strong> <strong>the</strong> mostpollutedcluster was 5 times that <strong>in</strong> <strong>the</strong> least-pollutedcluster (Figure 65).Yu TS <strong>and</strong> colleagues (2001) studied 1660 Hong Kongchildren, aged 8–12 years, who resided <strong>in</strong> two urban districts<strong>in</strong> 1995. Annual average concentrations <strong>of</strong> SO 2 , NO 2 ,<strong>and</strong> respirable suspended particles (RSP) were 22.8, 58.5,<strong>and</strong> 57.6 µg/m 3 , respectively, <strong>in</strong> <strong>the</strong> three districts. Theprevalence <strong>of</strong> chronic phlegm was <strong>in</strong>creased <strong>in</strong> <strong>the</strong> morepolluteddistrict compared with <strong>the</strong> less-polluted district<strong>in</strong> analyses that controlled for parental tobacco smok<strong>in</strong>g<strong>and</strong> <strong>in</strong>door air pollution from cook<strong>in</strong>g or o<strong>the</strong>r sources(OR, 1.84; 95% CI, 1.06–3.19). This study corroboratesobservations <strong>in</strong> three earlier <strong>in</strong>vestigations <strong>of</strong> <strong>the</strong> prevalence<strong>of</strong> chronic respiratory disease <strong>in</strong> schoolchildren <strong>in</strong>two o<strong>the</strong>r Hong Kong districts that differed <strong>in</strong> ambientconcentrations <strong>of</strong> air pollution (Ong et al. 1991; Tam et al.1994; Peters J et al. 1996). Peters J <strong>and</strong> colleagues (1996)estimated <strong>the</strong> effect on <strong>the</strong> prevalence <strong>of</strong> respiratory disease<strong>in</strong> <strong>the</strong> two Hong Kong districts that was associatedwith a reduction <strong>in</strong> sulfur concentration <strong>in</strong> fuels, implemented<strong>in</strong> Hong Kong <strong>in</strong> 1990, which resulted <strong>in</strong> decreases<strong>in</strong> ambient SO 2 concentrations, changes <strong>in</strong> <strong>the</strong> elementalcomposition <strong>of</strong> PM, <strong>and</strong> reductions <strong>in</strong> long-term averagemortality rates (Hedley et al. 2002; Wong CM et al. 2009).After adjustment for potential confounders, residence <strong>in</strong><strong>the</strong> high-pollution district versus <strong>the</strong> low-pollution district<strong>in</strong> 1989–1990, prior to <strong>the</strong> reduction <strong>of</strong> sulfur concentration<strong>in</strong> fuels, was associated with an 11% <strong>in</strong>crease <strong>in</strong><strong>the</strong> prevalence <strong>of</strong> chronic phlegm (OR, 1.11; 95% CI, 0.96–1.30). By 1991, air quality had improved <strong>in</strong> both districts,with greater improvements <strong>in</strong> <strong>the</strong> most-polluted district<strong>and</strong> no significant difference <strong>in</strong> <strong>the</strong> reported prevalence <strong>of</strong>chronic phlegm (OR, 0.88; 95% CI, 0.68–1.13).Discussion COPD <strong>in</strong> adults is among <strong>the</strong> most important<strong>of</strong> <strong>the</strong> outcomes considered <strong>in</strong> this review, because itis associated with shortened healthy life expectancy. Instudies that controlled for major potential confound<strong>in</strong>gfactors (<strong>in</strong>clud<strong>in</strong>g tobacco smok<strong>in</strong>g <strong>and</strong> <strong>in</strong>door air pollutionfrom burn<strong>in</strong>g solid fuels), <strong>the</strong> prevalence <strong>of</strong> chronicphlegm was associated with exposure to combustionsourceair pollution both <strong>in</strong> qualitative comparisonsamong areas with differ<strong>in</strong>g levels <strong>of</strong> pollution <strong>and</strong> <strong>in</strong> comparisons<strong>of</strong> measured levels <strong>of</strong> air pollution. Associationswere observed with both PM, measured as PM 10 , <strong>and</strong> gaseouscombustion-source pollutants, such as SO 2 <strong>and</strong> NO 2 .Similar associations with pollution, after controll<strong>in</strong>g forsmok<strong>in</strong>g, have been reported <strong>in</strong> many surveys <strong>in</strong> NorthAmerica <strong>and</strong> Europe, <strong>in</strong>clud<strong>in</strong>g some <strong>in</strong> which <strong>the</strong> sources140
HEI International Scientific Oversight Committee<strong>and</strong> concentrations <strong>of</strong> pollutants were similar to those <strong>in</strong>some <strong>Asia</strong>n cities <strong>in</strong> this review (Pope <strong>and</strong> Dockery 1999;ATS 1996a,b).The <strong>in</strong>creased prevalence <strong>of</strong> chronic phlegm <strong>in</strong> children,although not an <strong>in</strong>dicator <strong>of</strong> chronic bronchitis orCOPD (both <strong>of</strong> which take longer to develop), may be correlatedwith repeated respiratory <strong>in</strong>fections, which <strong>in</strong> turnmay result <strong>in</strong> reduced pulmonary function (Johnston et al.1998). It has also been hypo<strong>the</strong>sized that repeated respiratory<strong>in</strong>fections <strong>in</strong> childhood <strong>and</strong> adolescence <strong>in</strong>crease <strong>the</strong>risk <strong>of</strong> develop<strong>in</strong>g COPD <strong>in</strong> adulthood, but this questionrema<strong>in</strong>s unresolved (Reid <strong>and</strong> Fairbairn 1958; Reid 1964;Vestbo <strong>and</strong> Hogg 2006). However, reduced lung function <strong>in</strong>childhood <strong>and</strong> early adulthood is associated with an<strong>in</strong>creased risk <strong>of</strong> develop<strong>in</strong>g COPD later <strong>in</strong> life (Fletcher<strong>and</strong> Peto 1977; Rennard <strong>and</strong> Vestbo 2008).Pulmonary FunctionTwenty-n<strong>in</strong>e studies evaluated effects <strong>of</strong> long-termexposure to air pollution on pulmonary function. Bothchildren <strong>and</strong> adults were studied, <strong>and</strong> <strong>the</strong> results for eachare described separately below, with particular emphasison results regard<strong>in</strong>g adults who were nonsmokers.Studies <strong>of</strong> Children Pulmonary function <strong>in</strong> children15 years <strong>of</strong> age or younger was assessed <strong>in</strong> 12 studies(Table 17). Most <strong>in</strong>cluded relatively large numbers <strong>of</strong> children,with study populations rang<strong>in</strong>g from approximately180 to approximately 1300. The studies come largely fromEast <strong>and</strong> Sou<strong>the</strong>ast <strong>Asia</strong>, with studies from Hong Kong (4studies), Taipei,Ch<strong>in</strong>a (2), <strong>and</strong> Ch<strong>in</strong>a (1) <strong>and</strong> additionals<strong>in</strong>gle studies from S<strong>in</strong>gapore, South Korea, <strong>and</strong> Bangkok.With<strong>in</strong> each study, region-specific pollution gradients(ei<strong>the</strong>r measured or estimated as urban–rural gradients)were considered <strong>the</strong> pollution source. Pulmonary functionmeasurements usually <strong>in</strong>cluded FEV 1 , forced vitalcapacity (FVC) <strong>and</strong> forced expiratory flow dur<strong>in</strong>g <strong>the</strong>middle half <strong>of</strong> FVC (FEF 25–75 ), as well as FEV/FVC <strong>in</strong>some cases. The results were typically adjusted for age,sex, <strong>and</strong> height, as well as exposure to ETS if those datawere available. In addition, bronchial hyperresponsiveness(BHR) was assessed <strong>in</strong> three studies, <strong>and</strong> changes <strong>in</strong>maximal oxygen uptake (VO 2 max) <strong>in</strong> one study.In all, 11 <strong>of</strong> <strong>the</strong> 12 studies were judged to be adequate toreach a conclusion as to <strong>the</strong> association between air pollution<strong>and</strong> pulmonary function. The one excluded study wasby Kamat <strong>and</strong> colleagues (reported <strong>in</strong> 1980 <strong>and</strong> 1992). In <strong>the</strong>1980 article, <strong>the</strong> adjustment <strong>of</strong> <strong>the</strong> pulmonary function databy height <strong>and</strong> age appeared to be applied <strong>in</strong>consistently,<strong>and</strong> <strong>in</strong> <strong>the</strong> 1992 article, fewer than 15 children were studied<strong>in</strong> each exposure region, too few to yield <strong>in</strong>terpretableresults. Few studies explicitly addressed potential confound<strong>in</strong>gdue to passive smok<strong>in</strong>g, although <strong>in</strong> studies <strong>in</strong>which <strong>the</strong>se data were available, passive or householdsmok<strong>in</strong>g did not appear to <strong>in</strong>fluence <strong>the</strong> results substantially.In studies that reported concentrations <strong>of</strong> ambientair pollution, PM concentrations were generally 1.5 to 2times as high <strong>in</strong> <strong>the</strong> more-polluted areas than as <strong>in</strong> lesspollutedareas. Concentrations <strong>of</strong> gaseous pollutants suchas SO 2 <strong>and</strong> NO 2 were 5 to 10 times as high <strong>in</strong> <strong>the</strong> more-pollutedregions.Most studies <strong>of</strong> pulmonary function <strong>in</strong> childrenobserved adverse effects <strong>of</strong> air pollution exposure on pulmonaryfunction, def<strong>in</strong>ed variously <strong>in</strong> <strong>the</strong> differentstudies. These estimates did not appear to change withcontrol for passive smok<strong>in</strong>g exposure. Goh <strong>and</strong> colleagues(1986) reported on 684 children from S<strong>in</strong>gapore with anaverage age <strong>of</strong> 10.7 years. The authors found a modest butsignificant reduction <strong>in</strong> FEV 1 <strong>and</strong> FVC values among boysliv<strong>in</strong>g <strong>in</strong> <strong>the</strong> <strong>in</strong>dustrial area compared with <strong>the</strong> urban orrural areas. No significant differences were seen <strong>in</strong> girls, <strong>and</strong>data for nei<strong>the</strong>r boys nor girls were adjusted for passivesmok<strong>in</strong>g exposure. The greatest differences <strong>in</strong> pollutionconcentrations were found for SO 2 ; <strong>the</strong>re was little difference<strong>in</strong> TSP concentrations across <strong>the</strong> areas surveyed.Hsiue <strong>and</strong> colleagues (1991) studied 382 children, aged9–11 years, <strong>in</strong> four regions <strong>of</strong> Taipei,Ch<strong>in</strong>a, one <strong>of</strong> whichwas downw<strong>in</strong>d from wire-reclamation <strong>and</strong> <strong>in</strong>c<strong>in</strong>erationfacilities. They reported pollution gradients for NO 2 <strong>and</strong>SO 2 for which <strong>the</strong> highest exposure was approximately 9 to10 times <strong>the</strong> lowest exposure, as well as evidence for bothobstructive <strong>and</strong> restrictive lung-function deficits afteradjustment for passive smoke exposure <strong>in</strong> <strong>the</strong> home.Tam <strong>and</strong> colleagues (1994) measured BHR <strong>in</strong> 423 children,aged 10–12 years, <strong>in</strong> two Hong Kong districts. Averageconcentrations <strong>of</strong> SO 2 <strong>and</strong> NO 2 varied by a factor <strong>of</strong> 13between <strong>the</strong> two districts, <strong>and</strong> RSP concentrations wereabout twice as high <strong>in</strong> one district as <strong>in</strong> <strong>the</strong> o<strong>the</strong>r. Althoughno significant differences <strong>in</strong> st<strong>and</strong>ard spirometric measureswere found, mild-to-moderate <strong>in</strong>creases <strong>in</strong> airway reactivitywere 4 times as common among nonasthmatic childrenliv<strong>in</strong>g <strong>in</strong> <strong>the</strong> more-polluted district than <strong>the</strong> less-pollutedone, after controll<strong>in</strong>g for passive smok<strong>in</strong>g.Studies <strong>of</strong> Adults Fifteen studies reported pulmonaryfunction data obta<strong>in</strong>ed us<strong>in</strong>g a st<strong>and</strong>ardized protocol <strong>and</strong>some estimate <strong>of</strong> pollutant exposure (Table 18). Seven <strong>of</strong><strong>the</strong> studies are from India, 1 from South Korea, three fromThail<strong>and</strong>, two from Japan, <strong>and</strong> two from Ch<strong>in</strong>a. In studies<strong>of</strong> adults, <strong>the</strong> potential for confound<strong>in</strong>g by smok<strong>in</strong>g is animportant limitation when try<strong>in</strong>g to estimate <strong>the</strong> effects <strong>of</strong>long-term pollution on <strong>the</strong> level <strong>of</strong> pulmonary function.141
<strong>Outdoor</strong> <strong>Air</strong> <strong>Pollution</strong> <strong>and</strong> <strong>Health</strong> <strong>in</strong> <strong>the</strong> Develop<strong>in</strong>g <strong>Countries</strong> <strong>of</strong> <strong>Asia</strong>Table 17. Studies <strong>of</strong> Pulmonary Function <strong>in</strong> ChildrenCitationStudyLocationStudyYearsStudy Sample<strong>of</strong> Children <strong>Pollution</strong> VariablesGoh et al.1986S<strong>in</strong>gapore 1982–1983684 M <strong>and</strong> F(6–14 years)TSP, SO 2 , <strong>and</strong> NO 2 concentrations <strong>in</strong><strong>in</strong>dustrial (Jurong), urban(Queenstown), <strong>and</strong> rural(Sembawang) areasHe QCet al.1993Wuhan,Ch<strong>in</strong>a1988 602 M <strong>and</strong> F(7–13 years)TSP <strong>and</strong> NO x concentrations <strong>in</strong>high-pollution urban <strong>and</strong> lowpollutionsuburban areas with<strong>in</strong>WuhanHsiue et al.1991Taipei,Ch<strong>in</strong>aNotspecified382 M <strong>and</strong> F(9–11 years)SO 2 <strong>and</strong> NO 2 concentrations <strong>in</strong> threepolluted areas (Wanli, Chiad<strong>in</strong>g,Hunei) <strong>and</strong> a control area (Annan)Jang et al.2003Kamatet al.1980Yeocheon,Yeosu,<strong>and</strong>Namwon,SouthKoreaMumbai,IndiaNotspecified1977–1979670 M <strong>and</strong> F(10–13 years)1395 M <strong>and</strong> F(7–19 years)SO 2 , NO 2 , <strong>and</strong> O 3 concentrations <strong>in</strong>two areas with vary<strong>in</strong>g proximity tochemical-factory emissions(Yeochun <strong>and</strong> Yeosu) <strong>and</strong> a ruralarea (Namwon)SO 2 , SPM, <strong>and</strong> NO 2 concentrations<strong>in</strong> high-to-low pollution urbanareas (Lalbaug, Chembur, <strong>and</strong> Kaur)<strong>and</strong> a rural areaPFTOutcomes ResultsFEV 1 <strong>and</strong>FVCFEV 1 <strong>and</strong>FVCFEV 1 <strong>and</strong>FVCFEV 1 , FVC,<strong>and</strong> BHR(def<strong>in</strong>ed asa 20%decrease <strong>in</strong>FEV 1 )FEV 1 <strong>and</strong>FVCResidence <strong>in</strong> <strong>in</strong>dustrial district (vs. urban orrural) associated with reduction <strong>in</strong> FEV 1 <strong>and</strong>FVC <strong>in</strong> boys.No control for ETS.Decrements <strong>in</strong> FVC <strong>of</strong> 3–8.5% <strong>in</strong> pollutedregion vs. less-polluted region; decrements<strong>in</strong> FEV 1 <strong>of</strong> 0.8–4.5% over range <strong>of</strong> age <strong>and</strong>height <strong>in</strong> polluted region.The measures from 1988 represent chroniclong-term lifetime exposure. No control forETS.Pulmonary obstruction varied across <strong>the</strong> fourareas. Prevalence <strong>of</strong> abnormal FVC rangedfrom 4.1–16.5%; abnormal FEV 1 , 7.2–11.9%. Range <strong>of</strong> prevalence <strong>of</strong> pattern: 4.1–11.9%.No significant difference <strong>in</strong> PFTs but prevalence<strong>of</strong> BHR ranged from 32–45% vs. 32%over distance from source.No control for ETS.In all <strong>of</strong> <strong>the</strong> urban districts, low pollution wasassociated with higher lung function <strong>in</strong> children<strong>of</strong> all ages studied. In <strong>the</strong> rural district,however, lung function was significantlylower despite lower pollution.FVC measurements appear too low, mak<strong>in</strong>g<strong>the</strong> reliability <strong>of</strong> PFT measurements questionable.Table cont<strong>in</strong>ues next page142
HEI International Scientific Oversight CommitteeTable 17 (Cont<strong>in</strong>ued). Studies <strong>of</strong> Pulmonary Function <strong>in</strong> ChildrenCitationStudyLocationStudyYearsStudySample<strong>Pollution</strong>VariablesKamat et al.1992Mumbai,India1988–1989585 M <strong>and</strong> Fchildren (7–19years)SO 2 , SPM, <strong>and</strong> NO 2 concentrations<strong>in</strong> three urban areas (Parel, Dadar,<strong>and</strong> Maravali) <strong>and</strong> a rural area(Deonar)Langkulsenet al. 2006Bangkok,Thail<strong>and</strong>2004 844 M <strong>and</strong> Fchildren(10–15 years)PM 10 concentrations <strong>in</strong> three highpollutionareas <strong>and</strong> a low-pollutionarea with<strong>in</strong> BangkokTam et al.1994.HongKong,Ch<strong>in</strong>a1989–1990423 M <strong>and</strong> Fchildren(10–12 years)SO 2 , NO 2 , <strong>and</strong> RSP concentrations <strong>in</strong>a high-pollution area (Kwa Ts<strong>in</strong>gdistrict) <strong>and</strong> a low-pollution area(sou<strong>the</strong>rn district)Wang JYet al. 1992Taipei,Ch<strong>in</strong>aNotspecified178 M <strong>and</strong> Fchildren(12 years)SO 2 <strong>and</strong> NO 2 concentrations <strong>in</strong> ahigh-pollution area (Wanli) <strong>and</strong> alow-pollution area (Ta<strong>in</strong>an)Wong CMet al. 1998HongKong,Ch<strong>in</strong>a1990–1991320 M <strong>and</strong> Fchildren(9–12 years)SO 2 , NO 2 , <strong>and</strong> RSP concentrations(follow<strong>in</strong>g sulfur-reductionmeasures) <strong>in</strong> a high-pollution area(Kwa Ts<strong>in</strong>g district) <strong>and</strong> a lowpollutionarea (sou<strong>the</strong>rn district)Yu ITet al. 2004Yu TSet al. 2001HongKong,Ch<strong>in</strong>aHongKong,Ch<strong>in</strong>aNotspecified1994–1995821 M <strong>and</strong> Fchildren(8–13 years)1294 M <strong>and</strong> Fchildren(8–12 years)SO 2 , NO 2 , <strong>and</strong> RSP concentrations <strong>in</strong>a high-pollution area (Kwun Tongdistrict) <strong>and</strong> a low-pollution area(Shat<strong>in</strong> district)SO 2 , NO 2 , <strong>and</strong> RSP concentrations <strong>in</strong>a high-pollution area (Kwun Tongdistrict) <strong>and</strong> a low-pollution area(Shat<strong>in</strong> district)PFTOutcomes ResultsFEV 1 <strong>and</strong>FVCFEV 1 <strong>and</strong>FVCFEV 1 <strong>and</strong>FVCFEV 1 <strong>and</strong>FVCBHR(def<strong>in</strong>ed asa 20%decrease <strong>in</strong>FEV 1 )FEV 1 <strong>and</strong>FVCAdjusted FEV 1 <strong>and</strong> FVC values <strong>in</strong>versely associated.Measures <strong>of</strong> expiratory flow werelower <strong>in</strong> <strong>the</strong> two districts with higher exposuresvs. <strong>the</strong> o<strong>the</strong>r two districts (P > 0.05).PFT protocol poorly described. Too few subjects<strong>in</strong> age group <strong>of</strong> <strong>in</strong>terest. No control for ETS.OR for abnormal PFT <strong>in</strong> areas with pollutedroadsides or general residential areas vs.less-polluted areas: 1.4 (95% CI, 0.99–1.1).Significant among junior-high students only.Modest effect limited to one group, after controlfor ETS.No significant difference between districts <strong>in</strong>basel<strong>in</strong>e PFTs. Mild-to-moderate BHR amongnonasthmatic children <strong>in</strong> <strong>the</strong> high-pollutiondistrict vs. <strong>the</strong> low-pollution district: 11%vs. 4%.For <strong>the</strong> high- <strong>and</strong> low-pollution districts,prevalence <strong>of</strong> abnormal FVC was 15.6% <strong>and</strong>6.5% <strong>and</strong> <strong>of</strong> abnormal FEV 1 was 17.5% <strong>and</strong>3.2%. BHR reported <strong>in</strong> 9 <strong>of</strong> 26 vs. 1 <strong>of</strong> 28responders.Repeated measures <strong>of</strong> BHR prevalence among4th graders <strong>in</strong> 1990, 28.9% <strong>and</strong> 21.1%; 4thgraders <strong>in</strong> 1991, 27.9% <strong>and</strong> 14.1%; <strong>and</strong> 5thgraders <strong>in</strong> 1991, 15.7%, <strong>and</strong> 9.7%; <strong>and</strong> aga<strong>in</strong><strong>in</strong> 1991, 17.8% <strong>and</strong> 11.1%. Little evidence<strong>of</strong> differences <strong>in</strong> BHR prevalence <strong>in</strong> 1992.F<strong>in</strong>d<strong>in</strong>gs suggest reversibility <strong>of</strong> BHR withpollution decl<strong>in</strong>e. No control for ETS.Difference <strong>in</strong> adjusted VO 2 max between districts:1.9 mL/kg <strong>of</strong> body-surface area/m<strong>in</strong>.FEV 1 , FVC<strong>and</strong>among girls than boys. In polluted vs. lesspolluteddistrict, mean FVC was 50 mL vs.29 mL <strong>and</strong> mean FEV 1 was 83 mL vs. 54 mL.Similar effects were reported for FEF 25–75 .FEF 25–75Difference <strong>in</strong> PFTs between districts greater143
<strong>Outdoor</strong> <strong>Air</strong> <strong>Pollution</strong> <strong>and</strong> <strong>Health</strong> <strong>in</strong> <strong>the</strong> Develop<strong>in</strong>g <strong>Countries</strong> <strong>of</strong> <strong>Asia</strong>Table 18. Studies <strong>of</strong> Pulmonary Function <strong>in</strong> AdultsCitationStudy LocationStudyYears Study Sample <strong>Pollution</strong> Variable PFT Outcomes ResultsChhabra etal. 2001Hong YCet al. 2005Ingle et al.2005Kamat et al.1980Kamat et al.1992Karita et al.2001Delhi,IndiaIncheon,SouthKoreaJalgaon,IndiaMumbai,IndiaMumbai,IndiaBangkok<strong>and</strong> Ayutthaya,Thail<strong>and</strong>1988–19984171 M <strong>and</strong> F residents(> 17 years)2002 293 M <strong>and</strong> Fcollege students2003–20041977–19791988–19891998–199960 M trafficpolicemen <strong>and</strong>60 M controls(o<strong>the</strong>r workers)2008 M <strong>and</strong> Fresidents(> 19 years)821 M <strong>and</strong> Fresidents(> 19 years)78 M traffic policemen<strong>and</strong> 128 M nontrafficpolicemen(unspecified agerange)TSP, SO 2 , <strong>and</strong> NO 2 concentrations<strong>in</strong> high-pollution<strong>and</strong> low-pollutionzones with<strong>in</strong> DelhiDistance <strong>of</strong> residencefrom road ( < 50, 50–100,100–500, <strong>and</strong> > 500 m)Traffic policemen comparedto occupationalcontrols with<strong>in</strong> JalgoanSO 2 , SPM, <strong>and</strong> NO 2 concentrations<strong>in</strong> high-tolowpollution urbanareas (Lalbaug, Chembur<strong>and</strong> Kaur) <strong>and</strong> arural areaSO 2 , SPM, <strong>and</strong> NO 2 concentrations<strong>in</strong> threeurban areas (Parel,Dadar, <strong>and</strong> Maravali)<strong>and</strong> a rural area (Deonar)Traffic policemen <strong>in</strong> anurban area (Bangkok)compared to generalpolicemen with<strong>in</strong> <strong>the</strong>urban area <strong>and</strong> a ruralarea (Ayutthaya)FEV 1 , FVC,FEF, PEFR,<strong>and</strong>Difference <strong>in</strong> average predicted PFT between<strong>the</strong> high- <strong>and</strong> low-pollution areas, amongmen <strong>and</strong> women (respectively): FVC, 3.7%MMEF 25–75<strong>and</strong> 2.9%; FEV 1 , 5.1% <strong>and</strong> 6.6%; FEF, 8.3%<strong>and</strong> 4.8%; PEFR, 7.5% <strong>and</strong> 2.0%; <strong>and</strong>MMEF 25–75 , 8.32% <strong>and</strong> 4.8%.FEV 1 , FVC, <strong>and</strong> Personal exposure to NO 2 was associated withFEF 25–75 decreased FEV 1 (P = 0.07) <strong>and</strong> FEF 25–75 (P =0.05).FEV 1 <strong>and</strong>FVCFEV 1 <strong>and</strong>FVCFEV 1 <strong>and</strong>FVCFEV 1 <strong>and</strong>FVCSpirometric analysis showed significant respiratoryimpairment <strong>in</strong> traffic policemen vs.controls.Results difficult to <strong>in</strong>terpret because subjectswere grouped by height category; those 3 cmtaller had a predicted FVC 500 mL lower.<strong>Air</strong> pollution was associated with reducedlung function <strong>in</strong> subjects <strong>of</strong> all ages. In <strong>the</strong>rural area, however, lung function was significantlylower, despite lower pollution concentrations.Results not adjusted for smok<strong>in</strong>g status.No significant differences <strong>in</strong> lung functionassociated with residence <strong>in</strong> polluted areas.Prevalence <strong>of</strong> FEV 1 /FVC < 70% <strong>of</strong> <strong>the</strong> predictedvalue was associated with residence<strong>in</strong> polluted areas <strong>in</strong> an analysis based on asmall number <strong>of</strong> subjects.Differences <strong>in</strong> socioeconomic status <strong>and</strong> ethnicityamong <strong>the</strong> four areas not controlled.After adjustment for age, height, <strong>and</strong> smok<strong>in</strong>gstatus, a difference <strong>in</strong> FEV 1 <strong>of</strong> ~5% wasfound between traffic <strong>and</strong> general police.~ 45% <strong>of</strong> subjects <strong>in</strong> each group were smokers.Table cont<strong>in</strong>ues next page144
HEI International Scientific Oversight CommitteeTable 18 (Cont<strong>in</strong>ued). Studies <strong>of</strong> Pulmonary Function <strong>in</strong> AdultsCitationStudy LocationStudyYears Study Sample <strong>Pollution</strong> Variable PFT Outcomes ResultsKumar KSet al. 2000Kumar Ret al. 2004Maeda et al.1991Nakai et al.1999Pothikamjornet al.2002Hyderabad,IndiaM<strong>and</strong>iGob<strong>in</strong>dgarh<strong>and</strong>,Mor<strong>in</strong>da,IndiaTokyo,JapanTokyo,JapanBangkok,Thail<strong>and</strong>1991 216 M residents(18–60 years)1999–20011987–19901987–19903603 M <strong>and</strong> Fresidents(> 15 years)2600 F residents(30–60 years)444 F residents(39–50 years)1999 290 F students(15–18 years)SPM, SO 2 , <strong>and</strong> NO 2 concentrations<strong>in</strong> <strong>in</strong>dustrial(Balanagar), commercial(Uppal), <strong>and</strong> residential(Tarnaka) districtsTSP, PM 10 , NO x , SO 2 ,CO, <strong>and</strong> O 3 concentrations<strong>in</strong> a high-pollutionarea (M<strong>and</strong>i Gob<strong>in</strong>dgarh)<strong>and</strong> a low-pollutionarea (Mor<strong>in</strong>da)NO 2 gradient based ondistance <strong>of</strong> residencefrom road <strong>in</strong> SumidaWard, Tokyo (< 20 m<strong>and</strong> 20–150 m) <strong>and</strong> a residentialsuburb <strong>of</strong> Tokyo(Higashiyamato)NO 2 gradient based ondistance <strong>of</strong> residencefrom road <strong>in</strong> SumidaWard, Tokyo (< 20 m<strong>and</strong> 20–150 m) <strong>and</strong> a residentialsuburb <strong>of</strong> Tokyo(Higashiyamato)PM 10 concentrationsoutside schoolslocated <strong>in</strong> <strong>the</strong> center<strong>of</strong> BangkokFEV 1 <strong>and</strong>FVCFEV 1 <strong>and</strong>FVCFEV 1 <strong>and</strong>FVCFEV 1 <strong>and</strong>FVCNo significant differences <strong>in</strong> level <strong>of</strong> pulmonaryfunction among districts or <strong>in</strong> associationwith average air pollution concentrationsNo adjustment for smok<strong>in</strong>g.Prevalence <strong>of</strong> ventilatory defects ~2 higher<strong>in</strong> <strong>in</strong>dustrial town than non-<strong>in</strong>dustrial townafter adjustment for age, sex, education,occupation, <strong>in</strong>come, <strong>and</strong> smok<strong>in</strong>g status.“Ventilatory defect” def<strong>in</strong>ed as 1.645 SE <strong>of</strong>estimated predictive value. Potential residualconfound<strong>in</strong>g by smok<strong>in</strong>g status.No consistent differences <strong>in</strong> FEV 1 <strong>and</strong> FVC.Results not adjusted for smok<strong>in</strong>g status.Repeated pulmonary function measurementsshowed small reductions <strong>in</strong> FEV 1 <strong>and</strong> FVCassociated with residence near busy roads.Extension <strong>of</strong> Maeda et al. 1991. Results notadjusted for smok<strong>in</strong>g status.FEV 1, FVC, <strong>and</strong> Small differences <strong>in</strong> FEF 25–75 <strong>in</strong> associationFEF 25–75 with pollution levels (P < 0.05); no o<strong>the</strong>reffects on PFT.No details on PFT methods or smok<strong>in</strong>g status(except that 30% <strong>of</strong> households had a residentsmoker).Table cont<strong>in</strong>ues next page145
<strong>Outdoor</strong> <strong>Air</strong> <strong>Pollution</strong> <strong>and</strong> <strong>Health</strong> <strong>in</strong> <strong>the</strong> Develop<strong>in</strong>g <strong>Countries</strong> <strong>of</strong> <strong>Asia</strong>Table 18 (Cont<strong>in</strong>ued). Studies <strong>of</strong> Pulmonary Function <strong>in</strong> AdultsCitationStudyYears Study Sample <strong>Pollution</strong> Variable PFT Outcomes ResultsRao et al.1992NotspecifiedWongsurakiatet al.1999Xu XPet al. 1991Zhou Wet al. 2001Study LocationAhmedabad,IndiaBangkok,Thail<strong>and</strong>Beij<strong>in</strong>g,Ch<strong>in</strong>aShanghai,Ch<strong>in</strong>a1996–1997203 Shopkeepers NO 2 concentrations atsix traffic junctionsgrouped <strong>in</strong>to threelevels <strong>of</strong> exposure620 M traffic policemen(20–60 years)<strong>and</strong> 303 M controls(students <strong>and</strong> o<strong>the</strong>rworkers)1986 1440 M <strong>and</strong> Fresidents(40–69 years)1998 377 M <strong>and</strong> F taxi<strong>and</strong> bus drivers orconductors(19–55 years) <strong>and</strong>65 M <strong>and</strong> F controls(unexposedresidents)Traffic policemen (with<strong>and</strong> without protectivemasks) <strong>and</strong> controlswith<strong>in</strong> BangkokTSP <strong>and</strong> SO 2 concentrations<strong>in</strong> residential,<strong>in</strong>dustrial, <strong>and</strong> suburbanareas with<strong>in</strong> Beij<strong>in</strong>gTraffic-exposed workers<strong>and</strong> controls with<strong>in</strong>ShanghaiFEV 1 , FVC,<strong>and</strong> FEFFEV 1 <strong>and</strong>FVCFEV 1 <strong>and</strong>FVCFEV 1 <strong>and</strong>FVCIn high-exposure <strong>and</strong> low-exposure groups(respectively), FVC was 89.2% <strong>and</strong> 92.2%(nonsignificant); FEV 1 was 81.1% <strong>and</strong> 85%(P < 0.05); <strong>and</strong> FEF was 85.2% <strong>and</strong> 95.9%(P < 0.05).~15% <strong>of</strong> <strong>the</strong> highly exposed shopkeepers hadcl<strong>in</strong>ically significant airway obstruction.In traffic policemen (without protectivemasks) <strong>and</strong> controls (respectively), FEV 1 was3.29% <strong>and</strong> 3.43% (P < 0.01); <strong>and</strong> FVC was3.86 % <strong>and</strong> 3.98% (P = 0.047).Liv<strong>in</strong>g <strong>in</strong> <strong>the</strong> residential <strong>and</strong> <strong>in</strong>dustrial areaswas associated with a reduced FEV 1 (69-mL<strong>and</strong> 62-mL decl<strong>in</strong>e) <strong>and</strong> FVC (257-mL <strong>and</strong>177-mL decl<strong>in</strong>e).<strong>Pollution</strong> reported to have no significant effecton FEV 1 <strong>and</strong> FVC, but no specific data reported<strong>and</strong> cannot separate out non-smokers.No useful PFT data.146
HEI International Scientific Oversight CommitteeFor each study, we assessed <strong>the</strong> degree to which smok<strong>in</strong>gwas taken <strong>in</strong>to account, ei<strong>the</strong>r by separately report<strong>in</strong>g <strong>the</strong>results accord<strong>in</strong>g to smok<strong>in</strong>g status or by statistical adjustment.Most <strong>of</strong> <strong>the</strong> studies did not report <strong>the</strong> methods orresults <strong>in</strong> sufficient detail to determ<strong>in</strong>e whe<strong>the</strong>r <strong>the</strong> potentialfor confound<strong>in</strong>g due to smok<strong>in</strong>g could be excluded asan explanation <strong>of</strong> <strong>the</strong> reported results.Some studies suggest that <strong>the</strong>re are adverse effects onlung function <strong>in</strong> adults, <strong>in</strong>dependent <strong>of</strong> <strong>the</strong> effects <strong>of</strong>tobacco smok<strong>in</strong>g. Three <strong>of</strong> <strong>the</strong> eight studies from India provideddata on changes <strong>in</strong> pulmonary function associatedwith relatively high concentrations <strong>of</strong> TSP <strong>and</strong> NO 2 orSO 2 . Chhabra <strong>and</strong> colleagues (2001) studied approximately4171 asymptomatic nonsmokers who lived <strong>in</strong> twodistricts <strong>in</strong> Delhi. They reported a 3% to 6% difference <strong>in</strong>levels <strong>of</strong> FVC, FEV 1 , <strong>and</strong> maximum midexpiratory flowdur<strong>in</strong>g <strong>the</strong> middle half <strong>of</strong> FVC (MMEF 25–75 ) among bothmale <strong>and</strong> female residents <strong>of</strong> <strong>the</strong> more-polluted districtcompared with values for residents <strong>of</strong> <strong>the</strong> less-polluteddistrict, after adjustment for socioeconomic status. Thedifference <strong>in</strong> ambient concentrations between high- <strong>and</strong>low-pollution areas was greater for <strong>the</strong> gaseous pollutants(for which <strong>the</strong> high concentrations were twice <strong>the</strong> low concentrations)than for TSP (for which <strong>the</strong> high concentrationswere 1.3 times <strong>the</strong> low concentrations).Rao <strong>and</strong> colleagues (1992) studied 203 shopkeepers whowere nonsmokers, compar<strong>in</strong>g those with high exposures totraffic <strong>and</strong> those with lower exposures. Measured NO 2concentrations <strong>in</strong> <strong>the</strong> high-exposure areas were twicethose <strong>in</strong> <strong>the</strong> lower-exposure areas. Adjusted FEV 1 valueswere 4% lower <strong>in</strong> <strong>the</strong> highly exposed group, <strong>and</strong> roughly15% <strong>of</strong> <strong>the</strong> shopkeepers <strong>in</strong> <strong>the</strong> highly exposed group hadlevels <strong>of</strong> pulmonary function consistent with cl<strong>in</strong>icallysignificant obstruction <strong>of</strong> <strong>the</strong> airways. F<strong>in</strong>ally, Kumar R<strong>and</strong> colleagues (2004) studied 3603 residents, aged > 15years, <strong>in</strong> two towns: one <strong>in</strong>dustrial <strong>and</strong> one non-<strong>in</strong>dustrial.Concentrations <strong>of</strong> PM (measured as TSP <strong>and</strong> PM 10 ) <strong>and</strong>gaseous pollutants (NO x , sulfur oxides, <strong>and</strong> CO) were measuredover a year; <strong>the</strong> concentrations <strong>in</strong> <strong>the</strong> <strong>in</strong>dustrialtown were 1.5 to 8 times <strong>the</strong> concentrations <strong>in</strong> <strong>the</strong> non<strong>in</strong>dustrialtown. The authors reported that <strong>the</strong> frequency <strong>of</strong>ventilatory defects <strong>in</strong> <strong>the</strong> <strong>in</strong>dustrial town was approximatelytwice that <strong>in</strong> <strong>the</strong> non-<strong>in</strong>dustrial town, a differenceequivalent to a 1-SD unit below <strong>the</strong> estimated predictedvalue, after adjustment for age, sex, education level, occupation,<strong>in</strong>come, method <strong>of</strong> home heat<strong>in</strong>g, <strong>and</strong> smok<strong>in</strong>g.The authors noted <strong>the</strong> potential for residual confound<strong>in</strong>gby factors related to socioeconomic status.Effects <strong>of</strong> exposure to traffic-related air pollution werealso reported <strong>in</strong> a Thai study <strong>of</strong> traffic policemen whowere nonsmokers (Wongsurakiat et al. 1999). Policemenwith more than 10 years <strong>of</strong> heavy exposure to vehiculartraffic were 1.7 times as likely to have an FEV 1 level below80% <strong>of</strong> <strong>the</strong> predicted value than less-exposed policemen<strong>and</strong> o<strong>the</strong>r controls. An apparent protective effect <strong>of</strong> regularuse <strong>of</strong> masks was noted but not confirmed; <strong>the</strong> number <strong>of</strong>nonusers was small.Xu XP <strong>and</strong> colleagues (1991) compared 1400 adult nonsmokers,aged 40–69 years, liv<strong>in</strong>g <strong>in</strong> one <strong>of</strong> three districts<strong>in</strong> Beij<strong>in</strong>g. The TSP concentrations among <strong>the</strong> three districtsvaried by a factor <strong>of</strong> 1.7, <strong>and</strong> <strong>the</strong> SO 2 concentrationsvaried by a factor <strong>of</strong> 7.1; <strong>in</strong> <strong>the</strong> most <strong>in</strong>dustrial district, <strong>the</strong>annual average TSP <strong>and</strong> SO 2 concentrations were 449µg/m 3 <strong>and</strong> 261 µg/m 3 , respectively. In a multivariate analysiswith adjustment for a variety <strong>of</strong> known factors, <strong>the</strong>authors found significantly reduced FEV 1 <strong>and</strong> FVC values<strong>in</strong> residents <strong>of</strong> <strong>the</strong> most-polluted district, with a decrease<strong>in</strong> FVC <strong>of</strong> 131 mL per log unit <strong>of</strong> SO 2 <strong>and</strong> <strong>of</strong> 478 mL per logunit <strong>of</strong> TSP. Smaller changes were noted for FEV 1 . Issues <strong>of</strong>confound<strong>in</strong>g by home heat<strong>in</strong>g <strong>and</strong> potential residualsmok<strong>in</strong>g effects were not completely resolved <strong>in</strong> a companionstudy reported on later (Xu X 1998).Discussion In general, because <strong>the</strong>se studies are crosssectional<strong>and</strong> because <strong>the</strong> air pollution exposures wereestimated for whole geographic areas ra<strong>the</strong>r than for <strong>in</strong>dividuals,it is difficult to reach firm conclusions as to <strong>the</strong>impact <strong>of</strong> ambient pollution on pulmonary function.Cross-sectional studies suggest detrimental effects <strong>of</strong> exposureto air pollution on children’s lung function, provid<strong>in</strong>gsnapshots <strong>of</strong> events that are part <strong>of</strong> a dynamic process <strong>of</strong>how lung growth <strong>and</strong> development may be affected. Longitud<strong>in</strong>alstudies are needed to determ<strong>in</strong>e whe<strong>the</strong>r <strong>the</strong> crosssectionalassociations with air pollution represent aslower-than-normal growth <strong>of</strong> lung function that results <strong>in</strong>permanent deficits (<strong>and</strong> might subsequently lead to anaccelerated decl<strong>in</strong>e <strong>in</strong> lung function <strong>in</strong> adulthood) or, assome studies <strong>in</strong> Western countries suggest, a transientworsen<strong>in</strong>g <strong>of</strong> pulmonary function with recovery as pollutionlevels improve (Avol et al. 2001; Sugiri et al. 2006).Few studies <strong>of</strong> adults have used acceptable methodswith regard to test<strong>in</strong>g protocols or controll<strong>in</strong>g for <strong>the</strong>effects <strong>of</strong> tobacco smok<strong>in</strong>g. In a small subset <strong>of</strong> <strong>the</strong> studiesthat controlled for confound<strong>in</strong>g by tobacco smoke, ei<strong>the</strong>rthrough restrict<strong>in</strong>g <strong>the</strong> study population to people who didnot smoke or by adjustment, <strong>the</strong>re were decrements <strong>in</strong> pulmonaryfunction; it was difficult to determ<strong>in</strong>e, however,whe<strong>the</strong>r <strong>the</strong>se decrements were <strong>the</strong> result <strong>of</strong> long-term exposure<strong>in</strong> adulthood or reduced growth <strong>of</strong> lung function <strong>in</strong>childhood. There is also <strong>the</strong> potential for residual confound<strong>in</strong>g,such as confound<strong>in</strong>g due to differences among factorsrelated to socioeconomic status <strong>in</strong> studies that compare147
<strong>Outdoor</strong> <strong>Air</strong> <strong>Pollution</strong> <strong>and</strong> <strong>Health</strong> <strong>in</strong> <strong>the</strong> Develop<strong>in</strong>g <strong>Countries</strong> <strong>of</strong> <strong>Asia</strong>rates <strong>in</strong> an <strong>in</strong>dustrialized or urban area with those <strong>in</strong> a morerural area. These problems are encountered <strong>in</strong> cross-sectionalstudies <strong>in</strong> Western countries as well as <strong>in</strong> <strong>Asia</strong>.Götschi <strong>and</strong> colleagues (2008) recently reviewed <strong>the</strong> literatureon pulmonary function <strong>and</strong> long-term exposure toair pollution published over <strong>the</strong> past 20 years. They identified58 studies <strong>of</strong> adults or children, but only 9 <strong>in</strong> <strong>Asia</strong>ncountries, all <strong>of</strong> which were <strong>in</strong>cluded <strong>in</strong> this review. Theyfocused on <strong>the</strong> 35 studies that <strong>in</strong>cluded four or morelocales; only two <strong>of</strong> <strong>the</strong>se studies were <strong>in</strong> <strong>Asia</strong> (Nakai et al.1999; Sek<strong>in</strong>e et al. 2004). They noted <strong>the</strong> methodologicdiversity <strong>of</strong> <strong>the</strong> studies <strong>and</strong> <strong>the</strong> challenges this posed forquantitatively summariz<strong>in</strong>g <strong>the</strong> results, but concluded that<strong>the</strong> available evidence was consistent with air pollutionbe<strong>in</strong>g associated with adverse effects on lung growth <strong>in</strong>children <strong>and</strong> reduced lung function <strong>in</strong> adults; <strong>the</strong> latterconclusion was based largely on <strong>the</strong> same types <strong>of</strong> crosssectionalstudies reviewed above. They also emphasized<strong>the</strong> need to identify <strong>the</strong> tim<strong>in</strong>g <strong>of</strong> exposure with regard toeffects on lung function <strong>and</strong> <strong>the</strong> need to address a range <strong>of</strong>potential modifiers <strong>of</strong> <strong>the</strong> effect <strong>of</strong> air pollution on lungfunction, <strong>in</strong>clud<strong>in</strong>g differences among <strong>in</strong>dividuals <strong>in</strong> susceptibility<strong>and</strong> characteristics <strong>of</strong> <strong>the</strong> air pollution mix.Longitud<strong>in</strong>al cohort studies or panel studies that uselongitud<strong>in</strong>al follow-up designs with adequate measures <strong>of</strong>ambient <strong>and</strong> personal pollutant exposures are needed toassess <strong>the</strong> growth <strong>and</strong> development <strong>of</strong> pulmonary function<strong>in</strong> children, as well as to assess <strong>the</strong> rate <strong>of</strong> decl<strong>in</strong>e <strong>of</strong> pulmonaryfunction <strong>in</strong> adults, who will cont<strong>in</strong>ue to beexposed to ambient pollutants generated both by stationary<strong>and</strong> mobile sources. Fur<strong>the</strong>rmore, it would beuseful to identify places <strong>in</strong> which improvements arescheduled that will reduce ambient exposures, to aid <strong>in</strong>characteriz<strong>in</strong>g <strong>the</strong> reversibility <strong>of</strong> lung function deficits asair pollution exposures decrease.Asthma <strong>and</strong> WheezeLiterature searches with<strong>in</strong> <strong>the</strong> PAPA–SAN <strong>and</strong> APEDdatabases yielded 48 c<strong>and</strong>idate papers address<strong>in</strong>g asthmaor wheeze published through August 2007 with <strong>the</strong> fulltext available <strong>in</strong> English. The eligibility criteria were that(1) <strong>the</strong> study conta<strong>in</strong>ed <strong>in</strong>formation about <strong>the</strong> statisticalassociation between <strong>in</strong>dicators <strong>of</strong> air pollution <strong>and</strong> measures<strong>of</strong> <strong>the</strong> prevalence or <strong>in</strong>cidence <strong>of</strong> wheeze (<strong>the</strong> card<strong>in</strong>alsymptom <strong>of</strong> asthma) or a diagnosis <strong>of</strong> asthma, (2) <strong>the</strong>study was population based, <strong>and</strong> (3) estimates wereadjusted for age <strong>and</strong> sex, at least. After a more detailed<strong>in</strong>spection <strong>of</strong> <strong>the</strong> 48 articles, 6 were excluded: 4 because<strong>the</strong>re was <strong>in</strong>adequate <strong>in</strong>formation on exposure or outcome(Hsieh <strong>and</strong> Shen 1988; Kagamimori et al. 1990; Lahiri et al.2000; Tsai HJ et al. 2006a), <strong>and</strong> 2 because <strong>the</strong>y were basedon a worker population with occupational exposures(Tamura et al. 2003; Karita et al. 2004). The degree <strong>of</strong>adjustment for confounders varied; we elected to <strong>in</strong>cludestudies without statistical adjustment, provided that <strong>the</strong>comparison groups were balanced with respect to age <strong>and</strong>sex. All selected articles were sufficiently clearly writtento underst<strong>and</strong> what <strong>the</strong> <strong>in</strong>vestigators had done.The 42 studies are summarized <strong>in</strong> Table 19, with severalcharacteristics <strong>and</strong> quantitative results listed. If ORs weregiven, <strong>the</strong>y were tabulated <strong>and</strong> presented as forest plots.The largest number <strong>of</strong> studies was from Taipei,Ch<strong>in</strong>a (13),followed by Japan (10), Ch<strong>in</strong>a (6), Hong Kong (4), India (4),Indonesia (2), <strong>and</strong> one each from South Korea, S<strong>in</strong>gapore,<strong>and</strong> Thail<strong>and</strong>. The publication date was prior to 1990 for 4articles, between 1990 <strong>and</strong> 1999 for 14, <strong>and</strong> between 2000<strong>and</strong> 2007 for 24. There were 30 studies <strong>of</strong> children <strong>and</strong> 14<strong>of</strong> adults (with 2 studies address<strong>in</strong>g both). A total <strong>of</strong> 19studies reported results for females, 13 for males, <strong>and</strong> 28for both sexes comb<strong>in</strong>ed.To ascerta<strong>in</strong> <strong>the</strong> presence <strong>of</strong> asthma, <strong>the</strong> studies usedconventional <strong>and</strong> widely accepted methods that are basedon questionnaires about wheeze, <strong>the</strong> pr<strong>in</strong>cipal symptom <strong>of</strong>asthma, or a diagnosis <strong>of</strong> asthma. Asthma is a relaps<strong>in</strong>g–remitt<strong>in</strong>g disease with a large range <strong>of</strong> <strong>in</strong>dividual patterns<strong>of</strong> frequency, duration, <strong>and</strong> <strong>in</strong>tensity <strong>of</strong> wheezy dyspnea.Questions about wheeze generally focus on a limited timeperiod for possible symptoms, generally with<strong>in</strong> <strong>the</strong> recentpast (e.g., <strong>the</strong> past 12 months), to ensure that recollectionis feasible. It is also common to ask whe<strong>the</strong>r <strong>the</strong> respondenthas “ever” had a given symptom, <strong>in</strong> which case <strong>the</strong>tim<strong>in</strong>g is unclear unless def<strong>in</strong>ed by <strong>the</strong> young age <strong>of</strong> <strong>the</strong>subject (e.g., < 5 years). Most studies we identified alsoasked about receipt <strong>of</strong> a diagnosis <strong>of</strong> “asthma,” sometimesqualify<strong>in</strong>g it as be<strong>in</strong>g “doctor-diagnosed.” Although thisquestion clearly specifies asthma, <strong>the</strong> particulars <strong>of</strong> diagnos<strong>in</strong>g<strong>the</strong> disease vary considerably. Therefore, <strong>the</strong> prevalence<strong>of</strong> asthma symptoms will tend to be underestimated,because not all people with symptoms consult a doctor <strong>and</strong>because <strong>the</strong> diagnosis <strong>of</strong> asthma may not be given untilwheez<strong>in</strong>g has been shown to be recurrent or persistent.St<strong>and</strong>ardized questionnaires have been developed by<strong>the</strong> ATS, <strong>the</strong> British Medical Research Council (BMRC),<strong>the</strong> European Respiratory <strong>Health</strong> Survey, <strong>the</strong> InternationalStudy <strong>of</strong> Asthma <strong>and</strong> Allergies <strong>in</strong> Childhood (ISAAC), <strong>and</strong><strong>the</strong> WHO. The majority <strong>of</strong> <strong>the</strong> studies reviewed used one <strong>of</strong><strong>the</strong>se questionnaires outright or as a basis <strong>of</strong> a study-specificquestionnaire. It was not always clear how faithfully<strong>the</strong> study had followed <strong>the</strong> st<strong>and</strong>ardized questionnaire. Allstudies used a systematic approach that permitted unbiasedcomparisons <strong>of</strong> <strong>the</strong> groups <strong>of</strong> <strong>in</strong>terest. To simplify <strong>the</strong>148
HEI International Scientific Oversight CommitteeTable 19. Studies <strong>of</strong> Asthma <strong>and</strong> WheezeCitationStudyLocationStudy StudyYear aVariables orComparisonsSample b Designs c <strong>Pollution</strong>Parameters, Summary F<strong>in</strong>d<strong>in</strong>gsQuestionnaires d for Confounders eOutcomes, <strong>and</strong> <strong>and</strong> AdjustmentsAggarwal et al. 2006 Four urban orrural centers <strong>in</strong>Ch<strong>and</strong>igarh,Delhi, <strong>and</strong>Kanpur,BangaloreChen PC et al. 1998 Six communities<strong>in</strong> Taipei,Ch<strong>in</strong>aNR 73,605 M+Fadults( 15 years)1994–1997Chhabra et al. 2001 Delhi, India 1988–19984860 M+F primary-schoolchildren4171 M, Fadults liv<strong>in</strong>g <strong>in</strong>two areas withdifferentpollutionconcentrationsChhabra et al. 1999 Delhi, India NR 21,367 M+Fchildren(5–17 years)Duki et al. 2003 Jakarta, B<strong>and</strong>ar,<strong>and</strong> Lampung,Indonesia1996–199716,663 Pairs <strong>of</strong>junior-highstudents <strong>and</strong><strong>the</strong>ir mo<strong>the</strong>rs;children M+F,adults FBetween cities(n = 4)Between cities(n = 6)Urban vs.ruralUrban vs.ruralPrevalence, A-r,IUATLDPrevalence, W-rns<strong>and</strong> A-rns, WHOWith<strong>in</strong> city High vs. low Prevalence, W-rns<strong>and</strong> A-rnsWith<strong>in</strong> city High vs. low Prevalence, W-r,ATS <strong>and</strong> BMRCBetween cities(n = 8)<strong>and</strong> proximityto trafficNO 2 concentration;< 20m vs. 20 mfrom roadPrevalence, W-r,ATSSignificant associationAdjustment for D, S, Sm,<strong>and</strong> OSignificant associationAdjustment for D, S, I, Sm,<strong>and</strong> OInvestigator reported no significantassociation (data notshown)Adjustment for D, S, I, Sm,<strong>and</strong> OInvestigator reported no significantassociation (data notshown)Adjustment for D, S, I, Sm,<strong>and</strong> OSignificant associations withNO 2 , no significant associationswith liv<strong>in</strong>g < 20 m from roadAdjustment for D <strong>and</strong> Sm. ORscould not be extractedTable cont<strong>in</strong>ues next pagea NR <strong>in</strong>dicates that <strong>the</strong> study year was not reported.b M+F <strong>in</strong>dicates that <strong>the</strong> data for males <strong>and</strong> females were comb<strong>in</strong>ed; M, F <strong>in</strong>dicates that <strong>the</strong> data for males <strong>and</strong> females were reported separately.c If several designs were used, <strong>the</strong> design associated with <strong>the</strong> reported adjusted effect estimates is listed.d Possible parameters were <strong>in</strong>cidence, prevalence, exacerbation, <strong>and</strong> trends. Possible outcomes were A-r (doctor-diagnosed or self-reported asthma with<strong>in</strong> <strong>the</strong> last 3 years), or A-rns (doctordiagnosedor self-reported asthma, whose time <strong>of</strong> diagnosis or self-report<strong>in</strong>g is unspecified or not recent), W-r (wheeze symptoms reported with<strong>in</strong> <strong>the</strong> last 3 years), or W-rns (wheeze symptomswhose time <strong>of</strong> report<strong>in</strong>g is unspecified or not recent). The questionnaire was <strong>the</strong> st<strong>and</strong>ardized questionnaire used to assess asthma <strong>and</strong> wheeze <strong>in</strong> <strong>the</strong> study, if any.e Summary f<strong>in</strong>d<strong>in</strong>gs listed <strong>in</strong>clude any positive statistically significant association (noted as “significant association”). Any significant negative association is specifically listed as such.Adjustments for confounders <strong>in</strong>cluded adjustments for demographic characteristics (D), socioeconomic characteristics (S), <strong>in</strong>door air pollution (I), smok<strong>in</strong>g status (Sm), <strong>and</strong> o<strong>the</strong>r variables (O).Comments are also listed, if pert<strong>in</strong>ent.149
<strong>Outdoor</strong> <strong>Air</strong> <strong>Pollution</strong> <strong>and</strong> <strong>Health</strong> <strong>in</strong> <strong>the</strong> Develop<strong>in</strong>g <strong>Countries</strong> <strong>of</strong> <strong>Asia</strong>Table 19 (Cont<strong>in</strong>ued). Studies <strong>of</strong> Asthma <strong>and</strong> WheezeCitationStudyLocationStudy StudyYear aVariables orComparisonsSample b Designs c <strong>Pollution</strong>Parameters, Summary F<strong>in</strong>d<strong>in</strong>gsQuestionnaires d for Confounders eOutcomes, <strong>and</strong> <strong>and</strong> AdjustmentsGoh et al. 1986 S<strong>in</strong>gapore 1983 3216 M+F primary-schoolchildrenGuo et al. 1999 Taipei,Ch<strong>in</strong>a 1995 331,686 M, FnonsmokerchildrenBetweencitiesBetweencities(nationwide)Urban vs.rural vs.<strong>in</strong>dustrialPrevalence,W-r ,W-rns, A-r,<strong>and</strong> A-rnsTraffic-related Prevalence, W-rpollution, <strong>and</strong> A-rnsstationarysourcepollutionrelatedto fossil-fuelcombustion,<strong>and</strong> CO, NO x ,O 3 , PM 10 ,<strong>and</strong> SO 2Investigator reported no significantassociation (data notshown)Adjustment for D, by designSignificant associations withtraffic-related pollution, <strong>and</strong>significant negative associationswith stationary sources <strong>and</strong>fossil-fuel combustion, <strong>and</strong>significant association with NO x<strong>and</strong> CO but not O 3 , PM 10 , or SO 2Adjustment for D, S, Sm, <strong>and</strong> O.ORs could not be extractedHo et al. 2007 Taipei,Ch<strong>in</strong>a 1995–199664,660 M, Fjunior-highstudentsBetweencitiesHigh vs. lowconcentrations<strong>of</strong> CO,NO 2 , NO, O 3<strong>and</strong> A-r, ISAAC,<strong>and</strong> o<strong>the</strong>r<strong>and</strong> PM 10Prevalence, W-rSignificant associationsAdjustment for D, S, I, Sm, <strong>and</strong>OHong CY et al.2004aHong SJ et al.2004bKer<strong>in</strong>ci, SP7, <strong>and</strong>Pelalawan,IndonesiaSeoul <strong>and</strong> 8 prov<strong>in</strong>cialcenters(Suwon, Chungju,Chunju,Changwon,Chunchon,Cheju, Ulsan,<strong>and</strong> Ansan),South Korea2001 382 M+F children1995–200015,214 M, F, <strong>and</strong>M+F adolescentsBetweencities (n = 2)BetweencitiesUrban vs.ruralUrban vs.rural <strong>and</strong><strong>in</strong>dustrial vs.ruralPrevalence,W-rns, ISAACPrevalence, W-r,ISAACNo significant associationAdjustment for D, S, I, SmNo significant associations <strong>in</strong>1995 or 2000Adjustment for D, by designTable cont<strong>in</strong>ues next pagea NR <strong>in</strong>dicates that <strong>the</strong> study year was not reported.b M+F <strong>in</strong>dicates that <strong>the</strong> data for males <strong>and</strong> females were comb<strong>in</strong>ed; M, F <strong>in</strong>dicates that <strong>the</strong> data for males <strong>and</strong> females were reported separately.c If several designs were used, <strong>the</strong> design associated with <strong>the</strong> reported adjusted effect estimates is listed.d Possible parameters were <strong>in</strong>cidence, prevalence, exacerbation, <strong>and</strong> trends. Possible outcomes were A-r (doctor-diagnosed or self-reported asthma with<strong>in</strong> <strong>the</strong> last 3 years), or A-rns (doctordiagnosedor self-reported asthma, whose time <strong>of</strong> diagnosis or self-report<strong>in</strong>g is unspecified or not recent), W-r (wheeze symptoms reported with<strong>in</strong> <strong>the</strong> last 3 years), or W-rns (wheeze symptomswhose time <strong>of</strong> report<strong>in</strong>g is unspecified or not recent). The questionnaire was <strong>the</strong> st<strong>and</strong>ardized questionnaire used to assess asthma <strong>and</strong> wheeze <strong>in</strong> <strong>the</strong> study, if any.e Summary f<strong>in</strong>d<strong>in</strong>gs listed <strong>in</strong>clude any positive statistically significant association (noted as “significant association”). Any significant negative association is specifically listed as such.Adjustments for confounders <strong>in</strong>cluded adjustments for demographic characteristics (D), socioeconomic characteristics (S), <strong>in</strong>door air pollution (I), smok<strong>in</strong>g status (Sm), <strong>and</strong> o<strong>the</strong>r variables (O).Comments are also listed, if pert<strong>in</strong>ent.150
HEI International Scientific Oversight CommitteeTable 19 (Cont<strong>in</strong>ued). Studies <strong>of</strong> Asthma <strong>and</strong> WheezeCitationStudyLocationStudy StudyYear aVariables orComparisonsSample b Designs c <strong>Pollution</strong>Parameters, Summary F<strong>in</strong>d<strong>in</strong>gsQuestionnaires d for Confounders eOutcomes, <strong>and</strong> <strong>and</strong> AdjustmentsHwang BF et al.2005a22 Municipalities<strong>in</strong> Taipei,Ch<strong>in</strong>aImai et al. 1980 Yokkaichi,Mihama, <strong>and</strong>Kusu, JapanKagamimori et al.1986Kumar R et al.2004Awara-machi,JapanM<strong>and</strong>iGob<strong>in</strong>dgarh <strong>and</strong>Mor<strong>in</strong>da, IndiaKuo et al. 2002 CentralTaipei,Ch<strong>in</strong>aLangkulsen et al.2006Bangkok,Thail<strong>and</strong>2001 32,672 M+Fschoolchildren(6–15 years)1973–1974<strong>and</strong>19781970–19791999–2001M+F residents(> 40 years)M+F schoolchildren(6–14years)3603 M, F, <strong>and</strong>M+F adult residents(> 15years)NR 12,926 M+F junior-highstudents(13–16years) <strong>in</strong> eightschools2004 878 M+F schoolchildrenBetweencities 1 kmfrom monitor<strong>in</strong>gstations(n = 22)With<strong>in</strong> city(23 areas)Po<strong>in</strong>t source(power station)Betweencities (n = 2)Betweencities (n = 8)With<strong>in</strong>cityCO, NO x , O 3 , Prevalence, A-rns,PM 10 , <strong>and</strong> ISAACSO 2Time trends<strong>in</strong> NO x <strong>and</strong>sulfur oxidesPrevalence <strong>and</strong>trends, A-r,BMRCTime trends Prevalence <strong>and</strong>SO 2 BMRC<strong>in</strong> NO 2 <strong>and</strong> trends, W-r,High vs. low Prevalence, W-r,BMRCHigh vs. low Prevalence, A-rnsconcentrationsNO 2 , ISAAC<strong>and</strong> W-rns,O 3 , PM 10 ,<strong>and</strong> SO 2High (threegrades) vs.lowPrevalence, A-r,ATSSignificant associationsAdjustment for D, S, I, Sm,<strong>and</strong> O. Study <strong>in</strong>cludes multipollutantmodelsSignificant association withsulfur oxides but not NO xAdjustment for D <strong>and</strong> Sm, NO xMultiple correlation coefficientscalculated us<strong>in</strong>g adjustedprevalence estimatesSignificant correlations overtime with NO 2Adjustment for DSignificant associationAdjustment for D, by designSignificant associationsAdjustment for D, S, I, Sm, <strong>and</strong>OSignificant associationsAdjustment for D, I, Sm, <strong>and</strong> OTable cont<strong>in</strong>ues next pagea NR <strong>in</strong>dicates that <strong>the</strong> study year was not reported.b M+F <strong>in</strong>dicates that <strong>the</strong> data for males <strong>and</strong> females were comb<strong>in</strong>ed; M, F <strong>in</strong>dicates that <strong>the</strong> data for males <strong>and</strong> females were reported separately.c If several designs were used, <strong>the</strong> design associated with <strong>the</strong> reported adjusted effect estimates is listed.d Possible parameters were <strong>in</strong>cidence, prevalence, exacerbation, <strong>and</strong> trends. Possible outcomes were A-r (doctor-diagnosed or self-reported asthma with<strong>in</strong> <strong>the</strong> last 3 years), or A-rns (doctordiagnosedor self-reported asthma, whose time <strong>of</strong> diagnosis or self-report<strong>in</strong>g is unspecified or not recent), W-r (wheeze symptoms reported with<strong>in</strong> <strong>the</strong> last 3 years), or W-rns (wheeze symptomswhose time <strong>of</strong> report<strong>in</strong>g is unspecified or not recent). The questionnaire was <strong>the</strong> st<strong>and</strong>ardized questionnaire used to assess asthma <strong>and</strong> wheeze <strong>in</strong> <strong>the</strong> study, if any.e Summary f<strong>in</strong>d<strong>in</strong>gs listed <strong>in</strong>clude any positive statistically significant association (noted as “significant association”). Any significant negative association is specifically listed as such.Adjustments for confounders <strong>in</strong>cluded adjustments for demographic characteristics (D), socioeconomic characteristics (S), <strong>in</strong>door air pollution (I), smok<strong>in</strong>g status (Sm), <strong>and</strong> o<strong>the</strong>r variables (O).Comments are also listed, if pert<strong>in</strong>ent.151
<strong>Outdoor</strong> <strong>Air</strong> <strong>Pollution</strong> <strong>and</strong> <strong>Health</strong> <strong>in</strong> <strong>the</strong> Develop<strong>in</strong>g <strong>Countries</strong> <strong>of</strong> <strong>Asia</strong>Table 19 (Cont<strong>in</strong>ued). Studies <strong>of</strong> Asthma <strong>and</strong> WheezeCitationStudyLocationStudy StudyYear aVariables orComparisonsSample b Designs c <strong>Pollution</strong>Parameters, Summary F<strong>in</strong>d<strong>in</strong>gsQuestionnaires d for Confounders eOutcomes, <strong>and</strong> <strong>and</strong> AdjustmentsLee YL et al.2003cLee YL et al.2005L<strong>in</strong> RS et al.2001cMaeda et al.1991Taipei,Ch<strong>in</strong>a 2001 35,036 M+Fschoolchildren(6–15 years)Taipei,Ch<strong>in</strong>a 1995–1996<strong>and</strong>2001Taipei,Ch<strong>in</strong>a 1995–1996Tokyo, Japan 1987–1990M+F children(12–15 years):44,104 <strong>in</strong>1995–1996 <strong>and</strong>11,048 <strong>in</strong> 20011,018,031 M+Fmiddle-schoolstudents2600 Adultwomen (30–60years) <strong>and</strong> 360M+F children(3–6 years)Mi et al. 2006 Shanghai, Ch<strong>in</strong>a 2000 1414 M+FschoolchildrenBetween cities(n = 22)1 km frommonitor<strong>in</strong>gstationsRepeatedsurveysSubjectperceivedISAACPrevalence, A-rns,pollution,<strong>and</strong> CO,NO x , PM 10 ,SO 2 , <strong>and</strong> O 3Time trendsNational CO concentrations:high vs. low<strong>and</strong> mediumvs. lowBetween<strong>in</strong>dividuals<strong>and</strong> proximityto trafficPrevalence <strong>and</strong><strong>in</strong> CO, NO x , trends, W-rnsO 3 , <strong>and</strong> <strong>and</strong> A-rns,PM 10 ISAACProximity totraffic:< 20 m, 20–150 m, <strong>and</strong>residentialaway fromroads withheavy trafficPrevalence,A-r <strong>and</strong> W-r,ISAACPrevalence,W-r <strong>and</strong> A-r,ATSWith<strong>in</strong> city NO 2 <strong>and</strong> O 3 Prevalence,W-r <strong>and</strong> A-r,ECRHSCO, NO x , PM 10 , <strong>and</strong> SO 2 concentrationsassociated with subjectperceivedpollution. Subjectperceivedpollution associatedwith asthma.Adjustment for D, S, <strong>and</strong> SmNo significant correlation overtime between adjusted prevalence<strong>and</strong> pollutant levelsAdjustment for D, S, Sm, <strong>and</strong> OSignificant associationsAdjustment for D, S, I, <strong>and</strong> SmSignificant association withchronic wheez<strong>in</strong>g; no significantassociation with asthmaAdjustment for D, I, <strong>and</strong> SmSignificant associationsAdjustment for D, I, <strong>and</strong> SmTable cont<strong>in</strong>ues next pagea NR <strong>in</strong>dicates that <strong>the</strong> study year was not reported.b M+F <strong>in</strong>dicates that <strong>the</strong> data for males <strong>and</strong> females were comb<strong>in</strong>ed; M, F <strong>in</strong>dicates that <strong>the</strong> data for males <strong>and</strong> females were reported separately.c If several designs were used, <strong>the</strong> design associated with <strong>the</strong> reported adjusted effect estimates is listed.d Possible parameters were <strong>in</strong>cidence, prevalence, exacerbation, <strong>and</strong> trends. Possible outcomes were A-r (doctor-diagnosed or self-reported asthma with<strong>in</strong> <strong>the</strong> last 3 years), or A-rns (doctordiagnosedor self-reported asthma, whose time <strong>of</strong> diagnosis or self-report<strong>in</strong>g is unspecified or not recent), W-r (wheeze symptoms reported with<strong>in</strong> <strong>the</strong> last 3 years), or W-rns (wheeze symptomswhose time <strong>of</strong> report<strong>in</strong>g is unspecified or not recent). The questionnaire was <strong>the</strong> st<strong>and</strong>ardized questionnaire used to assess asthma <strong>and</strong> wheeze <strong>in</strong> <strong>the</strong> study, if any.e Summary f<strong>in</strong>d<strong>in</strong>gs listed <strong>in</strong>clude any positive statistically significant association (noted as “significant association”). Any significant negative association is specifically listed as such.Adjustments for confounders <strong>in</strong>cluded adjustments for demographic characteristics (D), socioeconomic characteristics (S), <strong>in</strong>door air pollution (I), smok<strong>in</strong>g status (Sm), <strong>and</strong> o<strong>the</strong>r variables (O).Comments are also listed, if pert<strong>in</strong>ent.152
HEI International Scientific Oversight CommitteeTable 19 (Cont<strong>in</strong>ued). Studies <strong>of</strong> Asthma <strong>and</strong> WheezeCitationStudyLocationStudy StudyYear aVariables orComparisonsSample b Designs c <strong>Pollution</strong>Parameters, Summary F<strong>in</strong>d<strong>in</strong>gsQuestionnaires d for Confounders eOutcomes, <strong>and</strong> <strong>and</strong> AdjustmentsNakai et al. 1999 Tokyo, Japan 1987–1990Nitta et al. 1993 Tokyo, Japan 1979,1982,<strong>and</strong>1983Ong et al. 1991 Hong Kong,Ch<strong>in</strong>aPeters J et al.1996Qian Z et al.2000Qian Z et al.2004Hong Kong,Ch<strong>in</strong>aLanzhou, Wuhan,<strong>and</strong> Guangzhou,Ch<strong>in</strong>aGuangzhou,Wuhan,Lanzhou, <strong>and</strong>Chongq<strong>in</strong>g,Ch<strong>in</strong>a1986 Adultwomen (30–59years)Adult women(40–59 years):1148 <strong>in</strong> 1979,1758 <strong>in</strong> 1982,<strong>and</strong> 1916 <strong>in</strong>19831989 3846 M, F, <strong>and</strong>M+F schoolchildren1989–19911985–19881993–19963521 M+F children2789 M+Fschoolchildren(5–14 years)7058 M+Fschoolchildren(5–16 years)Proximity totrafficProximity totrafficWith<strong>in</strong>cityWith<strong>in</strong>cityBetween<strong>and</strong> with<strong>in</strong>cities(n = 4)Betweencities(n = 4)Distancefrom roadDistancefrom road:< 20 m, 20–150 m, <strong>and</strong>residentialaway fromroads withheavy trafficHigh vs.lowTrends <strong>in</strong>low vs. highHigh vs. low(i.e., Lanzhouvs.Guangzhou)Prevalence,W-r, <strong>and</strong> ATSPrevalence,W-rPrevalence,W-rnsPrevalence <strong>and</strong>trends, W-r,WHO <strong>and</strong> BMRCPrevalence, W-r<strong>and</strong> A-rns, ATSHigh vs. low Prevalence, W-r<strong>and</strong> A-rns, ATSNo significant associationsAdjustment for D, I, <strong>and</strong> SmSignificant associationsAdjustment for D, S, I, <strong>and</strong> Sm,<strong>and</strong> OSignificant associationsAdjusted for D, by designReduction <strong>in</strong> difference betweenareas after low-sulfur fuelregulationAdjustment for D, by designNo significant associationAdjustment for D, S, I, <strong>and</strong> SmSignificant associationsAdjustment for D, S, I, <strong>and</strong> SmTable cont<strong>in</strong>ues next pagea NR <strong>in</strong>dicates that <strong>the</strong> study year was not reported.b M+F <strong>in</strong>dicates that <strong>the</strong> data for males <strong>and</strong> females were comb<strong>in</strong>ed; M, F <strong>in</strong>dicates that <strong>the</strong> data for males <strong>and</strong> females were reported separately.c If several designs were used, <strong>the</strong> design associated with <strong>the</strong> reported adjusted effect estimates is listed.d Possible parameters were <strong>in</strong>cidence, prevalence, exacerbation, <strong>and</strong> trends. Possible outcomes were A-r (doctor-diagnosed or self-reported asthma with<strong>in</strong> <strong>the</strong> last 3 years), or A-rns (doctordiagnosedor self-reported asthma, whose time <strong>of</strong> diagnosis or self-report<strong>in</strong>g is unspecified or not recent), W-r (wheeze symptoms reported with<strong>in</strong> <strong>the</strong> last 3 years), or W-rns (wheeze symptomswhose time <strong>of</strong> report<strong>in</strong>g is unspecified or not recent). The questionnaire was <strong>the</strong> st<strong>and</strong>ardized questionnaire used to assess asthma <strong>and</strong> wheeze <strong>in</strong> <strong>the</strong> study, if any.e Summary f<strong>in</strong>d<strong>in</strong>gs listed <strong>in</strong>clude any positive statistically significant association (noted as “significant association”). Any significant negative association is specifically listed as such.Adjustments for confounders <strong>in</strong>cluded adjustments for demographic characteristics (D), socioeconomic characteristics (S), <strong>in</strong>door air pollution (I), smok<strong>in</strong>g status (Sm), <strong>and</strong> o<strong>the</strong>r variables (O).Comments are also listed, if pert<strong>in</strong>ent.153
<strong>Outdoor</strong> <strong>Air</strong> <strong>Pollution</strong> <strong>and</strong> <strong>Health</strong> <strong>in</strong> <strong>the</strong> Develop<strong>in</strong>g <strong>Countries</strong> <strong>of</strong> <strong>Asia</strong>Table 19 (Cont<strong>in</strong>ued). Studies <strong>of</strong> Asthma <strong>and</strong> WheezeCitationStudyLocationStudy StudyYear aVariables orComparisonsSample b Designs c <strong>Pollution</strong>Parameters, Summary F<strong>in</strong>d<strong>in</strong>gsQuestionnaires d for Confounders eOutcomes, <strong>and</strong> <strong>and</strong> AdjustmentsSek<strong>in</strong>e et al.2004Shima <strong>and</strong> Adachi2000Tokyo, Japan 1987–19947 Communities<strong>in</strong> ChibaPrefecture,JapanShima et al. 2002 8 Communities<strong>in</strong> ChibaPrefecture,JapanShima et al. 2003 Chiba Prefecture,JapanTam et al. 1994 Hong Kong,Ch<strong>in</strong>a1991–19931989–19921991–19951989–19905682 Adultwomen842 M, F children(9–10years)3049 M, F, <strong>and</strong>M+F children(6–13 years)2506 M, Fschoolchildren(6–13 years)423 M+F childrenProximityto trafficBetweencities(n = 7)Betweencities(n = 8)Proximityto traffic,<strong>in</strong> 8 communitiesWith<strong>in</strong>cityTraffic density:high oraverage vs.medium vs.lowPrevalence,W-r<strong>and</strong> A-r, ATSNO 2 Incidence <strong>and</strong>prevalence, W-r<strong>and</strong> A-r, ATSNO 2 <strong>and</strong> PM 10 Incidence <strong>and</strong>prevalence,W-r <strong>and</strong> A-r,ATSProximity toroad:0–49 m vs. 50 m vs.ruralIncidence <strong>and</strong>prevalence,W-r <strong>and</strong> A-r,ATSHigh vs. low Prevalence,W-r, <strong>and</strong> A-rnsNo significant associationsAdjustment for D, S, I, Sm,<strong>and</strong> OSignificant associations with<strong>in</strong>cidence <strong>and</strong> prevalenceAdjustment for D, I, Sm, <strong>and</strong> ONo significant associations withprevalence, significant associationswith <strong>in</strong>cidenceAdjustment for D, I, Sm, <strong>and</strong> OSignificant association with liv<strong>in</strong>g< 50 m from roadAdjustment for D, I, Sm, <strong>and</strong> OSignificant association for W-r,nonsignificant association forA-rnsAdjustment for D, by designTable cont<strong>in</strong>ues next pagea NR <strong>in</strong>dicates that <strong>the</strong> study year was not reported.b M+F <strong>in</strong>dicates that <strong>the</strong> data for males <strong>and</strong> females were comb<strong>in</strong>ed; M, F <strong>in</strong>dicates that <strong>the</strong> data for males <strong>and</strong> females were reported separately.c If several designs were used, <strong>the</strong> design associated with <strong>the</strong> reported adjusted effect estimates is listed.d Possible parameters were <strong>in</strong>cidence, prevalence, exacerbation, <strong>and</strong> trends. Possible outcomes were A-r (doctor-diagnosed or self-reported asthma with<strong>in</strong> <strong>the</strong> last 3 years), or A-rns (doctordiagnosedor self-reported asthma, whose time <strong>of</strong> diagnosis or self-report<strong>in</strong>g is unspecified or not recent), W-r (wheeze symptoms reported with<strong>in</strong> <strong>the</strong> last 3 years), or W-rns (wheeze symptomswhose time <strong>of</strong> report<strong>in</strong>g is unspecified or not recent). The questionnaire was <strong>the</strong> st<strong>and</strong>ardized questionnaire used to assess asthma <strong>and</strong> wheeze <strong>in</strong> <strong>the</strong> study, if any.e Summary f<strong>in</strong>d<strong>in</strong>gs listed <strong>in</strong>clude any positive statistically significant association (noted as “significant association”). Any significant negative association is specifically listed as such.Adjustments for confounders <strong>in</strong>cluded adjustments for demographic characteristics (D), socioeconomic characteristics (S), <strong>in</strong>door air pollution (I), smok<strong>in</strong>g status (Sm), <strong>and</strong> o<strong>the</strong>r variables (O).Comments are also listed, if pert<strong>in</strong>ent.154
HEI International Scientific Oversight CommitteeTable 19 (Cont<strong>in</strong>ued). Studies <strong>of</strong> Asthma <strong>and</strong> WheezeCitationStudyLocationStudy StudyYear aVariables orComparisonsSample b Designs c <strong>Pollution</strong>Parameters, Summary F<strong>in</strong>d<strong>in</strong>gsQuestionnaires d for Confounders eOutcomes, <strong>and</strong> <strong>and</strong> AdjustmentsWang TN et al.1999Kaohsiung <strong>and</strong>P<strong>in</strong>tong,Taipei,Ch<strong>in</strong>a1995–1996165,173 M+Fhigh-schoolstudents (11–16 years)Betweencities (n = 3)or with<strong>in</strong>cities (n =24)Above or Prevalence, W-r,below ISAACmedian forTSP, PM 10 ,SO 2 , NO 2 ,CO, <strong>and</strong> O 3Significant associationsAdjustment for D, S, I, Sm,<strong>and</strong> OXu X <strong>and</strong> Wang L1993Yang CY et al. 1997 L<strong>in</strong>-yuan(exposed area)<strong>and</strong> Taihsi(control area),Taipei,Ch<strong>in</strong>aYang CY et al.1998Yang CY et al.2002cBeij<strong>in</strong>g, Ch<strong>in</strong>a 1982 1576 M+F adultnever-smokers(40–69 years)L<strong>in</strong>-yuan(exposed area)<strong>and</strong> Taihsi(control area),Taipei,Ch<strong>in</strong>aYang-M<strong>in</strong>g <strong>and</strong>Zhuang-J<strong>in</strong>g,Taipei,Ch<strong>in</strong>a1995 2036 M+F adultresidents <strong>of</strong>L<strong>in</strong>-yuan (30–64 years) <strong>and</strong>1976 controls1994–19951081 M+F primary-schoolchildren: 470<strong>in</strong> a pollutedarea <strong>and</strong> 611 <strong>in</strong>a control area1999 6190 M+F primary-schoolstudentsWith<strong>in</strong> city High vs.moderatevs. lowBetween<strong>in</strong>dustrial<strong>and</strong> non<strong>in</strong>dustrialareas (n = 2)Between an<strong>in</strong>dustrial<strong>and</strong> a ruralareaProximity totrafficIndustrial vs.non-<strong>in</strong>dustrialIndustrial vs.ruralHeavy vs.light trafficPrevalence, W-r No significant associationsAdjustment for D, S, I, Sm,<strong>and</strong> OPrevalence, W-r,ATS <strong>and</strong> WHOPrevalence,W-r, ATSPrevalence,W-r <strong>and</strong> A-r, ATS<strong>and</strong> WHONo significant associationAdjustment for D, S, I, Sm,<strong>and</strong> ONo significant associationAdjustment for D, S, I, Sm,<strong>and</strong> ONo significant associationAdjustment for D, S, I, Sm,<strong>and</strong> OTable cont<strong>in</strong>ues next pagea NR <strong>in</strong>dicates that <strong>the</strong> study year was not reported.b M+F <strong>in</strong>dicates that <strong>the</strong> data for males <strong>and</strong> females were comb<strong>in</strong>ed; M, F <strong>in</strong>dicates that <strong>the</strong> data for males <strong>and</strong> females were reported separately.c If which several designs were used, <strong>the</strong> design associated with <strong>the</strong> reported adjusted effect estimates is listed.d Possible parameters were <strong>in</strong>cidence, prevalence, exacerbation, <strong>and</strong> trends. Possible outcomes were A-r (doctor-diagnosed or self-reported asthma with<strong>in</strong> <strong>the</strong> last 3 years), or A-rns (doctordiagnosedor self-reported asthma, whose time <strong>of</strong> diagnosis or self-report<strong>in</strong>g is unspecified or not recent), W-r (wheeze symptoms reported with<strong>in</strong> <strong>the</strong> last 3 years), or W-rns (wheeze symptomswhose time <strong>of</strong> report<strong>in</strong>g is unspecified or not recent). The questionnaire was <strong>the</strong> st<strong>and</strong>ardized questionnaire used to assess asthma <strong>and</strong> wheeze <strong>in</strong> <strong>the</strong> study, if any.e Summary f<strong>in</strong>d<strong>in</strong>gs listed <strong>in</strong>clude any positive statistically significant association (noted as “significant association”). Any significant negative association is specifically listed as such.Adjustments for confounders <strong>in</strong>cluded adjustments for demographic characteristics (D), socioeconomic characteristics (S), <strong>in</strong>door air pollution (I), smok<strong>in</strong>g status (Sm), <strong>and</strong> o<strong>the</strong>r variables (O).Comments are also listed, if pert<strong>in</strong>ent.155
<strong>Outdoor</strong> <strong>Air</strong> <strong>Pollution</strong> <strong>and</strong> <strong>Health</strong> <strong>in</strong> <strong>the</strong> Develop<strong>in</strong>g <strong>Countries</strong> <strong>of</strong> <strong>Asia</strong>Table 19 (Cont<strong>in</strong>ued). Studies <strong>of</strong> Asthma <strong>and</strong> WheezeCitationStudyLocationStudy StudyYear aVariables orComparisonsSample b Designs c <strong>Pollution</strong>Parameters, Summary F<strong>in</strong>d<strong>in</strong>gsQuestionnaires d for Confounders eOutcomes, <strong>and</strong> <strong>and</strong> AdjustmentsYano et al. 1986 Kushira,Sakurajima, <strong>and</strong>Oura, JapanYu JH et al. 2005 Taichung <strong>and</strong>Chu-Shan,Taipei,Ch<strong>in</strong>aYu TS et al. 2001 Hong Kong,Ch<strong>in</strong>aZhang JF et al.2002Zhang J et al.1999Guangzhou,Wuhan,Lanzhou, <strong>and</strong>Chongq<strong>in</strong>g,Ch<strong>in</strong>aGuangzhou,Wuhan, <strong>and</strong>Lanzhou,Ch<strong>in</strong>a1980 2006 Adultwomen (30–59years)2001 14,201 M+Fschoolchildren1994–19951993–19961985–19881294 M+F children(8–12years)7557 M+F elementary-schoolstudentsBetweenareas(n = 3)Volcanicash–affectedareas vs.control areaWith<strong>in</strong> city Urban vs.ruralBetweencities(n = 2)With<strong>in</strong>city4108 M, F adults Betweencities (n = 4)<strong>and</strong> with<strong>in</strong>city (urbanvs. suburban)Prevalence,W-rPrevalence, W-r<strong>and</strong> A-r,ISAACHigh vs. low Prevalence, W-r<strong>and</strong> A-rns,ATSPM 2.5 , Prevalence, W-rPM 10–2.5 , <strong>and</strong> A-rns,PM 10 , ATSTSP, SO 2 ,<strong>and</strong> NO xUrban vs.suburbanwith<strong>in</strong>WuhanPrevalence, W-r<strong>and</strong> A-rns,ATSNo significant associationAdjustment for DSignificant associationAdjustment for D, by designSignificant associationsAdjustment for D, S, I, Sm,<strong>and</strong> ONo significant associationAdjustment for D, S, I, Sm,<strong>and</strong> OSignificant associationsAdjustment for D, S, I, Sm,<strong>and</strong> Oa NR <strong>in</strong>dicates that <strong>the</strong> study year was not reported.b M+F <strong>in</strong>dicates that <strong>the</strong> data for males <strong>and</strong> females were comb<strong>in</strong>ed; M, F <strong>in</strong>dicates that <strong>the</strong> data for males <strong>and</strong> females were reported separately.c If which several designs were used, <strong>the</strong> design associated with <strong>the</strong> reported adjusted effect estimates is listed.d Possible parameters were <strong>in</strong>cidence, prevalence, exacerbation, <strong>and</strong> trends. Possible outcomes were A-r (doctor-diagnosed or self-reported asthma with<strong>in</strong> <strong>the</strong> last 3 years), or A-rns (doctordiagnosedor self-reported asthma, whose time <strong>of</strong> diagnosis or self-report<strong>in</strong>g is unspecified or not recent), W-r (wheeze symptoms reported with<strong>in</strong> <strong>the</strong> last 3 years), or W-rns (wheeze symptomswhose time <strong>of</strong> report<strong>in</strong>g is unspecified or not recent). The questionnaire was <strong>the</strong> st<strong>and</strong>ardized questionnaire used to assess asthma <strong>and</strong> wheeze <strong>in</strong> <strong>the</strong> study, if any.e Summary f<strong>in</strong>d<strong>in</strong>gs listed <strong>in</strong>clude any positive statistically significant association (noted as “significant association”). Any significant negative association is specifically listed as such.Adjustments for confounders <strong>in</strong>cluded adjustments for demographic characteristics (D), socioeconomic characteristics (S), <strong>in</strong>door air pollution (I), smok<strong>in</strong>g status (Sm), <strong>and</strong> o<strong>the</strong>r variables (O).Comments are also listed, if pert<strong>in</strong>ent.156
HEI International Scientific Oversight Committeequestionnaire outcomes for purposes <strong>of</strong> our review, weclassified <strong>the</strong> reported outcome data <strong>in</strong>to “recent” (symptomsoccurr<strong>in</strong>g with<strong>in</strong> 3 years before <strong>the</strong> question wasasked, persistent symptoms, or symptoms whose degree <strong>of</strong>recency was implied <strong>in</strong> <strong>the</strong> question) <strong>and</strong> “degree <strong>of</strong>recency not specified” (conta<strong>in</strong><strong>in</strong>g responses to <strong>the</strong> “ haveyou ever had” questions). This classification yielded fouroutcome categories: recent wheez<strong>in</strong>g (W-r); recent asthma(A-r); wheez<strong>in</strong>g, degree <strong>of</strong> recency not specified (W-rns);<strong>and</strong> asthma, degree <strong>of</strong> recency not specified (A-rns). Somestudies reported grades <strong>of</strong> severity or exacerbation, but<strong>the</strong>se data were not <strong>in</strong>cluded <strong>in</strong> <strong>the</strong> meta-analysis.To dist<strong>in</strong>guish comparisons <strong>of</strong> populations exposed todist<strong>in</strong>ct airsheds from comparisons <strong>of</strong> study subjectswith<strong>in</strong> populations (such as <strong>in</strong>tra-city studies) with sharedregional <strong>and</strong> urban background exposures, we categorized f<strong>the</strong> comparisons <strong>in</strong>to two broad classes: between-city comparisons(with “cities” loosely def<strong>in</strong>ed as dist<strong>in</strong>ct urbancommunities with separate airsheds), reported <strong>in</strong> 25studies, <strong>and</strong> with<strong>in</strong>-city comparisons (describ<strong>in</strong>g those forlarge conurbations or o<strong>the</strong>r areas with unclear boundaries),reported <strong>in</strong> 17 studies.The with<strong>in</strong>-city studies <strong>in</strong>cluded five that <strong>in</strong>vestigated<strong>the</strong> associations between asthma <strong>and</strong> proximity to traffic.In addition, one study assessed exposure at <strong>the</strong> <strong>in</strong>dividuallevel, two studies focused on a po<strong>in</strong>t power-generationsource, <strong>and</strong> ano<strong>the</strong>r study <strong>in</strong>vestigated <strong>the</strong> effects <strong>of</strong> longtermexposure to volcanic air pollution. Three studies correlated<strong>the</strong> prevalence <strong>of</strong> asthma with air pollution overtime. Some studies without actual measures <strong>of</strong> communityexposure to air pollution made assumptions about <strong>the</strong>rank<strong>in</strong>g <strong>of</strong> exposure contrasts, such as <strong>in</strong> some urban–ruralor urban–suburban comparisons <strong>and</strong> comparisons <strong>of</strong> communitiesaccord<strong>in</strong>g to proximity to traffic. Several studiesdescribed measures <strong>of</strong> long-term exposure to pollutantssuch as PM 10 but used <strong>the</strong>se data to categorize populations<strong>in</strong>stead <strong>of</strong> us<strong>in</strong>g <strong>the</strong> pollution data quantitatively <strong>in</strong> <strong>the</strong>statistical analysis.Many studies, particularly <strong>the</strong> more recent ones, usedlogistic regression analysis to estimate ORs for <strong>the</strong> effect <strong>of</strong>air pollution on asthma symptoms, adjust<strong>in</strong>g for variousconfound<strong>in</strong>g factors. A total <strong>of</strong> 33 <strong>of</strong> <strong>the</strong> studies analyzedpollution as a qualitative variable; <strong>the</strong> rema<strong>in</strong>der analyzed<strong>the</strong> effects per <strong>in</strong>crement <strong>of</strong> pollution. Sometimes, <strong>the</strong>analysis dichotomized <strong>the</strong> annual exposure measurements(e.g., as be<strong>in</strong>g above or below <strong>the</strong> U.S. EPA NAAQS or <strong>the</strong>median <strong>of</strong> <strong>the</strong> measured concentrations). The absence <strong>of</strong>f Although many articles <strong>in</strong>cluded considerable <strong>in</strong>formation on outcomes<strong>and</strong> pollution exposures, we concentrated on <strong>the</strong> results presented toge<strong>the</strong>rwith <strong>the</strong> statistical associations to categorize <strong>the</strong> outcomes <strong>and</strong> exposurecomparisons.logistic regression analysis did not necessarily reduce <strong>the</strong>quality <strong>of</strong> <strong>the</strong> study. For example, one very large, multicenterstudy <strong>in</strong> Taipei,Ch<strong>in</strong>a, appropriately used multiplel<strong>in</strong>ear regression to analyze st<strong>and</strong>ardized prevalence estimates(Guo et al. 1999).Confound<strong>in</strong>g is a major potential problem <strong>in</strong> studies <strong>of</strong>long-term exposure, especially when <strong>the</strong> exposure isassessed for <strong>the</strong> pollutant mix ra<strong>the</strong>r than <strong>in</strong>dividual pollutants.The studies varied greatly <strong>in</strong> <strong>the</strong> extent <strong>of</strong> <strong>the</strong>ircontrol for confound<strong>in</strong>g. Some studies controlled only forage or sex, by design (e.g., by select<strong>in</strong>g <strong>the</strong> same schoolgrades <strong>in</strong> all study areas), whereas o<strong>the</strong>rs controlled notonly for demographic factors but also for socioeconomic<strong>in</strong>dicators, a range <strong>of</strong> <strong>in</strong>door environmental factors (e.g.,cook<strong>in</strong>g, <strong>in</strong>cense burn<strong>in</strong>g), smok<strong>in</strong>g (active <strong>and</strong> passive),<strong>and</strong> o<strong>the</strong>r factors (e.g., temperature).The majority <strong>of</strong> studies did not report a quantitativerelation between measured or modeled pollution concentrations<strong>and</strong> <strong>the</strong> health outcome, mak<strong>in</strong>g it difficult to estimatea summary effect <strong>in</strong> terms <strong>of</strong> a def<strong>in</strong>ed pollution<strong>in</strong>crement. Only a m<strong>in</strong>ority <strong>of</strong> studies estimated summaryeffects <strong>in</strong> terms <strong>of</strong> <strong>in</strong>crements <strong>in</strong> concentrations <strong>of</strong> measuredpollutants, <strong>and</strong> <strong>the</strong> designs, outcomes, pollutionexposure contrasts, <strong>and</strong> specific pollutants analyzed werequite heterogeneous, mak<strong>in</strong>g it impossible to assemble asufficiently large number (n > 4) <strong>of</strong> homogeneous studies fora credible quantitative meta-analysis. However, we constructedforest plots <strong>of</strong> estimated ORs for ei<strong>the</strong>r wheeze or adiagnosis <strong>of</strong> asthma from <strong>the</strong> 26 <strong>of</strong> 42 studies that reported<strong>the</strong>m (Figures 66, 67, <strong>and</strong> 68); <strong>the</strong> correspond<strong>in</strong>g data arealso listed <strong>in</strong> Appendix Tables B.1, B.2, <strong>and</strong> B.3. Quantitativeestimates were st<strong>and</strong>ardized to an <strong>in</strong>crease <strong>of</strong> 10 µg/m 3<strong>in</strong> pollutant concentration. For <strong>the</strong> studies whose data arenot shown <strong>in</strong> <strong>the</strong> figures, Table 19 briefly summarizeswhe<strong>the</strong>r or not significant associations were found.Qualitative Comparisons Among Geographic AreasFigure 66 shows ORs for qualitative comparisons betweenurban <strong>and</strong> rural communities or between or with<strong>in</strong> cities.There were five comparisons between urban <strong>and</strong> ruralcommunities, <strong>and</strong> although ORs were elevated <strong>in</strong> all <strong>the</strong>sestudies, most were estimated with poor precision <strong>and</strong> onlyone was statistically significant. There were 11 betweencitystudies <strong>in</strong> which ORs were based on a qualitative comparison,7 <strong>of</strong> which are plotted. The majority reported an<strong>in</strong>creased prevalence <strong>of</strong> asthma or wheeze <strong>in</strong> associationwith exposure to air pollution. This group <strong>of</strong> studies wasdom<strong>in</strong>ated by five studies <strong>in</strong> Taipei,Ch<strong>in</strong>a, which had useda variety <strong>of</strong> designs to study asthma symptoms <strong>in</strong> children.With <strong>the</strong> exception <strong>of</strong> one <strong>of</strong> <strong>the</strong> five studies, which compared<strong>in</strong>dustrial <strong>and</strong> non-<strong>in</strong>dustrial areas (f<strong>in</strong>d<strong>in</strong>g no significantassociation), <strong>the</strong>se studies used an arbitrary cut<strong>of</strong>f157
<strong>Outdoor</strong> <strong>Air</strong> <strong>Pollution</strong> <strong>and</strong> <strong>Health</strong> <strong>in</strong> <strong>the</strong> Develop<strong>in</strong>g <strong>Countries</strong> <strong>of</strong> <strong>Asia</strong>Figure 66. ORs (<strong>and</strong> 95% CIs) for asthma or wheeze from qualitative comparisons between areas with differ<strong>in</strong>g pollutant concentrations <strong>in</strong> studies <strong>of</strong>urban <strong>and</strong> rural locations, or between or with<strong>in</strong> cities. Y-axis labels give study <strong>in</strong>formation <strong>in</strong> <strong>the</strong> follow<strong>in</strong>g sequence: reference citation; location, outcome,pollutant levels or areas compared; <strong>and</strong> sex <strong>of</strong> subjects (female, male, or comb<strong>in</strong>ed). A log scale is used on <strong>the</strong> x axis to accommodate <strong>the</strong> range <strong>of</strong>estimates. Two studies reported “no significant association” with no odds ratio; data po<strong>in</strong>ts are shown here as triangles without a CIs. For study details,see Table 19. The four outcome categories are: recent wheez<strong>in</strong>g (W-r); recent asthma (A-r); wheez<strong>in</strong>g, degree <strong>of</strong> recency not specified (W-rns); <strong>and</strong> asthma,degree <strong>of</strong> recency not specified (A-rns), or a comb<strong>in</strong>ation <strong>of</strong> asthma <strong>and</strong> wheeze (A+W-r <strong>and</strong> A+W-rns).for pollutant concentrations (e.g., above or below <strong>the</strong> U.S.EPA NAAQS or <strong>the</strong> median <strong>of</strong> <strong>the</strong> measured concentrations)based on data from community monitors. In onestudy (Ho et al. 2007), a significant, positive association <strong>of</strong>disease with high concentrations <strong>of</strong> CO was observed, butPM 10 <strong>and</strong> O 3 appeared to have no significant effect. In <strong>the</strong>study <strong>of</strong> Kuo <strong>and</strong> colleagues (2002), <strong>the</strong>re was a significant,positive association with high NO 2 concentrations,but no significant association with PM 10 , O 3 , or SO 2 concentrations.L<strong>in</strong> MC <strong>and</strong> colleagues (2001b) found asthma<strong>and</strong> wheeze to be positively associated with high CO concentrations,<strong>and</strong> Wang TN et al. (1999) reported significantassociations with high NO 2 , O 3 , CO, <strong>and</strong> TSP but not PM 10or SO 2 . In a national study, Guo <strong>and</strong> colleagues (1999)reported a significant, positive association <strong>of</strong> wheeze <strong>and</strong>asthma with traffic-related sources, but not stationarysources or those related to fossil fuels (accord<strong>in</strong>g to pr<strong>in</strong>cipal-componentsanalysis), <strong>and</strong> significant associationswith NO x <strong>and</strong> CO but not PM 10 , O 3 , or SO 2 (data notshown). Though <strong>the</strong>re is a lack <strong>of</strong> consistency between<strong>the</strong>se studies <strong>of</strong> essentially <strong>the</strong> same populations <strong>and</strong>exposures, it appears that <strong>in</strong>dicators <strong>of</strong> traffic emissions,such as NO 2 <strong>and</strong> CO, are more consistently associatedwith <strong>the</strong> prevalence <strong>of</strong> asthma or wheeze than are o<strong>the</strong>rpollutants. None <strong>of</strong> <strong>the</strong> four studies that <strong>in</strong>vestigated PM 10found any significant associations with asthma symptoms.There were 10 studies <strong>of</strong> qualitative with<strong>in</strong>-city comparisons,conducted <strong>in</strong> Thail<strong>and</strong>, India, Japan, Ch<strong>in</strong>a,Taipei,Ch<strong>in</strong>a, <strong>and</strong> Hong Kong. The four for which ORs158
HEI International Scientific Oversight Committeecould be extracted are shown <strong>in</strong> Figure 67. Most reportedat least one significant positive association, but one study<strong>in</strong> Taipei,Ch<strong>in</strong>a <strong>and</strong> ano<strong>the</strong>r <strong>in</strong> Japan found no significantassociations, <strong>and</strong> many studies also reported associationthat could be expla<strong>in</strong>ed by <strong>the</strong> play <strong>of</strong> chance. One study(by Imai et al. 1980) analyzed a large number <strong>of</strong> areas, butmost comparisons <strong>in</strong>volved only two or three strata <strong>of</strong>analysis (e.g., urban vs. suburban or high vs. moderate vs.low pollutant level).The o<strong>the</strong>r ma<strong>in</strong> qualitative with<strong>in</strong>-city comparisonswere for proximity to traffic. There were eight suchstudies, <strong>of</strong> which four (all <strong>in</strong> Japan) found positive associations.The four for which ORs could be extracted areshown <strong>in</strong> Figure 67. Nakai <strong>and</strong> coworkers (1999) found noevidence <strong>of</strong> an association with road proximity. In <strong>the</strong>study by Nitta <strong>and</strong> colleagues (1993), <strong>the</strong> risk <strong>of</strong> asthmawas <strong>in</strong>creased by liv<strong>in</strong>g with<strong>in</strong> 20 m <strong>of</strong> traffic, versus 20–150 m from traffic, <strong>in</strong> 1979 but not 1982 or 1983. Sek<strong>in</strong>e<strong>and</strong> coworkers (2004) used a complicated comb<strong>in</strong>ation <strong>of</strong>traffic proximity, traffic <strong>in</strong>tensity, <strong>and</strong> NO 2 concentrationsto classify <strong>the</strong> population <strong>in</strong>to three categories <strong>of</strong> exposure;<strong>the</strong>y found <strong>in</strong>creased, though not statistically significant,associations <strong>of</strong> disease prevalence <strong>in</strong> <strong>the</strong> high- <strong>and</strong>medium-exposure categories as compared with <strong>the</strong> lowexposurecategory. The study by Shima <strong>and</strong> colleagues(2003) analyzed <strong>the</strong> risks <strong>of</strong> both asthma prevalence <strong>and</strong><strong>in</strong>cidence over 4 years between populations liv<strong>in</strong>g 0–49 mor 50 m from ma<strong>in</strong> roads <strong>and</strong> a population <strong>in</strong> a ruralFigure 67. ORs (<strong>and</strong> 95% CIs) for asthma or wheeze from qualitative comparisons between areas with differ<strong>in</strong>g pollutant levels or proximities to trafficwith<strong>in</strong> cities. Y-axis labels give study <strong>in</strong>formation <strong>in</strong> <strong>the</strong> follow<strong>in</strong>g sequence: reference citation; location; outcome; pollutant levels, areas, or distancesfrom traffic compared; year <strong>of</strong> residence (if applicable); <strong>and</strong> sex <strong>of</strong> subjects (female, male, or comb<strong>in</strong>ed). A log scale is used on <strong>the</strong> x axis to accommodate<strong>the</strong> range <strong>of</strong> estimates. For A-r outcomes <strong>in</strong> Shima et al. 2003, <strong>the</strong> ORs are estimates <strong>of</strong> <strong>the</strong> relative risk <strong>of</strong> new occurrences <strong>of</strong> asthma. For Langkulsen etal. 2006, high1 <strong>in</strong>dicates highly polluted general area; high2 <strong>in</strong>dicates highly polluted roadside area; high3 <strong>in</strong>dicates moderately polluted roadside area;low <strong>in</strong>dicates control area. For study details, see Table 19. The four outcome categories are: recent wheez<strong>in</strong>g (W-r); recent asthma (A-r); wheez<strong>in</strong>g, degree<strong>of</strong> recency not specified (W-rns); <strong>and</strong> asthma, degree <strong>of</strong> recency not specified (A-rns), or a comb<strong>in</strong>ation <strong>of</strong> asthma <strong>and</strong> wheeze (A+W-r <strong>and</strong> A+W-rns).159
<strong>Outdoor</strong> <strong>Air</strong> <strong>Pollution</strong> <strong>and</strong> <strong>Health</strong> <strong>in</strong> <strong>the</strong> Develop<strong>in</strong>g <strong>Countries</strong> <strong>of</strong> <strong>Asia</strong>area. There was a significant trend toward higher prevalenceamong girls, but not boys, liv<strong>in</strong>g 0–49 m from ma<strong>in</strong>roads versus <strong>in</strong> <strong>the</strong> rural area. Follow-up <strong>of</strong> <strong>the</strong> same populationsrevealed a significant <strong>in</strong>crease <strong>in</strong> <strong>the</strong> number <strong>of</strong>new cases <strong>of</strong> asthma, but not wheeze, among boys but nosignificant <strong>in</strong>crease <strong>in</strong> <strong>the</strong> <strong>in</strong>cidence <strong>of</strong> ei<strong>the</strong>r outcomeamong girls <strong>in</strong> populations liv<strong>in</strong>g 0–49 m from a ma<strong>in</strong> roadversus <strong>in</strong> rural areas. The study did not report on a comparison<strong>of</strong> children liv<strong>in</strong>g <strong>in</strong> a roadside area versus a nonroadsidearea.Quantitative Comparisons Based on AmbientMeasurements The results <strong>of</strong> quantitative comparisonsbased on ambient measurements are summarized <strong>in</strong>Figure 68; <strong>the</strong> estimates plotted <strong>in</strong> <strong>the</strong> figure are shown <strong>in</strong>Appendix Table B.3 Although <strong>the</strong> pattern is heterogeneous,<strong>the</strong> overall f<strong>in</strong>d<strong>in</strong>g is that <strong>the</strong>re is little evidence <strong>of</strong> an<strong>in</strong>creased prevalence <strong>of</strong> asthma <strong>in</strong> association with an<strong>in</strong>crease <strong>of</strong> 10 µg/m 3 <strong>in</strong> specific measured pollutants, apartfrom NO 2 <strong>in</strong> some studies. The lack <strong>of</strong> associations with PM,measured as PM 10 , is especially strik<strong>in</strong>g. The follow<strong>in</strong>g paragraphsgive greater detail about <strong>the</strong> <strong>in</strong>dividual studies.Shima <strong>and</strong> colleagues (2002) performed a study <strong>of</strong> elementaryschools <strong>in</strong> eight communities <strong>in</strong> Japan’s ChibaPrefecture, four <strong>of</strong> which were <strong>in</strong> rural areas. The prevalence<strong>of</strong> asthma was not significantly associated with<strong>in</strong>creases <strong>in</strong> PM 10 or NO 2 concentrations <strong>in</strong> boys or girlsstudied separately. Increased NO 2 concentrations wereassociated with an <strong>in</strong>crease by a factor <strong>of</strong> nearly 4 <strong>in</strong> <strong>the</strong><strong>in</strong>cidence <strong>of</strong> asthma among 6-year-old children followedFigure 68. ORs (<strong>and</strong> 95% CIs) for asthma or wheeze per 10 µg/m 3 change <strong>in</strong> pollutant concentration from quantitative comparisons. Y-axis labels givestudy <strong>in</strong>formation <strong>in</strong> <strong>the</strong> follow<strong>in</strong>g sequence: reference citation, location, outcome, pollutant, <strong>and</strong> sex <strong>of</strong> subjects (female, male, or comb<strong>in</strong>ed). A log scaleis used on <strong>the</strong> x axis, to accommodate <strong>the</strong> range <strong>of</strong> estimates. Two <strong>of</strong> <strong>the</strong> ORs for both females <strong>and</strong> males from <strong>the</strong> Shima et al. 2002 study were calculatedfrom <strong>in</strong>cidence data. The Mi et al. 2006 study was conducted with<strong>in</strong> a s<strong>in</strong>gle city. The ORs from <strong>the</strong> Shima <strong>and</strong> Adachi 2000 study are for 4th, 5th, <strong>and</strong> 6thgrades comb<strong>in</strong>ed. For study details, see Table 19. The four outcome categories are: recent wheez<strong>in</strong>g (W-r); recent asthma (A-r); wheez<strong>in</strong>g, degree <strong>of</strong>recency not specified (W-rns); <strong>and</strong> asthma, degree <strong>of</strong> recency not specified (A-rns), or a comb<strong>in</strong>ation <strong>of</strong> asthma <strong>and</strong> wheeze (A+W-r <strong>and</strong> A+W-rns).160
HEI International Scientific Oversight Committeeover 4 years (data not shown), though <strong>the</strong> estimate wasextremely imprecise, with CIs that <strong>in</strong>cluded <strong>in</strong>creases assmall as 10% <strong>and</strong> as large as 1000% (OR, 3.62; 95% CI,1.11–11.87). An <strong>in</strong>crease <strong>in</strong> PM 10 concentration was associatedwith an <strong>in</strong>crease, by a factor <strong>of</strong> almost 3, <strong>in</strong> asthma<strong>in</strong>cidence (OR, 2.84; 95% CI, 0.84–9.58), but this estimatetoo was highly imprecise (data not shown). The 2002 studywas an update <strong>of</strong> one by Shima <strong>and</strong> Adachi from 2000,which showed an association between outdoor concentrations<strong>of</strong> NO 2 <strong>and</strong> <strong>the</strong> <strong>in</strong>cidence <strong>of</strong> wheeze <strong>and</strong> asthma over3 years. In <strong>the</strong> 2002 update, no significant association wasfound between asthma <strong>in</strong>cidence <strong>and</strong> <strong>in</strong>door concentrations<strong>of</strong> NO 2 , nor were <strong>the</strong>re significant differences <strong>in</strong> <strong>the</strong>prevalence <strong>of</strong> asthma among urban, suburban, <strong>and</strong> ruraldistricts. Taken toge<strong>the</strong>r with <strong>the</strong> results <strong>of</strong> <strong>the</strong> study <strong>of</strong>distance from ma<strong>in</strong> roads (Shima et al. 2003) discussedabove, it seems that outdoor concentrations <strong>of</strong> NO 2 <strong>and</strong>pollutant concentrations reflect<strong>in</strong>g proximity to roadswere more related to <strong>in</strong>cidence than to prevalence. S<strong>in</strong>ceprevalence is a function <strong>of</strong> <strong>in</strong>cidence <strong>and</strong> duration, thissuggests that <strong>the</strong> duration <strong>of</strong> wheez<strong>in</strong>g illness may beshorter <strong>in</strong> areas near roads than <strong>in</strong> areas not near roads.Hwang BF <strong>and</strong> colleagues (2005a) carried out an <strong>in</strong>vestigationamong children <strong>in</strong> schools <strong>in</strong> 22 municipalitieswith<strong>in</strong> 1 km <strong>of</strong> monitor<strong>in</strong>g stations collect<strong>in</strong>g measurements<strong>of</strong> background pollution at regular <strong>in</strong>tervals. In comparisons<strong>of</strong> populations liv<strong>in</strong>g closer to traffic <strong>and</strong> thoseliv<strong>in</strong>g far<strong>the</strong>r away, adjusted ORs for doctor-diagnosedasthma showed significant associations between <strong>the</strong> prevalence<strong>of</strong> asthma <strong>and</strong> <strong>in</strong>creases <strong>in</strong> CO concentration (by 100ppb) (OR, 1.05; 95% CI, 1.02–1.07) <strong>and</strong> <strong>in</strong>creases <strong>in</strong> O 3 concentration(by 10 ppb) (OR, 1.14; 95% CI,1.00–1.29), nonsignificantassociations with NO x (OR, 1.01; 95% CI, 0.95–1.06), <strong>and</strong> no association with PM 10 or SO 2 . The positiveresults for CO <strong>and</strong> O 3 were robust <strong>in</strong> multi-pollutant models.The associations between asthma <strong>and</strong> air pollution were<strong>in</strong>vestigated among children from eight districts <strong>of</strong> four Ch<strong>in</strong>esecities (Zhang JF et al. 2002). The OR for develop<strong>in</strong>gasthma was <strong>in</strong>creased <strong>in</strong> relation to an <strong>in</strong>crease <strong>in</strong> <strong>the</strong> concentrations<strong>of</strong> PM 2.5 , PM 10–2.5 , PM 10 , TSP, <strong>and</strong> SO 2 , butnone <strong>of</strong> <strong>the</strong> associations were statistically significant. Theassociation with NO x was negative but also not significant.Mi <strong>and</strong> colleagues (2006) <strong>in</strong>vestigated <strong>the</strong> associationbetween asthma <strong>and</strong> <strong>in</strong>door <strong>and</strong> outdoor NO 2 <strong>and</strong> O 3 <strong>in</strong> 10naturally ventilated schools <strong>in</strong> Shanghai. Nei<strong>the</strong>r pollutantwas significantly associated with <strong>the</strong> prevalence <strong>of</strong> wheeze,but NO 2 concentration was significantly associated with <strong>the</strong>diagnosis <strong>of</strong> asthma (OR, 1.44; 95% CI, 1.06–1.95).We also identified four relevant studies that do not fiteasily <strong>in</strong>to <strong>the</strong> with<strong>in</strong>- <strong>and</strong> between-city categories (Table19). Two reported associations between trends <strong>in</strong> prevalence<strong>and</strong> trends <strong>in</strong> air pollution over time. First, <strong>the</strong> study byKagamimori <strong>and</strong> colleagues (1986) <strong>in</strong> Japan found correlations<strong>of</strong> asthma prevalence over time with NO 2 , but not SO 2 ,<strong>in</strong> a population exposed to stationary-source pollution fromfossil-fuel combustion. Second, for Taipei,Ch<strong>in</strong>a, Lee YL<strong>and</strong> colleagues (2005) reported nei<strong>the</strong>r significant associationsbetween trends <strong>in</strong> childhood asthma between 1995–1996 <strong>and</strong> 2001 nor trends <strong>in</strong> CO, NO x , O 3 , or PM 10 concentrationsover <strong>the</strong> same period. Because <strong>of</strong> <strong>the</strong> likelihood <strong>of</strong>o<strong>the</strong>r relevant trends over time, any causal <strong>in</strong>terpretation <strong>of</strong><strong>the</strong>se ecologic trends must be extremely cautious.A more powerful way <strong>of</strong> study<strong>in</strong>g <strong>the</strong> effects <strong>of</strong> air pollutionover time us<strong>in</strong>g ecologic data is to <strong>in</strong>vestigate situations<strong>in</strong> which <strong>the</strong>re is an important change <strong>in</strong> airpollution. Such an opportunity arose <strong>in</strong> Hong Kong when,<strong>in</strong> June 1990, <strong>the</strong>re was a restriction on <strong>the</strong> sulfur content<strong>of</strong> fuel put <strong>in</strong>to place over a s<strong>in</strong>gle weekend. This resulted<strong>in</strong> a marked <strong>and</strong> sudden drop <strong>in</strong> ambient concentrations <strong>of</strong>SO 2 . Peters J <strong>and</strong> colleagues (1996) found that differences<strong>in</strong> <strong>the</strong> prevalence <strong>of</strong> wheez<strong>in</strong>g symptoms between a polluteddistrict <strong>and</strong> a less-polluted district <strong>in</strong> Hong Kongwere attenuated between 1989 <strong>and</strong> 1991, consistent with areduction <strong>in</strong> <strong>the</strong> effects <strong>of</strong> air pollution.A last study is by Yano <strong>and</strong> colleagues (1986), who comparedchronic respiratory symptoms <strong>in</strong> populationsexposed to a range <strong>of</strong> concentrations <strong>of</strong> particles from a volcano.No significant associations with asthma were found.Discussion The studies <strong>of</strong> long-term exposure toambient air pollutants <strong>and</strong> asthma symptoms <strong>and</strong> diagnosesreviewed <strong>in</strong> this section vary considerably <strong>in</strong> design.Differences <strong>in</strong> exposure have been estimated at between<strong>and</strong>with<strong>in</strong>-city levels, with <strong>the</strong> with<strong>in</strong>-city comparisons<strong>in</strong>clud<strong>in</strong>g roadside exposures. The studies also varywidely <strong>in</strong> terms <strong>of</strong> statistical power, quality <strong>of</strong> exposureassessment, <strong>and</strong> degree <strong>of</strong> control <strong>of</strong> confound<strong>in</strong>g factors.At one end <strong>of</strong> <strong>the</strong> spectrum are studies <strong>of</strong> only two communities,with small sample sizes, no adjustment for confounders(apart from age <strong>and</strong> sex, by design, as <strong>in</strong> studies<strong>of</strong> schoolchildren <strong>in</strong> various grades), <strong>and</strong> a purely qualitativecomparison <strong>of</strong> exposures (e.g., urban vs. rural or urbanvs. suburban). At <strong>the</strong> o<strong>the</strong>r end are large multi-centerstudies <strong>of</strong> large samples with high-quality exposure assessment,extensive control <strong>of</strong> confound<strong>in</strong>g factors, <strong>and</strong> sophisticatedmulti-level statistical analysis. Some studiesconf<strong>in</strong>ed <strong>the</strong> outcome to physician diagnosis <strong>of</strong> asthmaonly, <strong>in</strong>creas<strong>in</strong>g <strong>the</strong> potential for diagnostic bias. All studiesrelied on questionnaire data to ascerta<strong>in</strong> outcomes, ra<strong>the</strong>rthan us<strong>in</strong>g more objective methods, such as measures <strong>of</strong>BHR, thus <strong>in</strong>creas<strong>in</strong>g <strong>the</strong> potential for report<strong>in</strong>g bias byrespondents. Overall, however, <strong>the</strong> design <strong>and</strong> conduct <strong>of</strong>161
<strong>Outdoor</strong> <strong>Air</strong> <strong>Pollution</strong> <strong>and</strong> <strong>Health</strong> <strong>in</strong> <strong>the</strong> Develop<strong>in</strong>g <strong>Countries</strong> <strong>of</strong> <strong>Asia</strong><strong>the</strong> studies are similar to those from Western countries,<strong>and</strong> some, such as <strong>the</strong> very large <strong>and</strong> well-conducted prevalencestudies from Taipei,Ch<strong>in</strong>a, <strong>the</strong> <strong>in</strong>cidence studyfrom Japan, <strong>and</strong> <strong>the</strong> evaluation <strong>of</strong> sulfur regulation <strong>in</strong> HongKong, make important, new contributions to <strong>the</strong> <strong>in</strong>ternationalliterature.Most <strong>of</strong> <strong>the</strong> reported estimates showed an elevated prevalence<strong>of</strong> asthma <strong>in</strong> association with air pollution exposure,<strong>and</strong> none showed a significantly reduced prevalence,which would have suggested uncontrolled sources <strong>of</strong> confound<strong>in</strong>gor o<strong>the</strong>r error. The estimated RR was generallyless than 1.5 for more-polluted locales versus less-pollutedlocales. The larger estimates were generally less precise, as<strong>in</strong>dicated by wider CIs. Conversely, <strong>the</strong> most precise estimates,those from Taipei,Ch<strong>in</strong>a, tended to be <strong>the</strong> lowest.This heterogeneity <strong>of</strong> results was seen <strong>in</strong> all <strong>of</strong> <strong>the</strong> subgroupscompared <strong>in</strong> urban–rural, between-city, with<strong>in</strong>city,<strong>and</strong> traffic-proximity studies. Unfortunately, methodologicdifferences make it impossible to comb<strong>in</strong>e studies<strong>in</strong> order to compute a more precise summary estimate.Publication bias could not be formally <strong>in</strong>vestigated, but<strong>the</strong> most extreme ORs tended to have <strong>the</strong> widest CIs, irrespective<strong>of</strong> direction <strong>of</strong> <strong>the</strong> effect. This observation is evidenceaga<strong>in</strong>st any non-negligible degree <strong>of</strong> publicationbias regard<strong>in</strong>g asthma. Most <strong>of</strong> <strong>the</strong> studies were equally, ifnot more, concerned with o<strong>the</strong>r respiratory symptoms,such as chronic cough, mak<strong>in</strong>g it less likely that negativef<strong>in</strong>d<strong>in</strong>gs for just one outcome, such as asthma, wouldaffect <strong>the</strong> decision to publish.The results <strong>of</strong> <strong>the</strong> <strong>Asia</strong>n studies <strong>of</strong> asthma are very similarto those obta<strong>in</strong>ed from research <strong>in</strong> Western countries.Western studies have tended not to f<strong>in</strong>d significant differencesbetween urban <strong>and</strong> rural areas, <strong>and</strong> <strong>the</strong> results <strong>of</strong>multi-city or multi-area comparisons <strong>of</strong> prevalence have, ifanyth<strong>in</strong>g, tended toward null results (Dockery et al. 1989,1996; Braun-Fahrl<strong>and</strong>er et al. 1997; Baldi et al. 1999; PetersJM et al. 1999; Zemp et al. 1999; Pattenden et al. 2006).Exclud<strong>in</strong>g studies <strong>of</strong> birth cohorts, <strong>the</strong>re are few Westernstudies <strong>of</strong> <strong>the</strong> <strong>in</strong>cidence <strong>of</strong> asthma to compare with <strong>Asia</strong>nstudy results. One <strong>of</strong> <strong>the</strong> few is <strong>the</strong> Californian Seventh-DayAdventist <strong>Health</strong> Study <strong>of</strong> Smog (AHSMOG), whichreported an association between O 3 <strong>and</strong> <strong>the</strong> <strong>in</strong>cidence <strong>of</strong>asthma <strong>in</strong> adult males (McDonnell et al. 1999). On <strong>the</strong> o<strong>the</strong>rh<strong>and</strong>, <strong>the</strong> Californian Children’s <strong>Health</strong> Study <strong>of</strong> 12 areasdid not f<strong>in</strong>d a significant association between asthma <strong>in</strong>cidence<strong>and</strong> community concentrations <strong>of</strong> acid particles, NO 2 ,O 3 , PM 10 , or PM 2.5 (McConnell et al. 2002).There is now a large body <strong>of</strong> evidence from Westernstudies associat<strong>in</strong>g proximity to traffic, especially heavydutydiesel vehicles, with <strong>in</strong>creased prevalence <strong>of</strong> respiratorysymptoms (He<strong>in</strong>rich <strong>and</strong> Wichmann 2004; Salam etal. 2008). The <strong>Asia</strong>n evidence is <strong>of</strong> great <strong>in</strong>terest. Resultsfrom Japan have not supported an association betweenroadside exposure <strong>and</strong> asthma prevalence, but <strong>the</strong>re is evidence<strong>of</strong> an association with asthma <strong>in</strong>cidence over a 4-year period <strong>in</strong> a cohort <strong>of</strong> first-grade students (Shima et al.2003). Such an association <strong>of</strong> <strong>in</strong>cidence, but not prevalence,with greater exposure to vehicle pollution has beenfound <strong>in</strong> Sou<strong>the</strong>rn California (Gauderman et al. 2005;McConnell et al. 2006). Overall, <strong>the</strong>re rema<strong>in</strong>s considerableuncerta<strong>in</strong>ty surround<strong>in</strong>g <strong>the</strong> effect <strong>of</strong> traffic proximityon asthma (Gauderman et al. 2005). We did not f<strong>in</strong>d anyreports <strong>of</strong> asthma <strong>in</strong> <strong>Asia</strong>n birth cohorts. A considerablenumber <strong>of</strong> birth-cohort studies are now under way, but <strong>the</strong>results reported so far have been <strong>in</strong>consistent (e.g. Gehr<strong>in</strong>get al. 2002; Pierse et al. 2006; Brauer et al. 2007; Oftedal etal. 2007; Morgenstern et al. 2008; Nordl<strong>in</strong>g et al. 2008).A range <strong>of</strong> <strong>in</strong>terpretations could be made regard<strong>in</strong>g <strong>the</strong>lack <strong>of</strong> consistency among associations observed <strong>in</strong> <strong>the</strong><strong>Asia</strong>n studies. On <strong>the</strong> positive side, it could be argued that<strong>the</strong> associations are <strong>in</strong> fact causal but that <strong>the</strong>ir heterogeneityreflects variations <strong>in</strong> toxicity, exposure contrasts, orexposure error, or o<strong>the</strong>r limitations <strong>of</strong> <strong>the</strong> methods used.On <strong>the</strong> negative side, it could be argued that <strong>the</strong> negativeassociations are true <strong>and</strong> that <strong>the</strong> positive associationsreflect <strong>the</strong> play <strong>of</strong> chance, report<strong>in</strong>g bias, or uncontrolledconfound<strong>in</strong>g at <strong>the</strong> group or <strong>in</strong>dividual level. Taken as awhole, we conclude that <strong>the</strong>re is some evidence for amodest effect <strong>of</strong> air pollution on asthma prevalence, butwe still know little about <strong>the</strong> reasons for this effect or <strong>the</strong>observed heterogeneity among <strong>the</strong> f<strong>in</strong>d<strong>in</strong>gs. Our impressionis that if <strong>the</strong>re are any differences between <strong>Asia</strong>n <strong>and</strong>Western studies, it is that <strong>Asia</strong>n studies tend to f<strong>in</strong>d morepositive results. Asthma prevalence ranges widely amongchildren <strong>in</strong> <strong>Asia</strong> (Asher et al. 2006), but this variation seemsunlikely, on <strong>the</strong> basis <strong>of</strong> <strong>the</strong> current evidence, to beexpla<strong>in</strong>ed by <strong>the</strong> correspond<strong>in</strong>g range <strong>of</strong> ambient air pollutionconcentrations (Anderson et al. 2010). The variability <strong>in</strong><strong>the</strong> results <strong>of</strong> <strong>the</strong> asthma studies reviewed <strong>in</strong> this sectionshould not be taken to imply that air pollution is not harmfulto <strong>the</strong> respiratory system <strong>in</strong> ways o<strong>the</strong>r than caus<strong>in</strong>g asthma;<strong>the</strong>re is conv<strong>in</strong>c<strong>in</strong>g evidence that air pollution is associatedwith respiratory symptoms such as chronic cough <strong>and</strong>impairment <strong>of</strong> lung function (WHO 2005b).LUNG CANCERStudiesFive studies <strong>of</strong> lung cancer met <strong>the</strong> criteria for <strong>in</strong>clusion(Table 20). Three <strong>of</strong> <strong>the</strong> five studies were <strong>in</strong> East <strong>Asia</strong> (Ch<strong>in</strong>a<strong>and</strong> Taipei,Ch<strong>in</strong>a), one <strong>in</strong> Thail<strong>and</strong>, <strong>and</strong> one <strong>in</strong> India. Allwere case–control studies, which provide estimates <strong>of</strong> <strong>the</strong>162
HEI International Scientific Oversight CommitteeTable 20. Case–Control Studies <strong>of</strong> Lung CancerCitationStudyLocationStudyYearsGupta D et al.2001aCh<strong>and</strong>igarh, India 1995–1997Ko YC et al. 1997 Kaohsiung,Taipei,Ch<strong>in</strong>a1992–1993Pisani et al. 2006 LampangProv<strong>in</strong>ce,Thail<strong>and</strong>1993–1995Xu ZY et al. 1989 Shenyang, Ch<strong>in</strong>a 1985–1987Yang CY et al.1999Taipei,Ch<strong>in</strong>a1990–1994StudySample Pollutants <strong>Health</strong> Outcome Results265 Case subjects<strong>and</strong> 525 controlsmatched bysex <strong>and</strong> age117 Women withlung cancer <strong>and</strong> 117matched controls,<strong>in</strong>clud<strong>in</strong>g 106nonsmokers211 Case subjects<strong>and</strong> 202 controls(set 1) <strong>and</strong> 211controls (set 2)1349 Patients <strong>and</strong>1345 controls399 Womenwith lung cancer<strong>and</strong> 399 controlsmatched for sex,year <strong>of</strong> birth, <strong>and</strong>year <strong>of</strong> deathUrban air pollution,<strong>in</strong>door pollution,tobacco smok<strong>in</strong>g, <strong>and</strong>occupational exposureIndustrial air pollution<strong>and</strong> cook<strong>in</strong>g fumesIncidence RR for women with lifetimeresidence <strong>in</strong> urban area vs. ruralarea, 0.29 (95% CI, 0.07–1.17).Incidence RR for nonsmoker women withresidence 21 years with<strong>in</strong> 3 km <strong>of</strong><strong>in</strong>dustrial area vs. those withresidence for < 21 years, 2.7 (95%CI, 0.9–8.9).Power-plant emissions Incidence RR for high vs. low SO 2 /NO 2 <strong>in</strong>dex,1.2 (95% CI, 0.7–2.0); RR for highvs. low PM 10 <strong>in</strong>dex, 1.1 (95% CI,0.7–1.8).Industrial air pollution Incidence RRs for residence for > 20 yearswith<strong>in</strong> 200 m <strong>of</strong> <strong>in</strong>dustrial area vs.those with residence for 20 years:men, 2.7 (95% CI, 1.1–6.5); women,3.2 (95% CI, 1.0–10.5).Petrochemical airpollutionMortality RR for high vs. low petrochemical airpollution <strong>in</strong>dex, 1.66 (95% CI, 1.05–2.61); RR for high vs. low nonpetrochemicalair pollution <strong>in</strong>dex,1.24 (95% CI, 0.79–1.95); RR forurban vs. rural, 0.92 (95% CI, 0.56–1.49).163
<strong>Outdoor</strong> <strong>Air</strong> <strong>Pollution</strong> <strong>and</strong> <strong>Health</strong> <strong>in</strong> <strong>the</strong> Develop<strong>in</strong>g <strong>Countries</strong> <strong>of</strong> <strong>Asia</strong>RR <strong>of</strong> lung cancer <strong>in</strong>cidence or mortality associated wi<strong>the</strong>xposure to air pollution. Most <strong>of</strong> <strong>the</strong> studies were small:<strong>the</strong> largest, by Xu ZY <strong>and</strong> colleagues (1989), <strong>in</strong>cluded 1249cases <strong>of</strong> lung cancer, <strong>the</strong> next largest, 399 (Yang CY et al.1999), <strong>and</strong> <strong>the</strong> three o<strong>the</strong>rs, 265 or fewer. Four studiescharacterized air pollution exposure <strong>of</strong> cases <strong>and</strong> controls<strong>in</strong> terms <strong>of</strong> residential proximity to one or more stationarysources us<strong>in</strong>g various approaches, <strong>and</strong> <strong>the</strong> Indian study(Gupta D et al. 2001a) compared residents <strong>in</strong> urban <strong>and</strong>rural locations. None reported estimated RRs for exposureto measured ambient concentrations <strong>of</strong> specific pollutants,though one study (Pisani et al. 2006) reported estimatedRRs accord<strong>in</strong>g to an exposure <strong>in</strong>dex based on emissions <strong>of</strong>SO 2 <strong>and</strong> NO 2 from a power plant. Four studies <strong>in</strong>cludedsmokers, <strong>and</strong>, <strong>of</strong> <strong>the</strong>se, three reported results adjusted tocontrol for <strong>the</strong> effects <strong>of</strong> tobacco smok<strong>in</strong>g.Estimates from <strong>the</strong> five studies are plotted <strong>in</strong> Figure 69.The largest study, by Xu ZY <strong>and</strong> colleagues (1989), askedsubjects to classify <strong>the</strong>ir outdoor residential environmentaccord<strong>in</strong>g to its level <strong>of</strong> “smok<strong>in</strong>ess”: not smoky, somewhator slightly smoky, or smoky. They reported estimated RRs<strong>of</strong> 1.5 <strong>and</strong> 2.3 among men (for <strong>the</strong> comparison betweenslightly smoky <strong>and</strong> not smoky <strong>and</strong> between smoky <strong>and</strong> notsmoky, respectively). These estimates were adjusted foreffects <strong>of</strong> age, education level, smok<strong>in</strong>g status, <strong>and</strong> <strong>in</strong>doorair pollution concentration. They estimated that <strong>the</strong> risk <strong>of</strong>lung cancer among men <strong>and</strong> women resid<strong>in</strong>g < 1 km froma smelter was approximately 3 times that among subjects >3 km from it. There was no evidence <strong>of</strong> a smoothly<strong>in</strong>creas<strong>in</strong>g gradient <strong>of</strong> air pollution with decreas<strong>in</strong>g distancefrom <strong>the</strong> smelter among women <strong>in</strong> analyses thatadjusted for age, educational level, smok<strong>in</strong>g status, <strong>in</strong>doorair pollution concentrations, <strong>and</strong> employment at <strong>the</strong>smelter. However, duration <strong>of</strong> residence with<strong>in</strong> 200 m <strong>of</strong><strong>in</strong>dustrial factories for more than 20 years was associatedwith 70% <strong>and</strong> 60% <strong>in</strong>creases <strong>in</strong> <strong>the</strong> risk <strong>of</strong> lung canceramong men <strong>and</strong> women, respectively.Yang CY <strong>and</strong> colleagues (1999) studied 399 housewives<strong>in</strong> Taipei,Ch<strong>in</strong>a, with lung cancer <strong>and</strong> 399 controls matchedfor age <strong>and</strong> year <strong>of</strong> birth (<strong>and</strong> death) <strong>in</strong> municipalities thatFigure 69. RRs (<strong>and</strong> 95% CIs) for lung cancer from quantitative comparisons. Y-axis labels give study <strong>in</strong>formation <strong>in</strong> <strong>the</strong> follow<strong>in</strong>g sequence: referencecitation, sex <strong>of</strong> subjects (if applicable), smok<strong>in</strong>g status (if applicable), <strong>and</strong> comparison <strong>of</strong> <strong>in</strong>terest, <strong>in</strong>clud<strong>in</strong>g air pollution (AP) <strong>in</strong>dex levels. For <strong>the</strong> Xu ZYet al. 1989 study, > 20 years’ residence < 200 m from an <strong>in</strong>dustrial area was compared with 20 years’ residence. For <strong>the</strong> Ko YC et al. 1997 study, 21years’ residence < 3 km from an <strong>in</strong>dustrial area was compared with < 21 years’ residence. For study details, see Table 20.164
HEI International Scientific Oversight Committeediffered with regard to <strong>the</strong> proportion <strong>of</strong> residentsemployed <strong>in</strong> <strong>the</strong> petrochemical <strong>in</strong>dustry <strong>and</strong> <strong>the</strong> level <strong>of</strong>urbanization. No <strong>in</strong>formation was available on tobaccosmok<strong>in</strong>g. Rates <strong>of</strong> lung cancer were elevated among residents<strong>in</strong> municipalities with <strong>the</strong> highest proportion <strong>of</strong> residentsemployed <strong>in</strong> <strong>the</strong> petrochemical <strong>in</strong>dustry but notamong residents <strong>in</strong> <strong>the</strong> most urbanized municipalities.The one study we identified that was restricted to nonsmokers(106 cases <strong>of</strong> lung cancer <strong>in</strong> women), <strong>and</strong> thuswas less prone to confound<strong>in</strong>g by tobacco smok<strong>in</strong>g,reported no significant <strong>in</strong>crease <strong>in</strong> lung cancer risk amongwomen who had lived near an <strong>in</strong>dustrial district for up to20 years (Ko YC et al. 1997). However, <strong>the</strong> authors didreport an estimated RR <strong>of</strong> 2.7 (95% CI, 0.9 to 7.8) amongthose with more than 21 years’ residence, after statisticaladjustment for age, exposure to <strong>in</strong>door air pollution fromcook<strong>in</strong>g, <strong>and</strong> socioeconomic status.Pisani <strong>and</strong> colleagues (2006) conducted a small, hospital-basedcase–control study <strong>of</strong> 211 lung cancer cases, <strong>in</strong>which <strong>the</strong>y attempted to quantify cumulative exposure toSO 2 <strong>and</strong> NO 2 as well as PM, us<strong>in</strong>g models based on emissionsfrom power plants. They reported small <strong>in</strong>creases <strong>in</strong><strong>the</strong> risk <strong>of</strong> lung cancer that did not vary monotonicallywith <strong>the</strong> estimated level <strong>of</strong> cumulative exposure to ei<strong>the</strong>rSO 2 <strong>and</strong> NO 2 or PM, <strong>in</strong> analyses that adjusted for sex, age,<strong>and</strong> tobacco-smok<strong>in</strong>g status but not exposure to <strong>in</strong>door airpollution (Figure 69). However, <strong>the</strong> controls <strong>in</strong>cluded <strong>in</strong>dividualshospitalized for causes related to air pollutionexposure, such as cardiovascular disease, fur<strong>the</strong>r complicat<strong>in</strong>g<strong>the</strong> <strong>in</strong>terpretation <strong>of</strong> <strong>the</strong> reported results.The only Indian study (Gupta D et al. 2001a) found nosignificant association between <strong>the</strong> <strong>in</strong>cidence <strong>of</strong> lungcancer among men <strong>and</strong> lifetime residence <strong>in</strong> areas classifiedby <strong>the</strong> <strong>in</strong>vestigators as ei<strong>the</strong>r mixed urban <strong>and</strong> rural or> 75% urban, as compared with areas that were > 75%rural (Figure 69). They also reported a statistically impreciseprotective effect <strong>of</strong> lifetime urban residence amongwomen, though exposure to <strong>in</strong>door air pollution fromburn<strong>in</strong>g <strong>of</strong> solid fuels, which is associated with a risk <strong>of</strong>lung cancer among women, was apparently not adjustedfor <strong>in</strong> <strong>the</strong> analysis.DiscussionGiven <strong>the</strong> small number <strong>of</strong> studies <strong>of</strong> lung cancer <strong>in</strong> ourreview, <strong>and</strong> <strong>the</strong> even smaller number with control formajor potential confounders, <strong>the</strong> evidence regard<strong>in</strong>g airpollution <strong>and</strong> lung cancer is quite limited. The two studiesthat have addressed potential confound<strong>in</strong>g by strong riskfactors such as tobacco smok<strong>in</strong>g <strong>and</strong> <strong>in</strong>door air pollutionfrom <strong>the</strong> burn<strong>in</strong>g <strong>of</strong> solid fuels suggest that exposure tooutdoor air pollution is associated with an <strong>in</strong>creased risk<strong>of</strong> lung cancer, with estimated RRs <strong>in</strong> <strong>the</strong> range <strong>of</strong> 1.5 to3.0. This is generally consistent with results reported <strong>in</strong>studies from Europe <strong>and</strong> North America (V<strong>in</strong>eis et al. 2004;Samet <strong>and</strong> Cohen 2006), but we identified no <strong>Asia</strong>nstudies that quantify excess risk <strong>in</strong> relation to measuredconcentrations <strong>of</strong> air pollution <strong>and</strong> also address <strong>the</strong> majorpotential confounders, tobacco smok<strong>in</strong>g <strong>and</strong> <strong>in</strong>door combustion<strong>of</strong> solid fuels. The current studies do not allow forconfident assessment <strong>of</strong> <strong>the</strong> relative effects <strong>of</strong> <strong>in</strong>dividualpollutants <strong>and</strong> are largely focused on air pollution fromlarge stationary sources. To date, <strong>the</strong>re have been nostudies <strong>in</strong> <strong>Asia</strong> like those conducted <strong>in</strong> Europe that specificallyaddress <strong>the</strong> effects <strong>of</strong> mobile-source air pollution(Nyberg et al. 2000; Nafstad et al. 2003). Fur<strong>the</strong>r research isalso needed to quantify <strong>the</strong> relative effects <strong>of</strong> outdoor <strong>and</strong><strong>in</strong>door air pollution on lung cancer <strong>in</strong> various <strong>Asia</strong>nlocales <strong>and</strong> to characterize <strong>the</strong> relative impact <strong>of</strong> <strong>the</strong>se twotypes <strong>of</strong> air pollution over time.ADVERSE PREGNANCY OUTCOMESStudies <strong>in</strong> our review reported effects <strong>of</strong> air pollutionexposure on ei<strong>the</strong>r low birth weight or preterm delivery orboth. The majority <strong>of</strong> studies were conducted <strong>in</strong>Taipei,Ch<strong>in</strong>a (10), with a few studies also conducted <strong>in</strong>Ch<strong>in</strong>a (3) <strong>and</strong> South Korea (3). Of <strong>the</strong> five studies thatfocused on ambient air concentrations <strong>in</strong> general, all butone addressed exposure <strong>in</strong> <strong>the</strong> first <strong>and</strong> third trimesters.Studies that reported pollutant-specific risk estimatesfocused ma<strong>in</strong>ly on PM <strong>and</strong> SO 2 , though a h<strong>and</strong>ful <strong>of</strong>studies also explored associations with NO 2 <strong>and</strong> CO.Because most studies used data obta<strong>in</strong>ed from adm<strong>in</strong>istrativebirth records, control for potential confounders <strong>and</strong>assessment <strong>of</strong> effect modification was generally limited torout<strong>in</strong>ely collected <strong>in</strong>formation. For example, to avoideffect modification by birth order or multiple births, nearlyall studies focused on first, s<strong>in</strong>gleton, live births. Maternalcharacteristics, <strong>in</strong>clud<strong>in</strong>g maternal age, education level,marital status, <strong>and</strong> occupation were <strong>of</strong>ten addressed. Moststudies also adjusted for <strong>in</strong>fant sex, season, <strong>and</strong> birthplace.None <strong>of</strong> <strong>the</strong> studies addressed parental smok<strong>in</strong>g, however.Preterm DeliveryTen studies focused on preterm delivery, consistentlydef<strong>in</strong>ed as less than 37 weeks <strong>of</strong> gestation, with gestationalage, where clearly specified, based on last date <strong>of</strong> menstruation.Seven <strong>of</strong> <strong>the</strong> studies were conducted <strong>in</strong> Taipei,Ch<strong>in</strong>a,two <strong>in</strong> Ch<strong>in</strong>a, <strong>and</strong> one <strong>in</strong> South Korea (Table 21<strong>and</strong> Figure 70).All but two studies focused on specific sources <strong>of</strong> exposure,with exposures def<strong>in</strong>ed accord<strong>in</strong>g to proximity to165
<strong>Outdoor</strong> <strong>Air</strong> <strong>Pollution</strong> <strong>and</strong> <strong>Health</strong> <strong>in</strong> <strong>the</strong> Develop<strong>in</strong>g <strong>Countries</strong> <strong>of</strong> <strong>Asia</strong>Table 21. Studies <strong>of</strong> Preterm DeliveryCitationStudyLocationStudyYearsChen Z et al.1995Guangzhou,Ch<strong>in</strong>a1985–1992Leem et al.2006Incheon,SouthKorea2001–2002L<strong>in</strong> MC et al.2001aKaohsiung,Taipei,Ch<strong>in</strong>a1993–1996Tsai SS et al.2003cTaipei,Ch<strong>in</strong>a1994–1997Tsai SS et al.2004Taipei,Ch<strong>in</strong>a1993–1996StudySample7695 Newborns:325with adverseoutcomes <strong>and</strong>390 controls52,113 S<strong>in</strong>gletonbirths498,755 First,s<strong>in</strong>gleton,live births14,545 Births<strong>in</strong> <strong>in</strong>dustrialareas <strong>and</strong>49,670 births<strong>in</strong> o<strong>the</strong>r areas(controls)23,072 First,s<strong>in</strong>gleton,birthsPrimarySource <strong>of</strong>ExposurePetrochemical<strong>in</strong>dustryAmbient airpollutionPetrochemical<strong>in</strong>dustryIndustrialareasThermalpowerplantsExposureClassification PollutantsExposureW<strong>in</strong>dowsEstimatedRelative Risk(95% CI) AdjustmentsProximity topetrochemicalplant: < 2 km vs. 5 kmPetrochemicalairpollutionFull term 2.13(0.60–7.64)Occupation <strong>and</strong>ethnicity,possibly o<strong>the</strong>rsExposure quartilesbased onneighborhoodlevelair pollutionResidence<strong>in</strong> petroleumref<strong>in</strong>ery areaResidencewith<strong>in</strong> 2 km<strong>of</strong> <strong>in</strong>dustrialsourceProximity to<strong>the</strong>rmal powerplant: 0–3 kmvs. 3–4 kmCO, PM 10 ,NO 2 , <strong>and</strong><strong>and</strong> 3rdtrimesters(only 1stshown here)SO 21st, 2nd,PetrochemicalairpollutionIndustrialair pollutionIndustrialair pollutionFor CO, PM 10 ,NO 2 , <strong>and</strong> SO 2 ,respectively:1.26 (1.11–1.44),1.27 (1.04–1.56),1.24 (1.09–1.42),<strong>and</strong>1.21 (1.01–1.46)Full term 1.41(1.08–1.82)Full term 1.11(1.02–1.21)Full term 1.14(1.01–1.30)Maternal age,parity, sex,season,parentaleducationMaternal age,season, maritalstatus, maternaleducation,<strong>in</strong>fant sexMaternal age,season, maritalstatus, maternaleducation,<strong>in</strong>fant sex, birthplaceMaternal age,season, maritalstatus, maternaleducation,<strong>in</strong>fant sex, birthplaceTable cont<strong>in</strong>ues next page166
HEI International Scientific Oversight CommitteeTable 21 (Cont<strong>in</strong>ued). Studies <strong>of</strong> Preterm DeliveryCitationStudyLocationStudyYearsStudySamplePrimarySource <strong>of</strong>ExposureExposureClassification PollutantsXu X et al.1995aBeij<strong>in</strong>g,Ch<strong>in</strong>a1988 25,370 Births Ambient airpollution(with coalstoveuse <strong>in</strong>93% <strong>of</strong> studyhouseholds)Cont<strong>in</strong>uousexposureSO 2 <strong>and</strong>TSPYang CY et al.2002bKaohsiung,Taipei,Ch<strong>in</strong>a1993–199657,127 S<strong>in</strong>gletonbirthsPetrochemical<strong>in</strong>dustryResidence <strong>in</strong>petrochemicalareaPetrochemicalairpollutionYang CY et al.2002aTaipei,Ch<strong>in</strong>a1993–199639,750 S<strong>in</strong>gletonbirthsPetrochemical<strong>in</strong>dustryResidence <strong>in</strong>petrochemical<strong>in</strong>dustrial areaPetrochemicalairpollutionYang CY et al.2003aSanm<strong>in</strong>gDistrict,Taipei,Ch<strong>in</strong>a1992–19976251 First,s<strong>in</strong>gleton,live birthsFreeway Residencewith<strong>in</strong> 500 m<strong>of</strong> freeway vs.500–1500 mTrafficemissionsYang CY et al.2004a51 Boroughsaround 3ref<strong>in</strong>eries<strong>in</strong> Taipei,Ch<strong>in</strong>a1994–199757,483 First,s<strong>in</strong>gleton,live birthsPetroleumref<strong>in</strong>eriesResidencewith<strong>in</strong> 3 km<strong>of</strong> petroleumref<strong>in</strong>eryPetrochemicalairpollutionExposureW<strong>in</strong>dowsEstimatedRelative Risk(95% CI) AdjustmentsFull term For SO 2 , 1.21(1.01–1.46); forTSP, 1.10(1.01–1.20)Full term 1.18(1.04–1.34)Full term 1.03(0.94–1.13)Full term 1.30(1.03–1.65)Full term 1.14(1.01–1.28)<strong>Outdoor</strong> temperature<strong>and</strong>humidity, day <strong>of</strong>week, season,maternal age,<strong>in</strong>fant sex, residentialareaMaternal age,season, maritalstatus, maternaleducation,<strong>in</strong>fant sexMaternal age,marital status,maternal education,<strong>in</strong>fant sexMaternal age,season, maritalstatus, maternaleducation,<strong>in</strong>fant sexMaternal age,season, maritalstatus, maternaleducation,<strong>in</strong>fant sex167
<strong>Outdoor</strong> <strong>Air</strong> <strong>Pollution</strong> <strong>and</strong> <strong>Health</strong> <strong>in</strong> <strong>the</strong> Develop<strong>in</strong>g <strong>Countries</strong> <strong>of</strong> <strong>Asia</strong>Figure 70. RRs (<strong>and</strong> 95% CIs) for preterm delivery from qualitative sources <strong>of</strong> exposure, accord<strong>in</strong>g to study citation. Y-axis labels <strong>in</strong> bold type specify <strong>the</strong>source <strong>of</strong> exposure. For study details, see Table 21.petrochemical <strong>in</strong>dustries, <strong>the</strong>rmal power plants, <strong>in</strong>dustrialsources, or freeways. With a few exceptions, <strong>the</strong> studiescompared differences <strong>in</strong> exposure between different areas <strong>of</strong>residence. As a result, <strong>the</strong> studies estimated risks associatedwith exposure over <strong>the</strong> full term <strong>of</strong> pregnancy, ra<strong>the</strong>r thanwith<strong>in</strong> specific trimesters. The studies consistently demonstratedan <strong>in</strong>creased risk <strong>of</strong> preterm delivery <strong>in</strong> associationwith liv<strong>in</strong>g <strong>in</strong> close proximity to pollution sources.Two studies focused on measures <strong>of</strong> ambient air pollution.One (Leem et al. 2006) assessed trimester-specific risks<strong>of</strong> preterm delivery associated with neighborhood levels <strong>of</strong>air pollution. In analyses compar<strong>in</strong>g residents <strong>in</strong> neighborhoodswith <strong>the</strong> highest <strong>and</strong> lowest quartiles <strong>of</strong> exposure, <strong>the</strong>authors found an <strong>in</strong>crease <strong>in</strong> risk by 26%, 27%, 24%, <strong>and</strong>21% to be associated with <strong>in</strong>creased exposure to CO, PM 10 ,NO 2 , <strong>and</strong> SO 2 , respectively, dur<strong>in</strong>g <strong>the</strong> first trimester.Trends toward <strong>in</strong>creased risk with <strong>in</strong>creased exposure wereobserved for CO, NO 2 , <strong>and</strong> SO 2 dur<strong>in</strong>g <strong>the</strong> second trimester.The estimated risks <strong>of</strong> preterm delivery <strong>in</strong> relation to<strong>in</strong>creased exposure dur<strong>in</strong>g <strong>the</strong> third trimester were somewhatlower, with only those related to <strong>in</strong>creased CO <strong>and</strong>NO 2 concentrations rema<strong>in</strong><strong>in</strong>g statistically significant.The second study that <strong>in</strong>cluded quantitative ambient measures<strong>of</strong> pollution was conducted <strong>in</strong> Beij<strong>in</strong>g at a time whenover 93% <strong>of</strong> households were us<strong>in</strong>g coal stoves (Xu X et al.1995c). Thus, measured ambient pollutant concentrationswere extremely high; mean <strong>and</strong> maximum SO 2 concentrationsdur<strong>in</strong>g <strong>the</strong> study period were 102 µg/m 3 <strong>and</strong>630 µg/m 3 , respectively, <strong>and</strong> mean <strong>and</strong> maximum TSPconcentrations were 10 µg/m 3 <strong>and</strong> 630 µg/m 3 . The studyassessed <strong>the</strong> effects <strong>of</strong> exposures from <strong>the</strong> time dur<strong>in</strong>g <strong>the</strong>first trimester when women were enrolled through <strong>the</strong>time <strong>of</strong> delivery. Interquartile <strong>in</strong>creases <strong>in</strong> SO 2 <strong>and</strong> TSPconcentrations were associated with 21% <strong>and</strong> 10% <strong>in</strong>creases<strong>in</strong> <strong>the</strong> risk <strong>of</strong> preterm delivery, respectively.Low Birth WeightEight studies explored <strong>the</strong> relation between air pollutionexposure <strong>and</strong> low birth weight, def<strong>in</strong>ed as a weight< 2500 g (Table 22). Like studies <strong>of</strong> preterm delivery, <strong>the</strong>sestudies focused primarily on specific sources <strong>of</strong> exposure,ma<strong>in</strong>ly proximity to petrochemical <strong>in</strong>dustries <strong>and</strong> householdcoal use. Unlike <strong>the</strong> studies <strong>of</strong> preterm delivery, however,six <strong>of</strong> <strong>the</strong>se eight studies <strong>in</strong>cluded quantitativemeasures <strong>of</strong> ambient pollution associated with <strong>the</strong>sesources. Four studies explored associations with PM (measuredas ei<strong>the</strong>r TSP or PM 10 ) <strong>and</strong> SO 2 (Wang X et al. 1997;Ha et al. 2001; Lee BE et al. 2003a; L<strong>in</strong> CM et al. 2004b),two <strong>of</strong> which also assessed associations with CO (Ha et al.2001; Lee BE et al. 2003a).The studies that assessed exposures dur<strong>in</strong>g <strong>the</strong> first trimesterfound small but consistent associations between168
HEI International Scientific Oversight CommitteeTable 22. Studies <strong>of</strong> Low Birth WeightCitationStudyLocationStudyYearsStudySampleChen Z et al.1995Ha et al.2001Guangzhou,Ch<strong>in</strong>aSeoul,SouthKorea1985–19921996–19977695 Newborns:325 withadverseoutcomes<strong>and</strong> 390controls276,763BirthsLee BE et al.2003aSeoul,SouthKorea1996–1998388,105S<strong>in</strong>gletonbirthsPrimarySource <strong>of</strong>ExposurePetrochemical<strong>in</strong>dustryAmbient airpollutionAmbient airpollutionExposureClassification PollutantsExposureW<strong>in</strong>dowsEstimatedRelative Risk(95% CI) AdjustmentsProximity topetrochemicalplant:< 2 km vs. 5 kmPetrochemicalairpollution(pollutant notspecified)Full term 3.10 (1.00–9.54) Occupation <strong>and</strong>ethnicity,possibly o<strong>the</strong>rsInterquartile<strong>in</strong>crease <strong>in</strong>pollutantconcentrationInterquartile<strong>in</strong>crease <strong>in</strong>pollutantconcentrationCO, SO 2 , <strong>and</strong>TSP1st <strong>and</strong> 3rdtrimestersCO, SO 2 , <strong>and</strong> 1st <strong>and</strong> 3rdPM 10 trimestersCO: 1st trimester,1.08 (1.04–1.12);3rd trimester,0.91 (0.87–0.96)SO 2 : 1st trimester,1.06 (1.02–1.10);3rd trimester,0.93 (0.88–0.98)TSP: 1st trimester,1.04 (1.00–1.08);3rd trimester,0.95 (0.90–0.99)CO: 1st trimester,1.04 (1.01–1.07);3rd trimester,0.96 (0.93–0.99)SO 2 : 1st trimester,1.02 (0.99–1.06);3rd trimester,0.96 (0.91–1.00)PM 10 : 1st trimester,1.03 (1.00–1.07);3rd trimester,1.00 (0.95–1.04)UnclearTime trend, gestationalage,<strong>in</strong>fant sex, birthorder, maternalage, parentaleducationTable cont<strong>in</strong>ues next page169
<strong>Outdoor</strong> <strong>Air</strong> <strong>Pollution</strong> <strong>and</strong> <strong>Health</strong> <strong>in</strong> <strong>the</strong> Develop<strong>in</strong>g <strong>Countries</strong> <strong>of</strong> <strong>Asia</strong>Table 22 (Cont<strong>in</strong>ued). Studies <strong>of</strong> Low Birth WeightCitationStudyLocationStudyYearsStudySamplePrimarySource <strong>of</strong>ExposureL<strong>in</strong> MC et al.2001bL<strong>in</strong>-yuan(exposedarea) <strong>and</strong>Taihsi(controlarea),Taipei,Ch<strong>in</strong>a1993–19962545 Births Petrochemical<strong>in</strong>dustryL<strong>in</strong> CM et al.2004bKaohsiung,<strong>and</strong>Taipei,Ch<strong>in</strong>a1995–199792,288 Fullterm,s<strong>in</strong>gleton,livebirthsPetrochemical<strong>in</strong>dustryL<strong>in</strong> CM et al.2004aWang Xet al. 1997Kaohsiung,<strong>and</strong>Taipei,Ch<strong>in</strong>aBeij<strong>in</strong>g,Ch<strong>in</strong>a1995–19971988–199192,288 Residentsliv<strong>in</strong>gwith<strong>in</strong> 3 km<strong>of</strong> an airqualitymonitor<strong>in</strong>gstation74,671 First,live birthsPetrochemical<strong>in</strong>dustryHouseholdcoal useYang CYet al. 2002aTaipei,Ch<strong>in</strong>a1993–199639,750S<strong>in</strong>gletonbirthsPetrochemical<strong>in</strong>dustryExposureClassification PollutantsExposureW<strong>in</strong>dowsEstimatedRelative Risk(95% CI) AdjustmentsExposed vs.controlPetrochemicalair pollution(pollutant notspecified)Full term 1.77 (1.00–3.12) Maternal age<strong>and</strong> education,season, maritalstatus, <strong>in</strong>fantsexLow vs. high SO 2 <strong>and</strong> PM 10 3rd Trimester<strong>and</strong>full termExposed vs.controlIndustrial airpollution(pollutant notspecified)SO 2 : 3rd trimester,1.20 (1.01–1.41);full term,1.26 (1.04–1.53)PM 10 : 3rd trimester,0.97 (0.81–1.17);full term,0.87 (0.71–1.05)Gestational age,<strong>in</strong>fant sex, birthorder, season <strong>of</strong>birth, maternalage; for PM 10 ,additionaladjustments formaternal education<strong>and</strong> foro<strong>the</strong>r pollutantsFull term 1.13 (1.03–1.24) Gestational age,<strong>in</strong>fant sex, birthorder, season <strong>of</strong>birth, maternalage <strong>and</strong> education100-µg/m 3IncreaseExposed vs.controlSO 2 <strong>and</strong> TSP 3rd TrimesterPetrochemicalair pollution(pollutant notspecified)SO 2 :1.11 (1.06–1.16)TSP:1.01 (1.01–1.01)Gestational age,residential area,maternal age,year <strong>of</strong> birth,<strong>in</strong>fant sexFull term 1.07 (0.95–1.22) Maternal age<strong>and</strong> education,marital status,<strong>in</strong>fant sex170
HEI International Scientific Oversight CommitteeFigure 71. RRs (<strong>and</strong> 95% CIs) for low birth weight from PM 10 or TSP exposure, accord<strong>in</strong>g to study citation <strong>and</strong> period <strong>of</strong> exposure. Y-axis labels <strong>in</strong> boldtype specify <strong>the</strong> type <strong>of</strong> PM. For study details, see Table 22.Figure 72. RRs (<strong>and</strong> 95% CIs) for low birth weight from SO 2 exposure, accord<strong>in</strong>g to study citation <strong>and</strong> period <strong>of</strong> exposure. For study details, see Table 22.low birth weight <strong>and</strong> PM exposure (Ha et al. 2001; Lee BEet al. 2003a) (Figure 71). Increased exposure to PM <strong>in</strong> <strong>the</strong>first trimester was associated with a 3%–4% <strong>in</strong>creased risk<strong>of</strong> low birth weight, with estimated decl<strong>in</strong>es <strong>in</strong> birthweight <strong>of</strong> 5.2 g (95% CI, 1.9–8.5) for every 10-µg/m 3<strong>in</strong>crease <strong>in</strong> PM 10 (Yang CY et al. 2003a) <strong>and</strong> <strong>of</strong> 6.06 g (95%CI, 3.85–8.27) for every <strong>in</strong>terquartile change <strong>in</strong> TSP (Ha etal. 2001). However, full-term or third-trimester exposuresto PM had smaller associations, or no significant association,with low birth weight (Wang X et al. 1997; Ha et al.2001; Lee BE et al. 2003a; L<strong>in</strong> CM et al. 2004b).The evidence for SO 2 <strong>and</strong> CO was similar to that for PM(Figures 72 <strong>and</strong> 73, respectively). Associations with lowbirth weight <strong>of</strong> magnitude similar to those seen with PMwere observed for first-trimester exposures, with lessereffects observed for third-trimester or full-term exposures.171
<strong>Outdoor</strong> <strong>Air</strong> <strong>Pollution</strong> <strong>and</strong> <strong>Health</strong> <strong>in</strong> <strong>the</strong> Develop<strong>in</strong>g <strong>Countries</strong> <strong>of</strong> <strong>Asia</strong>Figure 73. RRs (<strong>and</strong> 95% CIs) for low birth weight from CO exposure, accord<strong>in</strong>g to study citation <strong>and</strong> period <strong>of</strong> exposure. For study details, see Table 22.Figure 74. RRs (<strong>and</strong> 95% CIs) for low birth weight from qualitative sources <strong>of</strong> exposure, accord<strong>in</strong>g to study citation. Y-axis labels <strong>in</strong> bold type specify<strong>the</strong> source <strong>of</strong> exposure. For study details, see Table 22.Each 10-µg/m 3 change <strong>in</strong> SO 2 dur<strong>in</strong>g <strong>the</strong> first trimesterwas associated with a 5.2 g (95% CI, 0.9–26.3) decrease <strong>in</strong>birth weight (Yang CY et al. 2003a); each <strong>in</strong>terquartilechange <strong>in</strong> SO 2 was associated with an 8.06 g (95% CI,5.59–10.53) decrease <strong>in</strong> birth weight (Ha et al. 2001).The four studies with qualitative measures <strong>of</strong> pollution(Chen Z et al. 1995; L<strong>in</strong> MC et al. 2001a; Yang CY et al.2002a; L<strong>in</strong> CM et al. 2004a) all focused on proximity to <strong>the</strong>petrochemical <strong>in</strong>dustry (Figure 74). The study conducted<strong>in</strong> Guangzhou, Ch<strong>in</strong>a (Chen Z et al. 1995) found anextremely high risk <strong>of</strong> low birth weight (RR, 3.10; 95% CI,1.00–9.54) among women liv<strong>in</strong>g < 2 km from a petrochemicalplant as compared with women liv<strong>in</strong>g 5 m away.The o<strong>the</strong>r three studies, conducted <strong>in</strong> Taipei,Ch<strong>in</strong>a, suggestedlower risks, with women liv<strong>in</strong>g <strong>in</strong> a petrochemical–<strong>in</strong>dustrial municipality hav<strong>in</strong>g an elevated risk <strong>of</strong> lowbirth weight, around 1.07 to 1.77 times <strong>the</strong> risk amongthose liv<strong>in</strong>g <strong>in</strong> cleaner municipalities.172
HEI International Scientific Oversight CommitteeDiscussionConsistent with <strong>the</strong> larger global literature on air pollution<strong>and</strong> adverse pregnancy outcomes, <strong>the</strong> <strong>Asia</strong>n literaturesuggests relatively small risks associated with exposure toair pollution, with exposure early <strong>in</strong> pregnancy appear<strong>in</strong>gto be most strongly associated with an <strong>in</strong>creased risk <strong>of</strong>low birth weight <strong>and</strong> preterm delivery (Gl<strong>in</strong>ianaia et al.2004b; Ritz <strong>and</strong> Wilhelm 2008). Although <strong>the</strong> evidencesuggests that early pregnancy is <strong>the</strong> critical w<strong>in</strong>dow dur<strong>in</strong>gwhich air pollutants can affect fetal growth, a better underst<strong>and</strong><strong>in</strong>g<strong>of</strong> <strong>the</strong> biological mechanisms <strong>of</strong> such an effect isneeded before causality can be assessed (Ritz <strong>and</strong> Wilhelm2008).Similar to studies conducted elsewhere, <strong>the</strong> <strong>Asia</strong>nstudies took advantage <strong>of</strong> exist<strong>in</strong>g data from birth records;this reliance on rout<strong>in</strong>ely collected data provides for alarger sample size but also limits <strong>the</strong> ability to fullyaddress potential effect modifiers, especially those thathave not been documented on <strong>the</strong> birth records (Slama etal. 2008). For example, because none <strong>of</strong> <strong>the</strong> <strong>Asia</strong>n studiesaddressed parental smok<strong>in</strong>g, potential confound<strong>in</strong>g bysmok<strong>in</strong>g rema<strong>in</strong>s an issue (Šrám et al. 2005). The use <strong>of</strong>rout<strong>in</strong>ely collected data also <strong>in</strong>creases <strong>the</strong> potential forexposure misclassification (Slama et al. 2008).Most <strong>of</strong> <strong>the</strong> selected <strong>Asia</strong>n studies focused on specificsources <strong>of</strong> exposure, usually <strong>in</strong>dustrial sources. Eventhough some studies did <strong>in</strong>clude quantitative measures <strong>of</strong>pollutants, <strong>the</strong> paucity <strong>of</strong> studies <strong>of</strong> ambient air pollutionexposures limits <strong>the</strong> ability to compare this body <strong>of</strong> evidencewith <strong>the</strong> larger literature.SUMMARY AND CONCLUSIONSWe assessed <strong>the</strong> evidence that long-term exposure toambient air pollution has adverse effects on chronic respiratorydisease, lung cancer, or adverse reproductive outcomes<strong>in</strong> <strong>Asia</strong>. A rigorous search was conducted toascerta<strong>in</strong> all important peer-reviewed articles publishedwith<strong>in</strong> <strong>the</strong> relevant time frame. The literature is diverse,<strong>and</strong> <strong>the</strong> studies vary widely <strong>in</strong> quality <strong>of</strong> design, presentation,<strong>and</strong> analysis. For this reason, no summary effect estimateswere calculated. However, wherever possible, wecalculated effect estimates for st<strong>and</strong>ardized <strong>in</strong>crements <strong>in</strong>measured pollutants. This approach provided additionalopportunities for quantitative summarization <strong>and</strong> comparison<strong>of</strong> results. Despite <strong>the</strong>se challenges <strong>and</strong> constra<strong>in</strong>ts,some limited conclusions can be drawn. Overall, <strong>the</strong> availablestudies provide evidence that long-term exposure toambient air pollution <strong>in</strong> <strong>Asia</strong> is associated with chronicrespiratory illness, reduced lung function, lung cancer,<strong>and</strong> adverse reproductive outcomes. This evidence isbroadly consistent with <strong>the</strong> evidence from o<strong>the</strong>r regions.Although publication bias cannot be completely ruled out,several studies reported no significant association wi<strong>the</strong>xposure, <strong>and</strong> it seems unlikely that <strong>the</strong> f<strong>in</strong>d<strong>in</strong>g acrossregions would be as generally consistent if <strong>the</strong> results hadbeen significantly <strong>in</strong>fluenced by publication bias.We found no cohort studies that reported mortality estimatesfor <strong>Asia</strong>n populations exposed over <strong>the</strong> long term tohigh concentrations <strong>of</strong> air pollution. The lack <strong>of</strong> studies <strong>of</strong>cardiovascular morbidity <strong>and</strong> mortality from IHD <strong>and</strong>stroke is particularly noteworthy, given <strong>the</strong> burden <strong>of</strong> diseaseattributable to <strong>the</strong>se conditions, as discussed <strong>in</strong> SectionII. Development, <strong>Air</strong> <strong>Pollution</strong> Exposure, <strong>and</strong>Population <strong>Health</strong>. However, <strong>the</strong> current evidence from<strong>Asia</strong> suggests that <strong>the</strong>se effects are likely. Both COPD <strong>and</strong>reduced pulmonary function are associated with <strong>in</strong>creasedmortality <strong>and</strong> reduced life expectancy, both <strong>in</strong> smokers<strong>and</strong> <strong>in</strong> nonsmokers (S<strong>in</strong> <strong>and</strong> Man 2005; S<strong>in</strong> et al. 2005).There is also evidence from cross-sectional studies conducted<strong>in</strong> Ch<strong>in</strong>a <strong>of</strong> mortality from chronic disease associatedwith long-term exposure to PM (characterized as TSP)<strong>and</strong> o<strong>the</strong>r combustion-source pollutants (Lave <strong>and</strong> Sesk<strong>in</strong>1977). (These studies were similar <strong>in</strong> design to some <strong>of</strong> <strong>the</strong>early U.S. studies that first identified effects air pollutionexposure.)In <strong>the</strong> 1990s, <strong>the</strong> WHO, UNEP, <strong>and</strong> Ch<strong>in</strong>ese collaboratorsconducted cross-sectional studies <strong>of</strong> mortality <strong>in</strong> twolarge Ch<strong>in</strong>ese cities that are very heavily polluted: Benxi(J<strong>in</strong> et al. 1999) <strong>and</strong> Shenyang (Xu Z et al. 2000), centers <strong>of</strong><strong>the</strong> iron <strong>and</strong> steel <strong>in</strong>dustries <strong>in</strong> <strong>the</strong> country. Annualaverage concentrations <strong>of</strong> TSP ranged from 290–620 µg/m 3among n<strong>in</strong>e areas <strong>of</strong> Benxi <strong>and</strong> 353–560 µg/m 3 among threeareas <strong>of</strong> <strong>in</strong> Shenyang; <strong>the</strong> correspond<strong>in</strong>g annual average SO 2concentrations were 160–240 µg/m 3 <strong>and</strong> 75–212 µg/m 3 .Effects <strong>of</strong> TSP <strong>and</strong> SO 2 on mortality from all natural causes<strong>and</strong> mortality from cardiovascular causes (coronary heartdisease [CHD] <strong>and</strong> cerebrovascular disease) <strong>and</strong> respiratorydiseases were estimated for 1993–1994 <strong>in</strong> Benxi <strong>and</strong> 1992 <strong>in</strong>Shenyang, on <strong>the</strong> basis <strong>of</strong> a l<strong>in</strong>ear regression <strong>of</strong> mortalityrates adjusted for current age on current average pollutionconcentrations among <strong>the</strong> study areas <strong>in</strong> <strong>the</strong> two cities. InBenxi, a 100-µg/m 3 <strong>in</strong>crease <strong>in</strong> TSP concentration was associatedwith estimated RRs for mortality from CHD, COPD,<strong>and</strong> cerebrovascular disease <strong>of</strong> 1.24 (95% CI, 1.08–1.41),1.24 (95% CI, 1.04–1.44), <strong>and</strong> 1.08 (95% CI, 1.00–1.15),respectively. In Shenyang, <strong>the</strong> air pollution measurementswere used to construct a three-level <strong>in</strong>dex <strong>of</strong> air pollution.The estimated RRs for mortality from CHD, cerebrovasculardisease, <strong>and</strong> COPD <strong>in</strong> association with <strong>the</strong> highest <strong>in</strong>dexlevel versus <strong>the</strong> lowest <strong>in</strong>dex level were 1.11 (P < 0.05),1.21 (P < 0.01), <strong>and</strong> 1.22 (P < 0.05), respectively. The authors173
<strong>Outdoor</strong> <strong>Air</strong> <strong>Pollution</strong> <strong>and</strong> <strong>Health</strong> <strong>in</strong> <strong>the</strong> Develop<strong>in</strong>g <strong>Countries</strong> <strong>of</strong> <strong>Asia</strong><strong>of</strong> <strong>the</strong> Shenyang study also attempted to estimate <strong>the</strong>effects <strong>of</strong> exposure on mortality from selected <strong>in</strong>fectiousdiseases. The rate <strong>of</strong> mortality from pneumonia <strong>in</strong> children< 10 years old was considerably lower among residents <strong>of</strong><strong>the</strong> least-polluted <strong>of</strong> <strong>the</strong> three areas (0.0 cases/100,000population) than among residents <strong>of</strong> <strong>the</strong> most-pollutedarea (4.2 cases/100,000 population). The estimated RR formortality from TB was <strong>in</strong>creased <strong>in</strong> <strong>the</strong> most-polluted area(1.91, P < 0.05). There was no control for smok<strong>in</strong>g or<strong>in</strong>door air pollution from solid fuel use, even at <strong>the</strong> level <strong>of</strong>area. This lack <strong>of</strong> controls for <strong>the</strong>se combustion productsadds considerable uncerta<strong>in</strong>ty to <strong>the</strong> reported results. Thepotential for major confound<strong>in</strong>g may have been limited,however, because estimated RRs were calculated amongresidents <strong>of</strong> each city, a procedure that might have resulted<strong>in</strong> a relatively homogenous distribution <strong>of</strong> smok<strong>in</strong>g <strong>and</strong>o<strong>the</strong>r potential confounders. In any case, <strong>the</strong> reportedresults for cardiovascular <strong>and</strong> respiratory disease seembroadly consistent with those from <strong>the</strong> current body <strong>of</strong>U.S. <strong>and</strong> European cohort studies, discussed earlier <strong>in</strong>Summary <strong>of</strong> Current Evidence on <strong>Health</strong> Effects <strong>of</strong> <strong>Air</strong> <strong>Pollution</strong>:Implications for <strong>Asia</strong> <strong>in</strong> Section III.174
Section VII. Summary <strong>and</strong> ConclusionsThis review has evaluated <strong>the</strong> evidence <strong>of</strong> health effects<strong>of</strong> outdoor air pollution <strong>in</strong> develop<strong>in</strong>g <strong>Asia</strong> <strong>in</strong> <strong>the</strong> context<strong>of</strong> ongo<strong>in</strong>g changes <strong>in</strong> both air quality <strong>and</strong> populationhealth. The nature <strong>of</strong> <strong>the</strong> health risks associated with <strong>the</strong>natural <strong>and</strong> built environments changes as economicdevelopment occurs. Economic development <strong>and</strong> its attendanturbanization have been, <strong>and</strong> cont<strong>in</strong>ue to be, based <strong>in</strong>large part on <strong>the</strong> <strong>in</strong>creased combustion <strong>of</strong> fossil fuels. Suchdevelopment has led, <strong>in</strong> some countries, to impressivereductions <strong>in</strong> poverty <strong>and</strong> <strong>in</strong>creased life expectancy butalso to a substantial <strong>and</strong> <strong>in</strong>creas<strong>in</strong>g burden <strong>of</strong> disease fromchronic noncommunicable diseases, such as IHD, cerebrovasculardisease, COPD, <strong>and</strong> cancer. This <strong>in</strong>creas<strong>in</strong>gburden is due to a variety <strong>of</strong> factors, most importantly tolarger numbers <strong>of</strong> people liv<strong>in</strong>g to older ages <strong>and</strong> to <strong>the</strong><strong>in</strong>creased prevalence <strong>of</strong> tobacco smok<strong>in</strong>g, <strong>in</strong>creas<strong>in</strong>g rates<strong>of</strong> obesity, <strong>and</strong> changes <strong>in</strong> dietary patterns. Economicdevelopment <strong>and</strong> poverty reduction have also led togradual decreases <strong>in</strong> environmental risks at <strong>the</strong> householdlevel, such as <strong>in</strong>door air pollution from <strong>the</strong> burn<strong>in</strong>g <strong>of</strong>dirty fuels <strong>and</strong> poor water quality, although <strong>the</strong> burden <strong>of</strong>disease associated with <strong>the</strong>se exposures <strong>in</strong> young children<strong>and</strong> women rema<strong>in</strong>s substantial.Despite improvements <strong>in</strong> air quality across <strong>the</strong> region,air pollution concentrations <strong>in</strong> <strong>Asia</strong>n cities <strong>of</strong>ten greatlyexceed current WHO health-based air quality guidel<strong>in</strong>es<strong>and</strong> many current national st<strong>and</strong>ards. In a large number <strong>of</strong>studies worldwide, air pollution has been found toadversely affect people with chronic cardiovascular <strong>and</strong>respiratory diseases, <strong>and</strong> it may also contribute to <strong>the</strong>development <strong>of</strong> those diseases <strong>in</strong> o<strong>the</strong>rwise healthypeople. Thus, even as air quality has improved <strong>in</strong> someways, <strong>the</strong>re rema<strong>in</strong>s an important impact on public health,which may grow as populations age <strong>and</strong> rates <strong>of</strong> chronicdisease <strong>and</strong> urbanization <strong>in</strong>crease.<strong>Air</strong> quality <strong>in</strong> <strong>Asia</strong> reflects complex <strong>and</strong> evolv<strong>in</strong>g relationsbetween <strong>in</strong>creased energy consumption for transportation<strong>and</strong> power generation <strong>and</strong> measures be<strong>in</strong>g taken toimprove air quality. From past experience <strong>in</strong> Western countries,it seems clear that substantial <strong>in</strong>creases <strong>in</strong> combustion<strong>of</strong> fossil fuels for power generation <strong>and</strong> transportation canimprove economic conditions <strong>in</strong> develop<strong>in</strong>g <strong>Asia</strong> <strong>and</strong> elsewhere,but can also, if not controlled, have important consequencesfor human health <strong>and</strong> environmental quality. It isalso clear that effective approaches to controll<strong>in</strong>g <strong>and</strong>reduc<strong>in</strong>g pollution exist. Investment <strong>in</strong> <strong>the</strong>se approachesneed not necessarily impede economic growth <strong>and</strong>, on <strong>the</strong>basis <strong>of</strong> documented experience <strong>in</strong> developed countries<strong>and</strong> emerg<strong>in</strong>g evidence <strong>in</strong> <strong>Asia</strong>, <strong>the</strong> develop<strong>in</strong>g countries<strong>of</strong> <strong>Asia</strong> may be able to avert <strong>in</strong>creased environmental degradation<strong>and</strong> associated health impacts while reduc<strong>in</strong>gpoverty <strong>and</strong> provid<strong>in</strong>g economic security for <strong>the</strong>ir populations(CAI-<strong>Asia</strong> Center 2008a; U.S. EPA 2008). Overall,estimates <strong>of</strong> pollution emissions as well as measured <strong>and</strong>estimated ambient concentrations <strong>in</strong>dicate that air qualityis improv<strong>in</strong>g throughout much <strong>of</strong> urban <strong>Asia</strong>. Trends <strong>in</strong> airquality have largely shown improvement dur<strong>in</strong>g periods <strong>of</strong>dramatically <strong>in</strong>creased energy use <strong>in</strong> <strong>Asia</strong>, a testament to<strong>the</strong> impact <strong>of</strong> effective air quality management as well asimproved energy efficiency <strong>and</strong> reduced <strong>in</strong>tensity <strong>of</strong>energy use. Climate change <strong>and</strong> emissions <strong>of</strong> GHGs presenta considerable challenge for <strong>Asia</strong> but also an opportunityfor cont<strong>in</strong>ued improvement <strong>in</strong> air quality. Strategies forreduc<strong>in</strong>g GHG emissions, though directed toward climatechange, may also have direct impacts on local <strong>and</strong> regionalair quality, result<strong>in</strong>g <strong>in</strong> faster <strong>and</strong> larger improvementsthan would o<strong>the</strong>rwise occur <strong>in</strong> <strong>the</strong> region.As a result <strong>of</strong> <strong>the</strong>se developments, <strong>the</strong> need for highqualityresearch on <strong>the</strong> health effects <strong>of</strong> air pollution <strong>in</strong><strong>Asia</strong> has never been greater, <strong>and</strong> <strong>the</strong> scientific communityis respond<strong>in</strong>g with an <strong>in</strong>creas<strong>in</strong>g number <strong>of</strong> studies <strong>of</strong> <strong>the</strong>effects <strong>of</strong> exposure to air pollution on morbidity <strong>and</strong> mortalitydue to cardiovascular or respiratory diseases,adverse reproductive outcomes, <strong>and</strong> o<strong>the</strong>r health outcomes.The over 400 studies identified <strong>and</strong> summarized <strong>in</strong><strong>the</strong> PAPA–SAN database provide substantial evidence <strong>of</strong>serious health effects <strong>of</strong> exposure to outdoor air pollution<strong>in</strong> <strong>the</strong> develop<strong>in</strong>g countries <strong>of</strong> <strong>Asia</strong>. The spectrum <strong>of</strong>adverse health effects associated with air pollution exposureranges from acute <strong>and</strong> chronic respiratory symptoms<strong>and</strong> changes <strong>in</strong> pulmonary function to <strong>in</strong>creased mortalityfrom cardiovascular or respiratory diseases or lung cancer— <strong>the</strong> same spectrum <strong>of</strong> adverse health outcomes associatedwith air pollution <strong>in</strong> <strong>the</strong> West.In particular, time-series studies <strong>of</strong> <strong>the</strong> effects <strong>of</strong> shorttermexposure on morbidity <strong>and</strong> mortality from cardiovascularor respiratory disease cont<strong>in</strong>ue to provide some <strong>of</strong> <strong>the</strong>most current <strong>and</strong> consistent evidence <strong>of</strong> serious adverse175
<strong>Outdoor</strong> <strong>Air</strong> <strong>Pollution</strong> <strong>and</strong> <strong>Health</strong> <strong>in</strong> <strong>the</strong> Develop<strong>in</strong>g <strong>Countries</strong> <strong>of</strong> <strong>Asia</strong>health effects <strong>in</strong> <strong>Asia</strong>. <strong>Asia</strong>n scientists have used this studydesign extensively <strong>in</strong> recent years, result<strong>in</strong>g <strong>in</strong> at least 115studies published as <strong>of</strong> 2007, an <strong>in</strong>crease by more than100% <strong>in</strong> <strong>the</strong> number published as <strong>of</strong> 2004 (HEI ISOC 2004).This literature now <strong>in</strong>cludes <strong>the</strong> results <strong>of</strong> a coord<strong>in</strong>atedmulti-center study (HEI <strong>Health</strong> <strong>and</strong> <strong>Air</strong> <strong>Pollution</strong> <strong>in</strong> <strong>Asia</strong>Program 2010), funded under <strong>the</strong> PAPA program, whichprovides <strong>the</strong> type <strong>of</strong> evidence that has contributed mostimportantly to <strong>in</strong>ternational guidel<strong>in</strong>es <strong>and</strong> science-basedregulatory policies <strong>in</strong> Europe <strong>and</strong> North America (Samet etal. 2000b; WHO 2005b; HEI ISOC 2010 [this report]).The updated meta-analysis <strong>of</strong> <strong>Asia</strong>n time-series studiespresented <strong>in</strong> this review is now based on results from 82publications, more than 3 times <strong>the</strong> number <strong>in</strong> <strong>the</strong> 2004review (HEI ISOC 2004). As a result, it provides more reliable<strong>and</strong> detailed estimates <strong>of</strong> <strong>the</strong> magnitude <strong>of</strong> <strong>the</strong> effect<strong>of</strong> exposure on daily mortality <strong>and</strong> hospital admissions <strong>in</strong><strong>Asia</strong>n populations <strong>and</strong> allows for more def<strong>in</strong>itive comparisons<strong>of</strong> <strong>Asia</strong>n evidence with results from o<strong>the</strong>r regions. Inour meta-analysis, short-term exposure to PM 10 was estimatedto <strong>in</strong>crease daily mortality from all natural causesby 0.27% (95% CI, 0.12–0.42) per 10-µg/m 3 <strong>in</strong>crease <strong>in</strong>concentration, an effect similar to that reported <strong>in</strong> metaanalyses<strong>and</strong> multi-city studies <strong>in</strong> Europe, North America,<strong>and</strong> Lat<strong>in</strong> America. Increased daily mortality from cardiovasculardisease, chiefly IHD <strong>and</strong> stroke, <strong>the</strong> major current<strong>and</strong> future causes <strong>of</strong> death <strong>of</strong> adults <strong>in</strong> <strong>the</strong> region, underliesthis estimate. Consistently larger exposure-related<strong>in</strong>creases <strong>in</strong> all-natural-cause, cardiovascular, <strong>and</strong> respiratorymortality were also observed among older people,who represent an <strong>in</strong>creas<strong>in</strong>gly large proportion <strong>of</strong> <strong>Asia</strong>npopulations.In our review, <strong>the</strong>re was little evidence <strong>of</strong> publicationbias — specifically, <strong>in</strong>accuracy <strong>in</strong> summary estimates dueto selective report<strong>in</strong>g <strong>of</strong> results by <strong>in</strong>vestigators or selectivepublication <strong>of</strong> studies report<strong>in</strong>g <strong>in</strong>creased risk. Asnoted earlier <strong>in</strong> Section V. Quantitative Assessment <strong>of</strong>Daily Time-Series Studies, publication bias may be less <strong>of</strong>an issue <strong>in</strong> coord<strong>in</strong>ated multi-city studies, such as <strong>the</strong>PAPA studies, that apply consistent methods <strong>of</strong> analysis todata from multiple locations accord<strong>in</strong>g to a prespecifiedprotocol <strong>and</strong> report results <strong>in</strong> a comprehensive, uniform,<strong>and</strong> rigorous fashion.THE PAPA STUDIESThe four PAPA studies conducted <strong>in</strong> Ch<strong>in</strong>a <strong>and</strong> Thail<strong>and</strong>constitute <strong>the</strong> first designed <strong>and</strong> coord<strong>in</strong>ated multi-city set<strong>of</strong> studies <strong>of</strong> <strong>the</strong> health effects <strong>of</strong> air pollution <strong>in</strong> <strong>Asia</strong>. Assuch, <strong>the</strong>y provide a unique, if limited, picture <strong>of</strong> <strong>the</strong> shorttermimpact <strong>of</strong> current ambient concentrations <strong>of</strong> particulateair pollution on mortality <strong>in</strong> four large metropolitanareas <strong>in</strong> East <strong>and</strong> Sou<strong>the</strong>ast <strong>Asia</strong> (Bangkok, Hong Kong,Shanghai, <strong>and</strong> Wuhan). In <strong>the</strong> comb<strong>in</strong>ed analysis <strong>of</strong> <strong>the</strong>city-specific results (Wong CM et al. 2008b, 2010a), a 10-µg/m 3 <strong>in</strong>crease <strong>in</strong> PM 10 concentration was associated withan <strong>in</strong>crease <strong>of</strong> 0.6% (95% CI, 0.3–0.9) <strong>in</strong> <strong>the</strong> daily rate <strong>of</strong>death from all natural causes; this estimate is similar to orgreater than those reported <strong>in</strong> multi-city studies <strong>in</strong> <strong>the</strong>United States <strong>and</strong> Europe. This proportional <strong>in</strong>crease <strong>in</strong>daily mortality is seen at levels <strong>of</strong> exposure (mean PM 10concentration, 51.6 to 141.8 µg/m 3 ) that were several timeshigher than those <strong>in</strong> most large Western cities, <strong>and</strong> <strong>in</strong> each<strong>of</strong> <strong>the</strong> four <strong>Asia</strong>n cities, daily mortality cont<strong>in</strong>ues to<strong>in</strong>crease over a fairly large range <strong>of</strong> daily average ambientPM 10 concentrations, up to several hundred microgramsper cubic meter.Wong CM <strong>and</strong> colleagues (2008b, 2010a) report a summaryestimate for <strong>the</strong> <strong>in</strong>itial four cities <strong>of</strong> <strong>the</strong> PAPA programthat exceeds <strong>the</strong> overall meta-analytic summaryestimate for <strong>the</strong> <strong>Asia</strong>n studies for all pollutants <strong>and</strong> outcomes(with <strong>the</strong> exception <strong>of</strong> respiratory mortality, forwhich <strong>the</strong> PAPA estimate is lower) (see Table 15). The reasonsare unclear. To some extent, <strong>the</strong> larger comb<strong>in</strong>ed estimatemay be due to <strong>the</strong> markedly higher estimates fromBangkok (Vichit-Vadakan et al. 2008, 2010), thoughexclud<strong>in</strong>g Bangkok from <strong>the</strong> comb<strong>in</strong>ed analysis <strong>of</strong> <strong>the</strong>PAPA studies still resulted <strong>in</strong> larger estimates (Wong CM etal. 2008b, 2010a) than those <strong>in</strong> <strong>the</strong> meta-analysis <strong>in</strong> thisreview. The systematic selection <strong>of</strong> air quality data, <strong>and</strong>quality control <strong>of</strong> those data, accord<strong>in</strong>g to an explicit protocolmay have resulted <strong>in</strong> reduced measurement error <strong>in</strong><strong>the</strong> PAPA studies, though this factor is difficult to evaluate.Stochastic variation, or <strong>the</strong> play <strong>of</strong> chance, is ano<strong>the</strong>r possibleexplanation. Whatever <strong>the</strong> reason, addition <strong>of</strong> <strong>the</strong>PAPA city-specific estimates to those derived from <strong>the</strong>o<strong>the</strong>r time-series studies identified <strong>in</strong> this review causedrelatively m<strong>in</strong>or changes <strong>in</strong> <strong>the</strong> summary estimates: for<strong>in</strong>stance, <strong>the</strong> <strong>in</strong>crease <strong>in</strong> all-natural-cause mortality per10-µg/m 3 <strong>in</strong>crease <strong>in</strong> PM 10 concentration was estimated at0.33% (95% CI, 0.16–0.51) after <strong>the</strong> PAPA estimates wereadded, versus 0.27% (95% CI, 0.12–0.42) without <strong>the</strong>sefour studies. Prelim<strong>in</strong>ary results from PAPA-fundedstudies <strong>in</strong> two Indian cities, Delhi (Rajarathnam et al.2010) <strong>and</strong> Chennai (Balakrishnan et al. 2010), also show<strong>in</strong>creased rates <strong>of</strong> all-natural-cause mortality <strong>in</strong> associationwith short-term exposure to PM 10 that are broadlyconsistent with <strong>the</strong> results <strong>of</strong> <strong>the</strong> current meta-analysis.The studies <strong>in</strong> Bangkok, Hong Kong, Shanghai, <strong>and</strong>Wuhan, were designed to provide a comb<strong>in</strong>ed picture <strong>of</strong><strong>the</strong> effects <strong>of</strong> short-term exposure to pollution on dailymortality across <strong>the</strong> four cities, but each study alsoexplored more detailed aspects <strong>of</strong> <strong>the</strong> epidemiology <strong>of</strong>176
HEI International Scientific Oversight Committeeexposure to air pollution <strong>in</strong> each location, provid<strong>in</strong>g additional<strong>in</strong>sight <strong>in</strong>to how factors such as wea<strong>the</strong>r <strong>and</strong> socialclass might modify <strong>the</strong> estimated RR <strong>of</strong> health effects <strong>of</strong> airpollution. The study <strong>in</strong> Wuhan, one <strong>of</strong> Ch<strong>in</strong>a’s “ovencities” (cities that experience very high temperatures <strong>and</strong>humidity), found that <strong>the</strong> estimated RR may <strong>in</strong>crease by afactor <strong>of</strong> 5 at extremely high temperatures, as comparedwith temperatures typical <strong>of</strong> temperate zones (Qian Z et al.2008, 2010). The studies <strong>in</strong> Hong Kong (Wong CM et al.2008a, 2010b) <strong>and</strong> Shanghai (Kan H et al. 2008, 2010)found evidence <strong>of</strong> higher estimated RRs among <strong>the</strong> economicallydisadvantaged <strong>and</strong> those with <strong>the</strong> least education,respectively, corroborat<strong>in</strong>g <strong>the</strong> results <strong>of</strong> earlierstudies <strong>in</strong> Western cities (O’Neill et al. 2003).SYSTEMATIC AND CRITICAL REVIEW OF STUDIES OFCHRONIC EFFECTS OF LONG-TERM EXPOSURE TOAIR POLLUTIONThe <strong>Asia</strong>n literature on <strong>the</strong> chronic effects <strong>of</strong> long-termexposure to air pollution is more limited than <strong>the</strong> literaturefrom Europe <strong>and</strong> North America, especially withregard to chronic cardiovascular disease. The design <strong>and</strong>quality <strong>of</strong> <strong>the</strong> studies also vary widely. None<strong>the</strong>less, <strong>the</strong>results <strong>of</strong> this review suggest that long-term exposure to airpollution from a variety <strong>of</strong> combustion sources is contribut<strong>in</strong>gto chronic respiratory disease <strong>in</strong> both children <strong>and</strong>adults, to lung cancer, <strong>and</strong> to adverse reproductive outcomes<strong>in</strong> <strong>Asia</strong>n populations.The prevalence <strong>of</strong> chronic phlegm, a symptom <strong>of</strong>chronic respiratory disease <strong>in</strong>dicat<strong>in</strong>g long-term exposureto <strong>in</strong>haled irritants, was found to be associated with exposureto combustion-source air pollution both <strong>in</strong> qualitativecomparisons among areas with differ<strong>in</strong>g levels <strong>of</strong> pollution<strong>and</strong> <strong>in</strong> quantitative comparisons <strong>of</strong> measured levels <strong>of</strong> airpollution. Studies that controlled for major potential confound<strong>in</strong>gfactors, <strong>in</strong>clud<strong>in</strong>g tobacco smok<strong>in</strong>g <strong>and</strong> <strong>in</strong>doorair pollution from <strong>the</strong> burn<strong>in</strong>g <strong>of</strong> solid fuels, reported ORsgenerally between 1.1 <strong>and</strong> 5.0, regardless <strong>of</strong> how pollutionwas characterized.A similarly diverse <strong>and</strong> overlapp<strong>in</strong>g collection <strong>of</strong>studies also provides some evidence for an <strong>in</strong>creased prevalence<strong>of</strong> asthma <strong>and</strong> asthma-related symptoms <strong>in</strong> associationwith exposure to air pollution from a variety <strong>of</strong>sources. Most studies showed an elevated prevalence <strong>in</strong>association with air pollution exposure, though <strong>the</strong> estimated<strong>in</strong>crease was small, with ORs greater than 1.0 butless than 1.5.There is limited evidence regard<strong>in</strong>g a connectionbetween air pollution <strong>and</strong> lung cancer <strong>in</strong> <strong>Asia</strong>n populations.The two studies that have addressed potential confound<strong>in</strong>gby strong risk factors, such as tobacco smok<strong>in</strong>g<strong>and</strong> <strong>in</strong>door air pollution from <strong>the</strong> burn<strong>in</strong>g <strong>of</strong> solid fuels,report estimated RRs for lung cancer <strong>in</strong> <strong>the</strong> range <strong>of</strong> 1.5 to3.0, consistent with ranges from studies <strong>in</strong> Europe <strong>and</strong>North America. But more def<strong>in</strong>itive evidence will requirelarger studies to estimate effects <strong>of</strong> exposure at current <strong>and</strong>past high concentrations us<strong>in</strong>g actual measured concentrations,<strong>of</strong> air pollution <strong>and</strong> adequate control for potentialconfound<strong>in</strong>g by those strong risk factors.The <strong>Asia</strong>n literature suggests that <strong>the</strong> risks <strong>of</strong> adversereproductive outcomes, low birth weight, <strong>and</strong> pretermdelivery <strong>in</strong> association with exposure to air pollution arerelatively small. Overall, <strong>the</strong> estimated RRs are between1.04 <strong>and</strong> 2.0. Exposure <strong>in</strong> early pregnancy appears to bemost strongly associated with risk. These results are generallyconsistent with those from <strong>the</strong> larger global literatureon air pollution <strong>and</strong> adverse pregnancy outcomes.IMPLICATIONS FOR ASSESSMENT OFHEALTH IMPACTSVery large populations are exposed to high concentrations<strong>of</strong> air pollution <strong>in</strong> develop<strong>in</strong>g <strong>Asia</strong>. Indeed, 30 millionpeople currently reside <strong>in</strong> just <strong>the</strong> first four citiesstudied <strong>in</strong> <strong>the</strong> PAPA project. Thus, <strong>the</strong> estimated effects <strong>of</strong>both short- <strong>and</strong> long-term exposures reviewed <strong>in</strong> thisreport, though small <strong>in</strong> relative terms, probably translate tolarge numbers <strong>of</strong> illnesses <strong>and</strong> deaths attributable to airpollution. The WHO estimated that <strong>in</strong> 2000 over 500,000deaths <strong>in</strong> <strong>Asia</strong> were due to outdoor air pollution exposure,account<strong>in</strong>g for approximately two thirds <strong>of</strong> <strong>the</strong> global totalattributed to air pollution. Indoor air pollution from use <strong>of</strong>solid fuel contributed an additional 1.1 million deaths(WHO 2002). O<strong>the</strong>r impact assessments have reported similarestimates (World Bank <strong>and</strong> SEPA 2007). That said, airpollution is only one <strong>of</strong> many factors that affect <strong>the</strong> health<strong>of</strong> people <strong>in</strong> develop<strong>in</strong>g <strong>Asia</strong> (Ezzati et al. 2002). None<strong>the</strong>less,<strong>the</strong> substantial health impacts <strong>of</strong> exposure to air pollutionshould be <strong>of</strong> concern to policy makers faced withdifficult decisions regard<strong>in</strong>g transport <strong>and</strong> energy policy.In <strong>Asia</strong> <strong>and</strong> elsewhere, an <strong>in</strong>creased life expectancy is amajor social benefit <strong>of</strong> economic growth <strong>and</strong> its attendant,if <strong>of</strong>ten variable, reductions <strong>in</strong> poverty. Brunekreef <strong>and</strong>colleagues (2007) argue that exposure to air pollution actsto reduce healthy life expectancy, shorten<strong>in</strong>g lives bymonths <strong>and</strong> even years, on average, <strong>in</strong> some populations.Although <strong>the</strong> time-series studies reviewed here document<strong>the</strong> occurrence <strong>of</strong> excess mortality related to short-termexposure, <strong>the</strong> study results cannot currently be useddirectly to estimate reductions <strong>in</strong> life expectancy due toextended exposure (Burnett et al. 2003; Rabl 2006). Suchestimates are provided by cohort studies, <strong>in</strong> which largenumbers <strong>of</strong> <strong>in</strong>dividuals exposed to various concentrations177
<strong>Outdoor</strong> <strong>Air</strong> <strong>Pollution</strong> <strong>and</strong> <strong>Health</strong> <strong>in</strong> <strong>the</strong> Develop<strong>in</strong>g <strong>Countries</strong> <strong>of</strong> <strong>Asia</strong><strong>of</strong> air pollution are observed for years <strong>and</strong> <strong>the</strong> mortalityrates <strong>in</strong> each exposure group are compared. To date, nocohort studies <strong>of</strong> long-term exposure to air pollution <strong>and</strong>mortality from chronic cardiovascular or respiratory diseaseappear to have been reported <strong>in</strong> <strong>Asia</strong>. Virtually allrecent estimates <strong>of</strong> <strong>the</strong> health impacts <strong>of</strong> air pollution <strong>in</strong><strong>Asia</strong>, <strong>in</strong>clud<strong>in</strong>g those made by <strong>the</strong> WHO (WHO 2002) <strong>and</strong><strong>the</strong> World Bank <strong>and</strong> SEPA (World Bank <strong>and</strong> SEPA 2007),are based on <strong>the</strong> results <strong>of</strong> <strong>the</strong> ACS study (Pope et al. 2002),<strong>the</strong> largest <strong>and</strong> most extensively reviewed cohort study.The broad consistency <strong>of</strong> <strong>the</strong> results <strong>of</strong> <strong>Asia</strong>n time-seriesstudies <strong>of</strong> mortality with those <strong>in</strong> Europe <strong>and</strong> NorthAmerica, <strong>in</strong>clud<strong>in</strong>g <strong>the</strong> evidence <strong>of</strong> greater rates <strong>of</strong> cardiovascularmorbidity <strong>and</strong> mortality among older people thanamong younger people, supports <strong>the</strong> cont<strong>in</strong>ued use <strong>of</strong> datafrom Western cohort studies to estimate <strong>the</strong> burden <strong>of</strong> diseaseattributable to air pollution <strong>in</strong> <strong>Asia</strong>. However, develop<strong>in</strong>g<strong>Asia</strong> currently differs from <strong>the</strong> United States <strong>and</strong>Europe with regard to energy use, air quality, <strong>and</strong> populationhealth, which are also dynamically chang<strong>in</strong>g. Thus,estimates <strong>of</strong> <strong>the</strong> impact <strong>of</strong> air pollution that are based oneven <strong>the</strong> most carefully executed U.S. studies must beused with caution. One key area <strong>of</strong> uncerta<strong>in</strong>ty is <strong>the</strong> shape<strong>of</strong> <strong>the</strong> concentration–response function relat<strong>in</strong>g long-termexposure to air pollution <strong>and</strong> mortality from chronic disease.The concentrations <strong>of</strong> PM 2.5 studied <strong>in</strong> <strong>the</strong> ACSstudy were much lower than <strong>the</strong> concentrations <strong>in</strong> majorcities <strong>in</strong> Ch<strong>in</strong>a <strong>and</strong> India, requir<strong>in</strong>g that analysts extrapolat<strong>in</strong>g<strong>the</strong> ACS data to <strong>Asia</strong> make projections regard<strong>in</strong>g <strong>the</strong>shape <strong>of</strong> <strong>the</strong> concentration–response function at muchhigher concentrations. The uncerta<strong>in</strong>ty <strong>in</strong> <strong>the</strong> result<strong>in</strong>gestimates, when quantified <strong>in</strong> sensitivity analyses, wassubstantial (Cohen et al. 2004). The concentration–response functions describ<strong>in</strong>g short-term exposure to airpollution <strong>and</strong> daily mortality recently reported for HongKong, Shanghai, <strong>and</strong> Wuhan (Wong CM et al. 2008b,2010a) may help to <strong>in</strong>form future extrapolation <strong>of</strong> resultsfrom U.S. cohort studies to <strong>Asia</strong>n populations <strong>in</strong> highlypolluted cities, but <strong>Asia</strong>n cohort studies are needed to providemore def<strong>in</strong>itive estimates.ENHANCED EVIDENCE OF EFFECTS OF AIRPOLLUTION IN ASIABased on f<strong>in</strong>d<strong>in</strong>gs from more than 80 <strong>Asia</strong>n time-seriesstudies, <strong>in</strong>clud<strong>in</strong>g coord<strong>in</strong>ated multi-city time-seriesstudies, <strong>the</strong> meta-analytic estimates appear consistent <strong>in</strong>both direction <strong>and</strong> magnitude with those from o<strong>the</strong>rregions. In broad terms, <strong>the</strong> effects <strong>of</strong> short-term exposure<strong>in</strong> <strong>Asia</strong>n cities are on a par with those observed <strong>in</strong> hundreds<strong>of</strong> studies worldwide. The same pollutants — RSP<strong>and</strong> gaseous pollutants such as O 3 , SO 2 , <strong>and</strong> NO 2 — affectolder people with chronic cardiovascular or respiratorydisease. The adverse effects <strong>in</strong> some locales, reported <strong>in</strong>studies published <strong>in</strong> <strong>the</strong> 1980s <strong>and</strong> 1990s, may reflect <strong>the</strong>effects <strong>of</strong> air pollution concentrations that have subsequentlyimproved. However, more recent studies cont<strong>in</strong>ueto report adverse effects at lower levels <strong>in</strong> cities <strong>in</strong> Thail<strong>and</strong><strong>and</strong> Japan, where air quality has improved, as well as<strong>in</strong> heavily polluted Ch<strong>in</strong>ese <strong>and</strong> Indian cities.The results <strong>of</strong> our meta-analysis <strong>of</strong> time-series studiesshould serve to reduce concerns regard<strong>in</strong>g <strong>the</strong> generalizability<strong>of</strong> <strong>the</strong> results <strong>of</strong> <strong>the</strong> substantial, but largely Western,literature on <strong>the</strong> effects <strong>of</strong> short-term exposure to air pollution.They suggest that nei<strong>the</strong>r genetic factors nor longertermexposure to highly polluted air substantially modifies<strong>the</strong> effect <strong>of</strong> short-term exposure on daily mortality <strong>in</strong>major cities <strong>in</strong> develop<strong>in</strong>g <strong>Asia</strong>. This evidence providessupport for <strong>the</strong> notion, implicit <strong>in</strong> <strong>the</strong> approach taken <strong>in</strong>sett<strong>in</strong>g <strong>the</strong> WHO world air quality guidel<strong>in</strong>es (Krzyzanowski<strong>and</strong> Cohen 2008), that <strong>in</strong>cremental improvements<strong>in</strong> air quality are expected to improve health, even <strong>in</strong> areaswith relatively high ambient concentrations. The resultsalso suggest that health benefits would result from fur<strong>the</strong>rreductions <strong>in</strong> exposure to pollution concentrations belowthose specified <strong>in</strong> <strong>the</strong> WHO guidel<strong>in</strong>es.The results <strong>of</strong> <strong>the</strong> studies <strong>of</strong> chronic effects reviewed <strong>in</strong>this report appear to be broadly consistent with those <strong>of</strong>studies <strong>in</strong> o<strong>the</strong>r regions, suggest<strong>in</strong>g that long-term exposureto air pollution causes chronic pulmonary disease<strong>and</strong> o<strong>the</strong>r adverse effects that result <strong>in</strong> reduced life expectancy.That said, <strong>the</strong>se studies are more susceptible than <strong>the</strong>time-series studies to uncontrolled confound<strong>in</strong>g by strongrisk factors, such as tobacco smok<strong>in</strong>g <strong>and</strong> <strong>in</strong>door air pollutionfrom <strong>the</strong> burn<strong>in</strong>g <strong>of</strong> solid fuels, <strong>and</strong> factors related tosocioeconomic status, such as diet. These risk factors mayalso modulate <strong>the</strong> effect <strong>of</strong> air pollution, lead<strong>in</strong>g to largereffects <strong>in</strong> some population groups <strong>and</strong> smaller effects <strong>in</strong>o<strong>the</strong>rs. Some <strong>of</strong> <strong>the</strong>se factors, such as those related to <strong>the</strong>level <strong>of</strong> economic development, may be particularlyimportant <strong>in</strong> develop<strong>in</strong>g <strong>Asia</strong>. If <strong>the</strong>y are ignored or poorlymeasured, an <strong>in</strong>accurate estimate <strong>of</strong> <strong>the</strong> effects <strong>of</strong> air pollutionmay result, <strong>and</strong> real differences among study results<strong>in</strong> various regions may be obscured.This literature review documents a number <strong>of</strong> promis<strong>in</strong>gimprovements <strong>in</strong> air quality <strong>in</strong> <strong>Asia</strong>n cities, even <strong>in</strong><strong>the</strong> context <strong>of</strong> economic growth. However, susceptibility to<strong>the</strong> effects <strong>of</strong> air pollution <strong>in</strong> <strong>Asia</strong> can be expected to risebecause rates <strong>of</strong> chronic cardiovascular <strong>and</strong> respiratorydisease <strong>in</strong>crease as populations age, exposure to combustion-sourceair pollution becomes more widespread ow<strong>in</strong>gto urbanization, vehicularization, <strong>and</strong> <strong>in</strong>dustrialization, <strong>and</strong>risk factors <strong>in</strong>crease <strong>in</strong> prevalence. In future assessments,178
HEI International Scientific Oversight Committee<strong>the</strong>se changes may yield larger health impacts <strong>in</strong> <strong>the</strong>region, although <strong>the</strong> effects <strong>of</strong> <strong>the</strong>se changes could becounterbalanced by improved access to medical care <strong>and</strong>o<strong>the</strong>r improvements <strong>in</strong> <strong>the</strong> st<strong>and</strong>ard <strong>of</strong> liv<strong>in</strong>g. Higher estimates<strong>of</strong> <strong>the</strong> magnitude <strong>of</strong> air pollution effects may alsocontribute to larger impact estimates. For example, <strong>the</strong>most recent publication from <strong>the</strong> ACS study (Krewski et al.2009) reported larger estimates <strong>of</strong> <strong>the</strong> risks <strong>of</strong> cardiovascularmortality <strong>and</strong> lung cancer than previously reported.KNOWLEDGE GAPS AND RESEARCH NEEDSThe acute toxicity <strong>of</strong> short-term exposure to high air pollutionconcentrations has been appreciated s<strong>in</strong>ce <strong>the</strong> early20th century, <strong>and</strong> recent multi-city studies <strong>in</strong> Europe <strong>and</strong>North America have identified such toxic effects at evenlower concentrations. Therefore, <strong>the</strong> results <strong>of</strong> meta-analyses<strong>of</strong> <strong>Asia</strong>n time-series studies <strong>of</strong> daily mortality <strong>and</strong>hospital admissions are not unexpected <strong>and</strong> can serve asan important part <strong>of</strong> <strong>the</strong> scientific basis <strong>and</strong> rationale for<strong>in</strong>terventions to improve air quality. Never<strong>the</strong>less, <strong>the</strong>re ismuch we still need to learn <strong>in</strong> order to fully underst<strong>and</strong><strong>the</strong> substantial air pollution challenges <strong>in</strong> <strong>Asia</strong>. Highquality,credible science from locally relevant studies willbe critical to help<strong>in</strong>g decision makers choose which policiesare most likely to result <strong>in</strong> public health benefits.How Does <strong>the</strong> Nature <strong>of</strong> <strong>the</strong> <strong>Air</strong> <strong>Pollution</strong> Mixture Affect<strong>Air</strong> Quality, Exposure, <strong>and</strong> <strong>Health</strong> Effects?<strong>Health</strong> impacts <strong>in</strong> cities <strong>in</strong> develop<strong>in</strong>g countries <strong>of</strong> <strong>Asia</strong>result from exposure to a mixture <strong>of</strong> pollutants, both particles<strong>and</strong> gases, which are derived <strong>in</strong> large part from combustionsources (Harrison 2006). This is true <strong>in</strong> Europe <strong>and</strong>North America as well, but <strong>the</strong> specific sources <strong>and</strong> <strong>the</strong>irproportional contributions <strong>in</strong> <strong>Asia</strong> are different, with alarger share from open burn<strong>in</strong>g <strong>of</strong> biomass <strong>and</strong> solid wastematerials, combustion <strong>of</strong> lower-quality fuels <strong>in</strong>clud<strong>in</strong>gcoal, <strong>and</strong> use <strong>of</strong> two- <strong>and</strong> three-wheeled vehicles with twostrokeeng<strong>in</strong>es. These conditions affect <strong>the</strong> size distribution<strong>and</strong> chemical composition <strong>of</strong> PM, among o<strong>the</strong>raspects <strong>of</strong> air pollution. (The proportional contribution <strong>of</strong><strong>the</strong>se sources is also chang<strong>in</strong>g over time <strong>in</strong> major cities <strong>in</strong><strong>Asia</strong>.) F<strong>in</strong>ally, time–activity patterns, build<strong>in</strong>g characteristics,<strong>and</strong> proximity <strong>of</strong> susceptible populations to pollutionsources <strong>in</strong> <strong>the</strong> region also differ from those <strong>in</strong> Westerncountries <strong>in</strong> ways that may affect human exposure <strong>and</strong>health effects (Janssen <strong>and</strong> Mehta 2006).Our current knowledge <strong>of</strong> <strong>the</strong>se issues is rudimentary,<strong>and</strong> additional research is needed to <strong>in</strong>form effective <strong>and</strong>susta<strong>in</strong>able control strategies. Without such studies, epidemiologistswill have a difficult time assess<strong>in</strong>g <strong>the</strong> relativeeffects <strong>of</strong> various pollution mixtures or specific pollutionsources or even <strong>in</strong>terpret<strong>in</strong>g patterns <strong>of</strong> variation.What Are <strong>the</strong> Effects <strong>of</strong> Long-Term Exposure to <strong>Air</strong><strong>Pollution</strong>?Although time-series studies will cont<strong>in</strong>ue to be importantpotential drivers <strong>of</strong> environmental <strong>and</strong> public policy,additional study designs, such as cohort studies like <strong>the</strong>ACS <strong>and</strong> Six Cities studies (Pope et al. 2002; Laden et al.2006), are needed <strong>in</strong> <strong>Asia</strong> to estimate <strong>the</strong> effects <strong>of</strong> longtermexposure on annual average rates <strong>of</strong> mortality fromchronic cardiovascular or respiratory diseases <strong>and</strong> impactson life expectancy, <strong>the</strong> metrics that may be <strong>the</strong> most mean<strong>in</strong>gful<strong>and</strong> relevant to policy. Conduct<strong>in</strong>g such studies willbe challeng<strong>in</strong>g, not least because <strong>of</strong> rapidly chang<strong>in</strong>g airpollution concentrations <strong>and</strong> exposures <strong>in</strong> develop<strong>in</strong>g<strong>Asia</strong>; as some U.S. studies suggest, however, if chroniceffects are due to recent exposure, this problem may not besevere. Studies <strong>of</strong> adverse reproductive outcomes <strong>and</strong>effects on <strong>the</strong> health <strong>of</strong> young children will be easier toconduct because <strong>the</strong> relevant exposures will be morerecent. A detailed quantitative review <strong>of</strong> <strong>the</strong> larger <strong>Asia</strong>nliterature (<strong>in</strong>clud<strong>in</strong>g cross-sectional studies <strong>of</strong> chronic respiratorydisease <strong>and</strong> studies <strong>of</strong> lung cancer <strong>and</strong> adversereproductive outcomes) may provide support for extrapolations<strong>of</strong> <strong>the</strong> Western studies, but long-term <strong>Asia</strong>n studieswill provide <strong>the</strong> most direct evidence.It may be possible to “retr<strong>of</strong>it” exist<strong>in</strong>g <strong>Asia</strong>n cohortstudies, orig<strong>in</strong>ally designed to address issues o<strong>the</strong>r thanair pollution, with estimates <strong>of</strong> air pollution exposure.This approach was used <strong>in</strong> <strong>the</strong> ACS study, but it is not asimple process, as HEI’s experience with <strong>the</strong> pilot study <strong>in</strong>Guangzhou makes clear (Lam et al. 2009). Retr<strong>of</strong>itt<strong>in</strong>gstudies requires <strong>the</strong> build<strong>in</strong>g <strong>of</strong> multidiscipl<strong>in</strong>ary teams <strong>of</strong><strong>in</strong>vestigators, with commitment <strong>of</strong> adequate, long-termresources, to work <strong>in</strong> collaboration with government <strong>of</strong>ficials,<strong>the</strong>ir <strong>in</strong>dustrial counterparts, <strong>and</strong> local stakeholders.In order to assess <strong>the</strong> current potential for such studies,HEI’s PAPA program issued a Request for Information <strong>and</strong>Qualifications for teams <strong>of</strong> <strong>in</strong>vestigators to conduct suchstudies <strong>in</strong> develop<strong>in</strong>g countries <strong>of</strong> <strong>Asia</strong> (<strong>Health</strong> EffectsInstitute 2009). Based on <strong>the</strong> responses, it was evident that<strong>the</strong> potential existed <strong>in</strong> several locations.What Do Results <strong>of</strong> Current Time-Series Studies <strong>in</strong> aSubset <strong>of</strong> <strong>Asia</strong>n Cities Tell Us About <strong>Health</strong> Effects <strong>of</strong> <strong>Air</strong><strong>Pollution</strong> Exposure <strong>in</strong> O<strong>the</strong>r, As Yet Unstudied, <strong>Asia</strong>nLocales?The number <strong>of</strong> time-series studies be<strong>in</strong>g reported fromacross <strong>Asia</strong> is grow<strong>in</strong>g; <strong>the</strong> first Indian studies <strong>of</strong> shorttermexposure to RSP <strong>and</strong> daily mortality, part <strong>of</strong> <strong>the</strong> PAPA179
<strong>Outdoor</strong> <strong>Air</strong> <strong>Pollution</strong> <strong>and</strong> <strong>Health</strong> <strong>in</strong> <strong>the</strong> Develop<strong>in</strong>g <strong>Countries</strong> <strong>of</strong> <strong>Asia</strong>research program, will soon be published. Even so, almostall current studies have been conducted <strong>in</strong> ma<strong>in</strong>l<strong>and</strong>Ch<strong>in</strong>a, Taipei,Ch<strong>in</strong>a, <strong>and</strong> South Korea. Major populationcenters <strong>in</strong> South <strong>and</strong> Sou<strong>the</strong>ast <strong>Asia</strong> (India, Pakistan,Vietnam, Philipp<strong>in</strong>es, Indonesia, <strong>and</strong> Malaysia) are stilllargely understudied, with <strong>the</strong> exception <strong>of</strong> Bangkok. Differences<strong>in</strong> <strong>the</strong> relative prevalence <strong>of</strong> urban air pollutionsources (such as open burn<strong>in</strong>g) <strong>and</strong> urban poverty maymodify <strong>the</strong> effects <strong>of</strong> exposure. Exp<strong>and</strong>ed coord<strong>in</strong>atedmulti-city studies, designed <strong>and</strong> analyzed consistently <strong>and</strong>conducted across <strong>the</strong> region, could provide more def<strong>in</strong>itiveanswers. In some cases, nonmortality outcomes, suchas hospital admissions, may also be studied, enabl<strong>in</strong>gpolicy makers to better quantify <strong>the</strong> health impacts <strong>of</strong> airpollution.What Role Does Indoor <strong>Air</strong> <strong>Pollution</strong> Play <strong>in</strong> <strong>the</strong> <strong>Health</strong>Effects <strong>of</strong> <strong>Outdoor</strong> <strong>Air</strong> <strong>Pollution</strong>?The magnitude <strong>and</strong> prevalence <strong>of</strong> exposure to <strong>in</strong>door airpollution are high <strong>in</strong> <strong>Asia</strong>n cities, especially among peopleliv<strong>in</strong>g <strong>in</strong> poverty. We need a better underst<strong>and</strong><strong>in</strong>g <strong>of</strong> howair pollution from <strong>in</strong>door sources contributes to concentrations<strong>of</strong> outdoor air pollution <strong>and</strong> how <strong>in</strong>door exposure toair pollution from <strong>in</strong>door sources affects risk estimates foroutdoor air pollution. Coord<strong>in</strong>ated measurements <strong>of</strong> exposure<strong>and</strong> coord<strong>in</strong>ated epidemiologic studies will beneeded to address <strong>the</strong>se questions.What Role Does Poverty Play <strong>in</strong> <strong>the</strong> <strong>Health</strong> Effects <strong>of</strong><strong>Air</strong> <strong>Pollution</strong>?Limited evidence, largely from studies <strong>in</strong> Europe <strong>and</strong>North America, suggests that economic deprivation<strong>in</strong>creases <strong>the</strong> rates <strong>of</strong> morbidity <strong>and</strong> mortality related to airpollution. One reason may be <strong>the</strong> higher air pollutionexposures experienced by people <strong>of</strong> lower socioeconomicstatus. Never<strong>the</strong>less, <strong>in</strong>creased vulnerability can also becaused by factors related to socioeconomic status, such ashealth status, nutritional status, <strong>and</strong> access to medical services.Studies <strong>of</strong> <strong>the</strong>se issues are relatively rare <strong>in</strong> <strong>Asia</strong>,where extreme poverty is more prevalent than <strong>in</strong> <strong>the</strong> West;<strong>the</strong>refore, results <strong>of</strong> Western studies cannot be simplyextrapolated, though <strong>the</strong> recent results <strong>of</strong> <strong>the</strong> PAPA studies<strong>in</strong> Shanghai <strong>and</strong> Hong Kong are welcome <strong>and</strong> muchneededadditions (Kan H et al. 2008, 2010; Wong CM et al.2008a, 2010b). Some analyses <strong>of</strong> U.S. cohort studies suggestedthat low levels <strong>of</strong> atta<strong>in</strong>ed education were associatedwith larger estimated RRs <strong>of</strong> air pollution–relatedmortality (Krewski et al. 2000), but more recent analysesbased on extended follow-up <strong>of</strong> <strong>the</strong> largest cohort have notupheld this pattern (Krewski et al. 2009). Studies <strong>in</strong> <strong>Asia</strong>that exam<strong>in</strong>e <strong>the</strong> effect <strong>of</strong> exposure on morbidity <strong>and</strong> mortalityfrom diseases associated with poverty (such as acutelower respiratory <strong>in</strong>fection [ALRI] <strong>in</strong> children <strong>and</strong> TB) <strong>and</strong>studies that estimate effects <strong>of</strong> exposure across socioeconomicstrata are needed. HEI’s study <strong>of</strong> hospital admissionsfor ALRI <strong>in</strong> children <strong>in</strong> Ho Chi M<strong>in</strong>h City is, to ourknowledge, <strong>the</strong> only example <strong>of</strong> such a study.What Are <strong>the</strong> <strong>Health</strong> Consequences <strong>of</strong> Changes <strong>in</strong> <strong>Air</strong><strong>Pollution</strong> Result<strong>in</strong>g from Climate Change <strong>and</strong> Efforts toReduce Emissions <strong>of</strong> Climate-Forc<strong>in</strong>g Agents?Changes <strong>in</strong> air pollution result<strong>in</strong>g from climate change<strong>and</strong> from efforts to reduce emissions <strong>of</strong> climate-forc<strong>in</strong>gagents may have important consequences for health <strong>in</strong> <strong>the</strong>region, especially <strong>in</strong> low- <strong>and</strong> middle-<strong>in</strong>come countries.However, major unknowns rema<strong>in</strong>, <strong>in</strong>clud<strong>in</strong>g <strong>the</strong> quantitativeassociation between reductions <strong>in</strong> <strong>the</strong> concentrations<strong>of</strong> GHGs such as CO 2 <strong>and</strong> toxic air pollutants such asPM 2.5 , <strong>the</strong> relative toxicity <strong>of</strong> short-lived GHGs with differentclimate-forc<strong>in</strong>g potentials, such as SO 42 <strong>and</strong> BC,<strong>and</strong> <strong>the</strong> impact <strong>of</strong> policy choices. There is also a need tounderst<strong>and</strong> more fully how concentration–response functionsfor air pollution may vary with regard to global <strong>and</strong>with<strong>in</strong>-region differences <strong>in</strong> climate, demographics, <strong>and</strong>pollutant mixes.F<strong>in</strong>ally, although <strong>the</strong> ability to conduct research on <strong>the</strong>health effects <strong>of</strong> air pollution <strong>in</strong> develop<strong>in</strong>g <strong>Asia</strong> isimprov<strong>in</strong>g, it is still constra<strong>in</strong>ed by limitations <strong>in</strong> environmental<strong>and</strong> public health <strong>in</strong>frastructures. <strong>Air</strong> quality monitor<strong>in</strong>ghas <strong>in</strong>creased <strong>in</strong> <strong>the</strong> region, but <strong>the</strong>re is a need formore extensive systems for monitor<strong>in</strong>g urban air qualitythat are designed to support health effects studies <strong>and</strong>impact assessments. There is also a correspond<strong>in</strong>g need formore highly tra<strong>in</strong>ed pr<strong>of</strong>essionals <strong>in</strong> air quality monitor<strong>in</strong>g,exposure assessment, <strong>and</strong> environmental epidemiology.Equally important, <strong>the</strong>re rema<strong>in</strong> considerabledeficiencies <strong>in</strong> registration <strong>of</strong> vital statistics <strong>in</strong> <strong>Asia</strong>, especiallyregard<strong>in</strong>g accurate <strong>and</strong> comprehensive assignment<strong>of</strong> causes <strong>of</strong> death. There is also a need to encourage cooperation<strong>and</strong> collaboration <strong>in</strong> health effects researchbetween health <strong>and</strong> environmental scientists <strong>and</strong> publicagencies. These deficiencies constitute a major impedimentto environmental health research <strong>and</strong>, more broadly,to <strong>the</strong> development <strong>of</strong> appropriate, evidence-based publichealth policy.180
REFERENCESAbbey DE, Nish<strong>in</strong>o N, McDonnell WF, Burchette RJ,Knutsen SF, Beeson WL, Yang JX. 1999. Long-term <strong>in</strong>halableparticles <strong>and</strong> o<strong>the</strong>r air pollutants related to mortality<strong>in</strong> nonsmokers. Am J Respir Crit Care Med 159:373–382.Abegunde DO, Ma<strong>the</strong>rs CD, Adam T, Ortegon M, Strong K.2007. Chronic Diseases 1. The burden <strong>and</strong> costs <strong>of</strong> chronicdiseases <strong>in</strong> low-<strong>in</strong>come <strong>and</strong> middle-<strong>in</strong>come countries.Lancet 370:1929–1938.Adar SD, Gold DR, Coull BA, Schwartz J, Stone PH, Suh H.2007. Focused exposures to airborne traffic particles <strong>and</strong>heart rate variability <strong>in</strong> <strong>the</strong> elderly. Epidemiology 18:95–103.Aga E, Samoli E, Touloumi G, Anderson HR, Cadum E,Forsberg B, Goodman P, Goren A, Kotesovec F, Kriz B,Macarol-Hiti M, Med<strong>in</strong>a S, Paldy A, Sch<strong>in</strong>dler C, Sunyer J,Tittanen P, Wojtyniak B, Zmirou D, Schwartz J, KatsouyanniK. 2003. Short-term effects <strong>of</strong> ambient particles onmortality <strong>in</strong> <strong>the</strong> elderly: Results from 28 cities <strong>in</strong> <strong>the</strong>APHEA2 project. Eur Respir J 21:28S–33S.Aggarwal AN, Chaudhry K, Chhabra SK, D’Souza GA,Gupta D, J<strong>in</strong>dal SK, Katiyar SK, Kumar R, Shah B, VijayanVK for Asthma Epidemiology Study Group. 2006. Prevalence<strong>and</strong> risk factors for bronchial asthma <strong>in</strong> Indianadults: A multicentre study. Indian J Chest Dis Allied Sci48:13–22.American Academy <strong>of</strong> Pediatrics Committee on Environmental<strong>Health</strong>. 2004. Ambient air pollution: <strong>Health</strong> hazardsto children. Pediatrics 114:1699–1707.American Thoracic Society. 1996a. <strong>Health</strong> effects <strong>of</strong> outdoorair pollution, Part 1. Committee <strong>of</strong> <strong>the</strong> Environmental<strong>and</strong> Occupational <strong>Health</strong> Assembly <strong>of</strong> <strong>the</strong> American ThoracicSociety. Am J Respir Crit Care Med 153:3–50.American Thoracic Society. 1996b. <strong>Health</strong> effects <strong>of</strong> outdoorair pollution, Part 2. Committee <strong>of</strong> <strong>the</strong> Environmental<strong>and</strong> Occupational <strong>Health</strong> Assembly <strong>of</strong> <strong>the</strong> American ThoracicSociety. Am J Respir Crit Care Med 153:477–498.American Thoracic Society. 2000. What constitutes anadverse health effect <strong>of</strong> air pollution? Am J Respir Crit CareMed 161:665–673.Analitis A, Katsouyanni K, Dimakopoulou K, Samoli E,Nikoloulopoulos AK, Petasakis Y, Touloumi G, Schwartz J,Anderson HR, Cambra K, Forastiere F, Zmirou D, Vonk JM,Clancy L, Kriz B, Bobvos J, Pekkanen J. 2006. Short-termeffects <strong>of</strong> ambient particles on cardiovascular <strong>and</strong> respiratorymortality. Epidemiology 17:230–233.An<strong>and</strong> SS, Yusuf S, Vuksan V, Devanesen S, Teo KK, MontaguePA, Kelemen L, Yi CL, Lonn E, Gerste<strong>in</strong> H, HegeleRA, McQueen M. 2000. Differences <strong>in</strong> risk factors, a<strong>the</strong>rosclerosis,<strong>and</strong> cardiovascular disease between ethnicgroups <strong>in</strong> Canada: The Study <strong>of</strong> <strong>Health</strong> Assessment <strong>and</strong>Risk <strong>in</strong> Ethnic groups (SHARE). Lancet 356:279–284.Anderson HR. 1999. <strong>Health</strong> effects <strong>of</strong> air pollution episodes.In: <strong>Air</strong> <strong>Pollution</strong> <strong>and</strong> <strong>Health</strong> (Holgate ST, Samet JM,Koren HS, Maynard R, eds.) pp. 461–482. Academic Press,London.Anderson HR. 2006. An example <strong>of</strong> publication bias <strong>in</strong>environmental epidemiology: Publication <strong>and</strong> lag selectionbias <strong>in</strong> time-series studies <strong>of</strong> <strong>the</strong> health effects <strong>of</strong>ambient air pollution. Eur J Epidemiol 21:24s.Anderson HR, Atk<strong>in</strong>son RW, Bremner SA, Marston L.2003. Particulate air pollution <strong>and</strong> hospital admissions forcardiorespiratory diseases: Are <strong>the</strong> elderly at greater risk?Eur Respir J Suppl 40:39s–46s.Anderson HR, Atk<strong>in</strong>son RW, Peacock JL, Sweet<strong>in</strong>g MJ,Marston L. 2005. Ambient particulate matter <strong>and</strong> heal<strong>the</strong>ffects: Publication bias <strong>in</strong> studies <strong>of</strong> short-term associations.Epidemiology 16:155–163.Anderson HR, Limb ES, Bl<strong>and</strong> JM, Deleon AP, Strachan DP,Bower JS. 1995. <strong>Health</strong> effects <strong>of</strong> an air pollution episode<strong>in</strong> London, December 1991. Thorax 50:1188–1193.Anderson HR, Ruggles R, P<strong>and</strong>ey KD, Kapetanakis V,Brunekreef B, Lai CK, Strachan DP, Weil<strong>and</strong> SK. 2010.Ambient particulate pollution <strong>and</strong> <strong>the</strong> world-wide prevalence<strong>of</strong> asthma, rh<strong>in</strong>oconjunctivitis <strong>and</strong> eczema <strong>in</strong> children:Phase one <strong>of</strong> <strong>the</strong> International Study <strong>of</strong> Asthma <strong>and</strong>Allergies <strong>in</strong> Childhood (ISAAC). Occup Environ Med67:293–300.Arimoto R, Kim YJ, Kim YP, Qu<strong>in</strong>n PK, Bates TS,Anderson TL, Gong S, Uno I, Ch<strong>in</strong> M, Huebert BJ, ClarkeAD, Sh<strong>in</strong>ozuka Y, Weber RJ, Anderson JR, Guazzotti SA,181
<strong>Outdoor</strong> <strong>Air</strong> <strong>Pollution</strong> <strong>and</strong> <strong>Health</strong> <strong>in</strong> <strong>the</strong> Develop<strong>in</strong>g <strong>Countries</strong> <strong>of</strong> <strong>Asia</strong>Sullivan RC, Sodeman DA, Pra<strong>the</strong>r KA, Sokolik IN. 2006.Characterization <strong>of</strong> <strong>Asia</strong>n dust dur<strong>in</strong>g ACE-<strong>Asia</strong>. GlobalPlanet Change 52:23–56.Asher MI, Montefort S, Bjorksten B, Lai CK, Strachan DP,Weil<strong>and</strong> SK, Williams H (HRA on Steer<strong>in</strong>g group). 2006.Worldwide time trends <strong>in</strong> <strong>the</strong> prevalence <strong>of</strong> symptoms <strong>of</strong>asthma, allergic rh<strong>in</strong>oconjunctivitis, <strong>and</strong> eczema <strong>in</strong> childhood:ISAAC Phases One <strong>and</strong> Three repeat multicountrycross-sectional surveys. Lancet 368:733–743.<strong>Asia</strong> Pacific Energy Research Centre (APERC). 2007. UrbanTransport Energy Use <strong>in</strong> <strong>the</strong> APEC Region. Institute <strong>of</strong>Energy Economics, Tokyo Japan. www.ieej.or.jp/aperc/2007pdf/2007_Reports/APERC_2007_Urban_Transport.pdf.<strong>Asia</strong>n Development Bank. 2006c. Energy Efficiency <strong>and</strong>Climate Change Considerations for On-Road Transport <strong>in</strong><strong>Asia</strong>. Available from www.cleanairnet.org/caiasia/1412/articles-70656_f<strong>in</strong>alreport.pdf. <strong>Asia</strong>n DevelopmentBank, Manila, Phillip<strong>in</strong>es.<strong>Asia</strong>n Development Bank <strong>and</strong> <strong>the</strong> Clean <strong>Air</strong> Initiative for<strong>Asia</strong>n Cities (CAI-<strong>Asia</strong>) Center. 2006a. Country Syn<strong>the</strong>sisReport on Urban <strong>Air</strong> Quality Management — Thail<strong>and</strong>.Available from www.cleanairnet.org/caiasia/1412/csr/thail<strong>and</strong>.pdf. Accessed January 2008. <strong>Asia</strong>n DevelopmentBank, Manila, Phillip<strong>in</strong>es.<strong>Asia</strong>n Development Bank <strong>and</strong> <strong>the</strong> Clean <strong>Air</strong> Initiative for<strong>Asia</strong>n Cities (CAI-<strong>Asia</strong>) Center. 2006b. Country Syn<strong>the</strong>sisReport on Urban <strong>Air</strong> Quality Management — Vietnam.Available from www.cleanairnet.org/caiasia/1412/csr/vietnam.pdf. Accessed January 2008. <strong>Asia</strong>n DevelopmentBank, Manila, Phillip<strong>in</strong>es.Aunan K, Fang JH, Hu T, Seip HM, Vennemo H. 2006. Climatechange <strong>and</strong> air quality — Measures with co-benefits<strong>in</strong> Ch<strong>in</strong>a. Environ Sci Technol 40:4822–4829.Aunan K, Fang JH, Vennemo H, Oye K, Seip HM. 2004. Cobenefits<strong>of</strong> climate policy — Lessons learned from a study<strong>in</strong> Shanxi, Ch<strong>in</strong>a. Energy Policy 32:567–581.Avol EL, Gauderman WJ, Tan SM, London SJ, Peters JM.2001. Respiratory effects <strong>of</strong> relocat<strong>in</strong>g to areas <strong>of</strong> differ<strong>in</strong>gair pollution levels. Am J Respir Crit Care Med 164:2067–2072.Baek SO, Choi JS, Hwang SM. 1997. A quantitative estimation<strong>of</strong> source contributions to <strong>the</strong> concentrations <strong>of</strong> atmosphericsuspended particulate matter <strong>in</strong> urban, suburban,<strong>and</strong> <strong>in</strong>dustrial areas <strong>of</strong> Korea. Environ Int 23:205–213.Bai X. 2002. Industrial relocation <strong>in</strong> <strong>Asia</strong>: A sound environmentalstrategy? Environment 44:8–21.Balakrishnan K, Ganguli B, Ghosh S, Sankar S, ThanasekaraanV, Rayudu VN, Caussy H. 2010. Short-TermEffects <strong>of</strong> <strong>Air</strong> <strong>Pollution</strong> on Mortality: Results from a Time-Series Analysis <strong>in</strong> Chennai, India. Research Report. <strong>Health</strong>Effects Institute, Boston, MA. In Press.Baldi I, Tessier JF, Kauffmann F, Jacqm<strong>in</strong>-Gadda H, NejjariC, Salamon R. 1999. [Prevalence <strong>of</strong> asthma <strong>and</strong> meanlevels <strong>of</strong> air pollution: Results from <strong>the</strong> French PAARCsurvey.] <strong>Pollution</strong> Atomospherique et Affections RespiratoiresChroniques. Eur Respir J 14:132–138.Barker T, Rosendahl KE. 2000. Ancillary benefits <strong>of</strong> GHGmitigation <strong>in</strong> Europe: SO 2 , NO x <strong>and</strong> PM 10 reductions frompolicies to meet Kyoto targets us<strong>in</strong>g <strong>the</strong> E3ME model <strong>and</strong>EXTERNE valuations. In: Ancillary Benefits <strong>and</strong> Costs <strong>of</strong>Greenhouse Gas Mitigation, Proceed<strong>in</strong>gs <strong>of</strong> an IPCC Co-Sponsored Workshop, March, Organisation for EconomicCooperation <strong>and</strong> Development, Paris.Bascom R, Bromberg PA, Costa DA, Devl<strong>in</strong> R, Dockery DW,Frampton MW, Lambert W, Samet JM, Speizer FE, Utell M.1996. <strong>Health</strong> effects <strong>of</strong> outdoor air pollution. Am J RespirCrit Care Med 153:3–50.Bates MN, Khalakd<strong>in</strong>a A, Pai M, Chang L, Lessa F, SmithKR. 2007. Risk <strong>of</strong> tuberculosis from exposure to tobaccosmoke: A systematic review <strong>and</strong> meta-analysis. ArchIntern Med 167:335–342.Beelen R, Hoek G, van den Br<strong>and</strong>t PA, Goldbohm RA, FischerP, Schouten LJ, Jerrett M, Hughes E, Armstrong B,Brunekreef B. 2008. Long-term effects <strong>of</strong> traffic-related airpollution on mortality <strong>in</strong> a Dutch cohort (NLCS-AIRstudy). Environ <strong>Health</strong> Perspect 116:196–202.Begg CB. 1997. Publication bias <strong>in</strong> meta-analysis: A Bayesi<strong>and</strong>ata-augmentation approach to account for issuesexemplified <strong>in</strong> <strong>the</strong> passive smok<strong>in</strong>g debate. Stat Sci 12:241–244.Begg CB, Berl<strong>in</strong> JA. 1989. Publication bias <strong>and</strong> dissem<strong>in</strong>ation<strong>of</strong> cl<strong>in</strong>ical research. JNCI 81:107–115.Begum BA, Biswas SK, Hopke PK. 2007. Source apportionment<strong>of</strong> air particulate matter by chemical mass balance(CMB) <strong>and</strong> comparison with positive matrix factorization(PMF) model. Aerosol <strong>Air</strong> Qual Res 7:446–468.Begum BA, Biswas SK, Hopke PK. 2008. Assessment <strong>of</strong>trends <strong>and</strong> present ambient concentrations <strong>of</strong> PM 2.2 <strong>and</strong>PM 10 <strong>in</strong> Dhaka, Bangladesh. <strong>Air</strong> Qual Atmos <strong>Health</strong>1:125–133.Begum BA, Biswas SK, Kim E, Hopke PK, KhaliquzzamanM. 2005. Investigation <strong>of</strong> sources <strong>of</strong> atmospheric aerosol at182
HEI International Scientific Oversight Committeea hot spot area <strong>in</strong> Dhaka, Bangladesh. J <strong>Air</strong> Waste ManageAssoc 55:227–240.Begum BA, Kim E, Biswas SK, Hopke PK. 2004. Investigation<strong>of</strong> sources <strong>of</strong> atmospheric aerosol at urban <strong>and</strong> semiurbanareas <strong>in</strong> Bangladesh. Atmos Environ 38:3025–3038.Beij<strong>in</strong>g Environmental Protection Bureau. www.bjepb.gov.cn Accessed January 2008.Bell ML, Davis DL. 2001. Reassessment <strong>of</strong> <strong>the</strong> lethalLondon fog <strong>of</strong> 1952: Novel <strong>in</strong>dicators <strong>of</strong> acute <strong>and</strong> chronicconsequences <strong>of</strong> acute exposure to air pollution. Environ<strong>Health</strong> Perspect 109:389–394.Bell ML, Levy JK, L<strong>in</strong> Z. 2007. The effect <strong>of</strong> s<strong>and</strong>storms<strong>and</strong> air pollution on cause-specific hospital admissions <strong>in</strong>Taipei, Taiwan. Occup Environ Med 65:104–111.Bell ML, McDermott A, Zeger SL, Samet JM, Dom<strong>in</strong>ici F.2004a. Ozone <strong>and</strong> short-term mortality <strong>in</strong> 95 US urbancommunities, 1987–2000. JAMA 292:2372–2378.Bell ML, Samet JM, Dom<strong>in</strong>ici F. 2004b. Time-series studies<strong>of</strong> particulate matter. Annu Rev Public <strong>Health</strong> 25:247–280.Bennett DH, McKone TE, Evans JS, Nazar<strong>of</strong>f WW, MargniMD, Jolliet O, Smith KR. 2002. Def<strong>in</strong><strong>in</strong>g <strong>in</strong>take fraction.Environ Sci Technol 36:206A–211A.Bhanarkar AD, Rao PS, Gajghate DG, Nema P. 2005. Inventory<strong>of</strong> SO 2 , PM <strong>and</strong> toxic metals emissions from <strong>in</strong>dustrialsources <strong>in</strong> Greater Mumbai, India. Atmos Environ39:3851–3864.Bharati V. 1997. All India energy generation & PLF status.Quarterly Journal <strong>of</strong> Central Electricity Authority 19:42–55.Black RE. 2003. Z<strong>in</strong>c deficiency, <strong>in</strong>fectious disease <strong>and</strong>mortality <strong>in</strong> <strong>the</strong> develop<strong>in</strong>g world. Presented at 11th InternationalSymposium on Trace Elements <strong>in</strong> Man <strong>and</strong> Animals,Berkeley, CA. J Nutr 133:1485S–1489S.Braga ALF, Zanobetti A, Schwartz J. 2001. The lag structurebetween particulate air pollution <strong>and</strong> respiratory <strong>and</strong>cardiovascular deaths <strong>in</strong> 10 US cities. J Occup EnvironMed 43:927–933.Brauer M, Hoek G, Smit HA, de Jongste JC, Gerritsen J,Postma DS, Kerkh<strong>of</strong> M, Brunekreef B. 2007. <strong>Air</strong> pollution<strong>and</strong> development <strong>of</strong> asthma, allergy <strong>and</strong> <strong>in</strong>fections <strong>in</strong> abirth cohort. Eur Respir J 29:879–888.Braun-Fahrländer C, Vuille JC, Sennhauser FH, Neu U,Künzle T, Grize L, Gassner M, M<strong>in</strong>der C, Sch<strong>in</strong>dler C,Varonier HS, Wüthrich B. 1997. Respiratory health <strong>and</strong>long-term exposure to air pollutants <strong>in</strong> Swiss schoolchildren.SCARPOL Team. Swiss Study on Childhood Allergy<strong>and</strong> Respiratory Symptoms with Respect to <strong>Air</strong> <strong>Pollution</strong>,Climate <strong>and</strong> Pollen. Am J Respir Crit Care Med 155:1042–1049.Brimblecomble P. 1987. The Big Smoke: A History <strong>of</strong> <strong>Air</strong><strong>Pollution</strong> <strong>in</strong> London S<strong>in</strong>ce Medieval Times. Methuen,London.Bruce N, Rehfuess E, Mehta S, Hutton G, Smith K. 2006.Indoor air pollution. In: Disease Control Priorities <strong>in</strong>Develop<strong>in</strong>g <strong>Countries</strong>, pp. 793–816. Oxford UniversityPress, New York.Brunekreef B, Miller BG, Hurley JF. 2007. The brave newworld <strong>of</strong> lives sacrificed <strong>and</strong> saved, deaths attributed <strong>and</strong>avoided. Epidemiology 18:785–788.Burnett RT, Brook J, Dann T, Delocla C, Philips O, CakmakS, V<strong>in</strong>cent R, Goldberg MS, Krewski D. 2000. Associationbetween particulate- <strong>and</strong> gas-phase components <strong>of</strong> urbanair pollution <strong>and</strong> daily mortality <strong>in</strong> eight Canadian cities.Inhal Toxicol 12:15–39.Burnett RT, Dewanji A, Dom<strong>in</strong>ici F, Goldberg MS, CohenA, Krewski D. 2003. On <strong>the</strong> relationship between timeseriesstudies, dynamic population studies, <strong>and</strong> estimat<strong>in</strong>gloss <strong>of</strong> life due to short-term exposure to environmentalrisks. Environ <strong>Health</strong> Perspect 111:1170–1174.Burtraw D, Krupnick A, Palmer K, Paul A, Toman M,Bloyd C. 2001. Ancillary Benefits <strong>of</strong> Reduced <strong>Air</strong> <strong>Pollution</strong><strong>in</strong> <strong>the</strong> United States from Moderate Greenhouse Gas MitigationPolicies <strong>in</strong> <strong>the</strong> Electricity Sector. Proceed<strong>in</strong>g fromResources for <strong>the</strong> Future, Wash<strong>in</strong>gton, DC.Burtraw D, Krupnick A, Palmer K, Paul A, Toman M,Bloyd C. 2003. Ancillary benefits <strong>of</strong> reduced air pollution<strong>in</strong> <strong>the</strong> US from moderate greenhouse gas mitigation policies<strong>in</strong> <strong>the</strong> electricity sector. J Environ Econ Manage45:650–673.Bussolo M, O'Connor D. 2001. Clear<strong>in</strong>g <strong>the</strong> <strong>Air</strong> <strong>in</strong> India:The Economics <strong>of</strong> Climate Policy with Ancillary Benefits.Organisation for European Cooperation <strong>and</strong> Development,Paris.Cao GL, Zhang XY, Zheng FC. 2006. Inventory <strong>of</strong> blackcarbon <strong>and</strong> organic carbon emissions from Ch<strong>in</strong>a. AtmosEnviron 40:6516–6527.Cao J, Ho MS, Jorgenson DW. 2008. “Co-benefits” <strong>of</strong> GreenhouseGas Mitigation Policies <strong>in</strong> Ch<strong>in</strong>a: An Integrated Top-183
<strong>Outdoor</strong> <strong>Air</strong> <strong>Pollution</strong> <strong>and</strong> <strong>Health</strong> <strong>in</strong> <strong>the</strong> Develop<strong>in</strong>g <strong>Countries</strong> <strong>of</strong> <strong>Asia</strong>Down <strong>and</strong> Bottom-Up Model<strong>in</strong>g Analysis. Proceed<strong>in</strong>gfrom Resources for <strong>the</strong> Future, Wash<strong>in</strong>gton, DC.Cao JJ, Lee SC, Ho KF, Zou SC, Fung K, Li Y, Watson JG,Chow JC. 2004. Spatial <strong>and</strong> seasonal variations <strong>of</strong> atmosphericorganic carbon <strong>and</strong> elemental carbon <strong>in</strong> PearlRiver Delta Region, Ch<strong>in</strong>a. Atmos Environ 38:4447–4456.Census <strong>and</strong> Statistics Department. 2002. Hong Kong PopulationProjections 2002–2031. Demographic Statistics Section,The Government <strong>of</strong> Hong Kong Special Adm<strong>in</strong>istrativeRegion, Hong Kong.Census <strong>and</strong> Statistics Department. 2010. Projected Mid-YearPopulation by Age Group <strong>and</strong> Sex for 2010–2039. The Government<strong>of</strong> <strong>the</strong> Hong Kong Special Adm<strong>in</strong>istrative Region.Available at www.censtatd.gov.hk/products_<strong>and</strong>_services/products/<strong>in</strong>dividual_statistical_tables/<strong>in</strong>dex.jsp. Last updated2010. Accessed September 16, 2010.Census <strong>of</strong> India. 2001. Census <strong>of</strong> India: Metadata <strong>and</strong> briefhighlights on slum population. Office <strong>of</strong> <strong>the</strong> Registrar General& Census Commissioner, New Delhi, India.Center for International Earth Science Information Network(CIESIN) at Columbia University IFPRII, World Bank,Centro Internacional de Agricultura Tropical (CIAT). 2004.Global Rural-Urban Mapp<strong>in</strong>g Project (GRUMP) alpha:GPW with Urban Reallocation (GPW-UR) Population grids.Last updated September 21, 2009. Available fromhttp://sedac.cies<strong>in</strong>.columbia.edu/gpw/. Accessed July 31,2009.Chan CC, Chuang KJ, Chien LC, Chen WJ, Chang WT. 2006.Urban air pollution <strong>and</strong> emergency admissions for cerebrovasculardiseases <strong>in</strong> Taipei, Taiwan. Eur Heart J27:1238–1244.Ch<strong>and</strong>ramouli C. 2003. Slums <strong>in</strong> Chennai: A Pr<strong>of</strong>ile. Proceed<strong>in</strong>gfrom Third International Conference on Environment& <strong>Health</strong>, India (Bunch S, Kumaran V, eds.), pp. 82–88.Chang CC, Lee IM, Tsai SS, Yang CY. 2006. Correlation <strong>of</strong><strong>Asia</strong>n dust storm events with daily cl<strong>in</strong>ic visits for allergicrh<strong>in</strong>itis <strong>in</strong> Taipei, Taiwan. J Toxicol Environ <strong>Health</strong> A69:229–235.Chang CC, Tsai SS, Ho SC, Yang CY. 2005. <strong>Air</strong> pollution<strong>and</strong> hospital admissions for cardiovascular disease <strong>in</strong>Taipei, Taiwan. Environ Res 98:114–119.Chang CH, Hsaio IY, Cheng WL. 2002. [Effect <strong>of</strong> air pollutionon daily cl<strong>in</strong>ic treatments for respiratory <strong>and</strong> cardiovasculardiseases <strong>in</strong> central Taiwan, 1997–1999.] Ch<strong>in</strong> JOccup Med 9:111–120.Chang GQ, Pan XC, Xie XQ, Gao YL. 2004. [Time-seriesanalysis on <strong>the</strong> relationship between air pollution <strong>and</strong>daily mortality <strong>in</strong> Beij<strong>in</strong>g]. Wei Sheng Yan Jiu [J Hyg Res]32:565–568.Chang GQ, Wang LG, Pan XC. 2003b. Study on <strong>the</strong> associationsbetween ambient air pollutant <strong>and</strong> hospital outpatientvisitor emergency room visit <strong>in</strong> Beij<strong>in</strong>g. Ch<strong>in</strong> J SchoolDoctor 17:295–297.Chang YC, Lee HW, Tseng HH. 2007. The formation <strong>of</strong><strong>in</strong>cense smoke. J Aerosol Sci 38:39–51.Changhong C, B<strong>in</strong>gyan W, Q<strong>in</strong>gyan F, Green C, Streets DG.2006. Reductions <strong>in</strong> emissions <strong>of</strong> local air pollutants <strong>and</strong>co-benefits <strong>of</strong> Ch<strong>in</strong>ese energy policy: A Shanghai casestudy. Energy Policy 34:754–762.Chelani AB, Devotta S. 2007. <strong>Air</strong> quality assessment <strong>in</strong>Delhi: Before <strong>and</strong> after CNG as fuel. Environ Monit Assess125:257–263.Chen CH, Chen BH, Wang BY, Huang C, Zhao J, Dai Y, KanHD. 2007. Low-carbon energy policy <strong>and</strong> ambient air pollution<strong>in</strong> Shanghai, Ch<strong>in</strong>a: A health-based economicassessment. Sci Total Environ 373:13–21.Chen CH, Wang BY, Fu QY, Green C, Streets DG. 2006a.Reductions <strong>in</strong> emissions <strong>of</strong> local air pollutants <strong>and</strong> co-benefits<strong>of</strong> Ch<strong>in</strong>ese energy policy: A Shanghai case study.Energy Policy 34:754–762.Chen CH, Xirasagar S, L<strong>in</strong> HC. 2006b. Seasonality <strong>in</strong> adultasthma admissions, air pollutant levels, <strong>and</strong> climate: Apopulation-based study. J Asthma 43:287–292.Chen PC, Lai YM, Wang JD, Yang CY, Hwang JS, Kuo HW,Huang SL, Chan CC. 1998. Adverse effect <strong>of</strong> air pollutionon respiratory health <strong>of</strong> primary school children <strong>in</strong>Taiwan. Environ <strong>Health</strong> Perspect 106:331–336.Chen YS, Sheen PC, Chen ER, Liu YK, Wu TN, Yang CY.2004. Effects <strong>of</strong> <strong>Asia</strong>n dust storm events on daily mortality<strong>in</strong> Taipei, Taiwan. Environ Res 95:151–155.Chen YS, Yang CY. 2005. Effects <strong>of</strong> <strong>Asia</strong>n dust stormevents on daily hospital admissions for cardiovascular disease<strong>in</strong> Taipei, Taiwan. J Toxicol Environ <strong>Health</strong> A68:1457–1464.Chen Z, Chen C, Dong S. 1995. [Epidemiological studieson risk for adverse pregnancy outcomes <strong>in</strong> women neighbor<strong>in</strong>ga petrochemical works]. Zhonghua Yu Fang Yi XueZa Zhi 29:209–212.Chew FT, Goh DY, Ooi BC, Saharom R, Hui JK, Lee BW.1999. Association <strong>of</strong> ambient air-pollution levels with184
HEI International Scientific Oversight Committeeacute asthma exacerbation among children <strong>in</strong> S<strong>in</strong>gapore.Allergy 54:320–329.Chhabra SK, Chhabra P, Rajpal S, Gupta RK. 2001.Ambient air pollution <strong>and</strong> chronic respiratory morbidity<strong>in</strong> Delhi. Arch Environ <strong>Health</strong> 56:58–64.Chhabra SK, Gupta CK, Chhabra P, Rajpal S. 1999. Risk factorsfor development <strong>of</strong> bronchial asthma <strong>in</strong> children <strong>in</strong>Delhi. Ann Allergy Asthma Immunol 83:385–390.Cho B, Choi J, Yum YT. 2000. <strong>Air</strong> pollution <strong>and</strong> hospitaladmissions for respiratory disease <strong>in</strong> certa<strong>in</strong> areas <strong>of</strong>Korea. J Occup <strong>Health</strong> 42:185–191.Choi KU, Paek DM. 1995. Asthma <strong>and</strong> air pollution <strong>in</strong>Korea. Korean J Epidemiol 17:64–75.Chow JC. 1995. Measurement methods to determ<strong>in</strong>e compliancewith ambient air quality st<strong>and</strong>ards for suspendedparticles J <strong>Air</strong> Waste Manage Assoc 45:320–382.Chowdhury Z, Hughes LS, Salmon LG, Cass GR. 2001.Atmospheric particle size <strong>and</strong> composition measurementsto support light ext<strong>in</strong>ction calculations over <strong>the</strong> IndianOcean. J Geophys Res-Atmos 106:28597–28605.Chowdhury Z, Zheng M, Schauer JJ, Sheesley RJ, SalmonLG, Cass GR, Russell AG. 2007. Speciation <strong>of</strong> ambient f<strong>in</strong>eorganic carbon particles <strong>and</strong> source apportionment <strong>of</strong>PM 2.5 <strong>in</strong> Indian cities. J Geophys Res-Atmos 112:D15303.Chue<strong>in</strong>ta W, Hopke PK, Paatero P. 2000. Investigation <strong>of</strong>sources <strong>of</strong> atmospheric aerosol at urban <strong>and</strong> suburban residentialareas <strong>in</strong> Thail<strong>and</strong> by positive matrix factorization.Atmos Environ 34:3319–3329.Cifuentes L, Borja-Aburto VH, Gouveia N, Thurston G,Davis DL. 2001a. Assess<strong>in</strong>g <strong>the</strong> health benefits <strong>of</strong> urban airpollution reductions associated with climate change mitigation(2000–2020): Santiago, Sao Paulo, Mexico City, <strong>and</strong>New York City. Environ <strong>Health</strong> Perspect 109:419–425.Cifuentes L, Borja-Aburto VH, Gouveia N, Thurston G,Davis DL. 2001b. Climate change: Hidden health benefits<strong>of</strong> greenhouse gas mitigation. Science 293:1257–1259.Clancy L, Goodman P, S<strong>in</strong>clair H, Dockery DW. 2002.Effect <strong>of</strong> air-pollution control on death rates <strong>in</strong> Dubl<strong>in</strong>, Irel<strong>and</strong>:An <strong>in</strong>tervention study. Lancet 360:1210–1214.Clean <strong>Air</strong> Initiative for <strong>Asia</strong>n Cities (CAI-<strong>Asia</strong>) Center.2002. Environment <strong>and</strong> health impacts <strong>of</strong> Kathm<strong>and</strong>u'sbrick kilns. Report to Clean Energy Nepal (CEN). Lastupdated September 8, 2009. Available fromwww.cleanairnet.org/caiasia/1412/article-58750.html.Clean <strong>Air</strong> Initiative for <strong>Asia</strong>n Cities (CAI-<strong>Asia</strong>) Center.2004. <strong>Air</strong> Quality Management Capability <strong>in</strong> <strong>Asia</strong>n Cities.Last updated September 7, 2009. Available fromwww.cleanairnet.org/caiasia/1412/article-59072.html.Clean <strong>Air</strong> Initiative for <strong>Asia</strong>n Cities (CAI-<strong>Asia</strong>) Center.2006a. Country Syn<strong>the</strong>sis Report on Urban <strong>Air</strong> QualityManagement: Thail<strong>and</strong>. Draft report. Available fromwww.cleanairnet.org/caiasia/1412/csr/thail<strong>and</strong>.pdf.Clean <strong>Air</strong> Initiative for <strong>Asia</strong>n Cities (CAI-<strong>Asia</strong>) Center.2006b. Summary <strong>of</strong> Country/City Syn<strong>the</strong>sis ReportsAcross <strong>Asia</strong>. <strong>Asia</strong>n Development Bank, Manila, Philipp<strong>in</strong>es.Clean <strong>Air</strong> Initiative for <strong>Asia</strong>n Cities (CAI-<strong>Asia</strong>) Center.2007a. A Roadmap for Cleaner Fuels <strong>and</strong> Vehicles <strong>in</strong> <strong>Asia</strong>.Last updated September 8, 2009. Available fromwww.cleanairnet.org/caiasia/1412/article-70655.html.Clean <strong>Air</strong> Initiative for <strong>Asia</strong>n Cities (CAI-<strong>Asia</strong>) Center.2007b. Comparison <strong>of</strong> particulate matter (PM) st<strong>and</strong>ards <strong>in</strong><strong>Asia</strong>n countries/cities versus WHO, EU <strong>and</strong> USEPA. Lastupdated July 7, 2007. Available from www.cleanairnet.org/caiasia/1412/articles-71889 _PM_st<strong>and</strong>ards.pdf.Clean <strong>Air</strong> Initiative for <strong>Asia</strong>n Cities (CAI-<strong>Asia</strong>) Center.2007c. Emission St<strong>and</strong>ards for New Vehicles (Light Duty).Last updated September 5, 2009. Available from www.cleanairnet.org/caiasia/1412/articles-58969 _new.pdf.Clean <strong>Air</strong> Initiative for <strong>Asia</strong>n Cities (CAI-<strong>Asia</strong>) Center.2008a. <strong>Air</strong> <strong>Pollution</strong>, Poverty <strong>and</strong> <strong>Health</strong> Effects <strong>in</strong> Ho ChiM<strong>in</strong>h City (APPH) Policy Consultation Workshop. Lastupdated September 5, 2009. Available from www.cleanairnet.org/caiasia/1412/articles-72525 _apph.pdf.Clean <strong>Air</strong> Initiative for <strong>Asia</strong>n Cities (CAI-<strong>Asia</strong>) Center.2008b. Clean Fuels for <strong>Asia</strong>. Proceed<strong>in</strong>g from 6th <strong>Asia</strong>nPetroleum Technology Symposium: Improvement <strong>of</strong> FuelQuality <strong>and</strong> Ref<strong>in</strong>ery Environment, Cebu, Philipp<strong>in</strong>es.Susta<strong>in</strong>able Urban Mobility Program <strong>in</strong> <strong>Asia</strong> (SUMA).Available from www.cleanairnet.org/caiasia/1412/article-73460.html. Accessed January 2008.Clean <strong>Air</strong> Initiative for <strong>Asia</strong>n Cities (CAI-<strong>Asia</strong>) Center.2009. Emission St<strong>and</strong>ards for New Vehicles (Light Duty).Last updated September 5, 2009. Available fromwww.cleanairnet.org/caiasia/1412/articles-58969_resource_1.pdf. Accessed June 3, 2010.Co HX, Dung NT, Le HA, An DD, Ch<strong>in</strong>h KV, Oanh NTK.2009. Integrated management strategies for brick kilnemission reduction. Int J Environ Stud 66:113–124.185
<strong>Outdoor</strong> <strong>Air</strong> <strong>Pollution</strong> <strong>and</strong> <strong>Health</strong> <strong>in</strong> <strong>the</strong> Develop<strong>in</strong>g <strong>Countries</strong> <strong>of</strong> <strong>Asia</strong>Cohen AJ, Anderson HR, Ostro B, P<strong>and</strong>ey KD, KrzyzanowskiM, Künzli N, Gutschmidt K, Pope CA III, Romieu I,Samet JM, Smith KR. 2004. Urban air pollution. In: ComparativeQuantification <strong>of</strong> <strong>Health</strong> Risks: Global <strong>and</strong>Regional Burden <strong>of</strong> Disease Attributable to Selected MajorRisk Factors. (Ezzati M, Lopez AD, Rodgers A, Murray CJL,eds.) pp. 1153–1433. World <strong>Health</strong> Organization, Geneva,Switzerl<strong>and</strong>.Cohen AJ, Mehta S. 2007. <strong>Pollution</strong> <strong>and</strong> tuberculosis: <strong>Outdoor</strong>sources. PLoS Med 4:e142.Collaborative Work<strong>in</strong>g Group on <strong>Air</strong> <strong>Pollution</strong>, Poverty,<strong>and</strong> <strong>Health</strong> <strong>in</strong> Ho Chi M<strong>in</strong>h City. 2009. The Effects <strong>of</strong>Short-Term Exposure on Hospital Admissions for AcuteLower Respiratory Infections <strong>in</strong> Young Children <strong>of</strong> Ho ChiM<strong>in</strong>h City. Draft F<strong>in</strong>al Report. <strong>Health</strong> Effects Institute,Boston, MA.Confalonieri U, Menne B, Akhtar R, Ebi KL, Hauengue M,Kovats RS, Revich B, Woodward A. 2007. Climate Change2007: Impacts, Adaptation <strong>and</strong> Vulnerability. Contribution<strong>of</strong> Work<strong>in</strong>g Group II to <strong>the</strong> Fourth Assessment Report <strong>of</strong><strong>the</strong> Intergovernmental Panel on Climate Change. In:Human <strong>Health</strong> (Parry ML, Canziani OF, Palutik<strong>of</strong> JP, v<strong>and</strong>er L<strong>in</strong>den PJ, Hansson CE, eds.). Cambridge UniversityPress, Cambridge, UK.Corbett JJ, W<strong>in</strong>ebrake JJ, Green EH, Kasibhatla P, Eyr<strong>in</strong>g V,Lauer A. 2007. Mortality from ship emissions: A globalassessment. Environ Sci Technol 41:8512–8518.Cropper ML, Simon NB, Alber<strong>in</strong>i A, Sharma PK. 1997. Thehealth effects <strong>of</strong> air pollution <strong>in</strong> Delhi, India. PolicyResearch Work<strong>in</strong>g Paper 1860 (unpublished). The WorldBank Development Research Group, Wash<strong>in</strong>gton DC.Croquant. 2007. Pearl River Delta Area. Posted October 11,2007. Wikipedia. http://en.wikipedia.org/wiki/File:Pearl_River_Delta_Area.png. Accessed June 7, 2010.Dai H, Song W, Gao X, Chen L. 2004. [Study on relationshipbetween ambient PM 10 , PM 2.5 pollution <strong>and</strong> dailymortality <strong>in</strong> a district <strong>in</strong> Shanghai]. Wei Sheng Yan Jiu [JHyg Res] 33:293–297.Dales R, Burnett RT, Smith-Doiron M, Stieb DM, Brook JR.2004. <strong>Air</strong> pollution <strong>and</strong> sudden <strong>in</strong>fant death syndrome.Pediatrics 113:E628–E631.Dan M, Zhuang GS, Li XX, Tao HR, Zhuang YH. 2004. Thecharacteristics <strong>of</strong> carbonaceous species <strong>and</strong> <strong>the</strong>ir sources<strong>in</strong> PM 2.5 <strong>in</strong> Beij<strong>in</strong>g. Atmos Environ 38:3443–3452.Davis DL, Krupnick A, McGlynn G. 2000. Ancillary Benefits<strong>and</strong> Costs <strong>of</strong> Greenhouse Gas Mitigation: An Overview.Proceed<strong>in</strong>g from Workshop on Assess<strong>in</strong>g <strong>the</strong> AncillaryBenefits <strong>and</strong> Costs <strong>of</strong> Greenhouse Gas Mitigation Strategies,Wash<strong>in</strong>gton, DC. Organisation for European Cooperation<strong>and</strong> Development.Department <strong>of</strong> Environment, Bangladesh, Dhaka. www.doe-bd.org. Accessed January 2008.DerSimonian R, Laird N. 1986. Meta-analysis <strong>in</strong> cl<strong>in</strong>icaltrials. Control Cl<strong>in</strong> Trials 7:177–188.Devkota SR, Neupane CP. 1994. Industrial pollution <strong>in</strong>ventory<strong>of</strong> <strong>the</strong> Kathm<strong>and</strong>u Valley <strong>and</strong> Nepal. Industrial <strong>Pollution</strong>Control Management Project, M<strong>in</strong>istry <strong>of</strong> Industry,S<strong>in</strong>gha Durbar, Kathm<strong>and</strong>u, Nepal.Dherani M, Pope D, Mascarenhas M, Smith KR, Weber M,Bruce N. 2008. Indoor air pollution from unprocessedsolid fuel use <strong>and</strong> pneumonia risk <strong>in</strong> children aged underfive years: A systematic review <strong>and</strong> meta-analysis. BullWorld <strong>Health</strong> Organ 86:390–398.Dickers<strong>in</strong> K. 1997. How important is publication bias? Asyn<strong>the</strong>sis <strong>of</strong> available data. AIDS Educ Prev 9:15–21.D<strong>in</strong>g EL, Malik VS. 2008. Convergence <strong>of</strong> obesity <strong>and</strong> highglycemic diet on compound<strong>in</strong>g diabetes <strong>and</strong> cardiovascularrisks <strong>in</strong> moderniz<strong>in</strong>g Ch<strong>in</strong>a: An emerg<strong>in</strong>g publichealth dilemma. Global <strong>Health</strong> 4:4.D'Ippoliti D, Forastiere F, Ancona C, Agabiti N, Fusco D,Michelozzi P, Perucci CA. 2003. <strong>Air</strong> pollution <strong>and</strong> myocardial<strong>in</strong>farction <strong>in</strong> Rome: A case–crossover analysis. Epidemiology14:528–535.Dockery DW, Cunn<strong>in</strong>gham J, Damokosh AI, Neas LM, SpenglerJD, Koutrakis P, Ware JH, Raizenne M, Speizer FE,Koutrakis P. 1996. <strong>Health</strong> effects <strong>of</strong> acid aerosols on NorthAmerican children: Respiratory symptoms. Environ<strong>Health</strong> Perspect 104:500–505.Dockery DW, Pope CA, Xu XP, Spengler JD, Ware JH, FayME, Ferris BG, Speizer FE. 1993. An association betweenair pollution <strong>and</strong> mortality <strong>in</strong> 6 United States cities. N EnglJ Med 329:1753–1759.Dockery DW, Schwartz J, Spengler JD. 1992. <strong>Air</strong> pollution<strong>and</strong> daily mortality–associations with particulates <strong>and</strong>acid aerosols. Environ Res 59:362–373.Dockery DW, Speizer FE, Stram DO, Ware JH, Spengler JD,Ferris BG. 1989. Effects <strong>of</strong> <strong>in</strong>halable particles on respiratoryhealth <strong>of</strong> children. Am J Respir Crit Care Med139:587–594.186
HEI International Scientific Oversight CommitteeDom<strong>in</strong>ici F. 2004. Time-Series Analysis <strong>of</strong> <strong>Air</strong> <strong>Pollution</strong><strong>and</strong> Mortality: A Statistical Review. Research Report 123.<strong>Health</strong> Effects Institute, Boston, MA.Dom<strong>in</strong>ici F, Daniels M, McDermott A, Zeger SL, Samet JM.2003a. Shape <strong>of</strong> <strong>the</strong> exposure–response relation <strong>and</strong> mortalitydisplacement <strong>in</strong> <strong>the</strong> NMMAPS database. In: RevisedAnalyses <strong>of</strong> Time-Series Studies <strong>of</strong> <strong>Air</strong> <strong>Pollution</strong> <strong>and</strong><strong>Health</strong>, pp. 91–96. Special Report. <strong>Health</strong> Effects Institute,Boston, MA.Dom<strong>in</strong>ici F, McDermott A, Zeger SL, Samet JM. 2003b.National maps <strong>of</strong> <strong>the</strong> effects <strong>of</strong> particulate matter on mortality:Explor<strong>in</strong>g geographical variation. Environ <strong>Health</strong>Perspect 111:39–43.Dom<strong>in</strong>ici F, Samet JM, Zeger SL. 2000. Comb<strong>in</strong><strong>in</strong>g evidenceon air pollution <strong>and</strong> daily mortality from <strong>the</strong> 20largest US cities: A hierarchical modell<strong>in</strong>g strategy. J RoyalStat Ser A 163:263–284.Dom<strong>in</strong>ici F, Sheppard L, Clyde M. 2003c. <strong>Health</strong> effects <strong>of</strong>air pollution: A statistical review. Int Stat Rev 71:243–276.Dong JW, Xu X, Chen Y, Dockery DW, Jiang JY. 1995. Relationshipbetween air pollution <strong>and</strong> daily mortality <strong>in</strong>urban district <strong>of</strong> Beij<strong>in</strong>g. Wei Sheng Yan Jiu [J Hyg Res]24:212–214.Dong JW, Xu XP, Dockery DW. 1996. [Association <strong>of</strong> airpollution with unscheduled outpatient visits <strong>in</strong> Beij<strong>in</strong>gLongfu Hospital, 1991]. Zhonghua Liu X<strong>in</strong>g B<strong>in</strong>g Xue ZaZhi 17:13–16.Duan FK, Liu XD, Yu T, Cachier H. 2004. Identification <strong>and</strong>estimate <strong>of</strong> biomass burn<strong>in</strong>g contribution to <strong>the</strong> urbanaerosol organic carbon concentrations <strong>in</strong> Beij<strong>in</strong>g. AtmosEnviron 38:1275–1282.Duki MIZ, Sudarmadi S, Suzuki S, Kawada T, Tri-TugaswatiA. 2003. Effect <strong>of</strong> air pollution on respiratory health<strong>in</strong> Indonesia <strong>and</strong> its economic cost. Arch Environ <strong>Health</strong>58:135–143.Egger M, Smith GD, M S, M<strong>in</strong>der C. 1997. Bias <strong>in</strong> metaanalysisdetected by a simple, graphical test. Br Med J315:629–634.Emmanuel SC. 2000. Impact to lung health <strong>of</strong> haze fromforest fires: The S<strong>in</strong>gapore experience. Respirology 5:175–182.Enstrom JE. 2005. F<strong>in</strong>e particulate air pollution <strong>and</strong> totalmortality among elderly Californians, 1973–2002. InhalToxicol 17:803–816.Environmental Management Bureau, Department <strong>of</strong> Environmental<strong>and</strong> Natural Resources, 2001 to 2002. 2002.Regional state <strong>of</strong> <strong>the</strong> brown environment reports for 1995–2001. Regions 1–13, Cordillera Autonomous Region <strong>and</strong>National Capital Region.European Commission. 2005. xternE: Externalities <strong>of</strong>Energy Methodology 2005 Update. European Communities,Luxembourg.Environmental Protection Agency, Taipei, Taiwan.www.epa.gov.tw/en/. Last updated October 29, 2009.Evans JS, Tosteson T, K<strong>in</strong>ney PL. 1984. Cross-sectionalmortality studies <strong>in</strong> air pollution risk assessment. EnvironInt 10:55–83.Ezzati M, Lopez AD, Rodgers A, V<strong>and</strong>er Hoorn S, MurrayCJL, <strong>the</strong> Comparative Risk Assessment Collaborat<strong>in</strong>gGroup. 2002. Selected major risk factors <strong>and</strong> global <strong>and</strong>regional burden <strong>of</strong> disease. Lancet 360:1347–1360.Ezzati M, Rodgers A, Lopez A, Murray C, eds. 2004. ComparativeQuantification <strong>of</strong> <strong>Health</strong> Risks: Global <strong>and</strong>Regional Burden <strong>of</strong> Disease Attributable to Selected MajorRisk Factors. World <strong>Health</strong> Organization, Geneva, Switzerl<strong>and</strong>.Ezzati M, V<strong>and</strong>er Hoorn S, Lawes CMM, Leach R, JamesWPT, Lopez AD, Rodgers A, Murray CJL. 2005. Reth<strong>in</strong>k<strong>in</strong>g<strong>the</strong> "diseases <strong>of</strong> affluence" paradigm: Global patterns <strong>of</strong>nutritional risks <strong>in</strong> relation to economic development. PLoSMed 2:e133. doi: 10.1371/journal.pmed.0020133.Fairley D. 1990. The relationship <strong>of</strong> daily mortality to suspendedparticulates <strong>in</strong> Santa Clara country, 1980–1986.Environ <strong>Health</strong> Perspect 89:159–168.Fertilizer Association <strong>of</strong> India (FAI). 1998. Fertiliser Statistics— 1997–98. Last updated September 4, 2009. Availablefrom www.fad<strong>in</strong>ap.org/<strong>in</strong>dia/pub.htm. AccessedAugust 4, 2008.Fletcher C, Peto R. 1977. The natural history <strong>of</strong> chronic airflowobstruction. Br Med J 1:1645–1648.Florig HK, Sun GD, Song GJ. 2002. Evolution <strong>of</strong> particulateregulation <strong>in</strong> Ch<strong>in</strong>a — Prospects <strong>and</strong> challenges <strong>of</strong> exposure-basedcontrol. Chemosphere 49:1163–1174.Forster P, Ramaswamy V, Artaxo P, Berntsen T, Betts R,Fahey DW, Haywood J, Lean J, Lowe DC, Myhre G, NgangaJ, Pr<strong>in</strong>n R, Raga G, Schulz M, Van Dorl<strong>and</strong> R. 2007. Contribution<strong>of</strong> Work<strong>in</strong>g Group I to <strong>the</strong> Fourth AssessmentReport <strong>of</strong> <strong>the</strong> Intergovernmental Panel on Climate Change.In: Climate Change 2007: The Physical Science Basis187
<strong>Outdoor</strong> <strong>Air</strong> <strong>Pollution</strong> <strong>and</strong> <strong>Health</strong> <strong>in</strong> <strong>the</strong> Develop<strong>in</strong>g <strong>Countries</strong> <strong>of</strong> <strong>Asia</strong>(Solomon S, Q<strong>in</strong> D, Mann<strong>in</strong>g M, Chen Z, Marquis M,Averyt KB, Tignor M, Miller HL, eds.). Cambridge UniversityPress, Cambridge, UK <strong>and</strong> New York, NY, USA.Friedl<strong>and</strong>er SK. 1973. Chemical element balances <strong>and</strong>identification <strong>of</strong> air pollution sources. Environ Sci Technol7:235–240.Frontier Research Center for Global Change. 2007.Regional Emissions Inventory <strong>in</strong> <strong>Asia</strong> (REAS), version 1.1.Last updated September 27, 2007. Available fromwww.jamstec.go.jp/frcgc/research/p3/reas_c.html>.Accessed November 9, 2007.Fung YS, Wong LWY. 1995. Apportionment <strong>of</strong> air pollutionsources by receptor models <strong>in</strong> Hong Kong. AtmosEnviron 29:2041–2048.Gao J, Xu XP, Chen YD, Dockery DW, Long DH, Liu HX,Jiang JY. 1993. Relationship between air pollution <strong>and</strong>mortality <strong>in</strong> Dongcheng <strong>and</strong> Xicheng Districts, Beij<strong>in</strong>g [<strong>in</strong>Ch<strong>in</strong>ese]. Zhonghua Yu Fang Yi Xue Za Zhi 27:340–343.Garbaccio RF, Ho MS, Jorgenson DW. 2000. The healthbenefits <strong>of</strong> controll<strong>in</strong>g carbon emissions <strong>in</strong> Ch<strong>in</strong>a. Proceed<strong>in</strong>gfrom Workshop on Assess<strong>in</strong>g <strong>the</strong> Ancillary Benefits<strong>and</strong> Costs <strong>of</strong> Greenhouse Gas Mitigation Strategies,Wash<strong>in</strong>gton, D.C. Organization for Economic Cooperation<strong>and</strong> Development.Gauderman WJ, Avol E, Gillil<strong>and</strong> F, Vora H, Thomas D,Berhane K, McConnell R, Kuenzli N, Lurmann F, RappaportE, Margolis H, Bates D, Peters J. 2004. The effect <strong>of</strong> airpollution on lung development from 10 to 18 years <strong>of</strong> age.N Engl J Med 351:1057–1067.Gauderman WJ, Avol E, Lurmann F, Kuenzli N, Gillil<strong>and</strong> F,Peters J, McConnell R. 2005. Childhood asthma <strong>and</strong> exposureto traffic <strong>and</strong> nitrogen dioxide. Epidemiology 16:737–743.Gauderman WJ, Vora H, McConnell R, Berhane K, Gillil<strong>and</strong>F, Thomas D, Lurmann F, Avoli E, Kuenzli N, JerrettM, Peters J. 2007. Effect <strong>of</strong> exposure to traffic on lungdevelopment from 10 to 18 years <strong>of</strong> age: A cohort study.Lancet (North American Edition) 369:571–577.Gehrig R, Buchmann B. 2003. Characteris<strong>in</strong>g seasonal variations<strong>and</strong> spatial distribution <strong>of</strong> ambient PM 10 <strong>and</strong> PM 2.5concentrations based on long-term Swiss monitor<strong>in</strong>g data.Atmos Environ 37:2571–2580.Gehr<strong>in</strong>g U, Cyrys J, Sedlmeir G, Brunekreef B, Bell<strong>and</strong>er T,Fischer P, Bauer CP, Re<strong>in</strong>hardt D, Wichmann HE, He<strong>in</strong>richJ. 2002. Traffic-related air pollution <strong>and</strong> respiratory healthdur<strong>in</strong>g <strong>the</strong> first 2 yrs <strong>of</strong> life. Eur Respir J 19:690–698.Ghaffar A, Reddy S, S<strong>in</strong>ghi M. 2004. Burden <strong>of</strong> non-communicablediseases <strong>in</strong> South <strong>Asia</strong>. Br Med J 328:807–810.Gill<strong>in</strong>gham K, Newell R, Palmer K. 2004. The effectiveness<strong>and</strong> cost <strong>of</strong> energy efficiency programs. Presented atResources for <strong>the</strong> Future, Wash<strong>in</strong>gton, DC.Gl<strong>in</strong>ianaia SV, Rank<strong>in</strong> J, Bell R, Pless-Mulloli T, Howel D.2004a. Does particulate air pollution contribute to <strong>in</strong>fantdeath? A systematic review. Environ <strong>Health</strong> Perspect112:1365–1370.Gl<strong>in</strong>ianaia SV, Rank<strong>in</strong> J, Bell R, Pless-Mulloli T, Howel D.2004b. Particulate air pollution <strong>and</strong> fetal health: A systematicreview <strong>of</strong> <strong>the</strong> epidemiologic evidence. Epidemiology15:36–45.Goh KT, Lun KC, Chong YM, Ong TC, Tan JL, Chay SO,Goh KT, Lun KC, Chong YM, Ong TC, Tan JL, Chay SO.1986. Prevalence <strong>of</strong> respiratory illnesses <strong>of</strong> school children<strong>in</strong> <strong>the</strong> <strong>in</strong>dustrial, urban <strong>and</strong> rural areas <strong>of</strong> S<strong>in</strong>gapore. TropGeogr Med 38:344–350.Goodman PG, Dockery DW, Clancy L. 2004. Cause-specificmortality <strong>and</strong> <strong>the</strong> extended effects <strong>of</strong> particulate pollution<strong>and</strong> temperature exposure. Environ <strong>Health</strong> Perspect112:179–185.Götschi T, He<strong>in</strong>rich J, Sunyer J, Künzli N. 2008. Long-termeffects <strong>of</strong> ambient air pollution on lung function. Epidemiology19:690–701.Gouveia N, Bremner SA, Novaes HMD. 2004. Associationbetween ambient air pollution <strong>and</strong> birth weight <strong>in</strong> SaoPaulo, Brazil. J Epidemiol Community <strong>Health</strong> 58:11–17.Government <strong>of</strong> Hong Kong. 2008. API: <strong>Air</strong> <strong>Pollution</strong> Index(last updated 10/29/09). Environmental Protection Department,Special Adm<strong>in</strong>istrative Region, <strong>Air</strong> Quality Monitor<strong>in</strong>gNetwork, Hong Kong. www.epd-asg.gov.hk/.Accessed 01/2008.Government <strong>of</strong> India. 2008. National <strong>Air</strong> Quality Monitor<strong>in</strong>gProgramme (last updated 10/29/09). M<strong>in</strong>istry <strong>of</strong>Environment <strong>and</strong> Forests, Central <strong>Pollution</strong> Control Board,Mumbai, Delhi. www.cpcb.nic.<strong>in</strong>/air.php. Accessed01/2008.Goyal A, Yusuf S. 2006. The burden <strong>of</strong> cardiovascular disease<strong>in</strong> <strong>the</strong> Indian subcont<strong>in</strong>ent. Indian J Med Res124:235–244.Guo YL, L<strong>in</strong> YC, Sung FC, Huang SL, Ko YC, Lai JS, Su HJ,Shaw CK, L<strong>in</strong> RS, Dockery DW. 1999. Climate, traffic-relatedair pollutants, <strong>and</strong> asthma prevalence <strong>in</strong> middle-school children<strong>in</strong> Taiwan. Environ <strong>Health</strong> Perspect 107:1001–1006.188
HEI International Scientific Oversight CommitteeGupta D, Aggarwal AN, J<strong>in</strong>dal SK. 2002. Pulmonary effects<strong>of</strong> passive smok<strong>in</strong>g: The Indian experience. TobaccoInduced Dis 1:127–134.Gupta D, B<strong>of</strong>fetta P, Gaborieau V, J<strong>in</strong>dal SK. 2001a. Riskfactors <strong>of</strong> lung cancer <strong>in</strong> Ch<strong>and</strong>igarh, India. Indian J MedRes 113:142–150.Gupta PK, Prasad VK, Kant Y, Sharma C, Ghosh AB,Sharma MC, Sarkar AK, Ja<strong>in</strong> SL, Tripathi OP, Sharma RC,Badar<strong>in</strong>ath KVS, Mitra AP. 2001b. Study <strong>of</strong> trace gases <strong>and</strong>aerosol emissions due to biomass burn<strong>in</strong>g at shift<strong>in</strong>g cultivationsites <strong>in</strong> East Godavari District (Andhra Pradesh)dur<strong>in</strong>g INDOEX IFP-99. Curr Sci 80:186–196.Gustafsson O, Krusa M, Zencak Z, Sheesley RJ, Granat L,Engstrom E, Praveen PS, Rao PSP, Leck C, Rodhe H. 2009.Brown clouds over South <strong>Asia</strong>: Biomass or fossil fuel combustion?Science 323:495–498.Ha EH, Hong YC, Lee BE, Woo BH, Schwartz J, ChristianiDC. 2001. Is air pollution a risk factor for low birth weight<strong>in</strong> Seoul? Epidemiology 12:643–648.Ha EH, Lee JT, Kim H, Hong YC, Lee BE, Park HS, ChristianiDC. 2003. Infant susceptibility <strong>of</strong> mortality to air pollution<strong>in</strong> Seoul, South Korea. Pediatrics 111:284–290.Ha<strong>in</strong>es A, Kovats RS, Campbell-Lendrum D, Corvalan C.2006. Climate change <strong>and</strong> health: Impacts, vulnerability,<strong>and</strong> mitigation. Lancet 367:2101–2109.Han JS, Moon KJ, Kim YJ. 2006. Identification <strong>of</strong> potentialsources <strong>and</strong> source regions <strong>of</strong> f<strong>in</strong>e ambient particles measuredat Gosan background site <strong>in</strong> Korea us<strong>in</strong>g advancedhybrid receptor model comb<strong>in</strong>ed with positive matrix factorization.J Geophys Res 111, D22217, doi:10.1029/2005JD006577.Hansen JE. 2002. <strong>Air</strong> <strong>Pollution</strong> as a Climate Forc<strong>in</strong>g. GoddardInstitute for Space Sciences, Honolulu, HI.Hao JM, Wang LT. 2005. Improv<strong>in</strong>g urban air quality <strong>in</strong>Ch<strong>in</strong>a: Beij<strong>in</strong>g case study. J <strong>Air</strong> Waste Manage Assoc55:1298–1305.Harrison RM. 2006. Sources <strong>of</strong> air pollution. In: <strong>Air</strong>Quality Guidel<strong>in</strong>es Global Update 2005, pp. 9–30. World<strong>Health</strong> Organization, Regional Office for Europe, Copenhagen.He KB, Yang FM, Ma YL, Zhang Q, Yao XH, Chan CK,Cadle S, Chan T, Mulawa P. 2001. The characteristics <strong>of</strong>PM 2.5 <strong>in</strong> Beij<strong>in</strong>g, Ch<strong>in</strong>a. Atmos Environ 35:4959–4970.He QC, Lioy PJ, Wilson WE, Chapman RS. 1993. Effects <strong>of</strong>air pollution on children's pulmonary function <strong>in</strong> urban<strong>and</strong> suburban areas <strong>of</strong> Wuhan, People's Republic <strong>of</strong> Ch<strong>in</strong>a.Arch Environ <strong>Health</strong> 48:382–391.He Y, Uno I, Wang Z, Ohara T, Sugirnoto N, Shimizu A,Richter A, Burrows JP. 2007. Variations <strong>of</strong> <strong>the</strong> <strong>in</strong>creas<strong>in</strong>gtrend <strong>of</strong> tropospheric NO 2 over central east Ch<strong>in</strong>a dur<strong>in</strong>g<strong>the</strong> past decade. Atmos Environ 41:4865–4876.<strong>Health</strong> Effects Institute. 2003. Revised Analyses <strong>of</strong> Time-Series Studies <strong>of</strong> <strong>Air</strong> <strong>Pollution</strong> <strong>and</strong> <strong>Health</strong>. Special Report.<strong>Health</strong> Effects Institute, Boston, MA.<strong>Health</strong> Effects Institute. 2008. Public <strong>Health</strong> <strong>and</strong> <strong>Air</strong> <strong>Pollution</strong><strong>in</strong> <strong>Asia</strong>: Science Access on <strong>the</strong> Net (PAPA–SAN). Databaseavailable at www.heal<strong>the</strong>ffects.org/<strong>Asia</strong>/papasan-home.htm. Last updated March 2008.<strong>Health</strong> Effects Institute. 2009. Request for Applications.Spr<strong>in</strong>g 2009 Research Agenda. Accessed August 25, 2010.Available from www.heal<strong>the</strong>ffects.org/RFA/RFASpr<strong>in</strong>g2009.pdf. Last updated May 2009. <strong>Health</strong> Effects Institute,Boston, MA.Hedley AJ, Wong CM, Thach TQ, Ma S, Lam TH, AndersonHR. 2002. Cardiorespiratory <strong>and</strong> all-cause mortality afterrestrictions on sulphur content <strong>of</strong> fuel <strong>in</strong> Hong Kong: An<strong>in</strong>tervention study. Lancet 360:1646–1652.HEI International Scientific Oversight Committee. 2004.<strong>Health</strong> Effects <strong>of</strong> <strong>Outdoor</strong> <strong>Air</strong> <strong>Pollution</strong> <strong>in</strong> Develop<strong>in</strong>g<strong>Countries</strong> <strong>of</strong> <strong>Asia</strong>: A Literature Review. Special Report 15.<strong>Health</strong> Effects Institute, Boston, MA.HEI Public <strong>Health</strong> <strong>and</strong> <strong>Air</strong> <strong>Pollution</strong> <strong>in</strong> <strong>Asia</strong>. 2006. PAPA–SAN Literature Review Manual. Last updated March 2008.Available from www.heal<strong>the</strong>ffects.org/<strong>Asia</strong>/papasanmethods.htm.HEI Public <strong>Health</strong> <strong>and</strong> <strong>Air</strong> <strong>Pollution</strong> <strong>in</strong> <strong>Asia</strong> Program.2010. Public <strong>Health</strong> <strong>and</strong> <strong>Air</strong> <strong>Pollution</strong> <strong>in</strong> <strong>Asia</strong> (PAPA):Coord<strong>in</strong>ated Studies <strong>of</strong> Short-Term Exposure to <strong>Air</strong> <strong>Pollution</strong><strong>and</strong> Daily Mortality <strong>in</strong> Four Cities. Research Report154. <strong>Health</strong> Effects Institute, Boston, MA.He<strong>in</strong>rich J, Wichmann HE. 2004. Traffic related pollutants<strong>in</strong> Europe <strong>and</strong> <strong>the</strong>ir effect on allergic disease. Curr Op<strong>in</strong>Allergy Cl<strong>in</strong> Immunol 4:341–348.Hien PD, B<strong>in</strong>h NT, Truong Y, Ngo NT. 1999. Temporal variations<strong>of</strong> source impacts at <strong>the</strong> receptor, as derived from airparticulate monitor<strong>in</strong>g data <strong>in</strong> Ho Chi M<strong>in</strong>h City, Vietnam.Atmos Environ 33:3133–3142.Hien PD, B<strong>in</strong>h NT, Truong Y, Ngo NT, Sieu LN. 2001. Comparativereceptor model<strong>in</strong>g study <strong>of</strong> TSP, PM 2 <strong>and</strong> PM 2–10<strong>in</strong> Ho Chi M<strong>in</strong>h City: <strong>Asia</strong>. Atmos Environ 35:2669–2678.189
<strong>Outdoor</strong> <strong>Air</strong> <strong>Pollution</strong> <strong>and</strong> <strong>Health</strong> <strong>in</strong> <strong>the</strong> Develop<strong>in</strong>g <strong>Countries</strong> <strong>of</strong> <strong>Asia</strong>Ho Chi M<strong>in</strong>h City Environmental Protection Agency.Department <strong>of</strong> Natural Resources <strong>and</strong> Environment,Department <strong>of</strong> Environmental Protection (last updated10/29/09). www.hepa.gov.vn/. Accessed 01/2008.Ho WC, Hartley WR, Myers L, L<strong>in</strong> MH, L<strong>in</strong> YS, Lien CH,L<strong>in</strong> RS. 2007. <strong>Air</strong> pollution, wea<strong>the</strong>r, <strong>and</strong> associated riskfactors related to asthma prevalence <strong>and</strong> attack rate.Environ Res 104:402–409.Hoek G, Brunekreef B, Goldbohm S, Fischer P, van denBr<strong>and</strong>t PA. 2002. Association between mortality <strong>and</strong> <strong>in</strong>dicators<strong>of</strong> traffic-related air pollution <strong>in</strong> <strong>the</strong> Ne<strong>the</strong>rl<strong>and</strong>s: Acohort study. Lancet 360:1203–1209.Honda Y, Nitta H, Ono M. 2003. Low level carbon monoxide<strong>and</strong> mortality <strong>of</strong> persons aged 65 or older <strong>in</strong> Tokyo,Japan, 1976–1990. J <strong>Health</strong> Sci 49:454–458.Hong CY, Chia SE, Widjaja D, Saw SM, Lee J, Munoz C,Koh D, Hong CY, Chia SE, Widjaja D, Saw SM, Lee J,Munoz C, Koh D. 2004a. Prevalence <strong>of</strong> respiratory symptoms<strong>in</strong> children <strong>and</strong> air quality by village <strong>in</strong> rural Indonesia.J Occup Environ Med 46:1174–1179.Hong SJ, Lee MS, Sohn MH, Shim JY, Han YS, Park KS,Ahn YM, Son BK, Lee HB. 2004b. Self-reported prevalence<strong>and</strong> risk factors <strong>of</strong> asthma among Korean adolescents: 5-year follow-up study, 1995–2000. Cl<strong>in</strong> Exp Allergy34:1556–1562.Hong YC, Lee JT, Kim H, Ha EH, Schwartz J, Christiani DC.2002a. Effects <strong>of</strong> air pollutants on acute stroke mortality.Environ <strong>Health</strong> Perspect 110:187–191.Hong YC, Lee JT, Kim H, Kwon HJ. 2002b. <strong>Air</strong> pollution: Anew risk factor <strong>in</strong> ischemic stroke mortality. Stroke33:2165–2169.Hong YC, Leem JH, Ha EH. 1999a. <strong>Air</strong> pollution <strong>and</strong> dailymortality <strong>in</strong> Inchon, Korea. J Korean Med Sci 14:239–244.Hong YC, Leem JH, Ha EH, Christiani DC. 1999b. PM(10)exposure, gaseous pollutants, <strong>and</strong> daily mortality <strong>in</strong>Inchon, South Korea. Environ <strong>Health</strong> Perspect 107:873–878.Hong YC, Leem JH, Lee KH, Park DH, Jang JY, Kim ST, HaEH. 2005. Exposure to air pollution <strong>and</strong> pulmonary function<strong>in</strong> university students. Int Arch Occup Environ <strong>Health</strong>78:132–138.Hopke PK. 2003. Recent developments <strong>in</strong> receptor model<strong>in</strong>g.J Chemometr 17:255–265.Hopke PK, Cohen DD, Begum BA, Biswas SK, Ni BF,P<strong>and</strong>it GG, Santoso M, Chung YS, Davy P, Markwitz A,Waheed S, Siddique N, Santos FL, Pabroa PCB, SeneviratneMCS, Wimolwattanapun W, Bunprapob S, Vuong TB,Hien PD, Markowicz A. 2008. Urban air quality <strong>in</strong> <strong>the</strong><strong>Asia</strong>n region. Sci Total Environ 404:103–112.Hsieh KH, Shen JJ. 1988. Prevalence <strong>of</strong> childhood asthma<strong>in</strong> Taipei, Taiwan <strong>and</strong> o<strong>the</strong>r <strong>Asia</strong>n Pacific countries. JAsthma 25:73–82.Hsiue TR, Lee SS, Chen HI. 1991. Effects <strong>of</strong> air pollutionresult<strong>in</strong>g from wire reclamation <strong>in</strong>c<strong>in</strong>eration on pulmonaryfunction <strong>in</strong> children. Chest 100:698–702.Hunsicker MD, Crockett TR, Labode BMA. 1996. An overview<strong>of</strong> <strong>the</strong> municipal waste <strong>in</strong>c<strong>in</strong>eration <strong>in</strong>dustry <strong>in</strong> <strong>Asia</strong><strong>and</strong> <strong>the</strong> former Soviet Union. J Hazard Mater 47:31–42.Hwang BF, Lee YL, L<strong>in</strong> YC, Jaakkola JJK, Guo YL. 2005a.Traffic related air pollution as a determ<strong>in</strong>ant <strong>of</strong> asthmaamong Taiwanese school children. Thorax 60:467–473.Hwang JS, Chan CC. 2002. Effects <strong>of</strong> air pollution on dailycl<strong>in</strong>ic visits for lower respiratory tract illness. Am J Epidemiol155:1–10.Hwang JS, Chen YJ, Wang JD, Lai YM, Yang CY, Chan CC.2000. Subject-doma<strong>in</strong> approach to <strong>the</strong> study <strong>of</strong> air pollutioneffects on schoolchildren's illness absence. Am J Epidemiol152:67–74.Hwang SS, Cho SH, Kwon HJ. 2005b. [Effects <strong>of</strong> <strong>the</strong> severe<strong>Asia</strong>n dust events on daily mortality dur<strong>in</strong>g <strong>the</strong> spr<strong>in</strong>g <strong>of</strong>2002, <strong>in</strong> Seoul, Korea]. J Prev Med Public <strong>Health</strong> 38:197–202.Im HJ, Lee SY, Yun KJ, Ju YS, Kang DH, Cho SH. 2000. Acase–crossover study between air pollution <strong>and</strong> hospitalemergency room visits by asthma attack. Korean J OccupEnviron Med 12:249–257.Imai M, Yoshida K, Tomita Y, et al. 1980. A change <strong>in</strong> airpollution <strong>and</strong> its <strong>in</strong>fluence on <strong>the</strong> human body <strong>in</strong> YokkaichiCity: On <strong>the</strong> prevalence rate <strong>of</strong> respiratory symptoms.Mie Med J 30:129–138.Ingle ST, Pachp<strong>and</strong>e BG, Wagh ND, Patel VS, Attarde SB.2005. Exposure to vehicular pollution <strong>and</strong> respiratoryimpairment <strong>of</strong> traffic policemen <strong>in</strong> Jalgaon city, India. Ind<strong>Health</strong> 43:656–662.Intergovernmental Panel on Climate Change (IPCC). 2007.Work<strong>in</strong>g Group I: The Physical Science Basis, Summaryfor Policy Makers. Fourth Assessment Report <strong>of</strong> <strong>the</strong> IntergovernmentalPanel on Climate Change. IPCC-World MeteorologicalOrganization. Geneva, Switzerl<strong>and</strong>.190
HEI International Scientific Oversight CommitteeInternational Energy Agency. 2007. Energy Balances <strong>of</strong>Non-OECD <strong>Countries</strong> 2004–2005. 2007 Edition. InternationalEnergy Agency, Paris, France.Jakob M. 2006. Marg<strong>in</strong>al costs <strong>and</strong> co-benefits <strong>of</strong> energyefficiency <strong>in</strong>vestments: The case <strong>of</strong> <strong>the</strong> Swiss residentialsector. Energ Policy 34:171–187.Janes H, Sheppard L, Lumley T. 2005. Case–crossover analyses<strong>of</strong> air pollution exposure data: Referent selectionstrategies <strong>and</strong> <strong>the</strong>ir implications for bias. Epidemiology16:717–726.Jang AS, Kim BY, Lee CH, Park JS, Lee JH, Park SW, KimDJ, Park CS. 2006. Hospital visits <strong>and</strong> admissions <strong>in</strong>patients with asthma, COPD, <strong>and</strong> cardiovascular diseasesaccord<strong>in</strong>g to air pollutants. J Asthma Allergy Cl<strong>in</strong>Immunol 26:233–238.Jang AS, Yeum CH, Son MH. 2003. Epidemiologic evidence<strong>of</strong> a relationship between airway hyperresponsiveness<strong>and</strong> exposure to polluted air. Allergy 58:585–588.Janssen N, Mehta S. 2006. Human exposure to air pollution.In: <strong>Air</strong> Quality Guidel<strong>in</strong>es Global Update 2005.World <strong>Health</strong> Organization, Geneva, Switzerl<strong>and</strong>.Jerrett M, Burnett RT, Brook J, Kanaroglou P, Giovis C,F<strong>in</strong>kelste<strong>in</strong> N, Hutchison B. 2004. Do socioeconomic characteristicsmodify <strong>the</strong> short term association between airpollution <strong>and</strong> mortality? Evidence from a zonal time series<strong>in</strong> Hamilton, Canada. J Epidemiol Community <strong>Health</strong>58:31–40.Jerrett M, Burnett RT, Ma RJ, Pope CA, Krewski D, NewboldKB, Thurston G, Shi YL, F<strong>in</strong>kelste<strong>in</strong> N, Calle EE,Thun MJ. 2005. Spatial analysis <strong>of</strong> air pollution <strong>and</strong> mortality<strong>in</strong> Los Angeles. Epidemiology 16:727–736.Jetter JJ, Guo ZS, McBrian JA, Flynn MR. 2002. Characterization<strong>of</strong> emissions from burn<strong>in</strong>g <strong>in</strong>cense. Sci TotalEnviron 295:51–67.J<strong>in</strong> L, Q<strong>in</strong> Y, Xu Z. 2000. [Relationship between air pollution<strong>and</strong> acute <strong>and</strong> chronic respiratory disease <strong>in</strong> Benxi,Ch<strong>in</strong>a]. Ch<strong>in</strong>ese J Environ <strong>Health</strong> 17:268–270.J<strong>in</strong> L, Wang S, Q<strong>in</strong> Y, Ren C, Xu Z, Ren L, Li J, Sha F, ChenBH, Kjellstrom T. 1999. [Association between air pollution<strong>and</strong> mortality <strong>in</strong> Benxi, Ch<strong>in</strong>a]. Ch<strong>in</strong>ese J Public <strong>Health</strong>15:211–212.J<strong>in</strong>dal SK. 2007. Bronchial asthma: The Indian scene. CurrOp<strong>in</strong> Pulm Med 13:8–12.J<strong>in</strong>dal SK, Aggarwal AN, Gupta D. 2001. A review <strong>of</strong> populationstudies from India to estimate national burden <strong>of</strong>chronic obstructive pulmonary disease <strong>and</strong> its associationwith smok<strong>in</strong>g. Indian J Chest Dis Allied Sci 43:139–147.Joh S, Nam Y, Shim S, Sung J, Sh<strong>in</strong> YC. 2001. Ancillarybenefits due to greenhouse gas mitigation, 2000–2020 —International co-control analysis program <strong>of</strong> Korea. IntegratedEnvironmental Strategies, Korea Environment Institute,Seoul, Korea.Johnston IDA, Strachan DP, Anderson HR. 1998. Effect <strong>of</strong>pneumonia <strong>and</strong> whoop<strong>in</strong>g cough <strong>in</strong> childhood on adultlung function. N Engl J Med 338:581–587.Joshi P, Islam S, Pais P, Reddy S, Dorairaj P, Kazmi K,P<strong>and</strong>ey MR, Hague S, Mendis S, Rangarajan S, Yusuf S.2007. Risk factors for early myocardial <strong>in</strong>farction <strong>in</strong> South<strong>Asia</strong>ns compared with <strong>in</strong>dividuals <strong>in</strong> o<strong>the</strong>r countries.JAMA 297:286–294.Ju YS, Cho SH. 2001. Effect <strong>of</strong> air pollution on emergencyroom visits for asthma: A time series analysis. Korean JPrev Med 34:61–72.Kagamimori S, Katoh T, Naruse Y, Kakiuchi H, MatsubaraI, Kasuya M, Kawano S. 1990. An ecological study on airpollution: Changes <strong>in</strong> annual r<strong>in</strong>g growth <strong>of</strong> <strong>the</strong> Japanesecedar <strong>and</strong> prevalence <strong>of</strong> respiratory symptoms <strong>in</strong> schoolchildren<strong>in</strong> Japanese rural districts. Environ Res 52:47–61.Kagamimori S, Katoh T, Naruse Y, Watanabe M, Kasuya M,Sh<strong>in</strong>kai J, Kawano S. 1986. The chang<strong>in</strong>g prevalence <strong>of</strong>respiratory symptoms <strong>in</strong> atopic children <strong>in</strong> response to airpollution. Cl<strong>in</strong> Allergy 16:299–308.Kamat SR, Doshi VB. 1987. Sequential health effect study<strong>in</strong> relation to air pollution <strong>in</strong> Bombay, India. Eur J Epidemiol3:265–277.Kamat SR, Godkh<strong>in</strong>di KD, Shah BW, Mehta A, Shah V, GregratJ, Papewar V, Tyagi N, Rashid S, Bhiwankar N, Natu R.1980. Correlation <strong>of</strong> health morbidity to air pollutantlevels <strong>in</strong> Bombay City: Results <strong>of</strong> prospective 3 year surveyat one year. J Postgrad Med 26:45–62.Kamat SR, Patil JD, Gregart J, Dalal N, Deshp<strong>and</strong>e JM, HardikarP. 1992. <strong>Air</strong> pollution related respiratory morbidity<strong>in</strong> central <strong>and</strong> north-eastern Bombay. J Assoc PhysiciansIndia 40:588–593.Kan H, Chen B. 2003a. A case–crossover analysis <strong>of</strong> airpollution <strong>and</strong> daily mortality <strong>in</strong> Shanghai. J Occup <strong>Health</strong>45:119–124.Kan H, Chen B. 2003b. <strong>Air</strong> pollution <strong>and</strong> daily mortality <strong>in</strong>Shanghai: A time-series study. Arch Environ <strong>Health</strong>58:360–367.191
<strong>Outdoor</strong> <strong>Air</strong> <strong>Pollution</strong> <strong>and</strong> <strong>Health</strong> <strong>in</strong> <strong>the</strong> Develop<strong>in</strong>g <strong>Countries</strong> <strong>of</strong> <strong>Asia</strong>Kan H, Chen B, Zhao N, London SJ, Song G, Chen G, ZhangY, Jiang L. 2010. Part 1. A time-series study <strong>of</strong> ambient airpollution <strong>and</strong> daily mortality <strong>in</strong> Shanghai, Ch<strong>in</strong>a. In:Public <strong>Health</strong> <strong>and</strong> <strong>Air</strong> <strong>Pollution</strong> <strong>in</strong> <strong>Asia</strong> (PAPA): Coord<strong>in</strong>atedStudies <strong>of</strong> Short-Term Exposure to <strong>Air</strong> <strong>Pollution</strong> <strong>and</strong>Daily Mortality <strong>in</strong> Four Cities. Research Report 154. <strong>Health</strong>Effects Institute, Boston, MA.Kan H, Jia J, Chen B. 2003. Acute stroke mortality <strong>and</strong> airpollution: New evidence from Shanghai, Ch<strong>in</strong>a. J Occup<strong>Health</strong> 45:321–323.Kan H, Jia J, Chen B. 2004a. A time-series study on <strong>the</strong>association <strong>of</strong> stroke mortality <strong>and</strong> air pollution <strong>in</strong> ZhabeiDistrict, Shanghai [<strong>in</strong> Ch<strong>in</strong>ese]. Wei Sheng Yan Jiu [J HygRes] 33:36–38.Kan H, Jia J, Chen B. 2004b. The association <strong>of</strong> daily diabetesmortality <strong>and</strong> outdoor air pollution <strong>in</strong> Shanghai,Ch<strong>in</strong>a. J Environ <strong>Health</strong> 67:21–26.Kan H, London SJ, Chen G, Zhang Y, Song G, Zhao N, JiangL, Chen B. 2007. Differentiat<strong>in</strong>g <strong>the</strong> effects <strong>of</strong> f<strong>in</strong>e <strong>and</strong>coarse particles on daily mortality <strong>in</strong> Shanghai, Ch<strong>in</strong>a.Environ Int 33:376–384.Kan H, London SJ, Chen G, Zhang Y, Song G, Zhao N, JiangL, Chen B. 2008. Season, sex, age <strong>and</strong> education as modifiers<strong>of</strong> <strong>the</strong> effects <strong>of</strong> outdoor air pollution on daily mortality<strong>in</strong> Shanghai, Ch<strong>in</strong>a: The Public <strong>Health</strong> <strong>and</strong> <strong>Air</strong><strong>Pollution</strong> <strong>in</strong> <strong>Asia</strong> (PAPA) Study. Environ <strong>Health</strong> Perspect116:1183–1188.Kan HD, Chen BH, Fu CW, Yu SZ, Mu LN. 2005. Relationshipbetween ambient air pollution <strong>and</strong> daily mortality <strong>of</strong>SARS <strong>in</strong> Beij<strong>in</strong>g. Biomed Environ Sci 18:1–4.Karita K, Yano E, J<strong>in</strong>sart W, Boudoung D, Tamura K. 2001.Respiratory symptoms <strong>and</strong> pulmonary function amongtraffic police <strong>in</strong> Bangkok, Thail<strong>and</strong>. Arch Environ <strong>Health</strong>56:467–470.Karita K, Yano E, Tamura K, J<strong>in</strong>sart W. 2004. Effects <strong>of</strong>work<strong>in</strong>g <strong>and</strong> residential location areas on air pollutionrelated respiratory symptoms <strong>in</strong> policemen <strong>and</strong> <strong>the</strong>irwives <strong>in</strong> Bangkok, Thail<strong>and</strong>. Eur J Public <strong>Health</strong> 14:24–26.Katsouyanni K, Samet JM. 2009. <strong>Air</strong> <strong>Pollution</strong> <strong>and</strong> <strong>Health</strong>:A North American Approach (APHENA). Research Report142. <strong>Health</strong> Effects Institute, Boston, MA.Katsouyanni K, Schwartz J, Spix C, Touloumi G, Zmirou D,Zanobetti A, Wojtyniak B, Vonk JM, Tobias A, Ponka A,Med<strong>in</strong>a S, Bacharova L, Anderson HR. 1996. Short termeffects <strong>of</strong> air pollution on health: A European approachus<strong>in</strong>g epidemiologic time series data: The APHEA protocol.J Epidemiol Community <strong>Health</strong> 50:S12–S18.Katsouyanni K, Touloumi G, Samoli E, Gryparis A, LeTertre A, Monopolis Y, Rossi G, Zmirou D, Ballester F,Boumghar A, Anderson HR, Wojtyniak B, Paldy A, Braunste<strong>in</strong>R, Pekkanen J, Sch<strong>in</strong>dler C, Schwartz J. 2001. Confound<strong>in</strong>g<strong>and</strong> effect modification <strong>in</strong> <strong>the</strong> short-term effects<strong>of</strong> ambient particles on total mortality: Results from 29European cities with<strong>in</strong> <strong>the</strong> APHEA2 project. Epidemiology12:521–531.Katsouyanni K, Touloumi G, Samoli E, Petasakis Y,Analitis A, Le Tertre A, Rossi G, Zmirou D, Ballester F,Boumghar A, Anderson HR, Wojtyniak B, Paldy A,Brauste<strong>in</strong> R, Pekkanen J, Sch<strong>in</strong>dler C, Schwartz J. 2003.Sensitivity analysis <strong>of</strong> various models <strong>of</strong> short-term effects<strong>of</strong> ambient particles on total mortality <strong>in</strong> 29 cities <strong>in</strong>APHEA2. In: Revised Analyses <strong>of</strong> Time-Series Studies <strong>of</strong><strong>Air</strong> <strong>Pollution</strong> <strong>and</strong> <strong>Health</strong>. pp. 157–164. Special Report.<strong>Health</strong> Effects Institute, Boston, MA.Katsouyanni K, Touloumi G, Spix C, Schwartz J, BalducciF, Med<strong>in</strong>a S, Rossi G, Wojtyniak B, Sunyer J, Bacharova L,Schouten JP, Ponka A, Anderson HR. 1997. Short termeffects <strong>of</strong> ambient sulphur dioxide <strong>and</strong> particulate matteron mortality <strong>in</strong> 12 European cities: Results from timeseries data from <strong>the</strong> APHEA project. Br Med J 314:1658–1663.Kaufman YJ, Tanre D, Boucher O. 2002. A satellite view <strong>of</strong>aerosols <strong>in</strong> <strong>the</strong> climate system. Nature 419:215–223.Kim H, Kim Y, Hong YC. 2003. The lag-effect pattern <strong>in</strong> <strong>the</strong>relationship <strong>of</strong> particulate air pollution to daily mortality<strong>in</strong> Seoul, Korea. Int J Biometeorol 48:25–30.Kim H, Lee JT, Hong YC, Yi SM, Kim Y. 2004a. Evaluat<strong>in</strong>g<strong>the</strong> effect <strong>of</strong> daily PM 10 variation on mortality. Inhal Toxicol16 Suppl 1:55–58.Kim J, Yang HE. 2005. Generalized additive model <strong>of</strong> airpollution to daily mortality. Key Eng Mat Vols 277–279:487–491.Kim KH, Mishra VK, Kang CH, Choi KC, Kim YJ, Kim DS.2006a. The ionic compositions <strong>of</strong> f<strong>in</strong>e <strong>and</strong> coarse particlefractions <strong>in</strong> <strong>the</strong> two urban areas <strong>of</strong> Korea. J EnvironManage 78:170–182.Kim SY, Kim H, Kim J. 2006b. [Effects <strong>of</strong> air pollution onasthma <strong>in</strong> Seoul: Comparisons across subject characteristics].J Prev Med Public <strong>Health</strong> 39:309–316.Kim SY, Lee JT, Hong YC, Ahn KJ, Kim H. 2004b. Determ<strong>in</strong><strong>in</strong>g<strong>the</strong> threshold effect <strong>of</strong> ozone on daily mortality: An192
HEI International Scientific Oversight Committeeanalysis <strong>of</strong> ozone <strong>and</strong> mortality <strong>in</strong> Seoul, Korea, 1995–1999. Environ Res 94:113–119.Kim SY, O'Neill MS, Lee JT, Cho Y, Kim J, Kim H. 2007. <strong>Air</strong>pollution, socioeconomic position, <strong>and</strong> emergency hospitalvisits for asthma <strong>in</strong> Seoul, Korea. Int Arch OccupEnviron <strong>Health</strong> 80:701–710.Klemm RJ, Mason RM. 2003. Replication <strong>of</strong> reanalysis <strong>of</strong>Harvard Six-City Mortality Study. In: Revised Analyses <strong>of</strong>Time-Series Studies <strong>of</strong> <strong>Air</strong> <strong>Pollution</strong> <strong>and</strong> <strong>Health</strong>. pp. 165–172. Special Report. <strong>Health</strong> Effects Institute, Boston, MA.Klemm RJ, Mason RM, Heilig CM, Neas LM, Dockery DW.2000. Is daily mortality associated specifically with f<strong>in</strong>eparticles? Data reconstruction <strong>and</strong> replication <strong>of</strong> analyses.J <strong>Air</strong> Waste Manage Assoc 50:1215–1222.Knöbel HH, Chen CJ, Liang KY. 1995. Sudden <strong>in</strong>fant deathsyndrome <strong>in</strong> relation to wea<strong>the</strong>r <strong>and</strong> optimetrically measuredair pollution <strong>in</strong> Taiwan. Pediatrics 96:1106–1110.Ko YC, Lee CH, Chen MJ, Huang CC, Chang WY, L<strong>in</strong> HJ,Wang HZ, Chang PY. 1997. Risk factors for primary lungcancer among non-smok<strong>in</strong>g women <strong>in</strong> Taiwan. Int J Epidemiol26:24–31.Ko FW, Tam WW, Wong TW, Chan DP, Tung AH, Lai CK,Hui DS. 2007. The temporal relationship between air pollutants<strong>and</strong> hospital admissions for chronic obstructivepulmonary disease <strong>in</strong> Hong Kong. Thorax 62:780–785.Krewski D, Burnett RT, Goldberg MS, Hoover K, SiemiatyckiJ, Jerrett M, Abrahamowicz M, White WH. 2000.Reanalysis <strong>of</strong> <strong>the</strong> Harvard Six Cities Study <strong>and</strong> <strong>the</strong> AmericanCancer Society Study <strong>of</strong> Particulate <strong>Air</strong> <strong>Pollution</strong> <strong>and</strong>Mortality. A Special Report <strong>of</strong> <strong>the</strong> Institute's Particle EpidemiologyReanalysis Project. <strong>Health</strong> Effects Institute,Cambridge, MA.Krewski D, Jerrett M, Burnett RT, Ma R, Hughes E, Shi Y,Turner MC, Pope CA III, Thurston G, Calle EE, Thun MJ.2009. Extended Analysis <strong>of</strong> <strong>the</strong> American Cancer SocietyStudy <strong>of</strong> Particulate <strong>Air</strong> <strong>Pollution</strong> <strong>and</strong> Mortality. ResearchReport 140. <strong>Health</strong> Effects Institute, Boston, MA.Krzyzanowski M, Cohen A. 2008. Update <strong>of</strong> WHO airquality guidel<strong>in</strong>es. <strong>Air</strong> Qual Atmos <strong>Health</strong> 1:7–13.Kumar D, Khare M, Alappat BH. 2001. Lechate generationfrom municipal l<strong>and</strong>fills <strong>in</strong> New Delhi. Proceed<strong>in</strong>g from27th WEDC Conference on People <strong>and</strong> Systems for Water,Sanitation, <strong>and</strong> <strong>Health</strong>, Lusaka, Zambia.Kumar KS, Prasad CE, Balakrishnan N, Rao KV, Reddy PU.2000. Respiratory symptoms <strong>and</strong> spirometric observations<strong>in</strong> relation to atmospheric pollutants <strong>in</strong> a sample <strong>of</strong> urbanpopulation. <strong>Asia</strong> Pac J Public <strong>Health</strong> 12:58–64.Kumar R, Sharma M, Srivastva A, Thakur JS, J<strong>in</strong>dal SK,Parwana HK. 2004. Association <strong>of</strong> outdoor air pollutionwith chronic respiratory morbidity <strong>in</strong> an <strong>in</strong>dustrial town<strong>in</strong> nor<strong>the</strong>rn India. Arch Environ <strong>Health</strong> 59:471–477.Kuo HW, Lai JS, Lee MC, Tai RC, Lee MC. 2002. Respiratoryeffects <strong>of</strong> air pollutants among asthmatics <strong>in</strong> centralTaiwan. Arch Environ <strong>Health</strong> 57:194–200.Kwon HJ, Cho SH. 1999. <strong>Air</strong> pollution <strong>and</strong> daily mortality<strong>in</strong> Seoul. Korean J Prev Med 32:191–199.Kwon HJ, Cho SH, Chun Y, Lagarde F, Pershagen G. 2002.Effects <strong>of</strong> <strong>the</strong> <strong>Asia</strong>n dust events on daily mortality <strong>in</strong>Seoul, Korea. Environ Res 90:1–5.Kwon HJ, Cho SH, Nyberg F, Pershagen G. 2001. Effects <strong>of</strong>ambient air pollution on daily mortality <strong>in</strong> a cohort <strong>of</strong>patients with congestive heart failure. Epidemiology12:413–419.Lacasana M, Esplugues A, Ballester F. 2005. Exposure toambient air pollution <strong>and</strong> prenatal <strong>and</strong> early childhoodhealth effects. Eur J Epidemiol 20:183–199.Laden F, Neas LM, Dockery DW, Schwartz J. 2000. Association<strong>of</strong> f<strong>in</strong>e particulate matter from different sources withdaily mortality <strong>in</strong> six US cities. Environ <strong>Health</strong> Perspect108:941–947.Laden F, Schwartz J, Speizer FE, Dockery DW. 2006.Reduction <strong>in</strong> f<strong>in</strong>e particulate air pollution <strong>and</strong> mortality:Extended follow-up <strong>of</strong> <strong>the</strong> Harvard six cities study. Am JRespir Crit Care Med 173:667–672.Lahiri T, Roy S, Basu C, Ganguly S, Ray MR, Lahiri P. 2000.<strong>Air</strong> pollution <strong>in</strong> Calcutta elicits adverse pulmonary reaction<strong>in</strong> children. Indian J Med Res 112:21–26.Lai ACK, Thatcher TL, Nazar<strong>of</strong>f WW. 2000. Inhalationtransfer factors for air pollution health risk assessment. J<strong>Air</strong> Waste Manage Assoc 50:1688–1699.Lam TH, Ho LM, Hedley AJ, Adab P, Field<strong>in</strong>g R, McGheeSM, Aharonson-Daniel L. 2000. Environmental tobaccosmoke exposure among police <strong>of</strong>ficers <strong>in</strong> Hong Kong.JAMA 284:756–763.Lam TH, Jiang C, Thomas GN, Zhou SZX, Lao X, Cao M,Zheng WS, Wang B, Can C, Liang G, Wong CM, Adab P,Jaakkola J, Cheng KK, Hedley AJ, Lai PC, Fan SJ. 2009. Apilot study <strong>of</strong> <strong>the</strong> impact <strong>of</strong> air pollution on health outcomes<strong>in</strong> elderly Ch<strong>in</strong>ese: The Guangzhou Cohort Study.Pilot Study Report. <strong>Health</strong> Effects Institute, Boston, MA.193
<strong>Outdoor</strong> <strong>Air</strong> <strong>Pollution</strong> <strong>and</strong> <strong>Health</strong> <strong>in</strong> <strong>the</strong> Develop<strong>in</strong>g <strong>Countries</strong> <strong>of</strong> <strong>Asia</strong>Langkulsen U, J<strong>in</strong>sart W, Karita K, Yano E. 2006. Respiratorysymptoms <strong>and</strong> lung function <strong>in</strong> Bangkok school children.Eur J Public <strong>Health</strong> 16:676–681.Lave LB, Sesk<strong>in</strong> EP. 1970. <strong>Air</strong> pollution <strong>and</strong> human health.Science 169:723–733.Lave LB, Sesk<strong>in</strong> EP. 1977. <strong>Air</strong> <strong>Pollution</strong> <strong>and</strong> Human<strong>Health</strong>. Johns Hopk<strong>in</strong>s University Press, Baltimore, MD.Le Tertre A, Quenel P, Eilste<strong>in</strong> D, Med<strong>in</strong>a S, Prouvost H,Pascal L, Boumghar A, Saviuc P, Zeghnoun A, Filleul L,Declercq C, Cassadou S, Le Goaster C. 2002. Short-termeffects <strong>of</strong> air pollution on mortality <strong>in</strong> n<strong>in</strong>e French cities: Aquantitative summary. Arch Environ <strong>Health</strong> 57:311–319.Lea<strong>the</strong>r J. 2008. Urban Development <strong>and</strong> Transport <strong>in</strong> <strong>Asia</strong>.Proceed<strong>in</strong>g from Better <strong>Air</strong> Quality 2008, <strong>Air</strong> Quality <strong>and</strong>Climate Change: Scal<strong>in</strong>g Up W<strong>in</strong>-W<strong>in</strong> Solutions for <strong>Asia</strong>.Imperial Queen's Park Hotel, Bangkok, Thail<strong>and</strong>. <strong>Asia</strong>nDevelopment Bank.Lee BE, Ha EH, Park HS, Kim YJ, Hong YC, Kim H, Lee JT.2003a. Exposure to air pollution dur<strong>in</strong>g different gestationalphases contributes to risks <strong>of</strong> low birth weight. HumReprod 18:638–643.Lee BK, Lee HK, Jun NY. 2006a. Analysis <strong>of</strong> regional <strong>and</strong>temporal characteristics <strong>of</strong> PM 10 dur<strong>in</strong>g an <strong>Asia</strong>n dust episode<strong>in</strong> Korea. Chemosphere 63:1106–1115.Lee CSL, Li X, Zhang G, Li J, D<strong>in</strong>g A, Wang T. 2007a. Heavymetals <strong>and</strong> Pb isotopic composition <strong>of</strong> aerosols <strong>in</strong> urban<strong>and</strong> suburban areas <strong>of</strong> Hong Kong <strong>and</strong> Guangzhou, SouthCh<strong>in</strong>a: Evidence <strong>of</strong> <strong>the</strong> long-range transport <strong>of</strong> air contam<strong>in</strong>ants.Atmos Environ 41:432–447.Lee E, Chan CK, Paatero P. 1999a. Application <strong>of</strong> positivematrix factorization <strong>in</strong> source apportionment <strong>of</strong> particulatepollutants <strong>in</strong> Hong Kong. Atmos Environ 33:3201–3212.Lee IM, Tsai SS, Chang CC, Ho CK, Yang CY. 2007b. <strong>Air</strong>pollution <strong>and</strong> hospital admissions for chronic obstructivepulmonary disease <strong>in</strong> a tropical city: Kaohsiung, Taiwan.Inhal Toxicol 19:393–398.Lee JT. 2003. Association between air pollution <strong>and</strong>asthma-related hospital admissions <strong>in</strong> children <strong>in</strong> Seoul,Korea: A case–crossover study. Korean J Prev Med 36:47–53.Lee JT, Lee SI, Sh<strong>in</strong> D, Chung Y. 1998. <strong>Air</strong> particulate matters<strong>and</strong> daily mortality <strong>in</strong> Ulsan, Korea. Korean J PrevMed 31:82–90.Lee JT, Kim H, Cho YS, Hong YC, Ha EH, Park H. 2003b.<strong>Air</strong> pollution <strong>and</strong> hospital admissions for ischemic heartdiseases among <strong>in</strong>dividuals 64+ years <strong>of</strong> age resid<strong>in</strong>g <strong>in</strong>Seoul, Korea. Arch Environ <strong>Health</strong> 58:617–623.Lee JT, Kim H, Hong YC, Kwon HJ, Schwartz J, ChristianiDC. 2000. <strong>Air</strong> pollution <strong>and</strong> daily mortality <strong>in</strong> seven majorcities <strong>of</strong> Korea, 1991–1997. Environ Res 84:247–254.Lee JT, Kim H, Song H, Hong YC, Cho YS, Sh<strong>in</strong> SY, HyunYJ, Kim YS. 2002. <strong>Air</strong> pollution <strong>and</strong> asthma among children<strong>in</strong> Seoul, Korea. Epidemiology 13:481–484.Lee JT, Schwartz J. 1999. Reanalysis <strong>of</strong> <strong>the</strong> effects <strong>of</strong> airpollution on daily mortality <strong>in</strong> Seoul, Korea: A case–crossoverdesign. Environ <strong>Health</strong> Perspect 107:633–636.Lee JT, Sh<strong>in</strong> D, Chung Y. 1999b. <strong>Air</strong> pollution <strong>and</strong> dailymortality <strong>in</strong> Seoul <strong>and</strong> Ulsan, Korea. Environ <strong>Health</strong> Perspect107:149–154.Lee JT, Son JY, Cho YS. 2007c. A comparison <strong>of</strong> mortalityrelated to urban air particles between periods with Asi<strong>and</strong>ust days <strong>and</strong> without <strong>Asia</strong>n dust days <strong>in</strong> Seoul, Korea,2000–2004. Environ Res 105:409–413.Lee SC, Wang B. 2004. Characteristics <strong>of</strong> emissions <strong>of</strong> airpollutants from burn<strong>in</strong>g <strong>of</strong> <strong>in</strong>cense <strong>in</strong> a large environmentalchamber. Atmos Environ 38:941–951.Lee SL, Wong WHS, Lau YL. 2006b. Association betweenair pollution <strong>and</strong> asthma admission among children <strong>in</strong>Hong Kong. Cl<strong>in</strong> Exp Allergy 36:1138–1146.Lee YJ, Lee JT, Ju YS, Sh<strong>in</strong> DC, Im HJ, Cho SH. 2001. Shorttermeffect <strong>of</strong> air pollution on respiratory disease <strong>in</strong> Seoul:A case–crossover study. Korean J Prev Med 34:253–261.Lee YL, L<strong>in</strong> YC, Hsiue TR, Hwang BF, Guo YL. 2003c.Indoor <strong>and</strong> outdoor environmental exposures, parentalatopy, <strong>and</strong> physician-diagnosed asthma <strong>in</strong> Taiwaneseschoolchildren. Pediatrics 112:e389–e389.Lee YL, L<strong>in</strong> YC, Hwang BF, Guo YL. 2005. Chang<strong>in</strong>g prevalence<strong>of</strong> asthma <strong>in</strong> Taiwanese adolescents: Two surveys 6years apart. Pediatr Allergy Immunol 16:157–164.Leem JH, Kaplan BM, Shim YK, Pohl HR, Gotway CA,Bullard SM, Rogers JF, Smith MM, Tylenda CA. 2006.Exposures to air pollutants dur<strong>in</strong>g pregnancy <strong>and</strong> pretermdelivery. Environ <strong>Health</strong> Perspect 114:905–910.Leem JH, Lee JT, Kim DG, Sh<strong>in</strong> D, Roh JH. 1998. Short-termeffects <strong>of</strong> air pollution on hospital visits for respiratory diseases<strong>in</strong> Seoul. Korean J Occup Environ Med 10:333–342.194
HEI International Scientific Oversight CommitteeLevy JI, Hammitt JK, Spengler JD. 2000. Estimat<strong>in</strong>g <strong>the</strong>mortality impacts <strong>of</strong> particulate matter: What can belearned from between-study variability? Environ <strong>Health</strong>Perspect 108:109–117.Li J, Guttikunda SK, Carmichael GR, Streets DG, Chang YS,Fung V. 2004. Quantify<strong>in</strong>g <strong>the</strong> human health benefits <strong>of</strong>curb<strong>in</strong>g air pollution <strong>in</strong> Shanghai. J Environ Manage70:49–62.Li J, Hao JM. 2003. Application <strong>of</strong> <strong>in</strong>take fraction to populationexposure estimates <strong>in</strong> Hunan Prov<strong>in</strong>ce <strong>of</strong> Ch<strong>in</strong>a. JEnviron Sci <strong>Health</strong> A 38:1041–1054.Light RJ, Pillemer DB. 1984. Summ<strong>in</strong>g up: The science <strong>of</strong>review<strong>in</strong>g research. Harvard University Press, Cambridge,MA.Lim JY, Chun YS. 2006. The characteristics <strong>of</strong> <strong>Asia</strong>n dustevents <strong>in</strong> Nor<strong>the</strong>ast <strong>Asia</strong> dur<strong>in</strong>g <strong>the</strong> spr<strong>in</strong>gtime from 1993to 2004. Global Planet Change 52:231–247.L<strong>in</strong> CM, Li CY, Mao IF. 2004a. Increased risks <strong>of</strong> term lowbirth-weight<strong>in</strong>fants <strong>in</strong> a petrochemical <strong>in</strong>dustrial citywith high air pollution levels. Arch Environ <strong>Health</strong>59:663–668.L<strong>in</strong> CM, Li CY, Yang GY, Mao IF. 2004b. Associationbetween maternal exposure to elevated ambient sulfurdioxide dur<strong>in</strong>g pregnancy <strong>and</strong> term low birth weight.Environ Res 96:41–50.L<strong>in</strong> HH, Ezzati M, Murray M. 2007. Tobacco Smoke, Indoor<strong>Air</strong> <strong>Pollution</strong> <strong>and</strong> Tuberculosis: A Systematic Review <strong>and</strong>Meta-Analysis. PLoS Med 4(1): e20.doi:10.1371/journal.pmed.0040020L<strong>in</strong> HH, Murray M, Cohen T, Colijn C, Ezzati M. 2008.Effects <strong>of</strong> smok<strong>in</strong>g <strong>and</strong> solid-fuel use on COPD, lungcancer, <strong>and</strong> tuberculosis <strong>in</strong> Ch<strong>in</strong>a: A time-based, multiplerisk factor, modell<strong>in</strong>g study. Lancet 373:1473–1483.L<strong>in</strong> MC, Chiu HF, Yu HS, Tsai SS. 2001a. Increased risk <strong>of</strong>preterm delivery <strong>in</strong> areas with air pollution from a petroleumref<strong>in</strong>ery plant <strong>in</strong> Taiwan. J Toxicol Environ <strong>Health</strong>64:637–644.L<strong>in</strong> MC, Yu HS, Tsai SS, Cheng BH, Hsu TY, Wu TN, YangCY. 2001b. Adverse pregnancy outcome <strong>in</strong> a petrochemicalpolluted area <strong>in</strong> Taiwan. J Toxicol Environ <strong>Health</strong> A63:565–574.L<strong>in</strong> RS, Sung FC, Huang SL, Gou YL, Ko YC, Gou HW,Shaw CK. 2001c. Role <strong>of</strong> urbanization <strong>and</strong> air pollution <strong>in</strong>adolescent asthma: A mass screen<strong>in</strong>g <strong>in</strong> Taiwan. J FormosMed Assoc 100:649–655.Lipfert FW, Wyzga RE, Baty JD, Miller JP. 2006. Traffic densityas a surrogate measure <strong>of</strong> environmental exposures <strong>in</strong>studies <strong>of</strong> air pollution health effects: Long-term mortality<strong>in</strong> a cohort <strong>of</strong> US veterans. Atmos Environ 40:154–169.Liu CM, Young CY, Lee YC. 2006. Influence <strong>of</strong> <strong>Asia</strong>n duststorms on air quality <strong>in</strong> Taiwan. Sci Total Environ368:884–897.Lopez AD, Ma<strong>the</strong>rs CD, Ezzati M, Evans DB, Jha P, Mills A,Musgrove P, eds. 2006. Global Burden <strong>of</strong> Disease <strong>and</strong> RiskFactors, 1990–2001. A copublication <strong>of</strong> Oxford UniversityPress <strong>and</strong> World Bank.Lung SCC, Hu SC. 2003. Generation rates <strong>and</strong> emissionfactors <strong>of</strong> particulate matter <strong>and</strong> particle-bound polycyclicaromatic hydrocarbons <strong>of</strong> <strong>in</strong>cense sticks. Chemosphere50:673–679.Maclure M. 1991. The case–crossover design: A methodfor study<strong>in</strong>g transient effects on <strong>the</strong> risk <strong>of</strong> acute events.Am J Epidemiol 133:144–153.Maeda K, Nitta H, Nakai S. 1991. Exposure to nitrogenoxides <strong>and</strong> o<strong>the</strong>r air pollutants from automobiles. Public<strong>Health</strong> Rev 19:61–72.Mahoney MJ. 1977. Publication prejudices: An experimentalstudy <strong>of</strong> confirmatory bias <strong>in</strong> <strong>the</strong> peer reviewsystem. Cognitive Ther Res 1:161–175.Maisonet M, Correa A, Misra D, Jaakkola JJK. 2004. Areview <strong>of</strong> <strong>the</strong> literature on <strong>the</strong> effects <strong>of</strong> ambient air pollutionon fetal growth. Environ Res 95:106–115.Malmström M, Sundquist J, Johansson SE. 1999. Neighborhoodenvironment <strong>and</strong> self-reported health status: A multilevelanalysis. Am J Public <strong>Health</strong> 89:1181–1186.Mark<strong>and</strong>ya A, Rübbelke DTG. 2003. Ancillary benefits <strong>of</strong>climate policy. Milan, Fondazione Eni Enrico Mattei Notedi Lavoro Series Index.Marshall JD, Nazar<strong>of</strong>f WW. 2007. Intake fraction. In: ExposureAnalysis (Ott WR, Ste<strong>in</strong>emann AC, Wallace LA, eds.)pp. 237–251. CRC Press, New York, NY.Ma<strong>the</strong>rs CD, Loncar D. 2006. Projections <strong>of</strong> global mortality<strong>and</strong> burden <strong>of</strong> disease from 2002 to 2030. PLoS Med3:e442.McConnell R, Berhane K, Gillil<strong>and</strong> F, London SJ, Islam T,Gauderman WJ, Avol E, Margolis HG, Peters JM. 2002.Asthma <strong>in</strong> exercis<strong>in</strong>g children exposed to ozone: A cohortstudy. Lancet 359:386–391.195
<strong>Outdoor</strong> <strong>Air</strong> <strong>Pollution</strong> <strong>and</strong> <strong>Health</strong> <strong>in</strong> <strong>the</strong> Develop<strong>in</strong>g <strong>Countries</strong> <strong>of</strong> <strong>Asia</strong>McConnell R, Berhane K, Yao L, Jerrett M, Lurmann F, Gillil<strong>and</strong>F, Kunzli N, Gauderman J, Avol E, Thomas D, PetersJ. 2006. Traffic, susceptibility, <strong>and</strong> childhood asthma.Environ <strong>Health</strong> Perspect 114:766–772.McDonnell WF, Abbey DE, Nish<strong>in</strong>o N, Lebowitz MD. 1999.Long-term ambient ozone concentration <strong>and</strong> <strong>the</strong> <strong>in</strong>cidence<strong>of</strong> asthma <strong>in</strong> nonsmok<strong>in</strong>g adults: The AHSMOG Study.Environ Res 80:110–121.McDonnell WF, Nish<strong>in</strong>o-Ishikawa N, Petersen FF, ChenLH, Abbey DE. 2000. Relationships <strong>of</strong> mortality with <strong>the</strong>f<strong>in</strong>e <strong>and</strong> coarse fractions <strong>of</strong> long-term ambient PM 10 concentrations<strong>in</strong> nonsmokers. J Expo Anal Env Epid 10:427–436.McGhee SM, Hedley AJ, Ho LM. 2002. Passive smok<strong>in</strong>g<strong>and</strong> its impact on employers <strong>and</strong> employees <strong>in</strong> Hong Kong.Occup Environ Med 59:842–846.McMichael AJ, Powles JW, Butler CD, Uauy R. 2007.Energy <strong>and</strong> health 5: Food, livestock production, energy,climate change, <strong>and</strong> health. Lancet 370:1253–1263.McMichael AJ, Woodruff RE, Hales S. 2006. Climatechange <strong>and</strong> human health: Present <strong>and</strong> future risks. Lancet367:859–869.Mehta S, Shahpar C. 2004. The health benefits <strong>of</strong> <strong>in</strong>terventionsto reduce <strong>in</strong>door air pollution from solid fuel use: Acost-effectiveness analysis. Energy 8:53–59.Mestl HES, Aunan K, Seip HM, Wang S, Zhao Y, Zhang D.2007. Urban <strong>and</strong> rural exposure to <strong>in</strong>door air pollutionfrom domestic biomass <strong>and</strong> coal burn<strong>in</strong>g across Ch<strong>in</strong>a. SciTotal Environ 377:12–26.Mi YH, Norback D, Tao J, Mi YL, Ferm M, Mi YH. 2006.Current asthma <strong>and</strong> respiratory symptoms among pupils<strong>in</strong> Shanghai, Ch<strong>in</strong>a: Influence <strong>of</strong> build<strong>in</strong>g ventilation,nitrogen dioxide, ozone, <strong>and</strong> formaldehyde <strong>in</strong> classrooms.Indoor <strong>Air</strong> 16:454–464.Miller KA, Siscovick DS, Sheppard L, Shepherd K, SullivanJH, Anderson GL, Kaufman JD. 2007. Long-termexposure to air pollution <strong>and</strong> <strong>in</strong>cidence <strong>of</strong> cardiovascularevents <strong>in</strong> women. N Engl J Med 356:447–458.M<strong>in</strong>oura H, Takahashi K, Chow JC, Watson JG. 2006. Multiyeartrend <strong>in</strong> f<strong>in</strong>e <strong>and</strong> coarse particle mass, carbon, <strong>and</strong> ions<strong>in</strong> downtown Tokyo, Japan. Atmos Environ 40:2478–2487.Morgenstern V, Zutavern A, Cyrys J, Brockow I, KoletzkoS, Kramer U, Behrendt H, Herbarth O, von Berg A, BauerCP, Wichmann HE, He<strong>in</strong>rich J. 2008. Atopic diseases,allergic sensitization, <strong>and</strong> exposure to traffic-related airpollution <strong>in</strong> children. Am J Respir Crit Care Med117:1331–1337.Mouli PC, Mohan SV, Reddy SJ. 2006. Chemical composition<strong>of</strong> atmospheric aerosol (PM 10 ) at a semi-arid urbansite: Influence <strong>of</strong> terrestrial sources. Environ Monit Assess117:291–305.Mulholl<strong>and</strong> E, Smith L, Carneiro I, Becher H, Lehmann D.2008. Equity <strong>and</strong> child-survival strategies. Bull World<strong>Health</strong> Organ 86:399–407.Murakami A, Za<strong>in</strong> AM, Takeuchi K, Tsunekawa A, YokotaS. 2005. Trends <strong>in</strong> urbanization <strong>and</strong> patterns <strong>of</strong> l<strong>and</strong> use <strong>in</strong><strong>the</strong> <strong>Asia</strong>n mega cities Jakarta, Bangkok, <strong>and</strong> Metro Manila.L<strong>and</strong>scape Urban Plan 70:251–259.Murakami Y, Ono M. 2006. Myocardial <strong>in</strong>farction deathsafter high level exposure to particulate matter. J EpidemiolCommunity <strong>Health</strong> 60:262–266.Murray CJ, Lopez AD. 1997. Alternative projections <strong>of</strong>mortality <strong>and</strong> disability by cause 1990–2020: Globalburden <strong>of</strong> disease study. Lancet 349:1498–1504.Nafstad P, Håheim LL, Oftedal B, Gram F, Holme I, HjermannI, Leren P. 2003. Lung cancer <strong>and</strong> air pollution: A 27-yearfollow-up <strong>of</strong> 16,209 Norwegian men. Thorax 58:1071–1076.Nafstad P, Håheim LL, Wisl<strong>of</strong>f T, Gram F, Oftedal B, HolmeI, Hjermann I, Leren P. 2004. Urban air pollution <strong>and</strong> mortality<strong>in</strong> a cohort <strong>of</strong> Norwegian men. Environ <strong>Health</strong> Perspect112:610–615.Nakai S, Nitta H, Maeda K. 1999. Respiratory health associatedwith exposure to automobile exhaust. III. Results <strong>of</strong>a cross-sectional study <strong>in</strong> 1987, <strong>and</strong> repeated pulmonaryfunction tests from 1987 to 1990. Arch Environ <strong>Health</strong>54:26–33.NASA Earth Observatory. 2007. Urbanization <strong>of</strong> <strong>the</strong> Pearl RiverDelta. Last updated August 12, 2007. Available from http://earthobservatory.nasa.gov/IOTD/view.php?id=7949. Accessed July 31, 2009.NASA Earth Observatory. 2009. Beij<strong>in</strong>g restrictions reducepollution. Last updated December 17, 2008. Available fromhttp://earthobservatory.nasa.gov/IOTD/view.php?id=36195. Accessed July 31, 2009.National Academy <strong>of</strong> Eng<strong>in</strong>eer<strong>in</strong>g (NAE) <strong>and</strong> NationalResearch Council (NRC). 2008. Energy Futures <strong>and</strong> Urban<strong>Air</strong> <strong>Pollution</strong> Challenges for Ch<strong>in</strong>a <strong>and</strong> <strong>the</strong> United States.The National Academies Press, Wash<strong>in</strong>gton, DC.National Bureau <strong>of</strong> Statistics <strong>of</strong> Ch<strong>in</strong>a (NBSC). 2004.[Ch<strong>in</strong>a Statistics Yearbook]. Ch<strong>in</strong>a Statistics Press, Beij<strong>in</strong>g.196
HEI International Scientific Oversight CommitteeNational Renewable Energy Laboratory (NREL). 2008.Apply<strong>in</strong>g Technologies: International Project Assistance <strong>and</strong>Collaboration. Last updated September 26, 2008. Availablefrom www.nrel.gov/apply<strong>in</strong>g_technologies/<strong>in</strong>ternational.html.National Statistic Communiqué. 2008. PM 10 Concentrations<strong>in</strong> Capital Cities <strong>of</strong> Ch<strong>in</strong>ese Prov<strong>in</strong>ces 2003–2006.Received June 11, 2008 from Yu Zhao, Ph.D. C<strong>and</strong>idate,<strong>Air</strong> <strong>Pollution</strong> Control Division, Department <strong>of</strong> EnvironmentalScience <strong>and</strong> Eng<strong>in</strong>eer<strong>in</strong>g, Ts<strong>in</strong>ghua University,Beij<strong>in</strong>g, Ch<strong>in</strong>a. (zhaou99@mails.ts<strong>in</strong>ghua.edu.cn)Neas LM, Schwartz J, Dockery D. 1999. A case–crossoveranalysis <strong>of</strong> air pollution <strong>and</strong> mortality <strong>in</strong> Philadelphia.Environ <strong>Health</strong> Perspect 107:629–631.New M, Hulme M, Jones P. 1999. Represent<strong>in</strong>g twentiethcenturyspace-time climate variability: Part I. Development<strong>of</strong> a 1961-90 mean monthly terrestrial climatology. JClimate 12: 829–856.Nishioka Y, Levy JI, Norris GA. 2006. Integrat<strong>in</strong>g air pollution,climate change, <strong>and</strong> economics <strong>in</strong> a risk-based lifecycleanalysis: A case study <strong>of</strong> residential <strong>in</strong>sulation. HumEcol Risk Assess 12:552–571.Nishtar S. 2002. Prevention <strong>of</strong> coronary heart disease <strong>in</strong>south <strong>Asia</strong>. Lancet 360:1015–1018.Nitta H, Sato T, Nakai S, Maeda K, Aoki S, Ono M. 1993.Respiratory health associated with exposure to automobileexhaust. I. Results <strong>of</strong> cross-sectional studies <strong>in</strong> 1979, 1982,<strong>and</strong> 1983. Arch Environ <strong>Health</strong> 48:53–58.Niu Y, He L, Hu M, Zhang J, Zhao Y. 2006. <strong>Pollution</strong> characteristics<strong>of</strong> atmospheric f<strong>in</strong>e particles <strong>and</strong> <strong>the</strong>ir secondarycomponents <strong>in</strong> <strong>the</strong> atmosphere <strong>of</strong> Shenzhen <strong>in</strong>summer <strong>and</strong> <strong>in</strong> w<strong>in</strong>ter. Sci Ch<strong>in</strong>a Ser B 49:446–474.Nordl<strong>in</strong>g E, Bergl<strong>in</strong>d N, Melen E, Emenius G, Hallberg J,Nyberg F, Pershagen G, Svartengren M, Wickman M, Bell<strong>and</strong>erT. 2008. Traffic-related air pollution <strong>and</strong> childhoodrespiratory symptoms, function <strong>and</strong> allergies. Epidemiology19:401–408.Nyberg FP, Gustavsson L, Järup T, Bell<strong>and</strong>er T, Bergl<strong>in</strong>d N,Jakobsson R, Pershagen G. 2000. Urban air pollution <strong>and</strong>lung cancer <strong>in</strong> Stockholm. Epidemiology 11:487–495.Oanh NTK, Polprasert C. 2005. Improv<strong>in</strong>g air quality <strong>in</strong><strong>Asia</strong>n develop<strong>in</strong>g countries. Last updated November 28,2002. Available from www.serd.ait.ac.th/airpetdocuments/Progress/comb<strong>in</strong>e%20p2%20report%203.pdf. AccessedAugust 4, 2008.Oanh NTK, Upadhyaya N, Zhuang YH, Hao ZP, MurthyDVS, Lestari P, Villar<strong>in</strong> JT, Chengchua K, Co HX, Dung NT,L<strong>in</strong>dgren ES. 2006. Particulate air pollution <strong>in</strong> six <strong>Asia</strong>ncities: Spatial <strong>and</strong> temporal distributions, <strong>and</strong> associatedsources. Atmos Environ 40:3367–3380.Oanh NTK, Upadhyay N, Zhuang YH, Hao ZP, Murthy D,Lestari P, Villar<strong>in</strong> J, Chengchua K, Co HX, Dung NT, L<strong>in</strong>dgrenES. 2007. Particulate pollution levels <strong>and</strong> source apportionment<strong>in</strong> six <strong>Asia</strong>n cities: Prelim<strong>in</strong>ary f<strong>in</strong>d<strong>in</strong>gs <strong>of</strong> AIRPET.Available from www.serd.ait.ac.th/airpet/documents/Progress%20comb<strong>in</strong>e%20p2%20report%203.pdf.Oanh NTK, Zhang BN. 2004. Photochemical smog model<strong>in</strong>gfor assessment <strong>of</strong> potential impacts <strong>of</strong> different managementstrategies on air quality <strong>of</strong> <strong>the</strong> BangkokMetropolitan Region, Thail<strong>and</strong>. J <strong>Air</strong> Waste Manage Assoc54:1321–1338.O’Connor D. 2000. Ancillary Benefits Estimation <strong>in</strong> Develop<strong>in</strong>g<strong>Countries</strong>: A Comparative Assessment. Presented atWorkshop on Assess<strong>in</strong>g <strong>the</strong> Ancillary Benefits <strong>and</strong> Costs <strong>of</strong>Greenhouse Gas Mitigation, Wash<strong>in</strong>gton, DC. Organisationfor Economic Cooperation <strong>and</strong> Development.Oftedal B, Brunekreef B, Nystad W, Nafstad P. 2007. Residentialoutdoor air pollution <strong>and</strong> allergen sensitization <strong>in</strong>schoolchildren <strong>in</strong> Oslo, Norway. Cl<strong>in</strong> Exp Allergy37:1632–1640.Ohara T, Akimoto H, Kurokawa J, Horii N, Yamaji K, YanX, Hayasaka T. 2007. An <strong>Asia</strong>n emission <strong>in</strong>ventory <strong>of</strong>anthropogenic emission sources for <strong>the</strong> period 1980–2020.Atmos Chem Phys 7:4419–4444.Omori T, Fujimoto G, Yoshimura I, Nitta H, Ono M. 2003.Effects <strong>of</strong> particulate matter on daily mortality <strong>in</strong> 13 Japanesecities. J Epidemiol 13:314–322.O'Neill MS, Jerrett M, Kawachi L, Levy JL, Cohen AJ, GouveiaN, Wilk<strong>in</strong>son P, Fletcher T, Cifuentes L, Schwartz J;Workshop on <strong>Air</strong> <strong>Pollution</strong> <strong>and</strong> Socioeconomic Conditions.2003. <strong>Health</strong>, wealth, <strong>and</strong> air pollution: Advanc<strong>in</strong>g<strong>the</strong>ory <strong>and</strong> methods. Environ <strong>Health</strong> Perspect 111:1861–1870.Ong SG, Liu J, Wong CM, Lam TH, Tam AY, Daniel L,Hedley AJ. 1991. Studies on <strong>the</strong> respiratory health <strong>of</strong> primaryschool children <strong>in</strong> urban communities <strong>of</strong> Hong Kong.Sci Total Environ 106:121–135.Ono M, Omori T, Nitta H. 2007. Is <strong>the</strong> midnight-to-midnightaverage concentration <strong>of</strong> pollutants an appropriateexposure <strong>in</strong>dex for a daily mortality study? J Expo SciEnviron Epidemiol 17:84–87.197
<strong>Outdoor</strong> <strong>Air</strong> <strong>Pollution</strong> <strong>and</strong> <strong>Health</strong> <strong>in</strong> <strong>the</strong> Develop<strong>in</strong>g <strong>Countries</strong> <strong>of</strong> <strong>Asia</strong>Ostro B, Broadw<strong>in</strong> R, Green S, Feng WY, Lipsett M. 2006.F<strong>in</strong>e particulate air pollution <strong>and</strong> mortality <strong>in</strong> n<strong>in</strong>e Californiacounties: Results from CALFINE. Environ <strong>Health</strong>Perspect 114:29–33.Ostro B, Chestnut L, Vichit-Vadakan N, Laixuthai A. 1999.The impact <strong>of</strong> particulate matter on daily mortality <strong>in</strong>Bangkok, Thail<strong>and</strong>. J <strong>Air</strong> Waste Manag Assoc 49:100–107.Özkaynak H, Thurston GD. 1987. Associations between1980 United States mortality rates <strong>and</strong> alternative measures<strong>of</strong> airborne particle concentration. Risk Anal 7:449–461.Paatero P, Tapper U. 1993. Analysis <strong>of</strong> different modes <strong>of</strong>factor analysis as least squares fit problems. ChemometrIntell Lab 18:183–194.Pan American <strong>Health</strong> Organization. 2005. An Assessment<strong>of</strong> <strong>Health</strong> Effects <strong>of</strong> Ambient <strong>Air</strong> <strong>Pollution</strong> <strong>in</strong> Lat<strong>in</strong>America <strong>and</strong> <strong>the</strong> Caribbean. PAHO, Santiago, Chile.P<strong>and</strong>e JN, Bhatta N, Biswas D, P<strong>and</strong>ey RM, Ahluwalia G,Siddaramaiah NH, Khilnani GC. 2002. <strong>Outdoor</strong> air pollution<strong>and</strong> emergency room visits at a hospital <strong>in</strong> Delhi.Indian J Chest Dis Allied Sci 44:13–19.Paramesh H. 2002. Epidemiology <strong>of</strong> asthma <strong>in</strong> India.Indian J Pediatr 69:309–312.Parashar DC, Gadi R, M<strong>and</strong>al TK, Mitra AP. 2005. Carbonaceousaerosol emissions from India. Atmos Environ39:7861–7871.Park H, Lee B, Ha EH, Lee JT, Kim H, Hong YC. 2002. Association<strong>of</strong> air pollution with school absenteeism due to illness.Arch Pediatr Adolesc Med 156:1235–1239.Park SS, Bae MS, Kim YJ. 2001. Chemical composition <strong>and</strong>source apportionment <strong>of</strong> PM 2.5 particles <strong>in</strong> <strong>the</strong> Sihwa area,Korea. J <strong>Air</strong> Waste Manage Assoc 51:393–405.Parashar DC, Gadi R, M<strong>and</strong>al TK, Mitra AP. 2005. Carbonaceousaerosol emissions from India. Atmos Environ39:7861–7871.Pattenden S, Hoek G, Braun-Fahrländer C, Forastiere F,Kosheleva A, Neuberger M, Fletcher T. 2006. NO 2 <strong>and</strong> children'srespiratory symptoms <strong>in</strong> <strong>the</strong> PATY study. OccupEnviron Med 63:828–835.Pearce D. 2000. Policy frameworks for <strong>the</strong> ancillary benefits<strong>of</strong> climate change policies. Presented at Workshop onAssess<strong>in</strong>g <strong>the</strong> Ancillary Benefits <strong>and</strong> Costs <strong>of</strong> GreenhouseGas Mitigation Strategies, Wash<strong>in</strong>gton, DC. Organisationfor European Cooperation <strong>and</strong> Development.Peng RD, Dom<strong>in</strong>ici F, Pastor-Barriuso R, Zeger SL, SametJM. 2005. Seasonal analyses <strong>of</strong> air pollution <strong>and</strong> mortality<strong>in</strong> 100 US cities. Am J Epidemiol 161:585–594.Peters A, Dockery DW, Muller JE, Mittleman MA. 2001.Increased particulate air pollution <strong>and</strong> <strong>the</strong> trigger<strong>in</strong>g <strong>of</strong>myocardial <strong>in</strong>farction. Circulation 103:2810–2815.Peters J, Hedley AJ, Wong CM, Lam TH, Ong SG, Liu J,Spiegelhalter DJ. 1996. Effects <strong>of</strong> an ambient air pollution<strong>in</strong>tervention <strong>and</strong> environmental tobacco smoke on children'srespiratory health <strong>in</strong> Hong Kong. Int J Epidemiol25:821–828.Peters JM, Avol E, Navidi W, London SJ, Gauderman WJ,Lurmann F, L<strong>in</strong>n WS, Margolis H, Rappaport E, Gong H,Thomas DC. 1999. A study <strong>of</strong> twelve Sou<strong>the</strong>rn Californiacommunities with differ<strong>in</strong>g levels <strong>and</strong> types <strong>of</strong> air pollution.I. Prevalence <strong>of</strong> respiratory morbidity. Am J RespirCrit Care Med 159:760–767.Pierse N, Rushton L, Harris RS, Kuehni CE, Silverman M,Grigg J. 2006. Locally generated particulate pollution <strong>and</strong>respiratory symptoms <strong>in</strong> young children. Thorax 61:216–220.Pisani P, Srivatanakul P, R<strong>and</strong>erson-Moor J, Vipasr<strong>in</strong>imit S,Lalitwongsa S, Unpunyo P, Bashir S, Bishop DT. 2006.GSTM1 <strong>and</strong> CYP1A1 polymorphisms, tobacco, air pollution,<strong>and</strong> lung cancer: A study <strong>in</strong> rural Thail<strong>and</strong>. CancerEpidemiol Biomarkers Prev 15:667–674.Piver WT, Ando M, Ye F, Portier CJ. 1999. Temperature <strong>and</strong>air pollution as risk factors for heat stroke <strong>in</strong> Tokyo, July<strong>and</strong> August 1980–1995. Environ <strong>Health</strong> Perspect 107:911–916.<strong>Pollution</strong> Control Department. 2007. Monitor<strong>in</strong>g Stations(last updated 6/3/07). <strong>Air</strong> Quality <strong>and</strong> Noise ManagementBureau, M<strong>in</strong>istry <strong>of</strong> Natural Resources <strong>and</strong> Environment,Bangkok Thail<strong>and</strong>. www.aqnis.pcd.go.th/station/allstation.htm.Accessed 01/2008.Pope CA III. 1996. Particulate pollution <strong>and</strong> health: Areview <strong>of</strong> <strong>the</strong> Utah Valley experience. J Exp Anal EnvironEpidemiol 6:23–34.Pope CA III. 2007. Mortality effects <strong>of</strong> longer term exposuresto f<strong>in</strong>e particulate air pollution: Review <strong>of</strong> recent epidemiologicalevidence. Inhal Toxicol 19:33–38.Pope CA III, Burnett RT. 2007. Confound<strong>in</strong>g <strong>in</strong> air pollutionepidemiology: The broader context. Epidemiology18:424–426.198
HEI International Scientific Oversight CommitteePope CA III, Burnett RT, Thun MJ, Calle EE, Krewski D, ItoK, Thurston GD. 2002. Lung cancer, cardiopulmonary mortality,<strong>and</strong> long-term exposure to f<strong>in</strong>e particulate air pollution.JAMA 287:1132–1141.Pope CA III, Burnett RT, Thurston GD, Thun MJ, Calle EE,Krewski D, Godleski JJ. 2004. Cardiovascular mortality <strong>and</strong>long-term exposure to particulate air pollution: Epidemiologicalevidence <strong>of</strong> general pathophysiological pathways<strong>of</strong> disease. Circulation 109:71–77.Pope CA III, Dockery DW. 1999. Epidemiology <strong>of</strong> particleeffects (Holgate ST, Samet JM, Koren HS, Maynard R, eds.)pp. 673–705. Academic Press, London.Pope CA III, Dockery DW. 2006. <strong>Health</strong> effects <strong>of</strong> f<strong>in</strong>e particulateair pollution: L<strong>in</strong>es that connect. J <strong>Air</strong> WasteManage Assoc 56:709–742.Pope CA III, Kalkste<strong>in</strong> LS. 1996. Synoptic wea<strong>the</strong>r model<strong>in</strong>g<strong>and</strong> estimates <strong>of</strong> <strong>the</strong> exposure–response relationshipbetween daily mortality <strong>and</strong> particulate air pollution.Environ <strong>Health</strong> Perspect 104:414–420.Pope CA III, Muhleste<strong>in</strong> JB, May HT, Renlund DG,Anderson JL, Horne BD. 2006. Ischemic heart diseaseevents triggered by short-term exposure to f<strong>in</strong>e particulateair pollution. Circulation 114:2443–2448.Pope CA III, Rodermund DL, Gee MM. 2007. Mortalityeffects <strong>of</strong> a copper smelter strike <strong>and</strong> reduced ambient sulfateparticulate matter air pollution. Environ <strong>Health</strong> Perspect115:679–683.Pope CA III, Schwartz J, Ransom MR. 1992. Daily mortality<strong>and</strong> PM (10) pollution <strong>in</strong> Utah Valley. Arch Environ <strong>Health</strong>47:211–217.Pope CA III, Thun MJ, Namboodiri MM, Dockery DW,Evans JS, Speizer FE, Heath CW. 1995. Particulate air pollutionas a predictor <strong>of</strong> mortality <strong>in</strong> a prospective study <strong>of</strong>US adults. Am J Respir Crit Care Med 151:669–674.Pothikamjorn SL, Ruxrungtham K, Thampanitchawong P,Fuangthong R, Srasuebkul P, Sangahsapaviriyah A, SuttihavilW, Klaewsongkram J, Parisuthikul V, Viravan T,Rumsaeng V, Kana K, Direkwattanachai C, KamchaisathienV, Phanupak P. 2002. Impact <strong>of</strong> particulate air pollutantson allergic diseases, allergic sk<strong>in</strong> reactivity <strong>and</strong> lung function.<strong>Asia</strong> Pac J Allergy Immunol 20:77–83.Qian Z, Chapman RS, Hu W, Wei F, Korn LR, Zhang JJ.2004. Us<strong>in</strong>g air pollution based community clusters toexplore air pollution health effects <strong>in</strong> children. Environ Int30:611–620.Qian Z, Chapman RS, Tian Q, Chen Y, Lioy PJ, Zhang J.2000. Effects <strong>of</strong> air pollution on children's respiratoryhealth <strong>in</strong> three Ch<strong>in</strong>ese cities. Arch Environ <strong>Health</strong>55:126–133.Qian Z, He Q, L<strong>in</strong> HM, Kong L, Bentley CM, Liu W, ZhouD. 2008. High temperatures enhanced acute mortalityeffects <strong>of</strong> ambient air pollution <strong>in</strong> <strong>the</strong> “oven” city <strong>of</strong>Wuhan, Ch<strong>in</strong>a. Environ <strong>Health</strong> Perspect 11:1172–1178.Qian Z, He Q, L<strong>in</strong> HM, Kong LL, Liao DP, Dan JJ, BentleyCM, Wang BW. 2007a. Association <strong>of</strong> daily cause-specificmortality with ambient particle air pollution <strong>in</strong> Wuhan,Ch<strong>in</strong>a. Environ Res 105:380–389.Qian Z, He Q, L<strong>in</strong> HM, Kong L, Liao D, Yang N, BentleyCM, Xu S. 2007b. Short-term effects <strong>of</strong> gaseous pollutantson cause-specific mortality <strong>in</strong> Wuhan, Ch<strong>in</strong>a. J <strong>Air</strong> WasteManag Assoc 57:785–793.Qian Z, He Q, L<strong>in</strong> H-M, Kong L, Zhou D, Liang S, Zhu Z,Liao D, Liu W, Bentley CM, Dan J, Wang B, Yang N, Xu S,Gong J, Wei H, Sun H, Q<strong>in</strong> Z. 2010. Part 2. Association <strong>of</strong>daily mortality with ambient air pollution, <strong>and</strong> effect modificationby extremely high temperature <strong>in</strong> Wuhan, Ch<strong>in</strong>a.In: Public <strong>Health</strong> <strong>and</strong> <strong>Air</strong> <strong>Pollution</strong> <strong>in</strong> <strong>Asia</strong> (PAPA): Coord<strong>in</strong>atedStudies <strong>of</strong> Short-Term Exposure to <strong>Air</strong> <strong>Pollution</strong><strong>and</strong> Daily Mortality <strong>in</strong> Four Cities. Research Report 154.<strong>Health</strong> Effects Institute, Boston, MA.Qian ZM, Zhang JF, Wei FH, Wilson WE, Chapman RS.2001. Long-term ambient air pollution levels <strong>in</strong> four Ch<strong>in</strong>esecities: Inter-city <strong>and</strong> <strong>in</strong>tra-city concentration gradientsfor epidemiological studies. J Expo Anal Env Epid11:341–351.Rabl A. 2006. Analysis <strong>of</strong> air pollution mortality <strong>in</strong> terms<strong>of</strong> life expectancy changes: Relation between time series,<strong>in</strong>tervention, <strong>and</strong> cohort studies. Environ <strong>Health</strong> 5:1–11.Raizenne M, Neas LM, Damokosh AI, Dockery DW, SpenglerJD, Koutrakis P, Ware JH, Speizer FE. 1996. <strong>Health</strong>effects <strong>of</strong> acid aerosols on North American children: Pulmonaryfunction. Environ <strong>Health</strong> Perspect 104:506–514.Rajarathnam U, Seghal M, Nairy S, Patnayak RC, ChhabraSK, Kilnani, Santhosh Ragavan KV. 2010. Time-SeriesStudy on <strong>Air</strong> <strong>Pollution</strong> <strong>and</strong> Mortality <strong>in</strong> Delhi. ResearchReport. <strong>Health</strong> Effects Institute, Boston, MA. In Press.Ramanathan V, Carmichael G. 2008. Global <strong>and</strong> regionalclimate changes due to black carbon. Nat Geosci 1:221–227.Ramanathan V, Crutzen PJ. 2003. New directions: Atmosphericbrown "clouds". Atmos Environ 37:4033–4035.199
<strong>Outdoor</strong> <strong>Air</strong> <strong>Pollution</strong> <strong>and</strong> <strong>Health</strong> <strong>in</strong> <strong>the</strong> Develop<strong>in</strong>g <strong>Countries</strong> <strong>of</strong> <strong>Asia</strong>Ramanathan V, Crutzen PJ, Lelieveld J, Mitra AP, AlthausenD, Anderson J, Andreae MO, Cantrell W, Cass GR,Chung CE, Clarke AD, Coakley JA, Coll<strong>in</strong>s WD, ConantWC, Dulac F, He<strong>in</strong>tzenberg J, Heymsfield AJ, Holben B,Howell S, Hudson J, Jayaraman A, Kiehl JT, KrishnamurtiTN, Lub<strong>in</strong> D, McFarquhar G, Novakov T, Ogren JA,Podgorny IA, Pra<strong>the</strong>r K, Priestley K, Prospero JM, Qu<strong>in</strong>nPK, Rajeev K, Rasch P, Rupert S, Sadourny R, Sa<strong>the</strong>esh SK,Shaw GE, Sheridan P, Valero FPJ. 2001. Indian OceanExperiment: An <strong>in</strong>tegrated analysis <strong>of</strong> <strong>the</strong> climate forc<strong>in</strong>g<strong>and</strong> effects <strong>of</strong> <strong>the</strong> great Indo-<strong>Asia</strong>n haze. J Geophys Res-Atmos 106:28371–28398.Rao NM, Patel TS, Raiyani CV, Aggarwal AL, Kulkarni PK,Chatterjee SK, Kashyap SK. 1992. Pulmonary functionstatus <strong>of</strong> shopkeepers <strong>of</strong> Ahmedabad exposed to autoexhaustpollutants. Indian J Physiol Pharmacol 36:60–64.Reddy KS. 2004. Cardiovascular disease <strong>in</strong> non-westerncountries. N Engl J Med 350:2438–2440.Reddy MS, Venkataraman C. 2002. Inventory <strong>of</strong> aerosol<strong>and</strong> sulphur dioxide emissions from India: I. Fossil fuelcombustion. Atmos Environ 36:677–697.Regional COPD Work<strong>in</strong>g Group. 2003. COPD prevalence <strong>in</strong>12 <strong>Asia</strong>-Pacific countries <strong>and</strong> regions: Projections based on<strong>the</strong> COPD prevalence estimation model. Respirology8:192–198.Reid DD. 1964. <strong>Air</strong> pollution <strong>and</strong> respiratory disease <strong>in</strong>children. In: Bronchitis II: Second International Symposium(Orie NGM, Sluiter HJ, eds.) pp. 313–318. RoyalVangorium: Assen.Reid DD, Fairbairn AS. 1958. The natural history <strong>of</strong>chronic bronchitis. Lancet 1:1147–1152.Rennard SI, Vestbo J. 2008. Natural histories <strong>of</strong> chronicobstructive pulmonary disease. Proc Am Thorac Soc5:878–883.Reynolds CCO, K<strong>and</strong>likar M. 2008. Climate impacts <strong>of</strong> airquality policy: Switch<strong>in</strong>g to a natural gas-fueled publictransportation system <strong>in</strong> New Delhi. Environ Sci Technol42:5860–5865.Richter A, Burrows JP, Nuss H, Granier C, Niemeier U.2005. Increase <strong>in</strong> tropospheric nitrogen dioxide over Ch<strong>in</strong>aobserved from space. Nature 437:129–132.Ritz B, Wilhelm M. 2008. Ambient air pollution <strong>and</strong>adverse birth outcomes: Methodologic issues <strong>in</strong> anemerg<strong>in</strong>g field. Basic Cl<strong>in</strong> Pharmacol Toxicol 102:182–190.Romieu I, Samet JM, Smith KR, Bruce N. 2002. <strong>Outdoor</strong> airpollution <strong>and</strong> acute respiratory <strong>in</strong>fections among children<strong>in</strong> develop<strong>in</strong>g countries. Occup Environ Med 44:640–649.Royal Society. 2008. Ground-Level Ozone <strong>in</strong> <strong>the</strong> 21st Century:Future Trends, Impacts <strong>and</strong> Policy Implications. SciencePolicy Report 15/08, p. 132. London, Engl<strong>and</strong>.Rübbelke DTG. 2002. International Climate Policy toCombat Global Warm<strong>in</strong>g: An Analysis <strong>of</strong> <strong>the</strong> AncillaryBenefits <strong>of</strong> Reduc<strong>in</strong>g Carbon Emissions. Edward ElgarPublish<strong>in</strong>g Ltd, Cheltenham.Rudan I, Tomaskovic L, Boschi-P<strong>in</strong>to C, Campbell H. 2004.Global estimate <strong>of</strong> <strong>the</strong> <strong>in</strong>cidence <strong>of</strong> cl<strong>in</strong>ical pneumoniaamong children under five years <strong>of</strong> age. Bull World <strong>Health</strong>Organ 82:895–903.Salam MT, Islam T, Gillil<strong>and</strong> FD. 2008. Recent evidencefor adverse effects <strong>of</strong> residential proximity to trafficsources on asthma. Curr Op<strong>in</strong> Pulm Med 14:3–8.Samet JM. 2007. Traffic, air pollution, <strong>and</strong> health. InhalToxicol 19:1021–1027.Samet JM, Cohen AJ. 2006. <strong>Air</strong> pollution <strong>and</strong> cancer. In:Cancer Epidemiology <strong>and</strong> Prevention (Schottenfeld D,Fraumeni JF, eds.) Oxford University Press, New York.Samet JM, Dom<strong>in</strong>ici F, Curriero FC, Coursac I, Zeger SL.2000a. F<strong>in</strong>e particulate air pollution <strong>and</strong> mortality <strong>in</strong> 20US Cities, 1987–1994. N Engl J Med 343:1742–1749.Samet JM, Zeger SL, Berhane K. 1995. Particulate <strong>Air</strong> <strong>Pollution</strong><strong>and</strong> Daily Mortality: Replication <strong>and</strong> Validation <strong>of</strong>Selected Studies; <strong>the</strong> Phase I Report <strong>of</strong> <strong>the</strong> Particle EpidemiologyEvaluation Project. Special Report. <strong>Health</strong> EffectsInstitute, Cambridge, MA.Samet JM, Zeger SL, Dom<strong>in</strong>ici F, Curriero F, Coursac I,Dockery DW, Schwartz J, Zanobetti A. 2000b. Part II. Morbidity<strong>and</strong> mortality from air pollution <strong>in</strong> <strong>the</strong> UnitedStates. The National Morbidity, Mortality, <strong>and</strong> <strong>Air</strong> <strong>Pollution</strong>Study. Research Report 94. <strong>Health</strong> Effects Institute,Cambridge, MA.Samet JM, Zeger S, Kelsall J, Xu J, Kalkste<strong>in</strong> L. 1998. Doeswea<strong>the</strong>r confound or modify <strong>the</strong> association <strong>of</strong> particulateair pollution with mortality? An analysis <strong>of</strong> <strong>the</strong> Philadelphiadata, 1973–1980. Environ Res 77:9–19.Samoli E, Schwartz J, Analitis A, Petasakis Y, Wojtyniak B,Touloumi G, Spix C, Balducci F, Med<strong>in</strong>a S, Rossi G, SunyerJ, Anderson HR, Katsouyanni K. 2003. Sensitivity analyses<strong>of</strong> regional differences <strong>in</strong> short-term effects <strong>of</strong> air pollutionon daily mortality <strong>in</strong> APHEA cities. In: Revised Analyses200
HEI International Scientific Oversight Committee<strong>of</strong> Time-Series Studies <strong>of</strong> <strong>Air</strong> <strong>Pollution</strong> <strong>and</strong> <strong>Health</strong> (pp.205–209). Special Report. <strong>Health</strong> Effects Institute, Boston,MA.Samoli E, Peng R, Ramsay T, Pipikou M, Touloumi G,Dom<strong>in</strong>ici F, Burnett R, Cohen A, Krewski D, Samet J, KatsouyanniK. 2008. Acute effects <strong>of</strong> ambient particulatematter on mortality <strong>in</strong> Europe <strong>and</strong> North America: Resultsfrom <strong>the</strong> APHENA study. Environ <strong>Health</strong> Perspect116:1480–1486.Samoli E, Schwartz J, Wojtyniak B, Touloumi G, Spix C,Balducci F, Med<strong>in</strong>a S, Rossi G, Sunyer J, Bacharova L,Anderson HR, Katsouyanni K. 2001. Investigat<strong>in</strong>g regionaldifferences <strong>in</strong> short-term effects <strong>of</strong> air pollution on dailymortality <strong>in</strong> <strong>the</strong> APHEA project: A sensitivity analysis forcontroll<strong>in</strong>g long-term trends <strong>and</strong> seasonality. Environ<strong>Health</strong> Perspect 109:349–353.Santoso M, Hopke PK, Hidayat A, Dwiana LD. 2008.Sources identification <strong>of</strong> <strong>the</strong> atmospheric aerosol at urban<strong>and</strong> suburban sites <strong>in</strong> Indonesia by positive matrix factorization.Sci Total Environ 397:229–238.Sastry N. 2002. Forest fires, air pollution, <strong>and</strong> mortality <strong>in</strong>sou<strong>the</strong>ast <strong>Asia</strong>. Demography 39:1–23.Sawaguchi T, Toro K, Sawaguchi A. 1997. Sudden <strong>in</strong>fantdeath syndrome <strong>in</strong> relation to climatic temperature, climatichumidity <strong>and</strong> air pollution <strong>in</strong> Japan. Rom J Leg Med5:21–24.Schauer JJ, Rogge WF, Hildemann LM, Mazurek MA, CassGR. 1996. Source apportionment <strong>of</strong> airborne particulatematter us<strong>in</strong>g organic compounds as tracers. AtmosEnviron 30:3837–3855.Schwartz J. 1991. Particulate air pollution <strong>and</strong> daily mortality<strong>in</strong> Detroit. Environ Res 56:204–213.Schwartz J. 1993. <strong>Air</strong> pollution <strong>and</strong> daily mortality <strong>in</strong> Birm<strong>in</strong>gham,Alabama. Am J Epidemiol 137:1136–1147.Schwartz J. 2000. The distributed lag between air pollution<strong>and</strong> daily deaths. Epidemiology 11:320–326.Schwartz J. 2004. The effects <strong>of</strong> particulate air pollution ondaily deaths: A multi-city case crossover analysis. OccupEnviron Med 61:956–61.Schwartz J, Coull B. 2003. Control for confound<strong>in</strong>g <strong>in</strong> <strong>the</strong>presence <strong>of</strong> measurement error <strong>in</strong> hierarchical models.Biostatistics 4:539–553.Schwartz J, Dockery DW. 1992a. Increased mortality <strong>in</strong>Philadelphia associated with daily air pollution concentrations.Am Rev Respir Dis 145:600–604.Schwartz J, Dockery DW. 1992b. Particulate air pollution<strong>and</strong> daily mortality <strong>in</strong> Steubenville, Ohio. Am J Epidemiol135:12–19.Schwartz J, Dockery DW, Neas LM. 1996. Is daily mortalityassociated specifically with f<strong>in</strong>e particles? J <strong>Air</strong> WasteManage Assoc 46:927–939.Schwartz J, Marcus A. 1990. Mortality <strong>and</strong> air pollution <strong>in</strong>London: A time-series analysis. Am J Epidemiol 131:185–194.Schwela D, Haq G, Huizenga C, Han W-J, Fabian H, AjeroM. 2006. Urban <strong>Air</strong> <strong>Pollution</strong> <strong>in</strong> <strong>Asia</strong>n Cities: Status, Challenges<strong>and</strong> Management. Earthscan, London, UK.Sek<strong>in</strong>e K, Shima M, Nitta Y, Adachi M. 2004. Long termeffects <strong>of</strong> exposure to automobile exhaust on <strong>the</strong> pulmonaryfunction <strong>of</strong> female adults <strong>in</strong> Tokyo, Japan. OccupEnviron Med 61:350–357.Shafey O, Dolwick S, Gu<strong>in</strong>don GE (eds.). 2003. TobaccoControl Country Pr<strong>of</strong>iles. American Cancer Society,Atlanta, GA.Shah MH, Shaheen N, Jaffar M, Khalique A, Tariq SR, ManzoorS. 2006. Spatial variations <strong>in</strong> selected metal contents<strong>and</strong> particle size distribution <strong>in</strong> an urban <strong>and</strong> rural atmosphere<strong>of</strong> Islamabad, Pakistan. J Environ Manage 78:128–137.Shanghai Environmental Protection Bureau, PRC.www.sepb.gov.cn/english/. Last updated October 29, 2009.Sharma C, Dasgupta A, Mitra AP. 2002. Inventory <strong>of</strong> GHGs<strong>and</strong> o<strong>the</strong>r urban pollutants from agricultural <strong>and</strong> wastesectors <strong>in</strong> Delhi <strong>and</strong> Calcutta. Proceed<strong>in</strong>g from IGES/APNmega-city project, Kitakyushu, Japan. Institute for GlobalEnvironmental Strategies.Shima M, Adachi M. 2000. Effect <strong>of</strong> outdoor <strong>and</strong> <strong>in</strong>doornitrogen dioxide on respiratory symptoms <strong>in</strong> schoolchildren.Int J Epidemiol 29:862–870.Shima M, Nitta Y, Adachi M. 2003. Traffic-related air pollution<strong>and</strong> respiratory symptoms <strong>in</strong> children liv<strong>in</strong>g alongtrunk roads <strong>in</strong> Chiba Prefecture, Japan. J Epidemiol13:108–119.Shima M, Nitta Y, Ando M, Adachi M. 2002. Effects <strong>of</strong> airpollution on <strong>the</strong> prevalence <strong>and</strong> <strong>in</strong>cidence <strong>of</strong> asthma <strong>in</strong>children. Arch Environ <strong>Health</strong> 57:529–535.Shimizu S, Kagawa J, Ishiguro M. 2001. [The associationbetween emergency cl<strong>in</strong>ic visits for asthmatic attacks <strong>and</strong>fluctuat<strong>in</strong>g environmental factors]. Arerugi 50:612–620.201
<strong>Outdoor</strong> <strong>Air</strong> <strong>Pollution</strong> <strong>and</strong> <strong>Health</strong> <strong>in</strong> <strong>the</strong> Develop<strong>in</strong>g <strong>Countries</strong> <strong>of</strong> <strong>Asia</strong>Sh<strong>in</strong>kura R, Fujiyama C, Akiba S. 1999. Relationshipbetween ambient sulfur dioxide levels <strong>and</strong> neonatal mortalitynear <strong>the</strong> Mt. Sakurajima volcano <strong>in</strong> Japan. J Epidemiol9:344–349.Shrestha RM, Malla S. 2007. <strong>Air</strong> pollution from energy use<strong>in</strong> a develop<strong>in</strong>g country city: The case <strong>of</strong> Kathm<strong>and</strong>u,Nepal. Available from www.cleanairnet.org/caiasia/1412articles-58928_resource_1.pdf.Simes RJ. 1986. Publication bias: The case for an <strong>in</strong>ternationalregistry <strong>of</strong> cl<strong>in</strong>ical trials. J Cl<strong>in</strong> Oncol 4:1529–1541.Sims REH, Rogner HH, Gregory K. 2003. Carbon emission<strong>and</strong> mitigation cost comparisons between fossil fuel,nuclear <strong>and</strong> renewable energy resources for electricity generation.Energy Policy 31:1315–1326.S<strong>in</strong> DD, Man SFP. 2005. Chronic obstructive pulmonarydisease as a risk factor for cardiovascular morbidity <strong>and</strong>mortality. Proc Am Thorac Soc 2:8–11.S<strong>in</strong> DD, Wu L, Man SFP. 2005. The relationship betweenreduced lung function <strong>and</strong> cardiovascular mortality: Apopulation-based study <strong>and</strong> a systematic review <strong>of</strong> <strong>the</strong> literature.Chest 127:1952–1959.S<strong>in</strong>gh V, Kh<strong>and</strong>elwal R, Gupta AB. 2003. Effect <strong>of</strong> air pollutionon peak expiratory flow rate variability. J Asthma40:81–86.Slama R, Darrow L, Parker J, Woodruff TJ, Strickl<strong>and</strong> M,Nieuwenhuijsen M, Gl<strong>in</strong>ianaia S, Hoggatt KJ, Kannan S,Hurley F, Kal<strong>in</strong>ka J, Šrám R, Brauer M, Wilhelm M, He<strong>in</strong>richJ, Ritz B. 2008. Meet<strong>in</strong>g report: Atmospheric pollution<strong>and</strong> human reproduction. Environ <strong>Health</strong> Perspect116:791–798.Smith KR. 1990. The risk transition. Int Environ Affair2:227–251.Smith KR. 1993. Fuel combustion, air pollution exposure,<strong>and</strong> health: The situation <strong>in</strong> develop<strong>in</strong>g countries. AnnuRev Energ Env 18:529–566.Smith KR, Corvalan CF, Kjellstrom T. 1999. How muchglobal ill health is attributable to environmental factors?Epidemiology 10:573–584.Smith KR, Ezzati M. 2005. How environmental health riskschange with development: The epidemiologic <strong>and</strong> environmentalrisk transitions revisited. Annu Rev Env Resour30:291–333.Smith KR, Haigler E. 2008. Co-benefits <strong>of</strong> climate mitigation<strong>and</strong> health protection <strong>in</strong> energy systems: Scop<strong>in</strong>gmethods. Annu Rev Public <strong>Health</strong> 29:11–25.Smith KR, Mehta S, Maeusezahl-Feuz M. 2004. Indoor airpollution from household use <strong>of</strong> solid fuels. In: ComparativeQuantification <strong>of</strong> <strong>Health</strong> Risks: Global <strong>and</strong> RegionalBurden <strong>of</strong> Diseases Attributable to Selected Major RiskFactors (Ezzati M, Lopez AD, Rodgers A, Murray CJL, eds.).World <strong>Health</strong> Organization, Geneva, Switzerl<strong>and</strong>.Smith KR, Samet JM, Romieu I, Bruce N. 2000a. Indoor airpollution <strong>in</strong> develop<strong>in</strong>g countries <strong>and</strong> acute lower respiratory<strong>in</strong>fections <strong>in</strong> children. Thorax 55:518–532.Smith KR, Uma R, Kishore VVN, Zhang JF, Joshi V, KhalilMAK. 2000b. Greenhouse implications <strong>of</strong> householdstoves: An analysis for India. Annu Rev Energ Environ25:741–763.Son JY, Kim H, Lee JT, Kim SY. 2006. [Relationshipbetween <strong>the</strong> exposure to ozone <strong>in</strong> Seoul <strong>and</strong> <strong>the</strong> childhoodasthma-related hospital admissions accord<strong>in</strong>g to <strong>the</strong> socioeconomicstatus]. J Prev Med Public <strong>Health</strong> 39:81–86.Song HI. 2001. Effect <strong>of</strong> air pollution on childhood asthmaliv<strong>in</strong>g <strong>in</strong> Seoul. J Asthma Allergy Cl<strong>in</strong> Immunol 21:28–39.Song Y, Shao M, Liu Y, Lu SH, Kuster W, Goldan P, Xie SD.2007. Source apportionment <strong>of</strong> ambient volatile organiccompounds <strong>in</strong> Beij<strong>in</strong>g. Environ Sci Technol 41:4348–4353.Song Y, Zhang YH, Xie SD, Zeng LM, Zheng M, SalmonLG, Shao M, Slan<strong>in</strong>a S. 2006. Source apportionment <strong>of</strong>PM 2.5 <strong>in</strong> Beij<strong>in</strong>g by positive matrix factorization. AtmosEnviron 40:1526–1537.Šrám RJ, B<strong>in</strong>kova BB, Dejmek J, Bobak M. 2005. Ambientair pollution <strong>and</strong> pregnancy outcomes: A review <strong>of</strong> <strong>the</strong> literature.Environ <strong>Health</strong> Perspect 113:375–382.Steel Authority <strong>of</strong> India. 1998. Statistics for Iron & SteelIndustry <strong>in</strong> India. Steel Authority <strong>of</strong> India, New Delhi,India.Sterl<strong>in</strong>g TD. 1959. Publication decisions <strong>and</strong> <strong>the</strong>ir possibleeffects on <strong>in</strong>ferences drawn from tests <strong>of</strong> significance—orvice versa. J Am Stat Assoc 54:30–34.Stieb DM, Judek S, Burnett RT. 2002. Meta-analysis <strong>of</strong>time-series studies <strong>of</strong> air pollution <strong>and</strong> mortality: Effects <strong>of</strong>gases <strong>and</strong> particles <strong>and</strong> <strong>the</strong> <strong>in</strong>fluence <strong>of</strong> cause <strong>of</strong> death,age, <strong>and</strong> season. J <strong>Air</strong> Waste Manage Assoc 52:470–484.Stieb DM, Judek S, Burnett RT. 2003. Meta-analysis <strong>of</strong>time-series studies <strong>of</strong> air pollution <strong>and</strong> mortality: Update<strong>in</strong> relation to <strong>the</strong> use <strong>of</strong> generalized additive models. J <strong>Air</strong>Waste Manage Assoc 53:258–261.Streets DG, Bond TC, Carmichael GR, Fern<strong>and</strong>es SD, Fu Q,He D, Klimont Z, Nelson SM, Tsai NY, Wang MQ, Woo JH,202
HEI International Scientific Oversight CommitteeYarber KF. 2003. An <strong>in</strong>ventory <strong>of</strong> gaseous <strong>and</strong> primaryaerosol emissions <strong>in</strong> <strong>Asia</strong> <strong>in</strong> <strong>the</strong> year 2000. J Geophys Res-Atmos 108.Sugiri D, Ranft U, Schikowski T, Krämer U. 2006. The<strong>in</strong>fluence <strong>of</strong> large-scale airborne particle decl<strong>in</strong>e <strong>and</strong>traffic-related exposure on children’s lung function.Environ <strong>Health</strong> Perspect 114:282–288.Sun G. 2001. An Integrated Study <strong>of</strong> Ch<strong>in</strong>a’s <strong>Air</strong> <strong>Pollution</strong>Management: Effectiveness, Efficiency, <strong>and</strong> Governance(Ph.D. Thesis). Carnegie Mellon University, Pittsburgh, PA.Sun JM, Zhang MY, Liu TS. 2001. Spatial <strong>and</strong> temporalcharacteristics <strong>of</strong> dust storms <strong>in</strong> Ch<strong>in</strong>a <strong>and</strong> its surround<strong>in</strong>gregions, 1960–1999: Relations to source area <strong>and</strong> climate. JGeophys Res-Atmos 106(D10):10325–10333.Sun YL, Zhuang GS, Y<strong>in</strong>g W, Han LH, Guo JH, Mo D,Zhang WJ, Wang ZF, Hao ZP. 2004. The air-borne particulatepollution <strong>in</strong> Bej<strong>in</strong>g — Concentration, composition,distribution <strong>and</strong> sources. Atmos Environ 38:5991–6004.Sung J, Kim H, Cho SH. 2001. Summertime heat waves <strong>and</strong>ozone: An <strong>in</strong>teraction on cardiopulmonary mortality? —Based on <strong>the</strong> 1994 heat wave <strong>in</strong> Korea. Korean J Prev Med34:316–322.Swart R, Amann M, Raes F, Tu<strong>in</strong>stra W. 2004. A good climatefor clean air: L<strong>in</strong>kages between climate change <strong>and</strong>air pollution. An editorial essay. Climatic Change 66:263–269.Tam AY, Wong CM, Lam TH, Ong SG, Peters J, Hedley AJ.1994. Bronchial responsiveness <strong>in</strong> children exposed toatmospheric pollution <strong>in</strong> Hong Kong. Chest 106:1056–1060.Tamura K, J<strong>in</strong>sart W, Yano E, Karita K, Boudoung D. 2003.Particulate air pollution <strong>and</strong> chronic respiratory symptomsamong traffic policemen <strong>in</strong> Bangkok. Arch Environ<strong>Health</strong> 58:201–207.Thurston GD, Ito K, Christensen WF, Eatough DJ, HenryRC, Kim E, Laden F, Lall R, Larson TV, Liu H, Neas L, P<strong>in</strong>toJ, Suh H, Hopke PK. 2005. Workgroup report: Workshop onsource apportionment <strong>of</strong> particulate matter health effects— Intercomparison <strong>of</strong> results <strong>and</strong> implications. Environ<strong>Health</strong> Perspect 113:1768–1774.Tokyo Metropolitan Government, Committee on PhotochemicalOxidant Control. 2007. Regional EmissionsInventory <strong>in</strong> <strong>Asia</strong>, version 1.1. Last updated September 27,2007. Available from www.jamstec.go.jp/frcgc/research/p3/reas_c.html. Accessed August 4, 2008.Tong SL, Colditz P. 2004. <strong>Air</strong> pollution <strong>and</strong> sudden <strong>in</strong>fantdeath syndrome: A literature review. Paediatr Per<strong>in</strong>at Epidemiol18:327–335.Toyama T, Adachi S. 1975. Seasonal variations <strong>of</strong> dailymortality <strong>in</strong> Tokyo city. Keio J Med 24:253–260.Tsai HJ, Tsai AC, Nriagu J, Ghosh D, Gong M, S<strong>and</strong>retto A.2006a. Risk factors for respiratory symptoms <strong>and</strong> asthma<strong>in</strong> <strong>the</strong> residential environment <strong>of</strong> 5th grade schoolchildren<strong>in</strong> Taipei, Taiwan. J Asthma 43:355–361Tsai SS, Chen CC, Hsieh HJ, Chang CC, Yang CY. 2006b.<strong>Air</strong> pollution <strong>and</strong> postneonatal mortality <strong>in</strong> a tropical city:Kaohsiung, Taiwan. Inhal Toxicol 18:185–189.Tsai SS, Cheng MH, Chiu HF, Wu TN, Yang CY. 2006c. <strong>Air</strong>pollution <strong>and</strong> hospital admissions for asthma <strong>in</strong> a tropicalcity: Kaohsiung, Taiwan. Inhal Toxicol 18:549–554.Tsai SS, Gogg<strong>in</strong>s WB, Chiu HF, Yang CY. 2003a. Evidencefor an association between air pollution <strong>and</strong> daily strokeadmissions <strong>in</strong> Kaohsiung, Taiwan. Stroke 34:2612–2616.Tsai SS, Huang CH, Gogg<strong>in</strong>s WB, Wu TN, Yang CY. 2003b.Relationship between air pollution <strong>and</strong> daily mortality <strong>in</strong> atropical city: Kaohsiung, Taiwan. J Toxicol Environ <strong>Health</strong>A 66:1341–1349.Tsai SS, Yu HS, Chang CC, Chuang HY, Yang CY. 2004.Increased risk <strong>of</strong> preterm delivery <strong>in</strong> women resid<strong>in</strong>g near<strong>the</strong>rmal power plants <strong>in</strong> Taiwan. Arch Environ <strong>Health</strong>59:478–483.Tsai SS, Yu HS, Liu CC, Yang CY. 2003c. Increased <strong>in</strong>cidence<strong>of</strong> preterm delivery <strong>in</strong> mo<strong>the</strong>rs resid<strong>in</strong>g <strong>in</strong> an <strong>in</strong>dustrializedarea <strong>in</strong> Taiwan. J Toxicol Environ <strong>Health</strong> A66:987–994.Tsai YI, Chen CL. 2006. Atmospheric aerosol composition<strong>and</strong> source apportionments to aerosol <strong>in</strong> sou<strong>the</strong>rn Taiwan.Atmos Environ 40:4751–4763.Tseng RY, Li CK. 1990. Low level atmospheric sulfurdioxide pollution <strong>and</strong> childhood asthma. Ann Allergy65:379–383.Tseng RY, Li CK, Sp<strong>in</strong>ks JA. 1992. Particulate air pollution<strong>and</strong> hospitalization for asthma. Ann Allergy 68:425–432.Tung TCW, Chao CYH, Burnett J, Pang SW, Lee RYM. 1999.A territory wide survey on <strong>in</strong>door particulate level <strong>in</strong> HongKong. Build Environ 34:213–220.Turp<strong>in</strong> BJ, Saxena P, Andrews E. 2000. Measur<strong>in</strong>g <strong>and</strong> simulat<strong>in</strong>gparticulate organics <strong>in</strong> <strong>the</strong> atmosphere: Problems<strong>and</strong> prospects. Atmos Environ 34:2983–3013.203
<strong>Outdoor</strong> <strong>Air</strong> <strong>Pollution</strong> <strong>and</strong> <strong>Health</strong> <strong>in</strong> <strong>the</strong> Develop<strong>in</strong>g <strong>Countries</strong> <strong>of</strong> <strong>Asia</strong>U.S. Census Bureau. 2008. International Data Base (IDB).Last updated December 15, 2008. Available fromwww.census.gov/ipc/www/idb/<strong>in</strong>dex.html.U.S. Environmental Protection Agency. 1993. The Pla<strong>in</strong>English Guide to <strong>the</strong> Clean <strong>Air</strong> Act. EPA-400/K-93-001.Office <strong>of</strong> <strong>Air</strong> Quality Plann<strong>in</strong>g <strong>and</strong> St<strong>and</strong>ards, ResearchTriangle Park, NC.U.S. Environmental Protection Agency. 1994. National <strong>Air</strong>Quality <strong>and</strong> Emissions Trends Report, 2003 SpecialStudies Edition. EPA-454/R-03-005. Office <strong>of</strong> <strong>Air</strong> QualityPlann<strong>in</strong>g <strong>and</strong> St<strong>and</strong>ards. Research Triangle Park, NC.U.S. Environmental Protection Agency. 1998. National <strong>Air</strong>Quality <strong>and</strong> Emissions Trends Report, 1997. EPA-454/R-98-016. Office <strong>of</strong> <strong>Air</strong> Quality Plann<strong>in</strong>g <strong>and</strong> St<strong>and</strong>ards,Research Triangle Park, NC.U.S. Environmental Protection Agency. 1999. The Benefits<strong>and</strong> Costs <strong>of</strong> <strong>the</strong> Clean <strong>Air</strong> Act, 1990 to 2010. EPA-410/R-99-001. Office <strong>of</strong> <strong>Air</strong> <strong>and</strong> Radiation/Office <strong>of</strong> Policy <strong>and</strong>Analysis, Research Triangle Park, NC.U.S. Environmental Protection Agency. 2000. Guidel<strong>in</strong>esfor Prepar<strong>in</strong>g Economic Analyses. EPA-240/R-00-003.Office <strong>of</strong> <strong>the</strong> Adm<strong>in</strong>istrator, Research Triangle Park, NC.U.S. Environmental Protection Agency. 2003. The IntegratedEnvironmental Strategies H<strong>and</strong>book. Office <strong>of</strong> <strong>Air</strong><strong>and</strong> Radiation, Research Triangle Park, NC.U.S. Environmental Protection Agency. 2004. Protocol forApply<strong>in</strong>g <strong>and</strong> Validat<strong>in</strong>g <strong>the</strong> CMB Model for PM 2.5 <strong>and</strong>VOC. EPA-451/R-04-001. Research Triangle Park, NC.U.S. Environmental Protection Agency. 2006. TechnologyTransfer Network. Support Center for Regulatory AtmosphericModel<strong>in</strong>g. Last updated December 31, 2008. Availablefrom www.epa.gov/scram001/receptor_cmb.htm.U.S. Environmental Protection Agency. 2008. National <strong>Air</strong>Quality — Status <strong>and</strong> Trends Through 2007. EPA-454/R-08-006. Office <strong>of</strong> <strong>Air</strong> Quality Plann<strong>in</strong>g <strong>and</strong> St<strong>and</strong>ards,Research Triangle Park, NC.United Nations Economic <strong>and</strong> Social Affairs. 2002. WorldUrbanization Prospects: The 2001 Revision, Data Tables<strong>and</strong> Highlights. Population Division, Department <strong>of</strong> Economic<strong>and</strong> Social Affairs, United Nations, New York, NY.United Nations Economic <strong>and</strong> Social Affairs. 2004a. WorldEconomic Situation <strong>and</strong> Prospects 2004. DevelopmentPolicy <strong>and</strong> Analysis Division, Department <strong>of</strong> Economic<strong>and</strong> Social Affairs, United Nations, New York, NY.United Nations Economic <strong>and</strong> Social Affairs. 2004b. WorldUrbanization Prospects: The 2003 Revision. PopulationDivision, Department <strong>of</strong> Economic <strong>and</strong> Social Affairs,United Nations, New York, NY.United Nations Economic <strong>and</strong> Social Affairs. 2006. WorldPopulation Prospects: The 2006 Revision. Executive Summary.Population Division, Department <strong>of</strong> Economic <strong>and</strong>Social Affairs, United Nations, New York, NY.United Nations Economic <strong>and</strong> Social Commission for <strong>Asia</strong><strong>and</strong> <strong>the</strong> Pacific. 2008. Database <strong>of</strong> Population <strong>and</strong> FamilyPlann<strong>in</strong>g <strong>in</strong> Ch<strong>in</strong>a by Prov<strong>in</strong>ce: Shanghai. Last updatedJuly 31, 2009. Available from www.unescap.org/esidpsis/population/database/ch<strong>in</strong>adata/shanghai.htm. AccessedAugust 4, 2008.United Nations Environment Programme. 2008. AtmosphericBrown Clouds: Regional Assessment Report withFocus on <strong>Asia</strong>. United Nations Environment Programme,Nairobi, Kenya.United Nations Human Settlements Programme (UN-Habitat).2003. The Challenge <strong>of</strong> Slums: Global Report onHuman Settlements, 2003. Earthscan, London.United Nations Human Settlements Programme (UN-Habitat).2004. Manag<strong>in</strong>g Urban Growth <strong>in</strong> a DecentralizedContext. Proceed<strong>in</strong>g from Forum on Habitat <strong>and</strong> E-Habitat,Shanghai, Ch<strong>in</strong>a.United Nations Human Settlements Programme (UN-Habitat).2006a. State <strong>of</strong> <strong>the</strong> World's Cities 2006/7. UnitedNations Human Settlement Programme, Nairobi, Kenya.United Nations Human Settlements Programme (UN-Habitat).2006b. World Urban Forum III: Report <strong>of</strong> <strong>the</strong> ThirdSession <strong>of</strong> <strong>the</strong> World Urban Forum. Proceed<strong>in</strong>g fromWorld Urban Forum III, Vancouver, Canada.United Nations Millennium Project. 2005. Invest<strong>in</strong>g <strong>in</strong>Development: A Practical Plan to Achieve <strong>the</strong> MillenniumDevelopment Goals. Earthscan, London.United Nations Population Fund (UNFPA). 2007. State <strong>of</strong>World Population 2007: Unleash<strong>in</strong>g <strong>the</strong> Potential <strong>of</strong> UrbanGrowth. United Nations Population Fund, New York, NY.Uno I, Carmichael GR, Streets DG, Tang Y, Yienger JJ,Satake S, Wang Z, Woo JH, Guttikunda S, Uematsu M, MatsumotoK, Tanimoto H, Yoshioka K, Iida T. 2003. Regionalchemical wea<strong>the</strong>r forecast<strong>in</strong>g system CFORS: Modeldescriptions <strong>and</strong> analysis <strong>of</strong> surface observations at Japaneseisl<strong>and</strong> stations dur<strong>in</strong>g <strong>the</strong> ACE-<strong>Asia</strong> experiment. JGeophys Res-Atmos 108:8668–8685.204
HEI International Scientific Oversight CommitteeVajanapoom N, Shy CM, Neas LM, Loomis D. 2002. Associations<strong>of</strong> particulate matter <strong>and</strong> daily mortality <strong>in</strong>Bangkok, Thail<strong>and</strong>. Sou<strong>the</strong>ast <strong>Asia</strong>n J Trop Med Public<strong>Health</strong> 33:389–399.van der A RJ, Peters DHMU, Eskes H, Boersma KF, VanRoozendael M, De Smedt I, Kelder HM. 2006. Detection <strong>of</strong><strong>the</strong> trend <strong>and</strong> seasonal variation <strong>in</strong> tropospheric NO 2 overCh<strong>in</strong>a. J Geophys Res 111:D12317, doi:10.1029/2005JD006594.van Vuuren DP, C<strong>of</strong>ala J, Eerens HE, Oostenrijk R, Heyes C,Klimont Z, den Elzen MGJ, Amann M. 2006. Explor<strong>in</strong>g <strong>the</strong>ancillary benefits <strong>of</strong> <strong>the</strong> Kyoto Protocol for air pollution <strong>in</strong>Europe. Energy Policy 34:444–460.VanCuren RA. 2006. <strong>Asia</strong>n aerosols <strong>in</strong> North America:Extract<strong>in</strong>g <strong>the</strong> chemical composition <strong>and</strong> mass concentrations<strong>of</strong> <strong>the</strong> <strong>Asia</strong>n cont<strong>in</strong>ental aerosol plume from longtermaerosol records <strong>in</strong> <strong>the</strong> western United States. J GeophysRes-Atmos 108(D20): 4623–4639. doi:10.1029/2003JD003459.Venners SA, Wang B, Xu Z, Schlatter Y, Wang L, Xu X.2003. Particulate matter, sulfur dioxide, <strong>and</strong> daily mortality<strong>in</strong> Chongq<strong>in</strong>g, Ch<strong>in</strong>a. Environ <strong>Health</strong> Perspect111:562–567.Vestbo J, Hogg JC. 2006. Convergence <strong>of</strong> <strong>the</strong> epidemiology<strong>and</strong> pathology <strong>of</strong> COPD. Thorax 61:86–88.Vichit-Vadakan N, Sasivimolkul W. 2002. Unleaded gasol<strong>in</strong>epolicy: <strong>Health</strong> benefits for school children <strong>and</strong> trafficpolicemen <strong>in</strong> Bangkok Metropolitan Adm<strong>in</strong>istration. <strong>Pollution</strong>Control Department (PCD), M<strong>in</strong>istry <strong>of</strong> NaturalResources <strong>and</strong> Environment, Bangkok, Thail<strong>and</strong>.Vichit-Vadakan N, Vajanapoom N, Ostro B. 2010. Part 3.Estimat<strong>in</strong>g <strong>the</strong> effects <strong>of</strong> air pollution on mortality <strong>in</strong>Bangkok, Thail<strong>and</strong>. In: Public <strong>Health</strong> <strong>and</strong> <strong>Air</strong> <strong>Pollution</strong> <strong>in</strong><strong>Asia</strong> (PAPA): Coord<strong>in</strong>ated Studies <strong>of</strong> Short-Term Exposureto <strong>Air</strong> <strong>Pollution</strong> <strong>and</strong> Daily Mortality <strong>in</strong> Four Cities.Research Report 154. <strong>Health</strong> Effects Institute, Boston, MA.Vichit-Vadakan N, Vajanapoom N, Ostro B. 2008. ThePublic <strong>Health</strong> <strong>and</strong> <strong>Air</strong> <strong>Pollution</strong> <strong>in</strong> <strong>Asia</strong> (PAPA) Project:Estimat<strong>in</strong>g <strong>the</strong> mortality effects <strong>of</strong> particulate matter <strong>in</strong>Bangkok, Thail<strong>and</strong>. Environ <strong>Health</strong> Perspect 116:1179–1182.V<strong>in</strong>eis P, Forastiere F, Hoek G, Lipsett M. 2004. <strong>Outdoor</strong> airpollution <strong>and</strong> lung cancer: Recent epidemiologic evidence.Int J Cancer 111:647–652.von Klot S, Peters A, Aalto P, Bell<strong>and</strong>er T, Bergl<strong>in</strong>d N,D'Ippoliti D, Elosua R, Hormann A, Kulmala M, Lanki T,Lowel H, Pekkanen J, Picciotto S, Sunyer J, Forastiere F,<strong>Health</strong> Effects <strong>of</strong> Particles on Susceptible Subpopulations(HEAPSS) Study Group. 2005. Ambient air pollution isassociated with <strong>in</strong>creased risk <strong>of</strong> hospital cardiac readmissions<strong>of</strong> myocardial <strong>in</strong>farction survivors <strong>in</strong> five Europeancities. Circulation 112:3073–3079.Walsh MP. 2008. Ancillary benefits for climate change mitigation<strong>and</strong> air pollution control <strong>in</strong> <strong>the</strong> world's motorvehicle fleets. Annu Rev Public <strong>Health</strong> 29:1–9.Wang H, L<strong>in</strong> G, Pan X. 2003. Association between totalsuspended particles <strong>and</strong> cardiovascular disease mortality<strong>in</strong> Shenyang. J Environ <strong>Health</strong> 20:13–15.Wang JY, Hsiue TR, Chen HI. 1992. Bronchial responsiveness<strong>in</strong> an area <strong>of</strong> air pollution result<strong>in</strong>g from wire reclamation.Arch Dis Child 67:488–490.Wang KY. 2007. Long-range transport <strong>of</strong> <strong>the</strong> April 2001dust clouds over <strong>the</strong> subtropical East <strong>Asia</strong> <strong>and</strong> <strong>the</strong> NorthPacific <strong>and</strong> its impacts on ground-level air pollution: ALagrangian simulation. J Geophys Res-Atmos 112.Wang TN, Ko YC, Chao YY, Huang CC, L<strong>in</strong> RS. 1999. Associationbetween <strong>in</strong>door <strong>and</strong> outdoor air pollution <strong>and</strong> adolescentasthma from 1995 to 1996 <strong>in</strong> Taiwan. Environ Res81:239–247.Wang X, D<strong>in</strong>g H, Ryan L, Xu X. 1997. Association betweenair pollution <strong>and</strong> low birth weight: A community-basedstudy. Environ <strong>Health</strong> Perspect 105:514–520.Wang XH, Bi XH, Sheng GY, Fu JM. 2006. Chemical composition<strong>and</strong> sources <strong>of</strong> PM 10 <strong>and</strong> PM 2.5 aerosols <strong>in</strong> Guangzhou,Ch<strong>in</strong>a. Environ Monit Assess 119:425–439.Wang XL, Sato T, X<strong>in</strong>g BS, Tamamura S, Tao S. 2005.Source identification, size distribution <strong>and</strong> <strong>in</strong>dicatorscreen<strong>in</strong>g <strong>of</strong> airborne trace metals <strong>in</strong> Kanazawa, Japan. JAerosol Sci 36:197–210.Wang YX, McElroy MB, Boersma KF, Eskes HJ, Veefk<strong>in</strong>d JP.2007. Traffic restrictions associated with <strong>the</strong> S<strong>in</strong>o-Africansummit: Reductions <strong>of</strong> NO x detected from space. GeophysRes Lett 34:L08814.Ward’s Automotive Group. 2008. Ward’s World MotorVehicle Data. Ward’s Automotive Group, Southfield, MI.Watson JG, Rob<strong>in</strong>son NF, Chow JC, Henry RC, Kim BM,Pace TG, Meyer EI, Nguyen Q. 1990. The USEPA/DRIchemical mass balance receptor model, CMB 7.0. EnvironS<strong>of</strong>tw 5:38–49.West JJ, Fiore AM, Horowitz LW, Mauzerall DL. 2006.Global health benefits <strong>of</strong> mitigat<strong>in</strong>g ozone pollution with205
<strong>Outdoor</strong> <strong>Air</strong> <strong>Pollution</strong> <strong>and</strong> <strong>Health</strong> <strong>in</strong> <strong>the</strong> Develop<strong>in</strong>g <strong>Countries</strong> <strong>of</strong> <strong>Asia</strong>methane emission controls. Proc Natl Acad Sci USA103:3988–3993.West JJ, Osnaya P, Laguna I, Mart<strong>in</strong>ez J, Fern<strong>and</strong>ez A. 2004.Co-control <strong>of</strong> urban air pollutants <strong>and</strong> greenhouse gases <strong>in</strong>Mexico City. Environ Sci Technol 38:3474–3481.Wichmann HE, Mueller W, Allh<strong>of</strong>f P, Beckmann M, BocterN, Csicsaky MJ, Jung M, Molik B, Schoeneberg G. 1989.<strong>Health</strong> effects dur<strong>in</strong>g a smog episode <strong>in</strong> West Germany <strong>in</strong>1985. Environ <strong>Health</strong> Perspect 79:89–99.Wilk<strong>in</strong>son P, Smith KR, J<strong>of</strong>fe M, Ha<strong>in</strong>es A. 2007. Energy<strong>and</strong> <strong>Health</strong> 1 — A global perspective on energy: <strong>Health</strong>effects <strong>and</strong> <strong>in</strong>justices. Lancet 370:965–978.W<strong>in</strong>ebrake JJ, Green EH, Kasibhatla P, Eyr<strong>in</strong>g V, Lauer A.2007. Mortality from ship emissions: A global assessment.Environ Sci Technol 41:8512–8518.Wong CM, Atk<strong>in</strong>son RW, Anderson HR, Hedley AJ, Ma S,Chau PY, Lam TH. 2002a. A tale <strong>of</strong> two cities: Effects <strong>of</strong> airpollution on hospital admissions <strong>in</strong> Hong Kong <strong>and</strong>London compared. Environ <strong>Health</strong> Perspect 110:67–77.Wong CM, Lam TH, Peters J, Hedley AJ, Ong SG, Tam AY,Liu J, Spiegelhalter DJ. 1998. Comparison between two districts<strong>of</strong> <strong>the</strong> effects <strong>of</strong> an air pollution <strong>in</strong>tervention on bronchialresponsiveness <strong>in</strong> primary school children <strong>in</strong> HongKong. J Epidemiol Commun <strong>Health</strong> 52:571–578.Wong CM, Ma S, Hedley AJ, Lam TH. 1999a. Does ozonehave any effect on daily hospital admissions for circulatorydiseases? J Epidemiol Commun <strong>Health</strong> 53:580–581.Wong CM, Ma S, Hedley AJ, Lam TH. 2001a. Effect <strong>of</strong> airpollution on daily mortality <strong>in</strong> Hong Kong. Environ <strong>Health</strong>Perspect 109:335–340.Wong C-M on behalf <strong>of</strong> <strong>the</strong> PAPA teams: Bangkok, HongKong, Shanghai, <strong>and</strong> Wuhan. 2010a. Part 5. Public <strong>Health</strong><strong>and</strong> <strong>Air</strong> <strong>Pollution</strong> <strong>in</strong> <strong>Asia</strong> (PAPA): A comb<strong>in</strong>ed analysis <strong>of</strong>four studies <strong>of</strong> air pollution <strong>and</strong> mortality. In: Public<strong>Health</strong> <strong>and</strong> <strong>Air</strong> <strong>Pollution</strong> <strong>in</strong> <strong>Asia</strong> (PAPA): Coord<strong>in</strong>atedStudies <strong>of</strong> Short-Term Exposure to <strong>Air</strong> <strong>Pollution</strong> <strong>and</strong> DailyMortality <strong>in</strong> Four Cities. Research Report 154. <strong>Health</strong>Effects Institute, Boston, MA.Wong CM, Ou CQ, Chan KP, Chau YK, Thach TQ, Yang L,Chung RYN, Thomas GN, Peiris JSM, Wong TW, HedleyAJ, Lam TH. 2008a. The effects <strong>of</strong> air pollution on mortality<strong>in</strong> socially deprived urban areas <strong>in</strong> Hong Kong,Ch<strong>in</strong>a. Environ <strong>Health</strong> Perspect 116:1189–1119.Wong CM, Rabl A, Thach TQ, Chau YK, Chan KP, Cowl<strong>in</strong>gBJ, Lai HK, Lam TH, McGhee SM, Anderson HR, HedleyAJ. 2009. <strong>Air</strong> pollution effects on life expectancy before<strong>and</strong> after restriction <strong>of</strong> fuel sulphur content <strong>in</strong> Hong Kong(abstract). In: <strong>Health</strong> Effects Institute Annual ConferenceBook, May 3–5, 2009, Portl<strong>and</strong>, Oregon. <strong>Health</strong> EffectsInstitute, Boston, MA.Wong C-M, Thach TQ, Chau PYK, Chan EKP, Chung RY-N,Ou C-Q, Yang L, Peiris JSM, Thomas GN, Lam T-H, WongT-W, Hedley AJ. 2010b. Part 4. Interaction between air pollution<strong>and</strong> respiratory viruses: Time-series study <strong>of</strong> dailymortality <strong>and</strong> hospital admissions <strong>in</strong> Hong Kong. In:Public <strong>Health</strong> <strong>and</strong> <strong>Air</strong> <strong>Pollution</strong> <strong>in</strong> <strong>Asia</strong> (PAPA): Coord<strong>in</strong>atedStudies <strong>of</strong> Short-Term Exposure to <strong>Air</strong> <strong>Pollution</strong> <strong>and</strong>Daily Mortality <strong>in</strong> Four Cities. Research Report 154. <strong>Health</strong>Effects Institute, Boston, MA.Wong CM, Vichit-Vadakan N, Kan HD, Qian ZM, PapaProject Teams. 2008b. Public <strong>Health</strong> <strong>and</strong> <strong>Air</strong> <strong>Pollution</strong> <strong>in</strong><strong>Asia</strong> (PAPA): A multi-city study <strong>of</strong> short-term effects <strong>of</strong> airpollution on mortality. Environ <strong>Health</strong> Perspect 116:1195–1202.Wong GW, Ko FW, Lau TS, Li ST, Hui D, Pang SW, Leung R,Fok TF, Lai CK. 2001b. Temporal relationship between airpollution <strong>and</strong> hospital admissions for asthmatic children<strong>in</strong> Hong Kong. Cl<strong>in</strong> Exp Allergy 31:565–569.Wong TW, Lau TS, Yu TS, Neller A, Wong SL, Tam W, PangSW. 1999b. <strong>Air</strong> pollution <strong>and</strong> hospital admissions for respiratory<strong>and</strong> cardiovascular diseases <strong>in</strong> Hong Kong. OccupEnviron Med 56:679–683.Wong TW, Tam W, Tak Sun Yu I, Wun YT, Wong AH, WongCM. 2006. Association between air pollution <strong>and</strong> generalpractitioner visits for respiratory diseases <strong>in</strong> Hong Kong.Thorax 61:585–591.Wong TW, Tam WS, Yu TS, Wong AH. 2002b. Associationsbetween daily mortalities from respiratory <strong>and</strong> cardiovasculardiseases <strong>and</strong> air pollution <strong>in</strong> Hong Kong, Ch<strong>in</strong>a.Occup Environ Med 59:30–35.Wong TW, Wun YT, Yu TS, Tam W, Wong CM, Wong AH.2002c. <strong>Air</strong> pollution <strong>and</strong> general practice consultations forrespiratory illnesses. J Epidemiol Commun <strong>Health</strong> 56:949–950.Wongsurakiat P, Nana A, Aksorn<strong>in</strong>t M, Maranetra KN,Naruman C, Chalermsanyakorn T. 1999. Respiratory symptoms<strong>and</strong> pulmonary function <strong>of</strong> traffic policemen <strong>in</strong>Thonburi. J Med Assoc Thai 82:435–443.Woodruff RE, McMichael T, Butler C, Hales S. 2006a.Action on climate change: The health risks <strong>of</strong> procrast<strong>in</strong>at<strong>in</strong>g.Aust N Z J Public <strong>Health</strong> 30:567–571.206
HEI International Scientific Oversight CommitteeWoodruff TJ, Grillo J, Schoendorf KC. 1997. The relationshipbetween selected causes <strong>of</strong> postneonatal <strong>in</strong>fant mortality<strong>and</strong> particulate air pollution <strong>in</strong> <strong>the</strong> United States.Environ <strong>Health</strong> Perspect 105:608–612.Woodruff TJ, Parker JD, Schoendorf KC. 2006b. F<strong>in</strong>e particulatematter (PM 2.5 ) air pollution <strong>and</strong> selected causes <strong>of</strong>postneonatal <strong>in</strong>fant mortality <strong>in</strong> California. Environ <strong>Health</strong>Perspect 114:786–790.Woods Hole Research Center. 2006. L<strong>in</strong>k<strong>in</strong>g Climate Policywith Development Strategy: "W<strong>in</strong>-W<strong>in</strong>" Options for Brazil,Ch<strong>in</strong>a, <strong>and</strong> India. Woods Hole Research Center.World Bank. 2005. Towards a discussion <strong>of</strong> support tourban transport development <strong>in</strong> India. Energy <strong>and</strong> InfrastructureUnit, South <strong>Asia</strong> Region, World Bank, Wash<strong>in</strong>gton,DC.World Bank. 2008. World Development Indicators, 2008.Wash<strong>in</strong>gton DC.World Bank <strong>and</strong> State Environmental Protection Adm<strong>in</strong>istration.2007. Cost <strong>of</strong> <strong>Pollution</strong> <strong>in</strong> Ch<strong>in</strong>a: Economic Estimates<strong>of</strong> Physical Damages. Rural Development, NaturalResources <strong>and</strong> Environmental Management Unit, East <strong>Asia</strong><strong>and</strong> Pacific Region, World Bank, Wash<strong>in</strong>gton, DC, <strong>and</strong>State Environmental Protection Adm<strong>in</strong>istration, P.R.Ch<strong>in</strong>a.World Bus<strong>in</strong>ess Council for Susta<strong>in</strong>able Development.2004. Mobility 2030: Meet<strong>in</strong>g <strong>the</strong> Challenges to Susta<strong>in</strong>ability.World Bus<strong>in</strong>ess Council for Susta<strong>in</strong>able Development,Geneva, Switzerl<strong>and</strong>.World <strong>Health</strong> Organization. 2001. Global Burden <strong>of</strong> Disease(GBD) 2000. WHO, Geneva, Switzerl<strong>and</strong>.World <strong>Health</strong> Organization. 2002. World <strong>Health</strong> Report2002: Reduc<strong>in</strong>g Risk, Promot<strong>in</strong>g <strong>Health</strong>y Life. WHO,Geneva, Switzerl<strong>and</strong>.World <strong>Health</strong> Organization. 2005a. <strong>Air</strong> Quality Guidel<strong>in</strong>esfor Particulate Matter, Ozone, Nitrogen Dioxide <strong>and</strong> SulfurDioxide: Global Update 2005. WHO, Geneva, Switzerl<strong>and</strong>.Available from http://whqlibdoc.who.<strong>in</strong>t/hq/2006/WHO-_SDE_PHE_OEH_06.02_eng.pdf. Accessed July 26, 2008.World <strong>Health</strong> Organization. 2005b. Effects <strong>of</strong> air pollutionon children's health <strong>and</strong> development: A review <strong>of</strong> <strong>the</strong> evidence.WHO European Centre for Environment <strong>and</strong><strong>Health</strong>, WHO Regional Office for Europe, Bonn, Germany.World <strong>Health</strong> Organization. 2006a. <strong>Air</strong> Quality Guidel<strong>in</strong>es.Global Update 2005. WHO, Geneva Switzerl<strong>and</strong>.World <strong>Health</strong> Organization. 2006b. WHO challenges worldto improve air quality: Stricter air pollution st<strong>and</strong>ardscould reduce deaths <strong>in</strong> polluted cities by 15%. WHO,Geneva, Switzerl<strong>and</strong>. http://www.who.<strong>in</strong>t/mediacentre/news/releases/2006/pr52/en/<strong>in</strong>dex.htmlWorld <strong>Health</strong> Organization. 2007a. Indoor <strong>Air</strong> <strong>Pollution</strong>:National Burden <strong>of</strong> Disease Estimates. WHO, Geneva,Switzerl<strong>and</strong>.World <strong>Health</strong> Organization. 2007b. The World <strong>Health</strong>Report 2007 — A Safer Future: Global Public <strong>Health</strong> Security<strong>in</strong> <strong>the</strong> 21st Century. WHO, Geneva, Switzerl<strong>and</strong>.World <strong>Health</strong> Organization. 2007c. <strong>Health</strong> relevance <strong>of</strong>particulate matter from various sources. Report on a WHOworkshop. WHO Regional Office for Europe, Bonn, Germany.World <strong>Health</strong> Organization. 2008. Global Burden <strong>of</strong> Disease2004 Update. WHO, Geneva, Switzerl<strong>and</strong>.www.who.<strong>in</strong>t/health<strong>in</strong>fo/global_burden_disease/2004_report_update/en/<strong>in</strong>dex.htmlWuhan Environmental Protection Bureau, Wuhan, PRC.www.whepb.gov.cn/. Last updated October 29, 2009.Xia Y, Tong H. 2006. Cumulative effects <strong>of</strong> air pollution onpublic health. Stat Med 25:3548–3559.Xu J, Zhang YH, Fu JS, Zheng SQ, Wang W. 2008. Processanalysis <strong>of</strong> typical summertime ozone episodes over <strong>the</strong>Beij<strong>in</strong>g area. Sci Total Environ 399:147–157.Xu X. 1998. Synergistic effects <strong>of</strong> air pollution <strong>and</strong> personalsmok<strong>in</strong>g on adult pulmonary function. Arch Environ<strong>Health</strong> 53:44–45.Xu X, D<strong>in</strong>g H, Wang X. 1995a. Acute effects <strong>of</strong> total suspendedparticles <strong>and</strong> sulfur dioxides on preterm delivery:A community-based cohort study. Arch Environ <strong>Health</strong>50:407–415.Xu X, Dockery DW, Christiani DC, Li B, Huang H. 1995b.Association <strong>of</strong> air pollution with hospital outpatient visits<strong>in</strong> Beij<strong>in</strong>g. Arch Environ <strong>Health</strong> 50:214–220.Xu X, Gao J, Dockery DW, Chen Y. 1994. <strong>Air</strong> pollution <strong>and</strong>daily mortality <strong>in</strong> residential areas <strong>of</strong> Beij<strong>in</strong>g, Ch<strong>in</strong>a. ArchEnviron <strong>Health</strong> 49:216–222.Xu X, Li B, Huang H. 1995c. <strong>Air</strong> pollution <strong>and</strong> unscheduledhospital outpatient <strong>and</strong> emergency room visits.Environ <strong>Health</strong> Perspect 103:286–289.Xu X, Wang L. 1993. Association <strong>of</strong> <strong>in</strong>door <strong>and</strong> outdoorparticulate level with chronic respiratory illness. Am RevRespir Dis 148:1516–1522.207
<strong>Outdoor</strong> <strong>Air</strong> <strong>Pollution</strong> <strong>and</strong> <strong>Health</strong> <strong>in</strong> <strong>the</strong> Develop<strong>in</strong>g <strong>Countries</strong> <strong>of</strong> <strong>Asia</strong>Xu XP, Dockery DW, Wang L. 1991. Effects <strong>of</strong> air pollutionon adult pulmonary function. Arch Environ <strong>Health</strong>46:198–206.Xu Z, Liu Y, Yu D, J<strong>in</strong>g L, Chen BH, Kjellstrom T. 2000.Effect <strong>of</strong> air pollution on mortality <strong>in</strong> Shenyang, Ch<strong>in</strong>a.Arch Environ <strong>Health</strong> 55:115–120.Xu ZY, Blot WJ, Xiao HP, Wu A, Feng YP, Stone BJ, Sun J,Ershow AG, Henderson BE, Fraumeni JF. 1989. Smok<strong>in</strong>g,air pollution, <strong>and</strong> <strong>the</strong> high rates <strong>of</strong> lung cancer <strong>in</strong> Shenyang,Ch<strong>in</strong>a. J Natl Cancer Inst 81:1800–1806.Yamazaki S, Nitta H, Ono M, Green J, Fukuhara S. 2007.Intracerebral haemorrhage associated with hourly concentration<strong>of</strong> ambient particulate matter: Case–crossover analysis.Occup Environ Med 64:17–24.Yang CY. 2006. Effects <strong>of</strong> <strong>Asia</strong>n dust storm events on dailycl<strong>in</strong>ical visits for conjunctivitis <strong>in</strong> Taipei, Taiwan. J ToxicolEnviron <strong>Health</strong> A 69:1673–1680.Yang CY, Chang CC, Chuang HY, Ho CK, Wu TN, Chang PY.2004a. Increased risk <strong>of</strong> preterm delivery among peopleliv<strong>in</strong>g near <strong>the</strong> three oil ref<strong>in</strong>eries <strong>in</strong> Taiwan. Environ Int30:337–342.Yang CY, Chang CC, Chuang HY, Ho CK, Wu TN, Tsai SS.2003a. Evidence for <strong>in</strong>creased risks <strong>of</strong> preterm delivery <strong>in</strong>a population resid<strong>in</strong>g near a freeway <strong>in</strong> Taiwan. ArchEnviron <strong>Health</strong> 58:649–654.Yang CY, Chang CC, Chuang HY, Tsai SS, Wu TN, Ho CK.2004b. Relationship between air pollution <strong>and</strong> daily mortality<strong>in</strong> a subtropical city: Taipei, Taiwan. Environ Int30:519–523.Yang CY, Cheng BH, Hsu TY, Chuang HY, Wu TN, ChenPC. 2002a. Association between petrochemical air pollution<strong>and</strong> adverse pregnancy outcomes <strong>in</strong> Taiwan. ArchEnviron <strong>Health</strong> 57:461–465.Yang CY, Chen CC, Chen CY, Kuo HW. 2007. <strong>Air</strong> pollution<strong>and</strong> hospital admissions for asthma <strong>in</strong> a subtropical city:Taipei, Taiwan. J Toxicol Environ <strong>Health</strong> A 70:111–117.Yang CY, Chen CJ. 2007. <strong>Air</strong> pollution <strong>and</strong> hospital admissionsfor chronic obstructive pulmonary disease <strong>in</strong> a subtropicalcity: Taipei, Taiwan. J Toxicol Environ <strong>Health</strong> A70:1214–1219.Yang CY, Cheng MF, Chiu JF, Tsai SS. 1999. Female lungcancer <strong>and</strong> petrochemical air pollution <strong>in</strong> Taiwan. ArchEnviron <strong>Health</strong> 54:180–185.Yang CY, Chen YS, Chiu HF, Gogg<strong>in</strong>s WB. 2005a. Effects <strong>of</strong><strong>Asia</strong>n dust storm events on daily stroke admissions <strong>in</strong>Taipei, Taiwan. Environ Res 99:79–84.Yang CY, Chen YS, Yang CH, Ho SC. 2004c. Relationshipbetween ambient air pollution <strong>and</strong> hospital admissions forcardiovascular diseases <strong>in</strong> Kaohsiung, Taiwan. J ToxicolEnviron <strong>Health</strong> A 67:483–493.Yang CY, Chiu HF, Tsai SS, Chang CC, Chuang HY. 2002b.Increased risk <strong>of</strong> preterm delivery <strong>in</strong> areas with cancermortality problems from petrochemical complexes.Environ Res 89:195–200.Yang CY, Hsieh HJ, Tsai SS, Wu TN, Chiu HF. 2006. Correlationbetween air pollution <strong>and</strong> postneonatal mortality <strong>in</strong>a subtropical city: Taipei, Taiwan. J Toxicol Environ <strong>Health</strong>A 69:2033–2040.Yang CY, Tsai SS, Chang CC, Ho SC. 2005b. Effects <strong>of</strong> Asi<strong>and</strong>ust storm events on daily admissions for asthma <strong>in</strong>Taipei, Taiwan. Inhal Toxicol 17:817–821.Yang CY, Tseng YT, Chang CC. 2003b. Effects <strong>of</strong> air pollutionon birth weight among children born between 1995<strong>and</strong> 1997 <strong>in</strong> Kaohsiung, Taiwan. J Toxicol Environ <strong>Health</strong>A 66:807–816.Yang CY, Wang JD, Chan CC, Chen PC, Huang JS, ChengMF. 1997. Respiratory <strong>and</strong> irritant health effects <strong>of</strong> a populationliv<strong>in</strong>g <strong>in</strong> a petrochemical-polluted area <strong>in</strong> Taiwan.Environ Res 74:145–149.Yang CY, Wang JD, Chan CC, Hwang JS, Chen PC. 1998.Respiratory symptoms <strong>of</strong> primary school children liv<strong>in</strong>g <strong>in</strong>a petrochemical polluted area <strong>in</strong> Taiwan. Pediatr Pulmonol25:299–303.Yang CY, Yu ST, Chang CC. 2002c. Respiratory symptoms<strong>in</strong> primary schoolchildren liv<strong>in</strong>g near a freeway <strong>in</strong> Taiwan.J Toxicol Environ <strong>Health</strong> A 65:714–755.Yang F, He K, Ye B, Chen X, Cha L, Cadle SH, Chan T,Mulawa PA. 2005c. One-year record <strong>of</strong> organic <strong>and</strong> elementalcarbon <strong>in</strong> f<strong>in</strong>e particles <strong>in</strong> downtown Beij<strong>in</strong>g <strong>and</strong>Shanghai. Atmos Chem Phys 5:217–241.Yano E, Yokoyama Y, Nishii S. 1986. Chronic pulmonaryeffects <strong>of</strong> volcanic ash: An epidemiologic study. ArchEnviron <strong>Health</strong> 41:94–99.Ye F, Piver WT, Ando M, Portier CJ. 2001. Effects <strong>of</strong> temperature<strong>and</strong> air pollutants on cardiovascular <strong>and</strong> respiratorydiseases for males <strong>and</strong> females older than 65 years <strong>of</strong> age <strong>in</strong>Tokyo, July <strong>and</strong> August 1980-1995. Environ <strong>Health</strong> Perspect109:355–359.Yu IT, Wong TW, Liu HJ. 2004. Impact <strong>of</strong> air pollution oncardiopulmonary fitness <strong>in</strong> schoolchildren. J OccupEnviron Med 46:946–952.208
HEI International Scientific Oversight CommitteeYu JH, Lue KH, Lu KH, Sun HL, L<strong>in</strong> YH, Chou MC. 2005.The relationship <strong>of</strong> air pollution to <strong>the</strong> prevalence <strong>of</strong>allergic diseases <strong>in</strong> Taichung <strong>and</strong> Chu-Shan <strong>in</strong> 2002. JMicrobiol Immunol Infect 38:123–126.Yu TS, Wong TW, Wang XR, Song H, Wong SL, Tang JL, YuTS. 2001. Adverse effects <strong>of</strong> low-level air pollution on <strong>the</strong>respiratory health <strong>of</strong> schoolchildren <strong>in</strong> Hong Kong. JOccup Environ Med 43:310–316.Yusuf S, Hawken S, Ounpuu S, Dans T, Avezum A, LanasF, McQueen M, Budaj A, Pais P, Varigos J, Lisheng L. 2004.Effect <strong>of</strong> potentially modifiable risk factors associated withmyocardial <strong>in</strong>farction <strong>in</strong> 52 countries (<strong>the</strong> INTERHEARTstudy): Case–control study. Lancet 364:937–952.Yusuf S, Reddy S, Ounpuu S. 2001a. Global burden <strong>of</strong> cardiovasculardiseases — Part II: Variations <strong>in</strong> cardiovasculardisease by specific ethnic groups <strong>and</strong> geographicregions <strong>and</strong> prevention strategies. Circulation 104:2855–2864.Yusuf S, Reddy S, Ounpuu S, An<strong>and</strong> S. 2001b. Globalburden <strong>of</strong> cardiovascular diseases — Part I: General considerations,<strong>the</strong> epidemiologic transition, risk factors, <strong>and</strong>impact <strong>of</strong> urbanization. Circulation 104:2746–2753.Zanobetti A, Schwartz J. 2005. The effect <strong>of</strong> particulate airpollution on emergency admissions for myocardial <strong>in</strong>farction:A multicity case–crossover analysis. Environ <strong>Health</strong>Perspect 113:978–982.Zanobetti A, Schwartz J, Samoli E, Gryparis A, TouloumiG, Atk<strong>in</strong>son R, Le Tertre A, Bobros J, Celko M, Goren A,Forsberg B, Michelozzi P, Rabczenko D, Ruiz EA, KatsouyanniK. 2002. The temporal pattern <strong>of</strong> mortality responsesto air pollution: A multicity assessment <strong>of</strong> mortality displacement.Epidemiology 13:87–93.Zanobetti A, Schwartz J, Samoli E, Gryparis A, TouloumiG, Peacock J, Anderson RH, Le Tertre A, Bobros J, Celko M,Goren A, Forsberg B, Michelozzi P, Rabczenko D, HoyosSP, Wichmann HE, Katsouyanni K. 2003. The temporalpattern <strong>of</strong> respiratory <strong>and</strong> heart disease mortality <strong>in</strong>response to air pollution. Environ <strong>Health</strong> Perspect111:1188–1193.Zemp E, Elsasser S, Sch<strong>in</strong>dler C, Künzli N, Perruchoud AP,Domenighetti G, Medici T, Ackermann-Liebrich U, LeuenbergerP, Monn C, Bologn<strong>in</strong>i G, Bongard JP, Br<strong>and</strong>li O,Karrer W, Keller R, Schoni MH, Tschopp JM, Villiger B,Zellweger JP (The SAPALDIA Team). 1999. Long-termambient air pollution <strong>and</strong> respiratory symptoms <strong>in</strong> adults(SAPALDIA study). Am J Respir Crit Care Med 159:1257–1266.Zhang J, Qian Z, Kong L, Zhou L, Yan L, Chapman RS.1999. Effects <strong>of</strong> air pollution on respiratory health <strong>of</strong>adults <strong>in</strong> three Ch<strong>in</strong>ese cities. Arch Environ <strong>Health</strong>54:373–381.Zhang JF, Hu W, Wei FS, Wu GP, Korn LR, Chapman RS.2002. Children's respiratory morbidity prevalence <strong>in</strong> relationto air pollution <strong>in</strong> four Ch<strong>in</strong>ese cities. Environ <strong>Health</strong>Perspect 110:961–967.Zhang JF, Smith KR. 2003. Indoor air pollution: A globalhealth concern. Br Med Bull 68:209–225.Zhang JJ, Lioy PJ. 2002. Human exposure assessment <strong>in</strong> airpollution systems. ScientificWorldJournal 2:497–513.Zhang Y, Huang W, London SJ, Song G, Chen G, Jiang L,Zhao N, Chen B, Kan H. 2006. Ozone <strong>and</strong> daily mortality<strong>in</strong> Shanghai, Ch<strong>in</strong>a. Environ <strong>Health</strong> Perspect 114:1227–1232.Zhang YP, Zhang ZQ, Liu XH, Zhang XP, Feng BQ, Li HP.2007. [Concentration-response relationship between particulateair pollution <strong>and</strong> daily mortality <strong>in</strong> Taiyuan].Beij<strong>in</strong>g Da Xue Xue Bao 39:153–157.Zhao YL, Hu M, Slan<strong>in</strong>a S, Zhang YH. 2007. Chemicalcompositions <strong>of</strong> f<strong>in</strong>e particulate organic matter emittedfrom Ch<strong>in</strong>ese cook<strong>in</strong>g. Environ Sci Technol 41:99–105.Zheng M, Hagler GSW, Ke L, Berg<strong>in</strong> MH, Wang F, LouiePKK, Salmon L, S<strong>in</strong> DWM, Yu JZ, Schauer JJ. 2006. Composition<strong>and</strong> sources <strong>of</strong> carbonaceous aerosols at threecontrast<strong>in</strong>g sites <strong>in</strong> Hong Kong. J Geophys Res-Atmos 111.Zheng M, Salmon LG, Schauer JJ, Zeng LM, Kiang CS,Zhang YH, Cass GR. 2005. Seasonal trends <strong>in</strong> PM 2.5 sourcecontributions <strong>in</strong> Beij<strong>in</strong>g, Ch<strong>in</strong>a. Atmos Environ 39:3967–3976.Zhou K, Ye YH, Liu Q, Liu AJ, Peng SL. 2007. Evaluation <strong>of</strong>ambient air quality <strong>in</strong> Guangzhou, Ch<strong>in</strong>a. J Environ Sci(Ch<strong>in</strong>a) 19:432–437.Zhou W, Yaun D, Ye S, Qi P, Fu C, Christiani DC. 2001.<strong>Health</strong> effects <strong>of</strong> occupational exposure to vehicle emissions<strong>in</strong> Shanghai. Int J Occup Environ <strong>Health</strong> 7:23–30.Zhou YR, Zeng Q, Xu F. 1997. Relationships between airpollution <strong>and</strong> trend <strong>of</strong> admission case <strong>in</strong> Chongq<strong>in</strong>g [Ch<strong>in</strong>ese].J Mod Prev Med 24:43–45.Zmirou D, Schwartz J, Saez M, Zanobetti A, Wojtyniak B,Touloumi G, Spix C, de Leon AP, Le Moullec Y, BacharovaL, Schouten J, Ponka A, Katsouyanni K. 1998. Time-seriesanalysis <strong>of</strong> air pollution <strong>and</strong> cause-specific mortality. Epidemiology9:495–503.209
APPENDIX A. Additional Analyses <strong>of</strong> DailyTime-Series StudiesAppendix Figure A.1a. Percent change <strong>in</strong> <strong>the</strong> mean number <strong>of</strong> daily deaths from all natural causes per 10-µg/m 3 change <strong>in</strong> 24-hr mean PM 10 concentrationamong adults only. Studies <strong>of</strong> children <strong>and</strong> <strong>in</strong>fants were excluded. Y-axis labels give study <strong>in</strong>formation <strong>in</strong> <strong>the</strong> follow<strong>in</strong>g sequence: reference citation,study location, <strong>and</strong> age group: Elderly (E), Not Elderly (NE), or o<strong>the</strong>r (X) <strong>and</strong> years <strong>of</strong> age.Appendix Figure A.1b. Percent change <strong>in</strong> <strong>the</strong> mean number <strong>of</strong> daily deaths from all natural causes per 10-µg/m 3 change <strong>in</strong> 24-hr mean PM 10 concentrationamong children <strong>and</strong> <strong>in</strong>fants. Y-axis labels give study <strong>in</strong>formation <strong>in</strong> <strong>the</strong> follow<strong>in</strong>g sequence: reference citation, study location, <strong>and</strong> age group. Allstudy populations consisted <strong>of</strong> children (C).211
<strong>Outdoor</strong> <strong>Air</strong> <strong>Pollution</strong> <strong>and</strong> <strong>Health</strong> <strong>in</strong> <strong>the</strong> Develop<strong>in</strong>g <strong>Countries</strong> <strong>of</strong> <strong>Asia</strong>Appendix Figure A.2. Percent change <strong>in</strong> <strong>the</strong> mean number <strong>of</strong> daily deaths from respiratory causes per 10-µg/m 3 change <strong>in</strong> 24-hr mean PM 10 concentration.Y-axis labels give study <strong>in</strong>formation <strong>in</strong> <strong>the</strong> follow<strong>in</strong>g sequence: reference citation, study location, cause <strong>of</strong> death, <strong>and</strong> age group: Children (C), Elderly(E), Not Elderly (NE), or o<strong>the</strong>r (X) <strong>and</strong> years <strong>of</strong> age or not applicable (n/a). A data po<strong>in</strong>t <strong>of</strong> “+” <strong>in</strong>dicates <strong>the</strong> paper reported only a s<strong>in</strong>gle po<strong>in</strong>t estimate withno st<strong>and</strong>ard error or confidence <strong>in</strong>terval; <strong>the</strong> value could not be used <strong>in</strong> <strong>the</strong> meta-analysis <strong>and</strong> only <strong>the</strong> po<strong>in</strong>t estimate is presented.212
HEI International Scientific Oversight CommitteeAppendix Figure A.3. Percent change <strong>in</strong> <strong>the</strong> mean number <strong>of</strong> daily deaths from cardiovascular causes per 10-µg/m 3 change <strong>in</strong> 24-hr mean PM 10 concentration.Y-axis labels give study <strong>in</strong>formation <strong>in</strong> <strong>the</strong> follow<strong>in</strong>g sequence: reference citation, study location, cause <strong>of</strong> death, <strong>and</strong> age group: Elderly (E), NotElderly (NE), or o<strong>the</strong>r (X) <strong>and</strong> years <strong>of</strong> age (or not applicable [n/a]). A data po<strong>in</strong>t <strong>of</strong> “+” <strong>in</strong>dicates <strong>the</strong> paper reported only a s<strong>in</strong>gle po<strong>in</strong>t estimate with nost<strong>and</strong>ard error or confidence <strong>in</strong>terval; <strong>the</strong> value could not be used <strong>in</strong> <strong>the</strong> meta-analysis <strong>and</strong> only <strong>the</strong> po<strong>in</strong>t estimate is presented.213
<strong>Outdoor</strong> <strong>Air</strong> <strong>Pollution</strong> <strong>and</strong> <strong>Health</strong> <strong>in</strong> <strong>the</strong> Develop<strong>in</strong>g <strong>Countries</strong> <strong>of</strong> <strong>Asia</strong>Appendix Figure A.4. Percent change <strong>in</strong> <strong>the</strong> mean number <strong>of</strong> daily hospital admissions from respiratory causes per 10-µg/m 3 change <strong>in</strong> 24-hr meanPM 10 concentration. Y-axis labels give study <strong>in</strong>formation <strong>in</strong> <strong>the</strong> follow<strong>in</strong>g sequence: reference citation, study location, cause <strong>of</strong> hospital admission, <strong>and</strong>age group: Children (C), Elderly (E), or Young Adult (YA) <strong>and</strong> years <strong>of</strong> age.214
HEI International Scientific Oversight CommitteeAppendix Figure A.5. Percent change <strong>in</strong> <strong>the</strong> mean number <strong>of</strong> daily hospital admissions from cardiovascular causes per 10-µg/m 3 change <strong>in</strong> 24-hr meanPM 10 concentration. Y-axis labels give study <strong>in</strong>formation <strong>in</strong> <strong>the</strong> follow<strong>in</strong>g sequence: reference citation, study location, cause <strong>of</strong> admission, <strong>and</strong> age group:Elderly (E), Young Adult (YA), or o<strong>the</strong>r (X) <strong>and</strong> years <strong>of</strong> age.215
<strong>Outdoor</strong> <strong>Air</strong> <strong>Pollution</strong> <strong>and</strong> <strong>Health</strong> <strong>in</strong> <strong>the</strong> Develop<strong>in</strong>g <strong>Countries</strong> <strong>of</strong> <strong>Asia</strong>Appendix Figure A.6. Percent change <strong>in</strong> <strong>the</strong> mean number <strong>of</strong> daily deaths from all natural causes per 10-µg/m 3 change <strong>in</strong> 24-hr mean TSP concentration.Y-axis labels give study <strong>in</strong>formation <strong>in</strong> <strong>the</strong> follow<strong>in</strong>g sequence: reference citation <strong>and</strong> study location.216
HEI International Scientific Oversight CommitteeAppendix Figure A.7. Percent change <strong>in</strong> <strong>the</strong> mean number <strong>of</strong> daily deaths from all natural causes per 10-µg/m 3 change <strong>in</strong> 24-hr mean TSP concentration.Y-axis labels give study <strong>in</strong>formation <strong>in</strong> <strong>the</strong> follow<strong>in</strong>g sequence: reference citation, study location, <strong>and</strong> age group: Children (C), Elderly (E), Not Elderly (NE),o<strong>the</strong>r (X), or Young Adult (YA) <strong>and</strong> years <strong>of</strong> age (or not applicable [n/a]).217
<strong>Outdoor</strong> <strong>Air</strong> <strong>Pollution</strong> <strong>and</strong> <strong>Health</strong> <strong>in</strong> <strong>the</strong> Develop<strong>in</strong>g <strong>Countries</strong> <strong>of</strong> <strong>Asia</strong>Appendix Figure A.8. Percent change <strong>in</strong> <strong>the</strong> mean number <strong>of</strong> daily deaths from respiratory causes per 10-µg/m 3 change <strong>in</strong> 24-hr mean TSP concentration.Y-axis labels give study <strong>in</strong>formation <strong>in</strong> <strong>the</strong> follow<strong>in</strong>g sequence: reference citation, study location, cause <strong>of</strong> death, <strong>and</strong> age group: o<strong>the</strong>r (X, n/a) or AllAges (AA). A data po<strong>in</strong>t <strong>of</strong> “+” <strong>in</strong>dicates <strong>the</strong> paper reported only a s<strong>in</strong>gle po<strong>in</strong>t estimate with no st<strong>and</strong>ard error or confidence <strong>in</strong>terval; <strong>the</strong> value could notbe used <strong>in</strong> <strong>the</strong> meta-analysis <strong>and</strong> only <strong>the</strong> po<strong>in</strong>t estimate is presented.218
HEI International Scientific Oversight CommitteeAppendix Figure A.9. Percent change <strong>in</strong> <strong>the</strong> mean number <strong>of</strong> daily deaths from cardiovascular causes per 10-µg/m 3 change <strong>in</strong> 24-hr mean TSP concentration.Y-axis labels give study <strong>in</strong>formation <strong>in</strong> <strong>the</strong> follow<strong>in</strong>g sequence: reference citation, study location, cause <strong>of</strong> death, <strong>and</strong> age group: All Ages (AA) oro<strong>the</strong>r (X, n/a). A data po<strong>in</strong>t <strong>of</strong> “+” <strong>in</strong>dicates <strong>the</strong> paper reported only a s<strong>in</strong>gle po<strong>in</strong>t estimate with no st<strong>and</strong>ard error or confidence <strong>in</strong>terval; <strong>the</strong> value couldnot be used <strong>in</strong> <strong>the</strong> meta-analysis <strong>and</strong> only <strong>the</strong> po<strong>in</strong>t estimate is presented.219
<strong>Outdoor</strong> <strong>Air</strong> <strong>Pollution</strong> <strong>and</strong> <strong>Health</strong> <strong>in</strong> <strong>the</strong> Develop<strong>in</strong>g <strong>Countries</strong> <strong>of</strong> <strong>Asia</strong>Appendix Figure A.10. Percent change <strong>in</strong> <strong>the</strong> mean number <strong>of</strong> daily hospital admissions from respiratory causes per 10-µg/m 3 change <strong>in</strong> 24-hr meanTSP concentration among persons <strong>of</strong> all ages. Y-axis labels give study <strong>in</strong>formation <strong>in</strong> <strong>the</strong> follow<strong>in</strong>g sequence: reference citation, study location, cause <strong>of</strong>admission, <strong>and</strong> age group: All Ages (AA).220
HEI International Scientific Oversight CommitteeAppendix Figure A.11. Percent change <strong>in</strong> <strong>the</strong> mean number <strong>of</strong> daily deaths from all natural causes per 10-µg/m 3 change <strong>in</strong> 24-hr mean NO 2 concentration.Y-axis labels give study <strong>in</strong>formation <strong>in</strong> <strong>the</strong> follow<strong>in</strong>g sequence: reference citation, study location, <strong>and</strong> age group: Children (C), Elderly (E), Not Elderly(NE), or o<strong>the</strong>r (X) <strong>and</strong> days or years <strong>of</strong> age.221
<strong>Outdoor</strong> <strong>Air</strong> <strong>Pollution</strong> <strong>and</strong> <strong>Health</strong> <strong>in</strong> <strong>the</strong> Develop<strong>in</strong>g <strong>Countries</strong> <strong>of</strong> <strong>Asia</strong>Appendix Figure A.12. Percent change <strong>in</strong> <strong>the</strong> mean number <strong>of</strong> daily deaths from all respiratory causes per 10-µg/m 3 change <strong>in</strong> 24-hr mean NO 2concentration. Y-axis labels give study <strong>in</strong>formation <strong>in</strong> <strong>the</strong> follow<strong>in</strong>g sequence: reference citation, study location, <strong>and</strong> age group: Children (C), Elderly(E), Not Elderly (NE), or o<strong>the</strong>r (X) <strong>and</strong> years <strong>of</strong> age.222
HEI International Scientific Oversight CommitteeAppendix Figure A.13. Percent change <strong>in</strong> <strong>the</strong> mean number <strong>of</strong> daily deaths from cardiovascular causes per 10-µg/m 3 change <strong>in</strong> 24-hr mean NO 2 concentration.Y-axis labels give study <strong>in</strong>formation <strong>in</strong> <strong>the</strong> follow<strong>in</strong>g sequence: reference citation, study location, cause <strong>of</strong> death, <strong>and</strong> age group: Elderly (E) oro<strong>the</strong>r (X) <strong>and</strong> years <strong>of</strong> age.223
<strong>Outdoor</strong> <strong>Air</strong> <strong>Pollution</strong> <strong>and</strong> <strong>Health</strong> <strong>in</strong> <strong>the</strong> Develop<strong>in</strong>g <strong>Countries</strong> <strong>of</strong> <strong>Asia</strong>Appendix Figure A.14. Percent change <strong>in</strong> <strong>the</strong> mean number <strong>of</strong> daily hospital admissions from respiratory causes per 10-µg/m 3 change <strong>in</strong> 24-hr meanNO 2 concentration. Y-axis labels give study <strong>in</strong>formation <strong>in</strong> <strong>the</strong> follow<strong>in</strong>g sequence: reference citation, study location, cause <strong>of</strong> admission, <strong>and</strong> age group:Children (C), Elderly (E), or Young Adult (YA) <strong>and</strong> years <strong>of</strong> age.224
HEI International Scientific Oversight CommitteeAppendix Figure A.15. Percent change <strong>in</strong> <strong>the</strong> mean number <strong>of</strong> daily hospital admissions from cardiovascular causes per 10-µg/m 3 change <strong>in</strong> 24-hr meanNO 2 concentration. Y-axis labels give study <strong>in</strong>formation <strong>in</strong> <strong>the</strong> follow<strong>in</strong>g sequence: reference citation, study location, cause <strong>of</strong> admission, <strong>and</strong> age group:Elderly (E), Young Adult (YA), or o<strong>the</strong>r (X) <strong>and</strong> years <strong>of</strong> age.225
<strong>Outdoor</strong> <strong>Air</strong> <strong>Pollution</strong> <strong>and</strong> <strong>Health</strong> <strong>in</strong> <strong>the</strong> Develop<strong>in</strong>g <strong>Countries</strong> <strong>of</strong> <strong>Asia</strong>Appendix Figure A.16. Percent change <strong>in</strong> <strong>the</strong> mean number <strong>of</strong> daily deaths from all natural causes per 10-µg/m 3 change <strong>in</strong> mean O 3 concentration. Y-axis labels give study <strong>in</strong>formation <strong>in</strong> <strong>the</strong> follow<strong>in</strong>g sequence: reference citation, study location, O 3 averag<strong>in</strong>g time, <strong>and</strong> age group: Elderly (E), Not Elderly(NE), Children (C), o<strong>the</strong>r (X), or Young Adult (YA) <strong>and</strong> years <strong>of</strong> age.226
HEI International Scientific Oversight CommitteeAppendix Figure A.17. Percent change <strong>in</strong> <strong>the</strong> mean number <strong>of</strong> daily deaths from all respiratory causes per 10-µg/m 3 change <strong>in</strong> 8-hr O 3 concentration. Y-axis labels give study <strong>in</strong>formation <strong>in</strong> <strong>the</strong> follow<strong>in</strong>g sequence: reference citation, study location, O 3 averag<strong>in</strong>g time, <strong>and</strong> age group: Children (C), Elderly(E), Not Elderly (NE), or o<strong>the</strong>r (X) <strong>and</strong> years <strong>of</strong> age.227
<strong>Outdoor</strong> <strong>Air</strong> <strong>Pollution</strong> <strong>and</strong> <strong>Health</strong> <strong>in</strong> <strong>the</strong> Develop<strong>in</strong>g <strong>Countries</strong> <strong>of</strong> <strong>Asia</strong>Appendix Figure A.18. Percent change <strong>in</strong> <strong>the</strong> mean number <strong>of</strong> daily deaths from cardiovascular causes per 10-µg/m 3 change <strong>in</strong> 8-hr O 3 concentration. Y-axis labels give study <strong>in</strong>formation <strong>in</strong> <strong>the</strong> follow<strong>in</strong>g sequence: reference citation, study location, O 3 averag<strong>in</strong>g time, cause <strong>of</strong> death, <strong>and</strong> age group: Elderly(E) or o<strong>the</strong>r (X) <strong>and</strong> years <strong>of</strong> age.228
HEI International Scientific Oversight CommitteeAppendix Figure A.19. Percent change <strong>in</strong> <strong>the</strong> mean number <strong>of</strong> daily hospital admissions from respiratory causes per 10-µg/m 3 change <strong>in</strong> mean O 3 concentration.Y-axis labels give study <strong>in</strong>formation <strong>in</strong> <strong>the</strong> follow<strong>in</strong>g sequence: reference citation, study location, O 3 averag<strong>in</strong>g time, cause <strong>of</strong> admission, <strong>and</strong>age group: Children (C), Elderly (E), Young Adult (YA) <strong>and</strong> years <strong>of</strong> age.229
<strong>Outdoor</strong> <strong>Air</strong> <strong>Pollution</strong> <strong>and</strong> <strong>Health</strong> <strong>in</strong> <strong>the</strong> Develop<strong>in</strong>g <strong>Countries</strong> <strong>of</strong> <strong>Asia</strong>Appendix Figure A.20. Percent change <strong>in</strong> <strong>the</strong> mean number <strong>of</strong> daily hospital admissions from cardiovascular causes per 10-µg/m 3 change <strong>in</strong> mean O 3concentration. Y-axis labels give study <strong>in</strong>formation <strong>in</strong> <strong>the</strong> follow<strong>in</strong>g sequence: reference citation, study location, O 3 averag<strong>in</strong>g time, cause <strong>of</strong> admission,<strong>and</strong> age group: Elderly (E), Young Adult (YA), or o<strong>the</strong>r (X) <strong>and</strong> years <strong>of</strong> age.230
HEI International Scientific Oversight CommitteeAppendix Figure A.21. Percent change <strong>in</strong> <strong>the</strong> mean number <strong>of</strong> daily deaths from all natural causes per 10-µg/m 3 change <strong>in</strong> 24-hr mean SO 2 concentration.Y-axis labels give study <strong>in</strong>formation <strong>in</strong> <strong>the</strong> follow<strong>in</strong>g sequence: reference citation, study location, <strong>and</strong> age group: Children (C), Elderly (E), Not Elderly(NE), or o<strong>the</strong>r (X) <strong>and</strong> years <strong>of</strong> age.231
<strong>Outdoor</strong> <strong>Air</strong> <strong>Pollution</strong> <strong>and</strong> <strong>Health</strong> <strong>in</strong> <strong>the</strong> Develop<strong>in</strong>g <strong>Countries</strong> <strong>of</strong> <strong>Asia</strong>Appendix Figure A.22. Percent change <strong>in</strong> <strong>the</strong> mean number <strong>of</strong> daily deaths from respiratory causes per 10-µg/m 3 change <strong>in</strong> 24-hr mean SO 2 concentration.Y-axis labels give study <strong>in</strong>formation <strong>in</strong> <strong>the</strong> follow<strong>in</strong>g sequence: reference citation, study location, cause <strong>of</strong> death, <strong>and</strong> age group: Children (C), Elderly(E), Not Elderly (NE), or o<strong>the</strong>r (X) <strong>and</strong> years <strong>of</strong> age or not applicable (n/a). A data po<strong>in</strong>t <strong>of</strong> “+” <strong>in</strong>dicates <strong>the</strong> paper reported only a s<strong>in</strong>gle po<strong>in</strong>testimate with no st<strong>and</strong>ard error or confidence <strong>in</strong>terval; <strong>the</strong> value could not be used <strong>in</strong> <strong>the</strong> meta-analysis <strong>and</strong> only <strong>the</strong> po<strong>in</strong>t estimate is presented.232
HEI International Scientific Oversight CommitteeAppendix Figure A.23. Percent change <strong>in</strong> <strong>the</strong> mean number <strong>of</strong> daily deaths from cardiovascular causes per 10-µg/m 3 change <strong>in</strong> 24-hr mean SO 2 concentration.Y-axis labels give study <strong>in</strong>formation <strong>in</strong> <strong>the</strong> follow<strong>in</strong>g sequence: reference citation, study location, cause <strong>of</strong> death, <strong>and</strong> age group: Elderly (E) oro<strong>the</strong>r (X) <strong>and</strong> years <strong>of</strong> age or not applicable (n/a). A data po<strong>in</strong>t <strong>of</strong> “+” <strong>in</strong>dicates <strong>the</strong> paper reported only a s<strong>in</strong>gle po<strong>in</strong>t estimate with no st<strong>and</strong>ard error orconfidence <strong>in</strong>terval; <strong>the</strong> value could not be used <strong>in</strong> <strong>the</strong> meta-analysis <strong>and</strong> only <strong>the</strong> po<strong>in</strong>t estimate is presented.233
<strong>Outdoor</strong> <strong>Air</strong> <strong>Pollution</strong> <strong>and</strong> <strong>Health</strong> <strong>in</strong> <strong>the</strong> Develop<strong>in</strong>g <strong>Countries</strong> <strong>of</strong> <strong>Asia</strong>Appendix Figure A.24. Percent change <strong>in</strong> <strong>the</strong> mean number <strong>of</strong> daily hospital admissions from respiratory causes per 10-µg/m 3 change <strong>in</strong> 24-hr meanSO 2 concentration. Y-axis labels give study <strong>in</strong>formation <strong>in</strong> <strong>the</strong> follow<strong>in</strong>g sequence: reference citation, study location, cause <strong>of</strong> admission, <strong>and</strong> age group:Children (C), Elderly (E), or Young Adult (YA) <strong>and</strong> years <strong>of</strong> age.234
HEI International Scientific Oversight CommitteeAppendix Figure A.25. Percent change <strong>in</strong> <strong>the</strong> mean number <strong>of</strong> daily hospital admissions from cardiovascular causes per 10-µg/m 3 change <strong>in</strong> 24-hr meanSO 2 concentration. Y-axis labels give study <strong>in</strong>formation <strong>in</strong> <strong>the</strong> follow<strong>in</strong>g sequence: reference citation, study location, cause <strong>of</strong> admission, <strong>and</strong> age group:Elderly (E), Young Adult (YA), o<strong>the</strong>r (X) <strong>and</strong> years <strong>of</strong> age.235
<strong>Outdoor</strong> <strong>Air</strong> <strong>Pollution</strong> <strong>and</strong> <strong>Health</strong> <strong>in</strong> <strong>the</strong> Develop<strong>in</strong>g <strong>Countries</strong> <strong>of</strong> <strong>Asia</strong>Appendix Figure A.26. Percent change <strong>in</strong> <strong>the</strong> mean number <strong>of</strong> daily deaths from all natural causes per 1-mg/m 3 change <strong>in</strong> 24-hr mean CO concentration.Y-axis labels give study <strong>in</strong>formation <strong>in</strong> <strong>the</strong> follow<strong>in</strong>g sequence: reference citation, study location, <strong>and</strong> age group: All Ages (AA), Children (C), Elderly(E), or Not Elderly (NE) <strong>and</strong> years <strong>of</strong> age, if applicable.236
HEI International Scientific Oversight CommitteeAppendix Figure A.27. Percent change <strong>in</strong> <strong>the</strong> mean number <strong>of</strong> daily deaths from respiratory causes per 1-mg/m 3 change <strong>in</strong> 24-hr mean CO concentration.Y-axis labels give study <strong>in</strong>formation <strong>in</strong> <strong>the</strong> follow<strong>in</strong>g sequence: reference citation, study location, cause <strong>of</strong> death, <strong>and</strong> age group: o<strong>the</strong>r (X), All Ages(AA), Children (C), Elderly (E), or Not Elderly (NE) <strong>and</strong> years <strong>of</strong> age or not applicable (n/a). A data po<strong>in</strong>t <strong>of</strong> “+” <strong>in</strong>dicates <strong>the</strong> paper reported only a s<strong>in</strong>glepo<strong>in</strong>t estimate with no st<strong>and</strong>ard error or confidence <strong>in</strong>terval; <strong>the</strong> value could not be used <strong>in</strong> <strong>the</strong> meta-analysis <strong>and</strong> only <strong>the</strong> po<strong>in</strong>t estimate is presented.The estimate for children <strong>in</strong> Ha et al. 2003 was outside <strong>the</strong> scale <strong>of</strong> <strong>the</strong> plot.237
<strong>Outdoor</strong> <strong>Air</strong> <strong>Pollution</strong> <strong>and</strong> <strong>Health</strong> <strong>in</strong> <strong>the</strong> Develop<strong>in</strong>g <strong>Countries</strong> <strong>of</strong> <strong>Asia</strong>Appendix Figure A.28. Percent change <strong>in</strong> <strong>the</strong> mean number <strong>of</strong> daily deaths from cardiovascular causes per 1-mg/m 3 change <strong>in</strong> 24-hr mean CO concentration.Y-axis labels give study <strong>in</strong>formation <strong>in</strong> <strong>the</strong> follow<strong>in</strong>g sequence: reference citation, study location, cause <strong>of</strong> death, <strong>and</strong> age group: All Ages(AA) or o<strong>the</strong>r (X, n/a). A data po<strong>in</strong>t <strong>of</strong> “+” <strong>in</strong>dicates <strong>the</strong> paper reported only a s<strong>in</strong>gle po<strong>in</strong>t estimate with no st<strong>and</strong>ard error or confidence <strong>in</strong>terval; <strong>the</strong>value could not be used <strong>in</strong> <strong>the</strong> meta-analysis <strong>and</strong> only <strong>the</strong> po<strong>in</strong>t estimate is presented.238
HEI International Scientific Oversight CommitteeAppendix Figure A.29. Percent change <strong>in</strong> <strong>the</strong> mean number <strong>of</strong> daily hospital admissions from respiratory causes per 1-mg/m 3 change <strong>in</strong> 24-hr meanCO concentration. Y-axis labels give study <strong>in</strong>formation <strong>in</strong> <strong>the</strong> follow<strong>in</strong>g sequence: reference citation, study location, cause <strong>of</strong> admission, <strong>and</strong> age group:All Ages (AA) or Children (C) <strong>and</strong> years <strong>of</strong> age, if applicable.239
<strong>Outdoor</strong> <strong>Air</strong> <strong>Pollution</strong> <strong>and</strong> <strong>Health</strong> <strong>in</strong> <strong>the</strong> Develop<strong>in</strong>g <strong>Countries</strong> <strong>of</strong> <strong>Asia</strong>Appendix Figure A.30. Percent change <strong>in</strong> <strong>the</strong> mean number <strong>of</strong> daily hospital admissions from cardiovascular causes per 1-mg/m 3 change <strong>in</strong> 24-hr meanCO concentration. Y-axis labels give study <strong>in</strong>formation <strong>in</strong> <strong>the</strong> follow<strong>in</strong>g sequence: reference citation, study location, cause <strong>of</strong> admission, <strong>and</strong> age group:All Ages (AA), o<strong>the</strong>r (X), or Elderly (E) <strong>and</strong> years <strong>of</strong> age, if applicable.Appendix Figure A.31. Effect estimates for respiratory mortality per 10-µg/m 3 change <strong>in</strong> 24-hr mean PM 10 concentration, among persons <strong>of</strong> all ages,accord<strong>in</strong>g to daily mean PM 10 concentration.240
HEI International Scientific Oversight CommitteeAppendix Figure A.32. Effect estimates for all-natural-cause mortality per 10-µg/m 3 change <strong>in</strong> 24-hr mean PM 10 concentration, among persons <strong>of</strong> allages, accord<strong>in</strong>g to daily mean PM 10 concentration.Appendix Figure A.33. Effect estimates for all-natural-cause mortality per 10-µg/m 3 change <strong>in</strong> 24-hr mean NO 2 concentration, among persons <strong>of</strong> allages, accord<strong>in</strong>g to daily mean NO 2 concentration.241
<strong>Outdoor</strong> <strong>Air</strong> <strong>Pollution</strong> <strong>and</strong> <strong>Health</strong> <strong>in</strong> <strong>the</strong> Develop<strong>in</strong>g <strong>Countries</strong> <strong>of</strong> <strong>Asia</strong>Appendix Figure A.34. Effect estimates for all-natural-cause mortality per 10-µg/m 3 change <strong>in</strong> mean O 3 concentration, among persons <strong>of</strong> all ages,accord<strong>in</strong>g to 8-hr O 3 concentration.Appendix Figure A.35. Effect estimates for all-natural-cause mortality per 10-µg/m 3 change <strong>in</strong> 24-hr mean SO 2 concentration, among persons <strong>of</strong> allages, accord<strong>in</strong>g to daily mean SO 2 concentration.242
HEI International Scientific Oversight CommitteeAppendix Figure A.36. Effect estimates for all respiratory mortality per 10-µg/m 3 change <strong>in</strong> 24-hr mean PM 10 concentration, among persons <strong>of</strong> all ages,accord<strong>in</strong>g to year <strong>of</strong> publication. Y-axis labels give study <strong>in</strong>formation <strong>in</strong> <strong>the</strong> follow<strong>in</strong>g sequence: reference citation <strong>and</strong> study location.243
<strong>Outdoor</strong> <strong>Air</strong> <strong>Pollution</strong> <strong>and</strong> <strong>Health</strong> <strong>in</strong> <strong>the</strong> Develop<strong>in</strong>g <strong>Countries</strong> <strong>of</strong> <strong>Asia</strong>Appendix Figure A.37. Effect estimates for all cardiovascular mortality per 10-µg/m 3 change <strong>in</strong> 24-hr mean PM 10 concentration, among persons <strong>of</strong> allages, accord<strong>in</strong>g to year <strong>of</strong> publication. Y-axis labels give study <strong>in</strong>formation <strong>in</strong> <strong>the</strong> follow<strong>in</strong>g sequence: reference citation <strong>and</strong> study location.244
HEI International Scientific Oversight CommitteeAppendix Figure A.38. Effect estimates for all-natural-cause mortality per 10-µg/m 3 change <strong>in</strong> 24-hr mean NO 2 concentration, among persons <strong>of</strong> allages, accord<strong>in</strong>g to year <strong>of</strong> publication. Y-axis labels give study <strong>in</strong>formation <strong>in</strong> <strong>the</strong> follow<strong>in</strong>g sequence: reference citation <strong>and</strong> study location.Appendix Figure A.39. Effect estimates for all-natural-cause mortality per 10-µg/m 3 change <strong>in</strong> 8-hr O 3 concentration, among persons <strong>of</strong> all ages,accord<strong>in</strong>g to year <strong>of</strong> publication. Y-axis labels give study <strong>in</strong>formation <strong>in</strong> <strong>the</strong> follow<strong>in</strong>g sequence: reference citation <strong>and</strong> study location.245
<strong>Outdoor</strong> <strong>Air</strong> <strong>Pollution</strong> <strong>and</strong> <strong>Health</strong> <strong>in</strong> <strong>the</strong> Develop<strong>in</strong>g <strong>Countries</strong> <strong>of</strong> <strong>Asia</strong>Appendix Figure A.40. Effect estimates for all-natural-cause mortality per 10-µg/m 3 change <strong>in</strong> 24-hr mean SO 2 concentration, among persons <strong>of</strong> allages, accord<strong>in</strong>g to year <strong>of</strong> publication. Y-axis labels give study <strong>in</strong>formation <strong>in</strong> <strong>the</strong> follow<strong>in</strong>g sequence: reference citation <strong>and</strong> study location.246
HEI International Scientific Oversight CommitteeAppendix Table A.1. <strong>Asia</strong>n Daily Time-Series Studies Identified Through <strong>the</strong> Systematic Literature Search <strong>and</strong> Included<strong>in</strong> <strong>the</strong> Quantitative AnalysisCountry /CitationStudyLocationStudyPeriod Outcome Disease PollutantCh<strong>in</strong>aChang GQ et al.2004Chang GQ et al.2003bDai et al.2004Dong et al.1995Gao et al.1993J<strong>in</strong> et al.1999Kan H <strong>and</strong>Chen B 2003bKan H <strong>and</strong>Chen B 2003aKan H et al.2004bKan H et al.2003Kan H et al.2004aKan H et al.2007Ko FW et al.2007Lee SL et al.2006bQian Z et al.2007aQian Z et al.2007bVenners et al.2003Wong CM et al.1999aWong CM et al.2001aWong CM et al.2002aBeij<strong>in</strong>g 1998–2000 Mortality Respiratory disease, cardiovasculardisease, coronary heart disease,cerebrovascular disease, COPDTSP, PM 10 , SO 2 ,NO x , COBeij<strong>in</strong>g 1998–2000 ER visits Colds, pneumonia, bronchitis TSP, PM 10 , SO 2 ,NO x , COShanghai 2002–2003 Mortality All causes, cardiovascular disease, PM 10 , PM 2.5respiratory diseaseBeij<strong>in</strong>g 1990–1991 Mortality All causes TSP, SO 2Beij<strong>in</strong>g 1989 Mortality All causes, respiratory disease TSP, SO 2Benxi 1993–1994 ER visits All causes, COPD, cardiovasculardisease, cerebrovascular diseaseTSP, SO 2Shanghai 2000–2001 Mortality All causes, cardiovascular disease, PM 10 , SO 2 , NO 2COPD (<strong>in</strong>cl. asthma)Shanghai 2000–2001 Mortality All causes, cardiovascular disease, PM 10 , SO 2 , NO 2COPD (<strong>in</strong>cl. asthma)Shanghai 2001–2002 Mortality Diabetes PM 10 , SO 2 , NO 2Shanghai 2001–2002 Mortality Stroke PM 10 , SO 2 , NO 2Shanghai 2000–2001 Mortality All causes, cardiovascular disease,COPDPM 10 , SO 2 , NO 2Shanghai 2004–2005 Mortality All causes, cardiovascular disease, PM 10 , PM 2.5 ,respiratory diseasePM 102.5Hong Kong 2000–2004 Admissions COPD PM 10 , PM 2.5 ,NO 2 , SO 2 , O 3Hong Kong 1997–2002 Admissions Asthma PM 10 , PM 2.5 ,NO 2 , SO 2 , O 3Wuhan 2001–2004 Mortality All causes, cardiovascular disease, PM 10stroke, cardiac disease, respiratorydisease, cardiopulmonary diseaseWuhan 2001–2004 Mortality All causes, cardiovascular disease, NO 2 , SO 2 , O 3stroke, cardiac disease, respiratorydisease, cardiopulmonary diseaseChongq<strong>in</strong>g 1995 Mortality Respiratory disease, cardiovascular PM 2.5 , SO 2disease, cancer, o<strong>the</strong>rHong Kong 1994–1995 Admissions Respiratory disease, cardiovascular PM 10 , NO 2 , SO 2 ,diseaseO 3Hong Kong 1995–1997 Mortality All causes, cardiovascular disease, PM 10 , NO 2 , SO 2 ,respiratory diseaseO 3Hong Kong,Admissions Asthma, respiratory disease, cardiacLondondisease, ischemic heart disease1995–1997(HongKong),1992–1994(London)PM 10 , NO 2 , SO 2 ,O 3Table cont<strong>in</strong>ues next page247
<strong>Outdoor</strong> <strong>Air</strong> <strong>Pollution</strong> <strong>and</strong> <strong>Health</strong> <strong>in</strong> <strong>the</strong> Develop<strong>in</strong>g <strong>Countries</strong> <strong>of</strong> <strong>Asia</strong>Appendix Table A.1 (Cont<strong>in</strong>ued). <strong>Asia</strong>n Daily Time-Series Studies Identified Through <strong>the</strong> Systematic Literature Search<strong>and</strong> Included <strong>in</strong> <strong>the</strong> Quantitative AnalysisCountry /CitationStudyLocationStudyPeriod Outcome Disease PollutantCh<strong>in</strong>a (Cont<strong>in</strong>ued)Wong GW et al. Hong Kong 1993–1994 Admissions Asthma PM 10 , NO 2 , SO 2 ,2001bWong TW et al. Hong Kong 2000 General Respiratory disease, upper respiratory PM 10 , NO 2 , SO 2 ,2002cpractitioner tract <strong>in</strong>fectionO 3Wong TW et al.2006Wong TW et al.1999bWong TW et al.2002bXu X et al.1995aXu X et al.1994Xu X et al.1995bXu Z et al.2000Zhang Y et al.2006Zhang YP et al.2007consultationsHong Kong 2000–2002 GeneralpractitionerconsultationsUpper respiratory tract <strong>in</strong>fection PM 10 , PM 2.5 ,NO 2 , SO 2 , O 3Hong Kong 1994–1995 Admissions Cardiovascular disease PM 10 , NO 2 , SO 2 ,O 3Hong Kong 1995–1998 Mortality Respiratory disease, cardiovascular PM 10 , NO 2 , SO 2 ,diseaseO 3Beij<strong>in</strong>g 1990 Outpatient visits Surgery or nonsurgery TSP, SO 2Beij<strong>in</strong>g 1994 Mortality All causes, cardiovascular disease,cardiopulmonary disease, cancerBeij<strong>in</strong>g 1990 Outpatient <strong>and</strong>ER visitsShenyang 1992 Mortality All causes, cardiovascular disease,cardiopulmonary disease, COPD,cancerShanghai 2001–2004 Mortality All causes, cardiovascular disease,respiratory diseaseTaiyuan 2004–2005 Mortality All causes, cancer, cardiovasculardisease, respiratory diseaseTSP, SO 2TSP, SO 2TSP, SO 2O 3PM 10IndiaCropper et al.1997Delhi 1991–1994 Mortality All causes, respiratory disease,cardiovascular diseaseTSP, SO 2 , NO xJapanOmori et al.2003Yamazaki et al.2007Ye et al.200113 Largestcities13 Urbanareas1990–1994 Mortality All causes, cardiovascular disease,respiratory diseaseSPM1990–1994 Mortality Stroke, <strong>in</strong>tracerebral hemorrhage PM 7 , NO 2 ,photochemicaloxidantsCardiovascular (ang<strong>in</strong>a, cardiac PM 10 , NO 2 , SO 2 ,<strong>in</strong>sufficiency, hypertension,CO, O 3myocardial <strong>in</strong>farction) <strong>and</strong>respiratory (asthma, acute <strong>and</strong>chronic bronchitis, pneumonia)Tokyo 1980–1995 EmergencytransportsMalaysiaSastry2002KualaLumpur1997 Mortality All causes PM 10S<strong>in</strong>gaporeChew et al.1999S<strong>in</strong>gapore 1990–1994 ER visits Asthma TSP, SO 2 , NO 2 ,O 3Table cont<strong>in</strong>ues next page248
HEI International Scientific Oversight CommitteeAppendix Table A.1(Cont<strong>in</strong>ued). <strong>Asia</strong>n Daily Time-Series Studies Identified Through <strong>the</strong> Systematic Literature Search<strong>and</strong> Included <strong>in</strong> <strong>the</strong> Quantitative AnalysisCountry /CitationStudyLocationStudyPeriod Outcome Disease PollutantSouth KoreaCho et al. 2000Ulsan,Daejeon,Suwon1996 Admissions Respiratory (bronchial asthma,COPD, bronchitis)TSP, NO 2 , SO 2 ,CO, O 3Ha et al. 2003 Seoul 1995–1999 Mortality All causes, respiratory disease TSP, SO 2 , NO 2 ,CO, O 3Hong YC et al.2002bSeoul 1991–1997 Mortality Stroke (hemorrhagic or ischemic) TSP, NO 2 , SO 2 ,CO, O 3Hong YC et al.2002aSeoul 1995–1998 Mortality Stroke PM 10 , NO 2 , SO 2 ,O 3 , COHong YC et al.1999bIncheon 1995–1996 Mortality All causes, cardiovascular disease,respiratory diseasePM 10 , NO 2 , SO 2 ,CO, O 3Hong YC et al.1999aIncheon 1995 Mortality All causes TSP, PM 10 , NO 2 ,SO 2 , CO, O 3Im et al. 2000 Seoul 1996–1997 ER visits Asthma TSP, NO 2 , SO 2 ,CO, O 3Ju <strong>and</strong> Cho Seoul 1994–1997 ER visits Asthma TSP, PM 10 , O 32001Kim H et al.2003Seoul 1995–1999 Mortality All causes, respiratory disease,cardiovascular disease,PM 10cerebrovascular eventKim H et al. Seoul 1997–2001 Mortality All causes PM 102004aKim SY et al. Seoul 2002 Admissions Asthma PM 10 , NO 2 , SO 2 ,2006bCO, O 3Kim SY et al. Seoul 1995–1999 Mortality All causes PM 10 , NO 2 , SO 2 ,2004bO 3 , COKwon et al. Seoul 1994–1998 Mortality All causes PM 10 , NO 2 , SO 2 ,2001CO, O 3Kwon <strong>and</strong> Cho Seoul 1991–1995 Mortality All causes, cardiovascular disease, TSP, NO 2 , SO 2 ,1999respiratory diseaseO 3Lee JT et al. Seoul 1997–1999 Admissions Ischemic heart disease PM 10 , NO 2 , SO 2 ,2003bCO, O 3Lee JT et al. 7 Cities 1991–1997 Mortality All causes TSP, SO 2 , O 32000Lee JT et al. Seoul 1997–1999 Admissions Asthma PM 10 , NO 2 , SO 2 ,2002CO, O 3Lee JT et al. Ulsan 1991–1994 Mortality All causes TSP, SO 21998Lee JT <strong>and</strong> Seoul 1991–1995 Mortality All causes TSP, SO 2 , O 3Schwartz 1999Lee JT et al. Seoul, 1991–1995 Mortality All causes TSP, SO 2 , O 31999bUlsanLee JT et al. Seoul 2000–2004 Mortality All causes PM 10 , NO 2 , SO 2 ,2007cCO, O 3Lee JT 2003 Seoul 1997–1999 Admissions Asthma PM 10 , NO 2 , SO 2 ,CO, O 3Lee YJ et al. Seoul 1995–1996 ER visits Respiratory disease PM 10 , TSP, NO 2 ,2001SO 2 , CO, O 3Leem et al. 1998 Seoul 1995–1996 ER visits Respiratory disease PM 10 , O 3Table cont<strong>in</strong>ues next page249
<strong>Outdoor</strong> <strong>Air</strong> <strong>Pollution</strong> <strong>and</strong> <strong>Health</strong> <strong>in</strong> <strong>the</strong> Develop<strong>in</strong>g <strong>Countries</strong> <strong>of</strong> <strong>Asia</strong>Appendix Table A.1 (Cont<strong>in</strong>ued). <strong>Asia</strong>n Daily Time-Series Studies Identified Through <strong>the</strong> Systematic Literature Search<strong>and</strong> Included <strong>in</strong> <strong>the</strong> Quantitative AnalysisCountry /CitationStudyLocationStudyPeriod Outcome Disease PollutantSouth Korea (Cont<strong>in</strong>ued)Park H et al.2002Seoul 1996–1999 School absences Illness-related causes PM 10 , NO 2 , SO 2 ,CO, O 3Son et al. 2006 Seoul 2002 Admissions Asthma O 3Song HI 2001 Seoul 1992–1993 Doctor’s visits Asthma TSP, SO 2Sung et al.200112 Prov<strong>in</strong>ces 1991–1995 Mortality Cardiopulmonary disease TSP, SO 2 , O 3Taipei,Ch<strong>in</strong>aBell et al.2007Chan et al.2006Chang CC et al.2005Chang CH et al.2002Hwang JS <strong>and</strong>Chan 2002Lee IM et al.2007bTsai SS et al.2006bTsai SS et al.2003aTsai SS et al.2003bTsai SS et al.2006aYang CY et al.2004cYang CY et al.2004bYang CY <strong>and</strong>Chen CJ 2007Yang CY et al.2007Yang CY et al.2006Thail<strong>and</strong>Ostro et al.1999Vajanapoomet al. 2002Taipei 1995–2002 Admissions IHD, cerebrovascular disease, asthma,pneumoniaPM 10 , PM 2.5 ,PM 10–2.5 , NO 2 ,SO 2 , CO, O 3Taipei 1997–2002 Admissions Cerebrovascular PM 10 , PM 2.5 ,NO 2 , SO 2 , CO,O 3Taipei 1997–2001 Admissions Cardiovascular PM 10 , NO 2 , SO 2 ,O 3 , COTaipei 1997–1999 Admissions Respiratory disease, cardiovascular PM 10 , NO 2 , SO 2 ,diseaseO 3Taipei 1998 Cl<strong>in</strong>ic visits Lower respiratory tract illness PM 10 , NO 2 , SO 2 ,CO, O 3Kaohsiung 1996–2003 Admissions COPD PM 10 , NO 2 , SO 2 ,CO, O 3Kaohsiung 1996–2003 Admissions Asthma PM 10 , NO 2 , SO 2 ,CO, O 3Kaohsiung 1997–2000 Admissions Stroke PM 10 , NO 2 , SO 2 ,CO, O 3Kaohsiung 1994–2000 Mortality All causes, respiratory disease, PM 10 , NO 2 , SO 2 ,cardiovascular diseaseCO, O 3Kaohsiung 1994–2000 Mortality Postneonatal (27 days–1 yr) causes PM 10 , NO 2 , SO 2 ,CO, O 3Kaohsiung 1997–2000 Admissions Cardiovascular disease PM 10 , NO 2 , SO 2 ,CO, O 3Taipei 1994–1998 Mortality All causes, cardiovascular disease, PM 10 , NO 2 , SO 2 ,respiratory diseaseCO, O 3Taipei 1996–2003 Admissions COPD PM 10 , NO 2 , SO 2 ,CO, O 3Taipei 1996–2003 Admissions Asthma PM 10 , SO 2 , NO 2 ,CO, O 3Taipei 1994–2000 Mortality Postneonatal (27 days–1 yr) causes PM 10 , SO 2 , NO 2 ,CO, O 3Bangkok 1992–1995 Mortality All causes PM 10Bangkok 1992–1997 Mortality All causes, respiratory disease,cardiovascular disease, o<strong>the</strong>rPM 10 , poorvisibility250
HEI International Scientific Oversight CommitteeAppendix Table A.2. Time-Series Studies Excluded from Quantitative AnalysisCountry /CitationStudyLocationStudyPeriod Outcome Disease PollutantReason forExclusionCommentsCh<strong>in</strong>aDong et al.1996Kan HD et al.2005Tseng et al.1992Tseng <strong>and</strong> Li1990Wang H et al.2003Xia <strong>and</strong> Tong2006Zhou YR et al.1997Beij<strong>in</strong>g 1991 OutpatientvisitsAll causes TSP, SO 2 Study period< 1 yrBeij<strong>in</strong>g 2003 Mortality Severe acute PM 10 , SO 2 , Rare outcomerespiratory NO 2syndromeHong 1983– Hospital Asthma TSP, RSP, No numericalKong 1989 dischargesSO 2 , NO 2 , estimatesHongKong1983–1987Shenyang 1996–2000Hong 1994–Kong 1997Chongq<strong>in</strong>g 1991–1992AdmissionsMortalityAdmissionsAdmissionsAsthma episodesCardiovasculardiseaseTSPCirculatory<strong>and</strong>respiratorydiseasesRespiratorydisease,COPD, cancer,<strong>in</strong>juryNO x , O 3TSP, RSP,SO 2 , NO 2 ,NO, O 3PM 10 , SO 2 ,NO 2 , O 3TSP, SO 2 ,NO xQuarterlydataMonthly data365-Day lagMonthly dataIndiaP<strong>and</strong>e et al.2002NewDelhi1997–1998ER visitsCOPD,asthma,acute coronaryeventTSP, SO 2 ,NO x , CONo numericalestimatesJapanHonda et al.2003Murakami Y<strong>and</strong> Ono2006Ono et al.2007Piver et al.1999Sawaguchiet al. 1997Shimizu et al.2001Tokyo 1976–1990Tokyo 1990–199413 Largestcities1990–1994Tokyo 1980–199547 Prefectures1988–1994Yokohama 1990–1991Mortality All causes SO 2 , NO 2 ,NO, CO,oxidantMortalityMyocardial<strong>in</strong>farctionSPMMortality All causes,cardiovasculardisease,respiratorydiseaseSPMEmergency Heatstroke PM 10 , NO 2 ,transportO 3Mortality Sudden SO 2 , NO 2<strong>in</strong>fant deathsyndromeER visits Asthma SPM, SO 2 ,NO 2 , NONo numericalestimatesAnalysis <strong>of</strong>peak SPMhourly onlyNo seasonalcontrolRare outcomeNo numericalestimatesNo numericalestimatesSPM <strong>and</strong> NO 2 concentrationswere associated withnumbers <strong>of</strong> hospital admissionsfor asthma attacks <strong>in</strong>children < 6 yr. There wasno such association <strong>in</strong> children7–20 yr.Table cont<strong>in</strong>ues next page251
<strong>Outdoor</strong> <strong>Air</strong> <strong>Pollution</strong> <strong>and</strong> <strong>Health</strong> <strong>in</strong> <strong>the</strong> Develop<strong>in</strong>g <strong>Countries</strong> <strong>of</strong> <strong>Asia</strong>Appendix Table A.2 (Cont<strong>in</strong>ued). Time-Series Studies Excluded from Quantitative AnalysisCountry /CitationStudyLocationStudyPeriod Outcome Disease PollutantReason forExclusionCommentsJapan (Cont<strong>in</strong>ued)Sh<strong>in</strong>kura et al.1999Yamashita 1978–public 1988healthdistrict <strong>of</strong>KagoshimaCityMortality All causes SO 2 Monthly dataS<strong>in</strong>gaporeEmmanuel2000S<strong>in</strong>gapore 1997 Mortality,ER visitsRespiratorydiseasePM 10 , SO 2 , EpisodeNO 2 , CO, O 3 , study <strong>of</strong>haze <strong>Asia</strong>n duststormEffects <strong>of</strong> dust storms oncl<strong>in</strong>ic visits for allergic rh<strong>in</strong>itiswere marked 2 days afterevent but were not statisticallysignificant.South KoreaChoi <strong>and</strong> Paek Seoul 1993 Admissions Asthma TSP, SO 2 , CO Study < 1 yr1995<strong>in</strong> durationHwang SSet al. 2005bSeoul 2002 Mortality All causes,respiratorydisease, cardiovasculardisease,o<strong>the</strong>rPM 10 Episodestudy <strong>of</strong><strong>Asia</strong>n duststormJang et al.2006Kim J <strong>and</strong>Yang HE 2005Kim SY et al.2007Kwon et al.2002Bucheon,Gyenggi-do2003 Admissions Asthma,COPD, cardiovasculardiseaseSeoul 1999 Mortality Respiratory<strong>and</strong> cardiovasculardiseasePM 10 , SO 2 ,NO 2 , O 3TSP, PM 10 ,SO 2 , NO 2 ,CO, O 3Seoul 2002 Admissions Asthma PM 10 , SO 2 ,NO 2 , CO,O 3Seoul 1995–1998MortalityAll causes,respiratorydisease, cardiovasculardisease<strong>Asia</strong>n duststorm (PM 10 ,SO 2 , NO 2 ,CO, O 3 )MonthlydataNo seasonalcontrolSubjectcohort was asubset withpreviousasthmaEpisodestudy <strong>of</strong><strong>Asia</strong>n duststormResults suggested a causalrelationship between duststorm <strong>and</strong> mortality from allcauses, <strong>and</strong> cardiovascular<strong>and</strong> respiratory disease.Effects <strong>of</strong> dust storms oncardiovascular disease weremarked 1 day after <strong>the</strong> eventbut were not statisticallysignificant.Table cont<strong>in</strong>ues next page252
HEI International Scientific Oversight CommitteeAppendix Table A.2 (Cont<strong>in</strong>ued). Time-Series Studies Excluded from Quantitative AnalysisCountry /CitationStudyLocationStudyPeriod Outcome Disease PollutantReason forExclusionCommentsTaipei,Ch<strong>in</strong>aChang CC et al. Taipei 1997–20062001Chen CH et al.2006bChen YS et al.2004Chen YS <strong>and</strong>Yang CY2005Hwang JSet al. 2000Knöbel et al.1995Yang CY et al.2005aYang CY et al.2005bTaipei 1998–2001Taipei 1995–2000Taipei 1996–2001Taipei 1994–1995Taipei 1981–1991Taipei 1996–2001Taipei 1996–2001Yang CY 2006 Taipei 1997–2001Cl<strong>in</strong>ic visitsAdmissionsMortalityAdmissionsSchoolabsencesMortalityAllergicrh<strong>in</strong>itisAsthma,chronicbronchitisAll causes,respiratorydisease,cardiovasculardiseaseCerebrovasculardisease<strong>Asia</strong>n duststormPM 10 , SO 2 ,NO 2 , CO, O 3PM 10 , SO 2 ,NO 2 , CO, O 3PM 10 , SO 2 ,NO 2 , CO, O 3Episodestudy <strong>of</strong><strong>Asia</strong>n duststormMonthlydataEpisodestudy <strong>of</strong><strong>Asia</strong>n duststormEpisodestudy <strong>of</strong><strong>Asia</strong>n duststormAll causes NO x No seasonalcontrolSID or PM 10 , SO 2 , No numericalsuffocation CO, pollutant estimatesst<strong>and</strong>ard <strong>in</strong>dex,visibilityAdmissions Stroke <strong>Asia</strong>n duststorm (PM 10 ,SO 2 , NO 2 ,CO, O 3 )Admissions Asthma <strong>Asia</strong>n duststorm (PM 10 ,SO 2 , NO 2 ,CO, O 3 )ER visitsStatistically significant associationsbetween <strong>Asia</strong>n duststorm <strong>and</strong> daily primary<strong>in</strong>tracerebral hemorrhagicstroke <strong>and</strong> ischemic strokewere found.Effects <strong>of</strong> dust storms ondaily asthma admissionswere not found to be statisticallysignificant, possiblyow<strong>in</strong>g to <strong>in</strong>adequate samplesize for detect<strong>in</strong>g association.The effects <strong>of</strong> dust storms oncl<strong>in</strong>ic visits for conjunctivitiswere marked 4 days after<strong>the</strong> event. However, <strong>the</strong>association was not statisticallysignificant.Conjunctivitis<strong>Asia</strong>n duststorm (PM 10 ,SO 2 , NO 2 ,CO, O 3 )Episodestudy <strong>of</strong><strong>Asia</strong>n duststormEpisodestudy <strong>of</strong><strong>Asia</strong>n duststormEpisodestudy <strong>of</strong><strong>Asia</strong>n duststormDur<strong>in</strong>g several months <strong>of</strong>haze from forest fires, an<strong>in</strong>crease <strong>in</strong> <strong>the</strong> PM 10 concentrationsfrom 50 to150 µg/m 3 was significantlyassociated with <strong>in</strong>creases <strong>in</strong>outpatient visits for upperrespiratory illness (12%),asthma (19%), <strong>and</strong> rh<strong>in</strong>itis(26%). Nei<strong>the</strong>r hospitaladmissions nor mortality<strong>in</strong>creased significantly.<strong>Asia</strong>n dust events were foundto be weakly associated withmortality from all causes.However, <strong>the</strong> associationbetween dust events <strong>and</strong>deaths from respiratorycauses was stronger.<strong>Asia</strong>n dust events were positively,but not significantly,associated with respiratory<strong>and</strong> cardiovascular mortality.The relationship wasstronger <strong>in</strong> people 65 yr.253
<strong>Outdoor</strong> <strong>Air</strong> <strong>Pollution</strong> <strong>and</strong> <strong>Health</strong> <strong>in</strong> <strong>the</strong> Develop<strong>in</strong>g <strong>Countries</strong> <strong>of</strong> <strong>Asia</strong>Appendix Table A.3. Number <strong>of</strong> Studies Report<strong>in</strong>g Mortality <strong>and</strong> Admissions Results by Outcome <strong>and</strong> Pollutant aDiseaseNumber <strong>of</strong>StudieswithNumericalEstimatesPollutantTSP PM 10 PM 2.5 SO 2 NO 2 CO O 3MortalityAll natural causes 38 13 22 3 23 14 9 17Respiratory disease 20 5 15 2 11 9 6 10COPD 10 4 5 7 3 1 2Cardiovascular disease 24 7 17 2 13 11 5 10Cardiac disease 2 1 1Cerebrovascular event 10 2 6 6 6 2 5Ischemic heart disease 3 2 1 1 2Cancer 4 2 1 3AdmissionsRespiratory disease 4 1 3 4 4 1 4Asthma 13 2 11 2 10 10 6 11COPD 4 4 1 4 4 2 4Cardiovascular disease 3 2 2 2 3Cardiac disease 3 3 3 3 2 3Cerebrovascular event 6 5 2 5 4 3 6Ischemic heart disease 5 4 1 4 4 2 5Heart failure 2 1 1 1 2Dysrhythmia 1a Studies that <strong>in</strong>cluded more than one pollutant were counted with each pollutant.Appendix Table A.4. Number <strong>of</strong> Studies Report<strong>in</strong>g Resultsby Age Group aAgeGroupYearsNumber<strong>of</strong> StudiesChildren 0–20 20Young adults 5–64 7Adults 11–64 4Older adults 30 58Not elderly 0–65 6Elderly 65 20Miscellaneous 9a Studies that <strong>in</strong>cluded analyses <strong>of</strong> more than one age group were counted<strong>in</strong> each group.254
APPENDIX B. Additional Analyses <strong>of</strong> Effects <strong>of</strong>Long-Term ExposureAppendix Table B.1. ORs (<strong>and</strong> 95% CIs) for Asthma from Qualitative Comparisons Between Areas with Differ<strong>in</strong>gPollutant Levels <strong>in</strong> Studies <strong>of</strong> Urban <strong>and</strong> Rural Locations or Between Cities aCitation Study Details b OR (95% CI)Ho et al. 2007 Taipei,Ch<strong>in</strong>a, A+W-r, high vs. low CO, female 1.98 (1.54–2.56)Ho et al. 2007 Taipei,Ch<strong>in</strong>a, A+W-r, high vs. low CO, male 1.78 (1.38–2.30)Ho et al. 2007 Taipei,Ch<strong>in</strong>a, A+W-r, high vs. low O 3 , female 1.00Ho et al. 2007 Taipei,Ch<strong>in</strong>a, A+W-r, high vs. low O 3 , male 1.02 (1.00–1.03)Ho et al. 2007 Taipei,Ch<strong>in</strong>a, A+W-r, high vs. low PM 10 , female 0.99 (0.99–1.00)Ho et al. 2007 Taipei,Ch<strong>in</strong>a, A+W-r, high vs. low PM 10 , male 1.00Kuo et al. 2002 Taipei,Ch<strong>in</strong>a, A+W-rns, high vs. low NO 2 , female + male 1.69 (1.16–2.48)Kuo et al. 2002 Taipei,Ch<strong>in</strong>a, A+W-rns, high vs. low O 3 , female + male 0.75 (0.32–1.77)Kuo et al. 2002 Taipei,Ch<strong>in</strong>a, A+W-rns, high vs. low PM 10 , female + male 0.95 (0.64–1.40)Kuo et al. 2002 Taipei,Ch<strong>in</strong>a, A+W-rns, high vs. low SO 2 , female + male 1.20 (0.67–2.13)L<strong>in</strong> RS et al. 2001c Taipei,Ch<strong>in</strong>a, A+W-r, high vs. low CO, female + male 1.30 (1.18–1.43)L<strong>in</strong> RS et al. 2001c Taipei,Ch<strong>in</strong>a, A+W-r, med vs. low CO, female + male 1.10 (1.03–1.17)Qian Z et al. 2000 Ch<strong>in</strong>a, W-r, high- vs. low-pollution districts, female + male 1.48 (0.95–2.31)Qian Z et al. 2004 Ch<strong>in</strong>a, W-r, high- vs. low-pollution districts, female + male 2.33 (1.71–3.17)Qian Z et al. 2004 Ch<strong>in</strong>a, A-rns, high- vs. low-pollution districts, female + male 2.30 (1.26–4.20)Wang TN 1999 Taipei,Ch<strong>in</strong>a, W-r, high vs. low CO, female + male 1.15 (1.10–1.20)Wang TN 1999 Taipei,Ch<strong>in</strong>a, W-r, high vs. low NO 2 , female + male 1.08 (1.04–1.12)Wang TN 1999 Taipei,Ch<strong>in</strong>a, W-r, high vs. low O 3 , female + male 1.11 (1.07–1.15)Wang TN 1999 Taipei,Ch<strong>in</strong>a, W-r, high vs. low PM 10 , female + male 1.00 (0.96–1.04)Wang TN 1999 Taipei,Ch<strong>in</strong>a, W-r, high vs. low SO 2 , female + male 0.98 (0.95–1.01)Wang TN 1999 Taipei,Ch<strong>in</strong>a, W-r, high vs. low TSP, female + male 1.29 (1.24–1.34)Yang CY et al. 1997 Taipei,Ch<strong>in</strong>a, W-r, <strong>in</strong>dustrial vs. non-<strong>in</strong>dustrial, female + male 1.65 (0.88–3.09)Aggarwal et al. 2006 India, A-r, urban vs. rural, female + male 1.34 (1.19–1.51)Chen PC et al. 1998 Taipei,Ch<strong>in</strong>a, A+W-rns, urban vs. rural, female + male 1.68 (1.11–2.54)Hong CY et al. 2004a Indonesia, W-rns, urban vs. rural, female + male 1.18 (0.46–3.03)Hong SJ et al. 2004b South Korea, W-r, <strong>in</strong>dustrial vs. rural <strong>in</strong> 1995, female + male 1.38 (0.80–2.38)Hong SJ et al. 2004b South Korea, W-r, <strong>in</strong>dustrial vs. rural <strong>in</strong> 2000, female + male 0.71 (0.31–1.62)Hong SJ et al. 2004b South Korea, W-r, urban vs. rural <strong>in</strong> 1995, female + male 1.25 (0.93–1.68)Hong SJ et al. 2004b South Korea, W-r, urban vs. rural <strong>in</strong> 2000, female + male 0.82 (0.58–1.16)Yang CY et al. 1998 Taipei,Ch<strong>in</strong>a, W-r, <strong>in</strong>dustrial vs. rural, female + male 1.22 (0.69–2.16)a The study details <strong>and</strong> ORs correspond to those shown <strong>in</strong> Figure 66.b The study details consist <strong>of</strong> <strong>the</strong> location, outcome, pollutant levels or areas compared, <strong>and</strong> sex <strong>of</strong> subjects. Female + male <strong>in</strong>dicates <strong>the</strong> data werecomb<strong>in</strong>ed. The six outcome categories were recent wheez<strong>in</strong>g (W-r); recent asthma (A-r); wheez<strong>in</strong>g, degree <strong>of</strong> recency not specified (W-rns); asthma, degree<strong>of</strong> recency not specified (A-rns); <strong>and</strong> asthma <strong>and</strong> wheeze toge<strong>the</strong>r (A+W-r <strong>and</strong> A+W-rns).255
<strong>Outdoor</strong> <strong>Air</strong> <strong>Pollution</strong> <strong>and</strong> <strong>Health</strong> <strong>in</strong> <strong>the</strong> Develop<strong>in</strong>g <strong>Countries</strong> <strong>of</strong> <strong>Asia</strong>Appendix Table B.2. ORs (<strong>and</strong> 95% CIs) for Asthma from Qualitative Comparisons Between Areas with Differ<strong>in</strong>gPollutant Levels or Proximities to Traffic With<strong>in</strong> Cities aCitation Study Details b OR (95% CI)Langkulsen et al. 2006 c Thail<strong>and</strong>, A-r, high1 vs. low, female + male 2.60 (1.38–4.90)Langkulsen et al. 2006 c Thail<strong>and</strong>, A-r, high2 vs. low, female + male 2.44 (1.21–4.92)Langkulsen et al. 2006 c Thail<strong>and</strong>, A-r, high3 vs. low, female + male 1.57 (0.76–3.24)Xu X <strong>and</strong> Wang L 1993 Ch<strong>in</strong>a, W-r, high vs. low PM, female + male 2.10 (1.20–3.68)Xu X <strong>and</strong> Wang L 1993 Ch<strong>in</strong>a, W-r, mod vs. low PM, female + male 1.40 (0.80–2.45)Yu TS et al. 2001 Hong Kong, W-r, high vs. low pollution, female + male 1.31 (0.65–2.64)Yu TS et al. 2001 Hong Kong, A-rns, high vs. low pollution, female + male 1.98 (1.24–3.16)Zhang J et al. 1999 Ch<strong>in</strong>a, A-rns, urban vs. suburban, female 0.84 (0.14–5.04)Zhang J et al. 1999 Ch<strong>in</strong>a, W-r, urban vs. suburban, female 0.85 (0.41–1.76)Zhang J et al. 1999 Ch<strong>in</strong>a, A-rns, urban vs. suburban, male 3.59 (1.36–9.48)Zhang J et al. 1999 Ch<strong>in</strong>a, W-r, urban vs. suburban, male 0.71 (0.38–1.33)Nakai et al. 1999 Japan, W-r, 20–150 m vs. residential, female 0.85 (0.45–1.61)Nakai et al. 1999 Japan, W-r, < 20 m vs. 20–50 m, female 1.17 (0.59–2.32)Nakai et al. 1999 Japan, W-r, < 20 m vs. residential, female 1.00 (0.48–2.08)Nitta et al. 1993 Japan, W-r, 20–50 m vs. 50–150 m <strong>in</strong> 1982, female 1.17 (0.69–1.98)Nitta et al. 1993 Japan, W-r, < 20 m vs. 20–150 m <strong>in</strong> 1979, female 2.75 (1.65–4.58)Nitta et al. 1993 Japan, W-r, < 20 m vs. 20–150 m <strong>in</strong> 1983, female 0.94 (0.61–1.45)Nitta et al. 1993 Japan, W-r, < 20 m vs. 50–150 m <strong>in</strong> 1982, female 1.52 (0.91–2.54)Sek<strong>in</strong>e et al. 2004 Japan, A-r, high vs. low traffic density, female 2.66 (0.98–7.22)Sek<strong>in</strong>e et al. 2004 Japan, W-r, high vs. low traffic density, female 1.34 (0.85–2.11)Sek<strong>in</strong>e et al. 2004 Japan, W-r, medium vs. low traffic density, female 1.39 (0.95–2.03)Sek<strong>in</strong>e et al. 2004 Japan, A-r, medium vs. low traffic density, female 1.99 (0.82–4.83)Shima et al. 2003 d Japan, A-r, 0–49 m vs. rural, female 4.03 (0.90–18.05)Shima et al. 2003 Japan, W-r, 0–49 m vs. rural, female 0.76 (0.08–7.22)Shima et al. 2003 Japan, W-r, 0–49 m vs. rural, male 1.35 (0.34–5.36)Shima et al. 2003 d Japan, A-r, 0–49 m vs. rural, male 3.77 (1.00–14.21)Shima et al. 2003 dJapan, A-r, 50 m vs. rural, female 1.74 (0.63–4.81)Shima et al. 2003 Japan, W-r, 50 m vs. rural, female 0.79 (0.26–2.40)Shima et al. 2003 d Japan, A-r, 50 m vs. rural, male 1.99 (0.79–5.01)Shima et al. 2003 Japan, W-r, 50 m vs. rural, male 1.02 (0.44–2.36)Yang CY et al. 2002c Taipei,Ch<strong>in</strong>a, W-r, high vs. low pollution, female + male 1.01 (0.84–1.21)Yang CY et al. 2002c Taipei,Ch<strong>in</strong>a, A-r, high vs. low pollution, female + male 0.94 (0.78–1.13)a The study details <strong>and</strong> ORs correspond to those shown <strong>in</strong> Figure 67.b The study details consist <strong>of</strong> <strong>the</strong> location; outcome; pollutant levels or areas or distances (m) from traffic compared; <strong>and</strong> sex <strong>of</strong> subjects. The six outcomecategories were recent wheez<strong>in</strong>g (W-r); recent asthma (A-r); wheez<strong>in</strong>g, degree <strong>of</strong> recency not specified (W-rns); asthma, degree <strong>of</strong> recency not specified(A-rns); <strong>and</strong> asthma <strong>and</strong> wheeze toge<strong>the</strong>r (A+W-r <strong>and</strong> A+W-rns).c For Langkulsen et al. 2006, high1 vs. low means highly polluted general area vs. control area; high2 vs. low means highly polluted roadside area vs.control area; high3 vs. low means moderately polluted roadside area vs. control area.d The ORs for Shima et al. 2003 are estimates <strong>of</strong> <strong>the</strong> relative risk <strong>of</strong> new occurrences <strong>of</strong> asthma.256
HEI International Scientific Oversight CommitteeAppendix Table B.3 ORs (<strong>and</strong> 95% CIs) for Asthma from Quantitative Comparisons aCitation Study Details b Concentration (95% CI)OR per 10-µg/m 3Change <strong>in</strong> PollutantHwang BF et al. 2005a Taipei,Ch<strong>in</strong>a, A-rns, CO, female + male 1.00 (1.00–1.01)Hwang BF et al. 2005a Taipei,Ch<strong>in</strong>a, A-rns, NO x , female + male 1.00 (0.98–1.03)Hwang BF et al. 2005a Taipei,Ch<strong>in</strong>a, A-rns, O 3 , female + male 1.07 (1.00–1.14)Hwang BF et al. 2005a Taipei,Ch<strong>in</strong>a, A-rns, PM 10 , female + male 0.93 (0.91–0.96)Hwang BF et al. 2005a Taipei,Ch<strong>in</strong>a, A-rns, SO 2 , female + male 0.95 (0.89–1.02)Mi et al. 2006 c Ch<strong>in</strong>a, A-rns, NO 2 , female + male 1.44 (1.06–1.96)Mi et al. 2006 c Ch<strong>in</strong>a, W-r, NO 2 , female + male 1.00 (0.74–1.35)Mi et al. 2006 c Ch<strong>in</strong>a, W-r, O 3 , female + male 0.43 (0.16–1.16)Mi et al. 2006 c Ch<strong>in</strong>a, A-rns, O 3 , female + male 0.54 (0.21–1.39)Shima <strong>and</strong> Adachi 2000 d Japan, W-r, NO 2 , female 1.08 (0.92–1.26)Shima <strong>and</strong> Adachi 2000 d Japan, A-r, NO 2 , female 1.05 (0.87–1.26)Shima <strong>and</strong> Adachi 2000 d Japan, A-r, NO 2 , female + male 1.47 (1.05–2.07)Shima <strong>and</strong> Adachi 2000 d Japan, W-r, NO 2 , female + male 1.34 (1.02–1.77)Shima <strong>and</strong> Adachi 2000 d Japan, W-r, NO 2 , male 1.13 (0.99–1.30)Shima <strong>and</strong> Adachi 2000 d Japan, A-r, NO 2 , male 1.13 (0.97–1.31)Shima et al. 2002 Japan, A+W-r, NO 2 , female 1.00 (0.83–1.20)Shima et al. 2002 Japan, A+W-r, PM 10 , female 1.03 (0.79–1.35)Shima et al. 2002 Japan, A+W-r, NO 2 , female + male 0.94 (0.78–1.14)Shima et al. 2002 e Japan, A+W-r (<strong>in</strong>cidence), NO 2 , female + male 1.32 (1.02–1.71)Shima et al. 2002 Japan, A+W-r, PM 10 , female + male 1.00 (0.75–1.35)Shima et al. 2002 e Japan, A+W-r (<strong>in</strong>cidence), PM 10 , female + male 1.50 (0.93–2.40)Shima et al. 2002 Japan, A+W-r, NO 2 , male 0.88 (0.66–1.17)Shima et al. 2002 Japan, A+W-r, PM 10 , male 0.98 (0.63–1.52)Zhang JF et al. 2002 Ch<strong>in</strong>a, W-r, NO x , female + male 0.97 (0.91–1.04)Zhang JF et al. 2002 Ch<strong>in</strong>a, A-rns, NO x , female + male 0.99 (0.93–1.06)Zhang JF et al. 2002 Ch<strong>in</strong>a, W-r, PM 10 , female + male 1.01 (0.94–1.09)Zhang JF et al. 2002 Ch<strong>in</strong>a, A-rns, PM 10 , female + male 1.03 (0.97–1.10)Zhang JF et al. 2002 Ch<strong>in</strong>a, A-rns, PM 10–2.5 , female + male 1.06 (0.96–1.17)Zhang JF et al. 2002 Ch<strong>in</strong>a, W-r, PM 10–2.5 , female + male 1.03 (0.90–1.17)Zhang JF et al. 2002 Ch<strong>in</strong>a, W-r, PM 2.5 , female + male 1.01 (0.87–1.18)Zhang JF et al. 2002 Ch<strong>in</strong>a, A-rns, PM 2.5 , female + male 1.05 (0.92–1.20)Zhang JF et al. 2002 Ch<strong>in</strong>a, A-rns, SO 2 , female + male 1.00 (0.97–1.04)Zhang JF et al. 2002 Ch<strong>in</strong>a, W-r, SO 2 , female + male 1.01 (0.98–1.05)Zhang JF et al. 2002 Ch<strong>in</strong>a, W-r, TSP, female + male 1.01 (0.99–1.03)Zhang JF et al. 2002 Ch<strong>in</strong>a, A-rns, TSP, female + male 1.01 (1.00–1.02)a The study details <strong>and</strong> ORs correspond to those shown <strong>in</strong> Figure 68 [VI.5a].b The study details consist <strong>of</strong> <strong>the</strong> location, outcome, pollutant, <strong>and</strong> sex <strong>of</strong> subjects. The six outcome categories were recent wheez<strong>in</strong>g (W-r); recent asthma(A-r); wheez<strong>in</strong>g, degree <strong>of</strong> recency not specified (W-rns); asthma, degree <strong>of</strong> recency not specified (A-rns); <strong>and</strong> asthma <strong>and</strong> wheeze toge<strong>the</strong>r (A+W-r <strong>and</strong>A+W-rns).c Mi et al. 2006 was conducted with<strong>in</strong> a s<strong>in</strong>gle city.d The ORs from Shima <strong>and</strong> Adachi 2000 are for 4th, 5th, <strong>and</strong> 6th grades comb<strong>in</strong>ed.e Two <strong>of</strong> <strong>the</strong> ORs for females <strong>and</strong> males from Shima et al. 2002 were calculated from asthma <strong>in</strong>cidence data.257
Abbreviations <strong>and</strong> O<strong>the</strong>r TermsA-rA-rnsA+W-rA+W-rnsACSAHSMOGALRIAPEDAPHEAAPHENAATSBCBHRBMRCCAI-<strong>Asia</strong>CICMBCNGCOCO 2COPDDALYsECECRHSERETSFEFFEF 25–75FEV 1FVCGAMGDPrecent asthmaasthma, recency not specifiedrecent asthma <strong>and</strong> wheezeasthma <strong>and</strong> wheeze, recency not specifiedAmerican Cancer SocietySeventh-Day Adventist <strong>Health</strong> Study<strong>of</strong> Smogacute lower respiratory <strong>in</strong>fection<strong>Air</strong> <strong>Pollution</strong> Epidemiology Database<strong>Air</strong> <strong>Pollution</strong> <strong>and</strong> <strong>Health</strong>: A EuropeanApproach<strong>Air</strong> <strong>Pollution</strong> <strong>and</strong> <strong>Health</strong>: A European<strong>and</strong> North American ApproachAmerican Thoracic Societyblack carbonbronchial hyperresponsivenessBritish Medical Research CouncilClean <strong>Air</strong> Initiative for <strong>Asia</strong>n Citiesconfidence <strong>in</strong>tervalchemical mass balancecompressed natural gascarbon monoxidecarbon dioxidechronic obstructive pulmonary diseasedisability-adjusted life-yearselemental carbonEuropean Community Respiratory <strong>Health</strong>Servicesemergency roomenvironmental tobacco smokeforced expiratory flowforced expiratory flow dur<strong>in</strong>g <strong>the</strong> middlehalf <strong>of</strong> FVCforced expiratory volume <strong>in</strong> 1 secondforced vital capacitygeneralized additive modelgross domestic productGHG greenhouse gasGMAPs Global Model for Ambient ParticulatesGNI gross national <strong>in</strong>comeHEART <strong>Health</strong> Effects <strong>of</strong> <strong>Air</strong> <strong>Pollution</strong> ReductionTrialHVAC heat<strong>in</strong>g, ventilation, <strong>and</strong> air-condition<strong>in</strong>gIHD ischemic heart diseaseISAAC International Study <strong>of</strong> Asthma <strong>and</strong> Allergies<strong>in</strong> ChildhoodISOC International Scientific Oversight CommitteeIUATLD International Union Aga<strong>in</strong>st Tuberculosis<strong>and</strong> Lung DiseaseLPG liquefied petroleum gasMMEF 25–75 maximum midexpiratory flow dur<strong>in</strong>g <strong>the</strong>middle half <strong>of</strong> FVCNAAQS National Ambient <strong>Air</strong> Quality St<strong>and</strong>ardsNAE National Academy <strong>of</strong> Eng<strong>in</strong>eer<strong>in</strong>gNHLBI National Heart, Lung, <strong>and</strong> BloodInstitute (U.S.)NMMAPS National Morbidity, Mortality, <strong>and</strong> <strong>Air</strong><strong>Pollution</strong> StudyNMVOCs non-methane volatile organic compoundsNO nitric oxideNO 3 nitratesNO 2 nitrogen dioxideNO x oxides <strong>of</strong> nitrogenNRC National Research CouncilO 3 ozoneOC organic carbonOECD Organisation for Economic Co-operation<strong>and</strong> DevelopmentOR odds ratioPACF partial autocorrelation functionPAHO Pan American <strong>Health</strong> OrganizationPAHs polycyclic aromatic hydrocarbonsPAPA Public <strong>Health</strong> <strong>and</strong> <strong>Air</strong> <strong>Pollution</strong> <strong>in</strong> <strong>Asia</strong>259
<strong>Outdoor</strong> <strong>Air</strong> <strong>Pollution</strong> <strong>and</strong> <strong>Health</strong> <strong>in</strong> <strong>the</strong> Develop<strong>in</strong>g <strong>Countries</strong> <strong>of</strong> <strong>Asia</strong>PAPA–SANPCAPublic <strong>Health</strong> <strong>and</strong> <strong>Air</strong> <strong>Pollution</strong> <strong>in</strong> <strong>Asia</strong>— Science Access on <strong>the</strong> Netpr<strong>in</strong>cipal-components analysisSESEPAst<strong>and</strong>ard errorCh<strong>in</strong>ese State Environmental ProtectionAdm<strong>in</strong>istrationPEFRpeak expiratory flow rateSO 2sulfur dioxidePFTPMPM 2.5pulmonary function testparticulate matterPM with an aerodynamic diameter 2.5 µmSO 2 4SPMTBTSPsulfatesuspended particulate mattertuberculosistotal suspended particlesPM 10PM 102.5PMFppmVPPPPM with an aerodynamic diameter 10 µmPM with an aerodynamic diameterbetween 10 <strong>and</strong> 2.5 µmpositive matrix factorizationparts per million by volumepurchas<strong>in</strong>g power parityUNEPUNFPAUN-HabitatU.S. EPAVO 2 maxVOCsUnited Nations Environment ProgrammeUnited Nations Population FundUnited Nations Human SettlementsProgrammeU.S. Environmental Protection Agencymaximal oxygen uptakevolatile organic compoundsREASRegional Emissions Inventory <strong>in</strong> <strong>Asia</strong>W-rrecent wheezeRRrelative riskW-rnswheeze, recency not specifiedRSPrespirable suspended particlesWHOWorld <strong>Health</strong> Organization260
Cities, Prov<strong>in</strong>ces, <strong>and</strong> <strong>Countries</strong>COUNTRIESBangladeshBhutanBruneiCambodiaCh<strong>in</strong>aIndiaIndonesiaInner MongoliaJapanLaosMongoliaMaldivesMalaysiaMyanmar (Burma)NepalPakistanPhilipp<strong>in</strong>esS<strong>in</strong>gaporeSouth KoreaSri LankaTaipei,Ch<strong>in</strong>aThail<strong>and</strong>Timor-LesteVietnamCITIES OR PROVINCESAgra, IndiaAhmedabad, IndiaAnsan, South KoreaAwara-machi, JapanB<strong>and</strong>ar, IndonesiaB<strong>and</strong>ung, IndiaBangalore, IndiaBangkok, Thail<strong>and</strong>Beij<strong>in</strong>g, Ch<strong>in</strong>aBenxi, Ch<strong>in</strong>aBucheon, South KoreaBusan, South KoreaCh<strong>and</strong>igarh, IndiaChangchun, Ch<strong>in</strong>aChangsha, Ch<strong>in</strong>aChangwon, South KoreaCheju (Chuju, Jeju), South KoreaChengdu, Ch<strong>in</strong>aChennai, IndiaChiba, JapanChongq<strong>in</strong>g, Ch<strong>in</strong>aChuju (Cheju, Jeju), South KoreaChunchon, South KoreaChungju (Chunju), South KoreaChunju (Chungju), South KoreaChu-Shan, Ch<strong>in</strong>aColombo, Sri LankaDaegu, South KoreaDaejeon, South KoreaDakar, SenegalDalian, Ch<strong>in</strong>aDelhi, IndiaDhaka, BangladeshDongguan, Ch<strong>in</strong>aFoshan, Ch<strong>in</strong>aFukuoka, JapanFuzhou, Ch<strong>in</strong>aGyeonggi-do Prov<strong>in</strong>ce, South KoreaGosan, South KoreaGuangdong Prov<strong>in</strong>ce, Ch<strong>in</strong>aGuangzhou, Ch<strong>in</strong>aGuiyang, Ch<strong>in</strong>aGwangju, South KoreaHaikou, Ch<strong>in</strong>aHanoi, VietnamHangzhou, Ch<strong>in</strong>aHarb<strong>in</strong>, Ch<strong>in</strong>aHebei Prov<strong>in</strong>ce, Ch<strong>in</strong>aHefei, Ch<strong>in</strong>aHiroshima, JapanHo Chi M<strong>in</strong>h City, VietnamHong Kong, Ch<strong>in</strong>aHohhot, Ch<strong>in</strong>a261
<strong>Outdoor</strong> <strong>Air</strong> <strong>Pollution</strong> <strong>and</strong> <strong>Health</strong> <strong>in</strong> <strong>the</strong> Develop<strong>in</strong>g <strong>Countries</strong> <strong>of</strong> <strong>Asia</strong>Huizhou, Ch<strong>in</strong>aHyderabad, IndiaIncheon, South KoreaIslamabad, PakistanJakarta, IndonesiaJalgaon, IndiaJiangmen, Ch<strong>in</strong>aJ<strong>in</strong>an, Ch<strong>in</strong>aKagoshima City, JapanKanazawa, JapanKanpur, IndiaKaohsiung, TaiwanKarachi, PakistanKawasaki, JapanKathm<strong>and</strong>u, NepalKathm<strong>and</strong>u Valley, NepalKer<strong>in</strong>ci, IndonesiaKitakyushu, JapanKobe, JapanKolkata, IndiaKuala Lumpur, MalaysiaKunm<strong>in</strong>g, Ch<strong>in</strong>aKushira, JapanKusu, JapanKwangju, South KoreaKwun Tong, district <strong>of</strong> Hong Kong, Ch<strong>in</strong>aKyoto, JapanLagos, NigeriaLampung, IndonesiaLanzhou, Ch<strong>in</strong>aLhasa, Ch<strong>in</strong>aLhasa, TibetL<strong>in</strong>-yuan, Taipei,Ch<strong>in</strong>aLucknow, IndiaLudhiana, IndiaMacao, Ch<strong>in</strong>aManila, Philipp<strong>in</strong>esM<strong>and</strong>i Gob<strong>in</strong>dgarh, IndiaMihama, JapanMor<strong>in</strong>da, IndiaMumbai, IndiaNagoya, JapanNanchang, Ch<strong>in</strong>aNanj<strong>in</strong>g, Ch<strong>in</strong>aNann<strong>in</strong>g, Ch<strong>in</strong>aNew Delhi, India — south <strong>of</strong> DelhiOsaka, JapanOura, JapanPelalawan, IndonesiaP<strong>in</strong>tong, Taipei,Ch<strong>in</strong>aPune, IndiaRajshahi, BangladeshSakurajima, JapanSapporo, JapanSendai, JapanSeoul, South KoreaSh<strong>and</strong>ong, Ch<strong>in</strong>aShanghai, Ch<strong>in</strong>aShat<strong>in</strong>, district <strong>of</strong> Hong Kong, Ch<strong>in</strong>aShanxi, Ch<strong>in</strong>aShenyang, Ch<strong>in</strong>aShenzhen, Ch<strong>in</strong>aShijiazhuang, Ch<strong>in</strong>aSholapur, IndiaSihwa <strong>in</strong>dustrial district, South KoreaSP7, IndonesiaSurabaya, IndonesiaSurat, IndiaSuwon, South KoreaTaegu, South KoreaTaichung, Ch<strong>in</strong>aTaihsi, Taipei,Ch<strong>in</strong>aTaipei, Taipei,Ch<strong>in</strong>aTianj<strong>in</strong>, Ch<strong>in</strong>aTokyo, JapanUlsan, South KoreaWuhan, Ch<strong>in</strong>aWulumuqi (Urumqi), Ch<strong>in</strong>aXi’an, Ch<strong>in</strong>aX<strong>in</strong><strong>in</strong>g, Ch<strong>in</strong>aXhijiazhuang, Ch<strong>in</strong>aYamashita public health district, JapanYang-M<strong>in</strong>g, Ch<strong>in</strong>aY<strong>in</strong>chuan, Ch<strong>in</strong>aYokkaichi, JapanYokohama, JapanZhengzhou, Ch<strong>in</strong>aZhongshan, Ch<strong>in</strong>aZhuhai, Ch<strong>in</strong>aZhuang-J<strong>in</strong>g, Ch<strong>in</strong>a262
GLOSSARYEPIDEMIOLOGIC STUDY DESIGNS ANDBIOSTATISTICAL TERMS COMMONLY USED INAIR POLLUTION STUDIESCase–control study In a case–control study, persons <strong>in</strong> apopulation who develop particular diseases, or who diefrom those diseases, are identified <strong>and</strong> <strong>the</strong>n classifiedaccord<strong>in</strong>g to <strong>the</strong>ir exposure to air pollution <strong>and</strong> o<strong>the</strong>r factorsrelated to disease occurrence, such as age <strong>and</strong> cigarette-smok<strong>in</strong>gstatus. These are <strong>the</strong> cases. A sample <strong>of</strong>members <strong>of</strong> <strong>the</strong> study population who were free <strong>of</strong> <strong>the</strong> diseaseat <strong>the</strong> time that <strong>the</strong> case subjects became ill or died(<strong>the</strong> controls) is also selected <strong>and</strong> classified <strong>in</strong> terms <strong>of</strong> <strong>the</strong>same risk factors. An estimate <strong>of</strong> <strong>the</strong> relative risk <strong>of</strong> diseaseor death that is associated with a particular factor, <strong>of</strong>tentermed an odds ratio, can <strong>the</strong>n be calculated. The case–control approach provides an efficient alternative to acohort study (see description below), because <strong>the</strong> relativerisk <strong>of</strong> disease or death can be estimated <strong>in</strong> a populationwithout hav<strong>in</strong>g to collect <strong>in</strong>formation on all its members.Case–crossover study In a case–crossover study, cases <strong>of</strong>,or deaths from, particular diseases that occur <strong>in</strong> a populationare studied to provide an estimate <strong>of</strong> <strong>the</strong> effect <strong>of</strong>short-term exposure to air pollution. For each person whohas <strong>the</strong> disease or who has died, exposure to air pollutionis determ<strong>in</strong>ed for a period near <strong>the</strong> time <strong>of</strong> diagnosis ordeath (<strong>the</strong> case period) <strong>and</strong> one or more periods dur<strong>in</strong>gwhich <strong>the</strong> health event did not occur (control periods).The relative rate or relative risk can <strong>the</strong>n be estimatedus<strong>in</strong>g st<strong>and</strong>ard methods <strong>of</strong> analysis for matched case–controldata.Cohort study Cohort studies provide estimates <strong>of</strong> <strong>the</strong>effects <strong>of</strong> prolonged exposure to air pollution on mortality<strong>and</strong> morbidity due to chronic disease. In a cohort study,members <strong>of</strong> an entire population who are <strong>in</strong>itially free <strong>of</strong>disease are observed over an extended period <strong>of</strong> time. Eachmember <strong>of</strong> <strong>the</strong> population is classified accord<strong>in</strong>g to his orher exposure to air pollution, <strong>of</strong>ten determ<strong>in</strong>ed on <strong>the</strong>basis <strong>of</strong> place <strong>of</strong> residence, <strong>and</strong> accord<strong>in</strong>g to o<strong>the</strong>r factorsrelated to <strong>the</strong> occurrence <strong>of</strong> disease, such as age <strong>and</strong> cigarette-smok<strong>in</strong>gstatus. The rate or <strong>the</strong> risk <strong>of</strong> disease ordeath that occur among <strong>the</strong> exposed <strong>and</strong> unexposed personsare <strong>the</strong>n compared <strong>in</strong> order to estimate <strong>the</strong> effects <strong>of</strong>exposure. Differences <strong>in</strong> <strong>the</strong>se rates are <strong>of</strong>ten presented asa rate ratio or relative risk.Confounder or confound<strong>in</strong>g Confound<strong>in</strong>g refers to confus<strong>in</strong>g<strong>the</strong> effect <strong>of</strong> <strong>the</strong> variable <strong>of</strong> <strong>in</strong>terest with <strong>the</strong> effect <strong>of</strong>ano<strong>the</strong>r variable, <strong>the</strong> confounder. The confusion leads to abiased estimate <strong>of</strong> <strong>the</strong> effect <strong>of</strong> <strong>the</strong> variable <strong>of</strong> <strong>in</strong>terest. Forexample, <strong>the</strong> effect <strong>of</strong> exposure to an air pollutant is ourvariable <strong>of</strong> <strong>in</strong>terest; but o<strong>the</strong>r factors that affect humanhealth (e.g., season, wea<strong>the</strong>r, tobacco smok<strong>in</strong>g, <strong>in</strong>doorburn<strong>in</strong>g <strong>of</strong> solid fuels, <strong>and</strong> access to medical care) may becorrelated <strong>in</strong> <strong>the</strong> same place <strong>and</strong> time as <strong>the</strong> exposure <strong>and</strong><strong>the</strong>ir effects could be confused with those <strong>of</strong> <strong>the</strong> air pollutant.Confound<strong>in</strong>g may be prevented <strong>in</strong> ei<strong>the</strong>r <strong>the</strong> studydesign or <strong>the</strong> analysis <strong>of</strong> data, for example, by restrict<strong>in</strong>gstudy populations to those who are unexposed to potentialconfounders (e.g., nonsmokers) or through multivariableregression techniques.Cross–sectional study Cross–sectional studies are typicallyused to study <strong>the</strong> effects <strong>of</strong> long-term exposure to airpollution on <strong>the</strong> prevalence <strong>of</strong> chronic respiratory symptoms<strong>and</strong> disease or on chronic impairment <strong>of</strong> pulmonaryfunction. In a cross-sectional study, <strong>the</strong> disease status <strong>and</strong>exposure to air pollution <strong>of</strong> population members at a fixedpo<strong>in</strong>t <strong>in</strong> time are determ<strong>in</strong>ed. The effect <strong>of</strong> exposure on <strong>the</strong>prevalence <strong>of</strong> disease can <strong>the</strong>n be calculated. In contrast tocase–control or cohort studies (see above), however, <strong>in</strong> across-sectional study it is <strong>of</strong>ten not possible to determ<strong>in</strong>e<strong>the</strong> temporal relationship between exposure <strong>and</strong> disease.Ecologic study In an ecologic study, also called an aggregate-levelstudy, <strong>in</strong>formation is not collected on <strong>in</strong>dividualmembers <strong>of</strong> a population; <strong>in</strong>stead, <strong>the</strong> relationshipbetween average rates <strong>of</strong> disease or death <strong>and</strong> averageexposure to air pollution <strong>in</strong> <strong>the</strong> population is analyzed.Such studies <strong>of</strong>ten make use <strong>of</strong> rout<strong>in</strong>ely collected data onboth health outcomes <strong>and</strong> levels <strong>of</strong> air pollution. Whenecologic studies compare <strong>in</strong>cidence or mortality rates forwhole populations <strong>in</strong> geographic regions with differentaverage levels <strong>of</strong> air pollution, <strong>the</strong>y can provide estimates<strong>of</strong> <strong>the</strong> relative risk <strong>of</strong> disease or death due to air pollutionexposure. These estimates are <strong>of</strong>ten more difficult to <strong>in</strong>terpretthan those from case–control or cohort studiesbecause <strong>the</strong>y are not based on data on <strong>in</strong>dividual subjects.<strong>Health</strong> impact study <strong>Health</strong>-impact studies, or assessments,are <strong>of</strong>ten used to estimate <strong>the</strong> potential benefits <strong>in</strong>terms <strong>of</strong> public health <strong>of</strong> actions taken to improve airquality. In a health impact study, <strong>the</strong> amount <strong>of</strong> disease,disability, or death attributable to exposure to air pollution<strong>in</strong> a specific locale is quantified. Such analyses make use263
<strong>Outdoor</strong> <strong>Air</strong> <strong>Pollution</strong> <strong>and</strong> <strong>Health</strong> <strong>in</strong> <strong>the</strong> Develop<strong>in</strong>g <strong>Countries</strong> <strong>of</strong> <strong>Asia</strong><strong>of</strong> data on <strong>the</strong> levels <strong>of</strong> air pollution <strong>and</strong> <strong>the</strong> rates <strong>of</strong> diseaseor death <strong>in</strong> that locale <strong>and</strong> estimates <strong>of</strong> <strong>the</strong> effect <strong>of</strong> airpollution on <strong>the</strong> <strong>in</strong>cidence <strong>of</strong> disease or on mortality, suchas relative risks from epidemiologic studies. The effectestimates may come from studies <strong>of</strong> <strong>the</strong> local population,but when such studies are not available, estimates fromstudies <strong>in</strong> o<strong>the</strong>r populations may also be used.Lag time The <strong>in</strong>terval between exposure to a given pollutantor pollutants <strong>and</strong> <strong>the</strong> subsequent measurement <strong>of</strong>health outcomes, for purposes <strong>of</strong> estimat<strong>in</strong>g <strong>the</strong> <strong>in</strong>dependentcontribution <strong>of</strong> <strong>the</strong> pollutant levels on those healthoutcomes. The lag time can be a s<strong>in</strong>gle <strong>in</strong>terval (<strong>of</strong>ten aday), a cumulative period (usually 2 or more days) overwhich pollutant data are averaged, or a variable <strong>in</strong>tervalpermitt<strong>in</strong>g <strong>the</strong> comparison <strong>of</strong> a given time po<strong>in</strong>t with pollutantdata at each <strong>of</strong> several previous time po<strong>in</strong>ts (called a“distributed lag”). The contributions <strong>of</strong> pollutant levels onoutcomes yielded <strong>in</strong> lag-time models are called “laggedestimates.” Lag times <strong>of</strong> 0 <strong>and</strong> 1 day are commonly used<strong>and</strong> are termed “lag 0” <strong>and</strong> “lag 1,” respectively.Meta-analysis Meta-analysis refers to <strong>the</strong> analysis <strong>of</strong>multiple studies, <strong>in</strong>clud<strong>in</strong>g statistical techniques formerg<strong>in</strong>g <strong>and</strong> contrast<strong>in</strong>g results across studies. (Rothman,Greenl<strong>and</strong> <strong>and</strong> Lash 2008 p. 652)Panel study Panel studies are <strong>of</strong>ten used to estimate <strong>the</strong>effects <strong>of</strong> short-term exposure to air pollution on acute respiratorysymptoms or changes <strong>in</strong> pulmonary function oro<strong>the</strong>r biomarkers. In a panel study, a small group, or“panel,” <strong>of</strong> <strong>in</strong>dividuals is followed for a short period <strong>of</strong>time. Dur<strong>in</strong>g that period, health outcomes <strong>and</strong> exposure toair pollution are ascerta<strong>in</strong>ed for each subject on severaloccasions, <strong>and</strong> <strong>the</strong> longitud<strong>in</strong>al relationship betweenexposure <strong>and</strong> outcome is analyzed.Time-series study A time-series study provides an estimate<strong>of</strong> <strong>the</strong> effects <strong>of</strong> short-term exposure to air pollution.Typically, daily counts <strong>of</strong> health events, such as deaths orhospital admissions, <strong>in</strong> one or more locales are analyzed <strong>in</strong>relation to contemporaneous data on daily concentrations<strong>of</strong> air pollutants <strong>and</strong> o<strong>the</strong>r risk factors, such as wea<strong>the</strong>r,that vary over time. Statistical techniques, typicallyPoisson regression, are <strong>the</strong>n applied to <strong>the</strong>se data to estimate<strong>the</strong> proportional <strong>in</strong>crease <strong>in</strong> <strong>the</strong> rate <strong>of</strong> disease ordeath that is associated with a given <strong>in</strong>crement <strong>in</strong> exposureto air pollution.POLLUTANTS COMMONLY STUDIEDBenzene A clear, colorless, volatile, highly flammableliquid with a characteristic odor. It is found <strong>in</strong> gasol<strong>in</strong>efumes, vehicle emissions, <strong>and</strong> tobacco smoke. Benzene isderived from petroleum <strong>and</strong> is used extensively as a rawmaterial or solvent <strong>in</strong> many manufactur<strong>in</strong>g processes.Carbon monoxide (CO) A colorless, odorless, flammablegas that is toxic at high concentrations. It is produced by<strong>the</strong> <strong>in</strong>complete combustion <strong>of</strong> fossil fuels <strong>and</strong> is emitted bymotor vehicles <strong>and</strong> <strong>in</strong>dustrial activities.Criteria pollutant An air pollutant targeted for regulationby <strong>the</strong> USEPA. Lead, particulate matter, sulfur dioxide,carbon monoxide, nitrogen oxides, ozone, are all criteriapollutants that <strong>the</strong> USEPA is required by <strong>the</strong> United StatesCongress <strong>in</strong> <strong>the</strong> Clean <strong>Air</strong> Act to regulate under nationalambient air quality st<strong>and</strong>ards.Lead (Pb) A s<strong>of</strong>t, heavy, malleable toxic metallic element.It is found naturally as well as <strong>in</strong> certa<strong>in</strong> manufacturedproducts, such as lead-based pa<strong>in</strong>t <strong>and</strong> lead solder <strong>in</strong>water pipes. Historically, most ambient lead emissionswere produced by motor vehicles <strong>and</strong> <strong>in</strong>dustrial sources(e.g., m<strong>in</strong><strong>in</strong>g, smelt<strong>in</strong>g, <strong>and</strong> manufactur<strong>in</strong>g). Today, lead <strong>in</strong>gasol<strong>in</strong>e is banned <strong>in</strong> many <strong>Asia</strong>n countries <strong>and</strong>throughout North America <strong>and</strong> Europe.Nitrogen oxides (NO x ) A group <strong>of</strong> highly reactive gasesconta<strong>in</strong><strong>in</strong>g nitrogen <strong>and</strong> oxygen <strong>in</strong> various proportions.Nitrogen dioxide (NO 2 ) is an example <strong>of</strong> NO x <strong>and</strong> is acommon pollutant. It is produced by <strong>the</strong> combustion <strong>of</strong>fossil fuels <strong>and</strong> is emitted by motor vehicles <strong>and</strong> <strong>in</strong>dustrialsources, such as waste <strong>in</strong>c<strong>in</strong>eration. In many urban locations,motor vehicles are <strong>the</strong> pr<strong>in</strong>cipal source.Ozone (O 3 ) A strong-smell<strong>in</strong>g, extremely reactive toxicform <strong>of</strong> oxygen. It is produced both naturally <strong>and</strong> <strong>in</strong> photochemicalprocesses <strong>in</strong>volv<strong>in</strong>g NO x <strong>and</strong> volatile organic compoundsemitted by motor vehicles <strong>and</strong> <strong>in</strong>dustrial activities.Particulate matter (PM) Very small solid particles <strong>and</strong>liquid droplets suspended or carried <strong>in</strong> air, such as soot,dust, fumes, <strong>and</strong> mist. It is produced both naturally <strong>and</strong> bymotor vehicles <strong>and</strong> <strong>in</strong>dustrial activities, which emit PMdirectly <strong>and</strong> emit o<strong>the</strong>r pollutants that react <strong>in</strong> <strong>the</strong> atmosphereto form additional PM. (Nitrogen <strong>and</strong> sulfur oxides,for example, react to form nitrates <strong>and</strong> sulfates, respectively.)PM gives smog its color <strong>and</strong> affects visibility. Itcomes <strong>in</strong> a wide range <strong>of</strong> sizes, <strong>in</strong>clud<strong>in</strong>g:• Total suspended particulates (TSP) <strong>in</strong> all sizes• PM 10 µm or smaller <strong>in</strong> aerodynamic diameter (PM 10 )or respirable suspended particulates (RSP)• PM 2.5 µm or smaller <strong>in</strong> aerodynamic diameter (PM 2.5 )Sulfur dioxide (SO 2 ) A heavy, colorless, pungent-smell<strong>in</strong>gtoxic gas. It is produced naturally <strong>and</strong> by <strong>the</strong> combustion <strong>of</strong>fossil fuels conta<strong>in</strong><strong>in</strong>g sulfur (such as gasol<strong>in</strong>e, diesel, fueloil, certa<strong>in</strong> coals, <strong>and</strong> natural gas). Sulfur dioxide is emittedby motor vehicles <strong>and</strong> <strong>in</strong>dustrial activities.264
RELATED HEI PUBLICATIONSPr<strong>in</strong>cipalNumber Title Investigator Date*Research Reports154 Public <strong>Health</strong> <strong>and</strong> <strong>Air</strong> <strong>Pollution</strong> <strong>in</strong> <strong>Asia</strong> (PAPA): Coord<strong>in</strong>ated Studies <strong>of</strong>Short-Term Exposure to <strong>Air</strong> <strong>Pollution</strong> <strong>and</strong> Daily Mortality <strong>in</strong> Four CitiesPart 1. A Time-Series Study <strong>of</strong> Ambient <strong>Air</strong> <strong>Pollution</strong> <strong>and</strong> Daily Mortality<strong>in</strong> Shanghai, Ch<strong>in</strong>aPart 2. Association <strong>of</strong> Daily Mortality with Ambient <strong>Air</strong> <strong>Pollution</strong>, <strong>and</strong>Effect Modification by Extremely High Temperature <strong>in</strong> Wuhan, Ch<strong>in</strong>aPart 3. Estimat<strong>in</strong>g <strong>the</strong> Effects <strong>of</strong> <strong>Air</strong> <strong>Pollution</strong> on Mortality <strong>in</strong> Bangkok,Thail<strong>and</strong>Part 4. Interaction Between <strong>Air</strong> <strong>Pollution</strong> <strong>and</strong> Respiratory Viruses: Time-Series Study <strong>of</strong> Daily Mortality <strong>and</strong> Hospital Admissions <strong>in</strong> Hong KongPart 5. Public <strong>Health</strong> <strong>and</strong> <strong>Air</strong> <strong>Pollution</strong> <strong>in</strong> <strong>Asia</strong> (PAPA): A Comb<strong>in</strong>edAnalysis <strong>of</strong> Four Studies <strong>of</strong> <strong>Air</strong> <strong>Pollution</strong> <strong>and</strong> Mortality142 <strong>Air</strong> <strong>Pollution</strong> <strong>and</strong> <strong>Health</strong>: A European <strong>and</strong> North American Approach(APHENA)140 Extended Follow-Up <strong>and</strong> Spatial Analysis <strong>of</strong> <strong>the</strong> American Cancer SocietyStudy L<strong>in</strong>k<strong>in</strong>g Particulate <strong>Air</strong> <strong>Pollution</strong> <strong>and</strong> Mortality139 Effects <strong>of</strong> Long-Term Exposure to Traffic-Related <strong>Air</strong> <strong>Pollution</strong> on Respiratory<strong>and</strong> Cardiovascular Mortality <strong>in</strong> <strong>the</strong> Ne<strong>the</strong>rl<strong>and</strong>s: The NLCS-AIR Study138 <strong>Health</strong> Effects <strong>of</strong> Real-World Exposure to Diesel Exhaust <strong>in</strong> Persons withAsthmaH. Kan 2010Z. Qian 2010N. Vichit-Vadakan 2010C.-M. Wong 2010C.-M. Wong on behalf<strong>of</strong> <strong>the</strong> PAPA teams2010K. Katsouyanni <strong>and</strong> 2009J.M. SametD. Krewski 2009B. Brunekreef 2009J. Zhang 2009137 The Influence <strong>of</strong> Improved <strong>Air</strong> Quality on Mortality Risks <strong>in</strong> Erfurt, Germany A. Peters 2009123 Time-Series Analysis <strong>of</strong> <strong>Air</strong> <strong>Pollution</strong> <strong>and</strong> Mortality: A Statistical Review F. Dom<strong>in</strong>ici 200498 Daily Mortality <strong>and</strong> F<strong>in</strong>e <strong>and</strong> Ultraf<strong>in</strong>e Particles <strong>in</strong> Erfurt, GermanyH-E. Wichmann 2000Part I. Role <strong>of</strong> Particle Number <strong>and</strong> Particle Mass97 Identify<strong>in</strong>g Subgroups <strong>of</strong> <strong>the</strong> General Population That May Be Susceptible toShort-Term Increases <strong>in</strong> Particulate <strong>Air</strong> <strong>Pollution</strong>: A Time-Series Study <strong>in</strong>Montreal, QuebecM.S. Goldberg 200094 The National Morbidity, Mortality, <strong>and</strong> <strong>Air</strong> <strong>Pollution</strong> StudyPart II. Morbidity <strong>and</strong> Mortality from <strong>Air</strong> <strong>Pollution</strong> <strong>in</strong> <strong>the</strong> United States J.M. Samet 2000Part III. PM 10 Concentration–Response Curves <strong>and</strong> Thresholds for <strong>the</strong> 20 M.J. Daniels 2004Largest US CitiesPart IV. Hierarchical Bivariate Time-Series Models — A Comb<strong>in</strong>edAnalysis <strong>of</strong> PM 10 Effects on Hospitalization <strong>and</strong> MortalityF. Dom<strong>in</strong>ici 2005Cont<strong>in</strong>ued* Reports published s<strong>in</strong>ce 1998.Copies <strong>of</strong> <strong>the</strong>se reports can be obta<strong>in</strong>ed from <strong>the</strong> <strong>Health</strong> Effects Institute <strong>and</strong> many are available at www.heal<strong>the</strong>ffects.org.265
RELATED HEI PUBLICATIONSPr<strong>in</strong>cipalNumber Title Investigator Date*Special Reports17 Traffic-Related <strong>Air</strong> <strong>Pollution</strong>: A Critical Review <strong>of</strong> <strong>the</strong> Literature on2010Emissions, Exposure, <strong>and</strong> <strong>Health</strong> Effects15 <strong>Health</strong> Effects <strong>of</strong> <strong>Outdoor</strong> <strong>Air</strong> <strong>Pollution</strong> <strong>in</strong> Develop<strong>in</strong>g <strong>Countries</strong> <strong>of</strong> <strong>Asia</strong>: A2004Literature ReviewRevised Analyses <strong>of</strong> Time-Series Studies <strong>of</strong> <strong>Air</strong> <strong>Pollution</strong> <strong>and</strong> <strong>Health</strong> 2003Reanalysis <strong>of</strong> <strong>the</strong> Harvard Six Cities Study <strong>and</strong> <strong>the</strong> American Cancer SocietyStudy <strong>of</strong> Particulate <strong>Air</strong> <strong>Pollution</strong> <strong>and</strong> Mortality. A Special Report <strong>of</strong> <strong>the</strong>Institute’s Particle Epidemiology Reanalysis ProjectHEI Communications200013 Public <strong>Health</strong> <strong>and</strong> <strong>Air</strong> <strong>Pollution</strong> <strong>in</strong> <strong>Asia</strong> (PAPA): Key Results from Bangkok,Hong Kong, Shanghai, <strong>and</strong> Wuhan2008WebPublic <strong>Health</strong> <strong>and</strong> <strong>Air</strong> <strong>Pollution</strong> <strong>in</strong> <strong>Asia</strong>: Science Access on <strong>the</strong> Net (PAPA–SAN). Database available at www.heal<strong>the</strong>ffects.org/<strong>Asia</strong>/papasan-home.htm2008* Reports published s<strong>in</strong>ce 1998.Copies <strong>of</strong> <strong>the</strong>se reports can be obta<strong>in</strong>ed from <strong>the</strong> <strong>Health</strong> Effects Institute <strong>and</strong> many are available at www.heal<strong>the</strong>ffects.org.266
HEI BOARD, COMMITTEES, <strong>and</strong> STAFFBoard <strong>of</strong> DirectorsRichard F. Celeste, Chair President, Colorado CollegeSherwood Boehlert Of Counsel, Accord Group; Former Chair, U.S. House <strong>of</strong> Representatives Science CommitteeEnriqueta Bond President Emeritus, Burroughs Wellcome FundPurnell W. Chopp<strong>in</strong> President Emeritus, Howard Hughes Medical InstituteMichael T. Clegg Pr<strong>of</strong>essor <strong>of</strong> Biological Sciences, University <strong>of</strong> California–Irv<strong>in</strong>eJared L. Cohon President, Carnegie Mellon UniversityStephen Corman President, Corman EnterprisesGowher Rizvi Vice Provost <strong>of</strong> International Programs, University <strong>of</strong> Virg<strong>in</strong>iaL<strong>in</strong>da Rosenstock Dean, School <strong>of</strong> Public <strong>Health</strong>, University <strong>of</strong> California–Los AngelesHenry Schacht Manag<strong>in</strong>g Director, Warburg P<strong>in</strong>cus; Former Chairman <strong>and</strong> Chief Executive Officer,Lucent TechnologiesWarren M. Wash<strong>in</strong>gton Senior Scientist, National Center for Atmospheric Research; Former Chair,National Science BoardArchibald Cox, Found<strong>in</strong>g Chair 1980–2001Donald Kennedy, Vice Chair Emeritus Editor-<strong>in</strong>-Chief Emeritus, Science; President Emeritus <strong>and</strong>B<strong>in</strong>g Pr<strong>of</strong>essor <strong>of</strong> Biological Sciences, Stanford University<strong>Health</strong> Research CommitteeDavid L. Eaton, Chair Associate Vice Provost for Research <strong>and</strong> Director, Center for Ecogenetics <strong>and</strong> Environmental<strong>Health</strong>, School <strong>of</strong> Public <strong>Health</strong>, University <strong>of</strong> Wash<strong>in</strong>gton–SeattleJoe G.N. Garcia Vice Chancellor for Research <strong>and</strong> Pr<strong>of</strong>essor <strong>of</strong> Medic<strong>in</strong>e, University <strong>of</strong> Ill<strong>in</strong>ois–ChicagoUwe He<strong>in</strong>rich Pr<strong>of</strong>essor, Medical School Hannover, Executive Director, Fraunh<strong>of</strong>er Institute for Toxicology <strong>and</strong>Experimental Medic<strong>in</strong>e, Hannover, GermanyGrace LeMasters Pr<strong>of</strong>essor <strong>of</strong> Epidemiology <strong>and</strong> Environmental <strong>Health</strong>, University <strong>of</strong> C<strong>in</strong>c<strong>in</strong>natiCollege <strong>of</strong> Medic<strong>in</strong>eSylvia Richardson Pr<strong>of</strong>essor <strong>of</strong> Biostatistics, Department <strong>of</strong> Epidemiology <strong>and</strong> Public <strong>Health</strong>, Imperial CollegeSchool <strong>of</strong> Medic<strong>in</strong>e, London, United K<strong>in</strong>gdomRichard L. Smith Director, Statistical <strong>and</strong> Applied Ma<strong>the</strong>matical Sciences Institute, University <strong>of</strong> North Carol<strong>in</strong>a–Chapel HillJames A. Swenberg Kenan Dist<strong>in</strong>guished Pr<strong>of</strong>essor <strong>of</strong> Environmental Sciences, Department <strong>of</strong> EnvironmentalSciences <strong>and</strong> Eng<strong>in</strong>eer<strong>in</strong>g, University <strong>of</strong> North Carol<strong>in</strong>a–Chapel HillIra B. Tager Pr<strong>of</strong>essor <strong>of</strong> Epidemiology, School <strong>of</strong> Public <strong>Health</strong>, University <strong>of</strong> California–Berkeley267
HEI BOARD, COMMITTEES, <strong>and</strong> STAFFInternational Scientific Oversight CommitteeFrank Speizer, Chair Pr<strong>of</strong>essor <strong>of</strong> Environmental Science, Department <strong>of</strong> Environmental <strong>Health</strong>, Harvard MedicalSchoolH. Ross Anderson Pr<strong>of</strong>essor <strong>of</strong> Epidemiology <strong>and</strong> Public <strong>Health</strong>, Division <strong>of</strong> Community <strong>Health</strong> Sciences, St.George’s, University <strong>of</strong> London, <strong>and</strong> Medical Research Council–<strong>Health</strong> Protection Agency Centre for Environment<strong>and</strong> <strong>Health</strong>, London, United K<strong>in</strong>gdomMichael Brauer Director, School <strong>of</strong> Environmental <strong>Health</strong>, University <strong>of</strong> British Columbia, Vancouver, CanadaB<strong>in</strong>gheng Chen Pr<strong>of</strong>essor, School <strong>of</strong> Public <strong>Health</strong>, Fudan University, Shanghai, Ch<strong>in</strong>aKenneth L. Demerjian Director <strong>and</strong> Pr<strong>of</strong>essor, Atmospheric Sciences Research Center <strong>and</strong> Department <strong>of</strong> Earth<strong>and</strong> Atmospheric Science, University at Albany, State University <strong>of</strong> New YorkJim<strong>in</strong>g Hao Pr<strong>of</strong>essor <strong>of</strong> Environmental Science, Ts<strong>in</strong>ghua University; Dean, Institute <strong>of</strong> Environmental Science <strong>and</strong>Eng<strong>in</strong>eer<strong>in</strong>g, Beij<strong>in</strong>g, Ch<strong>in</strong>aAnthony J. Hedley Honorary Pr<strong>of</strong>essor, School <strong>of</strong> Public <strong>Health</strong>, University <strong>of</strong> Hong Kong, Hong Kong, Ch<strong>in</strong>aJitendra N. P<strong>and</strong>e Senior Consultant <strong>in</strong> Medic<strong>in</strong>e <strong>and</strong> Chest Diseases, Sitaram Bhartia Institute <strong>of</strong> Science <strong>and</strong>Research, New Delhi, IndiaC. Arden Pope III Mary Lou Fulton Pr<strong>of</strong>essor <strong>of</strong> Economics, Brigham Young UniversityKirk R. Smith Pr<strong>of</strong>essor <strong>of</strong> Global Environmental <strong>Health</strong> <strong>and</strong> Chair, Graduate Group <strong>in</strong> Environmental <strong>Health</strong>Studies, School <strong>of</strong> Public <strong>Health</strong>, University <strong>of</strong> California–BerkeleyMark J. Utell Pr<strong>of</strong>essor <strong>of</strong> Medic<strong>in</strong>e <strong>and</strong> Environmental Medic<strong>in</strong>e, University <strong>of</strong> Rochester Medical CenterPaul Wise Richard E. Behrman Pr<strong>of</strong>essor <strong>of</strong> Child <strong>Health</strong> <strong>and</strong> Society; Pr<strong>of</strong>essor <strong>of</strong> Pediatrics, Stanford UniversityMedical School<strong>Health</strong> Review CommitteeHomer A. Boushey, Chair Pr<strong>of</strong>essor <strong>of</strong> Medic<strong>in</strong>e, Department <strong>of</strong> Medic<strong>in</strong>e, University <strong>of</strong> California–San FranciscoBen Armstrong Reader <strong>in</strong> Epidemiological Statistics, Public <strong>and</strong> Environmental <strong>Health</strong> Research Unit,Department <strong>of</strong> Public <strong>Health</strong> <strong>and</strong> Policy, London School <strong>of</strong> Hygiene <strong>and</strong> Tropical Medic<strong>in</strong>e, United K<strong>in</strong>gdomMichael Brauer Pr<strong>of</strong>essor, School <strong>of</strong> Environmental <strong>Health</strong>, University <strong>of</strong> British Columbia, Vancouver, CanadaBert Brunekreef Pr<strong>of</strong>essor <strong>of</strong> Environmental Epidemiology, Institute <strong>of</strong> Risk Assessment Sciences,University <strong>of</strong> Utrecht, <strong>the</strong> Ne<strong>the</strong>rl<strong>and</strong>sMark W. Frampton Pr<strong>of</strong>essor <strong>of</strong> Medic<strong>in</strong>e <strong>and</strong> Environmental Medic<strong>in</strong>e, University <strong>of</strong> Rochester Medical CenterStephanie London Senior Investigator, Epidemiology Branch, National Institute <strong>of</strong> Environmental <strong>Health</strong> SciencesArmistead Russell Georgia Power Dist<strong>in</strong>guished Pr<strong>of</strong>essor <strong>of</strong> Environmental Eng<strong>in</strong>eer<strong>in</strong>g, School <strong>of</strong> Civil <strong>and</strong>Environmental Eng<strong>in</strong>eer<strong>in</strong>g, Georgia Institute <strong>of</strong> TechnologyLianne Sheppard Pr<strong>of</strong>essor <strong>of</strong> Biostatistics, School <strong>of</strong> Public <strong>Health</strong>, University <strong>of</strong> Wash<strong>in</strong>gton–Seattle268
HEI BOARD, COMMITTEES, <strong>and</strong> STAFFOfficers <strong>and</strong> StaffDaniel S. Greenbaum PresidentRobert M. O’Keefe Vice PresidentRashid Shaikh Director <strong>of</strong> ScienceBarbara Gale Director <strong>of</strong> PublicationsJacquel<strong>in</strong>e C. Rutledge Director <strong>of</strong> F<strong>in</strong>ance <strong>and</strong> Adm<strong>in</strong>istrationHelen I. Dooley Corporate SecretaryKate Adams Staff ScientistAaron J. Cohen Pr<strong>in</strong>cipal ScientistMaria G. Costant<strong>in</strong>i Pr<strong>in</strong>cipal ScientistPhilip J. DeMarco Compliance ManagerSuzanne Gabriel Editorial AssistantHope Green Editorial Assistant (part time)L. Virgi Hepner Senior Science EditorAnny Luu Adm<strong>in</strong>istrative AssistantFranc<strong>in</strong>e Marmenout Senior Executive AssistantSumi Mehta Senior ScientistNicholas Moustakas Policy AssociateHilary Selby Polk Senior Science EditorSarah Rakow Science Adm<strong>in</strong>istrative AssistantRobert A. Shavers Operations ManagerGe<strong>of</strong>frey H. Sunsh<strong>in</strong>e Senior ScientistMorgan Younk<strong>in</strong> Research AssistantAnnemoon M.M. van Erp Senior ScientistKa<strong>the</strong>r<strong>in</strong>e Walker Senior Scientist269
H E A L T HE F F E CTSINSTITUTE101 Federal Street, Suite 500Boston, MA 02110, USA+1-617-488-2300www.heal<strong>the</strong>ffects.orgS P E C I A LR e p o r T1 8November 2010