REGISTRATION DOCUMENT - Bourbon
REGISTRATION DOCUMENT - Bourbon
REGISTRATION DOCUMENT - Bourbon
- No tags were found...

You also want an ePaper? Increase the reach of your titles
YUMPU automatically turns print PDFs into web optimized ePapers that Google loves.
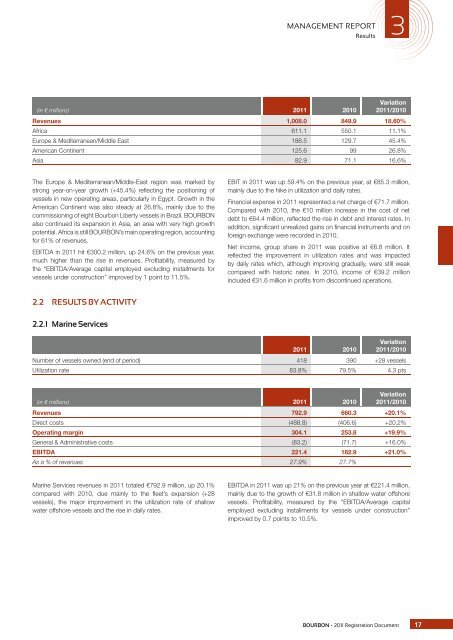
MANAGEMENT REPORT3Results(in € millions) 2011 2010Variation2011/2010Revenues 1,008.0 849.9 18.60%Africa 611.1 550.1 11.1%Europe & Mediterranean/Middle East 188.5 129.7 45.4%American Continent 125.6 99 26.8%Asia 82.9 71.1 16.6%The Europe & Mediterranean/Middle-East region was marked bystrong year-on-year growth (+45.4%) refl ecting the positioning ofvessels in new operating areas, particularly in Egypt. Growth in theAmerican Continent was also steady at 26.8%, mainly due to thecommissioning of eight <strong>Bourbon</strong> Liberty vessels in Brazil. BOURBONalso continued its expansion in Asia, an area with very high growthpotential. Africa is still BOURBON’s main operating region, accountingfor 61% of revenues.EBITDA in 2011 hit €300.2 million, up 24.6% on the previous year,much higher than the rise in revenues. Profi tability, measured bythe “EBITDA/Average capital employed excluding installments forvessels under construction” improved by 1 point to 11.5%.EBIT in 2011 was up 59.4% on the previous year, at €85.3 million,mainly due to the hike in utilization and daily rates.Financial expense in 2011 represented a net charge of €71.7 million.Compared with 2010, the €10 million increase in the cost of netdebt to €64.4 million, refl ected the rise in debt and interest rates. Inaddition, signifi cant unrealized gains on fi nancial instruments and onforeign exchange were recorded in 2010.Net income, group share in 2011 was positive at €6.8 million. Itrefl ected the improvement in utilization rates and was impactedby daily rates which, although improving gradually, were still weakcompared with historic rates. In 2010, income of €39.2 millionincluded €31.6 million in profi ts from discontinued operations.2.2 RESULTS BY ACTIVITY2.2.1 Marine Services2011 2010Variation2011/2010Number of vessels owned (end of period) 418 390 +28 vesselsUtilization rate 83.8% 79.5% 4.3 pts(in € millions) 2011 2010Variation2011/2010Revenues 792.9 660.3 +20.1%Direct costs (488.8) (406.6) +20.2%Operating margin 304.1 253.8 +19.9%General & Administrative costs (83.2) (71.7) +16.0%EBITDA 221.4 182.9 +21.0%As a % of revenues 27.9% 27.7%Marine Services revenues in 2011 totaled €792.9 million, up 20.1%compared with 2010, due mainly to the fl eet’s expansion (+28vessels), the major improvement in the utilization rate of shallowwater offshore vessels and the rise in daily rates.EBITDA in 2011 was up 21% on the previous year at €221.4 million,mainly due to the growth of €31.8 million in shallow water offshorevessels. Profi tability, measured by the “EBITDA/Average capitalemployed excluding installments for vessels under construction”improved by 0.7 points to 10.5%.BOURBON - 2011 Registration Document 17