umkhanyakude district municipality water services development plan
umkhanyakude district municipality water services development plan
umkhanyakude district municipality water services development plan

You also want an ePaper? Increase the reach of your titles
YUMPU automatically turns print PDFs into web optimized ePapers that Google loves.
INTEGRATEDENGINEERINGSOLUTIONSLIST OF APPENDIXESTABLEAPPENDIX ASurface Water CalculationDESCRIPTIONAPPENDIX BAPPENDIX CAPPENDIX DDetailed ranking list of areas to receive <strong>water</strong> after the 5-year <strong>plan</strong>Detailed ranking list of areas to receive sanitation after the 5-year <strong>plan</strong>Estimated annual expenditure graphsUMKHANYAKUDE DISTRICT MUNICIPALITYWATER SERVICES DEVELOPMENT PLAN Created on 2002-08-23 09:40Page iv
INTEGRATEDENGINEERINGSOLUTIONSFigure DA4Figure DA5Figure DA6Figure DA7Figure DA8Jozini Estimated annual expenditure – <strong>water</strong>Big 5 False Bay Estimated annual expenditure – <strong>water</strong>Habisa Estimated annual expenditure – <strong>water</strong>Mtubatuba Estimated annual expenditure – <strong>water</strong>St Lucia Park Estimated annual expenditure - <strong>water</strong>UMKHANYAKUDE DISTRICT MUNICIPALITYWATER SERVICES DEVELOPMENT PLAN Created on 2002-08-23 09:40Page vii
INTEGRATEDENGINEERINGSOLUTIONS1 DRAFTING TEAM AND PROCESS1.1 Name and Address of WSAPostal addressuMkhanyakude District MunicipalityP O Box 449Mkhuze3695Physical addressuMkhanyakude District MunicipalityStand 53Klebe StreetMkhuze3695UMKHANYAKUDE DISTRICT MUNICIPALITYWATER SERVICES DEVELOPMENT PLAN Created on 2002-08-23 09:40Page 1
INTEGRATEDENGINEERINGSOLUTIONS1.5 Consultation ProcessHas the <strong>plan</strong> been brought to the attention of: TICK IF YESConsumers Yes √Potential ConsumersIndustrial UsersYesYesWater service institutions Yes √Has public comment been invited on the <strong>plan</strong>? Yes √Have copies of the draft been sent to the Minister,the province and neighboring WSAs?Yes√UMKHANYAKUDE DISTRICT MUNICIPALITYWATER SERVICES DEVELOPMENT PLAN Created on 2002-08-23 09:40Page 5
INTEGRATEDENGINEERINGSOLUTIONS1.6 Links With The IDPHas the IDP process started yet? Yes √Is the WSDP addressing the <strong>water</strong> <strong>services</strong> aspectsof the IDP?Yes√*Note*NOTE: The IDP was finalised while the WSDP was still under preparation. It’srecommended that the two processes be fully aligned. The <strong>water</strong> Sector Plan, whichshould form an integrated part of the IDP, has been prepared as part of this WSDPsince March 2002.UMKHANYAKUDE DISTRICT MUNICIPALITYWATER SERVICES DEVELOPMENT PLAN Created on 2002-08-23 09:40Page 6
INTEGRATED2 LEGAL FRAMEWORK AND CONTENT OF THIS WATER SERVICES DEVELOPMENTPLAN2.1 Legal FrameworkThe Development Facilitation Act (Act No. 67 of 1995) states that an Integrated DevelopmentPlan (IDP) must be prepared to ensure proper co-ordination and integration of <strong>development</strong>.This <strong>plan</strong> must make maximum use of existing resources and avoid duplication of funding forinfrastructure <strong>development</strong> and <strong>services</strong> across disciplines.ENGINEERINGSOLUTIONSA Water Services Development Plan (WSDP) proposes the projects and actions necessary toachieve efficient and sustainable provision of <strong>water</strong> and sanitation <strong>services</strong> for the citizens ofa region or municipal areas within a region. WSDP’s are <strong>plan</strong>ning approaches that translate the<strong>water</strong> and sanitation Land Development Objectives (LDO) and IDP proposals into integrated<strong>water</strong> and sanitation <strong>plan</strong>s at a detailed sectoral level.There has been a restructuring of institutional arrangements for <strong>plan</strong>ning, implementation,operational and maintenance of <strong>water</strong> and sanitation <strong>services</strong> in the Republic of South Africa.This has resulted in the creation of Water Services Authorities (WSA’s), Water ServicesProviders (WSP’s) and several other institutional bodies considered necessary to achievecoordinated <strong>water</strong> <strong>services</strong> delivery. The uMkhanyakude District Municipality (uMkhanyakude)is a WSA and is, in terms of the Water Act (Act No 36 of 1998), responsible for the provisionof <strong>water</strong> and sanitation <strong>services</strong> in the area under its jurisdiction.The Water Act states, inter alia, that:“Every WSA has a duty to all customers or potential customers in it’s area of jurisdiction toprogressively ensure efficient, affordable, economic and sustainable access to Water Services.”and, “Every WSA must prepare a draft Water Service Development Plan for its area ofjurisdiction. 1 ”The South African Department of Water Affairs and Forestry (DWAF) has issued guidelineson how WSDP’s are to be prepared in the form of a booklet entitled “Water ServicesDevelopment Plan, Guidelines For Water Services Authorities, July 2001.” These Guidelinesare specifically aimed at WSA’s that have no prior experience in preparing WSDP’s and, as thiswill be the first WSDP that uMkhanyakude is preparing, most of the aspects detailed in theguidelines will be dealt with in this WSDP. The applicable <strong>plan</strong>ning period for this starterWSDP is 5 years.The guidelines provide a mechanism for ensuring a holistic approach to <strong>water</strong> sector <strong>plan</strong>ningat the municipal level, based on building a knowledge base and using this base to make strategic1 The Water Services Act (Act 108 of 1997)UMKHANYAKUDE DISTRICT MUNICIPALITYWATER SERVICES DEVELOPMENT PLAN Page 7
INTEGRATEDurbanisation (such as in the KwaMasaane area) and increased commercial agriculturalproduction.ENGINEERINGSOLUTIONS• The Lebombo Mountains: These form both an important visual backdrop, especiallyfrom when viewed from the south and west, to the area. They also provide scenicdrives and vantage points from which much of the area can be viewed. Visualmanagement within this area is of particular importance.• The Coastal Floodplain: This is an area where changes in land use that create highvertical forms (<strong>plan</strong>tations, masts, and tall buildings for example) have particularlysignificant impact. The open, level nature of the plain and the vistas it provides, forexample in crossing the Muzi Swamp, are unique visual experiences within the region.Due to the level nature of the surrounding land, the large <strong>water</strong> bodies of the areaare not visibly prominent from the surrounding landscape. They are however valuablevisual resources in their own right, while the management of their edges isparticularly important.UMKHANYAKUDE DISTRICT MUNICIPALITYWATER SERVICES DEVELOPMENT PLAN Page 11
INTEGRATEDprincipally related to poor <strong>water</strong> supply, poor hygiene, inadequate sanitation, and the pollutionof <strong>water</strong> bodies with faecal pollution.ENGINEERINGSOLUTIONSThe three most important elements required to contain the spread and prevent re-occurrenceare:vAccess to potable <strong>water</strong>;vSanitation andvHealth and hygiene education.Since the provision of <strong>water</strong> and sanitation <strong>services</strong> are the function of the WSA, the finalresponsibility lies with uMkhanyakude.b) Aids: Aids, which has a very high incidence of infection within the area is not anenvironmental based disease in the strict sense. However, poverty and its associated poornutrition and health levels lower resistance and to other diseases within the local environment,such as tuberculosis and malaria, both of which are very significant diseases.c) Malaria: Malaria is endemic to the area and is a significant disease affecting parts of thelocal population. It is also a significant deterrent to potential tourists. It is estimated thatthere is a 44% reduction in tourism visits to the malaria-infected areas. 2Income distribution. However, the roll-back-Malaria Campaign, involving the provincial andnational health departments of South Africa, Mozambique and Swaziland appears to be bearingfruit, with a distinct drop in malaria cases with the District being recorded from previousyears.The current monthly income distribution for the total population in uMkhanyakude is shown inTable 3.2.3(a) below. The figures reflect the proportion of income levels per settlement typeper local <strong>municipality</strong> for the economically active sector of the community, that is personsbetween the ages of 15 and 65.UMkhanyakude has a very high unemployment rate of 88%. From the table is can be deducedthat 96% of households in uMkhanyakude earn less than R500/month and only approximately2,5% earn in excess of R1 000/month. The poverty level in uMkhanyakude is therefore in theorder of 97%. People living in the bigger size settlements do not necessarily have a higheremployment rate than those living in the smaller settlements.2 Pers. Comm. Dr Raj Maharaj: Malaria research programme: South Africa medical research councilUMKHANYAKUDE DISTRICT MUNICIPALITYWATER SERVICES DEVELOPMENT PLAN Page 14
INTEGRATEDENGINEERINGSOLUTIONSTable 3.2.3(a) – Income distribution for the economically active sectorIncome per household perMonth (Rand)Percentage Distribution per Community Size5000 TotalNone 88.07% 87.14% 86.99% 80.18% 87.84%0-500 8.15% 8.64% 8.36% 11.72% 7.19%501-1000 1.59% 1.89% 1.72% 3.59% 1.64%1001-1500 1.21% 1.27% 1.32% 1.64% 2.28%1501-3500 0.99% 1.05% 1.47% 2.53% 1.05%3501+ 0.00% 0.01% 0.13% 0.33% 0.00%TOTAL 100.00% 100.00% 100.00% 100.00% 100.00%(Source – Census 1996)Table 3.2.3(b) below shows the monthly income (percentage) distribution per local<strong>municipality</strong>.Table 3.2.3(b) – Income distribution for the economically active sector per Local MunicipalityPercentage Distribution per Local MunicipalityIncome perMonthUmhlabuyalinganaJoziniThe Big Five FalseBayHlabisaMtubatuba St Lucia ParkNone 87.80% 89.15% 86.38% 87.37% 69.77% 83.82%0-500 8.19% 7.05% 10.47% 9.16% 12.53% 10.02%501-1000 1.63% 1.70% 1.46% 1.47% 4.60% 86.90%1101-1500 1.32% 1.34% 0.70% 1.00% 2.87% 1.21%1501-3500 1.05% 0.77% 0.99% 1.00% 6.33% 3.40%3501+ 0.00% 0.00% 0.00% 0.00% 3.90% 0.19%100.00% 100.00% 100.00% 100.00% 100.00% 100.00%(Source – Census 1996)The table shows a low-income distribution pattern that varies between the local municipalities.Mtubatuba has the highest household income approximately 98% of the population inuMkhanyakude earn under R1 000 and less than 2% earn more than R3 500 per month.The District income distribution shown above also gives an indication of the ability of people topay for <strong>services</strong>. Households can generally afford to spend 10% of their household income on<strong>services</strong>. For example, a household with an income of R500 per month can afford to pay R50for all <strong>services</strong>, which means they can only afford to pay R5 per month for <strong>water</strong>. The abilityto pay for <strong>services</strong> affects the type of service that can be provided to communities (Refer toTable 3.2.4 in Section 3.2.7 below). This is based on the end user pays principle. However,cognisance should be made of the fact that the Government has made promises of free basic<strong>services</strong> to all citizens. Thus no person or community can therefore be discriminated againstdue to his or her economic situation. The ability of people to pay for <strong>services</strong> is unlikely toUMKHANYAKUDE DISTRICT MUNICIPALITYWATER SERVICES DEVELOPMENT PLAN Page 15
INTEGRATEDchange in the period in which this WSDP will be implemented. This indicates that, only basiclevels of service should be offered.ENGINEERINGSOLUTIONSThe Free Basic Water topic is covered in more detail in Chapter 6.3.2.3 Economic ActivityUMkhanyakude has a relatively small economy which contributes only 0,6% to the economy ofthe province while the population of the <strong>district</strong> is 4% of the provincial population. Theeconomic activities of the <strong>district</strong> are concentrated in two main economic sectors namely theagriculture and tourism (trade) sectors. These two sectors together contribute 55% to thetotal economy of the <strong>district</strong>. Agriculture is responsible for 32% and trade contributes afurther 23%. The structure of the economy of the <strong>district</strong> differs considerably from that ofthe rest of the province. The average contribution of the provincial agriculture sector to theeconomy of the province is in the order of 5%. The 32% contribution of the agriculture sectorin the <strong>district</strong> is therefore about 6 times greater than in the case of the province. Likewise,the average contribution of the trade sector to the economy of the province is in the order of15%. The 23% contribution of the trade sector in the <strong>district</strong> is significantly higher than thatof the provincial average. Tourism constitutes a larger part of the trade sector in the <strong>district</strong>than what it does in the province. The most northern part of the <strong>district</strong> is almost withoutexception an area in which traditional agricultural methods are practised. Traditionalagriculture is mostly based on livestock and small-scale sugarcane and cotton farming. In thesouthern areas, agricultural activities are more commercial which includes sugarcane, forestry,livestock, game and to a lesser extent, citrus and vegetable farming. The agricultural potentialof the <strong>district</strong> is high but is limited by, amongst other, its ability to compete effectively withother parts of the country due to its relative isolation and high cost of maintaining sustainablemarketing channels. 3The Lebombo Spatial Development Initiative (LSID) and the declaration of the St Lucia WorldHeritage Site are bound to make a positive impact on the <strong>development</strong> of uMkhanyakude. Itshould be realised that the <strong>development</strong> in uMkhanyakude is starting from a very small baseand the poverty and unemployment levels in the <strong>district</strong> are very high. 4The informal sector cannot be ignored, as it is one of the few sectors experiencing growth andby which many of the poor survive. 43 uMkhanyakude District Municipality Integrated Development Plan, March 20024 Umkhanyakude District Municipality – Integrated Development Plan, March 2002UMKHANYAKUDE DISTRICT MUNICIPALITYWATER SERVICES DEVELOPMENT PLAN Page 16
INTEGRATED3.2.4 Employment levels and economic growth ratesENGINEERINGSOLUTIONSThe unemployment level of 88% shown in Table 3.2.3 is extrapolated from the 1996 censusdata. It must be noted that a large proportion of the population are young females, whom arenot seeking employment, as they are caring for the family and home. This high percentage offemales is evidence of a weak economy, as the males have had to relocate to seek employment.Although limited employment opportunities exist in the region, the agriculture and the trade<strong>services</strong> offer the most employment opportunities and these need to be exploited.The fairly low rate of economic growth in the country in general, and in uMkhanyakude is notenvisaged to increase significantly over the next few years. This low economic growth rate isnot going to alleviate problems of high unemployment and low income in uMkhanyakude duringthe period of which this WSDP reports. The unemployment levels in the uMkhanyakude will bereduced when the economic growth rate continuously exceeds the population growth rate.The annual inflation rate is more of a national indicator and can be said to apply acrosssettlement types. The expected national inflation rate for the duration of this WSDP is 6.0%per annum. Inflation governs the purchasing power of consumers. High inflation rates reducethe spending power of consumers. This reduced spending power could affect consumers’ability to pay for <strong>water</strong> <strong>services</strong> rendered to them.3.2.5 Population growth ratesThe factors that affect the population growth rate in uMkhanyakude are related to:• Immigration due to displaced farm labour, land restitution and declining job opportunitiesin the mining industries in neighbouring provinces.• Emigration to larger urban centres in search of job opportunities.• The HIV/AIDS epidemic. This epidemic is predicted to seriously affect the economicallyactive 18-45 year age group, thus depleting uMkhanyakude of potential human resourcecapital.Specific numbers of people contributing to these factors cannot be established; thereforethese factors are merely taken into consideration in predicting an annual population growthrate of 0%.The population and economic growth rates are used to determine the future needs ofresidents. It also gives an indication of the anticipated growth of the specific settlementtypes so as to project the trend in household growth in settlements in uMkhanyakude.UMKHANYAKUDE DISTRICT MUNICIPALITYWATER SERVICES DEVELOPMENT PLAN Page 17
INTEGRATEDAlthough the region has considerable potential, much has been said about theunder<strong>development</strong> of the region and it is primarily associated with the lack of or limitedinfrastructure available. Roads, electricity, communication networks and <strong>water</strong>, which areessential for successful <strong>development</strong> are severely lacking in this region. There is also theimpact of HIV/AIDS, which as discussed earlier, is having as increased negative effect oncommunities and businesses. Other general constraints that are affecting the economy ingeneral are:ENGINEERINGSOLUTIONS• High unemployment• Illiteracy and poverty• Limited diversity in the economy• Unequal ownership of resources• Small revenue base• Limited internal investment in <strong>district</strong>• Limited or non-existent marketing of <strong>district</strong>• Outward migration of the economically active• Crime and violence• Limited access to economic information, such as the tender process, for rural and periruralcommunitiesUMKHANYAKUDE DISTRICT MUNICIPALITYWATER SERVICES DEVELOPMENT PLAN Page 18
INTEGRATEDENGINEERINGSOLUTIONS3.2.6 Consumers ability to pay for <strong>services</strong>The affordability of consumers to pay for <strong>water</strong> <strong>services</strong> provided to them has been obtainedfrom the IDP as well as the income levels of the various categories of communities describedin Section 3.2.3.The Department of Constitutional Development (DCD) has developed a model for theaffordability of <strong>services</strong> per household (HH) per month (p.m.). This is shown inTable 3.2.4. An assumption was made that households could not afford to pay more than 10%of their household income on <strong>services</strong>. This is not based on research but adapted fromresearch undertaken in other countries in Africa, where it was established that householdswould not pay more than 5% extra for improved <strong>water</strong> supply. The following table serves justas a guideline.UMKHANYAKUDE DISTRICT MUNICIPALITYWATER SERVICES DEVELOPMENT PLAN Page 19
INTEGRATEDTable 3.2.4 - Recurrent costs for different service levels for urban and rural consumersENGINEERINGSOLUTIONSURBANLevels of serviceIntermediate Intermediate HighService Contents R perContentsR per HHContentsR per HHHH p.m.p.m.p.m.Water Yard tank R12 Metered yard tap R20 House connection R45Sanitation VIP R1 Simple <strong>water</strong>borne R10 Full <strong>water</strong>borne R25Other:R37R55R205Electricity 20 Amp supply 20 Amp supply 60 Amp supplyRoads 80% graded Gravel PavedStorm<strong>water</strong> Open Lined open PipedundergroundSolid wasteKerb side removalKerb side removalKerb side removalOther, including rates R0 R50 R135Total <strong>services</strong> R50 R135 R415HH income R500 R1350 R4150RURALLevel of serviceBasic Intermediate HighService Contents R perContentsR per HHContentsR per HHHH p.m.p.m.p.m.WaterCommunalstandpipeR5 Yard tank R15 House connection R45Sanitation VIP R0 VIP R1 Full <strong>water</strong>borne R25Other:R22R55R205Electricity 8 Amp supply 20 Amp supply 60 Amp supplyRoadsGraded/gravel towithin 500m ofhome80% graded PavedStorm<strong>water</strong>Along distributorLined openPipedroadundergroundSolid waste On site orcommunal dumpCommunal removalKerbside removalOther, including rates R0 R0 R0Total <strong>services</strong> R27 R38 R205Min. average HHR270 R380 R2050income(Source – DCD, Municipal Infrastructure Investment Framework)UMKHANYAKUDE DISTRICT MUNICIPALITYWATER SERVICES DEVELOPMENT PLAN Page 20
INTEGRATEDENGINEERINGSOLUTIONS4 SERVICE LEVEL PROFILE4.1 Service Levels4.1.1 Service level coverageThere are various <strong>water</strong> <strong>services</strong> users such as agriculture, business, domestic, industry andtourism. This WSDP specifically focuses on the domestic <strong>water</strong> user and the other users willbe incorporated in future <strong>plan</strong>s due to the large backlog in service delivery.The current situation has different service levels of coverage depending on the size of asettlement, that is whether the settlement falls in a group with less than 500 people, 500 – 1000 people, 1 000 – 5 000 people, 5 000 –10 000 people or more than 10 000 people persettlement. Within uMkhanyakude there are no settlements with more than 10 000 people.The existing situation also has the majority of the bigger size settlements (5 000 – 10 000people) having some level of service for both <strong>water</strong> and sanitation <strong>services</strong>. In contrast tothese bigger size settlements the majority of the smaller size villages either have no <strong>water</strong> orsanitation <strong>services</strong> provided to them, or these <strong>services</strong> do not meet the accepted minimumlevels of service provision as prescribed by Reconstruction and Development Program (RDP) of:Water‣ A minimum availability of 25l/capita/day‣ A minimum flow rate of 10l/minute‣ A maximum walking distance of 200m to the nearest tap‣ Water must meet SABS 0284 quality standards in terms of chemical content,microbial content, taste, color and appearance.‣ A guaranteed assurance of <strong>water</strong> of more than 98% of the year.Sanitation‣ Individual households to have access to a Ventilated Improved Pit (VIP) latrine as theminimum standard in human sanitation requirements.‣ A maximum walking distance of 50m from the homestead to the closest sanitationfacility.This section of the WSDP quantifies service levels within the various local municipalities. Thebenchmark set is that of RDP level of service. This is done with the aim of setting clearobjectives to ensure that all citizens have access to basic levels of service. Consideration willalso be made of the vision of the uMkhanyakude District Municipality of:UMKHANYAKUDE DISTRICT MUNICIPALITYWATER SERVICES DEVELOPMENT PLAN Page 21
INTEGRATED“The <strong>district</strong> <strong>municipality</strong> of uMkhanyakude through effective management and goodgovernance will meet the basic needs and improve the quality of life of all the residents bypromoting and protecting the regions international status for its unique natural assets andcultural heritage. 5 ”ENGINEERINGSOLUTIONSThus any WSDP adopted now will have far reaching implications on all <strong>plan</strong>ning in the future. Alimited percentage of people have adequate <strong>services</strong>. 314 470 (64%) of the494 131 people are in need of <strong>water</strong>. The current situation (2002) with regards to <strong>water</strong> andsanitation levels of hardship (LOH) is shown in Figures D and E. Table 4.1.1(a) indicatesthat <strong>water</strong> level of hardship is high in all the local municipalities in the settlement group withless than 500 people. The sanitation level of hardship within all the settlement groups isextremely high and continued related health problems are envisaged for the future if the highbacklog of sanitation is not met. Level of hardship is defined as either <strong>water</strong> or sanitation<strong>services</strong> not meeting any of the basic criteria of the RDP standards with regards to thesebasic <strong>services</strong>.Both the <strong>water</strong> and sanitation level of hardship are inherently classified as numbers of thepopulation. For this WSDP population numbers are used instead of household numbers. This isto conform to the information provided by sources of data, namely Census 1996. This alsodecreases the incidence of giving erroneous data by applying household numbers, which are inthemselves approximations.5 uMkhanyakude District Municipality – Integrated Development Plan, March 2002UMKHANYAKUDE DISTRICT MUNICIPALITYWATER SERVICES DEVELOPMENT PLAN Page 22
INTEGRATEDTable 4.1.1(a) – Current <strong>water</strong> <strong>services</strong> levels in each LMENGINEERINGSOLUTIONSSettlement SizesWater Services Levels Below RDP Standards (No.of People) per Local Municipality
INTEGRATEDThe above information is summarized in Table 4.1.1(b) below, which also shows the number ofcommunities in a particular local <strong>municipality</strong> and the proportion of the population with a <strong>water</strong>and sanitation LOH.ENGINEERINGSOLUTIONSUMKHANYAKUDE DISTRICT MUNICIPALITYWATER SERVICES DEVELOPMENT PLAN Page 24
INTEGRATEDTable 4.1.1(b) – Current <strong>water</strong> and sanitation levels of hardship in uMkhanyakudeENGINEERINGSOLUTIONSLocal MunicipalityNo ofCommunitiesTotalPopulationPopulation witha <strong>water</strong> LOH% Of Populationwith a <strong>water</strong> LOHPopulation with asanitation LOH% Of Populationwith a sanitationLOHUmhlabuyalingana 444 135780 68548 50% 135069 99%Jozini 529 138136 94701 69% 135860 98%The Big Five False Bay 43 21458 17247 80% 21458 100%Hlabisa 447 165807 107233 65% 155889 94%Mtubatuba 14 21582 17410 81% 14951 69%St Lucia Park 74 11368 9331 82% 11368 100%TOTAL 1551 494131 314470 64% 474595 96%(Source – Department of Water Affairs and Forestry, improved by uMkhanyakude District Municipality)From the above tables it is evident that both the <strong>water</strong> and situation levels of hardship variesacross the different local municipalities. High <strong>water</strong> level of hardship is reported for most ofthe local municipalities with The Big Five False Bay, Mtubatuba and St Lucia Park with thehighest need. 314 470 People (64%) are in need of <strong>water</strong> and 474 595 people (96%) are inneed of sanitation.4.1.2 Consumer <strong>water</strong> supplyThe current service coverage is reported in detail under <strong>water</strong> <strong>services</strong> infrastructure inSection 4.4.UMKHANYAKUDE DISTRICT MUNICIPALITYWATER SERVICES DEVELOPMENT PLAN Page 25
INTEGRATEDENGINEERINGSOLUTIONS4.2 Water BalanceThe purpose of <strong>water</strong> balance is to provide an overview of the relationship between future<strong>water</strong> requirements and <strong>water</strong> availability. To this end the annual <strong>water</strong> demand andwaste<strong>water</strong> flows are considered.The <strong>water</strong> balance is an important step in the process of understanding the currentfunctioning of a <strong>water</strong> supply system. Due to the complexity of the situation faced by most<strong>district</strong> municipalities, it is often not feasible for a full <strong>water</strong> balance to be carried out fortheir areas of responsibility.The current situation in uMkhanyakude is that 32% of the population make use of ground<strong>water</strong>as their primary <strong>water</strong> source while the remaining 68% of the population make use of surface<strong>water</strong>.The total <strong>water</strong> demand and waste<strong>water</strong> flows need to be viewed against what the surface andground<strong>water</strong> resources can sustain to supply and what the likely environmental impacts couldbe.Water quality levels are acceptable but further investigation is required which should beincluded in future reports.4.2.1 Ground<strong>water</strong> source and qualityA study on the ground<strong>water</strong> potential in the South Africa was undertaken by the CSIR in 1995.According to this study, ground<strong>water</strong> potential in South Africa is divided into threecategories, which are as follows:• Major ground<strong>water</strong> systems capable of supplying communities of up to 4890 people from asingle borehole at 30l/c/day. Average borehole yields of 4.26 l/s can be expected providedsound borehole <strong>development</strong> methods are employed.• Minor ground<strong>water</strong> systems capable of supplying communities of up to 1510 people from asingle borehole at 30 l/c/day. Average borehole yields of 1.58 l/s can be expected providedsound borehole <strong>development</strong> methods are employed.• Poor ground<strong>water</strong> systems capable of supplying communities of up to 1200 people from asingle borehole at 30 l/c/day. Average borehole yields of 1.25 l/s can be expected providedsound borehole <strong>development</strong> methods are employed.The eastern area of uMkhanyakude falls within the “Major Ground<strong>water</strong> System” category andthe western area in the “Minor Ground<strong>water</strong> Systems” category and as such the capacity ofthe ground<strong>water</strong> resources is very good to adequate. The entire uMkhanyakude is dotted withUMKHANYAKUDE DISTRICT MUNICIPALITYWATER SERVICES DEVELOPMENT PLAN Page 26
INTEGRATEDboreholes fitted with hand pumps, which have been installed as a means of rudimentary <strong>water</strong>supply. See Figure F. Although there are more boreholes in the minor ground systems, thedrilling conditions affect the successful establishment of a borehole.ENGINEERINGSOLUTIONSAs seen in Figure F, the major ground<strong>water</strong> system falls on a loose, unstable formation, whichmakes the drilling of a successful borehole highly unlikely. Drilling in loose sediments requireshighly specialised drilling equipment. The minor ground<strong>water</strong> system is covered by firm,potentially broken and moderately to hard, but generally stable formation which provide forbetter drilling conditions.4.2.2 Surface Water Source and QualityThe uMkhanyakude area has a primary surface catchments, namely the Usutu-Mhlathuzecatchment, which covers the entire uMkhanyakude area. The major dams within thiscatchment area are the Pongolapoort Dam (storage capacity of 490 million cubic metres), andHluhluwe dam (storage capacity of 29 million cubic metres) 7 . The major rivers that feed theUsutu-Mhlathuze catchment are the Usutu, Pongola, Mhlatuze, Mfolozi and Mkuze rivers. ThePongola is the only reliable perennial river due to the storage capacity of the PongolopoortDam.The surface <strong>water</strong> potential of uMkhanyakude has been calculated for each of the 25individual quaternaries within uMkhanyakude boundaries. (See Appendix A for surface <strong>water</strong>calculation). Figure G shows that surface <strong>water</strong> potential is favourable within uMkhanyakudeand Figure H indicates the total <strong>water</strong> availability per quaternary.The calculation takes into account the current surface <strong>water</strong> usage, current effluent return<strong>water</strong> and total future demand, assuming all people currently not receiving <strong>water</strong> at RDPstandards will be supplied via surface rather than borehole <strong>water</strong>. While this will never be thecase, as some of the population makes use of borehole <strong>water</strong>, the error will be on theconservative side and will allow for some factor of safety.The potential surface <strong>water</strong> availability has been calculated using quaternary and mean annualrun off data from WRC 90 7 . The mean annual run off has been adjusted to allow for 30%retention for the ecological reserve and an average volume of 780 m 3 /anum/km 2 .The results of the surface <strong>water</strong> availability investigation shows that there is more thansufficient surface <strong>water</strong> available in uMkhanyakude provided it is effectively harnessed and8 Surface Water Resources of South Africa 1990, WRC Report No 298/6.2/94, First Edition 1994. DC Midgley,WV Pitman and BJ Middleton7 Draft WSDP, Phase 1 Status Quo Assessment, uMkhanyakude DM, VGC Consulting Engineers, July 2001.UMKHANYAKUDE DISTRICT MUNICIPALITYWATER SERVICES DEVELOPMENT PLAN Page 27
INTEGRATEDstored. The total future surface <strong>water</strong> demand for uMkhanyakude is 7 169 Ml/year (Based onthe entire population receiving <strong>water</strong> at a minimum of 25 l/cap/day) while the total availablesurface <strong>water</strong> is 436 815 Ml/year (Refer to the <strong>water</strong> balance calculation in Appendix A). Thismeans that a massive 429 662 Ml/year, or 98% of surface <strong>water</strong> will be uncommitted evenafter the entire population of uMkhanyakude is receiving <strong>water</strong> to RDP standards.ENGINEERINGSOLUTIONSuMkhanyakude has, as the <strong>water</strong> balance attests, a luxurious availability of surface <strong>water</strong>.Access to surface <strong>water</strong> within uMkhanyakude is therefore not the only factor to beconsidered when investigating <strong>water</strong> delivery, but of rather more importance is the harnessingand storage of surface <strong>water</strong>.4.2.3 Water AbstractionA requirement of a WSDP is that information must be kept for all the larger <strong>water</strong> supplyschemes. As far as the Water Balance is concerned, the key indicator in these schemes is theamount of <strong>water</strong> abstracted from the resource for the year. Refer to Table 4.2.1 below forthe details of the larger schemes abstracting <strong>water</strong> from within the boundaries ofuMkhanyakude.As a means of ascertaining the theoretical capacity of <strong>water</strong> schemes in supplying basic <strong>water</strong>requirements, the current abstraction of <strong>water</strong> is translated into supply per capita per day inTable 4.2.1 as well. This is purely theoretical in that it assumes all <strong>water</strong> abstracted isequally supplied to all persons currently and potentially served by an individual scheme, and itignores all other <strong>water</strong> uses and wastage. It is useful to have this information, albeit on apurely theoretical basis, to establish potential shortfalls in <strong>water</strong> supply of existing schemesthat could hamper the delivery of basic <strong>water</strong> <strong>services</strong>.UMKHANYAKUDE DISTRICT MUNICIPALITYWATER SERVICES DEVELOPMENT PLAN Page 28
INTEGRATEDENGINEERINGSOLUTIONSTable 4.2.1 – Amount of <strong>water</strong> abstracted by larger schemes in Ml/yearLocal Municipality Scheme CodeScheme NameSchemeSourceSchemeCapacity(ml/year)VolAbstracted(ml/year)Water SourceNo OfCommPopulationServedwithinSchemePopulationwith <strong>water</strong>LOH% OfPopulationwith <strong>water</strong>LOHUmhlabuyalingana:KN001 Surface Water 29 9107 5917 65%KN055 Surface Water 10 1020 664 65%KN070 Surface Water 1 6734 0 0%KN114 Surface Water 50 18210 11839 65%KN117 Ground Water 8 2770 1799 65%scheme1104 Mseleni Surface Water 210 Lake Sibayi 29 8922 0 0%scheme1144 Manzangwenya 15 2579 2078 81%scheme1148 Mozi 2 91 91 100%scheme116 Jozini-Ntshongwe-Malobeni Surface Water Jozini Dam 14 3376 0 0%scheme1161 Endloldweni (1 & 2) 15 4488 3268 73%scheme1256 Mhlabuyalingana Surface Water 9 Pongola River 1 2166 0 0%scheme1273 Thokuzi Ground Water Boreholes 11 1532 512 33%scheme1335 Hlalugadile 1 8439 3038 36%scheme1338 Imfihlweni 1 720 619 86%scheme1339 Isiboweni 1 476 476 100%scheme1340 Qondweni 6 2551 1658 65%scheme1341 Kwamlamula 4 1416 921 65%scheme1342 Ngujini 1 930 484 52%scheme1343 Mpakhethini 13 1226 799 65%scheme1344 Kwasonto 23 5967 3311 55%scheme1346 Manzibomya 5 1702 1106 65%scheme141 Mbazwane Surface Water 363 Lake Sibayi 1 5309 3451 65%SUB-TOTAL 241 89731 42031 47%Jozini:KN001 Surface Water 101 25659 16676 65%scheme108 Makhathini 1/4 3 2276 2276 100%scheme109 Makhathini 2/4 5 853 853 100%scheme110 Makhathini 3/4 2 970 970 100%scheme111 Makhathini 4/4 1 1611 1418 88%scheme1136 Ubombo Reserve 1 1 860 765 89%scheme114 Ingwavuma Township Surface Water 18 Shemula Scheme 1 161 0 0%scheme1143 Manyiseni Ground Water 30 Borehole 1 1659 0 0%scheme1145 Kwadinabanye 4 310 247 80%scheme1146 Bambanana 3 1891 1229 65%scheme1147 Mhlambangwenya 1 + 2 2 884 477 54%scheme116 Jozini-Ntshongwe-Malobeni Surface Water Jozini Dam 17 4496 0 0%scheme1163 Kwaqondile:Ubombo 1 148 33 22%scheme1164 Malobeni (Phase 1) 2 529 330 62%scheme1180 Ekuhlehleni Ground Water 25 Boreholes 1 1162 662 57%scheme120A Jozini 1 2520 2520 100%scheme1246 Kuzanhleni Ground Water 14 Borehole and Spring 1 58 0 0%scheme125 Ingwavuma 1 2227 89 4%scheme1257 Mhlekazi South 42 Borehole 3 653 0 0%SUB-TOTAL 151 48927 28545 58%UMKHANYAKUDE DISTRICT MUNICIPALITYWATER SERVICES DEVELOPMENT PLAN Page 29
INTEGRATEDTable 4.2.1 – Amount of <strong>water</strong> abstracted by larger schemes in Ml/year (continued)LocalMunicipalityJozini:SchemeCodeScheme NameSchemeSourceSchemeVolCapacity Abstracted(Ml/year) (Ml/year)Water SourceENGINEERINGSOLUTIONSNoOfCommPopulation PopulationServedwithinSchemewith<strong>water</strong>LOH% OfPopulationwith<strong>water</strong>LOHscheme1271 Odalweni Surface Water 1 Spring 3 976 0 0%scheme1275Mayaluka Surface Water 6 Spring 3 1975 1248 63%scheme1277Bovini Ground Water 35 Borehole 3 303 0 0%scheme1289Nyawo Surface Water 55 Pipeline 38 5944 4630 78%scheme1291 Qondile/Gujini Surface Water Ntshongwe/Malobeni line 3 153 0 0%scheme131 Mkuze Surface Water 73 181Mkuzi River / Blackie Dam 1 50 50 100%scheme1315 Nondabuya 1 1 1795 1167 65%scheme132 Ndumu 2 4397 4320 98%scheme1345Nyathini 5 536 496 93%scheme139 Magugu Surface Water Makonto Dam 5 2201 1157 53%scheme234 Khandane Unknown 3 385 345 90%SUB-TOTAL 67 18715 13413 72%SUB-TOTAL 218 67642 41958 62%The Big Five False Bay:scheme103 Hluhluwe Dam Surface Water 150 278Hluhluwe Dam 2 880 286 33%scheme1137 Nibela: Ubombo Reserve 1 - Mpagatini Spri 2 2099 1364 65%scheme1138 Nibela: Ubombo Reserve 1 - Nquceni Spring 4 1013 658 65%scheme1139 Nibela: Ubombo Reserve 1 - Nqumukuphili S 1 1239 805 65%scheme1140 Nibela: Ubombo Reserve 1 - Masondo Spring 1 1013 658 65%SUB-TOTAL 10 6244 3771 60%Hlabisa:KN030 2 4242 2757 65%KN075 Ground Water 6 6166 4008 65%KN083 Ground Water 9 4728 3074 65%KN101 71 12832 8338 65%scheme103 Hluhluwe Dam Surface Water 150 278Hluhluwe Dam 1 63 41 65%scheme1119 Bazaneni 5 2858 1372 48%scheme1123 Majikeni 1 77 77 100%scheme1160 Emakopini 15 2498 1637 66%scheme1250Kwamsane-Mpukunyoni 1 625 406 65%scheme1276Baswazini Ground Water 15 10Boreholes 4 1616 1050 65%scheme1285Nhlwathi Ground Water 11 Borehole 6 3265 0 0%scheme1293Sitezi Ground Water 37 Springs, Boreholes 11 1509 0 0%scheme1328Zidonini Mpenbeni 2 674 611 91%scheme1330Vumbe 1 934 607 65%scheme146 Hlabisa 1 155 23 15%scheme278 Hlabisa town and hospital Unknown 1 585 146 25%SUB-TOTAL 137 42827 24147 56%UMKHANYAKUDE DISTRICT MUNICIPALITYWATER SERVICES DEVELOPMENT PLAN Page 30
INTEGRATEDTable 4.2.1 – Amount of <strong>water</strong> abstracted by larger schemes in Ml/year (continued)ENGINEERINGSOLUTIONSLocal Municipality Scheme Code Scheme NameSchemeSourceSchemeCapacity(Ml/year)VolAbstracted(Ml/year)WaterSourceNo Of CommPopulationServedwithinSchemePopulationwith <strong>water</strong>LOH% OfPopulationwith <strong>water</strong>LOHMtubatuba:scheme106 St. Lucia Surface WaterschemeT101A Mtubatuba Surface WaterMtubatubaWaterScheme 3 1422 0 0%UmfoloziRiver 1 973 39 4%SUB-TOTAL 4 2395 39 2%St Lucia Park:KN101 1 28 18 64%KN114 Surface Water 1 26 17 65%KN117 Ground Water 1 32 21 66%scheme1144 Manzangwenya 4 794 616 78%scheme1158 Mabhokisini 1 379 216 57%SUB-TOTAL 8 1259 888 71%TOTAL 618 210098 112834 54%(Source – Department of Water Affairs and Forestry, improved uMkhanyakude District Municipality)4.2.4 Quality of <strong>water</strong> returned to resourceIn most instances <strong>water</strong> is returned to the resource after treatment in a waste<strong>water</strong>treatment works. The authorities responsible for the operation of these waste<strong>water</strong>treatment works should also monitor the quality of the effluent discharged from these worksback into resources. Unfortunately this information and the location of these waste<strong>water</strong>treatment works are not available and should be included in future reports of the WSDP.4.2.5 Quality of <strong>water</strong> taken from sourceAll authorities that abstract <strong>water</strong> for human consumption should have programmes in placewhere they to ensure that it complies with minimum accepted quality standards continuouslymonitor surface <strong>water</strong>.The quality of <strong>water</strong> is suitable for human consumption and irrigation.UMKHANYAKUDE DISTRICT MUNICIPALITYWATER SERVICES DEVELOPMENT PLAN Page 31
INTEGRATEDENGINEERINGSOLUTIONS4.3 Water Services Infrastructure And Service LevelsThis section describes the existing <strong>water</strong> infrastructure in the form of larger <strong>water</strong> supplyschemes as well as existing committed <strong>water</strong> projects in each LM. The location of theseschemes and projects are spatially indicated per local <strong>municipality</strong> in Figures I - N. Thenumber of communities that are served by the <strong>water</strong> supply schemes, as well as the supplylevels of these schemes per local <strong>municipality</strong> are indicated in Table 4.3.1(a). The numbercommunities that will be served by the <strong>water</strong> supply projects and the proposed supply levels ofthese projects are indicated in Table 4.3.2(b).Table 4.3.1(a)– Communities served by <strong>water</strong> supply schemesLocal MunicipalityNo OfSchemesNo OfCommunitiesPopulationwithinSchemesPopulation within schemesreceiving <strong>water</strong> below RDPStandards% Of Population receiving<strong>water</strong> below RDP StandardsUmhlabuyalingana 22 241 89731 42031 47%Jozini 30 218 67642 41958 62%The Big Five False Bay 5 10 6244 3771 60%Hlabisa Municipality 16 137 42827 24147 56%Mtubatuba Municipality 2 4 2395 39 2%St Lucia Park 5 8 1259 888 71%TOTAL 80 618 210098 112834 54%(Source – Department of Water Affairs and Forestry, improved by uMkhanykude District Municipality)Table 4.3.1(b) - Communities to be served by <strong>water</strong> supply projectsLocal MunicipalityNo OfProjectsNo OfCommunitiesPopulation withinProjectsPopulation withinprojects receiving<strong>water</strong> below RDPStandards% Of Population receiving<strong>water</strong> below RDP StandardsUmhlabuyalingana 5 49 17420 8857 51%Jozini 6 47 21654 13031 60%The Big Five False Bay 3 9 3820 2482 65%Hlabisa 16 162 81009 53346 66%Mtubatuba 1 4 5191 3375 65%St Lucia Park 6 12 2074 1522 73%TOTAL 37 283 131168 82613 63%(Source – Department of Water Affairs and Forestry, improved by uMkhanykude District Municipality)The <strong>water</strong> supply projects indicated on Figure I – N also indicates the status of projects(complete, ongoing, deferred) within uMkhanyakude. Table 4.3.1(c) shows that no projectsfunded by DWAF since 1994 are completed as at 2002 of those initiated since X and thatmany projects do not have any status available.UMKHANYAKUDE DISTRICT MUNICIPALITYWATER SERVICES DEVELOPMENT PLAN Page 32
INTEGRATEDTable 4.3.1(c) – Status of Projects within uMkhanyakudeENGINEERINGSOLUTIONSLocal Municipality No Of ProjectsProject StatusUmhlabuyalingana 5 OngoingJoziniThe Big Five False BayHlabisa1 Restarted5 Ongoing1 Restarted2 Ongoing2 Restarted13 Ongoing1 DeferredMtubatuba 1 OngoingSt Lucia Park 7 OngoingUMKHANYAKUDE DISTRICT MUNICIPALITYWATER SERVICES DEVELOPMENT PLAN Page 33
INTEGRATEDENGINEERINGSOLUTIONS4.4 Sanitation Services Infrastructure And Service LevelsThis section describes the existing sanitation as well as existing committed sanitation projectsin each local <strong>municipality</strong>. The location of these schemes and projects is shown spatially inFigures O to T. See Table 4.4.1(a) for detailed information on sanitation schemes andTable 4.4.2(b) for information on sanitation projects.Table 4.4.1(a) - Communities served by sanitation supply schemesLocal MunicipalityNo OfSchemesNo OfCommunitiesPopulation withinSchemesPopulation withinschemes receivingsanitation <strong>services</strong>below RDP Standards% Of Populationsanitation <strong>services</strong>below RDP StandardsJozini 1 1 2520 2520 100%Hlabisa 1 1 1046 680 65%Mtubatuba 1 1 973 39 4%TOTAL 3 3 4539 3239 71%(Source – Department of Water Affairs and Forestry)Table 4.4.2(b) - Communities to be served by sanitation supply projectsLocal MunicipalityNo OfProjectsNo OfCommunitiesPopulation withinProjectsPopulation withinprojects receivingsanitation <strong>services</strong>below RDP Standards% Of Population havingsanitation <strong>services</strong> belowRDP StandardsUmhlabuyalingana 2 74 22542 22505 100%Jozini 2 107 34855 34855 100%The Big Five False Bay 1 5 1916 1916 100%Hlabisa 3 25 8464 8441 100%St Lucia Park 1 12 1192 1192 100%TOTAL 9 223 68969 68909 100%(Source – Department of Water Affairs and Forestry)UMKHANYAKUDE DISTRICT MUNICIPALITYWATER SERVICES DEVELOPMENT PLAN Page 34
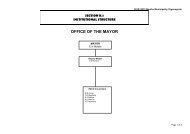
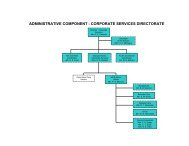
INTEGRATEDENGINEERINGSOLUTIONS4.5 Institutional, social and management arrangementsThe existing institutional and management arrangements in place in uMkhanyakude arediscussed in this section. Mhlatuze Water is a bulk <strong>water</strong> supplier, which covers a service areaof 36 689km2². UMkhanyakude is preparing a <strong>district</strong> business <strong>plan</strong> which will guide thecouncil on the financial, municipal and technical management issues related to <strong>water</strong> <strong>services</strong>.All communities in the <strong>district</strong> will either have contracted or non-contracted Water ServicesProviders that are responsible for providing <strong>water</strong> <strong>services</strong>, for example Mhlatuze Water,DWAF, AquAmanzi, individual local municipalities and individual communities.The contracted WSP’s need to establish linkages with uMkhanyakude with regards to theoperations of <strong>water</strong> <strong>services</strong> delivery in the areas under their jurisdiction and uMkhanyakudeneeds to develope firm contracts with these service providers. Thus uMkhanyakude as theWSA has among others, control over:• The <strong>development</strong> of regulations governing <strong>water</strong> use.• The setting of tariff structures for <strong>water</strong> <strong>services</strong>.• The communities to be targeted for <strong>water</strong> <strong>services</strong> delivery.Proceeding any project prioritisation and implementation is the overriding need to establisheffective institutional arrangements that will:• Operate and maintain existing schemes• Develop capacity to identify, <strong>plan</strong> and construct new projects• Operate and maintain these completed projects as new schemes• Identify funding sources and revenue streams for the ongoing operation ad maintenance ofthe <strong>water</strong> and sanitation schemes4.5.1 Water <strong>services</strong> organization structuresThe current organisational structure of uMkhanyakude is shown in Figure 1 below.UMKHANYAKUDE DISTRICT MUNICIPALITYWATER SERVICES DEVELOPMENT PLAN Page 35
INTEGRATEDENGINEERINGSOLUTIONSFigure 1 – uMkhanyakude Organisational StructureUMKHANYAKUDE DISTRICT MUNICIPALITY: ORGANOGRAMMunicipal ManagerPA to MayorPA to MMReceptionistPers Assist*Ass Dir.Exec AccAcc ClerkPayrollDir. FinancialRev AccAcc ClerkCreditorsAss Dir. ITIT OfficerAcc ClerkCapProjectsPers AssistSr Admin OffCommitteeDir. CorporateServices** VacantDriverSr Admin OffHR AdminSr AdminOffAdminAssistDir. Dev PlanningServices*GISOperator*FinController*SocialSr PlannerSr Planner*Tourism andEnvironmentalManager*Rural ServiceSystem CoPersAssistAss Dir: CapitalProjectsAss Dir. Ops&MaintAss Dir. EnergyProjectsTechnical DirectorBuildingControl*UMKHANYAKUDE DISTRICT MUNICIPALITYWATER SERVICES DEVELOPMENT PLAN Created on 2002-08-23 09:40 Page 36
INTEGRATEDENGINEERINGSOLUTIONS4.5.2 Organisational structure – KZ 271 : UmhlabuyalinganaThere is no approved organisational structure is in place for Umhlabuyalingana with onlyone official, the Municipal Manager that has been appointed. See Figure 2. The operatingbudget for the 2001/2002 financial years makes provision for four additionaladministrative personnel to be appointed. At present the Municipality renders no <strong>services</strong>to the community. The financial function for the Municipality is handled by GuaranteeTrust, which is situated in Richards Bay. 8Figure 2 - Organisational Structure – UmhlabuyalinganaMunicipal ManagerHead: Corporate ServicesFinancial Officer*Technical Officer*Administrative Officer*VacantCommittee Clerk Committee clerk Administrative Officer4.5.3 Organisational Structure – KZ 272 : JoziniThere is no approved organisational structure in place for Jozini while the operationalbudget for the 2001/2002 financial years makes provision for a staff complement of 77people, which includes a Municipal Manager and seven administrative staff. The balance istechnical personnel. There is no financial function established within the <strong>municipality</strong> butthe preparation of the budget and the handling of the day to day finance matters, havebeen outsourced to another service provider. Jozini has very limited capacity and renders<strong>services</strong> at a highly subsidised level to the service area. 94.5.4 Organisational Structure – KZ 273 : The Big Five False BayNo organisational structure has formally been approved. The operational budget for the2001/2002 financial years, makes provision for a Municipal Manager, a senioradministration officer, two administration officers and a secretary/typist/administrationclerk. The organisational structure as seen in Figure 3 is present in Hluhluwe town. The8 uMkhanyakude District Municipality Integrated Development Plan, March 2002UMKHANYAKUDE DISTRICT MUNICIPALITYWATER SERVICES DEVELOPMENT PLAN Created on 2002-08-23 09:40 Page 37
INTEGRATEDentire financial function has been outsourced to Guarantee Trust, an organisation situatedin Richards Bay 9 .ENGINEERINGSOLUTIONSFigure 3 - Organisational Structure – Big Five False BayMunicipal ManagerSecretarySenior Administrative Officer*VACANAdministration Officer*Administration Officer*4.5.5 Organisational Structure – KZ 274 : HlabisaAn organisational structure has been proposed for the Hlabisa Municipality as seen inFigure 4. Hlabisa Municipality is not directly engaged in the provision of <strong>services</strong> butexternal service providers on a contractual basis provide <strong>services</strong>. Guarantee Trustundertakes the entire financial function. Hlabisa Municipality has only limited capacity todeal with administrative matters. All other functional areas, as well as the technicalprovision of <strong>services</strong> have been outsourced on a contractual basis.Figure 4 Organisational Structure – HlabisaActing Municipal ManagerSecretary Administrative Officer Administrative OfficerCleaner9UMKHANYAKUDE DISTRICT MUNICIPALITYWATER SERVICES DEVELOPMENT PLAN Created on 2002-08-23 09:40 Page 38
INTEGRATED4.5.6 Organisational Structure – KZ 275 : MtubatubaENGINEERINGSOLUTIONSMtubatuba Municipality has developed a draft organisational structure that still needs tobe approved by the Council of the Municipality – Figure 5. The operational budget is anaggregation of estimates made for the former Mtubatuba and St Lucia transitional localcouncil areas and does not reflect any consideration of a process of transformation. 9Figure 5 Organisational Structure – MtubatubaMunicipal ManagerFinancial Services Protection Services Technical Services Administrative Services9 uMkhanyakude District Municipality Integrated Development Plan – March 2002UMKHANYAKUDE DISTRICT MUNICIPALITYWATER SERVICES DEVELOPMENT PLAN Created on 2002-08-23 09:40 Page 39
INTEGRATEDENGINEERINGSOLUTIONS4.6 Institutional Arrangements and Management PlanAppropriate institutional and management systems need to be in place to ensure thesustainability of the provision of <strong>water</strong> <strong>services</strong> to communities in uMkhanyakude. TheDistrict Municipality has to ensure that both themselves as the WSA and its WSP addresspolicies in demand management and sales arrangements.4.6.1 Demand Management/Water ConservationThe priority of uMkhanyakude as a WSA is currently to improve the provision of <strong>water</strong><strong>services</strong> to the not served or under served communities. Consumers in smaller areasconsume less <strong>water</strong> per capita than in larger areas. Demand management strategies shouldtherefore not entirely focus on reducing per capita consumption but rather on:• Customer care,• Improving consumer levels of payment for <strong>services</strong>,• Reducing illegal connections,• Customer education, and• Reporting major leaks.This will set the basis for more comprehensive demand management strategies in futureWSDP’s.A number of issues are of concern in uMkhanyakude:• Vandalism. This is and ongoing problem and education and awareness programmesneed to be initiated.• Illegal connections. This mostly occurs as people tamper with the infrastructureto access <strong>water</strong> at points other than the designated outlets. These illegalconnections could hamper the efficient operation of <strong>water</strong> supply schemes, as theywere not taken into consideration in the design of schemes and severely affect thescheme viability due to the resulting reduced income.• Non-payment of <strong>services</strong>.Extensive education campaigns need to be run in uMkhanyakude to informconsumers of the consequences of undertaking actions that could hinder the longtermsustainability of the provision of <strong>water</strong> <strong>services</strong>.UMKHANYAKUDE DISTRICT MUNICIPALITYWATER SERVICES DEVELOPMENT PLAN Created on 2002-08-23 09:40 Page 40
INTEGRATED4.6.2 Sales ArrangementsENGINEERINGSOLUTIONSuMkhanyakude together with the Water Service Providers need to introduce suitable salesarrangements to cover the following issues:‣ Type of metering to be used (credit of prepaid) for each level of service. Theexperience of the WSP with respect to the different types of metering methods iscritical in determining the suitability of any one of these methods when applied to aspecific community.‣ Types of billing system. These can be either separate for each service, combinedfor all <strong>services</strong> or a combination of both. This is applicable where both <strong>water</strong> andsanitation <strong>services</strong> are provided by the same WSP.‣ Method of billing (mail or hand delivery).‣ Arrangements for payment collection (offices or door to door).‣ Number of consumer units per payment collection point.‣ Credit control arrangements (action taken to collect bad debts).UMKHANYAKUDE DISTRICT MUNICIPALITYWATER SERVICES DEVELOPMENT PLAN Created on 2002-08-23 09:40 Page 41
INTEGRATED5 INTEGRATED DEVELOPMENT PLAN LINKAGES AND WSDP GOALS5.1 IDP LinkagesDuring several meetings held with the <strong>district</strong> and local municipalities to establishrequirement procedures for this WSDP, various requests were made that the IDPconsultants be present during these meetings and workshops in order for the WSDP to belinked to the IDP. The IDP promoted the following goals to be achieved in ensuring accessto <strong>water</strong> <strong>services</strong> in accordance with the minimum RDP standards:ENGINEERINGSOLUTIONS• Remove <strong>services</strong> backlog in a sustainable manner• Operate and maintain existing schemes in a sustainable manner• Complete existing appropriate <strong>water</strong> <strong>services</strong> projects in a sustainable manner.UMKHANYAKUDE DISTRICT MUNICIPALITYWATER SERVICES DEVELOPMENT PLAN Created on 2002-08-23 09:40 Page 42
INTEGRATEDENGINEERINGSOLUTIONS5.2 Water Services Development GoalsAs discussed in Chapter 2, a WSDP proposes the actions necessary to achieve efficientand sustainable provision of <strong>water</strong> and sanitation <strong>services</strong> for the people of a region ormunicipal areas within a region. uMkhanyakude is setting clear objectives within theirvision statement 9 to ensure that all citizens have access to basic levels of service up toRDP standards. The WSDP process supports the objectives for <strong>water</strong> <strong>services</strong> provisiontabled within the IDP and are as follows:• Upgrade / refurbish existing <strong>water</strong> <strong>services</strong> schemes• Operate and maintain existing schemes in a sustainable manner• Complete existing appropriate <strong>water</strong> <strong>services</strong> projects• Remove <strong>water</strong> <strong>services</strong> backlogSeeing that uMkhanyakude is a Water Services Authority and none of the localmunicipalities within uMkhanyakude are Water Services Authorities, the LocalMunicipalities within uMkhanyakude are therefore required to prepare Water Sector Plansas part of the Integrated Development Plan (IDP) process. The <strong>water</strong> sector <strong>plan</strong>s feed<strong>water</strong> and sanitation priorities and requirements into the IDP and into the <strong>district</strong> WSDPThe objectives for the preparation of uMkhanyakude’s Water Sector Plans were:• To review the current <strong>water</strong> and sanitation situation;• To set priorities for future <strong>water</strong> and sanitation projects;• To set priorities for future upgrading of <strong>water</strong> and sanitation projects to RDPstandards; and• To set targets and timeframes for the implementation of the agreed priorities.However, through the process of preparing the <strong>water</strong> sector <strong>plan</strong>s , each local <strong>municipality</strong>was assisted and through project identification and prioritisation workshops, all areas thatneed service level improvement, were identified.9 UMkhanyakude District Municipality Integrated Development Plan, March 2002UMKHANYAKUDE DISTRICT MUNICIPALITYWATER SERVICES DEVELOPMENT PLAN Created on 2002-08-23 09:40 Page 43
INTEGRATEDThese workshops were attended by Ward Councillors, Local Municipalities officials, tribalauthorities as well as DWAF and Umkhanyakude officials. These sessions were facilitatedby DM officials and staff from UWP Engineers.ENGINEERINGSOLUTIONSWhat is presently hereafter has been debated in extensive detail at both LM and <strong>district</strong>level and was accepted at the <strong>district</strong> wide ranking workshop held on 10 June 2002.UMKHANYAKUDE DISTRICT MUNICIPALITYWATER SERVICES DEVELOPMENT PLAN Created on 2002-08-23 09:40 Page 44
INTEGRATEDENGINEERINGSOLUTIONS5.3 Prioritisation MethodologyThe necessary information was obtained through various Local Municipality workshops thatwere held in uMkhanyakude.5.3.1 Local Municipality PrioritisationAreas with the highest <strong>water</strong> backlog need were identified and then ranked according tolevel of importance within each local <strong>municipality</strong>. Figures U – Y shows the priority areasagreed upon within each local <strong>municipality</strong>.5.3.2 District Wide PrioritisationA further refined prioritisation process was then applied for each priority area thatrepresented the <strong>district</strong> wide prioritisation process. The refined prioritisation processaddressed not only the objectives set by the WSDP but also focussed on the identificationof crisis project areas which included health issues, <strong>development</strong> nodes, etc. Theprioritisation criteria are as follows:• Upgrade / refurbish existing schemes;• Complete existing projects;• Remove <strong>water</strong> <strong>services</strong> backlog (population in need);• Development nodes (see figure Y1);• Health intervention areas, especially cholera; and (see figure C1)• Surface <strong>water</strong> source supply areas (see figure Y2).The prioritisation process resulted in Figures Z – DD, which shows the 5-yearimplementation <strong>plan</strong> (years 2003/2004 – 2007/2008) in order to provide <strong>water</strong> in specificareas within local municipalities. Areas to receive <strong>water</strong> after the 5-year <strong>plan</strong> are alsoindicated. The financial implications of implementing the 5-year <strong>plan</strong> will be discussed inchapter 6 (Appendix B for the detailed rank list).5.3.3 Sanitation PrioritisationIn the past <strong>water</strong> and sanitation problems were looked at separately. This has led to the<strong>plan</strong>ning and implementation of numerous <strong>water</strong> supply schemes but little or inadequate<strong>plan</strong>ning or provision for sanitation projects has been undertaken. In most casessanitation projects are linked to a <strong>water</strong> project or scheme and for this reason it wasdecided to use the same criteria listing to prioritise the sanitation backlog.UMKHANYAKUDE DISTRICT MUNICIPALITYWATER SERVICES DEVELOPMENT PLAN Created on 2002-08-23 09:40 Page 45
INTEGRATEDFigures EE – II shows the 5-year implementation <strong>plan</strong>s (years 2003/2004 – 2007/2008)to provide sanitation in specific areas within local municipalities. Areas to receive <strong>water</strong>after the 5-year <strong>plan</strong> are also indicated.ENGINEERINGSOLUTIONSUMKHANYAKUDE DISTRICT MUNICIPALITYWATER SERVICES DEVELOPMENT PLAN Created on 2002-08-23 09:40 Page 46
INTEGRATEDENGINEERINGSOLUTIONS5.4 Project Selection for 2002/2003 financial yearDuring January 2002, a list of projects to be funded during the coming 2002/03 financialyear, have been published by DWAF. Some previously deferred projects have now beenrestarted as well new projects have been identified. The list of the resulting cash flowsare presented in Table 5.4.1.UMKHANYAKUDE DISTRICT MUNICIPALITYWATER SERVICES DEVELOPMENT PLAN Created on 2002-08-23 09:40 Page 47
INTEGRATEDENGINEERINGSOLUTIONSLocal MunicipalityProjectCodeProject NameStausProposed ProjectAllocationProject TypeTotal Expenditure toDateProposed BudgetAllocation 2002/03Proposed BudgetAllocation 2002/03Proposed BudgetAllocation 2002/03UmhlabuylinganaKN055 Ezingeni Mpini Completed R 1,308,372.00Water R 0.00 R 0.00 R 0.00 R 0.00KN070 Kwangwanase Ongoing R 4,713,629.32Water R 0.00 R 513,000.00 R 410,400.00 R 216,000.00KN114 Shemula 2 Ongoing R 25,068,764.08 Water R 1,591,200.00 R 900,000.00 R 505,200.00 R 816,000.00KN117 Enkanyezini Ongoing R 5,325,552.34Water R 0.00 R 77,607.00 R 0.00 R 0.00KN119 Esiphaleni Ongoing R 281,221.79 Water R 0.00KN122 Mbazwane Ongoing R 3,556,977.84Water R 0.00 R 422,568.00 R 70,428.00 R 0.00KN215 TSHONGWE / MALOBENI Restarted R 1,982,500.00Water R 1,982,500.00 R 512,000.00 R 0.00 R 0.00KN255 MBILA / MACABUZELA / MBAZWANA Restarted R 967,026.96 Sanitation R 458,400.00 R 129,000.00 R 0.00 R 0.00KN261 SHEMULA Restarted R 897,521.90 Sanitation R 549,600.00 R 0.00 R 0.00 R 0.00KN291 KN291-Mbazwane WTP (CA) Ongoing R 1,995,410.24Water R 0.00 R 660,000.00 R 0.00 R 0.00KN297 KN297-Mseleni WTP (CA) Ongoing R 138,683.29 Water R 0.00 R 48,000.00 R 0.00 R 0.00KN322 MASULUMANE (CA) Restarted R 1,094,400.00Sanitation R 1,094,400.00 R 0.00 R 0.00 R 0.00KN340 Kwangwanase (Borehole) Ongoing R 1,815,000.00Water R 0.00 R 185,000.00 R 0.00 R 0.00KN341 Kwangwanase (Water retic) Ongoing R 1,658,704.00Water R 0.00 R 142,000.00 R 0.00 R 0.00KN378 MAKHATHINI Ongoing R 0.00Water R 0.00 R 0.00 R 0.00 R 0.00KN441 Mbazwana 2 Ongoing Water R 0.00 R 3,050,000.00 R 4,400,000.00 R 2,930,000.00KT002 Mseleni New R 67,000.00Water R 0.00 R 1,505,700.00 R 227,000.00 R 0.00KT078 Mbazwana 2 New R 3,151,062.00Water R 0.00 R 3,600,000.00 R 3,600,000.00 R 2,460,000.00JoziniTotal R 54,021,825.76 R 5,676,100.00 R 11,744,875.00 R 9,213,028.00 R 6,422,000.00KN115 Shemula 1 Upgrade Ongoing R 8,356,145.17Water R 0.00KN186 Isihlangwini Restarted R 855,297.67 Water R 218,000.00 R 0.00 R 0.00 R 0.00KN187 Nondabuya 2 Restarted R 2,407,429.03Water R 1,802,000.00 R 1,200,000.00 R 1,200,000.00 R 1,200,000.00KN282 KN282-Jozini WTP (CA) Ongoing R 1,304,231.03Water R 0.00 R 144,000.00 R 0.00 R 0.00KN283 KN283-Jozini STP (CA) Ongoing R 80,248.81Sanitation R 0.00 R 24,000.00 R 0.00 R 0.00KT022 Mkuze New R 0.00Water R 0.00 R 0.00 R 440,000.00 R 4,679,689.76KT0232 Jobe New R 0.00Water R 0.00 R 236,000.00 R 3,300,032.89 R 264,025.00The Big Five False BayTotal R 13,003,351.71 R 2,020,000.00 R 1,604,000.00 R 4,940,032.89 R 6,143,714.76KN101 Hluhluwe (Mpukyoni) Ongoing R 14,860,058.45 Water R 0.00 R 729,600.00 R 688,800.00 R 450,000.00KN221 UTHUNGULU LG SUPPORT Restarted R 500,000.00 Water R 500,000.00 R 500,000.00 R 248,000.00 R 0.00KN376 NIBELA-NQUTSHINI Ongoing R 0.00Water R 0.00 R 0.00 R 0.00 R 0.00KT064 Mngwenya New R 0.00Water R 0.00 R 0.00 R 0.00 R 819,500.00HlabisaTotal R 15,360,058.45 R 500,000.00 R 1,229,600.00 R 936,800.00 R 1,269,500.00KN028 Zamokuhle/Gunjaneni Ongoing R 2,792,100.21Water R 0.00 R 331,200.00 R 313,200.00 R 261,600.00KN030 Shikishela Ongoing R 1,878,751.88Water R 520,300.00 R 338,600.00 R 304,800.00 R 242,400.00KN031 Siyaphambili Ongoing R 1,580,321.40Water R 415,000.00 R 0.00 R 0.00 R 0.00UMKHANYAKUDE DISTRICT MUNICIPALITYWATER SERVICES DEVELOPMENT PLAN Created on 2002-08-23 09:40 Page 48
INTEGRATEDENGINEERINGSOLUTIONSKN069 Somkhele Ongoing R 6,336,482.56Water R 1,720,000.00 R 230,000.00 R 0.00 R 0.00KN075 Somile Ongoing R 3,580,870.26Water R 0.00 R 304,800.00 R 282,000.00 R 238,800.00KN080 Siwohlo Ongoing R 432,137.94 Water R 100,000.00 R 0.00 R 0.00 R 0.00KN083 Mpembeni Completed R 2,422,336.83Water R 237,000.00 R 0.00 R 0.00 R 0.00KN085 Macekeni-A Phase 2 Ongoing R 615,600.76 Water R 100,000.00 R 0.00 R 0.00 R 0.00KN116 Sakhuthando Ongoing R 284,734.84 Water R 50,000.00 R 541,000.00 R 14,600.00 R 0.00KN120 Sizabadletshe Restarted R 175,556.56 Water R 30,000.00 R 1,243,333.33 R 144,283.33 R 0.00KN172 Bumbanani Restarted R 2,740,363.77Water R 0.00 R 0.00 R 0.00 R 0.00KN253 MACABUZELA Restarted R 652,688.20 Sanitation R 216,000.00 R 0.00 R 0.00 R 0.00KN263 SIYAPHAMBILI Restarted R 287,981.98 Sanitation R 210,000.00 R 0.00 R 0.00 R 0.00KN271 KN271-Enseleni WTP (CA) Restarted R 0.00Water R 0.00 R 0.00 R 0.00 R 0.00KN272 KN272-Enseleni STP (CA) Restarted R 0.00Sanitation R 0.00 R 0.00 R 0.00 R 0.00KN287 KN287-Kwamsane STP (CA) Restarted R 0.00Sanitation R 0.00 R 0.00 R 0.00 R 0.00KN357 Nkololkhotho Ongoing R 605,300.00 Water R 0.00 R 2,008,184.94 R 167,000.00 R 0.00KN375 HLUHLUWE 2 Existing R 0.00Water R 0.00 R 0.00 R 0.00 R 0.00KT001 Mfekayi New R 75,000.00Water R 0.00 R 3,125,380.89 R 2,440,000.00 R 120,000.00KT005 Shikishela 2 New R 0.00Water R 0.00 R 30,000.00 R 3,677,214.44 R 2,219,716.67KT067 Hlambanyathi New R 0.00Water R 0.00 R 0.00 R 0.00 R 645,070.42KN240 DUKUDUKU Ongoing Sanitation R 0.00 R 0.00 R 0.00 R 0.00St Lucia ParkTotal R 24,460,227.19 R 3,598,300.00 R 8,152,499.16 R 7,343,097.78 R 3,727,587.08KN029 Mpelenyane Ongoing R 957,332.00 Water R 0.00 R 0.00 R 0.00 R 0.00KN407 DC 27 LG SUPPORT Ongoing R 499,999.20 Management (Gen R 499,999.20 R 499,999.20 R 499,999.20 R 0.00UmkhanyakudeTotal R 1,457,331.20 R 499,999.20 R 499,999.20 R 499,999.20 R 0.00KN377 MANSIYA Ongoing R 0.00Water R 0.00 R 0.00 R 0.00 R 0.00KN207 UTHUNGULU EMERGENCY Ongoing R 0.00Water R 2,557,625.60 R 0.00 R 0.00 R 0.00KN447 Kwamhkize San Ongoing R 0.00Sanitation R 0.00 R 0.00 R 0.00 R 0.00Grand TotalTotal R 0.00 R 2,557,625.60 R 0.00 R 0.00 R 0.00R 108,302,794.31 R 12,294,399.20 R 23,230,973.36 R 22,932,957.86 R 17,562,801.84UMKHANYAKUDE DISTRICT MUNICIPALITYWATER SERVICES DEVELOPMENT PLAN Created on 2002-08-23 09:40 Page 49
INTEGRATEDENGINEERINGSOLUTIONS6 FINANCIAL PROFILEThe financial implications of implementing this WSDP are given in this chapter. Thischapter also covers the potential sources of funding for the implementation of projectsoutlined in this WSDP.6.1 Operating and Maintenance CostsThe funding of Operation and Maintenance (O&M) of existing and future schemes is ofcritical importance. Correct operation and maintenance of physical infrastructure isarguably more important than the construction of the itself as, unless successfulpreventative maintenance procedures are instituted from day one of a scheme beingimplemented, the scheme will soon become inoperative. From Table 6.1.1 it can be seenthat the current O&M costs are R15.8 million per annum. A sizeable proportion of thisexpenditure is related to staff costs and the associated institutional arrangement areaddressed to improve the O&M aspects of the schemes, the substantial investmenttowards <strong>water</strong> and sanitation in uMkhanyakude will be lost as schemes becomedysfunctional and derelict.UMKHANYAKUDE DISTRICT MUNICIPALITYWATER SERVICES DEVELOPMENT PLAN Created on 2002-08-23 09:40 Page 50
INTEGRATEDTable 6.1.1 – Operating and Maintenance Costs (2000) of Schemes within uMkhanyakudeENGINEERINGSOLUTIONSLocal MunicipalityScheme CodeWater orSanitaion SchemeScheme OwnerO & M Costs(2000)KN001 Water DWAF Completed ProjectKN055 Water DWAF Completed ProjectKN070 Water DWAF Completed ProjectKN114 Water DWAF Completed ProjectKN117 Water DWAF Completed Projectscheme1104 Water DWAF R23 800scheme1144 Water Rural Council R135 771scheme1148 Water Rural Council R135 771scheme116 Water Rural Council R298 697scheme1161 Water Rural Council R203 657Umhlabuyalinganascheme1256 Water Rural Council R387 797scheme1273 Water Rural Council R123 043scheme1335 Water Rural Council R135 771scheme1338 Water Rural Council R135 771scheme1339 Water Rural Council R135 771scheme1340 Water Rural Council R135 771scheme1341 Water Rural Council R135 771scheme1342 Water Rural Council R135 771scheme1343 Water Rural Council R135 771scheme1344 Water Rural Council R135 771scheme1346 Water Rural Council R135 771scheme141 Water DWAF R3 786 610SUB-TOTAL R6 317 085Jozini KN001Water DWAFscheme108 Water LG & Housing R214 519scheme109 Water LG & Housing R260 681scheme110 Water LG & Housing R135 771scheme111 Water LG & Housing R135 771scheme1136 Water Rural Council R135 771scheme114 Water Rural Council R135 771scheme1143 Water Rural Council R950 400scheme1145 Water Rural Council R282 405scheme1146 Water Rural Council R135 771scheme1147 Water Rural Council R135 771scheme116 Water Rural Council R298 697scheme1163 Water Rural Council R135 771scheme1164 Water Rural Council R135 771scheme1180 Water Rural Council R67 886scheme120A Water & SanitationDWAF R8 600scheme1246 Water Rural Council R135 771scheme125 Water Provincial Works Department R108 617scheme1257 Water Rural Council R135 771scheme1271 Water Rural Council R282 405scheme1275 Water Rural Council R135 771scheme1277 Water Rural Council R135 771UMKHANYAKUDE DISTRICT MUNICIPALITYWATER SERVICES DEVELOPMENT PLAN Created on 2002-08-23 09:40 Page 51
INTEGRATEDscheme1289 Water Rural Council R135 771scheme1291 Water Rural Council R135 771scheme131 Water Devt Services BD R135 771scheme1315 Water Rural Council R135 771scheme132 Water LG & Housing R424 286scheme1345 Water Rural Council R135 771scheme139 Water Irrigation Board R203 657scheme234 Water R135 771SUB-TOTAL R5 546 031scheme103 Water DWAF R805 375scheme1137 Water Rural Council R135 771The Big Five False Bay scheme1138 Water Rural Council R135 771scheme1139 Water Rural Council R135 771scheme1140 Water Rural Council R135 771SUB-TOTAL R1 348 459KN030 Water DWAF Completed ProjectKN075 Water DWAF Completed ProjectKN083 Water DWAF Completed ProjectKN101 Water DWAF Completed Projectscheme103 Water DWAF R805 375scheme1119 Water Rural Council R135 771scheme1123 Water Rural Council R135 771ENGINEERINGSOLUTIONSHlabisascheme1160 Water Rural Council R135 771scheme1250 Water Rural Council R135 771scheme1276 Water Rural Council R135 771scheme1285 Water Rural Council R244 389scheme1293 Water Rural Council R135 771scheme1328 Water Rural Council R135 771scheme1330 Water Rural Council R135 771scheme145Sanitation DWAFscheme146 Water LG & Housing R135 771scheme278 Water R135 771SUB-TOTAL R2 407 474Mtubatubascheme106 Water Rural Council R156 986schemeT101A Water & SanitationLocal Authority Completed ProjectSUB-TOTAL R156 986KN101 Water DWAF Completed ProjectSt Lucia ParkKN114 Water DWAF Completed ProjectKN117 Water DWAF Completed Projectscheme1144 Water Rural Council R135 771scheme1158 Water Rural Council R135 771SUB-TOTAL R271 542TOTAL R16 047 577(Source: Department of Water Affairs and Forestry)UMKHANYAKUDE DISTRICT MUNICIPALITYWATER SERVICES DEVELOPMENT PLAN Created on 2002-08-23 09:40 Page 52
INTEGRATED6.2 Project cash flowsENGINEERINGSOLUTIONSIn Table 6.2.1 the current expenditure to date and future budgets for projects aredisplayed.Table 6.2.1 – Project Cash FlowsLocal MunicipalityTotal Expenditure toDateCurrent BudgetBudget for2002/2003Budget for2003/2004Budget for2004/2005Umhlabuyalingana R39,597,997.97 R51,622,891.00 R11,019,119.30 R5,012,642.00 R2,930,000.00Jozini R10,846,523.82 R5,000,000.00 R1,378,000.00 R1,214,000.00 R1,200,000.00The Big Five False Bay R13,910,858.45 R7,598,201.00 R943,900.00 R370,000.00 R0.00Hlabisa R17,900,119.95 R12,925,639.00 R3,441,762.30 R162,000.00 R0.00Mtubatuba R0.00 R591,030.00 R0.00 R0.00 R0.00St Lucia Park R631,220.00 R521,282.00 R499,999.20 R499,999.20 R41,666.60Total R82,886,720.19R78,259,043.00 R17,282,780.80 R7,258,641.20 R4,171,666.60(Source: Department of Water Affairs and Forestry)These projected cash flows are not considered in the requirements as presented inChapter 5. These funding requirements as well as those presented in chapter 5, arecustomised in section 6.5.UMKHANYAKUDE DISTRICT MUNICIPALITYWATER SERVICES DEVELOPMENT PLAN Created on 2002-08-23 09:40 Page 53
INTEGRATEDENGINEERINGSOLUTIONS6.3 Equitable Share AllocationsApart from consumer payments, the local municipalities also received funding from thenational government in the form of equitable share grants. The amounts of theseallocations for 2002/2003, 2003/2004 and 2004/2005 financial years for uMkhanyakudeare shown in Table 6.3.1 as published in the Government Gazette. These grants are meantto cover operating (or recurrent) costs only, and specifically exclude costs for new capitalinfrastructure.Table 6.3.1: Equitable Share AllocationsLocal MunicipalityAllocation for 2002/2003Municipal Financial YearAllocation for 2003/2004Municipal Financial YearAllocation for 2004/2005Municipal Financial YearUmhlabuyalingana R 9,479,914 R 13,485,258 R 16,425,669Jozini R 11,132,542 R 15,687,018 R 18,511,617The Big Five False Bay R 3,063,052 R 3,812,089 R 4,391,412Hlabisa R 8,719,183 R 11,892,459 R 14,229,433Mtubatuba R 4,538,110 R 4,732,948 R 3,897,325KZDMA27 R 2,129,372 R 2,541,475 R 2,880,906UMKHANYAKUDE R 16,910,242 R 17,872,462 R 19,119,001TOTAL R 55,972,415 R 70,023,709 R 79,455,363(Source: Department of Provincial and Local Government)Equitable share allocations are calculated on four criteria. For the purposes of <strong>water</strong><strong>services</strong> the most relevant of these criteria is the municipal basic <strong>services</strong> transfercalculation.The municipal basic <strong>services</strong> transfer (“S” transfer)The aim of this transfer is to ensure that poor residents in all local government areas alsohave access to basic municipal <strong>services</strong> such as <strong>water</strong> and sanitation. The qualifyingcriteria for this “S” transfer are the number of households per local authority with anincome below R800 per month in 1998. It is beneficial to District Municipalities withhigher levels of poor households 10 . The characteristic smaller to average size poorcommunities making up some of the local municipalities in uMkhanyakude means that thisDistrict Municipality should benefit further from equitable share allocations to providebasic <strong>water</strong> <strong>services</strong> to these communities. This “S” transfer allocation is being phased inover a period of five years in urban areas, and over a period of seven years in the ruralareas. This phase-in period started in the 1998-99 financial year 11 .10 DWAF “Free Basic Water” – Draft Implementation Strategy Document, March 200111 A Short Guide to the Equitable Share of Nationally Raised Revenue for Local Government (First Draft, June 1998)UMKHANYAKUDE DISTRICT MUNICIPALITYWATER SERVICES DEVELOPMENT PLAN Created on 2002-08-23 09:40 Page 54
INTEGRATEDThe basic <strong>services</strong> (S) grant supports the ability of municipalities to supply <strong>services</strong> to thepoor. The approach is to simply estimate the number of poor households with incomes ofless than R800 per month in 1998 Rand prices and the current annual cost of providingbasic <strong>services</strong> per person. The two magnitudes are multiplied together and then furthermultiplied by a parameter, which defines the proportion of need to be met by the S grant:ENGINEERINGSOLUTIONS• 0.6 for the 1998/1999 financial year with 0.1 for the remaining four years forurban municipalities; and• 0.1 for 1998/1999 financial year and increasing with 0.15 for the remaining sixyears for rural municipalities.The transfer aims to allocate an operating subsidy to municipalities of R86 per month foreach household earning less than R800 per month. The full operating subsidy will,however, not be provided in he first years of the system. Therefore the operatingsubsidy is based on an amount of R68.25 for the 1998/1999 financial year.UMKHANYAKUDE DISTRICT MUNICIPALITYWATER SERVICES DEVELOPMENT PLAN Created on 2002-08-23 09:40 Page 55
INTEGRATEDENGINEERINGSOLUTIONS6.4 Water Services FinancesThis section provides details of the <strong>water</strong> <strong>services</strong> finances per local municipalities for thearea under the jurisdiction of uMkhanyakude. It takes into account the variousinstitutions that are involved in the operation and maintenance of individual <strong>water</strong> <strong>services</strong>schemes. These institutions are Mhlatuze Water, WSSA who supply raw <strong>water</strong>(chlorinated) on behalf of DWAF, and the larger towns in the local municipalities.6.4.1 Supply ChargesA common feature in the tariff structures of all local municipalities is the non-uniformityof tariffs for the provision of <strong>water</strong> <strong>services</strong>. This is due to the fact that prior to thecreation of the local municipalities in December 2000, most towns acting as individual<strong>water</strong> service providers handled their own affairs. These towns are much smaller in sizethan the newly created local municipalities. This continues to be true of the individualtowns that previously acted and continue to act as de facto <strong>water</strong> <strong>services</strong> providers.A formal Water Service Provider contract between Mhlatuze Water and uMkhanyakude iscurrently being drawn up and will come into effect as soon as negotiations have beenfinalised. This will result in a standardisation of tariffs, as Mhlatuze Water will, once thecontract comes into effect, be the sole Water Service Provider for uMkhanyakude.The creation of a single WSP will result in standard tariffs for the entire DistrictMunicipality however; this may result in a reduction in the cost to rural consumers and anincrease in the cost to urban consumers in order to eliminate the enormous disparity in themonthly consumption charges. This is bound to create dissatisfaction among the urbanconsumers and will have to be handled delicately by uMkhanyakude as the WSA.The tariffs for <strong>water</strong> <strong>services</strong> need to be set to comply with consumers’ ability to affordthese charges. The implementation of free basic <strong>services</strong> will ensure access to basic<strong>services</strong> for those consumers who cannot afford to pay for <strong>services</strong>. However, shouldconsumers’ consumption exceed that of basic needs, they will have to pay for theconsumption of these <strong>services</strong> above that of basic supply.A complicating factor regarding the setting of tariffs is the issue of free basic <strong>water</strong>,which is covered in more detail in Section 6.6.UMKHANYAKUDE DISTRICT MUNICIPALITYWATER SERVICES DEVELOPMENT PLAN Created on 2002-08-23 09:40 Page 56
INTEGRATED6.4.2 Income from consumer paymentsENGINEERINGSOLUTIONSVery little to no information was available with regards to consumer payment records. Ifit is assumed that most consumers are not paying their accounts for <strong>services</strong> rendered,the financial pressures on the Water Service Provider will increase and would thereforehave a negative impact on the WSP’s ability to improve the levels of service that they canprovide to consumers.The issue of non-payment of <strong>services</strong> will be further addressed in the section discussingFree Basic Water.UMKHANYAKUDE DISTRICT MUNICIPALITYWATER SERVICES DEVELOPMENT PLAN Created on 2002-08-23 09:40 Page 57