Determination of Silicon Die Strength - IEEE Xplore
Determination of Silicon Die Strength - IEEE Xplore
Determination of Silicon Die Strength - IEEE Xplore
- No tags were found...

You also want an ePaper? Increase the reach of your titles
YUMPU automatically turns print PDFs into web optimized ePapers that Google loves.
AbstractThe purposes <strong>of</strong> this study are two folds: one is toattempt to develop a new, suitable test method fordifferentiating the factors that affect the variability <strong>of</strong> diestrength, and the other is to investigate the failure and fatiguestrength <strong>of</strong> silicon dies. In this study, a new test method, aplate-on-elastic-foundation test (PEFT) associated with pointorline-loading has been proposed and evaluated. It is foundthat the PEFT can provide not only a simple, chipping-freetest for dummy or real IC chips without limitation <strong>of</strong> size, butalso a stress field similar to the temperature loading. The testdata obtained from the current test are presented for thosefailed on IC and ground surfaces in real IC chips. It is foundthat the good consistency <strong>of</strong> the die strength data with minorscatter from both the point- and line-load tests for thespecimens failed on IC surfaces, but not for the ones failed onthe ground surfaces. The reason for this is that theinconsistency <strong>of</strong> strength data from both tests for failure onground surfaces is due to edge chipping involved, and thelarger scatter is resulted from the combined factors <strong>of</strong> theangle <strong>of</strong> grinding marks, planes <strong>of</strong> weakness <strong>of</strong> material, andloading stress state. The surface roughness <strong>of</strong> the diesmeasured by atomic force microscopy is correlated with thefailure mode and strength from the tests. It is found that thesilicon die strength is dominated by the roughness on failuresurface, and their failure modes always appear along theparallel and normal to the edges <strong>of</strong> the die, which might bethe weak plane <strong>of</strong> the crystal lattice <strong>of</strong> silicon. The specimenswith artificial cracks have been further tested. It has beenproved that the die strength dominated by the crack initiationdepends on the most severe defect and its failure mode iscontrolled by a special weak plane after the crack initiation.This study concludes that there are four factors to influencedie strength: the surface conditions <strong>of</strong> the die (includinggrinding-line direction and surface roughness), the edge crack<strong>of</strong> the die (so-called edge chipping created during the cuttingprocess), the weak planes <strong>of</strong> the crystal lattice <strong>of</strong> silicon, and,sometimes, the cause from different loading types. Thefatigue strength <strong>of</strong> the dies is also determined to be about 25%lower than static one.IntroductionThe trends <strong>of</strong> electronic packaging development are to bewith small size, low-pr<strong>of</strong>ile features, high-pin count and highperformance. Recently, the flip-chip packages, 3-D packagesor stacked die packages came out for these needs. Amongthese packages, mostly the thickness <strong>of</strong> the wafers has to beground thinner (from about 900µm to 100µm, or even to50µm). The strength <strong>of</strong> dies, cut from the wafers aftermanufacturing processes (such as grinding, polishing, plasmaetching, and die sawing), has to be determined for assuring<strong>Determination</strong> <strong>of</strong> <strong>Silicon</strong> <strong>Die</strong> <strong>Strength</strong>M. Y. Tsai*, and C. S. LinDepartment <strong>of</strong> Mechanical Engineering, Chang Gung UniversityKwei-Shan, Tao-Yuan, Taiwan 333*<strong>IEEE</strong> member, E-mail: mytsai@mail.cgu.edu.twTel: 886-3-2118800 ext. 5743, Fax: 886-3-2118346good design and reliability <strong>of</strong> the packages. In the literatures,the vertical die cracking is found as one <strong>of</strong> the major failuremodel in a flip-chip package under thermal loads [1]. Thevertical cracks around the central area <strong>of</strong> the chip surface,originating from the surface defects on the backside <strong>of</strong> thedie, propagate outward to the edge and simultaneouslydownward into chip by kinking when they hit thecompressive stress region [2, 3]. Sometimes, the vertical edgecracks, resulting from chipping during wafer sawing,propagate inward to the center <strong>of</strong> the die under tensile stresses[3], shown in Figure 1. Therefore, in-situ die strength data arevery important for packaging design. For evaluating the diestrength, a ball-breaker test [4] has been used to determine thedie strength from wafers with different grinding and polishingprocesses, and further different test methods (including threepointbending, four-point bending and ball-breaker tests) [5]have been evaluated for effectively determine the die strength.A ring-on-ring and four-point bending tests associated withWeibull probability analysis were employed for determiningdie strength in an attempt to separate the surface grinding andedge dicing effects [6]. Recently, it was found that thegeometry and sharpness <strong>of</strong> scratch tip for a few large anddeep scratches created by wafer thinning process significantlyaffect the strength data obtained from three-point bending test[7]. However, from the published data, it can be found thatthere are a large scatter existed in die strength data, andneither three-point bending nor four-point bending test can beused to differentiate the causes <strong>of</strong> the low strength from thegrinding and die sawing. There are two objectives in thisstudy: one is to investigate the failure and fatigue strength <strong>of</strong>silicon dies, and the other is to intend to develop a new,suitable test method for differentiating the factors that affectthe variability <strong>of</strong> die strength, in order to find out the causes<strong>of</strong> the weakness <strong>of</strong> the die strength and thus propose thesolution to improving the strength for enhancing thereliability <strong>of</strong> the IC packages.Fig.1 <strong>Die</strong> cracks occurring at the flip-chip packages underthermal cycling0-7803- 8906-9/05/$20.00 ©2005 <strong>IEEE</strong> 1155 2005 Electronic Components and Technology Conference
A New Test Method and ImplementationThe test specimens are real IC chips with a rectangularplate-like geometry <strong>of</strong> 3.88 mm x 3mm x 0.15mm. Thesurfaces <strong>of</strong> the specimens include IC surface (with circuitry)and ground surface (with grinding marks). In general, thesilicon die is a crack-sensitive, brittle material which failure isdriven by tension rather than compression. Therefore, thereare two surfaces <strong>of</strong> the specimens to be tested: one fails on theground surface in Figure 2(a), and the other on the IC surfacein Figure 2(b). Basically, once the specimens are pressured onthe one surface, then the other surface would be subjected totensile stresses, which maximum is at loading point andgoverns the die failure (maximum) loads.Fig.2(a) Failure (tensile) surface on the ground surface,(b) failure (tensile) surface on the IC surface.A new test method, a plate-on-elastic-foundation test(PEFT) associated with point- or line-loading, is proposed.The schematics <strong>of</strong> PEFT are shown in Figure 3, in which thePEFT associated with point- and line-loading are called aspoint-load test (PLT) and line-load test (LLT), respectively.The point load is applied at the center <strong>of</strong> the test specimenusing a pointer with a radius <strong>of</strong> 0.25 mm, while the line loadalong the center line <strong>of</strong> the test specimen using a plate-likecarbon steel tool with 0.3 mm thick. The loaded specimensare laid down on the elastic foundation, which is siliconerubber material with 10 mm thick in this study. Typical forcevs. displacement curves for die specimens are shown inFigure 4(a) for under point-load test, and 4(b) for under lineloadtest. It is shown that the specimens loaded under bothtests deformed almost linearly until they failed. Most <strong>of</strong> thespecimens for both tests followed the same curves as shownin Figure 4 but with various maximum loads.Fig.4 Typical force vs. displacement curve for die specimen(a) under point-load test, and (b) under line-load test.In order to calculate the stress state <strong>of</strong> the die specimenunder the PEFT, the modulus <strong>of</strong> the elastic foundation (K) <strong>of</strong>the silicone rubber will be determined first by pressing thesilicone rubber with a rigid rod (with a diameter <strong>of</strong> 4.2 mm).The applied force (load) vs. displacement (δ) plots are shownin Figure 5 for three tests--with maximum loads <strong>of</strong> 6.87 N,7.85 N and 19.62 N. It is shown that the lines with these threetests are almost identical with a slope <strong>of</strong> 4 N/mm 3 , which isthe K obtained by dividing stress (load/area) with the δ. Theobtained K can be needed in the stress analysis <strong>of</strong> the diespecimens for correlating the maximum force with the diestrength.Fig.3 Schematics <strong>of</strong> a plate-on-elastic-foundation test (PEFT)associated with point- and line-loading.Fig.5 <strong>Determination</strong> <strong>of</strong> the modulus <strong>of</strong> the elastic foundation(K) by pressing the silicone rubber with a rigid rod.11562005 Electronic Components and Technology Conference
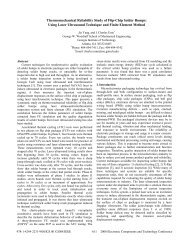
After the static tests, the fatigue tests with point loadingare also performed. Typical force vs. displacement curves fordie specimen under fatigue loading are shown in Figure 6(a)and the definition <strong>of</strong> fatigue failure is illustrated in Figure6(b). The displacement rate is 0.01 mm/min, and the time percycle is about 10 min. The cycle to failure is defined as thecycle with a big drop <strong>of</strong> load, shown in Figure 6 (b).Results and DiscussionFor the point-load test (PLT), as the die specimens wereloaded by a pointer at the center point on the ground surface,the maximum tensile stress dominating failure occurs at thesame point but on the other surface (IC surface). Ninespecimens have been tested and the results are shown inFigure 7, in which maximum (failure) forces and deflectionsfor each specimen with tension-loaded IC surfaces underpoint-load test. Note that since all the specimens are brittlefailure, thus entire force-deflection curves are almost linear upto failure load. It is shown that the average maximum force is3.86 N with standard deviation <strong>of</strong> 0.32 N (about 8.3% <strong>of</strong> theaverage), and the maximum force is approximatelyproportional to maximum deflection with the averagemaximum deflection <strong>of</strong> 0.11mm. The data indicated that thereis a small scatter for both data and consistency on the stiffness(equivalent to force divided by deflection). On the other hand,eight specimens were loaded at IC surface, meaning that themaximum tensile stress is at the center point <strong>of</strong> the groundsurface. The obtained results are shown in Figure 8,representing maximum forces and deflections for the diespecimens with various angles <strong>of</strong> grinding marks. Theaverage maximum force is 5.65 N with standard deviation <strong>of</strong>1.14 N (about 20% <strong>of</strong> the average), and the average maximumdeflection 0.145mm. In comparison with the case <strong>of</strong> tensionloadedIC surface, the one with tension-loaded ground surfacehas larger value <strong>of</strong> average maximum force, but with a largerscatter. Among these maximum force data, it seems that theFig. 6(a)Typical force vs. displacement curve for diespecimen under fatigue loading, (b) definition <strong>of</strong> fatiguefailure.Relationship between Force and <strong>Die</strong> StressTo convert the maximum force obtained from the tests tothe die strength, the stress state <strong>of</strong> the die specimen(especially for maximum stress) is needed and can bedetermined from theoretical or numerical stress analysis.Since the geometry <strong>of</strong> the test specimens used is rectangular,there is no theoretical close-form solution available. Thereby,the finite element (FE) analyses were applied for the presentstress analyses <strong>of</strong> point-load and line-load tests. Prior to thesefinite element analyses, the material properties <strong>of</strong> the elasticfoundation <strong>of</strong> the silicone rubber were also determined byperforming a finite element analysis to address the resultsshown in Figure 5. The obtained elastic modulus andPoisson’s ratio for silicone rubber foundation are E= 13.24MPa and ν =0.45, respectively. For the point-load test, thelinearly elastic, three-dimensional FE model was employed byassuming the applied load is uniformly distributed over thepin contact area. The material properties <strong>of</strong> the silicon die areE=170 GPa and ν =0.28. Under given certain load, themaximum tensile stresses were obtained for various contactareas. Similarly, the maximum tensile stresses for line-loadtest were obtained in terms <strong>of</strong> the given load and contact area,but using the two-dimensional plane strain model.Fig. 7 Max. forces and deflections for the die specimens withtension-loaded IC surfaces under point-load test (PLT).Fig. 8 Max. forces and deflections for the die specimens withvarious angles <strong>of</strong> grinding marks, with tension-loadedground surfaces under point-load test (PLT).11572005 Electronic Components and Technology Conference
data are dependent on the angle <strong>of</strong> grinding marks, and theultimate one is located between at 40 and 70 degree. And atthe nearly 90 degree, it has the lowest values. The reasons forthose will be illustrated later.In case <strong>of</strong> the line-load test (LLT), the die specimenswere pressured along the center line on the ground surfacewith a plate-like carbon steel tool and thus the maximumtensile stress dominating failure occurs along the same linebut on the other surface (IC surface). The results for 14specimens are shown in Figure 9 for their maximum forcesand deflections. It is shown that the average maximum forceis 6.98 N with a standard deviation <strong>of</strong> 0.55 N (about 7.8% <strong>of</strong>the average), and the average maximum deflection <strong>of</strong> 0.18mm. There also exists a small scatter for those data. On theother hand, fifteen specimens were tested and the maximumtensile stress was applied along the center line <strong>of</strong> the groundsurface. The maximum forces vs. various angles <strong>of</strong> grindingmarks for these specimens with tension-loaded groundsurfaces under line-load test (LLT) is shown in Figure 10.Fig. 9 Max. forces and deflections for the die specimens withtension-loaded IC surfaces under line-load test (LLT)Fig. 10 Max. force vs. grinding angle for the die specimenswith various angles <strong>of</strong> grinding marks, with tensionloadedground surfaces under line-load test (LLT)It shows a relatively larger scatter on the averagemaximum force <strong>of</strong> 8.87N with a standard deviation <strong>of</strong> 2.58N(about 29% <strong>of</strong> the average). In contrast to point-load test, themaximum force data from the line-load test highly depends onthe angles <strong>of</strong> grinding marks with the highest value at nearly 0degree, the lowest at nearly 90 degree and the intermediate atbetween those two. The maximum force data mentionedabove can be converted into maximum stress data (equivalentto material strength) either by theoretical or finite elementanalysis. Since the geometry <strong>of</strong> the die specimens isrectangular, there is no theoretical solution available to beemployed for the conversion. Thus, the finite element analysiswill be used for the calculation <strong>of</strong> maximum stress in terms <strong>of</strong>applied load.In order to correlate the applied force to maximumtensile die stress, the finite element analysis was applied forstress analyses <strong>of</strong> the pin-load and line-load tests. The resultsfor the specimen under the point-load test are shown in Figure11 for the relationship between pin contact length (c) andmaximum die stress for the die specimen loaded with P=4 N.It is shown that the maximum tensile die stresses occurring atthe center point is unequal and bi-axial, and quite dependenton the contact length. The inequality <strong>of</strong> bi-axial stresses is dueto the rectangular shape <strong>of</strong> the specimen, but not for squareshape. The axial stress in the transverse axis (σ y ) is only about85% <strong>of</strong> that in the longitudinal axis (σ x ). The axial stressdistributions are like concave-cone shape with the maximumvalue at the center and zero at the free end. On the otherhand, for the results <strong>of</strong> the line-load test, the relationshipbetween pin contact length (c) and maximum die stress for thedie specimen loaded with P=4 N is illustrated in Figure 12. Itis apparent that, unlike the point-load test, the maximumtensile die stress is insensitive to the contact length. And themaximum value occurring at the center point is uni-axial inthe longitudinal axis and constant across the transverse axis.Based on the results mentioned above, the contact lengthaffect significantly on the maximum stress for the point-loadtest, but not for the line-load test. Prior to application <strong>of</strong> thefinite element results to the test data, the contact mechanism<strong>of</strong> the pin-load test has to be investigated during the loading.The simple equation can be adopted to describe the contactlength in terms a radius <strong>of</strong> contact ball (r) and deflection <strong>of</strong>the plate specimen (δ), and shown as follows:22c = c( δ , r)= r − ( r − δ ) (1)The equation was plotted by contact length (c) vs. deflectionfor given radius <strong>of</strong> contact ball <strong>of</strong> 0.25 mm, and shown inFigure 13. Thus the maximum contact length, which isimpending over the die failure, can be determined using thisequation by putting the value <strong>of</strong> maximum deflection in.To summarize the test data above, Table 1 lists the averagemaximum forces ( Pmax), deflections (δ max ) and die strength( σu) data for the die specimens failed on IC and groundsurfaces, obtained from point-load test (PLT) and line-loadtest (LLT). Note that the maximum contact length ( Cmax) forpoint-load test is calculated by plugging the maximumdeflection into equation (1), while half the thickness <strong>of</strong> theloading plate is adopted as the contact length for line-loadtest. The die strengths ( σu) are calculated proportionally byusing the value <strong>of</strong> Cmaxand Pmax, and the finite element data11582005 Electronic Components and Technology Conference
Fig.11 The relationship between pin contact length (c) andmaximum die stress for the die specimen loaded withP=4 N, under point-load test, obtained from FEM.Table 1. Average max. forces, deflections and die strengthdata for the die specimens failed on IC and groundsurfaces, obtained from point-load test (PLT) andline-load test (LLT).Fig.12 The relationship between pin contact length (c) andmaximum die stress for the die specimen loaded withP=4 N, under line-load test, obtained from FEM.Fig.13 Pin contact radius (c) vs. maximum deflection .2C maxin Figures 11 (using contact area <strong>of</strong> ) and 12 for pointloadtest (PLT) and line-load test (LLT), respectively, underP= 4 N. This calculation, <strong>of</strong> course, assumes that the diematerial behaves linearly up to failure. Actually, the silicondie material is brittle and behaviors such the way up t<strong>of</strong>ailure, which is observed during the test. The raw test dataP ) and standard deviation and the corresponding die(maxπ1159Fig.14 (a) Maximum force, and (b) die strength, obtainedfrom point-loaded test (PLT) and line-loaded test(LLT) for failure on IC and ground surfaces.strength ( σu) and standard deviation are shown in Figure 14for failure on IC and ground surfaces under both tests. It isshown that the maximum force data in Figure 14(a) could notindicate any correlation and mechanics rule for these groups<strong>of</strong> test data. However, after converted into die strength datashown in Figure 14(b), the results indicate that the die2005 Electronic Components and Technology Conference
strengths from PLT and LLT for failure on IC surface are 304MPa with deviation <strong>of</strong> 25.2 MPa, and 322 MPa with 25.4MPa, respectively, and consistent fairly well with a relativelysmall scatter. However, for the data failed on ground surface,consistency between both tests is not as good as those failedon IC surface, and the averages <strong>of</strong> these data are larger thanthose failed on IC surface with a relatively large scatter.Fig.15 Wafer sawing (cutting) direction and die chippingoccurrence.For further understanding the factors on die strength, theedge conditions <strong>of</strong> the die specimens were observed usingoptical microscopy and shown in Figure 15. It is shown thatthe edge chipping is related to the cutting direction <strong>of</strong> the diesaw, and generally found at the ground side but not at the ICside. It is well known that the edge chipping would initiateand thus control the silicon die failure, as the edges <strong>of</strong> thespecimens are subjected to tensile stresses under the loadingsuch as three-point bending or four-point bending. Thetopographies (or roughness) <strong>of</strong> ground and IC surfaces weremeasured by atomic force microscopy (AFM), and are shownin Figure 16(a) and (b), respectively. The results appear thatthere are grinding marks on the ground surface but circuitpatterns on the IC surface. The average roughness on the onthe ground surface is 23.3 nm with maximum value <strong>of</strong> 234.9nm, while the average on the IC surface is 171.6 nm with 1.5µm maximum. The aforementioned factors <strong>of</strong> edge chippingand surface roughness can be correlated to the die strengthdata in order to understand the influential mechanism, bycomparing these factors with die strength data in Figure14(b). From the strength data <strong>of</strong> failure on IC and groundsurface, it can be found that the roughness, especially itsmaximum value, affect significantly the average die strengthby the way <strong>of</strong> decreasing the die strength with increasing thesurface roughness. For the line-load test which is sensitive tothe edge chipping, it shows an effect on the data failed onground surface by decreasing the average value based onpoint-load test value, but not on those failed on IC surface.The reason is that edge chipping was found at the groundsides which are under tension stresses during the line-loadtest, but not at the IC sides. Therefore, the data for failure onIC surface are avoided from the edge chipping effect and thusconsistent with those from the point-load test.Typical failure modes for die specimens under point-loadand line-load tests for failure on IC surfaces, and under lineloadfor failure on ground surfaces are two-piece breakingalong the transverse center line, shown in Figure 17 (a). Incontrast, the ones under point-load test for failure on groundsurfaces are four-piece and independent on the angle <strong>of</strong>grinding marks, shown in Figure 17 (b) and (c) for thespecimens with 45° angle <strong>of</strong> grinding marks and with close to0° angle <strong>of</strong> grinding mark, respectively. It is reasonable thatthe failure mode for the former case is due to maximumtensile stress in longitudinal direction at the center or alongthe transverse center line. However, for the latter case, itseems to be independent on the angle <strong>of</strong> grinding marks bybreaking into four pieces along the longitudinal andtransverse center lines, which are parallel to the edges. Thehypothesis is made that there could exist some planes <strong>of</strong>weakness due to crystal lattice <strong>of</strong> silicon on this (100) waferparallel to the cutting lines.Fig.16 Topography (roughness) (a) for ground surfaces and(b) for IC surfaces <strong>of</strong> die specimens measured byatomic force microscopy (AFM).11602005 Electronic Components and Technology Conference
the factors <strong>of</strong> planes <strong>of</strong> weakness and the angle <strong>of</strong> grindingmarks, it can be explained why the maximum failure loadsoccur near the 45 degree angle <strong>of</strong> grinding marks for thespecimens with tension-loaded ground surfaces under the pinloadtest, shown in Figure 8, and the failure mode is fourpiecebreaking and independent on the angle <strong>of</strong> grindingmarks. Furthermore, the larger scatter occurring at the datafailed on the ground surface is attributed to the angle <strong>of</strong>grinding marks, planes <strong>of</strong> weakness <strong>of</strong> material and loadingstress states from uni-axial stress for line-load test andunequal bi-axial stress for point-load test <strong>of</strong> rectangularspecimen.Fig.17 Typical failure modes for die specimens (a) under PLTand LLT, for failure on IC surfaces and under line-loadfor failure on ground surfaces (b) under PLT, forfailure on ground surfaces with 45° angle <strong>of</strong> grindingmarks (c) with close to 0° angle <strong>of</strong> grinding marks.In order to validate this hypothesis, three sets <strong>of</strong>10x10x0.2 mm dummy specimens, shown in Figure 18, with20µm-deep X , / and + artificial cracks, individually, weretested using the point-load test method. Beside from theartificial cracks, the roughness <strong>of</strong> these tensile-load surfaces is0.138 nm with a maximum <strong>of</strong> 0.952 nm. The results areshown in Figure 18 for the average failure loads <strong>of</strong> these threesets <strong>of</strong> the specimens (with six specimens for each set) withvarious artificial cracks. It can be seen that the average failureloads for the specimens with X and / cracks are about thesame and much lower than that for the specimens withoutcracks by about one order <strong>of</strong> magnitude. The average failureload for the specimens with + cracks is even far much lower.It is not surprise that the artificial cracks cause the enormousdrop <strong>of</strong> the failure load. However, if the values <strong>of</strong> failureloads are totally dominated by the artificial cracks (the bigdefects), then the failure loads for each group will be aboutthe same, since the maximum tensile stress in any direction isthe same for these square specimens. The question is why thefailure load for the specimens with + cracks is only two third<strong>of</strong> that for the specimens with X and / cracks. Is another factorinvolved? To answer this question, the typical failure modesfor these three sets <strong>of</strong> specimens are observed and shown inFigure 19. It is shown in Figure 19(a) that, for the specimenswith X or / artificial cracks, the failure crack initiates from theartificial cracks at the center, and kinks to and propagatesalong the longitudinal and transverse directions. That indicatethat there exist some planes <strong>of</strong> weakness in this (100) waferalong the longitudinal and transverse directions. As a result,when the artificial cracks are superimposed with (or parallelto) the planes <strong>of</strong> weakness, for the case with + cracks, theaverage failure load would decrease more than 30% further asshown in Figure 18 and the failure mode would be shown inFigure 19(b). Therefore, it can be concluded that there is afactor <strong>of</strong> planes <strong>of</strong> weakness to affect the failure load as wellas failure modes <strong>of</strong> the die specimens. By taking into account1161Fig.18 Failure loads for square test specimens with variousartificial cracks, under point-load test(with 6specimens for each set).Fig.19 Typical failure modes for square test specimens (a)with X or / artificial cracks, (b) with + artificial cracks(parallel to planes <strong>of</strong> weakness)2005 Electronic Components and Technology Conference
To understand the difference <strong>of</strong> die strength between fromstatic and fatigue tests, the point-load fatigue test was carriedout for the die specimens with tension-loaded IC surface. Theresults are shown in Figure 20, representing the maximumload vs. cycling times. Note that the maximum loads for onecycle failure were from the static tests, and the average is 3.86N. The fatigue results indicate that the cycle to failureincreases to 30 and further up to 1000 when the maximumload decreases to 2.94 N and further to 2.84 N. And as themaximum load is below 2.84 N, the cycle to failure is farbeyond 1000. As a result, based on the cycle to failure <strong>of</strong>1000, the fatigue strength <strong>of</strong> the dies loaded in tension on ICsurfaces is about 25% lower than static one.crystal lattice <strong>of</strong> silicon. The specimens with artificial crackshave been further tested. It has been confirmed that the diestrength dominated by the crack initiation depends on themost severe defect but not on the amount <strong>of</strong> the defects, andits failure mode is controlled by a special weak plane after thecrack initiation. This study concludes that there are fourfactors to influence die strength: the surface conditions <strong>of</strong> thedie (including grinding-line direction and surface roughness),the edge crack <strong>of</strong> the die (so-called edge chipping createdduring the cutting process), the weak planes <strong>of</strong> the crystallattice <strong>of</strong> silicon, and, sometimes, the cause from differentloading types. And the fatigue strength <strong>of</strong> the dies is alsodetermined to be about 25% lower than static one.Fig.20 Maximum load vs. fatige life cycle for die specimenswith tension-loaded IC surfaces under point-load test.ConclusionsIn this study, a new test method, a plate-on-elasticfoundationtest (PEFT) associated with point- or line-loadinghas been proposed and evaluated. It is found that the PEFTcan provide not only a simple and feasible, chipping-free testfor dummy or real IC chips without a limitation <strong>of</strong> the size,but also a stress field similar to the temperature loading. Thetest data obtained from the current test are presented for thosefailed on IC and ground surfaces in real IC chips. It is foundthat the good consistency <strong>of</strong> the die strength data with minorscatter from both the point- and line-load tests for thespecimens failed on IC surfaces, but not for the ones failed onthe ground surfaces. The reason for this is that theinconsistency <strong>of</strong> strength data from both tests for failure onground surfaces is due to edge chipping involved, and thelarger scatter is resulted from the combined factors <strong>of</strong> theangle <strong>of</strong> grinding marks, planes <strong>of</strong> weakness <strong>of</strong> material, andloading stress state from uni-axial stress for line-load test andunequal bi-axial stress for point-load test <strong>of</strong> rectangularspecimen. The surface roughness <strong>of</strong> the dies (including theIC and ground surfaces) measured by atomic forcemicroscopy is correlated with the failure mode and strengthfrom the tests. It is found that the silicon die strength isdominated by the roughness on failure surface, and theirfailure modes always appear along the parallel and normal tothe edges <strong>of</strong> the die, which might be the weak planes <strong>of</strong> the1162AcknowledgmentsThe authors would like to acknowledge the NationalScience Council, Taiwan, ROC, for its financial support underGrant No. NSC93-2212-E-182-005 and ASECL (ASE Group)for providing test specimensReferences1. Wu, T. Y., Tsukada, Y., and Chen, W. T., “Materials andMechanics Issues in Flip-Chip Organic Packaging,” Proc.46th Electron. Comp. Technol. Conf. June (1996), pp.524-533.2. Hu, K., Yeh, C. P., Doot, B., Skipor, A. F., and Wyatt, K.W., “<strong>Die</strong> Cracking in Flip Chip on Board Assembly,”Proc. 45th Electron. Comp. Technol. Conf. May (1995),pp.293-299.3. Tsai, M. Y., Hsu, C. H. and Wang, C. T., “Investigation <strong>of</strong>Thermo-Mechanical Behaviors <strong>of</strong> Flip Chip BGA in ICPackaging,” <strong>IEEE</strong> Transactions on Components andPackaging Technologies Vol. 27, No. 3, (2004), pp.568-576.4. Yeung, B.H., Hause, V., and Lee, T.Y.T.,“ Assessment <strong>of</strong>Backside Processes Through <strong>Die</strong> <strong>Strength</strong> Evaluation, ”<strong>IEEE</strong> Transactions on Advanced Packaging, Vol.23, No.3,(2000), pp.582-587.5. Yeung, B. H., and Lee, T.Y.T., “ An Overview <strong>of</strong>Experimental Methodologies and Their Applications <strong>Die</strong><strong>Strength</strong>, ” <strong>IEEE</strong> Transactions on Advanced Packaging,Vol.26, No.2, (June 2003), pp.423-428.6. Cotterell, B., Chen, Z., Han, J. B., and Tan, N. X., “The<strong>Strength</strong> <strong>of</strong> the <strong>Silicon</strong> <strong>Die</strong> in Flip-Chip Assemblies,”ASME Journal <strong>of</strong> Electronic Packaging, Vol. 125, (Mar.2003), pp. 114-119.7. McLellan, N. Fan, N., Liu, S., Lau, K.,and Wu, J.,“Effect<strong>of</strong> Wafer Thinning Condition on the Roughness ,Morphology and Fracture <strong>Strength</strong> <strong>of</strong> <strong>Silicon</strong><strong>Die</strong> , ”ASME Journal <strong>of</strong> Electronic Packaging, Vol.126,(2004), pp.110-114.2005 Electronic Components and Technology Conference